Attached files
| file | filename |
|---|---|
| 8-K - CURRENT REPORT - NCR CORP | d8k.htm |
| EX-99.1 - PRESS RELEASE ISSUED BY THE COMPANY, DATED APRIL 22, 2010 - NCR CORP | dex991.htm |
 NCR Q1 2010
Results & Pension Strategy April 22, 2010
Exhibit 99.2 |
 2
NCR Confidential
Note to Investors
Certain non-GAAP financial information regarding NCR’s operating
results may be discussed during this presentation. Reconciliation of
the differences between GAAP and non-GAAP measures are included
elsewhere in this presentation and are available on the Investor
page of NCR’s website at www.ncr.com.
Remarks and responses associated with this presentation include
forward-looking statements that are based on current expectations
and assumptions. These forward-looking statements are subject to a
number of risks and uncertainties that could cause actual results to
vary materially. These risk factors are detailed from time to time in
NCR’s SEC reports, including, but not limited to, Forms 10Q, 10K, 8K
and the Company’s
annual report to shareholders. These charts and
the associated remarks are integrally related and are intended to be
presented and understood together. |
 3
NCR Confidential
Overview of Q1 Results/Announcements
Q1 2010 Financial Results Above Expectations
•
A return to revenue growth
•
Gross margin improvement
•
Cost/expense program execution
•
Significant
non-pension
operating
income
(NPOI)
(1)
and non-pension EPS
(1)
growth
2010 Revenue & Non-GAAP Guidance Re-Affirmed
Pension Strategy
•
Company announces plan to address pension
funding status
•
Re-balancing pension assets to fixed income by end
of 2012 will substantially reduce risk and volatility
(1)
See reconciliation of GAAP to non-GAAP measures at the end of this presentation
|
 4
NCR Confidential
Q1 2010 vs. Q1 2009 Financial Highlights
Revenue up 2% to $1.03B
Gross margin up 120 bps, inclusive of
negative 70 bps effect from Entertainment
NPOI
(1)
up 54% to $43M
Non-GAAP EPS ex pension expense
(1)
$0.15; up 150% from $0.06 in Q1-2009
Improved backlog driven by 18% increase
in orders; Double digit order growth
balanced; Financial & Retail
(1)
See reconciliation of GAAP to non-GAAP measures at the end of this presentation
|
 5
NCR Confidential
Overview of NCR’s Business
NCR core vs. competitors
•
Core produces more
revenue
•
Core produces more
profit
•
Core enterprise value is
less
than competitors
Primary competitors
•
Trade at higher EBITDA and EPS
multiples based on 2010
consensus
Grow revenue
•
Low-mid single digit market
growth in core
•
Select strategic acquisitions to
grow faster than the secular
market
•
New markets and new
geographies, adjacencies
Continue to manage costs and
increase productivity
•
Cost savings of $200-$250
million from 2008 through 2011
(50% re-invested)
Financials
•
Expect 2010 revenue of $125-
$150 million and $30 million
loss from operations
•
Goal to be breakeven by end
of 2011 on run-rate basis
•
$1B+ revenue opportunity
Largest competitor
•
Consensus $1B+ revenue in
2010
•
EBIT margin mid-high teens for
DVD rental-only business
Brand
•
License to use Blockbuster
brand in the kiosk channel
Grow revenue
•
Build
out
kiosk
network
-
up
to
10k units by year-end 2010
•
Continued domestic and
international build-out in 2011
Create new category; higher
growth and margins than core
•
Only multi-channel, multi-
segment offer in industry
GAAP impacts
•
$1 billion underfunded status as
of 2009 year end
•
$215 million expected expense in
2010
•
Majority of pension expense is
amortization of prior losses (non-
cash)
Cash impacts
•
Pre-tax net cash liability of ~$1
billion (~$750 million after-tax) as
of 2009 year end
•
Expect cash contributions of
~$110 million in 2010
Eliminate current underfunded
liability
•
Rebalance asset portfolio to fixed
income by end of 2012
•
Interest rate increases and asset
price improvement would reduce
the underfunded position
Eliminate future volatility of plan
expense and funded status
•
Match assets and liabilities
Overview:
Strategy:
Core Business
Entertainment
Pension |
 6
NCR Confidential
Addressing NCR’s Valuation Gap
NCR trades at a material discount to the market and its peers, largely
due to the current pension situation
Pension assets invested in equities are not only volatile, but correlated
with NCR’s operating businesses
A significant portion of NCR’s capital is allocated to its “pension-
management”
business
•
This allocation has limited NCR’s ability to invest in our core operating
businesses and to provide immediate shareholder
returns •
Under-utilization of NCR balance sheet
To fix the valuation gap, NCR plans to:
•
Reduce risk and volatility by
re-allocating our domestic pension portfolio to
fixed-income securities
by year-end 2012
•
Direct freed-up risk-taking capacity to the highest value-added
investment alternatives: organic investments,
strategic acquisitions •
Fund the pension plan according to regulatory requirements (i.e., do
not pre-fund) |
 NCR
Confidential 7
Pension Management Strategy
•
Shift asset allocation of US Pension Plans to 100% fixed income by the end
of 2012
–
Target 60% by end of 2010, 80% by end of 2011, and 100% by end of 2012
–
Mostly high grade corporate bonds with an overall duration that approximates
the duration of the liability
•
For International Pension Plans, work with local pension trustee
boards to
make similar changes in asset allocation to the extent that it is appropriate
to do so
–
Each plan operates in a unique environment which influences appropriate asset
allocation
–
Local
pension
trustee
boards
have
final
authority
in
determining
appropriate
asset allocation
Actions to Address Valuation Gap
7
NCR Confidential |
 NCR Pension
Update – Q1 2010
Funded
Status
of
US
Plans
improved
by
$82
million
due
to
asset
returns
&
discount
rate
(2)
Funded
Status
of
International
Plans
has
deteriorated
slightly
driven
by
discount
rate
decreases
(2)
Funding
for
2011-2013
are
rough
estimates
based
on
expected
returns
and
current
discount
rate
Cash Funding for Pension Plans
2008
2009
2010E
2011E
2012E
2013E
International & Executive
$ 83
$ 83
$ 110
$ 125
$ 125
$ 125
US Qualified Plan*
0
0
0
0
125
175
Total
$ 83
$ 83
$ 110
$ 125
$ 250
$ 300
Pension Metrics & Funded Status
Asset
Return Discount rate
Funded
Status
3/31/10 YTD
(2)
12/31/09
3/31/10
(2)
12/31/09
3/31/10
(2)
US Plans
3.5%
5.75%
5.88%
$ (822)
$ (740)
International
2%
4.9%
4.8%
(226)
(250)
Global
2.9%
5.4%
5.45%
$ (1,048)
$ (990)
( $ Millions)
( $ Millions)
*Assumes no funding relief legislation
(2)
Estimated based on data available at March 31, 2010; for accounting
purposes the pension plans are not marked-to-market on a
quarterly basis
8
NCR Confidential |
 US Plans
Only –
Funded Status Bridge
•
Funded
Status
of
US
Plans
improved
~$82
million
in
Q1
to
($740
million)
(2)
•
Improvement
was
due
to
good
asset
returns
and
a
13bp
increase
in
discount
rate
(2)
Liabilities
Assets
Benefit
Payments
Asset
Returns
Fees &
Expenses
Asset Value,
12/31/09
$ (52)
$ (6)
$2,612
Asset Value,
3/31/10
(2)
Benefit
Payments
Interest
Liability Value,
12/31/09
$ (54)
$ 46
$3,352
Liability Value,
3/31/10
(2)
$ 88
$2,582
$3,404
$ (44)
Discount Rate
Movement
($Millions)
Funded Status
$ (822)
$ (740)
(2)
+2
+38
+42
(2)
Estimated based on data available at March 31, 2010;
for accounting purposes the pension plans are not
marked-to-
market on a
quarterly basis
9
NCR Confidential |
 ($
Millions) Pension Assets
Plan
2000
2001
2002
2003
2004
2005
2006
2007
2008
2009
U.S. Plans
$ 3,026
$ 2,686
$ 2,208
$ 2,797
$ 3,016
$ 3,098
$ 3,385
$ 3,423
$ 2,208
$ 2,582
International Plans
1,514
1,089
1,138
1,397
1,658
1,748
2,085
2,114
1,467
1,737
Total Plans
$ 4,540
$ 3,775
$ 3,346
$ 4,194
$ 4,674
$ 4,846
$ 5,470
$ 5,537
$ 3,675
$ 4,319
Pension Liability
Plan
2000
2001
2002
2003
2004
2005
2006
2007
2008
2009
U.S. Plans
$ 2,408
$ 2,494
$ 2,700
$ 2,960
$ 3,194
$ 3,372
$ 3,290
$ 3,199
$ 3,227
$ 3,404
International Plans
1,185
1,127
1,380
1,635
1,939
1,932
2,046
2,020
1,645
1,963
Total Plans
$ 3,593
$ 3,621
$ 4,080
$ 4,595
$ 5,133
$ 5,304
$ 5,336
$ 5,219
$ 4,872
$ 5,367
Funded Status
Plan
2000
2001
2002
2003
2004
2005
2006
2007
2008
2009
U.S. Plans
$ 618
$ 192
$ (492)
$ (163)
$ (178)
$ (274)
$ 95
$ 224
$ (1,019)
$ (822)
International Plans
329
(38)
(242)
(238)
(281)
(184)
39
94
(178)
(226)
Total Plans
$ 947
$ 154
$ (734)
$ (401)
$ (459)
$ (458)
$ 134
$ 318
$ (1,197)
$ (1,048)
NCR Historical Pension Overview
10
NCR Confidential |
 11
NCR Confidential
Historical Funded Status, Funding and Expense
($ Millions)
NCR has experienced significant volatility in the funded status of its pension plans
over the years NCR’s focus moving forward will be to manage and reduce
the risk of funded status volatility Funded Status
Plan
2000
2001
2002
2003
2004
2005
2006
2007
2008
2009
U.S. Plans
$ 618
$ 192
$ (492)
$ (163)
$ (178)
$ (274)
$ 95
$ 224
$ (1,019)
$ (822)
International Plans
329
(38)
(242)
(238)
(281)
(184)
39
94
(178)
(226)
Total Plans
$ 947
$ 154
$ (734)
$ (401)
$ (459)
$ (458)
$ 134
$ 318
$ (1,197)
$ (1,048)
Funded Status %
Plan
2000
2001
2002
2003
2004
2005
2006
2007
2008
2009
U.S. Plans
126%
108%
82%
94%
94%
92%
103%
107%
68%
76%
International Plans
128%
97%
82%
85%
86%
90%
102%
105%
89%
88%
Total Plans
126%
104%
82%
91%
91%
91%
103%
106%
75%
80%
Pension Funding
Plan
2000
2001
2002
2003
2004
2005
2006
2007
2008
2009
All Plans
$ 62
$ 59
$ 55
$ 70
$ 111
$ 110
$ 112
$ 92
$ 83
$ 83
Pension Expense / (Income)
Plan
2000
2001
2002
2003
2004
2005
2006
2007
2008
2009
All Plans
$ (124)
$ (124)
$ (74)
$ 105
$ 135
$ 150
$ 145
$ 44
$ 25
$ 159
11
NCR Confidential |
 Sensitivity
Analysis - US Plans ONLY
($ Millions)
Historical Asset Returns and Discount Rates for US Plan
2000
2001
2002
2003
2004
2005
2006
2007
2008
2009
10 yr
avg
20 yr
avg
Asset Returns
-2%
-6%
-12%
36%
15%
10%
16%
7%
-31%
28%
4%
10%
Discount Rate
7.5%
7.3%
6.8%
6.3%
5.8%
5.5%
5.8%
6.3%
6.3%
5.8%
6.3%
7.0%
(A) Assumes 6% at end 2010, 6.25% at end of 2011, and 6.5% at end of 2012
(B) Projected contribution
required for US Qualified plan in 2012 (no required contribution expected in 2010 or 2011),
also assumes no pension reform legislation
(C) Includes the impact of contributions on funded status
Projected Funded Status & Contributions -
Sensitivity Analysis
Discount Rate remains at 5.75%
Discount Rate increases to 6.5%
(A)
Scenario
Annual Equity
Returns
through 2012
Projected
Contribution in
2012
(B)
Projected
Funded Status
12/31/2012
(C)
Projected
Contribution in
2012
(B)
Projected
Funded Status
12/31/2012
(C)
3 yr. shift to 100% fixed income
5%
$145
($880)
$130
($770)
3 yr. shift to 100% fixed income
10%
$125
($775)
$115
($670)
3 yr. shift to 100% fixed income
15%
$115
($670)
$100
($565)
Funded Status as of 12/31/2009 = ($822)
12
NCR Confidential |
 Shift pension
asset allocation to 100% fixed income by end of 2012 •
Risk of equity exposure in pension plan must be reduced
–
Size of NCR pension plan (and therefore the associated risk) is disproportionate to the size
of NCR –
Riskiness and volatility of pension plan increases stock price volatility and places a
discount on the stock price –
The US pension plan is closed and the duration of the liability is becoming shorter
•
Shifting over 3 years allows for some additional recovery from the recent market
downturn
–
Potential
additional
upside
in
the
equity
markets
and/or
benefit
from
increase
in
the
discount
rate
Pre-fund of US pension plan analyzed
•
Given NCR’s tax position, there is not a compelling financial benefit for NCR to fund
early
–
NCR has minimal near-term U.S. tax liability, so cannot take advantage of accelerating
tax deductions by funding earlier than required
–
Similarly,
would
not
be
able
to
take
advantage
of
tax
deductions
for
interest
expense
(if
funded
with
debt)
•
Inefficient capital allocation
–
The
underfunded
pension
liability
is
analogous
to
unsecured
debt
of
NCR.
NCR
has
no
other
outstanding
debt.
We
believe
we
have
better
investment
uses
for
our
cash
balances
and
operating
cash
flow
than
choosing
to
pre-pay
debt
at
the
present
time
•
Cash flow deployed into business opportunities
–
No cash funding is projected to be required for the U.S. qualified pension plan in 2010 or
2011 –
A
pre-fund
now
does
not
materially
change
required
funding
in
2012
and
2013
Rationale –
Analyzed Various Options
13
NCR Confidential |
 14
NCR Confidential
Possible Impact of Pension Funding Relief Legislation
on NCR
Pension Legislation Could Provide Relief
Two relief options; 2+7 and 15-year vs.
current law
Two options potentially subject to “cash
flow rules”
(e.g., limits on employee
compensation, dividends, and stock
redemption)
Balanced legislation passed in Senate –
provides relief; currently bill in House Ways
and Means Committee; anticipated closure
by Q3 2010
Key
Provisions
Impact on NCR
Conditions
Status
2+7 vs.
Current
Law
Provides marginal
relief. NCR not
likely to use.
Senate: 2 yrs of
cash flow rules
House: 3 yrs TBD
Senate: passed
House: TBD
15-Year vs.
Current
Law
Likely provides
meaningful relief for
NCR.
Senate: 5 yrs of
cash flow rules
House: 3-5 yrs of
cash flow rules
and “active plan”
requirement
Senate: passed
House: active
plan issue
Investment
Expenses
not
Included in
Normal
Cost
Helpful to NCR.
N/A
Senate: not
addressed
House: TBD
NCR Leading Industry Coalition to
Secure Passage of Pension Relief
Possible Impact of Pension Funding
Relief Legislation on NCR |
 15
NCR Confidential
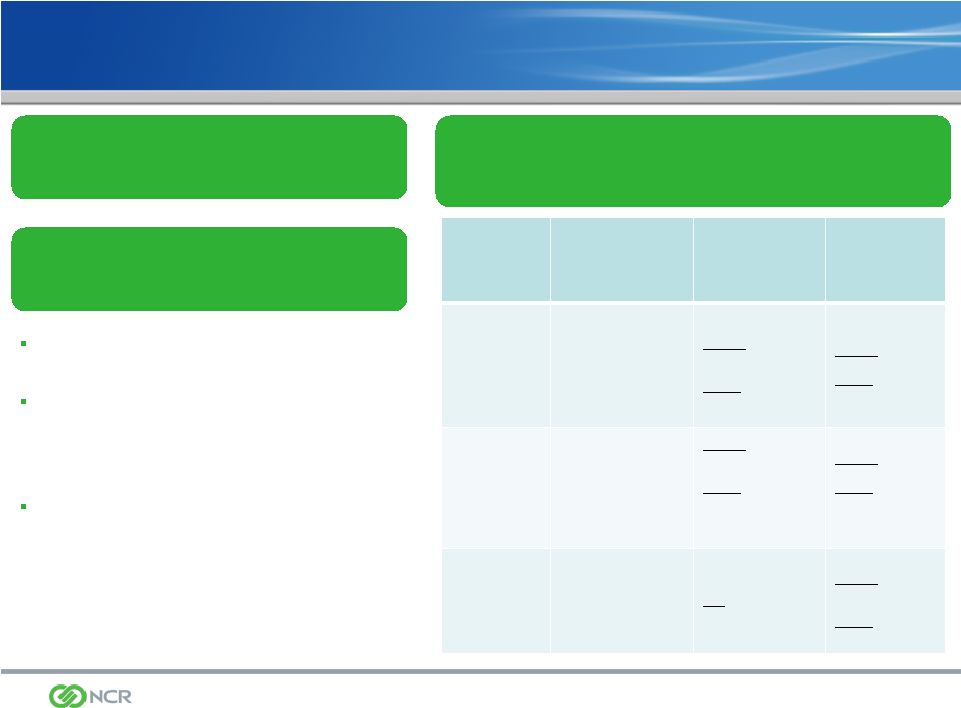
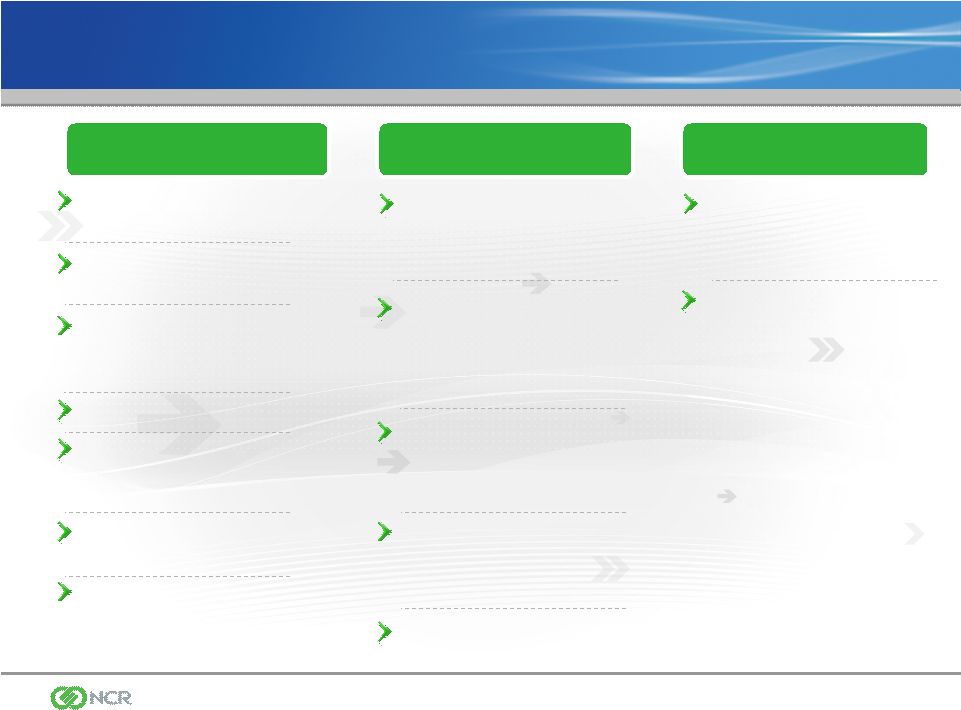
3-Year Vision for NCR
Leading Financial
Solutions provider
Leading Retail Solutions
provider
Leader in Hospitality,
Travel, Gaming and
Healthcare Solutions
Multi-Channel leadership
Leader in Managed
Services; 50% recurring
revenue stream
Sustainable, industry
leading cost structure
Continued significant
cash flow production
#1 or #2 market share
leader in DVD Kiosk
Market (US & Intl)
Physical DVD rental &
sell-through; digital
download leadership
“Automated Retail”
Market leader in multi-
channel distribution of
digital media
High growth; Significant
EBITDA; Positive cash
flow
Brand leadership
Under-funded
pension position
significantly reduced
Volatility and risk of
current pension asset
allocation eliminated
Core Business
Entertainment
Pension |
 16
NCR Confidential
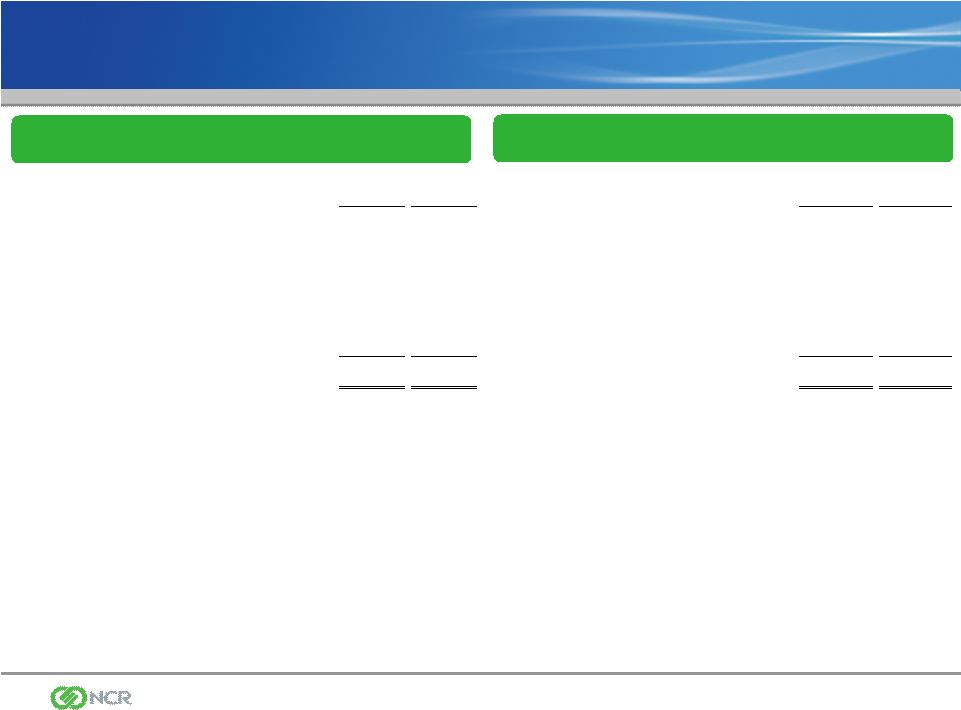
Reconciliation of GAAP to non-GAAP Measures
(1)
NCR reports its results in accordance with Generally Accepted Accounting Principles in the
United States, or GAAP. However, the Company believes that certain non-GAAP
measures found in this presentation are useful for investors. NCR’s management
evaluates the Company’s results excluding certain items, such as pension expense,
to assess the financial performance of the Company and believes this information is useful for
investors because it provides a more complete understanding of NCR’s underlying
operational performance, as well as consistency and comparability with past reports of
financial results. In addition, management uses earnings per share excluding
these items to manage and determine effectiveness of its business managers and as a basis for
incentive compensation. These non-GAAP measures should not be considered as
substitutes for or superior to results determined in accordance with GAAP.
Q1
Q1
Q1
Q1
2010
2009
2010
2009
Loss from Operations (GAAP)
(18)
$
(10)
$
Diluted Loss Per Share (GAAP)
(0.12)
$
(0.09)
$
Fox River Environmental Matter, Net
-
5
Fox River Environmental Matter, Net
-
0.03
Impairment of Equity Investment
-
(5)
Impairment of Equity Investment
-
(0.03)
Global Headquarters Relocation
5
-
Global Headquarters Relocation
(0.02)
-
Pension Expense
56
38
Pension Expense
(0.25)
(0.15)
Non-Pension Operating Income (non-GAAP)
(1)
43
$
28
$
Diluted Earnings Per Share (non-GAAP)
(1)
0.15
$
0.06
$
Loss from Operations (GAAP) to Non-Pension Operating
Income (non-GAAP)
Diluted Loss Per Share (GAAP) to Diluted Earnings Per
Share (non-GAAP) |