Attached files
| file | filename |
|---|---|
| 8-K - OSG FORM 8-K - OVERSEAS SHIPHOLDING GROUP INC | earn8k4q.htm |
| EX-99 - OSG FORM 8-K - EXHIBIT 99.1 - OVERSEAS SHIPHOLDING GROUP INC | earn8kx991.htm |
EXHIBIT
99.2
Fourth
Quarter Fiscal 2009
Earnings Conference Call
Earnings Conference Call
March
1, 2010

Page
2
This
presentation contains forward-looking statements regarding the Company's
prospects, including the outlook
for tanker and articulated tug barge markets, changing oil trading patterns, anticipated levels of newbuilding and
scrapping, prospects for certain strategic alliances and investments, estimated fixed revenue for 2010 and 2011,
forecasted newbuilding delivery schedule for 2010 and 2011, projected scheduled drydock and off hire days for
the 2010, projected locked-in charter revenue and locked-in time charter days, forecasted 2010 vessel
expenses, charter hire expenses, depreciation and amortization, general and administrative expenses, and
levels of equity income, other income, taxes and capital expenditures, timely delivery of newbuildings in
accordance with contractual terms, the outcome of OSG negotiations with Maersk Oil Qatar, the sustainability of
OSG’s annual dividend, prospects of OSG’s strategy of being a market leader in the segments in which it
competes and the forecast of world economic activity and oil demand. These statements are based on certain
assumptions made by OSG management based on its experience and perception of historical trends, current
conditions, expected future developments and other factors it believes are appropriate in the circumstances.
Forward-looking statements are subject to a number of risks, uncertainties and assumptions, many of which are
beyond the control of OSG, which may cause actual results to differ materially from those implied or expressed
by the forward-looking statements. Factors, risks and uncertainties that could cause actual results to differ from
the expectations reflected in these forward-looking statements are described in the Company’s Annual Report
for 2009 on Form 10-K and those risks discussed in the other reports OSG files with the Securities and
Exchange Commission.
Forward-Looking
Statements
Page
3
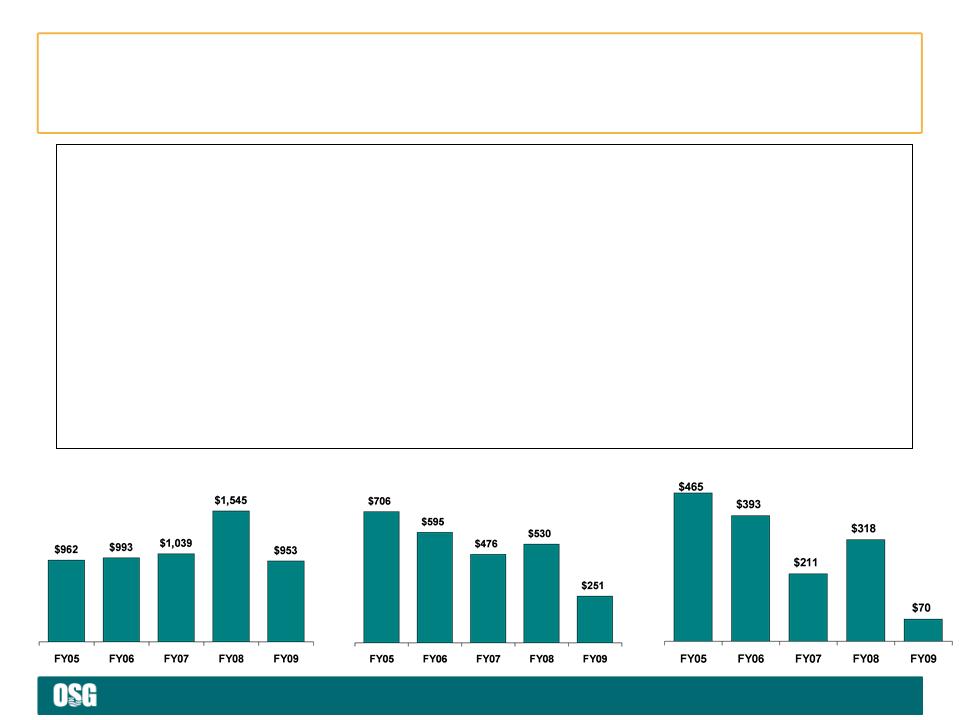
< 2009
was one of the toughest tanker markets in 20 years
• TCE revenues of $953M
down 38% YoY; Q4 down 41% to $203M
• EBITDA totaled $251M;
Q4 $867K
• Net income was $70M
compared to $318M; Q4 net loss was $23M vs. a loss of $80M Q408
• EPS was $2.61 compared
to $10.65; Q4 was a loss of $0.86 vs. a loss of $2.89
• Fourth quarter loss
per share included:
– Tender costs, Aker
settlement and other items that totaled $0.27
• Tax credit of $36M
substantially due to the Worker, Homeownership, and Business
Assistance Act of 2009
Assistance Act of 2009
< Despite
tough market conditions, the commercial, financial and operational
platforms of OSG performed well in 2009, and we enter 2010 in solid shape
platforms of OSG performed well in 2009, and we enter 2010 in solid shape
$
in millions
EBITDA
TCE
Revenues
Net
Income
$
in millions
$
in millions
FY09 /
4Q Financial Highlights

Page
4
Commercial
pools, COAs and triangulation trades optimize
OSG’s fleet, particularly in down markets
OSG’s fleet, particularly in down markets
$12,050
2009
Average
$4,819
$4,267
$5,495
$9,966
**
** 4Q09
Aframax blended daily TCE including Lightering was $16,563 resulting in
outperformance of $4,863 per day.
See
page 14 in the Appendix for additional information.
Outperforming in
Tough Market Conditions

Page
5
Overseas
Everest
Overseas
Cascade bow
loading system
loading system
FSO
Asia helipad, hose reel and
accommodation
accommodation
Quarter/Current
Highlights
< Tender for OSG
America L.P. completed on December 17th
• $72 million used to
finance the repurchase
• Difficult Jones Act
market conditions persist, but prospects for 2011-2012 are positive
< Vessel
Deliveries
• Overseas Everest,
newbuild VLCC from CSSC-Jiangnan
• Two MRs: Overseas
Skopelos from SPP and Overseas Mykonos from Hyundai Mipo
• Overseas Cascade,
U.S. flag from Aker
– After operating in
December entered yard for conversion
< FSO
Update
• FSO Asia hooked-up
off shore on January 4th; all
operations running smoothly
• FSO Africa
conversion near completion
• Maersk Oil Qatar AS
terminated contract but commercial discussions continue
< Aker Settlement
Reached
• All outstanding
commercial disputes settled
• Original bareboat
economics maintained
• Ownership costs of
the two shuttle tankers reduced by agreeing to purchase the two
vessels for $115M per ship
vessels for $115M per ship

Page
6
$522M
Construction Contract
Commitments
Commitments
*
Contract price Note all
amounts are in nominal dollars.
Highlights
< Capital commitments
for 14 owned
newbuilds fully funded
newbuilds fully funded
• An additional 8
newbuilds are chartered-in
< Cost reduction
efforts continue
< Active asset
management
• 20 planned
redeliveries
• 5 charter
terminations
– 2 time chartered-in
Aframaxes
– 2 newbuild time
chartered-in Suezmaxes
– 1 time chartered-in
VLCC
• Cancelled 2 owned
LR1s, swapping for 3
owned MRs
owned MRs
• Cost of 2 newbuild
VLCCs reduced in
exchange for accelerated payments
exchange for accelerated payments

Page
7
Key
Takeaways
< Strength of OSG’s
financial condition and business model position us well as
we manage through any market
we manage through any market
• Cash and short-term
investments $525M, up from $344M at Dec. 31, 2008
• Liquidity of
approximately $1.6B up slightly from $1.5B last year
• $522M of
construction commitments fully funded
• Annual dividend is
sustainable given the strength of OSG’s financial position
< Near-term
priorities
• Complete conversion
of FSO Africa
• Deliver OSG 350 and
351 to Sunoco
• Deliver Overseas
Cascade to Petrobras
• Corporate
efficiencies and further cost reductions without sacrificing
quality

Page
*
Financial
Review
Myles
Itkin, CFO
Page
9
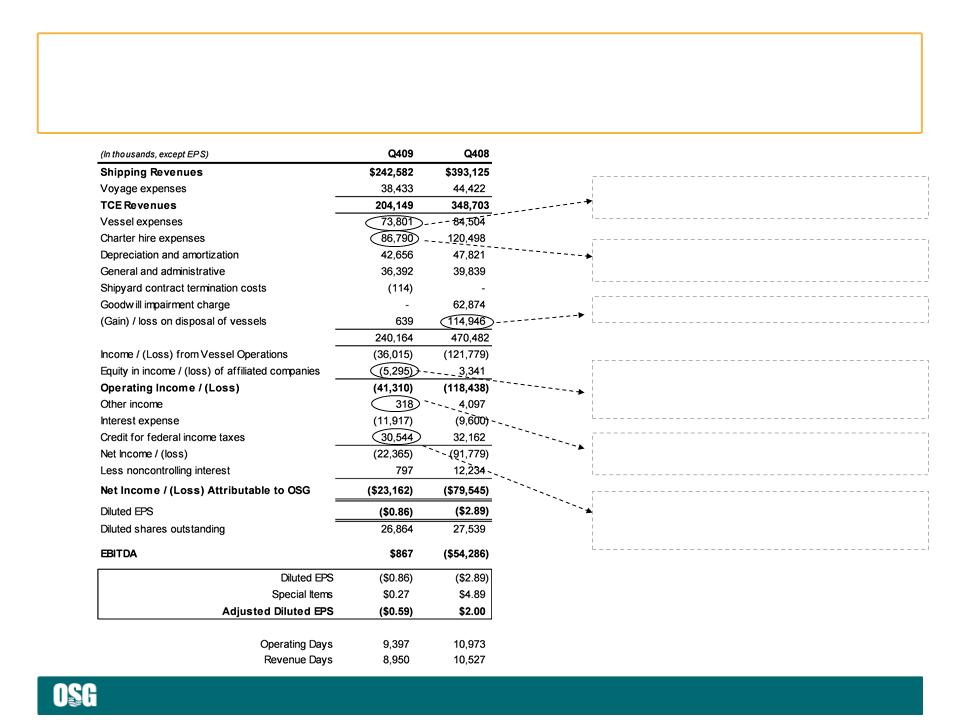
Redelivery of 11
single hull chartered-in MRs, lay up
of 4 U.S. Flag vessels and subsidy to DHT eliminated
of 4 U.S. Flag vessels and subsidy to DHT eliminated
959
fewer charter-in days and $12M lower profit
share
share
Impairments
recognized on U.S. Flag vessels
Primarily losses
associated with construction delays
on the FSOs; includes charge for interest rate swap
hedge ineffectiveness
on the FSOs; includes charge for interest rate swap
hedge ineffectiveness
Lower
gains from derivative positions and lower
interest income
interest income
Law
enacted in 2009 allows the carry back of 2009
tax losses 5 years instead of 2 years. Benefit
includes reversal of valuation allowance
tax losses 5 years instead of 2 years. Benefit
includes reversal of valuation allowance
Financial Review -
Income Statement

Page
10
Decrease
resulting from lower rates
Increase
resulting primarily from $42.2M carry back of
2009 tax loss after the Worker, Home Ownership and
Business Assistance Act of 2009 was signed into law
Q409
2009 tax loss after the Worker, Home Ownership and
Business Assistance Act of 2009 was signed into law
Q409
Includes
approx. $595M additions to vessels under
construction or purchased during the year
construction or purchased during the year
Increased funding of
FSO conversions and $70M
change in market value of derivatives held by JVs
change in market value of derivatives held by JVs
Primarily due to
release of $69M in margin call deposits
made in 2008
made in 2008
Reflects
$299M borrowing under CEXIM credit facility
and funding of the purchase of the Overseas Cascade
and OSP tender
and funding of the purchase of the Overseas Cascade
and OSP tender
Decrease
driven by $45M in regular amortization and
$16.6M reduction due to the termination of the Samho
Crown sale/leaseback transaction Q309
$16.6M reduction due to the termination of the Samho
Crown sale/leaseback transaction Q309
Increase
primarily due to improved mark-to-market on
effective portions of derivatives offset by the purchase of
the outstanding common units of OSG America L.P.
effective portions of derivatives offset by the purchase of
the outstanding common units of OSG America L.P.
Financial Review -
Balance Sheet
Page
11
|
|
Owned
|
Chartered-in
|
Total
|
|
2009 -
Beginning
|
59
|
63
|
122
|
|
2009 -
End
|
59
|
47
|
106
|
|
|
|
|
|
|
2010 -
Beginning
|
59
|
47
|
106
|
|
Deliveries
|
5
|
4
|
9
|
|
Redeliveries
|
|
<5>
|
<5>
|
|
2010 -
End
|
|
|
110
|
|
2010
Fixed Revenue
|
$275M
|
|
|
|
Fixed
|
Spot
|
|
TCE
Revenues
|
|
|
|
2008
|
35%
|
65%
|
|
2009
|
51%
|
49%
|
|
Revenue
Days
|
|
|
|
2008
|
45%
|
55%
|
|
2009
|
42%
|
58%
|
|
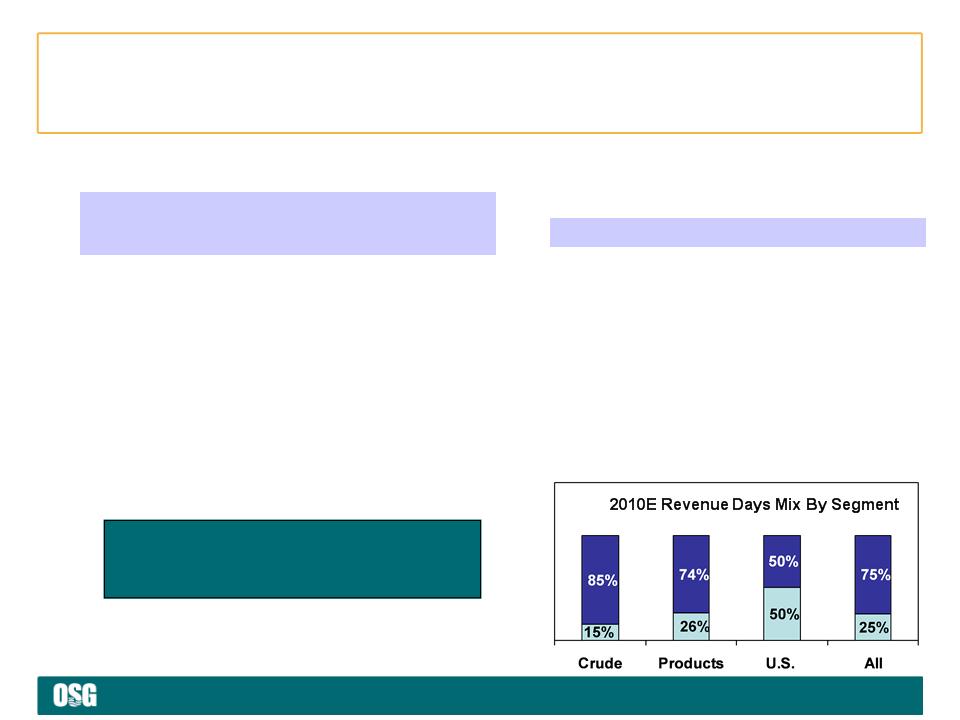
2010E
|
25%
|
75%
|
Operating
Fleet Composition
Spot
/ Fixed Mix
Expecting
tough market conditions, FFA
positions established in 2007/2008
generated $41M TCE revenues in 2009
positions established in 2007/2008
generated $41M TCE revenues in 2009
Fleet
Composition & Fixed Revenue

Page
12
2010
Guidance
< Estimated vessel
expenses
• $280M to
$300M
< Time and bareboat
charter hire expenses
• $345M to
$370M
< Depreciation and
Amortization
• $170M to
$190M
< G&A
• $100M to
$115M
< Equity income of
affiliated companies
• $15M to
$20M
< Interest
expense
• Interest expense
approx. $50M to $60M
< Capital
expenditures
• $23M in drydock
costs (Q1 $1M; Q2 $13; Q3 $2M and Q4 $7M) on 24 vessels
• $360M newbuild
progress payments, vessel improvements and capitalized interest (Q1
$123M;
Q2 $55M; Q3 $25M and Q4 $157M)
Q2 $55M; Q3 $25M and Q4 $157M)

Page
*
Appendix
Page
14
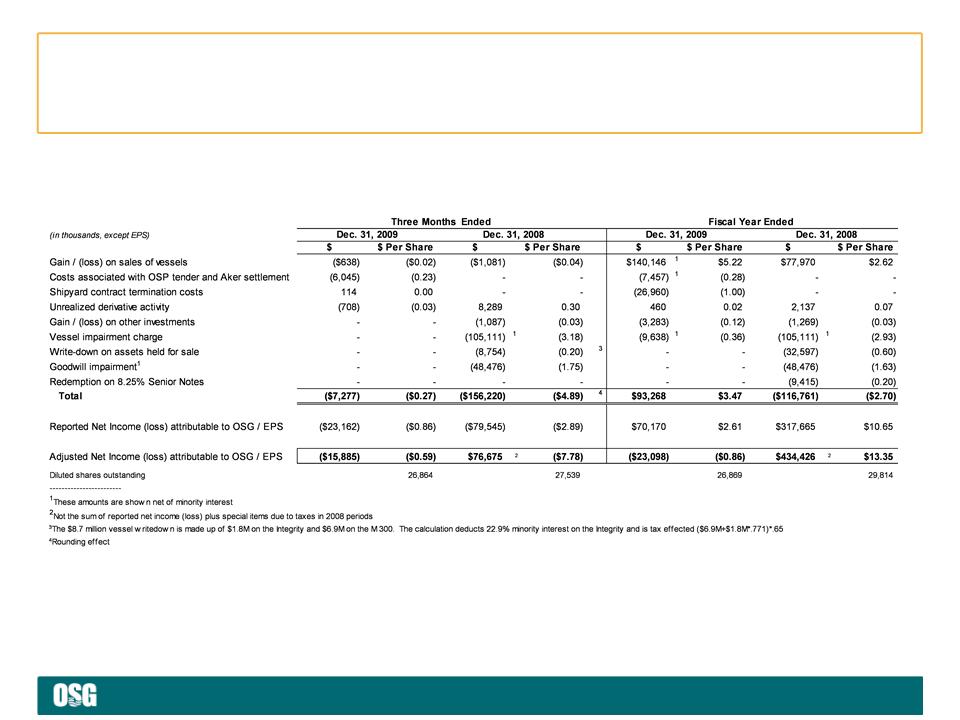
Set
forth below are significant items of income and expense that affected the
Company’s results for the three months and fiscal year ended
December 31, 2009 and 2008, all of which are typically excluded by securities analysts in their published estimates of the Company’s financial results
December 31, 2009 and 2008, all of which are typically excluded by securities analysts in their published estimates of the Company’s financial results
Special
Items Affecting Net Income/(Loss)
Spot
rates by quarter in 2009 are reported in the Company’s quarterly earnings press
releases.
Average
rates are sourced from OSG’s Forms 10-Q and 10-K and assume a 50-50
ballast-to-laden voyage blending rates that prevailed in
markets in which the Company’s vessels operate. VLCCs are based on 60% AG-East and 40% AG-West; Suezmaxes W. Africa to USG;
Aframaxes Caribbean to USG and USAC; Panamaxes based on 50% Carib-USG / USAC and 50% Ecuador to USWC; MRs based on 60%
trans-Atlantic and 40% Caribbean to USAC
markets in which the Company’s vessels operate. VLCCs are based on 60% AG-East and 40% AG-West; Suezmaxes W. Africa to USG;
Aframaxes Caribbean to USG and USAC; Panamaxes based on 50% Carib-USG / USAC and 50% Ecuador to USWC; MRs based on 60%
trans-Atlantic and 40% Caribbean to USAC
Spot
and Average Rates Used on Slide 4
Reconciling Items
and Other Information
Page
15
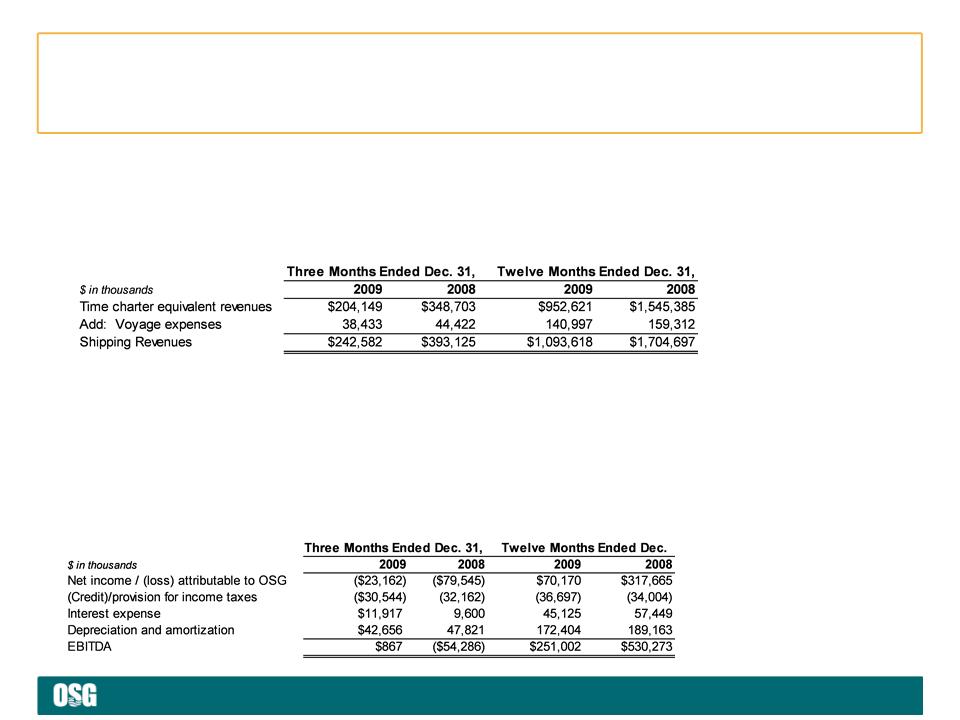
EBITDA
represents operating earnings excluding net income attributable to the
noncontrolling interest, which is before interest expense and
income taxes, plus other income and depreciation and amortization expense. EBITDA is presented to provide investors with meaningful additional
information that management uses to monitor ongoing operating results and evaluate trends over comparative periods. EBITDA should not be
considered a substitute for net income / (loss) attributable to the Company or cash flow from operating activities prepared in accordance with
accounting principles generally accepted in the United States or as a measure of profitability or liquidity. While EBITDA is frequently used as a
measure of operating results and performance, it is not necessarily comparable to other similarly titled captions of other companies due to
differences in methods of calculation.
EBITDA
Consistent with
general practice in the shipping industry, the Company uses time charter
equivalent revenues, which represents shipping revenues
less voyage expenses, as a measure to compare revenue generated from a voyage charter to revenue generated from a time charter. Time charter
equivalent revenues, a non-GAAP measure, provides additional meaningful information in conjunction with shipping revenues, the most directly
comparable GAAP measure, because it assists Company management in making decisions regarding the deployment and use of its vessels and in
evaluating their financial performance.
TCE
Revenues
Reconciling Items
and Other Information (continued)

Page
16
Fleet
Snapshot - As of February 25, 2010
Note: As of
February 25, 2010, 6 U.S. Flag ships are in lay up (M214, M209, Overseas Puget
Sound, Overseas
Philadelphia, Overseas New Orleans and Overseas Galena Bay)
Philadelphia, Overseas New Orleans and Overseas Galena Bay)
Owned
Chartered-in
Owned
Chartered-in
107
OPERATING
22 NEWBUILD/
CONVERSIONS
CONVERSIONS
60
47
14
8

Page
17
An
excel spreadsheet of OSG’s full fleet can be found on www.osg.com.
The Q3 2011 chartered-in newbuild is a chemical carrier
The Q3 2011 chartered-in newbuild is a chemical carrier
OSG’s
newbuild program totals
14 owned and 8 chartered-in vessels
delivering through 2011
14 owned and 8 chartered-in vessels
delivering through 2011
Vessel
Delivery Schedule - As of February 25, 2010
Page
18
Off
Hire and Scheduled Drydock
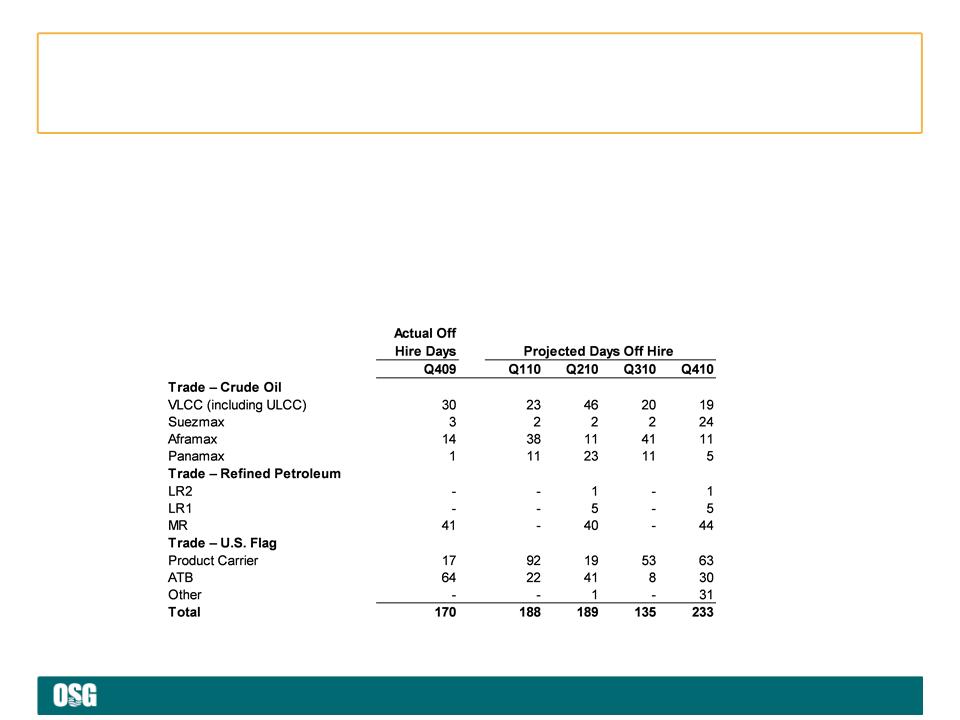
In
addition to regular inspections by OSG personnel, all vessels are subject to
periodic drydock,
special survey and other scheduled maintenance. The table below sets forth actual days off hire for
the fourth quarter of 2009 and anticipated days off hire for the above-mentioned events by class for
2010. Fourth quarter 2009 excludes 279 days associated with four U.S. Flag vessels in lay up: the
OSG 214, Overseas Galena Bay, Overseas Puget Sound and Overseas New Orleans. Projected off
hire days exclude 1,339 days (2010) associated with U.S. Flag vessels expected to be in lay up.
Off
Hire Schedule
Page
19
For
the Quarter Ended December 31, 2009
Charter
Hire Expense by Segment

Page
20
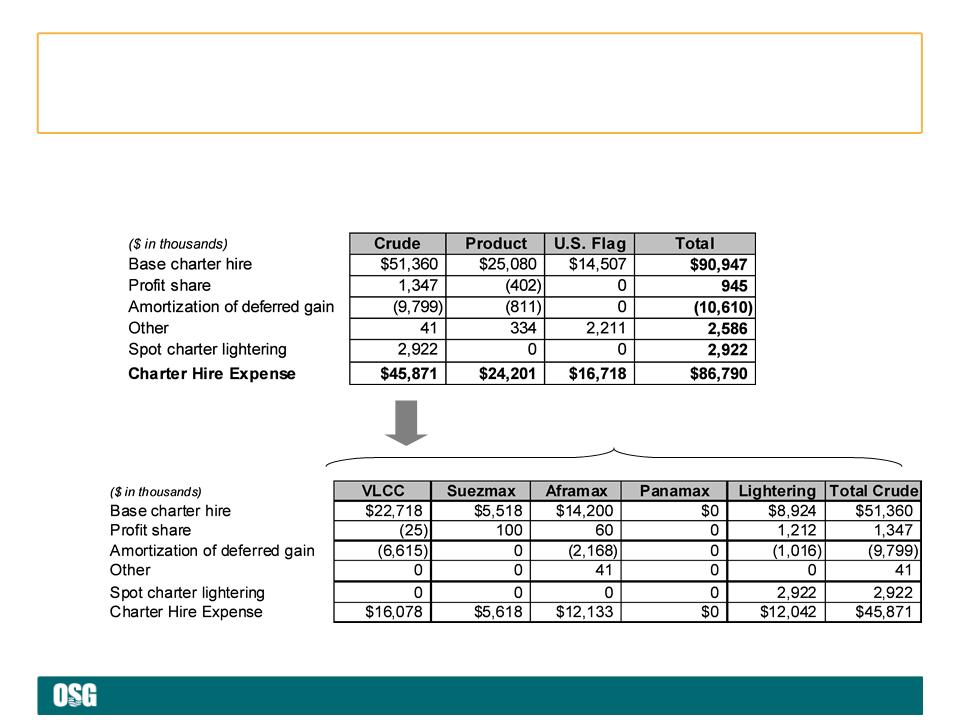
For
the Fiscal Year December 31, 2009
Charter
Hire Expense by Segment
Page
21
Locked-in
Time Charter
Days by Segment
Days by Segment
Locked-in
Time Charter
Revenue by Segment
Revenue by Segment
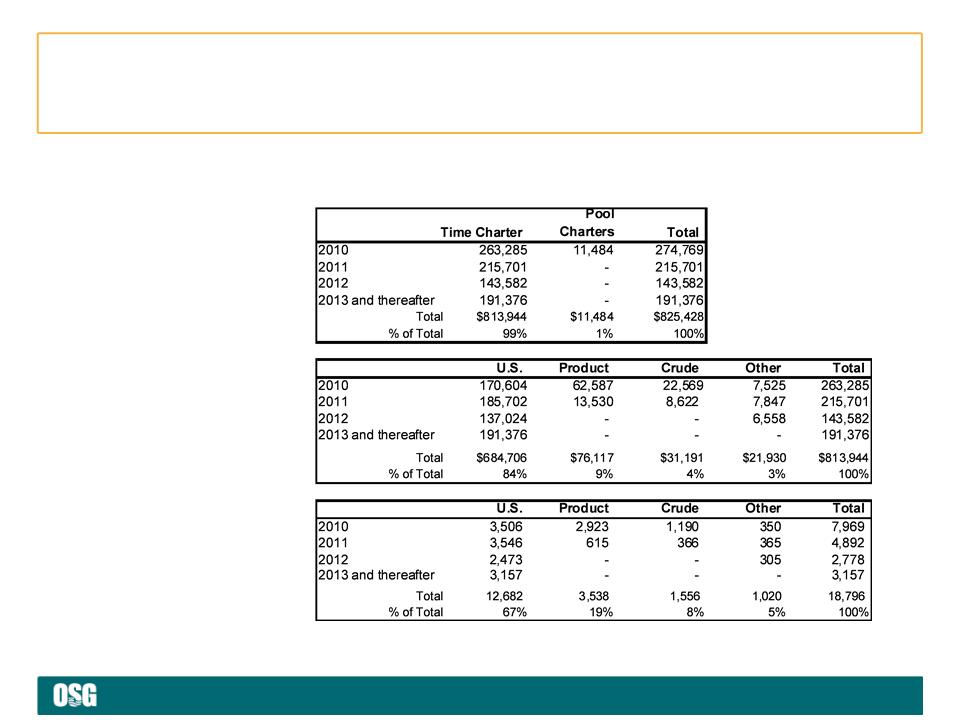
Locked-in
Charter Revenue
Charter Revenue
Note: Locked
in time charter days above for 2010 are as of 12/31/09 and will differ from a
later date used in
Appendices 3 and 4 in the FY09 earnings press release
Appendices 3 and 4 in the FY09 earnings press release
Future
Revenue $/Days by Segment - As of 12/31/09

Page
*
www.osg.com