Attached files
| file | filename |
|---|---|
| EX-23.1 - EX-23.1 - Knowlton Development Corp Inc | d39510dex231.htm |
| EX-10.2 - EX-10.2 - Knowlton Development Corp Inc | d39510dex102.htm |
| EX-5.1 - EX-5.1 - Knowlton Development Corp Inc | d39510dex51.htm |
Table of Contents
As filed with the Securities and Exchange Commission on September 14, 2021
Registration No. 333-257845
UNITED STATES
SECURITIES AND EXCHANGE COMMISSION
Washington, D.C. 20549
AMENDMENT NO. 2
TO
FORM S-1
REGISTRATION STATEMENT
UNDER
THE SECURITIES ACT OF 1933
Knowlton Development Corporation, Inc.
(Exact Name of Registrant as Specified in Its Charter)
| British Columbia | 2844 | N/A | ||
| (State or Other Jurisdiction of Incorporation or Organization) |
(Primary Standard Industrial Classification Code Number) |
(I.R.S. Employer Identification Number) |
375 Roland-Therrien Boulevard
Suite 210
Longueuil, Québec J4H 4A6
Canada
(450) 243-2000
(Address, Including Zip Code, and Telephone Number, Including Area Code, of Registrant’s Principal Executive Offices)
Nicholas Whitley
250 Pehle Avenue
Suite 1000
Saddle Brook, New Jersey 07663
(201) 688-2300
(Name, Address, Including Zip Code, and Telephone Number, Including Area Code, of Agent For Service)
Copies to:
| Roshni Banker Cariello Pedro J. Bermeo Davis Polk & Wardwell LLP 450 Lexington Avenue New York, New York 10017 (212) 450-4000 |
Nicolas Beugnot Chief Legal Officer and Corporate Secretary 375 Roland-Therrien Boulevard Longueuil, Québec J4H 4A6 Canada (450) 243-2000 |
Robert DeLaMater Jared Fishman Sullivan & Cromwell LLP 125 Broad Street New York, New York 10004 (212) 558-4000 | ||
|
Warren Silversmith David Tardif Stikeman Elliott LLP 1155 René-Lévesque Boulevard West Montréal, Québec H3B 3V2, Canada (514) 397-3000 |
François Paradis Osler, Hoskin & Harcourt LLP 1000 De La Gauchetière Street West, Suite 2100 Montréal, Québec H3B 4W5, Canada (514) 904-8100 |
Approximate date of commencement of proposed sale to the public: As soon as practicable after the effective date of this Registration Statement.
If any of the securities being registered on this form are to be offered on a delayed or continuous basis pursuant to Rule 415 under the Securities Act of 1933 check the following box. ☐
If this form is filed to register additional securities for an offering pursuant to Rule 462(b) under the Securities Act, check the following box and list the Securities Act registration statement number of the earlier effective registration statement for the same offering. ☐
If this form is a post-effective amendment filed pursuant to Rule 462(c) under the Securities Act, check the following box and list the Securities Act registration statement number of the earlier effective registration statement for the same offering. ☐
If this form is a post-effective amendment filed pursuant to Rule 462(d) under the Securities Act, check the following box and list the Securities Act registration statement number of the earlier effective registration statement for the same offering. ☐
Indicate by check mark whether the registrant is a large accelerated filer, an accelerated filer, a non-accelerated filer, a smaller reporting company or an emerging growth company. See the definitions of “large accelerated filer,” “accelerated filer,” “smaller reporting company” and “emerging growth company” in Rule 12b-2 of the Exchange Act.
| Large accelerated filer | ☐ | Accelerated filer | ☐ | |||
| Non-accelerated filer | ☒ | Smaller reporting company | ☐ | |||
| Emerging growth company | ☐ | |||||
If an emerging growth company, indicate by check mark if the registrant has elected not to use the extended transition period for complying with any new or revised financial accounting standards provided pursuant to Section 7(a)(2)(B) of the Securities Act. ☐
CALCULATION OF REGISTRATION FEE
|
| ||||||||
| Title of Each Class of Securities to be Registered |
Amount to be |
Proposed Maximum Offering Price per Share(2) |
Proposed Aggregate |
Amount of Registration Fee(3) | ||||
| Common shares, no par value |
65,714,285 | $15.00 | $985,714,275 | $107,542 | ||||
|
| ||||||||
|
| ||||||||
| (1) | Includes additional common shares which the underwriters have the option to purchase to cover over-allotments. |
| (2) | Estimated solely for the purpose of computing the amount of the registration fee pursuant to Rule 457(a) under the Securities Act of 1933. |
| (3) | A portion of this amount totaling $10,910.00 was previously paid in connection with the previous filing of this Registration Statement on August 27, 2021. |
The Registrant hereby amends this registration statement on such date or dates as may be necessary to delay its effective date until the Registrant shall file a further amendment which specifically states that this registration statement shall thereafter become effective in accordance with Section 8(a) of the Securities Act of 1933 or until the registration statement shall become effective on such date as the Commission, acting pursuant to said Section 8(a), may determine.
Table of Contents
EXPLANATORY NOTE
On July 1, 2021, Knowlton Development Corporation Inc., the operating company and the indirect wholly owned subsidiary of Knowlton Development Parent, Inc., changed its name to kdc/one Development Corporation, Inc. On the same day, Knowlton Development Parent, Inc., and Knowlton Development Holdco, Inc., a wholly-owned subsidiary of Knowlton Development Parent, Inc., amalgamated under the laws of British Columbia and continued as one corporation named Knowlton Development Corporation, Inc., which became the direct parent of kdc/one Development Corporation, Inc. These changes occurred after the end of the fiscal year ended April 30, 2021, such that the financial statements for the year ended April 30, 2021 included herein refer to Knowlton Development Parent, Inc. and Knowlton Development Corporation Inc. for the Successor Period and Predecessor Period (each as defined herein), respectively. See “Financial Statement Presentation” for further explanation of the presentation of financials in this registration statement.
Table of Contents
The information in this preliminary prospectus is not complete and may be changed. We may not sell these securities until the registration statement filed with the Securities and Exchange Commission is effective. This preliminary prospectus is not an offer to sell these securities and we are not soliciting offers to buy these securities in any jurisdiction where the offer or sale is not permitted.
Subject to Completion, dated September 14, 2021
Preliminary Prospectus
57,142,857 Shares

Knowlton Development Corporation, Inc.
Common Shares
Knowlton Development Corporation, Inc. is offering 57,142,857 common shares. This is our initial public offering and no public market exists for our common shares. We anticipate that the initial public offering price of our common shares will be between $13.00 and $15.00 per share. Our common shares have been approved for listing on the New York Stock Exchange (“NYSE”) and we have applied to list our common shares on the Toronto Stock Exchange (the “TSX”), both under the symbol “KDC.” Listing on the TSX will be subject to us fulfilling all the listing requirements of the TSX.
Investing in our common shares involves risk. See “Risk Factors” beginning on page 24.
Neither the Securities and Exchange Commission, or the SEC, nor any state securities commission or Canadian securities regulatory authority has approved or disapproved of these securities or determined if this prospectus is truthful or complete. Any representation to the contrary is a criminal offense.
| Per Share |
Total | |||||||
| Initial public offering price |
$ | $ | ||||||
| Underwriting discounts and commissions(1) |
$ | $ | ||||||
| Proceeds to us before expenses |
$ | $ | ||||||
| (1) | See “Underwriting (Conflicts of Interest)” for a description of compensation to be paid to the underwriters. |
At our request, the underwriters have reserved up to 2,857,142 common shares, or 5% of the common shares to be offered by this prospectus, for sale at the initial public offering price through a directed share program for certain persons designated by the Company. See “Underwriting (Conflicts of Interest)—Directed Share Program.”
The underwriters have the option to purchase up to an additional 8,571,428 common shares from us at the initial public offering price less the underwriting discounts and commissions.
The underwriters expect to deliver the shares against payment in New York, New York on or about , 2021 through the book-entry facilities of The Depository Trust Company.
| Goldman Sachs & Co. LLC | J.P. Morgan | UBS Investment Bank | BMO Capital Markets |
| BofA Securities | Guggenheim Securities | Jefferies | Morgan Stanley | RBC Capital Markets |
The date of this prospectus is , 2021.
Table of Contents

Beauty, Personal Care, and Home Care Uniquely Imagined and Expertly Delivered
Table of Contents

kdc/one Is a Diïerentiated and Compelling Consumer Opportunity Diversified, Scaled and Vertically Integrated Global Growth Platform Aligned to Attractive Consumer Markets and Growth Trends Strong Competitive Advantage Built on Innovative and Trust Strong Financial Profile With Highly Attractive Recent Growth and Margins
Table of Contents

We create products that consumers use every day — morning to night When they When catering start their day to their well being When relaxing When out at home and about When they When they start to get ready to go out wind down
Table of Contents

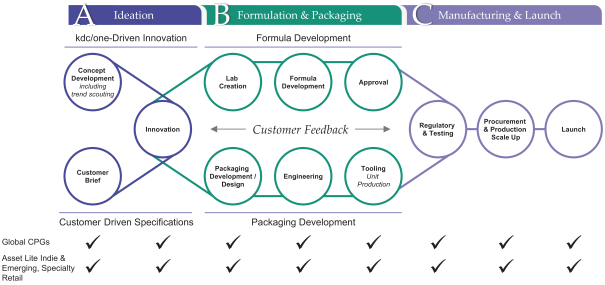
Global, Vertically Integrated End-to-End Solutions Ideation Formulation Design Packaging & devices Manufacturing
Table of Contents
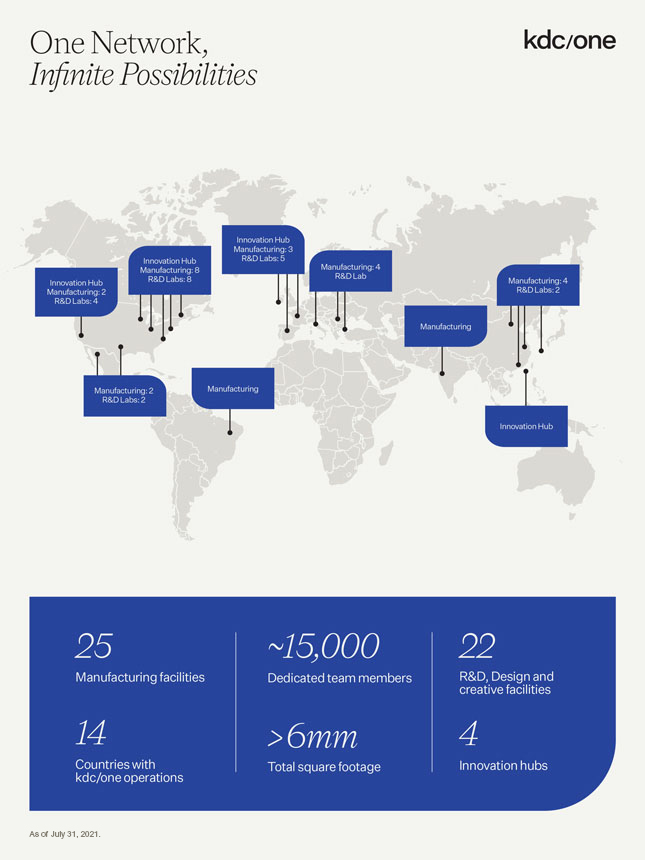
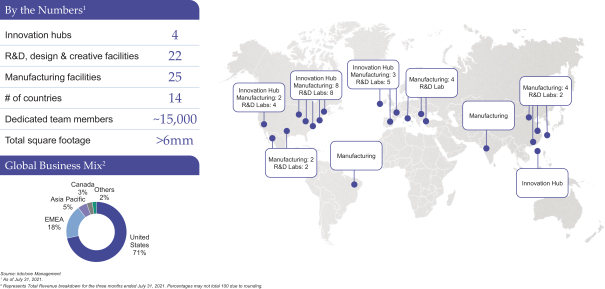
One Network, Infinite Possibilities Innovation Hub Manufacturing: 3 Innovation Hub R&D Labs: 5 Manufacturing: 8 Manufacturing: 4 R&D Labs: 8 R&D Lab Innovation Hub Manufacturing: 4 Manufacturing: 2 R&D Labs: 2 R&D Labs: 4 Manufacturing Manufacturing: 2 Manufacturing R&D Labs: 2 Innovation Hub 25 ~15,000 22 Manufacturing facilities Dedicated team members creative R&D, Design facilities and 14 6mm 4 Countries kdc/one operations with Total square footage Innovation hubs
Table of Contents
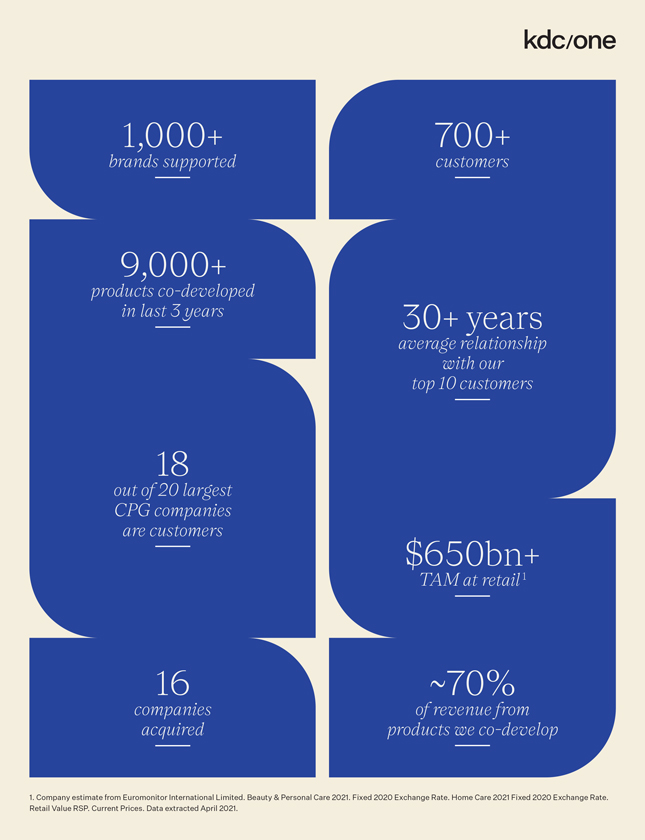
1,000+ 700+ brands supported customers 9,000+ products co-developed in last 3 years 30+ years average relationship with our top 10 customers 18 out of 20 largest CPG companies are customers $650bn+ TAM at retail 1 16 ~70% companies of revenue from acquired products we co-develop 1. Company estimate from Euromonitor International Limited. Beauty & Personal Care 2021. Fixed 2020 Exchange Rate. Home Care 2021 Fixed 2020 Exchange Rate. Retail Value RSP. Current Prices. Data extracted April 2021.
Table of Contents
| Page | ||||
| 1 | ||||
| 16 | ||||
| 18 | ||||
| 22 | ||||
| 24 | ||||
| 59 | ||||
| 62 | ||||
| 63 | ||||
| 64 | ||||
| 65 | ||||
| 67 | ||||
| 69 | ||||
| Management’s Discussion and Analysis of Financial Condition and Results of Operations |
72 | |||
| 119 | ||||
| 150 | ||||
| 161 | ||||
| 181 | ||||
| 187 | ||||
| 189 | ||||
| 192 | ||||
| 211 | ||||
| 216 | ||||
| 218 | ||||
| 228 | ||||
| 228 | ||||
| 229 | ||||
| F-1 | ||||
In this prospectus, unless the context otherwise requires, “Knowlton Development Corporation, Inc.,” the “Company,” “kdc/one,” “we,” “us” and “our” refer to Knowlton Development Corporation, Inc. and its subsidiaries. All currency amounts in this prospectus are expressed in United States (“U.S.”) dollars, unless otherwise indicated.
Neither we nor any of the underwriters have authorized anyone to provide any information or to make any representations other than those contained in this prospectus or in any free writing prospectuses we have prepared. We and the underwriters take no responsibility for, and can provide no assurance as to the reliability of, any other information that others may provide you. We are offering to sell, and seeking offers to buy, common shares only in jurisdictions where offers and sales are permitted. The information contained in this prospectus is accurate only as of the date of this prospectus, regardless of the time of delivery of this prospectus or of any sale of common shares. Our business, financial condition, results of operations and prospects may have changed since the date on the front cover of this prospectus.
Market and Industry Data
This prospectus includes industry and market data that we obtained from periodic industry publications, third-party studies and surveys, including from Euromonitor, as well as from filings of public companies in our
i
Table of Contents
industry and internal company surveys. These sources include government and industry sources. Industry publications and surveys generally state that the information contained therein has been obtained from sources believed to be reliable. Although we believe the industry and market data to be reliable as of the date of this prospectus, this information could prove to be inaccurate. Industry and market data could be wrong because of the method by which sources obtained their data and because information cannot always be verified with complete certainty due to the limits on the availability and reliability of raw data, the voluntary nature of the data gathering process and other limitations and uncertainties. Each publication, study and report speaks as of its original publication date (and not as of the date of this prospectus). Certain of these publications, studies and reports were published before the COVID-19 pandemic and therefore do not reflect any impact of COVID-19 on any specific market or globally. In addition, we do not know all of the assumptions regarding general economic conditions or growth that were used in preparing the forecasts from the sources relied upon or cited herein.
Trademarks and Service Marks
This prospectus contains references to a number of trademarks and service marks which are our registered trademarks or service marks, such as “kdc/one,” “HCT,” “Kolmar” and “Zobele,” as well as the “kdc/one” logo, or trademarks or service marks for which we have pending applications or common law rights. Trade names, trademarks and service marks of third parties appearing in this prospectus are the property of their respective holders. Solely for convenience, the trademarks, service marks and trade names are referred to in this prospectus without the ®, SM and TM symbols, but such references are not intended to indicate, in any way, that the owner thereof will not assert, to the fullest extent under applicable law, such owner’s rights to their trademarks, service marks and trade names.
Non-GAAP Financial Measures
We refer in this prospectus to the following non-GAAP financial measures:
| • | Adjusted EBITDA; |
| • | Adjusted EBITDA Margin; and |
| • | Value-Added Contribution Margin (“VACM”). |
These non-GAAP financial measures are not prepared in accordance with generally accepted accounting principles (“GAAP”) in the United States. They are supplemental financial measures of our performance only, and should not be considered substitutes for net income or loss, revenue or any other measure derived in accordance with GAAP.
As used in this prospectus, these non-GAAP financial measures have the following meanings:
| • | Adjusted EBITDA is net income or loss before interest expense, other expense (income), net, income tax benefit, depreciation and amortization, share-based compensation, acquisition-related costs, costs associated with becoming a public company, certain incremental costs associated with COVID-19 that are not expected to continue once the pandemic has significantly subsided globally and operations return to pre-COVID-19 levels, plant start-up costs incurred at our new facility in Columbus, Ohio (the “Columbus II facility”) before significant operations begin, including payroll and rent, sponsor fees (including the Sponsor Fees (as defined below) which are terminating in connection with this offering), impairment loss on assets and other intangibles and certain other adjustment items; |
| • | Adjusted EBITDA Margin is calculated by dividing Adjusted EBITDA by revenue; and |
| • | VACM is calculated by dividing Adjusted EBITDA by revenue from value added contributions (as defined elsewhere in this prospectus). |
ii
Table of Contents
Management utilizes Adjusted EBITDA and Adjusted EBITDA Margin as measures of operating performance and the operating leverage in the Company’s business. Management believes that these non-GAAP financial measures are useful to investors for period-to-period comparisons of the Company’s business and in understanding and evaluating the Company’s operating results for the following reasons:
| • | Adjusted EBITDA and Adjusted EBITDA Margin are widely used by investors and securities analysts to measure a company’s operating performance without regard to items such as share-based compensation expense, depreciation and amortization expense, impairment loss on assets, interest expense, other expense (income), net, and income taxes expense (benefit) that can vary substantially from company to company depending upon their financing, capital structures and the method by which assets were acquired; and |
| • | Adjusted EBITDA and Adjusted EBITDA Margin provide consistency and comparability with the Company’s past financial performance, facilitate period-to-period comparisons of the Company’s primary operating results, and also facilitate comparisons with other peer companies, many of which use similar non-GAAP financial measures to supplement their GAAP results. |
Management utilizes VACM as a measure of operating performance and believes that VACM is an important measure in analyzing the results of the business for the following reasons:
| • | our business is focused on innovation, product development and operational excellence, and, as a result, VACM reflects the way customers interact with us and the value embedded in the Company’s product delivery that we provide to them; |
| • | a significant portion of revenue from raw materials is generated through arrangements with mechanisms that pass through raw material costs, and accordingly the associated revenue is recorded as revenue from pass-through raw materials (as defined elsewhere in this prospectus) and is excluded from the calculation of VACM; and |
| • | we utilize revenue from value added contributions to assess growth between fiscal periods and to analyze the resulting margins without the revenue from pass-through raw materials (VACM will fluctuate between periods depending upon the Company’s ability to drive sales of higher margin solutions (i.e., favorable product mix, integrated sales) and to generate operating efficiencies across our network, including the ability to scale operations, as well as changes to the product portfolio and by the nature of the Company’s acquisitions from time to time). |
As a result, we believe that VACM is the best way to measure our business in a consistent manner, taking into account that customers have the flexibility to do business with us in more than one way, with some choosing a customer-supplied materials framework (which would not result in revenue to us) while others choose a kdc/one-supplied materials framework (which would result in revenue to us equal to the pass-through cost of such materials). If VACM is not used to measure performance, the transaction with the customer that chooses a kdc/one-supplied materials framework would appear to be lower margin than the transaction with the customer that chooses a customer-supplied materials framework when the profitability to us of both transactions would be the same.
For a reconciliation of Adjusted EBITDA to the most directly comparable GAAP measure, see “Prospectus Summary—Summary Consolidated Financial and Other Data.” The most directly comparable GAAP measure to Adjusted EBITDA Margin and VACM is net income margin. In this prospectus we have excluded a presentation of net income margin because we have experienced a net loss for all the relevant periods and therefore the net income margin would be less than zero and consequently we believe not helpful to investors. However, wherever we present Adjusted EBITDA Margin and VACM we present net loss. For a description of the revenue from value added contributions, see “Management’s Discussion and Analysis—Components of Revenue.”
The non-GAAP financial measures used in this prospectus have not been reviewed or audited by our auditors or any independent registered public accounting firm.
iii
Table of Contents
Adjusted EBITDA and Adjusted EBITDA Margin have important limitations as analytical tools and should not be considered in isolation or as substitutes for analysis of our financial results as reported under GAAP. For example, Adjusted EBITDA and Adjusted EBITDA Margin:
| • | do not reflect any cash capital expenditure requirements for the assets being depreciated and amortized that may have to be replaced in the future; |
| • | do not reflect changes in, or cash requirements for, our working capital needs; |
| • | do not reflect the impact of certain cash charges resulting from matters we consider not to be indicative of our primary operations; |
| • | do not reflect the interest expense or the cash requirements necessary to service interest or principal payments on our debt; |
| • | do not reflect share-based compensation expense and other non-cash charges including asset impairments; |
| • | exclude certain tax payments that may represent a reduction in cash available to us; and |
| • | do not reflect transaction-related expenses associated with acquisitions, certain incremental costs associated with COVID-19 that are not expected to continue once the pandemic has significantly subsided globally and operations return to pre-COVID-19 levels, plant start-up costs incurred at our Columbus II facility and costs associated with becoming a public company. |
Because of these limitations, Adjusted EBITDA and Adjusted EBITDA Margin should be considered along with other operating and financial performance measures presented in accordance with GAAP.
VACM has important limitations as an analytical tool and should not be considered in isolation or as a substitute for analysis of our financial results as reported under GAAP. For example, VACM:
| • | excludes revenue from pass-through raw materials; |
| • | includes revenue from raw materials from our packaging design and production business where variations in raw material prices are not passed through to the customer due to customer order management practices unique to the packaging business, which are typically based on high frequency, recurrent orders, where prices are determined at project onset and there may be limited ability to renegotiate to account for fluctuations in raw material prices; and |
| • | VACM in comparison to Adjusted EBITDA Margin will be higher as the former is calculated based on revenue from value added contributions only whereas the latter is calculated based on total revenue, which includes revenue from pass-through raw materials. |
Because of these limitations, VACM should be considered along with other operating and financial performance measures presented in accordance with GAAP.
Our use of the terms Adjusted EBITDA, Adjusted EBITDA Margin and VACM may vary from the use of similar terms by other companies in our industry and accordingly may not be comparable to similarly titled measures used by other companies.
Financial Statement Presentation
This prospectus includes historical consolidated financial and other data for the Company and the Company’s operating subsidiary, kdc/one Development Corporation, Inc. (previously named Knowlton Development Corporation Inc.), a company existing under the laws of British Columbia (“KDC Opco”).
The Purchase Agreement was entered into on October 26, 2018 among KDC Opco, the holders of all its issued and outstanding common shares and the Purchaser named therein, which was formed by Cornell Capital
iv
Table of Contents
LLC for the purpose of consummating the transactions under the Purchase Agreement. On December 21, 2018 (the “Closing Date”), Cornell Capital LLC transferred its ownership of the Purchaser to Knowlton Development Corporation, Inc. (previously named Knowlton Development Parent, Inc.), which was incorporated by a group of investors led by Cornell Capital LLC in British Columbia on November 30, 2018 originally as a holding company with no assets or operations of its own. The Purchaser was subsequently amalgamated with KDC Opco immediately following the acquisition of the outstanding common shares of KDC Opco by Knowlton Development Corporation, Inc. through the Purchaser. This is referred to herein as the Acquisition. Prior to the Acquisition, Knowlton Development Corporation, Inc. efforts were limited to organizational activities directly related to the Acquisition and for which it incurred acquisition-related costs. The 21-day overlap between Knowlton Development Corporation, Inc.’s incorporation and the Closing Date is not presented as a separate financial statement as there were no operations by Knowlton Development Corporation, Inc. between the date of its incorporation and the Closing Date except for the organizational activities mentioned above. Knowlton Development Corporation, Inc. currently owns no significant assets nor has any operations other than the ownership of all the common shares of kdc/one Development Corporation, Inc.
As a result of the Acquisition, Knowlton Development Corporation, Inc. was identified as the acquirer for accounting purposes, and kdc/one Development Corporation, Inc. as the acquiree and accounting predecessor. The Company’s financial statement presentation distinguishes (i) a Predecessor Period for the 234-day period ended December 20, 2018 (i.e., the 234 days of the fiscal year prior to the Closing Date), which reflects the financial statements for kdc/one Development Corporation, Inc. (under the name Knowlton Development Corporation Inc.) for the period prior to the Closing Date and (ii) a Successor Period for the years ended April 30, 2021 and 2020 and the 152-day period ended April 30, 2019 (i.e., the 152 days following Knowlton Development Corporation, Inc.’s incorporation (under the name Knowlton Development Parent, Inc.)) which reflects the financial statements of the Company for the period after the Closing Date. The Acquisition was accounted for as a business combination using the acquisition method of accounting, and the Successor’s financial statements reflect a basis of accounting that is based on the fair value of the assets acquired and the liabilities assumed. As a result of the application of the acquisition method of accounting as of the Closing Date, the financial statements for the Predecessor Period and for the Successor Period are presented on a different basis and, therefore, are not comparable. The Company utilizes a fiscal year from May 1 to April 30. The combination of Predecessor and Successor Periods is referred to as the “Combined 2019 Financial Information.” On July 1, 2021, Knowlton Development Corporation Inc. changed its name to kdc/one Development Corporation, Inc. On the same day, Knowlton Development Parent, Inc., and Knowlton Development Holdco, Inc., a wholly-owned subsidiary of Knowlton Development Parent, Inc., amalgamated under the laws of British Columbia and continued as one corporation named Knowlton Development Corporation, Inc. These changes occurred after the end of the fiscal year ended April 30, 2021, such that the financial statements for the year ended April 30, 2021 included herein refer to Knowlton Development Parent, Inc. and Knowlton Development Corporation Inc. for the Successor Period and Predecessor Period, respectively.
The financial statements and the related notes thereto included elsewhere in this prospectus, including the share and per share information therein, are presented on a historical basis and therefore do not reflect the Share Capital Amendments. See “Description of Share Capital—Share Capital Amendments.”
Commonly Used Defined Terms
As used in this prospectus, unless the context otherwise requires:
| • | “2020 Transactions” refers, collectively, to the seven acquisitions completed across the Company’s operating segments in the fiscal year ended April 30, 2020, comprising the acquisitions of Alkos, Swallowfield, Benchmark, HCT, Paristy, CLA and Zobele (each as defined herein). |
| • | “2021 Revolver Increase” refers to the Company’s January 27, 2021 $170.0 million increase to its commitments under the Revolving Facility. |
v
Table of Contents
| • | “2021 Term Loan Increase” refers to the Company’s January 27, 2021 €100.0 million increase to the available Euro Term Loan. |
| • | “Acquisition” refers to the acquisition of all issued and outstanding common shares of KDC Opco by the Purchaser and the subsequent amalgamation of the Purchaser and KDC Opco completed on December 21, 2018, resulting from a series of transactions through which Knowlton Development Corporation, Inc. became the ultimate parent company of KDC Opco. |
| • | “Acupac” refers to Acupac Packaging, Inc. |
| • | “Alkos” refers to Aaxen SAS. |
| • | “Aromair” refers to Aromair Fine Fragrance Company. |
| • | “Benchmark” refers to Benchmark Cosmetic Laboratories. |
| • | “CDPQ” refers to Caisse de dépôt et placement du Québec. |
| • | “Chemaid” refers to Chemaid Laboratories. |
| • | “CLA” refers to Cosmetic Laboratories of America. |
| • | “Combined 2019 Financial Information” refers to the unaudited supplemental financial information for the fiscal year ended April 30, 2019, which combines the Predecessor Period and the Successor Period. |
| • | “compound annual growth rate” refers to the average rate of growth per year over multiple-year periods that assumes compounding at each interval within that time span, calculated by factoring each year’s absolute growth into the calculation of the succeeding year’s percentage growth. |
| • | “Cornell” refers to Cornell Capital LLC. |
| • | “Credit Agreement” refers to the credit agreement dated as of December 21, 2018 by and among the Purchaser, KDC US Holdings, Inc., Holdings, UBS Securities LLC, Guggenheim Securities, LLC and Jefferies Finance LLC, as Joint Lead Arrangers and Joint Bookrunners, and Sumitomo Mitsui Banking Corporation, as Documentation Agent, and the Lenders party thereto, as amended, supplemented or otherwise modified from time to time. |
| • | “DGCL” refers to the Delaware General Corporation Law. |
| • | “Disaggregated 2020 Financial Information” refers to the unaudited supplemental disaggregated financial information for the fiscal year ended April 30, 2020, which excludes the impact of the 2020 Transactions. |
| • | “Disaggregated 2021 Financial Information” refers to the unaudited supplemental disaggregated financial information for the fiscal year ended April 30, 2021, which excludes the impact of the 2020 Transactions. |
| • | “Distribution Financing Transactions” refers to, collectively, (i) the returns of capital the Company effected on or about February 3, 2021 in the amount of $232.65 per Class A and Class B common share of the Company, totaling $318.5 million in the aggregate, which were distributed to the Company’s shareholders and funded, along with cash, by the 2021 Term Loan Increase, the 2021 Revolver Increase and Incremental Amendment No. 9, and (ii) the adjustments made in accordance with the equitable adjustment provision of the Stock Option Plan composed of a reduction in the exercise price of options and adjustment payments in cash. |
| • | “Euro Term Loan” refers to the Company’s euro-denominated term loan tranche under the Credit Agreement obtained on July 28, 2020 in an aggregate amount of €460.0 million, maturing on December 21, 2025, and which was incrementally increased by the 2021 Term Loan Increase. |
| • | “First Lien Term Loan” refers to the term loan entered into by the Company under the Credit Agreement on December 21, 2018 in an aggregate principal amount equal to $525.0 million, maturing |
vi
Table of Contents
| on December 21, 2025, and which was subsequently increased on each of August 22, 2019, January 23, 2020 and April 30, 2020 by $105.0 million, $300.0 million and $500.0 million, respectively. |
| • | “GAAP” refers to generally accepted accounting principles in the United States. |
| • | “HCT” refers to Clover Park 2 (BVI) Limited, a subsidiary acquired by the Company in fiscal year ended April 30, 2020. |
| • | “HCT Metals” refers to Geng Xian Metal Treatment (Jiangmen) Company Limited and Yaochang Metal Works (Zhuhai) Co., Ltd. |
| • | “Incremental Amendment No. 9” refers to the incremental amendment (Amendment No. 9 to the Credit Agreement) dated as of January 27, 2021, which amended the Credit Agreement in connection with the 2021 Term Loan Increase and the 2021 Revolver Increase. |
| • | “Kolmar” refers to Kolmar Laboratories, Inc. |
| • | “Northern Labs” refers to Northern Labs, Inc. |
| • | “Omnibus Plan” refers to the new equity compensation plan, in the form of an omnibus incentive plan, adopted by the Company’s board of directors, and submitted for approval of the Company’s pre-offering shareholders, prior to the completion of this offering. |
| • | “Paristy” refers to, collectively, Mei Shual Cosmetics Co., Pte Ltd and Mei Shual Cosmetics Co., Ltd. |
| • | “Predecessor Period” refers to the period from May 1, 2018 through December 20, 2018. |
| • | “Purchase Agreement” refers to the share purchase agreement entered into on October 26, 2018 among KDC Opco, the holders of all its issued and outstanding common shares and the Purchaser. |
| • | “Purchaser” refers to the purchaser named in the Purchase Agreement, which was formed by Cornell for the purpose of entering into the transactions contemplated in the Purchase Agreement. |
| • | “Registration Rights Agreement” refers to the registration rights agreement to be entered into in connection with this offering between the Company and certain shareholders of the Company. |
| • | “Revolving Facility” refers to the revolving credit facility provided for in the Credit Agreement in an aggregate principal amount of $75.0 million, maturing on December 21, 2023, and which was subsequently increased on January 23, 2020, July 28, 2020, December 4, 2020, January 27, 2021 and February 24, 2021 by $50.0 million, $25.0 million, $25.0 million, $170.0 million and $10.0 million, respectively. |
| • | “Services Agreement” refers to the services agreement, as amended, dated as of December 21, 2018, between the Company and Cornell, entered into in connection with the Acquisition and pursuant to which the Company pays Cornell the Sponsor Fees for financial and management consulting services, as well as quarterly reimbursements of customary expenses, which agreement will be terminated concurrently with the closing of this offering. |
| • | “Share Capital Amendments” has the meaning ascribed thereto under “Description of Share Capital—Share Capital Amendments.” |
| • | “Shareholders’ Agreement” refers to the shareholders’ agreement to be entered into in connection with this offering between the Company and certain shareholders of the Company. |
| • | “Sponsor Acquisition Fees” refers to the cash fees we pay to Cornell, pursuant to the Services Agreement, upon consummation of an acquisition by us of any company, business or entity, equal to 1% of the total enterprise value of such company, business or entity. |
| • | “Sponsor Fees” refers to, collectively, the Sponsor Acquisition Fees and the Sponsor Management Fees. |
| • | “Sponsor Management Fees” refers to an annual cash fee we pay to Cornell, pursuant to the Services Agreement, equal to 2.5% of consolidated adjusted EBITDA, as defined in the Services Agreement. |
vii
Table of Contents
| • | “Stock Option Plan” refers to the Knowlton Development Corporation, Inc. Stock Option Plan under which the Company has granted equity awards in the form of stock options to certain employees and other persons, including its named executive officers. |
| • | “Successor Period” refers to the period from November 30, 2018 through April 30, 2019, along with the fiscal years ended April 30, 2021 and 2020. |
| • | “Swallowfield” refers to Curzon Supplies Ltd. |
| • | “TAM” refers to the total addressable market. |
| • | “Term Loans” refers, collectively, to the First Lien Term Loan and the Euro Term Loan. |
| • | “Thibiant” refers to Thibiant International, Inc. |
| • | “Zobele” refers to Z Gamma B.V. |
viii
Table of Contents
Letter from Nicholas Whitley, President and Chief Executive Officer
Dear Prospective Shareholder,
Trust is a formidable proposition, often taking years to establish.
It is this powerful foundation of trust with our beauty, personal care and home care customers combined with our differentiated, value-added solutions that has allowed kdc/one to reach the scale it enjoys today. Every time a customer turns to us to help ideate, innovate and create new products or provide solutions, it presents an opportunity for kdc/one to enhance a trusted relationship or forge anew. This is what drives our global organization of approximately 15,000 talented team members.
Our focus on innovation, problem solving and partnerships has allowed us to cultivate a customer base in excess of 700 companies. These world-class consumer products businesses include iconic industry leaders and some of the fastest growing independent and emerging brands. Many of our most important customer relationships have extended for well beyond a decade.
While few end consumers may know of kdc/one, many likely use a product that we ideate, formulate, design, package or manufacture on a daily basis. Products we help develop are available in more than 70 countries worldwide and across a range of distribution platforms, meeting the end consumer’s rapidly evolving shopping preferences. In fact, over the past three years, kdc/one co-developed more than 9,000 unique beauty, personal care and home care products across a broad spectrum of price-points from mass to prestige.
When I joined the company in 2013, it was a different business than the integrated global solutions provider I am proud to lead today. At the time, the company had approximately 50 customers and was primarily focused on North American personal care. It was the fantastic set of core competencies and shared values, upon which we could build, that inspired me to move my family across the world for the opportunity to lead this organization. The company’s long-standing trusted customer relationships, industry-leading innovation capabilities and deep commitment to operational excellence are fueled by our entrepreneurial spirit.
I have been fortunate that my entire tenure at kdc/one has been enhanced by partnerships with a terrific management team and supportive investors. Our shared objective of building a unique, growth-oriented company drives our actions. In December 2018, after our acquisition by Cornell and concurrent reinvestment by CDPQ (a preeminent Canadian investment fund), we developed and executed an ambitious strategy. Originally envisioned as a five-year plan, we more than doubled the business in just two. This dramatically expanded our suite of capabilities and drove global expansion into the most attractive end markets.
Our growth plan allowed kdc/one to benefit from structural shifts in the beauty, personal care and home care markets. Consumers have greater access to information and influence around their brand choices than ever before. They seek out brands that better reflect their own values and lifestyles, which, in turn, drives demand for product innovation and new brand introductions at an ever-increasing pace. These shifts, paired with our customers’ specific needs, crystallized a strategy, comprised of both organic expansion and acquisitions, that would quickly allow kdc/one to (i) obtain a global innovation and manufacturing footprint, (ii) deliver turn-key solutions incorporating ideation, formulation, design, packaging and manufacturing, and (iii) develop the breadth of expertise to seamlessly service both large and small customers alike. Following significant investments in both existing and new facilities, and a series of highly strategic acquisitions since December 2018, we are now uniquely positioned to build from these foundations, disrupt the industry and empower our brand partners across the globe.
As a result of our growth strategy, we believe the TAM for the value-added solutions we provide has expanded from approximately $135 billion to approximately $654 billion of retail sales for 2020.1 This nearly five-fold increase is a direct result of our deliberate evolution from a North America focused personal care business to a global enterprise spanning beauty, personal care and home care. kdc/one has been disciplined in targeting our
| 1 | Company estimate from Euromonitor International Limited, Beauty & Personal Care 2021 Fixed 2020 Exchange Rate, Home Care 2021 Fixed 2020 Exchange Rate, Retail Value RSP, Current Prices. Data extracted April 2021. |
ix
Table of Contents
growth investments into the most attractive, fastest growing and resilient subsectors of the broader consumer market. We will continue to utilize this compass to inform our future organic expansion and M&A activity.
While the past two and a half years have certainly been exciting, there is much more to come. We are in the early stages of harnessing and optimizing the cross-selling potential across this exceptional network of assets.
Our categories are demonstrating strong growth across our global footprint in the United States and Canada; Europe, the Middle East and Africa; and the Asia Pacific region. The Chinese beauty market, in particular, is experiencing exceptional growth and is poised to become the world’s largest by 2022, according to Euromonitor.2 We fully intend to grow with this dynamic market by providing solutions not just to international brands but also to the many rapidly growing domestic brands. We are making additional investments in our people and capabilities in China, alongside the unique China market insights we receive from C2 Capital, a current investor. Alibaba Group, the leading e-commerce platform in China, is an anchor investor in C2 Capital.
Another key area of focus for kdc/one is environmental sustainability, which encompasses cleaner formulations, sustainable packaging solutions as well as sustainable manufacturing processes. Our unique vantage point across the industry landscape provides access to a vast amount of market intelligence and data insight, which allows us to stay ahead in the emergence of conscious beauty and home care products. This is enabled by scouting sustainable eco-friendly ingredients, leading in clean breakthrough formulations and more sustainable packaging solutions, designed without compromise of performance. To continue building on this momentum, kdc/one recently created a new role, appointing a senior executive to lead our sustainability initiatives.
While all these developments have been taking place across the organization, we have been careful not to lose sight of our culture, which is predicated on seven key values:
| • | Innovation that inspires our customers |
| • | Passion that fuels our dedication |
| • | Accountability that anchors our teams |
| • | Excellence that propels our growth |
| • | Inclusion that drives our diversity |
| • | Wellbeing that sustains our energy |
| • | Compassion that serves our environment and employees |
It is important for me to see these values extend across the global organization. As a result, we have made significant investments to enhance our internal communications capabilities, increased the frequency of town-halls, and commenced the roll-out of employee surveys, all with the goal of forging a stronger personal link between kdc/one and its employees.
The resiliency of our organization and strength of our relationships with customers and key stakeholders has never been more evident than during the COVID-19 pandemic. Our teamwork and entrepreneurial spirit allowed us to take care of our kdc/one family, support our customers while continuing to expand our business capabilities and build towards the future.
kdc/one provides an attractive way for prospective investors to access the excitement and innovation across the most compelling and fast-growing consumer product segments without single brand or channel risk. I hope you will join us on our continuing journey, built on trust and differentiated value, as kdc/one continues to define beauty, personal care and home care, uniquely imagined and expertly delivered.
Nicholas Whitley
President and Chief Executive Officer
| 2 | Euromonitor International Limited. Beauty & Personal Care 2021, Fixed 2020 Exchange Rate, Retail Value RSP, Current Prices. Data extracted April 2021. |
x
Table of Contents
This summary highlights selected information that is presented in greater detail elsewhere in this prospectus. This summary does not contain all of the information you should consider before investing in our common shares. You should read this entire prospectus carefully, including the sections titled “Risk Factors,” “Management’s Discussion and Analysis of Financial Condition and Results of Operations” and our financial statements and the related notes included elsewhere in this prospectus, before deciding whether to purchase our common shares.
Company Overview
Beauty, Personal Care and Home Care, Uniquely Imagined and Expertly Delivered
We are a trusted global provider of value-added solutions to many of the world’s leading brands in the beauty, personal care and home care categories. We partner closely with both industry-leading consumer products companies and fast-growing independent brands as a critical enabler of their success through ideation, formulation, design, packaging and manufacturing of products sold under more than 1,000 different brand names. Over the past three years, we have been responsible for co-developing over 9,000 products across growing categories that include skin care, body and hair care, soaps and sanitizers, cosmetics, deodorants, sun care, fragrances, air care, fabric care, pest control and surface care products. The innovative products that we have helped to develop are sold by our brand partners in more than 70 countries worldwide.
Revenue by Category
The pace of innovation and new brand and product introduction is accelerating across the beauty, personal care and home care categories. This, in turn, has underscored the importance of rapid strategic product development partnerships with companies such as ours to accelerate the speed to market. Against that backdrop, we have benefited by building a leading suite of end-to-end, value added solutions across a global platform. We believe the vertical integration of product solutions, coupled with the ability to service both established and emerging brands worldwide, provides us with a significant competitive advantage.
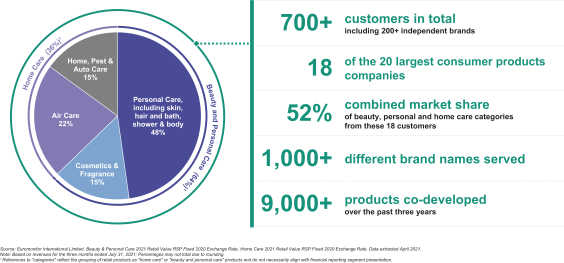
We provide our value-added solutions to more than 700 customers worldwide as of July 31, 2021, across 13 different product categories. Our customers include many of the most recognizable and rapidly emerging
1
Table of Contents
companies in beauty, personal care and home care. Our customer base encompasses 18 of the 20 largest beauty, personal care and home care companies worldwide, when ranked by retail sales in 2020, according to Euromonitor.3 In total, these 18 customers had a 52% share of the beauty, personal care, and home care categories in 2020, according to Euromonitor.3 As of July 31, 2021, our portfolio also included more than 200 independent and emerging customers, who we have selectively targeted as being among the fastest growing and most noteworthy brands.
Diverse Customer Base Underpinned by Long-Term Relationships
Our relationships with our largest customers are often multifaceted and can extend across their business portfolio to encompass multiple brands, products and geographies, creating a diversified portfolio approach aligned to multifaceted growth with resilience. We partner in the development of brands and products across the retail pricing spectrum, from mass to masstige to prestige. Products incorporating our value-added solutions are distributed across a broad array of channels from mass to specialty retail to e-commerce. We leverage our diverse suite of leading capabilities to support our customers across the product development and production cycle. Through our global footprint, we expect to be able to deliver our expertise wherever our customers choose to operate.
| 3 | Euromonitor International Limited. Beauty & Personal Care 2021, Retail Value RSP Fixed 2020 Exchange Rate, Home Care 2021 Retail Value RSP Fixed 2020 Exchange Rate. Data extracted April 2021. |
2
Table of Contents
Global End-to-End Solutions:
Vertical Integration from Beaker to Box Enables Speed to Market
Since fiscal year 2016, we have delivered significant growth through a combination of organic expansion and strategic acquisitions, increasing our revenue, net income (loss) (as we grew our business) and Adjusted EBITDA from $516.2 million to $2,143.8 million, $7.5 million to $(125.8) million and $61.5 million to $238.5 million, respectively, for fiscal year 2016 (with fiscal 2016 numbers derived from unaudited financial information not included in this prospectus) and fiscal year 2021, respectively. Adjusted EBITDA is a non-GAAP measure; for a reconciliation of Adjusted EBITDA to the most directly comparable financial measure in accordance with GAAP, see the section titled “Prospectus Summary—Summary Consolidated Financial and Other Data.”
Innovation is at the heart of both our culture and our value proposition. We have approximately 400 employees focused on research and development (“R&D”) as of July 31, 2021, including chemists, formulators, engineers and designers. As of July 31, 2021, our R&D personnel operate across 22 R&D, design and creative facilities and four innovation hubs globally, connecting locally with our customers wherever they are located. For each of the year ended April 30, 2021 and the three months ended July 31, 2021, approximately 73% of our total revenue was attributable to products we helped ideate, design or develop. We believe our R&D capabilities position us as a driving force for growth in our categories. For example, teams at our four innovation hubs, which are located in North America, Europe and the Asia Pacific region, focus on identifying emerging consumer trends and developing new technologies to leverage them. Our current and prospective customers are able to utilize the technologies we develop in the customization of their own branded products.
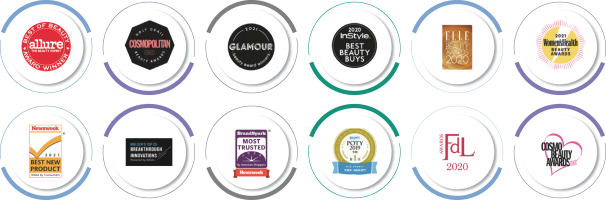
Our track record of innovation speaks for itself. We developed or co-developed over 3,500 formulations and 7,500 packaging designs during the year ended April 30, 2021. We also own an extensive library of proprietary formulations and packaging designs to which our customers have access. Over the last three years, on average, we have played a role in the launch of more than 3,000 new products annually. Products that we have co-developed are highly regarded and have won numerous industry awards.
3
Table of Contents
Select Recent Awards Enabled Through our Industry-leading Innovation Network
In addition to our focus on innovation through ideation and formulation, we have expansive capabilities in product delivery systems, design and packaging. We believe that we are the leader in customized delivery and packaging solutions, making us a “go-to” partner for brands seeking to differentiate themselves in terms of performance, look and feel. Customized packaging is an increasingly important way for brands to stand out from their competition in a crowded marketplace. In partnership with our customers, our expertise has led to the creation of many of the most distinctive beauty, personal care and home care products in consumers’ homes today.
We also have a sizeable and flexible global manufacturing footprint, operating to the most rigorous standards in the industry and allowing us to seamlessly deliver solutions for the complex production requirements of our customers. As of July 31, 2021, our manufacturing platform includes 25 facilities across North America, Europe, Latin America and the Asia Pacific region, 12 of which are over-the-counter (“OTC”) registered. At these facilities, we are able to engineer and manufacture products both at scale and in shorter runs. Our global infrastructure and integrated supply chain enable us to develop and deliver complex products while also maintaining the flexibility to respond to the needs of our customers as they arise. This, in turn, allows us to seamlessly support global brand launches across our customer base. We believe the stringent standards by which we operate provide our customers with confidence in the quality of our products and in our adherence to strict regulatory standards.
4
Table of Contents
Well-Invested Network to Support Our Customers Globally
We have grown significantly over the past two decades, systematically expanding our product capabilities, category reach and geographic footprint to better serve the needs of our customers globally. We have done this both organically and through acquisitions.
At our Knowlton, Québec, facility, for example, we recently completed a multi-step investment to expand and enhance our capabilities in the antiperspirant and deodorant category. We added a dedicated and flexible automated production line to support the growth of our on-trend natural deodorant products. We are currently undertaking a number of large-scale organic growth initiatives. Operations at our new facility in Columbus, Ohio commenced in the second quarter of fiscal year 2022, adding capabilities across a range of products, including foaming soap, hand soap, shower gel, hand sanitizer and body cream. We are expanding the footprint of our facility in Mexico, which is expected to increase by more than 70% and allow us, for the first time, to serve beauty and personal care customers, in addition to home care customers, through this location. We also expect to double capacity in Texas through our investment in our highly automated manufacturing facility. Each of these projects has been undertaken on the basis of supporting organic growth.
Acquisitions have also been, and we expect will continue to be, an important part of our growth. In 2020, we added industry-leading expertise in the field of complex packaging design and production through the acquisition of HCT, enabling us to better service the premium beauty category. HCT, through its global platform, increased our exposure to many of the most innovative and fast-growing emerging brands worldwide, while further expanding our relationship with many multinational leaders in prestige beauty. We believe the vertically integrated solutions that we now provide are a differentiated and important value proposition for brands, allowing them to accelerate speed to market.
In addition, in 2020, we added advanced capabilities in device design for the global home care category through the acquisition of Zobele, providing us with greater access to a large and growing market. Our acquisition of Paristy the same year provided us with the capability to offer leading, China-based capabilities in product formulation and manufacturing to both international beauty companies as well as leading domestic beauty brands in that region. We have developed a rich pipeline of acquisition opportunities, and we will
5
Table of Contents
continue to take a disciplined approach focused only on assets that we believe enable us to better serve our customers through expansive, end-to-end capabilities.
As we have extended our reach in terms of capabilities and geographies, the TAM for the value-added solutions we provide has meaningfully increased. Adding expansive capabilities in the home care category through acquisitions, and the extension of our geographic reach beyond our North American origins into Europe, Latin America and the Asia Pacific region, have enabled us to expand the size of our addressable market by a factor of five from approximately $135 billion to over $654 billion, based on 2020 retail sales, according to industry information from Euromonitor.4
We generated total revenue of approximately $2.1 billion for the year ended April 30, 2021. Over the same period, we incurred a net loss of $125.8 million and recognized Adjusted EBITDA of $238.5 million. In addition, we generated total revenue of $603.4 million for the three months ended July 31, 2021. Over the same period, we incurred a net loss of $12.7 million and recognized Adjusted EBITDA of $54.7 million.
Many of our customer contracts allow us to effectively pass through raw material costs, providing us with a hedge against fluctuations in commodity prices. As a result, we evaluate the performance of our business on the basis of Value-Added Contribution Margin (“VACM”), which we define as Adjusted EBITDA divided by revenue from value added contributions.
Our business is focused on innovation, product development and operational excellence. As a result, we believe VACM best reflects the profitable solutions we provide to our customers. We delivered VACM of 22.0% for the year ended April 30, 2021. In addition, we delivered VACM of 18.3% for the three months ended July 31, 2021.
Since fiscal year 2016, revenue (derived from unaudited financial information not included in this prospectus) from our Knowlton, Lynchburg, Columbus, Chemaid and Toronto facilities, which were our only facilities in existence at the beginning of fiscal year 2016, grew at a compounded annual growth rate of 5.6%. Although these facilities (including revenue attributable to the Toronto facility, which closed in fiscal year 2017 and had its business transferred to our Knowlton and Lynchburg facilities) generated 26% of the Company’s total fiscal year 2021 revenue, we believe this metric is meaningful as it demonstrates the growth, over an extended period of time, for a core portion of the Company’s operations. The financial information for the year ended April 30, 2016 has been derived from unaudited books and records of the Company, which are prepared on the same basis and using the same accounting principles as the audited consolidated financial statements of the Company included elsewhere in this prospectus.
Favorable Industry Dynamics
We operate in many of the largest, fastest growing, most resilient and most valuable product categories within beauty, personal care and home care. Product categories served by our Beauty and Personal Care segment represented retail sales value of $487 billion globally for 2020, according to Euromonitor.5 On a weighted-average basis, they are expected to deliver a compound annual growth rate of 5.2% through 2025. Product categories served by our Home Care segment represented retail sales value of $167 billion globally for 2020, according to Euromonitor.6 On a weighted-average basis, they are expected to deliver a compound annual growth rate of 6.4% through 2025.6
Within these product categories, a number of structural shifts are taking place that favor a value-added, integrated solutions partner such as kdc/one. Through digitization, consumers have more immediate access than
| 4 | Company estimate from Euromonitor International Limited. Beauty & Personal Care 2021, Fixed 2020 Exchange Rate, Home Care 2021 Fixed 2020 Exchange Rate, Retail Value RSP, Current Prices. Data extracted April 2021. |
| 5 | Euromonitor International Limited. Beauty & Personal Care 2021, Fixed 2020 Exchange Rate, Retail Value RSP, Current Prices. Data extracted April 2021. |
| 6 | Euromonitor International Limited. Home Care 2021, Fixed 2020 Exchange Rate, Retail Value RSP, Current Prices. Data extracted April 2021. |
6
Table of Contents
ever before to information around their purchasing choices, giving the consumer increasingly direct influence over the nature of the products that are brought to market. This has resulted in a faster pace of innovation across the beauty, personal care and home care categories, both for existing products and through a significant increase in the rate at which new brands are introduced.
As established brands adapt to this faster-paced consumer environment, they are increasingly reliant on outsourced strategic partnerships to help drive product innovation and speed to market. Likewise, owners of emerging brands often favor an asset-lite approach, freeing up time and resources to focus on consumer connectivity.
We believe the following capabilities, in particular, make kdc/one well-suited to benefit from these structural shifts:
| • | Innovation: We have developed comprehensive innovation capabilities, from ideation to formulation to design and packaging, allowing us to partner with our customers in addressing increasing consumer demand for new products and brands. |
| • | End-to-end solutions: As consumer demand for “newness” accelerates, brands are increasingly partnering with kdc/one across all facets of the strategic product planning process. We believe that our ability to offer integrated, end-to-end solutions on a global basis makes us a preferred partner across the categories we serve. |
| • | Speed to market: Our end-to-end capabilities reduce lead times for new products, meaning we are often able to shorten time to market compared with others in our industry, essential in a “fast beauty” environment. |
| • | Agile production capabilities: As the pace of innovation has increased, brands have shifted towards shorter product runs and more frequent innovation. Our manufacturing platform is flexible and agile, meaning that we are able to accommodate shorter runs for our customers across multiple geographies. At the same time, we are also able to scale production rapidly as brands grow. |
| • | Unique global network: We believe that partnering with kdc/one provides our customers with access to a unique network of capabilities across formulation, packaging and manufacturing; this allows them to focus investment of time and capital in meeting the needs of the consumer in a dynamic market. |
| • | Regulatory compliance and quality control: Customers rely on our expertise in complex global regulatory requirements enabling them to satisfy demand from an increasingly global consumer base. |
The structural industry shifts that favor reliance on outsourced capabilities are also creating pockets of demand from consumers, and, in turn, our direct customers, that far outpace category averages. Our deep industry expertise, coupled with constant, close communication with our customer base allows us to identify those opportunities and to focus our efforts appropriately.
We closely monitor the emerging brand landscape, and now count more than 200 customers that are independent and emerging among our customer base. The pace of growth for brands that are marketed and sold in a digital environment has been particularly strong in recent years. Industry estimates suggest that e-commerce growth in beauty and personal care, for example, has outpaced brick-and-mortar distribution by a factor of thirteen over the period from 2018 through 2020.7 We have partnered with our customers to ideate, formulate, design and package products that are specifically positioned for success in a digital marketing environment.
Consumers are increasingly seeking brands and products that better reflect their own values and lifestyles. This manifests itself in many ways, including more environmentally friendly ingredients, cleaner formulations,
| 7 | Euromonitor International Limited. Retailing 2021, Fixed 2020 Exchange Rate, Retail Value RSP excluding sales tax, Current prices. Data extracted April 2021. |
7
Table of Contents
sustainable packaging, and the way in which a company treats its employees or gives back to its community. We believe that the services and solutions we offer enable our brand partners to deliver cutting-edge products that are consistent with these values without compromising performance. Our broad suite of capabilities helps us partner with our customers to satisfy rapidly growing consumer demand and to help them achieve their own sustainability goals.
From a geographic perspective, industry estimates suggest that growth will continue across each of the major regions in which we operate, including the United States and Canada; Europe, the Middle East and Africa; and the Asia Pacific region. On a weighted-average basis, the markets for beauty, personal care and home care are expected to grow at a compound annual rate of 2.3%, 4.9% and 7.0% in the United States and Canada; Europe, the Middle East and Africa; and the Asia Pacific region, respectively, from 2019 through 2025, according to Euromonitor.8 China, in particular, is experiencing a period of elevated growth and is expected to grow at a compound annual rate of 10.2% over the period from 2019 through 2025.9 We have expanded our capabilities in the region through the acquisitions of industry-leading and well-respected companies, including Paristy, HCT and Zobele. We also benefit from China market insights provided by C2 Capital, a current investor. Alibaba Group, the leading e-commerce platform in China, is an anchor investor in C2 Capital.
Key Strengths
We are focused on driving deep and lasting relationships with our customers by leveraging the following competitive strengths:
We provide value-added solutions in some of the fastest growing, most resilient and most valuable categories across the consumer landscape, underpinned by an ongoing shift towards outsourced product development and innovation
The categories in which we operate represent, in aggregate, retail sales of approximately $654 billion globally for 2020, according to Euromonitor.10 On a weighted-average basis, these categories are expected to deliver a compound annual growth rate of 5.5% from 2019 through 2025.10 Across these categories, growth is underpinned by increasing consumer demand for product innovation and new brands, which in turn favors increasing reliance by consumer products companies on outsourced support for strategic product development. Our deep industry knowledge and insights also allow us to focus on areas of growth that are higher than the category average. Examples include: our focus on partnering with fast-growing, independent and emerging brands; our ability to service the fast-paced innovation requirements of brands focused on digital marketing and distribution (who often run asset-lite business models); and our increased focus on the rapidly-growing market for clean and sustainable product and packaging solutions.
We expect to deliver significant category growth across each major region in which we operate, including the United States and Canada; Europe, the Middle East and Africa; and the Asia Pacific region. China, in particular, is experiencing a period of elevated growth and its beauty, personal care and home care markets are expected to grow at a weighted-average compound annual rate of 10.2% from 2019 through 2025, according to Euromonitor.10 We have recently expanded our capabilities in the region through the acquisitions of Paristy, HCT and Zobele.
| 8 | Company estimate from Euromonitor International Limited, Beauty & Personal Care 2021 Fixed 2020 Exchange Rate, Home Care 2021 Fixed 2020 Exchange Rate, Retail Value RSP, Current Prices. Data extracted April 2021. |
| 9 | Euromonitor International Limited. Beauty & Personal Care 2021 Retail Value RSP Fixed 2020 Exchange Rate, Home Care 2021 Retail Value RSP Fixed 2020 Exchange Rate. Data extracted April 2021. |
| 10 | Company estimate from Euromonitor International Limited. Beauty & Personal Care 2021 Fixed 2020 Exchange Rate, Home Care 2021 Fixed 2020 Exchange Rate, Retail Value RSP, Current Prices. Data extracted April 2021. |
8
Table of Contents
Trusted, long-term partnerships with the industry’s leading consumer products companies and fast-growing independent and emerging brands
The breadth of our capabilities, coupled with our extensive geographic reach, allows us to develop long-term, trusted, strategic partnerships with our over 700 customers, encompassing over 1,000 brands across categories and geographies. As of July 31, 2021, our customers included more than 200 independent and emerging customers, who we have selectively targeted as owning many of the fastest growing and most noteworthy brands.
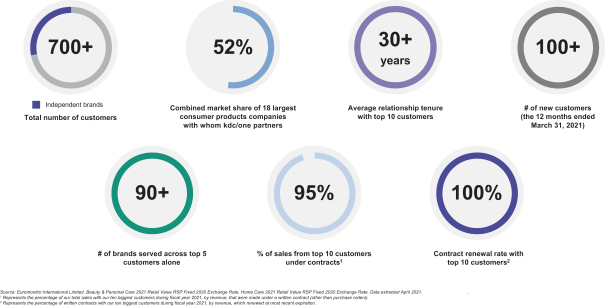
We enjoy close connectivity with our customers, reflecting the important role we play across the value chain. We have the ability to coordinate with our customers at every stage of the strategic product planning process. We have often been told that our ability to provide integrated solutions across the value chain makes us the first call for our customers when they seek to partner on new products or develop new solutions. The trust that our customers place in our capabilities leads to long-tenured relationships. For the year ended April 30, 2021, with our top 10 customers by revenue, we have an average relationship tenure of more than 30 years. We also have a track record of growing our revenue opportunities with customers over the duration of our partnership.
Differentiated Customer Solutions—Selected Case Studies
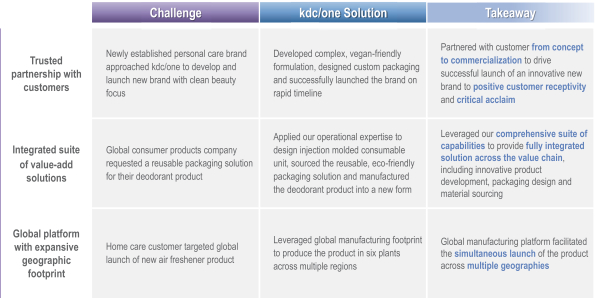
We offer a comprehensive, integrated and global portfolio of value-added solutions, including ideation, formulation, design and packaging and manufacturing
We have developed a comprehensive, integrated suite of value-added customer solutions and product capabilities. Our integrated approach allows us to offer services to our customers across every aspect of product development. We believe this is a significant competitive advantage, as we are able to partner with our customers to offer end-to-end solutions. Through our global footprint we are also able to deliver value-added solutions to customers worldwide. The comprehensive nature of our offering has allowed us both to add new customers and to increase share of spend with our existing customers.
9
Table of Contents
We support our comprehensive suite of solutions and capabilities with a sizeable and flexible manufacturing footprint, operating to stringent quality standards from our customers and adhering to strict regulatory standards. As of July 31, 2021, our manufacturing platform includes 25 facilities across North America, Europe, Latin America and the Asia Pacific region. At these facilities, we are able to engineer and manufacture products both at scale and in shorter product runs for our customers. Our global infrastructure and integrated supply chain enable us to develop and deliver highly complex products while also maintaining the flexibility to respond to the needs of our customers as they arise. We believe the stringent standards by which we operate provide our customers with confidence as to product quality and adherence to complex regulatory standards.
We enjoy leading capabilities in product innovation and design, enabling us to partner with our customers to meet increasing consumer demand for new products and brands
We believe we have the industry’s leading capabilities in product innovation. Teams at our four innovation hubs, located in the United States, Europe and Asia, focus on identifying emerging consumer trends and developing new technologies to leverage them. As of July 31, 2021, our R&D personnel operate across 22 R&D, design and creative facilities as well as four innovation hubs globally, connecting locally with our customers wherever they are located. For each of the year ended April 30, 2021 and the three months ended July 31, 2021, approximately 73% of our total revenue was attributable to products we helped ideate, design or develop.
Our track record of innovation speaks for itself. We developed or co-developed over 3,500 formulations and 7,500 packaging designs during the year ended April 30, 2021. We also own an extensive library of proprietary formulations and packaging designs to which our customers have access. Over the last three years, on average, we have played a role in the launch of more than 3,000 new products annually.
We have a successful track record of enhancing our product capabilities, category reach and geographic footprint through both organic expansion as well as highly selective and strategic acquisitions
We have grown significantly over the past two decades, systematically expanding our product capabilities, category reach and geographic footprint to better serve the needs of our customers. We have done this both organically and through acquisitions.
Our organic growth encompasses a range of initiatives including (i) upgrading and enhancing existing facilities; (ii) expanding capacity or building out new capabilities across the kdc/one network; and (iii) the construction of brand new facilities. kdc/one has a history of consistent execution success across all these forms of organic growth, and is currently in the process of completing several significant organic growth projects across the network. Importantly, these organic investments are supported by specific customer contracts.
At our Knowlton facility, we recently expanded and enhanced our antiperspirant and deodorant capabilities through the installation of new high speed production lines, supporting the growth of our on-trend natural deodorant products. We are currently in the process of a substantial expansion of our Home Care facility in Mexico (70% increase in square footage), transforming it into a facility capable of servicing Beauty and Personal Care customers as well. Upon completion of the project, this facility will also mark the introduction of wipes technology into the kdc/one network.
Following the successful construction of our Columbus facility in 2012 and subsequent fragrance build-out in 2016, the new 570,000 square-foot Columbus II facility adds a modern, flexible and highly automated facility to the kdc/one portfolio. While the Columbus II facility will be initially focused on the Beauty and Personal Care segment, the facility also contains 180,000 square feet of unutilized space underroof targeted to be used to support growth for our Home Care segment. We will continue to make disciplined investments in partnering with our global customers.
10
Table of Contents
We have a successful track record of acquisitions. Over our 30-year history, we have completed 16 transactions. Our current management team has completed six of those transactions over the past two years.
We have been systematic and disciplined in our approach to acquisitions. Our deep knowledge of the beauty, personal care and home care markets has allowed us to anticipate both significant industry shifts and the demands of our customers, and to identify acquisition targets that allow us to meet those demands. For example, the acquisition of HCT in 2020 added leading capabilities in design and packaging, which in combination with our existing platform has allowed us to provide both existing and new customers with a differentiated solution, and enhanced speed to market, from a truly integrated capability encompassing ideation to final product. The acquisition of Zobele in 2020 provided us with access to advanced device development and manufacturing capabilities in the large and growing global home care market. Similarly, our acquisitions of Zobele and Paristy, in particular, have enabled us to extend our geographic reach beyond North America to serve customers in Europe, Latin America and the Asia Pacific region. kdc/one is today a highly differentiated, vertically integrated brand enabler with global reach.
As a market leader in a fragmented industry, we believe we will benefit from ongoing opportunities to extend our reach through our buy and build strategy. We have developed a pipeline of opportunities that we will continue to monitor on a go forward basis. We will continue to be highly selective in our approach to acquisitions, focusing only on opportunities where we can add both leading capabilities and talent. We will continue to be careful and disciplined stewards of capital.
We have a diversified and resilient business model driving strong financial performance
Since fiscal year 2016, we have delivered significant growth through a combination of organic expansion and strategic acquisitions, increasing our revenue, net income (loss) (as we grew our business) and Adjusted EBITDA from $516.2 million to $2,143.8 million, $7.5 million to $(125.8) million and $61.5 million to $238.5 million, respectively, for fiscal year 2016 (with fiscal 2016 numbers derived from unaudited financial information not included in this prospectus) and fiscal year 2021, respectively. Adjusted EBITDA is a non-GAAP measure; for a reconciliation of Adjusted EBITDA to the most directly comparable financial measure in accordance with GAAP, see the section titled “Prospectus Summary—Summary Consolidated Financial and Other Data.”
Over the same period, revenue (derived from unaudited financial information not included in this prospectus) from our Knowlton, Lynchburg, Columbus, Chemaid and Toronto facilities, which were our only facilities in existence at the beginning of fiscal year 2016, grew at a compounded annual growth rate of 5.6%. Although these facilities (including revenue attributable to the Toronto facility, which closed in fiscal year 2017 and had its business transferred to our Knowlton and Lynchburg facilities) generated 26% of the Company’s total fiscal year 2021 revenue, we believe this metric is meaningful as it demonstrates the growth, over an extended period of time, for a core portion of the Company’s operations. The financial information for the year ended April 30, 2016 has been derived from unaudited books and records of the Company, which are prepared on the same basis and using the same accounting principles as the audited consolidated financial statements of the Company included elsewhere in this prospectus.
In many cases, we are able to pass through raw material costs to our customers by generating revenues through (i) contracts in which raw materials are either provided by or on behalf of the customer, or costs are partially or totally passed through to the customer, and (ii) purchase orders that sometimes serve as a de facto pass-through mechanism for variations in raw material price changes, providing us with an effective hedge against fluctuations in commodity prices. As a result, we evaluate the performance of our business on the basis of VACM, which we define as Adjusted EBITDA divided by revenue from value added contributions. Our business is focused on innovation, product development and operational excellence. As a result, revenue from value added contributions reflects the way customers interact with kdc/one and the value embedded in our product delivery
11
Table of Contents
that we provide to them. We have recognized a net loss of $125.8 million and Adjusted EBITDA of $238.5 million for the year ended April 30, 2021. Over the same period, we delivered a VACM of 22.0%. In addition, we have recognized a net loss of $12.7 million and Adjusted EBITDA of $54.7 million for the three months ended July 31, 2021. Over the same period, we delivered a VACM of 18.3%.
The diversification of our customer base and our product offerings also enables our business to be resilient through economic downturns. The categories on which we focus have also been resilient. For example, over the period 2007 to 2010, the beauty and personal care market grew at a compound annual growth rate of 3.7% and the home care market grew at a compound annual growth rate of 3.0%,11 while global gross domestic product grew at a compound annual growth rate of just 1.5%.
Highly experienced management team committed to supporting and enhancing kdc/one’s strong culture
Under the leadership of our President and Chief Executive Officer, Nicholas Whitley, we have built a talented and experienced multi-disciplinary and global management team to help drive growth.
We remain extremely focused on recruiting and retaining leading talent. As part of this effort, we have fostered a culture within the organization that emphasizes diversity, inclusion and respect. We have also sought to recruit individuals with a broad set of experiences to bring fresh perspectives to our business.
As part of this effort, we have made significant investments in our internal communications capabilities, increased the frequency of town-halls and conducted employee surveys all with the goal of forging stronger personal links between our team members. We believe that our corporate culture is one in which our talented managers and employees can thrive.
Drivers of Growth
We benefit from multiple drivers of future growth for our business, both organic and inorganic. Together, they enable us to capture market share and grow at a faster rate than average for the categories in which we participate.
Ability to offer our customers integrated, end-to-end solutions leveraging our global footprint
Through a combination of organic expansion and strategic acquisitions, we have built a comprehensive suite of solutions and capabilities to serve the beauty, personal care and home care categories, from ideation and formulation to design, packaging and manufacturing. This enables us to provide integrated, value-added solutions to our customers at every stage of the strategic product development process. In conjunction with our global footprint, we believe this provides us with a unique opportunity to serve the needs of our customers worldwide.
For example, we recently developed a sustainable product line for a customer, covering all aspects of the process from formulation to design and packaging, leveraging both the capabilities of our legacy kdc/one business as well as packaging solutions developed through HCT. We also have a strong track record of working with emerging brands whose founders have strong creative vision but rely on kdc/one’s experience in product ideation, formulation, design, delivery and packaging.
| 11 | Euromonitor International Limited. Beauty & Personal Care 2021 Retail Value RSP Fixed 2020 Exchange Rate, Home Care 2021 Retail Value RSP Fixed 2020 Exchange Rate. Data extracted April 2021. |
12
Table of Contents
Significant opportunity to cross-sell our comprehensive suite of value-added solutions to both new and existing customers
We have trusted relationships with over 700 customers globally. Many of our customer relationships were initiated through the provision of category-specific solutions. As we have extended our reach with respect to capabilities, categories and geographies, we have given our customers access to a broader suite of value-added solutions. As our customer relationships expand in this way, our reputation for innovation, reliability and quality assurance has a multiplier effect on the breadth of solutions our customers ask us to deliver. We have been successful in the early stages of leveraging our network to optimize cross-selling opportunities. As illustrated below, cross-selling opportunities arise across geographies, categories, capabilities and brands.
Cross-selling Opportunities
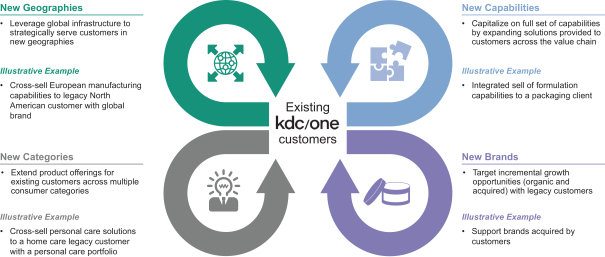
In addition to cross-selling to our existing customers, we are highly active in targeting and acquiring new customers. Over the twelve months ended March 31, 2021, we built relationships with over 100 new customers, many of which are high-growth emerging names. We believe that the opportunity to offer those new customers access to solutions across our broader footprint also represents a compelling growth opportunity.
Continue to target the fastest growing areas of demand within the categories and markets we serve
We believe that the breadth of both our customer relationships and our global footprint provide us with unique insights into the end markets we serve. This, in turn, allows us to anticipate the needs and demands of our customers and to focus on the areas which are demonstrating the most rapid growth. For example, we have been able to identify and establish relationships with more than 200 independent and emerging customers, who we have selectively targeted as owning many of the fastest growing and most noteworthy brands. Many of these brand owners operate asset-lite business models and rely heavily on kdc/one to provide innovative product solutions. Similarly, we have developed capabilities that are well-placed to service brands focused on digital distribution, delivering rapid innovation and shorter product runs. We have also recognized growing consumer demand for cleaner and more sustainable product formulations and packaging, and have developed industry leading solutions to help us capture an outsized share of that market.
13
Table of Contents
Continue to expand our geographic reach, including in China and the Asia Pacific region more broadly
We have built a global platform that positions us well for future growth across markets including North America, Europe, Latin America and Asia. On a weighted-average basis, the markets for beauty, personal care and home care are expected to grow at a compound annual rate of 2.3%, 4.9% and 7.0% in the United States and Canada; Europe, the Middle East and Africa; and the Asia Pacific region, respectively, from 2019 through 2025, according to Euromonitor.12 We have more recently focused on establishing a strong foothold in China, in particular, through the acquisitions of Paristy, HCT and Zobele in 2020. According to Euromonitor, by 2022, the size of the beauty market in China is projected to surpass that of the United States in terms of retail sales to become the largest in the world. Our capabilities in China now include formulation, design and packaging and manufacturing.13 We can now offer value-added solutions not only to multi-national consumer products companies, but also to leading domestic companies who are increasingly capturing market share. We are making additional investments in our people and capabilities in China, alongside the unique China market insights we receive from C2 Capital, a current investor. Alibaba Group, the leading e-commerce platform in China, is an anchor investor in C2 Capital.
Expand our category, capability and geographic reach through highly selective and strategic acquisitions
We have a successful track record of expansion through acquisitions. We have developed a strong pipeline of potential acquisition opportunities which we believe will help us to further broaden our reach and grow our relationships with both existing and new customers. Our management team includes executives with significant acquisition experience, both at kdc/one and from prior roles within the corporate, investment banking and legal fields. We will continue to focus on assets that we believe are truly best-in-class with respect to their respective capabilities and leadership teams, which are additive to our ability to service the demands of our customers. We will continue to be careful and disciplined stewards of capital as we contemplate acquisition activity going forward. We take a disciplined approach to reinvestment in our business, and approved investment projects typically have payback periods of two years or less, or up to three to four years where we deliver significant infrastructure expansion.
Continue to grow profitability margins with several levers to drive future margin expansion
We have a demonstrated track record of growing our profit margins and believe we have a path to future margin expansion. There are several levers we intend to utilize to expand our margins over time. As we grow, we believe our business mix across our two primary business segments should naturally drive margin accretion over time given the relative margin and growth profile of the two segments. Additionally, we plan to continue to effectively leverage our end-to-end, vertically-integrated business model to promote cross-selling across our business segments, geographies, and product categories. For example, in our beauty and personal care business, we can utilize our newer end-to-end capabilities, like packaging innovation, that we gained through our acquisition of HCT to cross-sell additional services to existing customers. We believe there is significant opportunity to drive further cross-sell penetration across multiple kdc/one sites within our existing customer base as well as with new customers, which we believe will increase our consolidated margin profile over time. In both our beauty and personal care business and our home care business, we believe we will benefit from incremental leverage of our fixed cost base as well as our continuous improvement initiatives across the kdc/one network, particularly through achieving efficiency improvements in our labor programs. Additionally, our Columbus II facility is expected to increase production automation and create new capacity and volume that will allow for greater operating leverage.
| 12 | Company estimate from Euromonitor International Limited. Beauty & Personal Care 2021 Retail Value RSP Fixed 2020 Exchange Rate, Home Care 2021 Retail Value RSP Fixed 2020 Exchange Rate. Data extracted April 2021. |
| 13 | Euromonitor International Limited. Beauty & Personal Care 2021, Fixed 2020 Exchange Rate, Retail Value RSP, Current Prices. Data extracted April 2021. |
14
Table of Contents
Corporate Information
kdc/one Development Corporation, Inc. was initially incorporated on December 17, 1990. In connection with the Acquisition, the Company was incorporated under the Business Corporations Act (British Columbia) (“BCBCA”) in November 2018 to become the indirect parent company of kdc/one Development Corporation, Inc. On July 1, 2021, Knowlton Development Corporation Inc., the operating company and the indirect wholly owned subsidiary of Knowlton Development Parent, Inc., changed its name to kdc/one Development Corporation, Inc. On the same day, Knowlton Development Parent, Inc. and Knowlton Development Holdco, Inc., a wholly-owned subsidiary of the Knowlton Development Parent, Inc., amalgamated under the laws of British Columbia and continued as one corporation named Knowlton Development Corporation, Inc., which became the direct parent of kdc/one Development Corporation, Inc. The Company owns no significant assets nor has any operations other than the ownership of all the common shares of kdc/one Development Corporation, Inc.
Our principal executive office is in Canada, located at 375 Roland-Therrien Boulevard, Suite 210, Longueuil, Québec, Canada, J4H 4A6, and our telephone number is (450) 243-2000. Our registered office is located at Suite 1700, Park Place, 666 Burrard Street, Vancouver, British Columbia, Canada, V6C 2X8. We also maintain a principal executive office in the United States, located at 250 Pehle Avenue, Suite 1000, Saddle Brook, New Jersey 07663 and our telephone number is (201) 688-2300. Our website is www.kdc-one.com. Our website and the information contained therein or connected thereto is not incorporated into this prospectus or the registration statement of which it forms a part.
Shareholders’ Agreement
In connection with this offering, we intend to enter into the Shareholders’ Agreement with certain of our shareholders, namely CC KDC Co-Invest LP (Cayman) (an affiliate of Cornell) (“CC KDC”), CDP Investissements Inc. (“CDP,” and together with CC KDC, the “Principal Shareholders”) and Upper Invest Ltd. (a Guernsey company) (“Upper Invest”). The Shareholders’ Agreement will require us to nominate a number of individuals designated by each of the Principal Shareholders, subject to such Principal Shareholders meeting certain shareholding thresholds. The Shareholders’ Agreement will also provide that, for so long as CC KDC is entitled to nominate a director, it will be entitled, but not obligated, subject to applicable securities laws, the rules of the NYSE and the BCBCA, to designate at least one director to each of the board committees other than the Audit Committee and for so long as CDP, together with its affiliates, continues to beneficially own at least 10% of our common shares, CDP will have the right to designate one individual as a non-voting observer to the board of directors. In addition, until the earlier of five years following the closing of this offering or CDP, together with its affiliates, ceasing to beneficially own at least 10% of our common shares, CDP will also have certain consultation rights with respect to any material change in the operations at the Québec-based facilities of the Company and its subsidiaries, and certain approval rights relating to the maintenance of the Company’s global headquarters in Québec. See “Risk Factors—Risks Related to Our Common Shares and this Offering—Certain of our major shareholders will continue to have significant influence over us after this offering and may have interests that are different from the interests of our other shareholders” and “Certain Relationships and Related Party Transactions—Shareholders’ Agreement.”
15
Table of Contents
Share information presented below reflects the Share Capital Amendments, including a 1-for-115 subdivision of our common shares, to occur after the effectiveness of the registration statement of which this prospectus forms a part and prior to the closing of this offering. See “Description of Share Capital.”
| Common shares offered by us |
57,142,857 common shares. |
| Option to purchase additional common shares from us |
8,571,428 common shares. |
| Common shares to be outstanding after this offering |
214,661,117 common shares (or 223,232,545 common shares if the underwriters exercise their option to purchase additional common shares from us in full). |
| Use of proceeds |
We estimate that our net proceeds from this offering will be approximately $758.0 million (or approximately $871.7 million if the underwriters exercise their option to purchase additional common shares from us in full), after deducting underwriting discounts and commissions but before deducting estimated offering expenses. |
| We intend to use the net proceeds that we receive from this offering (i) to pay offering expenses (a portion of which we have already prepaid), (ii) to repay all of our outstanding borrowings under the Revolving Facility and (iii) any remaining net proceeds to repay outstanding borrowings under the Euro Term Loan. To the extent we receive sufficient net proceeds to repay the Euro Term Loan in full, we intend to use any remaining net proceeds for general corporate purposes. |
| We estimate that the offering expenses (other than the underwriting discounts and commissions) will be approximately $13.0 million. See “Use of Proceeds.” |
| Dividend policy |
The declaration and payment by us of any future dividends to holders of our common shares will be at the sole discretion of our board of directors. |
| We do not anticipate paying any dividends in the foreseeable future. We currently intend to retain future earnings, if any, to finance operations and expand our business. See “Dividend Policy,” “Risk Factors” and “Description of Share Capital.” |
| Directed share program |
At our request, the underwriters have reserved up to 2,857,142 common shares, or 5% of the common shares to be offered by this prospectus, for sale at the initial public offering price through a directed share program for certain persons designated by the Company. Shares purchased through the directed share program will not be subject to a lock-up restriction, except in the case of shares purchased by any of our directors or officers and certain of our employees. The number of common shares available for sale to the |
16
Table of Contents
| general public will be reduced to the extent these individuals purchase such reserved shares. Any reserved shares that are not so purchased will be offered by the underwriters to the general public on the same basis as the other shares offered by this prospectus. See “Certain Relationships and Related Party Transactions,” “Shares Eligible for Future Sales” and “Underwriting (Conflicts of Interest)—Directed Share Program.” |
| Conflicts of interest |
An affiliate of UBS Securities LLC is the lender under the Euro Term Loan. Because we plan to use a portion of the proceeds to repay the Euro Term Loan, the affiliate of UBS Securities LLC will receive more than 5% of the proceeds from this offering, and, as a result, UBS Securities LLC is deemed to have a “conflict of interest” within the meaning of U.S. Financial Industry Regulatory Authority (“FINRA”) Rule 5121. Accordingly, this offering is being conducted in compliance with the applicable provisions of FINRA Rule 5121. FINRA Rule 5121 prohibits UBS Securities LLC from making sales to discretionary accounts without the prior written approval of the account holder and requires that a “qualified independent underwriter,” as defined in FINRA Rule 5121, participate in the preparation of the registration statement of which this prospectus forms a part, and exercise its usual standards of due diligence with respect thereto. Goldman Sachs & Co. LLC is acting as the “qualified independent underwriter” for this offering. See “Underwriting (Conflicts of Interest).” |
| NYSE and TSX Trading Symbol |
KDC. |
Unless we indicate otherwise throughout this prospectus, the information presented herein is based on 157,518,260 common shares outstanding as of September 14, 2021, after giving effect to the Share Capital Amendments and includes the common shares to be issued in this offering and excludes:
| • | 8,571,428 common shares issuable if the underwriters exercise their option to purchase additional common shares from us; |
| • | up to 21,466,112 common shares reserved for issuance under our Omnibus Plan, which will become effective immediately prior to or upon the consummation of this offering, including 1,836,446 common shares issuable thereunder in respect of the IPO equity awards assuming an initial public offering price of $14.00 per share (the midpoint of the estimated initial public offering price range set forth on the cover page of this prospectus) and a Black–Scholes factor of 0.4. See “Executive and Director Compensation—Description of Equity Incentive Plans—Omnibus Plan” for more information regarding our Omnibus Plan and “Executive and Director Compensation—Elements of Compensation—IPO Equity Awards” for more information regarding the IPO equity awards to be made to our named executive officers; |
| • | up to 14,120,735 common shares issuable upon the exercise of equity share option awards previously issued to certain employees and other persons, including our executive officers under our Stock Option Plan; and |
| • | up to 80,845 common shares issuable as deferred consideration in connection with the Paristy acquisition. |
Unless we indicate otherwise throughout this prospectus, all information in this prospectus reflects:
| • | an initial public offering price of $14.00 per share (the midpoint of the estimated initial public offering price range set forth on the cover page of this prospectus); |
| • | the completion of the Distribution Financing Transactions; and |
| • | the completion of the Share Capital Amendments. |
The share and per share information in the financial statements and the related notes thereto included elsewhere in this prospectus are presented on a historical basis and therefore do not reflect the Share Capital Amendments.
17
Table of Contents
SUMMARY CONSOLIDATED FINANCIAL AND OTHER DATA
The following tables present the summary historical and combined consolidated financial and other data for the Company.
The statements of operations data for the years ended April 30, 2021 and 2020 and for the periods from November 30, 2018 through April 30, 2019 and from May 1 through December 20, 2018, and balance sheet data as of April 30, 2021 and 2020 have been derived from the consolidated audited financial statements of the Company included elsewhere in this prospectus.
The Combined 2019 Financial Information has been derived from the unaudited combined year ended April 30, 2019 presented herein, which combines the Successor Period from November 30, 2018 through April 30, 2019 and the Predecessor Period from May 1, 2018 through December 20, 2018. See “Supplemental Financial Information.” These unaudited combined results of operations disclosures are not impacted by, nor adjusted for, the impact from the completion of this offering, the Share Capital Amendments, the issuance of common shares in this offering and the use of the proceeds from this offering as described in the section entitled “Use of Proceeds.”
The statements of operations data for the three months ended July 31, 2021 and 2020 and balance sheet data as of July 31, 2021 have been derived from the unaudited consolidated financial statements of the Company included elsewhere in this prospectus. The unaudited consolidated financial statements have been prepared on the same basis as our audited consolidated financial statements and reflect all adjustments of a normal recurring nature which, in the opinion of our management, are necessary for a fair statement of the results for the interim periods presented. The results for any interim period are not necessarily indicative of the results that may be expected for the full year. Our historical results are not necessarily indicative of the results expected for any future period.
The summary consolidated financial and other data presented below do not purport to be indicative of the results that can be expected for any future period and should be read together with “Financial Statement Presentation,” “Capitalization,” “Selected Consolidated Financial Data,” “Supplemental Financial Information,” “Management’s Discussion and Analysis of Financial Condition and Results of Operations” and our financial statements and related notes thereto included elsewhere in this prospectus.
| Successor Period | Predecessor Period |
|||||||||||||||||||||||||||||||||||
| Three Months Ended July 31, 2021 |
Three Months Ended July 31, 2020 |
Year Ended April 30, 2021 |
Year Ended April 30, 2020 |
November 30, 2018 through April 30, 2019 |
May 1, 2018 through December 20, 2018 |
Combined 2019 Financial Information(1) |
||||||||||||||||||||||||||||||
| (in millions, except shares and per share amounts) | ||||||||||||||||||||||||||||||||||||
| Statements of Operations Data |
||||||||||||||||||||||||||||||||||||
| Revenue |
$ | 603.4 | $ | 482.4 | $ | 2,143.8 | $ | 1,093.4 | $ | 369.8 | $ 632.8 | $ | 1,002.6 | |||||||||||||||||||||||
| Cost of revenue |
520.9 | 400.4 | 1,817.7 | 944.6 | 320.4 | 546.4 | 872.5 | |||||||||||||||||||||||||||||
|
|
|
|
|
|
|
|
|
|
|
|
|
|
|
|
|
|
|
|||||||||||||||||||
| Gross profit |
82.5 | 82.0 | 326.1 | 148.8 | 49.4 | 86.4 | 130.1 | |||||||||||||||||||||||||||||
| Operating expenses |
||||||||||||||||||||||||||||||||||||
| Selling, general and administrative expenses |
73.6 | 64.1 | 286.8 | 135.3 | 34.9 | 69.7 | 110.1 | |||||||||||||||||||||||||||||
| Acquisition-related costs and other expenses |
4.7 | 2.3 | 40.1 | 59.7 | 9.4 | 25.9 | 35.3 | |||||||||||||||||||||||||||||
| Impairment loss on goodwill and other intangibles |
— | — | 48.2 | — | — | — | — | |||||||||||||||||||||||||||||
|
|
|
|
|
|
|
|
|
|
|
|
|
|
|
|
|
|
|
|||||||||||||||||||
| Operating income (loss) |
4.2 | 15.6 | (49.0 | ) | (46.2 | ) | 5.1 | (9.2 | ) | (15.3 | ) | |||||||||||||||||||||||||
| Interest expense |
22.8 | 17.3 | 78.2 | 47.4 | 14.4 | 13.3 | 43.2 | |||||||||||||||||||||||||||||
| Other expense (income), net |
(3.1 | ) | 3.1 | 11.7 | 2.4 | 0.5 | 1.1 | 1.6 | ||||||||||||||||||||||||||||
|
|
|
|
|
|
|
|
|
|
|
|
|
|
|
|
|
|
|
|||||||||||||||||||
| Loss before income taxes |
(15.5 | ) | (4.8 | ) | (138.9 | ) | (96.0 | ) | (9.8 | ) | (23.6 | ) | (60.1 | ) | ||||||||||||||||||||||
| Income tax benefit |
(2.8 | ) | (4.2 | ) | (13.1 | ) | (14.1 | ) | (0.5 | ) | (0.9 | ) | (8.8 | ) | ||||||||||||||||||||||
|
|
|
|
|
|
|
|
|
|
|
|
|
|
|
|
|
|
|
|||||||||||||||||||
| Net loss |
$ | (12.7 | ) | $ | (0.6 | ) | $ | (125.8 | ) | $ | (81.9 | ) | $ | (9.3 | ) | $ | (22.7 | ) | $ | (51.3 | ) | |||||||||||||||
|
|
|
|
|
|
|
|
|
|
|
|
|
|
|
|
|
|
|
|||||||||||||||||||
18
Table of Contents
| Successor Period | Predecessor Period |
|||||||||||||||||||||||||||||||||||
| Three Months Ended July 31, 2021 |
Three Months Ended July 31, 2020 |
Year Ended April 30, 2021 |
Year Ended April 30, 2020 |
November 30, 2018 through April 30, 2019 |
May 1, 2018 through December 20, 2018 |
Combined 2019 Financial Information(1) |
||||||||||||||||||||||||||||||
| (in millions, except shares and per share amounts) | ||||||||||||||||||||||||||||||||||||
| Weighted-average shares outstanding—basic and diluted |
1,370,427 | 1,249,151 | 1,324,110 | 857,883 | 641,424 | 309,344,128 | ||||||||||||||||||||||||||||||
|
|
|
|
|
|
|
|
|
|
|
|
|
|
|
|
|
|
|
|||||||||||||||||||
| Net loss per share—basic and diluted |
$ | (9.27 | ) | $ | (0.48 | ) | $ | (95.01 | ) | $ | (95.47 | ) | $ | (14.50 | ) | $ | (0.07 | ) | ||||||||||||||||||
|
|
|
|
|
|
|
|
|
|
|
|
|
|
|
|
|
|
|
|||||||||||||||||||
| Unaudited Pro Forma Data(2) |
||||||||||||||||||||||||||||||||||||
| Pro forma weighted-average shares outstanding—basic and diluted |
1,867,321 | 1,821,004 | ||||||||||||||||||||||||||||||||||
|
|
|
|
|
|
|
|
|
|||||||||||||||||||||||||||||
| Pro forma net loss per share—basic and diluted |
$ | (3.80 | ) | $ | (86.33 | ) | ||||||||||||||||||||||||||||||
|
|
|
|
|
|
|
|
|
|||||||||||||||||||||||||||||
| (1) | See “Supplemental Financial Information” for an explanation as to how the Combined 2019 Financial Information is calculated. |
| (2) | Calculated without giving effect to the subdivision of common shares as part of the Share Capital Amendments. See Note 1, Description of Business and Basis of Presentation and Note 22, Net Loss per Share to our audited consolidated financial statements for the year ended April 30, 2021 and Note 1, Basis of Presentation and Summary of Significant Accounting Policies, and Note 17, Net Loss per Share to our unaudited consolidated financial statements for the three months ended July 31, 2021. |
| Successor Period | ||||||||||||
| As of July 31, 2021 |
As of April 30, 2021 |
As of April 30, 2020 |
||||||||||
| (in millions) | ||||||||||||
| Balance Sheet Data |
||||||||||||
| Total assets |
$ | 3,640.1 | $ | 3,574.1 | $ | 3,592.4 | ||||||
| Total liabilities |
$ | 2,713.1 | $ | 2,638.7 | $ | 2,372.7 | ||||||
| Total shareholders’ equity |
$ | 927.0 | $ | 935.4 | $ | 1,219.7 | ||||||
Other Financial Information
| Successor Period | Predecessor Period |
|||||||||||||||||||||||||||||||||||
| Three Months Ended July 31, 2021 |
Three Months Ended July 31, 2020 |
Year Ended April 30, 2021 |
Year Ended April 30, 2020 |
November 30, 2018 through April 30, 2019 |
May 1, 2018 through December 20, 2018 |
Combined 2019 Financial Information(1) |
Year ended April 30, 2016(2) |
|||||||||||||||||||||||||||||
| (in millions except percentages) | ||||||||||||||||||||||||||||||||||||
| Net income (loss) |
$ | (12.7 | ) | $ | (0.6 | ) | $ | (125.8 | ) | $ | (81.9 | ) | $ | (9.3 | ) | $ | (22.7 | ) | $ | (51.3 | ) | $7.5 | ||||||||||||||
| Adjusted EBITDA(3) |
$ | 54.7 | $ | 63.1 | $ | 238.5 | $ | 92.2 | $ | 39.1 | $ | 63.2 | $ | 102.3 | $ | 61.5 | ||||||||||||||||||||
| Adjusted EBITDA Margin(3) |
9.1 | % | 13.1 | % | 11.1 | % | 8.4 | % | 10.6 | % | 10.0 | % | 10.2 | % | ||||||||||||||||||||||
| VACM(4) |
18.3 | % | 25.4 | % | 22.0 | % | 17.6 | % | 24.0 | % | 22.7 | % | 23.2 | % | ||||||||||||||||||||||
| (1) | See “Supplemental Financial Information” for an explanation as to how the Combined 2019 Financial Information is calculated. |
| (2) | The financial information for the year ended April 30, 2016 has been derived from unaudited books and records of the Company, which are prepared on the same basis and using the same accounting principles as the audited consolidated financial statements of the Company included elsewhere in this prospectus. |
| (3) | Adjusted EBITDA and Adjusted EBITDA Margin are non-GAAP financial measures. See “Non-GAAP Financial Measures” for a definition of Adjusted EBITDA and Adjusted EBITDA Margin, a description of how management uses such measures to manage our business and material limitations on their usefulness. The table below shows a reconciliation of Adjusted EBITDA to net loss, the most directly comparable GAAP financial measure. The most directly comparable GAAP measure to Adjusted EBITDA Margin is net income |
19
Table of Contents
| margin. In this prospectus we have excluded a presentation of net income margin because we have experienced a net loss for all the relevant periods and therefore the net income margin would be less than zero and consequently we believe not helpful to investors. However, wherever we present Adjusted EBITDA Margin we present net loss. |
| (4) | VACM is a non-GAAP financial measure. See “Non-GAAP Financial Measures” for a definition of VACM and a description of how management uses such measures to manage our business and material limitations on its usefulness. The most directly comparable GAAP measure to VACM is net income margin. In this prospectus we have excluded a presentation of net income margin because we have experienced a net loss for all the relevant periods and therefore the net income margin would be less than zero and consequently we believe not helpful to investors. However, wherever we present VACM we present net loss. For a description of the revenue from value added contributions, see “Management’s Discussion and Analysis—Components of Revenue.” |
| Successor Period | Predecessor Period |
|||||||||||||||||||||||||||||||
| Three Months Ended July 31, 2021 |
Three Months Ended July 31, 2020 |
Year Ended April 30, 2021 |
Year Ended April 30, 2020 |
November 30, 2018 through April 30, 2019 |
May 1, 2018 through December 20, 2018 |
Combined 2019 Financial Information(a) |
Year Ended April 30, 2016(b) |
|||||||||||||||||||||||||
| (in millions except percentages) | ||||||||||||||||||||||||||||||||
| Net income (loss) |
$ | (12.7 | ) | $ | (0.6 | ) | $ | (125.8 | ) | $ | (81.9 | ) | $ | (9.3 | ) | $ | (22.7 | ) | $ | (51.3 | ) | $ | 7.5 | |||||||||
| Adjusted for the following: |
||||||||||||||||||||||||||||||||
| Interest expense and other expense (income), net |
19.7 | 20.4 | 89.9 | 49.8 | 14.9 | 14.4 | 44.8 | 11.9 | ||||||||||||||||||||||||
| Income tax expense (benefit) |
(2.8 | ) | (4.2 | ) | (13.1 | ) | (14.1 | ) | (0.5 | ) | (0.9 | ) | (8.8 | ) | 0.6 | |||||||||||||||||
| Depreciation and amortization |
37.4 | 36.9 | 151.3 | 70.2 | 20.5 | 26.2 | 57.9 | 26.4 | ||||||||||||||||||||||||
| Share-based compensation(c) |
1.1 | 0.5 | 8.5 | 1.7 | — | 16.5 | 16.5 | — | ||||||||||||||||||||||||
| Acquisition-related costs(d) |
0.3 | 0.4 | 8.1 | 56.9 | 9.3 | 25.3 | 34.6 | 3.1 | ||||||||||||||||||||||||
| Initial public offering preparation-related costs(e) |
3.3 | 1.3 | 10.8 | 0.1 | — | — | — | 0.9 | ||||||||||||||||||||||||
| COVID-19-related costs(f) |
1.7 | 4.1 | 28.6 | 1.5 | — | — | — | — | ||||||||||||||||||||||||
| Plant start-up costs(g) |
2.6 | — | 0.5 | — | — | — | — | — | ||||||||||||||||||||||||
| Sponsor fees(h) |
1.7 | 2.0 | 7.9 | 4.6 | 1.3 | 1.0 | 2.3 | 0.9 | ||||||||||||||||||||||||
| Impairment loss on assets(i) |
— | — | 54.3 | — | — | — | — | — | ||||||||||||||||||||||||
| Other adjustment items(j) |
2.4 | 2.3 | 17.5 | 3.4 | 2.9 | 3.4 | 6.3 | 10.2 | ||||||||||||||||||||||||
|
|
|
|
|
|
|
|
|
|
|
|
|
|
|
|
|
|||||||||||||||||
| Adjusted EBITDA |
$ | 54.7 | $ | 63.1 | $ | 238.5 | $ | 92.2 | $ | 39.1 | $ | 63.2 | $ | 102.3 | $ | 61.5 | ||||||||||||||||
| Adjusted EBITDA Margin |
9.1 | % | 13.1 | % | 11.1 | % | 8.4 | % | 10.6 | % | 10.0 | % | 10.2 | % | ||||||||||||||||||
|
|
|
|
|
|
|
|
|
|
|
|
|
|
|
|||||||||||||||||||
| Adjusted EBITDA by Segment: |
||||||||||||||||||||||||||||||||
| Beauty and Personal Care |
$ | 35.3 | $ | 33.3 | $ | 132.3 | $ | 76.4 | $ | 33.8 | $ | 46.2 | $ | 80.0 | ||||||||||||||||||
| Home Care |
$ | 26.0 | $ | 34.0 | $ | 124.6 | $ | 26.3 | $ | 9.3 | $ | 19.2 | $ | 28.5 | ||||||||||||||||||
| Corporate |
$ | (6.6 | ) | $ | (4.2 | ) | $ | (18.4 | ) | $ | (10.5 | ) | $ | (4.0 | ) | $ | (2.2 | ) | $ | (6.2 | ) | |||||||||||
| (a) | See “Supplemental Financial Information” for an explanation as to how the Combined 2019 Financial Information is calculated. |
| (b) | The financial information for the year ended April 30, 2016 has been derived from unaudited books and records of the Company, which are prepared on the same basis and using the same accounting principles as the audited consolidated financial statements of the Company included elsewhere in this prospectus. |
| (c) | Adjustments for share-based compensation represents the grant date fair value of share-based stock options granted to employees under the Stock Option Plan and the plan in place during the Predecessor Period and recognized as an expense in the consolidated statement of operations over the applicable vesting period of the awards. During the fourth quarter of fiscal year 2021, the adjustment for share-based compensation includes an expense of $5.5 million related to the adjustments made to the Stock Option |
20
Table of Contents
| Plan on February 7, 2021, in connection with the Distribution Financing Transactions. See Note 15, Employee Benefits, to our audited consolidated financial statements included elsewhere in this prospectus for further discussion of the adjustments made to the Stock Option Plan. |
| (d) | Adjustments for acquisition-related costs include professional, due diligence and advisory fees related to acquisitions, which include the Sponsor Acquisition Fees, which are terminating in connection with this offering. These costs also include the write-off of certain indemnification assets. |
| (e) | Adjustments for initial public offering preparation-related costs include incremental and non-recurring professional and advisory fees incurred in connection with this offering. |
| (f) | Adjustments for COVID-19-related costs primarily related to temporary enhanced compensation for factory-based employees (hazard pay), as well as incremental supplies and services to support social distancing and otherwise mitigate the spread of COVID-19; we do not expect to continue to incur such costs once COVID-19 has significantly subsided globally and operations return to pre-COVID-19 levels. During the fourth quarter of fiscal year 2021, the COVID-19-related costs include a $7.1 million charge primarily for inventory and receivables that were impaired as a result of goods that could not be imported into the United States from Mexico due to regulatory restrictions. |
| (g) | Adjustments for plant start-up costs include direct and incremental costs for our new facility in Columbus before significant operations begin, including payroll and rent. Operations began during the second quarter of fiscal year 2022 and will continue to ramp up throughout the course of fiscal year 2022. |
| (h) | Adjustments for sponsor fees include the Sponsor Management Fees, which are terminating in connection with this offering, as well as fees paid to a prior sponsor during the Predecessor Period. See “Certain Relationships and Party Transactions—Services Agreement.” |
| (i) | Adjustments includes a non-cash impairment charge of $48.2 million to reduce the carrying amount of goodwill and trade name intangible assets to fair value. The impairment recorded was driven in large part by the impacts of the COVID-19 pandemic on our color cosmetics business. The adjustments also include an impairment loss of $6.1 million on right-of-use assets representing the non-cash write-down for an office building lease that the Company no longer plans to use as it was initially intended. |
| (j) | Other adjustment items costs include incremental reorganization and restructuring costs, including severance related payments; litigation and related legal fees; start-up costs related to one laboratory from May 1, 2018 through December 20, 2018 and November 30, 2018 through April 30, 2019; and other incremental non-recurring expenses. |
21
Table of Contents
An investment in our common shares involves substantial risks and uncertainties that may adversely affect our business, financial condition and results of operations and cash flows. Some of the more significant challenges and risks relating to an investment in our common shares include those associated with the following:
| • | our business is highly competitive, and if we are unable to compete effectively our revenues and results of operations will suffer; |
| • | we may not successfully develop, innovate, introduce or acquire new technologies, products and solutions that meet our customers’ needs, which may cause us to fail to attract new customers or sell new products to existing customers, which may in turn adversely affect our results of operations; |
| • | rapid changes in market trends and consumer preferences could adversely affect our financial results; |
| • | we rely on our customers’ desire for outsourcing the ideation, formulation, design, packaging and manufacturing processes, and if our customers were to reduce their dependence on such outsourcing or if we are not able to otherwise successfully maintain our customer relationships, our revenues and results of operations would be adversely affected; |
| • | we may not be able to pursue our growth strategy through acquisitions, and the failure to successfully complete and integrate acquisitions could adversely affect our growth; |
| • | failure to realize anticipated synergies of recent and future acquisitions or restructurings may adversely affect our revenues and results of operations; |
| • | a significant portion of our revenue comes from a limited number of customers, the loss of which would have a material adverse effect on our business, financial condition and results of operations; |
| • | we have a history of net losses and there is no guarantee that we will achieve profitability in the short-term; |
| • | we are subject to risks related to our international operations; |
| • | as we expand our business in the Asia Pacific region, and in particular in China, the economic, political and social conditions, as well as changes in any government policies, laws and regulations, could adversely affect our business; |
| • | interruptions and delays in manufacturing operations, including volatility and increases in the price of raw materials and energy and transportation, could adversely affect our business, revenues and reputation; |
| • | our revenue and operating income fluctuate on a seasonal basis; |
| • | we rely on complex machinery for our operations, and production involves a significant degree of risk and uncertainty in terms of operational performance and costs; |
| • | product reliability, safety and effectiveness concerns can have significant negative impacts on sales and results of operations, lead to litigation and cause reputational damage; |
| • | we are subject to risks associated with leasing and occupying real property and the inability to extend, renew or continue to lease real property in key locations could harm our business, profitability and results of operations; |
| • | natural disasters, public health crises (such as the ongoing COVID-19 outbreak), international conflicts, terrorist acts, labor strikes, political crisis, accidents and other events could adversely affect our business and financial results by disrupting development, manufacturing or sale of our products; |
22
Table of Contents
| • | our success depends on attracting and retaining talented people; significant shortfalls in recruitment or retention could adversely affect our ability to compete and achieve our strategic goals; |
| • | we rely on third-party suppliers in procuring materials for our customers and otherwise conducting our business and operations, and their failure to perform to our standards or in a timely manner could adversely affect our reputation, business, and financial results; |
| • | if we are unable to comply with regulatory requirements and industry standards, including those regarding product safety, quality, efficacy and environmental impact, we could incur significant costs and suffer reputational harm which could adversely affect results of operations; |
| • | we incur substantial costs to comply with environmental protection and health and safety laws, and failure to comply with these laws may cause us to close, relocate or operate one or more of our plants at reduced production levels, and expose us to civil or criminal liability or other costs, which could adversely affect our operating results and future growth; changes to environmental laws could increase our costs of doing business; |
| • | our collection, use, storage, disclosure, transfer and other processing of personal information could give rise to significant costs and liabilities, including as a result of governmental regulation, conflicting legal requirements or differing views of personal privacy rights; |
| • | breaches or failures of our information technology systems or website security, the theft, unauthorized access, acquisition, use, disclosure, modification or misappropriation of personal information, the occurrence of fraudulent activity, or other cybersecurity or data security-related incidents may have an adverse impact on our business, financial condition, results of operations and prospects; |
| • | we do not own the intellectual property of all of the formulas or technical specifications of products that we manufacture, and if we are unable to protect the confidentiality of customer trade secrets, know-how and other proprietary and internally developed information, we may not be able to maintain customer relationships and our business may be adversely affected; |
| • | third parties may initiate legal proceedings alleging that we are infringing, misappropriating or otherwise violating their intellectual property rights, the outcome of which would be uncertain and could have a material adverse effect on our business, financial condition and results of operations; |
| • | insiders will continue to have substantial control over us after this offering and could limit your ability to influence the outcome of key transactions, including a change of control; and |
| • | we are governed by the corporate laws of British Columbia, Canada, which in some cases have a different effect on the rights of shareholders than the corporate laws of the United States. |
Before you invest in our common shares, you should carefully consider all the information in this prospectus, including matters set forth under the heading “Risk Factors.”
23
Table of Contents
An investment in our common shares involves a high degree of risk. You should carefully consider the risks and uncertainties described below as well as the other information included in this prospectus, including the section titled “Management’s Discussion and Analysis of Financial Condition and Results of Operations” and the consolidated financial statements and the related notes thereto included elsewhere in this prospectus, before making an investment decision. Our business, prospects, financial condition, or operating results could be harmed by any of these risks, as well as other risks not currently known to us or that we currently consider immaterial. The trading price of our common shares could decline due to any of these risks, and, as a result, you may lose all or part of your investment. See also “Cautionary Note Regarding Forward-Looking Statements.”
Risks Related to Our Business and Industry
Our business is highly competitive, and if we are unable to compete effectively our revenues and results of operations may suffer.
We operate in a fragmented industry. We face vigorous competition from companies throughout the world, including multi-national and specialized global beauty, personal care and home care manufacturers, independent and emerging beauty and personal care brands, packaging companies, as well as consumer product companies that develop their own global beauty, personal care and home care products. In many of our product lines, we may face competition from some of our customers who have retained development and manufacturing capabilities, which could be used to compete with our own capabilities and solutions. Some of our competitors specialize in one or more of our product sub-segments, while others participate in many of our product sub-segments. Certain of our competitors compete regionally, such as in the Asian or European markets. Such segment and regional specialization may allow such competitors to develop competitive advantages over us in those segments or regions. In addition, some of our global competitors or customers may have more resources than we do or may have proprietary products that could permit them to respond to changing business and economic conditions or market and customer demands more effectively than we can. Consolidation of our competitors may exacerbate these risks.
Competition in our business is based, among other things, on innovation, value-added capabilities, speed to market, integration of solutions to provide turn-key or “one-stop” solutions, product quality, regulatory compliance, pricing, quality of customer service and understanding of end-market dynamics and trends. It is difficult for us to predict the timing, scale and success of our competitors’ actions in these areas. Some of our proprietary manufacturing processes, know-how and design and development expertise could be replicated by competitors or be replaced with competitor solutions. In particular, the discovery and development of new global beauty, personal care and home care formulations and product design, the protection of our trade secrets and intellectual property and the development and retention of key employees are critical to our ability to effectively compete in our business. Significant investment in R&D by competitors or advancements or sudden breakthroughs in technologies could enhance the ability of our competitors to develop substitutable alternatives to our manufacturing processes and expertise. Additionally, as we seek to expand globally, we may face regional price sensitivities or contractual standards that will impact our success in those regions. Further, various customers manage their supply chains by limiting the number of their suppliers through the establishment of preferred or select supplier lists, giving such suppliers the first opportunity or priority for development and production of their new or modified products. Accordingly, we must ensure we provide effective service and meet other requirements and expectations from our customers to maintain inclusion on such preferred or select supplier lists. Increased competition by existing or future competitors, including aggressive price competition, or loss of preferred or select supplier status could result in the loss of sales, reduced pricing and margin pressure and could have a material adverse effect on our business and results of operations.
Additionally, our customers are likewise in competitive industries and face many similar competition risks. If our customers are adversely affected by any of these risks, that in turn could have a material adverse effect on our business and results of operations.
24
Table of Contents
We may not successfully develop, innovate, introduce or acquire new technologies, products and solutions that meet our customers’ needs, which may cause us to fail to attract new customers or sell new products to existing customers, which may in turn adversely affect our results of operations.
Our ability to differentiate ourselves and deliver growth in line with our strategy largely depends on our ability to successfully develop and introduce new products and manufacturing, design and packaging solutions that meet our customers’ needs and, ultimately, appeal to consumers, allowing us to deepen our relationship with our existing customers and strengthen customer loyalty, attract new customers and sell new products to existing customers. Innovation is an important element of our ability to develop and introduce new products and manufacturing, design and packaging solutions, and our turn-key or “one-stop” solutions approach to meeting our customers’ goals requires that we deliver integrated global end-to-end solutions from ideation through manufacturing and packaging. We cannot be certain that we will be successful in achieving our innovation goals, such as the development of new product ideas, formulas, designs or efficient and attractive packaging. In addition, we have in the past and may in the future make substantial investments to acquire new technologies and capabilities, such as our acquisitions of HCT and Zobele during the fiscal year ended April 30, 2020. Our investments may only generate future revenues to the extent that we are able to integrate, develop or acquire solutions that meet our customers’ requirements and specifications, are at an acceptable cost and achieve acceptance by the consumer markets targeted by our customers. There can be no assurance that our investments will result in additional or continued business from existing customers, new customers or increased revenue. Furthermore, there may be significant lag times from the time we invest in new technologies to the time these investments result in increased revenue. Consequently, our ability to generate revenues as a result of these investments is subject to numerous customer, economic, operational and other risks that are outside of our control, including delays by our customers in the launch of new products, the level of promotional support from our customers, anticipated sales by our customers not being realized or changes in market preferences or demands, or disruptive innovations by competitors or innovation being limited by existing third-party intellectual property rights.
To attract new customers and to retain and expand existing customer relationships, we must continually anticipate and react, in a timely and cost-effective manner, to changes in consumer preferences and demands, including, for example, increased focus on health, wellness and sustainability and calls for transparency with respect to product ingredients by consumers and regulators. Consumers of certain of our products, especially in developed economies such as the United States, Canada and Western Europe, are shifting away from products containing artificial ingredients to all-natural, cleaner alternatives, with a demand for sustainable product packaging. In addition, there has been a growing demand by consumers, non-governmental organizations and governmental agencies to provide more transparency in product labeling and our customers have been taking steps to address this demand, including by voluntarily providing product-specific ingredients disclosure. These two trends could affect the types and volumes of our ingredients and compounds that our customers include in their consumer product offerings and, therefore, affect the demand for our solutions. If we are unable to react to or anticipate these trends in a timely and cost-effective manner, it could have a material adverse effect on our business and future growth.
Rapid changes in market trends and consumer preferences could adversely affect our financial results.
Our continued success depends on our ability to anticipate, gauge and react in a timely and cost-effective manner, to industry trends and changes in consumer preferences for global beauty, personal care and home care products, consumer attitudes towards our industries and where and how consumers shop for those products. For example, as a result of the COVID-19 pandemic, demand for color cosmetics has decreased, while demand for personal care and home care products has increased. If we fail to meet such increased demand, our competitors are more successful at scaling production for such increased demand or if we fail to innovate quickly or develop new products to meet such increased demand, our business and financial condition could be adversely affected. Likewise, if there is a decrease in consumer demand for our personal care and home care products and consumer demand in the color cosmetics market does not increase to the extent necessary to compensate for such decrease,
25
Table of Contents
our financial results could be adversely affected. In addition, net revenues and margins could suffer if we do not successfully and continuously develop relationships with customers for new products in the beauty, personal care and home care industries. Many beauty and personal care products have short life cycles, and our failure to rapidly improve existing products or develop new products may negatively affect our operations. Consumer tastes cannot be predicted with certainty and can change rapidly. Additionally, due to the increasing use of social and digital media by consumers and the speed with which information (and, in some cases, misinformation) and opinions are shared, trends and tastes may continue to change even more quickly, particularly in beauty and personal care as product influencers drive a rapid cycle of certain fashion trends. If we are unable to anticipate and respond to trends in the market for global beauty, personal care and home care products and changing consumer demands, it could have an adverse material effect on our business and results of operations.
We rely on our customers’ desire for outsourcing the ideation, formulation, design, packaging and manufacturing processes, and if our customers were to reduce their dependence on such outsourcing or if we are not able to otherwise successfully maintain our customer relationships, our revenues and results of operations would be adversely affected.
Our primary service offering is formulating, designing, packaging and manufacturing products for our customers, utilizing proprietary formulas and ingredients from customers, or proprietary formulas that we develop and sometimes sell in return for manufacturing exclusivities. Our customers outsource various aspects of the product development and manufacturing process to us to leverage our know-how and expertise, as well as benefit from the cost efficiency of our operations. However, if our customers were to reverse this trend and choose to in-source certain activities and processes currently outsourced to us, either as a result of developing their own internal know-how or a change in their view of the cost efficiency of outsourcing or otherwise determine not to continue their relationship with us, it could have a material adverse effect on our business and results of operations.
We may not be able to pursue our growth strategy through acquisitions, and the failure to successfully complete and integrate acquisitions could adversely affect our growth.
Historically, we have grown significantly through acquisitions. Notable acquisitions include Chemaid during the fiscal year ended April 30, 2015, followed by Kolmar and Acupac during the fiscal year ended April 30, 2016, Thibiant during the fiscal year ended April 30, 2017 and Aromair and Northern Labs during the fiscal year ended April 30, 2018. During the fiscal year ended April 30, 2020, we completed seven acquisitions comprised of Alkos, Swallowfield, Benchmark, HCT, CLA, Paristy and Zobele. Our future growth may depend on additional acquisitions of global beauty, personal care and home care products businesses and other strategic businesses or assets meeting our acquisition criteria. We may not be able to locate or acquire other suitable acquisition candidates consistent with our strategy, and we may not be able to fund future acquisitions because of limitations under our indebtedness or otherwise, including due to the limited availability of funds.
If we are unable to successfully integrate and develop acquired businesses and operations, we could fail to achieve anticipated synergies and cost savings, including any expected increase in revenues and operating results, which could have a material adverse effect on our financial results. We may also incur asset impairment charges related to acquisitions that reduce our earnings. See “—Failure to realize anticipated synergies of recent and future acquisitions or restructurings may adversely affect our revenues and results of operations.”
In addition, from time to time, we may provide earnouts for the former owners. We may also acquire only a majority interest in companies and provide the ability, at our option, or obligation, at the former owners’ option, to purchase the minority interests at a future date at an established price. These investments may have additional risks and may not be as efficient as other operations as we may have fiduciary or contractual obligations to the minority investors and may rely on former owners for the continuing operation of the acquired business. If we are unable to successfully establish and manage these collaborative relationships and majority investments, it could adversely affect our future growth.
26
Table of Contents
Failure to realize anticipated synergies of recent and future acquisitions or restructurings may adversely affect our revenues and results of operations.
The combination of independent businesses is complex, costly and time-consuming, and combining practices and operations may divert significant management attention and resources and disrupt our business. The failure to meet the challenges involved in integrating acquired businesses and to realize the anticipated benefits of the transactions could cause an interruption of, or a loss of momentum in, our business activities and could adversely affect our results of operations. The process of combining businesses may also result in material unanticipated problems, expenses, liabilities, disputes, competitive responses, and loss of customer and other business relationships. The difficulties of integration include, among others:
| • | the diversion of management and key personnel attention to integration matters; |
| • | integrating operations and systems, including communications systems, administrative and information technology infrastructure, sales efforts, financial reporting and internal control systems, and intellectual property related to any of the foregoing, some of which may prove to be incompatible, resulting in less effective decision-making based on the information provided by these systems; |
| • | conforming standards, controls, procedures and accounting and other policies, business cultures and compensation structures between the businesses; |
| • | integrating employees and attracting and retaining key personnel; |
| • | retaining existing and obtaining new customers and suppliers; |
| • | managing the expanded operations of a significantly larger and more complex company with broader geographic scope and exposure to different business risks; |
| • | failure to manage internal communications within the organization; |
| • | contingent liabilities that are larger than expected; and |
| • | potential unknown liabilities, adverse consequences and unforeseen increased expenses associated with transactions. |
Many of these factors are outside of our control and/or will be outside the control of the acquired businesses, and any one of them could result in lower revenues, higher costs and diversion of management and key personnel time and energy, which could have a material adverse effect on our business, financial condition and results of operations.
In addition, even if the operations of our business and the acquired businesses are integrated successfully, the full benefits of the transaction may not be realized, including, among others, the synergies, cost savings or sales or growth opportunities that are expected. These benefits may not be achieved within the anticipated time frame or at all. Further, additional unanticipated costs may be incurred in the integration of our business and the acquired businesses. All of these factors could cause dilution to our earnings per common share, decrease or delay the projected accretive effect of the acquisitions in question, and negatively impact the price of our common shares following the transactions.
From time to time, we may restructure operations within the Company to achieve efficiencies. For example, we are currently restructuring our European and West Coast operations. In Europe, we expect that our recent acquisitions in France, the United Kingdom and the Czech Republic will allow us to transfer manufacturing of certain products, including pencils, soap and deodorant sticks, to other sites within our global footprint, and may involve investing in production lines. The acquisitions of Benchmark and CLA and the merger with HCT allow for the Company to maintain a regional hub, through our various California facilities, for West Coast customers in the United States, providing opportunities for collaboration, future investment and increased scale for growth. As with the integration of newly acquired businesses, restructuring of existing operations may reduce our available talent, assets and other resources, slow improvements in our products and services, adversely affect our
27
Table of Contents
ability to respond to customers, limit our ability to increase production quickly if demand for our products increases and draw adverse public attention. Realizing the anticipated benefits from planned restructuring initiatives, if any benefits are achieved at all, may take several years, and we may be unable to achieve our targeted cost efficiencies and gross margin improvements. Any of the circumstances described above could adversely impact our business and financial statements.
We do not typically have long-term contracts with our customers.
We do not typically have long-term contracts with our customers. The majority of our contracts are relatively short term and vary from three- to five-year terms. As a result, our relationships with our customers may change on short notice. Future agreements with respect to volume, pricing or new products and services, among other things, are subject to periodic negotiation with each customer. No assurance can be given that our customers will continue to do business with us, and the loss of product lines from any of our significant customers could have a material adverse effect on our business, results of operations, financial condition and liquidity. See “—Economic uncertainty may adversely affect consumer demand and customer needs, which may have a negative impact on our operating results and future growth” and “—We rely on our customers’ desire for outsourcing the ideation, formulation, design, packaging and manufacturing processes, and if our customers were to reduce their dependence on such outsourcing or if we are not able to otherwise successfully maintain our customer relationships, our revenues and results of operations would be adversely affected.”
Customers may cancel, reduce or delay their orders for various reasons, including changes in their inventory levels, storage capacity and changes in market trends and consumer preferences. Order cancellations, reductions or delays, or attempts to modify the terms of an order or delay delivery, by a significant customer or by a group of customers could harm our operating results and cash flows. In addition, we make significant decisions, including determinations regarding the level of business we will seek and accept, production schedules, component procurement commitments, personnel needs and other resource requirements, based on our estimates of customer requirements. The short-term nature of certain of our customers’ commitments, the absence of contractual volume commitments and the likelihood of rapid changes in demand for their products impair our ability to estimate our future customer requirements and allocate our resources accurately. As a consequence of the above factors, many of which are beyond our control and difficult to predict, our ability to plan is limited and our operating results and cash flows may vary significantly from our expectations.
In addition, as a part of our growth strategy, we regularly make capital investments in equipment necessary to meet our customers’ needs. In particular, we have one long-term contract with a key customer that could require capital expenditures to meet their growth requirements. To create product lines our work extends from formulation of products or invention of concept for devices through manufacturing and packaging, requiring meaningful investment of capital on a cyclical basis. These expenditures have, and will continue to, put pressure on our managerial, technical, financial, operational and other resources. Due to the short-term nature of the contracts with most of our customers and the likelihood of rapid changes in demand for their products, we may be unable to recoup our capital expenditures over the course of a customer’s contract. Our financial results and liquidity could be negatively impacted if we do not experience payback periods and returns on investment consistent with historical benchmarks.
A significant portion of our revenue comes from a limited number of customers, the loss of which would have a material adverse effect on our business, financial condition and results of operations.
Historically, we have relied on a limited number of customers for a substantial portion of our total revenue. For the fiscal years ended April 30, 2021 and 2020 and Combined 2019 Financial Information for the year ended April 30, 2019, our two largest customers represented 20.3% and 14.4%, 23.0% and 13.3%, and 20.8% and 15.0%, respectively, of our total revenue. For the three months ended July 31, 2021 and 2020, our two largest customers represented 20.6% and 12.5%, and 18.7% and 12.8%, respectively, of our total revenue.
28
Table of Contents
We may not be successful in continuing to reduce customer concentration due to a number of factors, including lower revenue growth, loss of a key customer or product line and relative growth of one customer’s business with us relative to the rest of our business. In particular, we may not succeed in attracting new smaller, fast-growing independent brand owners, which may adversely affect our revenues and results of operations. Additionally, a concentration among a limited number of our customers, and in particular our customers that are large corporations, could increase the negotiating power of these customers, leading to pricing pressure, which may have an adverse effect on our profitability.
Many of our customers are large and operate across several industries for which we ideate, formulate, develop, manufacture and package their products. Certain of our customers may only utilize us for a subset of their end-markets or in a single geography or may utilize only certain of our services. We rely on the strength of our relationships with these customers to expand our relationship with those customers into other industries, applications and regions. Because many of our customers operate in the global market and in several industries, a negative outcome in one sector or region could impact a global relationship.
We also rely on our reputation in order to promote our ideation, formulation, design, packaging and manufacturing solutions to potential new customers. The loss of any of our key customers, or a failure of some of them to renew or expand their relationships with us, could have a significant impact on our revenue, our reputation and our ability to obtain new business from existing customers or attract new customers.
We have a history of net losses and there is no guarantee that we will achieve profitability in the short-term.
We incurred net losses of $12.7 million for the three months ended July 31, 2021, $0.6 million for the three months ended July 31, 2020, $125.8 million for the fiscal year ended April 30, 2021, $81.9 million for the fiscal year ended April 30, 2020, $9.3 million for the period from November 30, 2018 through April 30, 2019, and $22.7 million for the period from May 1, 2018 through December 20, 2018. As of July 31, 2021, we had an accumulated deficit of $229.7 million. These losses and accumulated deficit are a result of the substantial investments we made to grow our business and we expect to make significant investments to expand our business in the future. For example, in order to support the continued growth of our business and to comply with continuously changing operational requirements, we plan to continue investing in both existing and new facilities and to continue to selectively pursue acquisition opportunities, which require that we incur various expenses, as well as the recognition of incremental depreciation and amortization. These expenditures may make it harder for us to achieve profitability in the short-term.
We may make decisions that would reduce our short-term operating results if we believe those decisions will improve our business prospects and financial performance over the long-term. These decisions may not be consistent with the expectations of investors and may not produce the long-term benefits that we expect, in which case our business, results of operations or financial condition may be materially and adversely affected.
We are subject to risks related to our international operations.
We maintain sites in 14 countries and have key R&D, design and creative facilities and innovation hubs located outside the United States and Canada that ideate, formulate, develop, manufacture and package goods. As of April 30, 2021, approximately 28% of our revenues and approximately 36% of our long-lived assets were attributable to our operations outside the United States and Canada. As of July 31, 2021, approximately 25% of our revenues and approximately 34% of our long-lived assets were attributable to our operations outside the United States and Canada. Our operations outside the United States and Canada are subject to many risks and uncertainties, including:
| • | fluctuations in foreign currency exchange rates, which have affected and may in the future affect our results of operations, reported earnings, the value of our foreign assets, the relative prices at which we and foreign competitors offer solutions in the same markets and the cost of certain inventory and non-inventory items required by our operations; |
29
Table of Contents
| • | changes in foreign laws, regulations and policies, including restrictions on foreign investment, trade, import and export license requirements, quotas, trade barriers and other protection measures imposed by foreign countries, as well as changes in U.S. and Canadian laws and regulations relating to tariffs and taxes, foreign trade and investment; |
| • | difficulties and costs associated with complying with, and enforcing remedies under, a wide variety of complex, and potentially conflicting, domestic and international laws, treaties and regulations, including the European Union’s General Data Protection Regulation (“GDPR”), the U.S. Foreign Corrupt Practices Act (“FCPA”), Canada’s Corruption of Foreign Public Officials Act and different regulatory structures and changes in regulatory environments; |
| • | potentially reduced protection for, and difficulty enforcing, intellectual property rights, especially in jurisdictions that do not respect and protect intellectual property rights to the same extent as the United States or Canada; |
| • | failure to effectively and immediately implement processes and policies across our diverse operations and employee base; |
| • | adverse weather conditions, social, economic and geopolitical conditions, such as political instability, environmental hazards, natural disasters, terrorist attacks, war or other military action or violent revolution; |
| • | significant health hazards or pandemics, which could result in closed factories, reduced workforces, scarcity of raw materials, and scrutiny or embargoing of goods produced in infected areas; |
| • | industry and contractual standards that are specific by region and which may generate different or additional business risk to operate; |
| • | disruption due to labor disputes; and |
| • | impact of the global pandemic caused by COVID-19 or new variants and mutations thereof. |
For example, the ongoing outbreak of COVID-19 has led to global work and travel restrictions or limitations. These restrictions and limitations have made and may continue to make it difficult for our suppliers and our customers to source raw materials and for us to manufacture finished goods and create limitations on or difficulties related to the export of our products internationally and in the United States and Canada. There have been significant and material disruptions to our global supply chain and operations, and delays in the manufacture of products, which may have a material adverse effect on our results of operations. Our future performance will depend upon these and the other factors listed above, which are beyond our control, and the occurrence or deepening impact of one or more of these events could have a material adverse effect on our results of operations, financial condition and cash flows.
We are also subject to the interpretation and enforcement by governmental agencies of foreign laws, rules, regulations or policies, including any changes thereto, such as restrictions on trade, import and export license requirements, privacy and data protection laws, and tariffs and taxes, which may require us to adjust our operations in certain markets where we do business. We face legal and regulatory risks in all jurisdictions in which we operate, in particular, cannot predict with certainty the outcome of various contingencies or the impact that pending or future legislative and regulatory changes may have on our business. In connection with our international expansion, an increasing portion of our activities may be located in emerging markets, such as China, India and Brazil, and we may face additional legal and regulatory risks in new target markets, including markets with political and economic structures which may lack the political and economic stability characteristic of jurisdictions such as the United States, Canada and Western European countries. As a result, we may be vulnerable to the geopolitical and legal and regulatory conditions affecting those markets, which may create more onerous or potentially conflicting compliance requirements. These risks could have a material adverse effect on our business, prospects, financial condition and results of operations.
30
Table of Contents
As we expand our business in the Asia Pacific region, and in particular in China, the economic, political and social conditions, as well as changes in any government policies, laws and regulations, could adversely affect our business.
We have made and plan to continue to make significant investments in expanding our presence in the Asian market, including through our recent acquisitions of Paristy, HCT and Zobele, to (i) drive customer and consumer awareness of the products we ideate, formulate, manufacture and package with existing customers in the Asian market and (ii) persuade potential Asian domestic customers to contract with us to ideate, formulate, manufacture and package their products. Our ability to penetrate and succeed in the Asian market will depend on, among other things, market acceptance of the products we ideate, formulate, manufacture and package with existing customers as well as potential Asian domestic customers, our ability to adapt to the requirements and barriers to entry specific to this market, and our ability to generate revenues and compete effectively with other formulating and manufacturing businesses operating in Asia, in particular in China and areas in Southeast Asia. We cannot assure you that a new market for the products we ideate, formulate, manufacture and package will become viable in the Asia Pacific region, and our investments may not be successful.
As we expand our operations in the Asia Pacific region, and in particular in China, our business in the region may be subject to economic, political and legal developments in China. China’s economy differs from the economies of most developed countries in many respects, including the amount of government involvement in directing business activity, level of development, growth rate, control of foreign exchange and allocation of resources, and the use or control of business activity in pursuit of foreign-policy objectives. While the Chinese economy has experienced significant growth in the past three decades, growth has been uneven, both geographically and among various sectors of the economy, and concerns exist as to whether expansion will continue and whether contraction could occur. Demand in China for Western services and products depends, in large part, on economic conditions in China, as well as on creation of and demand for similar Chinese domestic products. This demand may also be impacted by political considerations or events, including regarding the existing social policy of Hong Kong and its relationship with mainland China. Any slowdown in China’s economic growth or its desire or government directives to purchase Chinese domestic products rather than Western products may cause our potential Asian domestic customers to delay or cancel their plans to purchase our services and products, which in turn could reduce our revenues. We also may face competition from existing manufacturers in the Asia Pacific region. These competitors may serve established customers and have other regional and cost-saving advantages with which we may struggle to compete.
Although China’s economy has transitioned from a planned economy to a more market oriented economy since the late 1970s, the Chinese government continues to play a significant role in regulating industry development by imposing industrial policies, in some cases in pursuit of foreign policy objectives. The Chinese government also exercises significant control over China’s economic growth through allocating resources, controlling the incurrence and payment of foreign currency-denominated obligations, setting monetary policy, directing the lending activity of banks and providing preferential treatment to particular industries or companies. Changes in any of these policies, laws and regulations could impact our business or adversely affect the economy in China and thus have a material adverse effect on our business.
The Chinese government has implemented various measures to encourage foreign investment and sustainable economic growth and to guide the allocation of financial and other resources. However, we cannot assure you that the Chinese government will not repeal or alter these measures or introduce new measures that will have a negative effect on us. China’s social and political conditions may change and become unstable. Any sudden changes to China’s political system or the occurrence of widespread social unrest, including within Hong Kong, or the implementation of additional national-security measures by China could have a material adverse effect on our business and results of operations. Additionally, international trade policies with China remain in flux, and changes to such policies may impact our strategy of expanding in China.
31
Table of Contents
The U.S. government could expand, and the Canadian or other governments could expand or impose, economic sanctions on China for various reasons. Any such actions, or countermeasures taken by China, could materially impact our business.
Interruptions and delays in manufacturing operations, including volatility and increases in the price of raw materials and energy and transportation, could adversely affect our business, revenues and reputation.
Our manufacturing solutions require the timely delivery of sufficient amounts of complex, high-quality components and materials. As of July 31, 2021, we operate 25 manufacturing facilities, which are supported by a complex supply-chain operation sourcing from hundreds of suppliers locally and around the world. We have in the past faced, and may in the future face, unanticipated interruptions and delays in manufacturing through our internal or external supply chain, including transportation of materials. We are subject to risks related to manufacturing on a global scale, including industrial accidents, environmental events, strikes and other labor disputes (including ongoing discussions of unionization), disruptions in supply chain or information systems, disruption or loss of key research or manufacturing sites, political instability, rapid changes in trade regulations or enforcement, product quality control, safety and environmental compliance issues, licensing requirements and other regulatory issues, as well as natural disasters, global or local health crisis (including COVID-19, as discussed below), international conflicts, terrorist acts and other external factors over which we have no control. Such delays and difficulties in manufacturing can result in manufacturing shortages, declines in sales and reputational impact as well as significant remediation and related costs associated with addressing the shortages. In particular, if we are not able to provide the manufacturing capacity needed to meet our customers’ demands, we may see a negative effect on our business, revenues and reputation.
In addition, we and our customers use many different raw materials for our businesses, which has exposed, and may in the future expose, our customers, and in certain circumstances us, to price volatility with respect to raw materials.
Because we and our customers often rely on a limited number of suppliers for certain products’ components, the risk of price volatility for raw materials may be exacerbated. If our customers are impacted by raw material and other input cost increases and are unable to pass these to consumers through price increases, they may attempt to negotiate lower prices or otherwise transfer the risk to us as a means of preserving their margins and results of operations. In that case, we could fail to meet our revenue expectations, which could have a material adverse effect on our profitability and results of operations. Increases in prices of our solutions to customers or failure to decrease prices as customers may request may lead to declines in sales volumes, and we may not be able to accurately predict the volume impact of price increases, which could have a material adverse effect on our financial condition and results of operations. Further, the limited number of suppliers for certain products’ components exposes us to additional risks in the event of unavailability or delivery delays of those components, which would adversely affect our ability to manufacture the related products in a timely manner. While we seek to mitigate the risk of any potential supply interruptions, including by identifying alternative suppliers, sourcing components from different supplier locations and taking other actions to ensure our supply, such mitigation measures have limitations and may not be effective in all instances.
Similarly, commodities and energy prices are subject to significant volatility. If the cost of certain commodities or energy, shipping or transportation increases and we are unable to pass along these costs to our customers, our profit margins would be adversely affected. Furthermore, increasing our prices to our customers could result in long-term sales declines or loss of market share if our customers find alternative suppliers or choose to reformulate their consumer products to use fewer ingredients, which could have a material adverse effect on our results of operations.
Our revenue and operating income fluctuate on a seasonal basis.
Our revenue and operating income experience moderate fluctuations in connection with the corresponding seasonality of our customers’ respective businesses. Fluctuations may occur in connection with the year-end of our major customers when customary inventory assessments may occur, which may in turn affect future orders to
32
Table of Contents
us from such customers. We generally record our strongest results in our second fiscal quarter. Any decrease in revenue or margins during this period could have a material adverse effect on our results of operations, financial condition and cash flows. Seasonal fluctuations also affect our cash and inventory levels, since we usually manufacture and produce products for our customers in advance of their peak selling periods. We must manufacture a significant amount of inventory, especially before the holiday season selling period. If our customers are not successful in selling inventory, they may have to sell the inventory at significantly reduced prices or may not be able to sell the inventory at all, which could negatively impact the operations of our customers and which in turn could reduce future orders or the Company may incur excess storage costs, either of which could have a material adverse effect on our results of operations, financial condition and cash flows.
We rely on complex machinery for our operations, and production involves a significant degree of risk and uncertainty in terms of operational performance and costs.
We rely on complex machinery for our operations, and our production involves a significant degree of uncertainty and risk in terms of operational performance and costs. Our manufacturing facilities contain large-scale machinery combining many components. These components may suffer unexpected malfunctions from time to time and may require repairs and spare parts to resume operations, which may not be available when needed. Major rebuilds, annual maintenance, refurbishments and upgrades of our machinery are performed by third-party service suppliers from time to time. Although we also rely on internal capabilities, operational efficiency may be affected if we are not able to outsource such maintenance operations in a timely manner or in case of disruptions affecting our service suppliers. Unexpected malfunctions of the manufacturing plant components may significantly affect the intended operational efficiency. Operational performance and costs can be difficult to predict and are often influenced by factors outside of our control, such as, but not limited to, scarcity of natural resources, environmental hazards and remediation, costs associated with decommissioning of machines, labor disputes and strikes, difficulty or delays in obtaining governmental permits, damages or defects in electronic systems, industrial accidents, pandemics, fire and seismic activity and natural disasters. Additionally, due to the complex nature of our machinery, there may be limited flexibility to enable plants built for certain high-speed, high-volume and specific products to adjust for new products, which could impact our ability to quickly respond to shifts in customer demand. If any of our manufacturing facilities experienced unexpected downtime due to these risks or otherwise, there could be a material adverse effect on our business, results of operation, cash flows, financial condition, reputation or prospectus.
Should operational risks materialize, they may result in serious personal injury to or death of workers, the loss of production equipment, damage to manufacturing facilities, monetary losses, delays and unanticipated fluctuations in production, environmental damage, administrative fines, increased insurance costs and potential legal liabilities, all of which could have a material adverse effect on our business, results of operations, cash flows, financial condition, reputation or prospects.
Product reliability, safety and effectiveness concerns can have significant negative impacts on sales and results of operations, lead to litigation and cause reputational damage.
Concerns about product safety, whether raised internally or by litigants, regulators or consumer advocates, and whether or not based on scientific evidence, can result in safety alerts, product recalls, governmental investigations, regulatory action on the part of the U.S. Food and Drug Administration (“FDA”), Health Canada or other regulatory agencies (or their respective counterparts in other countries), private claims and lawsuits, payment of fines and settlements, declining sales and reputational damage.
Product safety or quality failures, actual or perceived, or allegations of product contamination, even when false or unfounded, could tarnish the image of our solutions, harm our relationship with our customers, and could cause customers to choose other partners. Allegations of contamination or other adverse effects on product safety or suitability for use by a particular customer, even if untrue, may require the recall of the product from all of the markets in which the affected production was distributed. Product recalls have occurred in the past and could occur in the future. Such recalls could prompt government investigations and inspections, the shutdown of manufacturing facilities, continued product shortages and related sales declines, significant remediation costs,
33
Table of Contents
reputational damage, civil penalties and criminal prosecution. Any of these circumstances can also result in damage to brand image, brand equity and customer trust in our solutions.
If the products we manufacture are perceived to be defective or unsafe, or if they otherwise fail to meet our customers’ or consumers’ standards, our relationships with customers could suffer and we could lose sales or become subject to liability claims. Any of these outcomes could result in a material adverse effect on our business, financial condition and results of operations.
We are subject to risks associated with leasing and occupying real property and the inability to extend, renew or continue to lease real property in key locations, could harm our business, profitability and results of operations.
While some of our properties are owned, most of them are leased with leases set to expire at various times through 2038, subject to renewal options in most instances. Accordingly, we are subject to the risks associated with leasing, occupying and making tenant improvements to real property, including, among others, changes in availability of, and contractual terms for, leasable manufacturing space, as well as potential liability for environmental conditions or various other claims. As each of our leases expire, we may be unable to negotiate renewals, either on commercially acceptable terms or at all, which could impact our ability to manufacture our products or deliver them to the market, which in turn could harm our business, profitability and results of operations.
Natural disasters, public health crises (such as the ongoing COVID-19 outbreak), international conflicts, terrorist acts, labor strikes, political crisis, accidents and other events could adversely affect our business and financial results by disrupting development, manufacturing or sale of our products.
As a company engaged in the global development, manufacture and distribution of consumer products, we are subject to the risks inherent in such activities, including industrial accidents, environmental events, strikes and other labor disputes, product quality control issues, safety, licensing requirements and other regulatory issues, as well as natural disasters, public health crises, such as pandemics or epidemics, international conflicts, terrorist acts and other external factors over which we have no control.
While we operate R&D and manufacturing facilities throughout the world, many of these facilities are specialized and certain of our R&D, design and creative facilities and innovation hubs are uniquely situated to support our R&D efforts while certain of our manufacturing facilities are the sole location where a specific ingredient or product is produced. If our R&D activities or the manufacturing of ingredients or products were disrupted, the cost of relocating or replacing these activities or reformulating these ingredients or products may be substantial, which could result in production or development delays or otherwise have an adverse effect on our margins, operating results and future growth.
The global spread of COVID-19, which originated in late 2019 and was declared a pandemic by the World Health Organization in March 2020, has negatively impacted the global economy, disrupted supply chains and created significant volatility in global financial markets. Although there has been an easing of restrictions in certain jurisdictions, some or all of those restrictions could be reinstated to manage a resurgence or new outbreak of the COVID-19 pandemic, including in connection with new variants and mutations thereof. These new variants and mutations and the logistics of vaccine distribution may lead to other restrictions being implemented in response to efforts to reduce the spread of COVID-19. The impact of COVID-19 has resulted in payment deferrals by certain of our customers, which to date has not had an adverse effect on our financial results. Further payment deferral may occur in the event of a resurgence of the outbreak, which may have an adverse effect on our financial results. Various jurisdictions, notably certain European countries and Canada, began to initiate new governmental restrictions, including travel restrictions, in response to renewed pandemic impacts and concerns, which may adversely impact future results of operations and cash flows. Although we have taken actions to enhance our financial flexibility and minimize the impact on our business, the ultimate impact to our business continues to remain uncertain.
34
Table of Contents
Furthermore, if a large number of our employees and/or a subset of our key employees and executives are impacted by COVID-19, our ability to continue to operate effectively may also be negatively impacted. While we have taken comprehensive measures intended to help minimize the risk of the virus to our employees, including the adoption of numerous safety measures such as mask-wearing, hand-washing, social-distancing protocols, health screening protocols and the reorganization of production lines and shifts, allowing all employees capable of working remotely to do so, suspending all non-essential travel worldwide for our employees and, other than in emergency situations with authorization of senior executives, prohibiting employee attendance at industry events and in-person work-related meetings, which could negatively affect our business, we cannot presently predict the scope and severity of the planned and potential shutdowns, furloughs or disruptions of businesses and government agencies.
In response to the spread of COVID-19 and the resulting economic uncertainty, we have taken, and may continue to take, other measures that might negatively impact our business, including suspending all facilities build-outs, significantly reducing non-essential capital expenditures and significantly reducing our contingent workforce. Additionally, as COVID-19 vaccines are becoming available and being distributed, and all of our operations resume and/or return to pre-pandemic status, new potential legal liabilities could arise in connection with workplace safety and employee rights.
With the sustained impact of COVID-19, we have seen a decrease in customer demand for certain of our products like color cosmetics, likely due in part to work-from-home policies and increased mask-wearing. We have also seen an increase in cancelled and deferred customer orders alongside increased costs in ensuring laboratory work safety. These and other factors arising from the COVID-19 pandemic could worsen. Any of these factors and other factors related to any such disruptions that are unforeseen, could have a material adverse effect on our business, results of operations and financial condition. Further, uncertainty around these and related issues could lead to adverse effects on the economy and capital markets of the United States, Canada, Europe and other economies, which could impact our ability to access capital needed to grow our business. Furthermore, the COVID-19 pandemic could exacerbate the other risks described in this section.
Economic uncertainty may adversely affect consumer demand and customer needs, which may have a negative impact on our operating results and future growth.
Our manufacturing, design and packaging solutions are used in a wide assortment of global consumer products throughout the world. Historically, demand for consumer products using our solutions was stimulated and broadened by changing social habits and consumer needs, population growth, an expanding global middle-class and general economic growth, especially in emerging markets. The global economy has recently experienced significant recessionary pressures and declines in consumer confidence and economic growth as a result of the COVID-19 pandemic. While some segments of the global economy appear to be recovering, the surrounding global economic uncertainty in the United States, Canada and Europe has increased, and may in the near future increase, unemployment and underemployment, and could also decrease salaries and wage rates, increase inflation or result in other market-wide cost pressures that will adversely affect demand for consumer products in both developed and emerging markets. In addition, growth rates in the emerging markets have moderated from previous levels. Reduced consumer spending may cause changes in our customer orders including reduced demand for our beauty, personal care or home care solutions, or order cancellations. The timing of placing of orders and the amounts of these orders differ by contract. The majority of our key contracts are relatively short term and vary from three- to five-year terms. Our purchase orders are generally at our customers’ discretion and customers may cancel, reduce or postpone orders with us on relatively short notice. Significant cancellations, reductions or delays in orders by customers could have a material adverse effect on our financial condition and results of operations. See “—We do not typically have long-term contracts with our customers.”
35
Table of Contents
Our success depends on attracting and retaining talented people. Significant shortfalls in recruitment or retention could adversely affect our ability to compete and achieve our strategic goals.
Attracting, developing, and retaining talented employees, including our scientists, engineers, package designers, manufacturing operators and key executives, is essential to the successful delivery of our customer solutions and success in the marketplace. Furthermore, as we continue to focus on innovation, we expect that our need for scientists and other professionals will increase. The ability to attract and retain talented employees is critical in the development of new products and technologies which is an integral component of our growth strategy. Attracting and retaining factory labor is also essential to our ability to continue to meet our customers’ requirements. In certain markets, we face intense competition for factory labor, which may limit our ability to attract and retain employees. We use third-party employment agencies to source temporary factory labor, in particular to respond to fluctuations in customer demand. Our inability to attract and retain factory labor, or to do so at a reasonable cost, or to enter into satisfactory arrangements with third-party providers of temporary labor may negatively impact our manufacturing operations and, in turn, our revenues.
Competition for employees and executives can be intense and if we are unable to successfully integrate, motivate and reward the acquired company employees and executives or our current employees and executives in our combined company, we may not be able to retain them. If we are unable to retain these employees and executives or attract new employees and executives in the future, our ability to effectively compete with our competitors and to grow our business could be adversely affected.
Wage increases and pressure in certain geographies may prevent us from sustaining our competitive advantage and may reduce our profit margin.
Both domestically in United States and Canada and globally, measures are being taken to increase minimum wages, and there is a shortage of skilled labor in certain locations leading to increased wage pressure. Similarly, with an increased global focus on environmental, social and corporate-governance concerns and sustainability, input costs have been steadily rising. Accordingly, we may need to increase the levels of labor compensation more rapidly than in the past to remain competitive in attracting and retaining the quality and amount of labor that our business requires. To the extent that we are not able to control or share wage increases, wage increases may reduce our margins and cash flows, which could adversely affect our business.
If we are not able to maintain, enhance and protect our reputation and recognition as a strong partner, particularly as a result of our acquisitions, our business and results of operations will be harmed.
We believe that maintaining and enhancing our reputation and recognition as a strong partner is critical. The promotion, marketing or cross-selling of our turn-key approach to product innovation, manufacturing and packaging may require us to make substantial investments and we anticipate that these promotion, marketing or cross-selling initiatives may become increasingly difficult and expensive. Our promotional, marketing and cross-selling activities may not be successful or yield increased revenue, and to the extent that these activities yield increased revenue, the increased revenue may not offset the expenses we incur and our results of operations could be harmed. In addition, any factor that diminishes our reputation or that of our management, or any adverse publicity or litigation involving or surrounding us or our management, could make it substantially more difficult for us to attract customers. For example, if we fail to maintain confidentiality of our customers’ information, including formulas and details of upcoming product launches, whether due to human or technological error or to a malicious event, this may lead to a loss of trust among our customers and damage our reputation. In addition, if any of our recent or potential acquisitions do not live up to or enhance our reputation, our business and results of operations may be harmed as our customers may choose to find a new manufacturer and it becomes more difficult to attract new customers.
36
Table of Contents
Our business could be negatively impacted by a failure to maintain good corporate citizenship or diversity and by environmental, social and sustainability concerns.
There is an increased focus from certain investors, customers, consumers, employees, and other stakeholders concerning corporate citizenship, diversity and sustainability matters. These concerns include concerns about lack of diversity in senior leadership positions, as well as the impact of our operations on climate change, the use of plastic, energy, waste and worker safety. Our reputation could be damaged if we do not (or are perceived not to) act responsibly with respect to these matters, which could adversely affect our business, financial condition, profitability, and cash flows. We could fail, or be perceived to fail: (i) to adequately promote diversity within the Company, particularly among our senior leadership positions, and (ii) with respect to the initiatives and goals we have adopted to address sustainability matters, to accurately report our progress on such initiatives and goals. Moreover, the standards by which citizenship and sustainability efforts and related matters are measured are developing and evolving and could change over time. We could be criticized for the seeming lack of diversity in our current management team, as well as the scope of citizenship and sustainability initiatives or goals or perceived as not acting responsibly in connection with any of these matters. Any such matters, or related corporate citizenship, diversity and sustainability matters, could have a material adverse effect on our business.
Our comparable revenues and quarterly financial performance may fluctuate for a variety of reasons, which could result in a decline in the price of our common shares.
Our comparable revenues and quarterly results of operations have fluctuated in the past, and we expect them to continue to fluctuate in the future. A variety of factors affect our comparable revenues and quarterly financial performance, including:
| • | general U.S. and Canadian economic conditions or economic conditions in any of our global markets; |
| • | performance of our customers and the retail markets; |
| • | the effectiveness of our inventory management as well as the inventory management of our customers; |
| • | timing and success of integrating new acquisitions, including additional human resource requirements and other integration costs; |
| • | actions by our existing or new competitors and the competitors of our customers; and |
| • | hurricanes, tornadoes, wildfires, earthquakes, mudslides, other natural disasters, and epidemics or pandemics. |
Accordingly, our results for any one fiscal quarter are not necessarily indicative of the results to be expected for any other quarter, and comparable revenues for any particular future period may decrease. In that event, the price of our common shares may decline. For more information on our quarterly results of operations, see “Prospectus Summary—Summary Consolidated Financial and Other Data,” “Selected Consolidated Financial Data,” and “Management’s Discussion and Analysis of Financial Condition and Results of Operations.”
Risks Related to Litigation and Regulatory Issues
Our results of operations may be negatively impacted by the outcome of uncertainties related to litigation or product recalls.
From time to time we are involved in a number of legal claims, regulatory investigations and litigation, including claims related to intellectual property, product liability, human resource matters, environmental matters and indirect taxes, as well as in litigation involving our customers. Our manufacturing and other facilities have in the past, and may in the future, expose us to environmental claims and regulatory investigations. The cost of defending these claims or our obligations for direct damages and indemnification if we were found liable could adversely affect our results of operations. In addition, such proceedings could distract our management and other
37
Table of Contents
employees or result in disclosure of our confidential information or of confidential information of a customer when required by law. Further, if securities analysts or investors perceive the developments relating to, or results of, such investigations or litigation matters to be negative, it could have an adverse effect on the price of our common shares.
Our insurance may not be adequate to protect us from all material expenses related to pending and future claims and our current levels of insurance may not be available in the future at commercially reasonable prices. Any of these factors could adversely affect our profitability and results of operations.
We rely on third-party suppliers in procuring materials for our customers and otherwise conducting our business and operations, and their failure to perform to our standards or in a timely manner could adversely affect our reputation, business, and financial results.
Third-party suppliers are key to the procurement of materials for our customers and otherwise conducting our business and operations. We have not implemented a supplier risk analysis program and do not have a centralized set of procurement or purchasing guidelines. We do not control our suppliers, their actions or their businesses. No assurance can be provided that suppliers will perform to our or our customers’ standards, comply with applicable law, appropriately manage their own risks, remain financially or operationally viable, or continue to provide us with the products that we require. In such a circumstance, our ability to deliver products and services to customers, to satisfy customer expectations and to otherwise successfully conduct our business and operations could be adversely affected. In addition, we may need to incur substantial expenses to address issues of concern with a supplier, and even if the issues cannot be acceptably resolved, we may not be able to timely or effectively replace the supplier due to contractual restrictions, the unavailability of acceptable alternative suppliers or other reasons. Further, regardless of how much we can influence our suppliers, actions of third-party suppliers could result in regulatory actions against us, which could damage our reputation and, in turn, adversely affect our business, financial condition and results of operations.
If we are unable to comply with regulatory requirements and industry standards, including those regarding product safety, quality, efficacy and environmental impact, we could incur significant costs and suffer reputational harm which could adversely affect results of operations.
Our ideation, formulation, design, packaging and manufacturing solutions are subject to various regulatory requirements in each of the countries in which we operate. See “Business—Regulatory Matters.” In addition, we are subject to product safety and compliance requirements established by governments, industry or similar oversight bodies, or contractually by our customers, including requirements concerning product safety, quality and efficacy, environmental impacts (including packaging, energy and water use and waste management) and other sustainability or similar issues. Regulatory issues regarding compliance with Current Good Manufacturing Practices (“cGMP”) (and comparable quality regulations in foreign countries) by manufacturers of drugs, devices and consumer products can lead to fines and penalties, product recalls, product shortages, interruptions in production, delays in new product approvals and litigation. As concerns regarding safety, quality and environmental impact become more pressing, we may see new, more restrictive regulations adopted that impact the products we manufacture or our manufacturing processes. For example, the European Chemicals Agency has proposed that the European Commission adopt a ban on microplastics, including those found in personal care items, detergents and cosmetics, to reduce plastics pollution. If this ban is adopted, we may be required to modify and/or innovate new solutions to replace microplastics. If we are unable to adapt to these new regulations or standards in a cost effective and timely manner, we may lose business to competitors who are able to provide compliant products.
Gaps in our operational processes or those of our suppliers or customers can result in products that do not meet our quality control or industry standards or fail to comply with the relevant regulatory requirements, which in turn can result in finished consumer goods that do not comply with applicable standards and requirements. Products that are mislabeled, contaminated or damaged could result in a regulatory noncompliance event or even
38
Table of Contents
a product recall by the FDA, Health Canada or a similar foreign agency. In some cases, our contracts require us to indemnify our customers for the costs associated with a product noncompliance event, including penalties, costs and settlements arising from litigation, remediation costs or loss of sales. As our global beauty, personal care and home care products are intended for human use, these consequences would be exacerbated if we or our customer did not identify the defect before the product reaches the consumer and there was a resulting impact at the consumer level. Such a result could lead to potentially large scale adverse publicity, negative effects on consumer’s health, recalls and potential litigation, fines, penalties, sanctions or other regulatory actions. In addition, if we do not have adequate insurance or contractual indemnification from suppliers or other third parties, or if insurance or indemnification is not available, the liability relating to product or possible third-party claims arising from mislabeled, contaminated or damaged products could materially adversely affect our business, financial condition or results of operations. Furthermore, adverse publicity about our solutions, or our customers’ products that we ideate, formulate, manufacture or package, including concerns about product safety or similar issues, whether real or perceived, could harm our reputation and result in an immediate adverse effect on our revenues and customer relationships, as well as require us to utilize significant resources to rebuild our reputation.
Furthermore, because of our extensive international operations, we could be adversely affected by violations, or allegations of violations, of the FCPA, the Corruption of Foreign Public Officials Act (Canada) and similar international anti-bribery laws. The FCPA, the Corruption of Foreign Public Officials Act (Canada) and similar international anti-bribery laws generally prohibit companies and their intermediaries from making improper payments to government officials or other third parties for the purpose of obtaining or retaining business. We cannot provide assurance that our internal controls policies and procedures that mandate compliance with these anti-bribery and other laws will protect us from reckless, intentional or unintentional criminal or non-permitted acts committed by our employees, joint-venture partners or agents. Violations of these laws by our employees or other agents, or allegations of such violations, could result in severe penalties, and could disrupt our business and adversely affect our reputation and our business, financial condition and results of operations.
We incur substantial costs to comply with environmental protection and health and safety laws, and failure to comply with these laws may cause us to close, relocate or operate one or more of our plants at reduced production levels, and expose us to civil or criminal liability or other costs, which could adversely affect our operating results and future growth. Changes to environmental laws could increase our costs of doing business.
Our business operations and properties procure, make use of and manufacture substances that are sometimes considered hazardous and are therefore subject to extensive and increasingly stringent federal, state, provincial, local and foreign laws and regulations pertaining to protection of the environment, and worker health and safety, including climate change, air and greenhouse gas emissions, wastewater discharges, the generation, handling and use of hazardous materials (including in consumer products), waste disposal practices and clean-up of existing environmental contamination. Failure to comply with these laws and regulations may result in significant consequences to us, including the need to close or relocate one or more of our production facilities, administrative, civil and criminal penalties, fines, sanctions, litigation, costly capital expenditures, remediation, abatement and mitigation measures, liability for damages and negative publicity. If we are unable to meet production requirements, as a result of restrictions associated with these laws and regulations or proceedings arising from our failure to comply, we can lose customer orders, which can adversely affect our future growth or require us to make incremental capital investments to ensure supply.
Under certain laws and regulations, such as the U.S. federal Superfund law or its state equivalents, or the Environment Quality Act (Québec) or its equivalent in other Canadian provinces, the obligation to investigate, remediate, monitor and clean up contamination at a property may be imposed on current and former owners, lessees or operators or on persons who may have sent waste to that facility for disposal. Liability under these laws and regulations may be imposed without regard to fault or to the legality of the activities giving rise to the
39
Table of Contents
contamination. Moreover, we may incur liabilities in connection with environmental conditions currently unknown to us relating to our prior, existing or future owned or leased sites or operations or those of predecessor companies whose liabilities we may have assumed or acquired.
Climate change poses a number of potential risks and impacts which remain uncertain today and which may increase over time. We are exposed to the effects of climate change. We cannot predict the prospective impact of climate change, or the development of laws or regulations addressing climate change, on our operations, suppliers or customers, which could have an adverse impact on our results of operations and financial condition.
We may incur liabilities for noncompliance, or substantial expenditures to achieve compliance, with environmental and other laws or changes thereto in the future or as a result of the application of additional laws and regulations to our business, including those limiting greenhouse gas emissions, those requiring compliance with the European Commission’s procedures under its regulation for the registration, evaluation and authorization of chemicals (“REACH”) or other laws and regulations concerning any potential health hazards associated with our products, and those imposing changes that would have the effect of increasing the cost of producing or would otherwise adversely affect the demand for plastic products. We have seen an increase in registration and reporting requirements concerning the use of certain chemicals, such as those subject to REACH, in a number of countries. In addition, stricter regulations, or stricter interpretations of existing laws or regulations, may impose new liabilities on us, and we may become obligated in the future to incur costs associated with the investigation and/or remediation of contamination at our facilities or other locations. Changes in or additional health and safety laws and regulations in connection with our products may also impose new requirements and costs on us. For example, there has been a recent increase in scrutiny on the presence of per- and polyfluoroalkyl substances, known collectively as PFAS, in soil and groundwater as well as their use as an ingredient in consumer products. Laws and regulations establishing cleanup standards with respect to PFAS or restricting their use are at various stages of consideration or implementation, including proposed or enacted U.S. federal and state legislation that would prohibit the intentional use of PFAS in cosmetics and other consumer products as well as similar initiatives in the European Union. In Canada, the federal government has also published a notice of intent to move forward with activities to address PFAS as a class. Certain of these laws and regulations may require us to reformulate or otherwise change certain of our products. Such requirements, liabilities and costs could have a material adverse effect on our capital expenditures, results of operations, financial condition or competitive position.
Changes in tax rules and regulations, or in interpretations thereof, may materially adversely affect our effective tax rates, and we are subject to income tax audits by various authorities.
We have operations in many jurisdictions and we are therefore subject to taxation in many jurisdictions with increasingly complex tax laws, the application of which can be uncertain. Changes in our tax rates could affect our future results of operation or financial condition. Our future effective tax rates could be unfavorably affected by changes in the tax rates in jurisdictions where our income is earned and taxed, by changes in tax rules and regulations, or in interpretations thereof, in the jurisdictions in which we do business, by increases in expenses not deductible for tax purposes including impairments of goodwill, by changes in U.S. GAAP or by changes in the valuation of our deferred tax assets and liabilities.
In addition, we are subject to the continual examination of our income tax returns by various tax authorities. Tax authorities in various jurisdictions may disagree with and subsequently challenge the amount of profits taxed in their state or country, which may result in increased tax liability. Accrued interest and penalties may also be levied on any such tax liability, which could affect our results of operation or financial condition. We regularly assess the likelihood of outcomes resulting from these examinations to determine the adequacy of our provision for income taxes and, where we have judged it appropriate, have reserved for potential adjustments that may result. We cannot be certain that the final determination of any of these examinations will not have a material adverse effect on our results of operations or financial condition.
Pending and future tax changes may result in significant additional taxes to us. For example, the Organization for Economic Cooperation and Development published a “Programme of Work,” which was
40
Table of Contents
divided into two pillars. Pillar One focused on the allocation of group profits among taxing jurisdictions based on a market-based concept, rather than the historical “permanent establishment” concept. Pillar Two, among other things, introduced a global minimum tax. More recently, on June 5, 2021, the finance ministers of the G7 agreed to (1) reach an equitable solution with respect to Pillar One and (2) a global minimum tax rate of at least 15% under Pillar Two. The foregoing proposals (in the event international consensus is achieved and implementing laws are adopted) and other possible future tax changes may have an adverse impact on us.
Our collection, use, storage, disclosure, transfer and other processing of personal information could give rise to significant costs and liabilities, including as a result of governmental regulation, conflicting legal requirements or differing views of personal privacy rights.
Although we currently carry on business-to-business operations, in the course of our operations, we collect, use, store, disclose, transfer and otherwise process personal information, including from employees and third parties with whom we conduct business. The collection, use, storage, disclosure, transfer and other processing of personal information is increasingly subject to a wide array of U.S. and Canadian federal, state and provincial and foreign laws and regulations regarding data privacy and security that are intended to protect the privacy of personal information that is collected, used, stored, disclosed, transferred and otherwise processed in or from the governing jurisdiction.
In the United States, various federal and state regulators have adopted, or are considering adopting, laws and regulations concerning personal information and data security. This patchwork of legislation and regulation may give rise to conflicts or differing views of personal privacy rights, thereby complicating compliance efforts. For example, the California Consumer Privacy Act (“CCPA”), which increases privacy rights for California residents and imposes obligations on companies that process their personal information, came into effect on January 1, 2020. Among other things, the CCPA requires covered companies to provide new disclosures to California consumers and provide such consumers new data protection and privacy rights, including the ability to opt-out of certain sales of personal information. The CCPA provides for civil penalties for violations, as well as a private right of action for certain data breaches that result in the loss of personal information. In addition, on November 3, 2020, California voters approved a new privacy law, the California Privacy Rights Act (“CPRA”), which significantly modifies the CCPA, including by expanding consumers’ rights with respect to certain personal information and creating a new state agency to oversee implementation and enforcement efforts. Many of the CPRA’s provisions will become effective on January 1, 2023.
In Canada, collection, use and disclosure of personal information by private organizations is subject to the Personal Information Protection and Electronic Documents Act and substantially similar provincial legislation. Generally, such legislation requires the organization to obtain the consent of an individual prior to any collection, use or disclosure of personal information about that individual and imposes certain requirements with respect to protecting the information from unauthorized access and use, keeping the information up to date and destroying the information when no longer needed for the purpose(s) for which it was collected. The federal government and several provincial governments are considering modernizing laws and regulations concerning personal information and data security. For example, the federal government released a Bill on November 17, 2020 short-titled the Digital Charter Implementation Act (“DICA”) that, if passed in its current form, will push the Canadian federal privacy framework closer towards that seen in California. DICA proposes to provide individuals with more control over their personal information, including the right to transfer their data from one organization to another, demand that an organization dispose of personal information under its possession, and to demand that a business explain how its algorithms utilize personal information. Furthermore, DICA proposes to provide greater enforcement powers by establishing a Personal Information and Data Protection Tribunal that would have increased administrative penalties and an expanded range of offences at its disposal. All of these evolving compliance and operational requirements impose significant costs that are likely to increase over time, may require us to modify our data processing practices and policies, divert resources from other initiatives and projects, and could restrict the way products and services involving data are offered, all of which may have a material and adverse impact on our business, financial condition and results of operations.
In the European Union, the GDPR which became effective in May 2018, greatly increased the European Commission’s jurisdictional reach of its laws and added a broad array of requirements for handling personal data.
41
Table of Contents
European Union member states are tasked under the GDPR to enact, and have enacted, certain implementing legislation that adds to and/or further interprets the GDPR requirements and potentially extends our obligations and potential liability for failing to meet such obligations. The GDPR, together with national legislation, regulations and guidelines of the European Union member states governing the processing of personal data, impose strict obligations and restrictions on the ability to collect, use, retain, protect, disclose, transfer and otherwise process personal data. In particular, the GDPR includes obligations and restrictions concerning the consent and rights of individuals to whom the personal data relates, the transfer of personal data out of the European Economic Area, security breach notifications and the security and confidentiality of personal data. The GDPR authorizes fines for certain violations of up to 4% of global annual revenue or €20 million, whichever is greater. Such fines are in addition to any civil litigation claims by customers and data subjects. Much remains unknown with respect to how to interpret and implement the GDPR, and guidance on implementation and compliance practices is often updated or otherwise revised. Given the breadth and depth of changes in data protection obligations, including classification of data and our commitment to a range of administrative, technical and physical controls to protect data and enable data transfers outside of the European Union, our compliance with the GDPR’s requirements will continue to require time, resources and review of the technology and systems we use to satisfy the GDPR’s requirements, including as European Union member states enact their legislation.
In the United Kingdom, many of the GDPR’s requirements were implemented by the Data Protection Act 2018. Further, following the end of the implementation period for the United Kingdom’s withdrawal from the European Union on December 31, 2020, the GDPR was directly incorporated into United Kingdom law as retained European Union legislation. The Trade and Cooperation Agreement, which governs the terms of the future trading relationship between the United Kingdom and European Union, provides for a transitional period during which the United Kingdom will be treated like an European Union member state in relation to processing and transfers of personal data for four months from January 1, 2021. This period may be extended by a further two months, after which the United Kingdom will be a “third country” under the GDPR unless the European Commission adopts an adequacy decision in respect of transfers of personal data to the United Kingdom. The United Kingdom government has already determined that it considers all European Union and European Economic Area member states to be adequate for the purposes of data protection, ensuring that data flows from the United Kingdom to the European Union / European Economic Area remain unaffected. As a consequence of the United Kingdom’s withdrawal from the European Union, we will have to comply with the GDPR and the GDPR as incorporated into United Kingdom national law, which may over time have differing requirements.
Many statutory requirements, in the United States, Canada and elsewhere, include obligations for companies to notify individuals of security breaches involving certain personal information, which could result from breaches experienced by us or our external service providers. Any actual or perceived security breach could harm our reputation and brand, expose us to potential liability or require us to expend significant resources on data security and in responding to any such actual or perceived breach. Any contractual protections we may have from our external service providers and insurance coverage may not be sufficient to adequately protect us from any such liabilities and losses, and we may be unable to enforce any such contractual protections or obtain the benefits under our insurance coverage.
Because the interpretation and application of laws, regulations, standards and other obligations relating to data privacy and security are still uncertain, it is possible that these laws, regulations, standards and other obligations may be interpreted and applied in a manner that is inconsistent with our data processing practices and policies. If our practices are not consistent, or are viewed as not consistent, with changes in laws, regulations and standards or new interpretations or applications of existing laws, regulations and standards, we may also become subject to fines, audits, inquiries, whistleblower complaints, adverse media coverage, investigations, lawsuits, loss of export privileges, severe criminal or civil sanction or other penalties. We could also be affected if legislation or regulations are expanded to require changes in our data processing practices and policies. We may be unable to make such changes and modifications in a commercially reasonable manner, or at all.
Although we endeavor to comply with our public statements and documentation, we may at times fail to do so or be alleged to have failed to do so. The publication of our privacy policies and other statements that provide
42
Table of Contents
promises and assurances about data privacy and security can subject us to potential government or legal action if they are found to be deceptive, unfair or misrepresentative of our actual practices. Any concerns about our data privacy and security practices, even if unfounded, could damage the reputation of our businesses and discourage potential users from our products and services. Any of the foregoing could have an adverse effect on our business, financial condition, results of operations and prospects.
Risks Related to Our Intellectual Property and Information Technology
Breaches or failures of our information technology systems or website security, the theft, unauthorized access, acquisition, use, disclosure, modification or misappropriation of personal information, the occurrence of fraudulent activity, or other cybersecurity or data security-related incidents may have an adverse impact on our business, financial condition, results of operations and prospects.
In the course of operating our business, we collect, use, store, disclose, transfer and otherwise process personal information and other confidential, proprietary and sensitive data. Breaches or failures of security involving our systems or website or those of any of our external service providers have occurred, and in the future may occur, and could result in the theft, unauthorized access, acquisition, use, disclosure, modification or misappropriation of personal information of our customers, consumers, employees or third parties with whom we conduct business, or other confidential, proprietary and sensitive data, fraudulent activity, or system disruptions or shutdowns. The occurrence of any actual or attempted breach, failure of security or fraudulent activity, the reporting of such an incident, whether accurate or not, or our failure to make adequate or timely disclosures to the public or law enforcement agencies following any such event, whether due to delayed discovery or a failure to follow existing protocols, could result in claims made against us or our external service providers, which could result in state, federal and/or international litigation and related financial liabilities, as well as criminal penalties or civil liabilities, regulatory actions from state, federal and/or international governmental authorities, and significant fines, orders, sanctions, litigation and claims against us by customers or consumers or other third parties and related indemnification obligations. Actual or perceived security breaches or failures could also cause financial losses, increased costs, interruptions in the operations of our businesses, misappropriation of assets, significant damage to our brand and reputation with customers and third parties with whom we do business, and result in adverse publicity, loss of customer confidence, distraction to our management, and reduced sales and profits.
Such breaches, failures and fraudulent activity may take many forms, including check fraud, fraudulent inducement, electronic fraud, wire fraud, computer viruses, phishing, social engineering, denial or degradation of service attacks, malware, ransomware or other cyberattacks, and other dishonest acts, any of which could be the result of a circumvention or failure of our data security processes, procedures, tools, and controls. Our systems are also subject to compromise from internal threats, such as theft, misuse, unauthorized access or other improper actions by employees, external service providers and other third parties with otherwise legitimate access to our systems and website. Data security-related incidents and fraudulent activity are increasing in frequency and evolving in nature and may be exacerbated during the current work-from-home environment. We rely on a framework of security, processes, procedures, tools, training and controls designed to protect our information and assets but, given the unpredictability of the timing, nature and scope of data security-related incidents and fraudulent activity, there can be no assurance that any security procedures and controls that we or our external service providers have implemented will be sufficient to prevent data security-related incidents or other fraudulent activity from occurring. Furthermore, because the methods of attack and deception change frequently, are increasingly complex and sophisticated, and can originate from a wide variety of sources, including third parties such as external service providers and even nation-state actors, despite our reasonable efforts to ensure the integrity of our systems and website, it is possible that we may not be able to anticipate, detect, appropriately react and respond to, or implement effective preventative measures against, all security breaches and failures and fraudulent activity.
We have been, and may in the future be, required to expend significant capital and other resources to protect against, respond to, and recover from any potential, attempted, or existing security breaches or failures and their
43
Table of Contents
consequences. As data security-related threats continue to evolve, we may be required to expend significant additional resources to continue to modify or enhance our protective measures or to investigate and remediate any information security vulnerabilities. In addition, our remediation efforts may not be successful and we could be unable to implement, maintain and upgrade adequate safeguards. Moreover, there could be public announcements regarding any data security-related incidents and any steps we take to respond to or remediate such incidents, and if securities analysts or investors perceive these announcements to be negative, it could, among other things, have a substantial adverse effect on the price of our common shares. Customers and consumers are generally concerned with cybersecurity and data privacy, and any publicized security problems affecting our businesses or those of third parties with whom we are affiliated or otherwise conduct business may discourage customers from doing business with us.
While we currently maintain cybersecurity insurance, such insurance may not be sufficient in type or amount to cover us against claims related to breaches, failures or other data security-related incidents, and we cannot be certain that cyber insurance will continue to be available to us on economically reasonable terms, or at all, or that any insurer will not deny coverage as to any future claim. The successful assertion of one or more large claims against us that exceed available insurance coverage, or the occurrence of changes in our insurance policies, including premium increases or the imposition of large deductible or co-insurance requirements, could have a material and adverse effect on our business, financial condition and results of operations. Any of the foregoing could have an adverse effect on our business, financial condition, results of operations and prospects.
If we are unable to obtain, maintain, protect and enforce our intellectual property rights for the products we develop, or if the scope of our intellectual property protection is not sufficiently broad, others may be able to develop and commercialize products substantially similar to ours, and our ability to successfully commercialize our products may be adversely affected.
A significant part of our business depends on internally developed products and formulas for our innovation strategy and on trade secrets and know-how behind our manufacturing capabilities, the protection of which is crucial to the success of our business. We rely on a combination of patent, trademark and trade secret laws and confidentiality procedures and contractual provisions to protect our intellectual property rights. We may, over time, increase our investment in protecting our intellectual property through additional patent, trademark and other intellectual property filings that could be expensive and time consuming. Effective patent, trademark, trade secret, copyright and other intellectual property protection is expensive to develop and maintain, both in terms of initial and ongoing registration requirements and the costs of defending our rights. These measures, however, may not be sufficient to offer us meaningful protection.
Any patents that may issue in the future from our pending or future patent applications may not provide us with competitive advantages, may be of limited territorial reach and may be held invalid or unenforceable if successfully challenged by third parties. Our lack of patent protection may restrict our ability to protect our technologies and processes from competition. It is also possible that third parties, including our competitors, may obtain patents relating to technologies that overlap or compete with our technology. If third parties obtain patent protection with respect to such technologies, they may assert that our technology infringes their patents and seek to charge us a licensing fee or otherwise preclude the use of our technology. Additionally, our registered or unregistered trademarks or trade names may be challenged, infringed, circumvented, diluted, declared generic, lapsed or determined to be infringing on, depreciate the goodwill in or be dilutive of other marks. Any of the foregoing could have an adverse effect on our business, financial condition, results of operations and prospects.
We may not be able to effectively prosecute and enforce our intellectual property and proprietary rights throughout the world.
The laws of some foreign jurisdictions do not protect intellectual property rights to the same extent as laws in the United States and Canada. If we are unable to protect our intellectual property and other proprietary rights, our competitive position and our business could be harmed, as third parties may be able to commercialize and
44
Table of Contents
use products that are substantially the same as ours. Any of our intellectual property rights, or any such rights of our customers, could be challenged, invalidated, circumvented, infringed, misappropriated or otherwise violated, our trade secrets and other confidential information could be disclosed in an unauthorized manner to third parties, or our intellectual property rights may not be sufficient to permit us to take advantage of current market trends or otherwise to provide us with competitive advantages, which could result in costly redesign efforts, discontinuance of certain products or other competitive harm.
Monitoring unauthorized use of our intellectual property is difficult and costly. From time to time, we seek to analyze our competitors’ services, and may in the future seek to enforce our rights against potential infringement, misappropriation or other violation. However, the steps we have taken to protect our intellectual property rights may not be adequate to prevent infringement, misappropriation or other violation of our intellectual property. We may not be able to detect unauthorized use of, or take appropriate steps to enforce, our intellectual property rights. Any inability to meaningfully protect our intellectual property rights could result in harm to our ability to compete and reduce demand for our products. Moreover, our failure to develop and properly manage new intellectual property could adversely affect our market positions and business opportunities.
Uncertainty may result from changes to intellectual property legislation and from interpretations or applications of intellectual property laws by applicable courts and agencies. Accordingly, despite our efforts, we may be unable to obtain, maintain, protect and enforce the intellectual property rights necessary to provide us with a competitive advantage. Any of the foregoing could have an adverse effect on our business, financial condition, results of operations and prospects.
We do not own the intellectual property of all of the formulas or technical specifications of products that we manufacture, and if we are unable to protect the confidentiality of customer trade secrets, know-how and other proprietary and internally developed information, we may not be able to maintain customer relationships and our business may be adversely affected.
We do not own the intellectual property of all of the formulas or technical specifications for the products that we manufacture. Rather, we often depend on our customers to provide the formulas or technical specifications for the products, or, alternatively, we develop new formulations and solutions that are sold to customers in return for certain manufacturing exclusivities. We contribute our internally developed proprietary know-how to the manufacturing process; these processes are considered trade secrets and are not typically shared with customers. Therefore, it is possible that our customers may approach another manufacturer to produce products using their formulas. We may not be able to adequately protect their trade secrets, know-how and other internally developed proprietary information or our customers may perceive that we are not able to adequately protect their trade secrets, know-how and other internally developed proprietary information. Although we use reasonable efforts to protect this information and technology, our employees, consultants and other parties (including independent contractors and companies with which we conduct business) may unintentionally or willfully disclose our or our customers’ trade secrets or other proprietary formulas or other information to competitors or other third parties. Enforcing a claim that a third party illegally disclosed or obtained and is using any of our internally developed information or formulas is difficult, expensive and time consuming, and the outcome is unpredictable. In addition, courts outside the United States and Canada are sometimes less willing to protect trade secrets, know-how and other proprietary information. We rely, in part, on non-disclosure, confidentiality and assignment-of-invention agreements with our employees, independent contractors, consultants and companies with which we conduct business to protect our and our customers’ trade secrets, know-how and other confidential or proprietary information. We may fail to enter into such agreements with all applicable parties, and such agreements may not be self-executing, or they may be breached and we may not have adequate remedies for such breach. Moreover, third parties may independently develop similar or equivalent proprietary information or reverse-engineer or otherwise gain access to our trade secrets, know-how and other internally developed information. Any of the foregoing could have an adverse effect on our business, financial condition, results of operations and prospects.
45
Table of Contents
Third parties may initiate legal proceedings alleging that we are infringing, misappropriating or otherwise violating their intellectual property rights, the outcome of which would be uncertain and could have a material adverse effect on our business, financial condition and results of operations.
Our commercial success depends on our ability to develop and commercialize our products and use our internally developed formulas without infringing the intellectual property or proprietary rights of third parties. Intellectual property disputes can be costly to defend and may cause our business, operating results and financial condition to suffer. Whether merited or not, we may face allegations that we or parties indemnified by us have infringed, misappropriated or otherwise violated the patents, trademarks, copyrights, trade secrets or other intellectual property rights of third parties. Such claims may be made by competitors seeking to obtain a competitive advantage or by other parties. Some third parties may be able to sustain the costs of complex litigation more effectively than we can because they have substantially greater resources. We may also face allegations that our employees have misappropriated the trade secrets or other intellectual property or proprietary rights of their former employers or other third parties. It may be necessary for us to initiate litigation to defend ourselves in order to determine the scope, enforceability, validity or ownership of third-party intellectual property or proprietary rights, or to establish our respective rights.
We may not be able to successfully settle or otherwise resolve such adversarial proceedings or litigation. If we are unable to successfully settle future claims on terms acceptable to us we may be required to engage in or to continue claims, regardless of whether such claims have merit, that can be time consuming, divert management’s attention and financial resources and be costly to evaluate and defend. Results of any such litigation are difficult to predict and may require us to stop commercializing or using our products or formulas, obtain licenses, modify our products and formulas while we develop non-infringing substitutes or incur substantial damages, settlement costs or face a temporary or permanent injunction prohibiting us from marketing or providing the affected products. If we require a third-party license, it may not be available on reasonable terms or at all, and we may have to pay substantial royalties and upfront or ongoing fees, or grant cross-licenses to our own intellectual property rights. Such licenses may also be non-exclusive, which could allow competitors and other parties to use the subject intellectual property in competition with us. We may also have to redesign our products so they do not infringe, misappropriate or otherwise violate third-party intellectual property rights, which may not be possible or may require substantial monetary expenditures and time, during which our products may not be available for commercialization or use. Even if we have an agreement to indemnify us against such costs, the indemnifying party may be unable or unwilling to uphold its contractual obligations. If we cannot or do not obtain a third-party license to the infringed intellectual property at all or on reasonable terms, our business, financial condition and results of operations could be adversely impacted.
In addition, there could be public announcements of the results of hearings, motions or other interim proceedings or developments, and if securities analysts or investors perceive these results to be negative, it could have a material adverse effect on the price of our common shares. Moreover, any uncertainties resulting from the initiation and continuation of any legal proceedings could have a material adverse effect on our ability to raise the funds necessary to continue our operations. Any of the foregoing could have an adverse effect on our business, financial condition, results of operations and prospects.
Risks Related to Our Indebtedness
Our existing and any future indebtedness could adversely affect our ability to operate our business.
As of July 31, 2021, we had $1,784.0 million of outstanding borrowings consisting of $253.5 million under our Revolving Facility, $1,519.4 million under our existing Term Loans and $11.1 million in finance leases and other borrowings. Indebtedness under our Revolving Facility and our outstanding Term Loans are secured by liens on our and certain of our subsidiaries’ assets, which are senior to any lien otherwise secured against our assets. While the terms of our credit facilities place restrictions on our ability to incur additional indebtedness, we may be able to incur significant additional indebtedness in the future.
46
Table of Contents
Our existing indebtedness has had, and any future indebtedness could have, important consequences, including:
| • | requiring us to dedicate a substantial portion of our cash flow to payments on our indebtedness, which would reduce the amount of cash flow available to fund working capital, capital expenditures or other corporate purposes; |
| • | increasing our vulnerability to general adverse economic, industry, and market conditions; |
| • | requiring the pledge of substantially all of our assets as collateral and subjecting us to restrictive covenants, including restrictions on our ability to pay dividends, each of which may reduce our ability to take certain corporate actions or obtain further debt or equity financing; |
| • | limiting our ability to plan for and respond to business opportunities or changes in our business or industry; and |
| • | placing us at a competitive disadvantage compared to our competitors that have less debt or better debt servicing options. |
In addition, our indebtedness under the Revolving Facility and Term Loans bears interest at a variable rate, making us vulnerable to increases in the market rate of interest. If the market rate of interest increases substantially, we will have to pay additional interest on this indebtedness, which would reduce cash available for our other business needs.
On or about February 3, 2021, we completed the Distribution Financing Transactions and, accordingly, did not retain any of the proceeds from the borrowings under the 2021 Term Loan Increase, the 2021 Revolver Increase and Incremental Amendment No. 9. See “Management’s Discussion and Analysis of Financial Condition and Results of Operations—Liquidity and Capital Resources—Term Loans and Revolving Facility” and “Description of Certain Indebtedness.”
We may not have sufficient funds, and may be unable to generate sufficient cash flows from operations, to pay the amounts due under our existing and future debt instruments. Failure to make payments or comply with other covenants under our existing or future debt instruments could result in an event of default. If an event of default occurs and the lender accelerates the amounts due, we may need to seek additional financing, which may not be available on acceptable terms, in a timely manner or at all. In such event, we may not be able to make accelerated payments, and the lender could seek to enforce security interests, if any, in the collateral securing such indebtedness, which includes or could include substantially all of our assets. In addition, the covenants under our existing or future debt instruments, any pledge of our assets as collateral and any negative pledge with respect to our intellectual property could limit our ability to obtain additional debt financing. Any of these events could have a material and adverse effect on our business, financial condition, operating results, cash flows, and prospects.
Certain of our long-term indebtedness bears interest at variable interest rates, primarily based on LIBOR, which may be subject to regulatory guidance and/or reform that could cause interest rates under our current or future debt agreements to fluctuate or cause other unanticipated consequences.
The UK Financial Conduct Authority, which regulates the London Inter-bank Offered Rate (“LIBOR”), has announced that all LIBOR settings will either cease to be provided by the administrator of LIBOR after June 30, 2023, in the case of the most commonly used U.S. dollar LIBOR settings, and after December 31, 2021, in the case of all other LIBOR settings, or no longer be representative following such dates. It is not possible to predict what rate or rates may become acceptable alternatives to LIBOR, or what effect these changes in views or alternatives may have on financial markets for LIBOR-linked financial instruments. When representative LIBOR rates cease to exist, interest rates on our current or future indebtedness may be adversely affected or we may need to renegotiate the terms of our debt agreements that utilize LIBOR as a factor in determining the applicable interest rate to replace LIBOR with the new standard that is established, if any, or to otherwise agree with the trustees or agents under such facilities or instruments on a new means of calculating interest.
47
Table of Contents
Risks Related to Our Common Shares and this Offering
We do not know whether an active trading market will develop or be sustained for our common shares or what the market price of our common shares will be, and, as a result, it may be difficult for you to sell your common shares.
Prior to this offering, there has been no public market for our common shares. The initial public offering price for our common shares will be determined through negotiations with the underwriters and may not bear any relationship to the market price at which our common shares will trade after this offering or to any other established criteria of the value of our business. Although our common shares have been approved for listing on the NYSE and we have applied to list our common shares on the TSX, an active trading market for our common shares may never develop or be sustained following this offering. If an active market for our common shares does not develop or is not sustained, it may be difficult for you to sell common shares you purchase in this offering without depressing the market price for the shares or at all.
If you purchase common shares in this offering, you will suffer immediate and substantial dilution of your investment.
The initial public offering price of our common shares will be substantially higher than the as further adjusted net tangible book value per common share immediately after this offering. Therefore, if you purchase our common shares in this offering, you will pay a price per common share that substantially exceeds our as further adjusted net tangible book value per common share after this offering. In addition, you will pay more for your common shares than the amounts paid by our existing owners. Based on an assumed initial public offering price of $14.00 per common share, which is the midpoint of the price range set forth on the cover page of this prospectus, you will experience immediate dilution in as further adjusted net tangible book value of $16.24 per common share, representing the difference between our as further adjusted net tangible book value per common share after giving effect to this offering and the initial public offering price.
We also have a number of outstanding options to purchase common shares with exercise prices that are below the estimated initial public offering price of our common shares. To the extent outstanding options are exercised, you will incur further dilution. See “Dilution” for more details.
If securities analysts do not commence to publish or cease publishing research or reports or publish misleading, inaccurate or unfavorable research about us, our business or our market, or if they publish negative evaluations of our common shares, the price and trading volume of our common shares could decline.
The trading market for our common shares is expected to be influenced, in part, by the research and reports that industry or financial analysts publish about us, our business, our market and our competitors. We do not currently have research coverage by industry or financial analysts. If no, or few, analysts commence coverage of us, the trading price of our common shares would likely decrease. Even if we do obtain analyst coverage, if one or more of the analysts covering our business downgrade their evaluations of our common shares or publish inaccurate or unfavorable research about our business, or provide more favorable relative recommendations about our competitors, the price of our common shares could decline. If one or more industry or financial analysts fail to regularly publish reports on us or if one or more of these analysts cease to cover our business, we could lose visibility in the market, which in turn could cause the price or trading volume of our common shares to decline.
The market price of our common shares may be volatile and fluctuate substantially, which could result in substantial losses for purchasers of our common shares in this offering.
The market price of our common shares could be subject to significant fluctuations after this offering, and may decline below the initial public offering price. In addition, securities markets worldwide have experienced,
48
Table of Contents
and are likely to continue to experience, extreme volatility that has often been unrelated to the operating performance of particular companies. As a result of this volatility, you may not be able to sell your common shares at or above the initial public offering price. The market price for our common shares may be influenced by many factors, including:
| • | our success in developing innovative manufacturing, design and packaging solutions for our target sectors; |
| • | the success of competitive solutions or technologies; |
| • | our entry into new markets; |
| • | regulatory or legal developments in the United States, Canada and other countries; |
| • | developments or disputes concerning intellectual property or proprietary rights; |
| • | the recruitment or departure of key personnel; |
| • | strategic actions by us or our competitors, such as acquisitions or restructurings; |
| • | the level of expenses related to any solutions we may develop; |
| • | the results of our efforts to discover, develop, acquire or in-license solutions or technologies and the costs of development of any such solutions or technologies; |
| • | actual or anticipated changes in estimates as to financial results, development timelines or recommendations by securities analysts; |
| • | effectiveness of our internal controls over financial reporting; |
| • | variations in our financial results or the financial results of companies that are perceived to be similar to us; |
| • | sales of common shares by us, our executive officers, directors or principal shareholders, or others; |
| • | market conditions in the consumer goods sectors; |
| • | general economic, industry, political and market conditions; and |
| • | the other factors described in this “Risk Factors” section. |
In the past, following periods of volatility in the market price of a company’s securities, securities class-action litigation has often been instituted against that company. Any lawsuit to which we are a party, with or without merit, may result in an unfavorable judgment. We also may decide to settle lawsuits on unfavorable terms. Any such negative outcome could result in payments of substantial damages or fines, damage to our reputation or adverse changes to our offerings or business practices. Such litigation may also cause us to incur other substantial costs to defend such claims and divert management’s attention and resources.
An inability to raise additional capital when needed on acceptable terms, or at all, could impact our growth strategy, financial performance and share price.
If the current equity and credit markets deteriorate, our results of operations are adversely affected or our credit ratings decline, it may make any necessary debt or equity financing more difficult, more costly or more dilutive. Failure to secure any necessary financing in a timely manner and on favorable terms could have a material adverse effect on our growth strategy, financial performance and share price and could require us to delay or abandon our business plans and opportunities. Moreover, the issuance of additional securities by us, whether equity or debt, or the market perception that such issuances are likely to occur, could cause the market price of our common shares to decline.
49
Table of Contents
Insiders will continue to have substantial control over us after this offering and could limit your ability to influence the outcome of key transactions, including a change of control.
Our principal shareholders, directors and executive officers and entities affiliated with them will own approximately 70% of our outstanding common shares after this offering. As a result, these shareholders, if acting together, would be able to influence or control matters requiring approval by our shareholders, including the election of directors and the approval of change of control transactions, amalgamations, arrangements or other extraordinary transactions. They may also have interests that differ from yours and may vote in a way with which you disagree and which may be adverse to your interests. The concentration of ownership may have the effect of delaying, preventing or deterring a change of control of our company, could deprive our shareholders of an opportunity to receive a premium for their common shares as part of a sale of our company and might ultimately affect the market price of our common shares.
Certain of our major shareholders will continue to have significant influence over us after this offering and may have interests that are different from the interests of our other shareholders.
Certain of our major shareholders may have interests that are different from, or are in addition to, the interests of our other shareholders. In particular, Cornell and certain of its affiliates may be deemed to beneficially own approximately 43% of our issued and outstanding common shares after giving effect to this offering, and CDPQ and certain of its affiliates may be deemed to beneficially own approximately 18% of our issued and outstanding common shares after giving effect to this offering. There may be real or apparent conflicts of interest with respect to matters affecting such shareholders and their affiliates whose interests in some circumstances may be adverse to our interests.
For so long as such shareholders continue to own a significant percentage of our common shares, they will be able to significantly influence the composition of our board of directors and the approval of actions requiring shareholder approval through their voting rights. Accordingly, for such period of time, they will have significant influence with respect to our management, business plans and policies, including the appointment and removal of our officers. In particular, for so long as such shareholders continue to own a significant percentage of our common shares, they may be able to cause or prevent a change of control of our company or a change in the composition of our board of directors and could preclude any unsolicited acquisition of our company. In addition, for so long as certain shareholders continue to own a significant percentage of our common shares, they will have certain approval or consultation rights, as applicable, under the Shareholders’ Agreement with respect to any action on, including an increase or decrease in, the number of directors serving on the board of directors, material changes in the operations at the Québec-based facilities of the Company and the maintenance of the Company’s global headquarters in Québec. See “Certain Relationships and Related Party Transactions—Shareholders’ Agreement.” The concentration of ownership could deprive you of an opportunity to receive a premium for your common shares as part of a sale of our company and ultimately might affect the market price of our common shares.
Such shareholders and their affiliates engage in a broad spectrum of activities. In the ordinary course of their business activities, they may engage in activities where their interests conflict with our interests or those of our shareholders. For example, they may pursue acquisition opportunities that may be complementary to our business, and, as a result, those acquisition opportunities may not be available to us. In addition, they may have an interest in our pursuing acquisitions, divestitures and other transactions that, in their judgment, could enhance their investment, even though such transactions might involve risks to us and our shareholders. Such potential conflicts may delay or limit the opportunities available to us, and it is possible that conflicts may be resolved in a manner adverse to us or result in agreements that are less favorable to us than terms that would be obtained in arm’s-length negotiations with unaffiliated third parties. See “Certain Relationships and Related Party Transactions.”
Because we do not anticipate paying any cash dividends on our common shares in the foreseeable future, capital appreciation, if any, will be your sole source of gain.
We currently intend to retain any future earnings to fund the development and expansion of our business, including further acquisitions, and, therefore, we do not anticipate paying cash dividends on our common shares
50
Table of Contents
in the foreseeable future. Any future determination to pay dividends will be at the discretion of our board of directors, subject to applicable laws, and will depend on our results of operations, financial condition, capital requirements, contractual restrictions and other factors deemed relevant by our board of directors. Our future ability to pay cash dividends on our common shares is currently limited by the terms of our Credit Agreement and may be limited by the terms of any future debt or preferred securities. We currently intend to retain all of our future earnings, if any, to finance the growth and development of our business. As a result, capital appreciation, if any, of our common shares will be your sole source of gain for the foreseeable future. See “Dividend Policy.”
A significant portion of our issued and outstanding common shares is restricted from immediate resale but may be sold into the market in the near future, which could cause the market price of our common shares to drop significantly, even if our business is doing well.
Sales of a substantial number of our common shares in the public market, or the perception in the market that the holders of a large number of shares intend to sell shares, could reduce the market price of our common shares and could impair our ability to raise capital through the sale of additional equity securities. After this offering, we will have 214,661,117 common shares outstanding based on the number of common shares outstanding as of September 14, 2021. This includes the common shares that we are selling in this offering, which may be resold in the public market immediately without restriction, unless purchased by persons otherwise restricted from selling. The remaining 157,518,260 common shares are currently restricted as a result of securities laws or lock-up agreements but will become eligible to be sold at various times after the offering as described in “Shares Eligible for Future Sale.” The lock-up agreements include customary exceptions, and the representatives of the underwriters may release some or all of the common shares subject to lock-up agreements at any time and without notice, which would allow for earlier sales of shares in the public market.
Moreover, beginning 180 days after the completion of this offering (or such earlier time as permitted by the terms of the lock-up agreements executed in connection with this offering), holders of an aggregate of approximately 150 million common shares will have rights, subject to specified conditions, to require us to file registration statements covering their shares or to include their shares in registration statements that we may file for ourselves or other shareholders. We also intend to register all common shares that we may issue under our equity compensation plans. Once we register these shares, they can be freely sold in the public market upon issuance, subject to volume limitations applicable to affiliates and the lock-up agreements described in “Underwriting (Conflicts of Interest).”
We will incur increased costs as a result of operating as a public company, and our management will be required to devote substantial time to new compliance initiatives and corporate governance practices.
As a public company, we will incur significant legal, accounting and other expenses that we did not incur as a private company. The Sarbanes-Oxley Act of 2002, the Dodd-Frank Wall Street Reform and Consumer Protection Act, the listing requirements, rules, regulations and policies of the NYSE and the TSX, and other applicable securities rules and regulations, including applicable Canadian securities laws, impose various requirements on public companies, including establishment and maintenance of effective disclosure and financial controls and corporate governance practices. Our management and other personnel will need to devote a substantial amount of time to these compliance initiatives. Moreover, these rules and regulations will increase our legal and financial compliance costs, particularly as we hire additional financial and accounting employees to meet public company internal control and financial reporting requirements and will make some activities more time consuming and costly. For example, we expect that these rules and regulations may make it more difficult and more expensive for us to obtain director and officer liability insurance, which in turn could make it more difficult for us to attract and retain qualified members of our board of directors.
We are evaluating these rules and regulations and cannot predict or estimate the amount of additional costs we may incur or the timing of such costs. These rules and regulations are often subject to varying interpretations, in many cases due to their lack of specificity, and, as a result, their application in practice may evolve over time as new guidance is provided by regulatory and governing bodies. This could result in continuing uncertainty
51
Table of Contents
regarding compliance matters and higher costs necessitated by ongoing revisions to disclosure and governance practices. If we fail to comply with new laws, regulations and standards, regulatory authorities could initiate legal proceedings against us, and our business could be harmed.
Pursuant to Section 404 of the Sarbanes-Oxley Act of 2002, or Section 404, we will be required to furnish a report by our management on our internal control over financial reporting and our independent registered public accounting firm will be required to audit our internal control over financial reporting. To achieve compliance with Section 404 and other applicable requirements within the prescribed period, we will be engaged in a process to document and evaluate our internal control over financial reporting, which is both costly and challenging. In this regard, we will need to continue to dedicate internal resources, including through hiring additional financial and accounting personnel, potentially engage outside consultants and adopt a detailed work plan to assess and document the adequacy of internal control over financial reporting, continue steps to improve control processes as appropriate, validate through testing that controls are functioning as documented and implement a continuous reporting and improvement process for internal control over financial reporting. Despite our efforts, there is a risk that we will not be able to conclude, within the prescribed time frame or at all, that our internal control over financial reporting is effective as required by Section 404 and other applicable requirements. In addition to the material weaknesses in internal control over financial reporting identified in the preparation of our financial statements to be filed with the SEC and the Canadian securities regulatory authorities, if we identify one or more additional material weaknesses in our internal control over financial reporting, it could result in an adverse reaction in the financial markets due to a loss of confidence in the reliability of our financial statements.
We identified certain material weaknesses in our internal control over financial reporting in the preparation of our financial statements to be filed with the SEC and the Canadian securities regulatory authorities, and we may identify additional material weaknesses in the future that may cause us to fail to meet our reporting obligations or result in material misstatements of our financial statements. If we fail to remediate any material weaknesses or if we otherwise fail to establish and maintain effective internal control over financial reporting, our ability to accurately and timely report our financial results could be adversely affected.
As a private company, we are not currently required to comply with the rules of the SEC implementing Section 404 of the Sarbanes-Oxley Act of 2002 and are therefore not required to make a formal assessment of the effectiveness of our internal control over financial reporting for that purpose. Upon becoming a public company, we will be required to comply with the SEC’s rules implementing Sections 302 and 404 of the Sarbanes-Oxley Act of 2002 in the United States and National Instrument 52-109—Certification of Disclosure in Issuers’ Annual and Interim Filings (“NI 52-109”) in Canada, which will require management to certify financial and other information in our quarterly and annual reports and provide an annual management report on the effectiveness of control over financial reporting. Though we will be required to disclose changes made in our internal controls and procedures on a quarterly basis, we will not be required to make our first annual assessment of our internal control over financial reporting pursuant to Section 404 until the year following our first annual report required to be filed with the SEC and the Canadian securities regulatory authorities. If our internal control over financial reporting is not effective, our independent registered public accounting firm may issue an adverse report.
In connection with the preparation of our financial statements to be filed with the SEC and the Canadian securities regulatory authorities, we and our independent registered public accounting firm identified certain control deficiencies in the design and operation of our internal control over financial reporting that in aggregate constituted material weaknesses. A material weakness is a deficiency, or a combination of deficiencies, in internal control over financial reporting such that there is a reasonable possibility that a material misstatement of our financial statements will not be prevented or detected on a timely basis. These material weaknesses relate to the financial reporting close process and information technology general controls, more specifically insufficient review of manual journal entries, lack of formalization of the reconciliations and analysis of certain key accounts and insufficient controls around system user access (including potential consequential segregation of duties issues) and change management.
As part of our plan to remediate these material weaknesses, we (i) have strengthened our compliance and accounting functions with additional experienced hires to assist in our design and implementation of controls; (ii) are developing and enhancing our company-wide policies and procedures, including those related to access management,
52
Table of Contents
change management, journal entries and account review controls and documentation requirements; (iii) are supporting our financial reporting teams in the implementation of such policies and procedures, including delivering additional training to our team members on internal controls over financial reporting; and (iv) are engaging our external advisor to assist us with further evaluating the design of our internal controls and assisting with remediation. We cannot assure you that the measures that we have taken, and that will be taken, to remediate these material weaknesses will, in fact, remedy such material weaknesses or will be sufficient to prevent future material weaknesses from occurring. We also cannot assure you that we have identified all of our existing material weaknesses.
In light of the control deficiencies and the resulting material weaknesses that were identified, we believe that it is possible that, had we and our independent registered public accounting firm performed an assessment or audit, respectively, of our internal control over financial reporting in accordance with the provisions of the Sarbanes-Oxley Act of 2002, additional material weaknesses may have been identified.
When evaluating our internal control over financial reporting, we may identify material weaknesses that we may not be able to remediate in time to meet the applicable deadline imposed upon us for compliance with the requirements of Section 404. If we are unable to remediate our existing material weaknesses or identify additional material weaknesses and are unable to comply with the requirements of Section 404 in a timely manner or assert that our internal control over financial reporting is effective, or if our independent registered public accounting firm expresses an adverse opinion on the effectiveness of our internal control over financial reporting, investors may lose confidence in the accuracy and completeness of our financial reports and the market price of our common shares could be negatively affected, and we could become subject to investigations by the stock exchanges on which our securities are listed, the SEC or other regulatory authorities, including Canadian regulatory authorities, which could require additional financial and management resources.
If we fail to maintain an effective system of internal control over financial reporting, we may not be able to accurately report our financial results or prevent fraud. As a result, shareholders could lose confidence in our financial and other public reporting, which would harm our business and the trading price of our common shares.
Effective internal control over financial reporting is necessary for us to provide reliable financial reports and, together with adequate disclosure controls and procedures, is designed to prevent fraud. Any failure to implement required new or improved controls, or difficulties encountered in their implementation could cause us to fail to meet our reporting obligations. In addition to the material weaknesses in internal control over financial reporting identified in connection with the preparation of our financial statements to be filed with the SEC and the Canadian securities regulatory authorities, any testing by us conducted in connection with Section 404 of the Sarbanes-Oxley Act of 2002 and other applicable requirements, or any subsequent testing by our independent registered public accounting firm, may reveal additional deficiencies in our internal control over financial reporting that are deemed to be material weaknesses or that may require prospective or retroactive changes to our financial statements or identify other areas for further attention or improvement. Inferior internal controls could also cause investors to lose confidence in our reported financial information, which could harm our business and have a negative effect on the trading price of our common shares. Failure to accurately report our financial performance on a timely basis could also jeopardize our continued listing on the NYSE, the TSX or any other exchange on which our common shares may be listed. Delisting of our common shares on any exchange would reduce the liquidity of the market for our common shares, which would reduce the price of and increase the volatility of the market price of our common shares.
We will be required to disclose changes made in our internal controls and procedures on a quarterly basis and our management will be required to assess the effectiveness of these controls annually. An independent assessment of the effectiveness of our internal control over financial reporting could detect problems that our management’s assessment might not. Undetected material weaknesses in our internal control over financial reporting could lead to financial statement restatements and require us to incur the expense of remediation, which could have a negative effect on the trading price of our common shares.
53
Table of Contents
Our disclosure controls and procedures may not prevent or detect all errors or acts of fraud.
Upon completion of this offering, we will become subject to certain reporting requirements of the Securities Exchange Act of 1934, as amended, or the Exchange Act, as well as of applicable Canadian securities laws. Our disclosure controls and procedures will be designed to reasonably assure that information required to be disclosed by us in reports we file or submit in accordance with U.S. and Canadian securities laws is accumulated and communicated to management, recorded, processed, summarized and reported within the time periods specified in the applicable rules and forms of the SEC and Canadian securities regulatory authorities. We believe that any disclosure controls and procedures or internal controls and procedures, no matter how well conceived and operated, can provide only reasonable, not absolute, assurance that the objectives of the control system are met. These inherent limitations include the realities that judgments in decision-making can be faulty, and that breakdowns can occur because of simple error or mistake. Additionally, controls can be circumvented by the individual acts of some persons, by collusion of two or more people or by an unauthorized override of the controls. Accordingly, because of the inherent limitations in our control system, misstatements or insufficient disclosures due to error or fraud may occur and not be detected.
If our estimates or judgments relating to our critical accounting policies prove to be incorrect, our operating results could be adversely affected.
The preparation of financial statements in conformity with GAAP requires management to make estimates and assumptions that affect the amounts reported in the consolidated financial statements and accompanying notes. We base our estimates on historical experience and on various other assumptions that we believe to be reasonable under the circumstances, as provided in “Management’s Discussion and Analysis of Financial Condition and Results of Operations—Critical Accounting Policies and Estimates.” The results of these estimates form the basis for making judgments about the carrying values of assets and liabilities, and the amount of revenue and expenses that are not readily apparent from other sources. Significant assumptions and estimates used in preparing our consolidated financial statements include those related to the determination of the fair value of intangible assets that arise as a result of business combinations, as well as the determination of useful lives and the subsequent testing of goodwill and intangible assets for impairment. As of July 31, 2021, the net carrying value of our goodwill and other intangibles totaled approximately $1.0 billion and $1.2 billion, respectively. In accordance with GAAP, we periodically assess these assets to determine if they are impaired. At the end of the second quarter of fiscal year 2021, we determined that a reduction in projected net operating cash flows primarily attributable to the COVID-19 pandemic and its impact on our color cosmetic business resulted in a reduction in the fair value of the HCT reporting unit requiring an impairment charge of $47.3 million and $0.9 million for goodwill and other intangibles, respectively. Significant negative industry or economic trends, disruptions to our business, inability to effectively integrate acquired businesses, unexpected significant changes or planned changes in use of our assets, changes in the structure of our business, market capitalization declines, or increases in associated discount rates may impair our goodwill and other intangible assets in the future. Any charges relating to such impairments would adversely affect our results of operations in the periods recognized.
Our operating results may be adversely affected if our assumptions change or if actual circumstances differ from those in our assumptions, which could cause our operating results to fall below the expectations of securities analysts and investors, resulting in a decline in the price of our common shares.
We are governed by the corporate laws of British Columbia, Canada, which in some cases have a different effect on the rights of shareholders than the corporate laws of the United States.
We are governed by the BCBCA and other relevant laws, which may affect the rights of shareholders differently than those of a company governed by the laws of a U.S. jurisdiction, and may, together with our articles, have the effect of delaying, deferring or discouraging another party from acquiring control of our company by means of a tender offer, a proxy contest or otherwise, or may affect the price an acquiring party would be willing to pay for our common shares. The material differences between the BCBCA and Delaware
54
Table of Contents
General Corporation Law, or DGCL, that may have the greatest such effect include, but are not limited to, the following: (i) for certain corporate transactions (such as amalgamations, arrangements or amendments to our articles) the BCBCA generally requires the voting threshold to be a special resolution approved by 66 2/3% of shareholders, or as set out in the articles, as applicable, whereas DGCL generally only requires a majority vote; and (ii) under the BCBCA holders of an aggregate of 5% or more of our common shares can requisition a special meeting of shareholders, whereas such right does not exist under the DGCL. We cannot predict whether investors will find our company and our common shares less attractive because of these material differences or because we are governed by the BCBCA. If some investors find our common shares less attractive as a result, there may be a less active trading market for our common shares and our share price may be more volatile. See “Description of Share Capital—Comparison of British Columbia Law and Delaware Law.”
Because we are a corporation incorporated in British Columbia and some of our directors and officers are resident in Canada, it may be difficult for investors in the United States to enforce civil liabilities against us based solely upon the federal securities laws of the United States. Similarly, it may be difficult for Canadian investors to enforce civil liabilities against our directors and officers residing outside Canada.
We are a corporation incorporated under the laws of British Columbia with our principal executive office in Québec, Canada. We also maintain a principal executive office in the United States, located in Saddle Brook, New Jersey. Some of our directors and officers and the auditors or other experts named herein are residents of Canada and all or a substantial portion of our assets and those of such persons are located outside the United States. Consequently, it may be difficult for U.S. investors to effect service of process within the United States upon us or our directors or officers or such auditors who are not residents of the United States, or to realize in the United States upon judgments of courts of the United States predicated upon civil liabilities under the Securities Act of 1933, as amended (the “Securities Act”). Investors should not assume that Canadian courts: (i) would enforce judgments of U.S. courts obtained in actions against us or such persons predicated upon the civil liability provisions of the U.S. federal securities laws or the securities or blue sky laws of any state within the United States or (ii) would enforce, in original actions, liabilities against us or such persons predicated upon the U.S. federal securities laws or any such state securities or blue sky laws.
Similarly, some of our directors and officers are residents of countries other than Canada and all or a substantial portion of the assets of such persons are located outside Canada. As a result, it may be difficult for Canadian investors to initiate a lawsuit within Canada against these non-Canadian residents. In addition, it may not be possible for Canadian investors to collect from these non-Canadian residents judgments obtained in courts in Canada predicated on the civil liability provisions of securities legislation of certain of the provinces and territories of Canada. It may also be difficult for Canadian investors to succeed in a lawsuit in the United States, based solely on violations of Canadian securities laws.
Provisions in our articles, Canadian law and certain restrictive covenants applicable to us could make an acquisition of us, which may be beneficial to our shareholders, more difficult and may prevent attempts by our shareholders to replace or remove our current management and/or limit the market price of our common shares.
Provisions in our articles that will become effective immediately prior to consummation of this offering, as well as certain provisions under the BCBCA and applicable Canadian laws may discourage, delay or prevent a merger, acquisition or other change in control of us that shareholders may consider favorable, including transactions in which they might otherwise receive a premium for their common shares.
For instance, our articles contain provisions that establish certain advance notice procedures for nomination of candidates for election as directors at shareholders’ meetings. See “Description of Share Capital—Certain Important Provisions of our Articles and the BCBCA.” In addition, certain approval or consultation rights will exist under the Shareholders’ Agreement with respect to material changes in the operations at the Québec-based facilities of the Company and the maintenance of the Company’s global headquarters in Québec. See “Certain Relationships and Related Party Transactions—Shareholders’ Agreement.”
55
Table of Contents
Limitations on the ability to acquire and hold our common shares may also be imposed by the Competition Act (Canada). This legislation permits the Commissioner of Competition, or Commissioner, to review any acquisition or establishment, directly or indirectly, including through the acquisition of shares, of control over or of a significant interest in us. Moreover, a non-Canadian must file an application for review with the Minister responsible for the Investment Canada Act and obtain approval of the Minister prior to acquiring control of a “Canadian business” within the meaning of the Investment Canada Act, where prescribed financial thresholds are exceeded. As a condition to the Acquisition, certain undertakings were given in respect of KDC Opco’s Canadian operations to Innovation, Science and Economic Development Canada, which undertakings expire on December 21, 2021. If such undertakings are not fulfilled, the Minister Responsible for the Investment Canada Act may apply to the court for an order directing compliance with such undertakings. See “Description of Share Capital—Ownership and Exchange Controls.”
Any of these provisions could limit the price that investors might be willing to pay in the future for our common shares, thereby depressing the market price of our common shares.
Knowlton Development Corporation, Inc. is a holding company with no operations of its own and, as such, it depends on its subsidiaries for cash to fund its expenses, including future dividend payments, if any.
As a holding company, our principal source of cash flow will be distributions from our operating subsidiaries, Therefore, our ability to fund and conduct our business, service our debt and pay dividends, if any, in the future will depend on the ability of our subsidiaries to generate sufficient cash flow to make upstream cash distributions to us. Our subsidiaries are separate legal entities, and although they are wholly owned and controlled by us, they have no obligation to make any funds available to us, whether in the form of loans, dividends or otherwise. The ability of our subsidiaries to distribute cash to us will also be subject to, among other things, restrictions that are contained in agreements, availability of sufficient funds in such subsidiaries and applicable laws and regulatory restrictions. Claims of any creditors of our subsidiaries generally will have priority as to the assets of such subsidiaries over our claims and claims of our creditors and shareholders. To the extent the ability of our subsidiaries to distribute dividends or other payments to us is limited in any way, our ability to fund and conduct our business, service our debt and pay dividends, if any, could be harmed.
Our articles will provide that any derivative actions, actions relating to breach of fiduciary duties and other matters relating to our internal affairs will be required to be litigated in Canada, and will contain an exclusive federal forum provision for certain claims under the Securities Act and the Exchange Act, which could limit your ability to obtain a favorable judicial forum for disputes with us.
Our articles that will become effective immediately prior to consummation of this offering will include a forum selection provision that provides that, unless we consent in writing to the selection of an alternative forum, the Supreme Court of British Columbia, Canada and the appellate courts therefrom, will be the sole and exclusive forum for (i) any derivative action or proceeding brought on our behalf; (ii) any action or proceeding asserting a claim of breach of a fiduciary duty owed by any of our directors, officers, or other employees to us; (iii) any action or proceeding asserting a claim arising pursuant to any provision of the BCBCA or our articles (as either may be amended from time to time); or (iv) any action or proceeding asserting a claim otherwise related to the relationships among us, our affiliates and their respective shareholders, directors and/or officers, but excluding claims related to our business or such affiliates. The forum selection provision also provides that our securityholders are deemed to have consented to personal jurisdiction in the Province of British Columbia and to service of process on their counsel in any foreign action initiated in violation of the foregoing provisions. See “Description of Share Capital—Certain Important Provisions of our Articles and the BCBCA—Forum Selection.” The forum selection provision may impose additional litigation costs on shareholders in pursuing any such claims. Additionally, the forum selection provision may limit our shareholders’ ability to bring a claim in a judicial forum that they find favorable for disputes with us or our directors, officers or employees, which may discourage the filing of lawsuits against us and our directors, officers and employees, even though an action, if
56
Table of Contents
successful, might benefit our shareholders. The courts of the Province of British Columbia may also reach different judgments or results than would other courts, including courts where a shareholder considering an action may be located or would otherwise choose to bring the action, and such judgments may be more or less favorable to us than to our shareholders.
For claims brought under the Securities Act, Section 22 of the Securities Act creates concurrent jurisdiction for federal and state courts over all claims brought to enforce any duty or liability created by the Securities Act or the rules and regulations thereunder and our articles will provide that the federal district courts of the United States of America will, to the fullest extent permitted by law, be the sole and exclusive forum for resolving any complaint asserting a cause of action arising under the Securities Act (the “Federal Forum Provision”). Application of our Federal Forum Provision means that suits brought by our shareholders to enforce any duty or liability created by the Securities Act must be brought in federal court and cannot be brought in state court.
Section 27 of the Exchange Act creates exclusive federal jurisdiction over all claims brought to enforce any duty or liability created by the Exchange Act or the rules and regulations thereunder. Accordingly, actions by our shareholders to enforce any duty or liability created by the Exchange Act or the rules and regulations thereunder must be brought in federal court and our articles will provide that the federal district courts of the United States will, to the fullest extent permitted by law, be the sole and exclusive forum for resolving any complaint asserting a cause of action under the Exchange Act. Our shareholders will not be deemed to have waived our compliance with the federal securities laws and the regulations promulgated thereunder.
The Federal Forum Provision is intended to apply to the fullest extent permitted by law. However, the enforceability of forum selection provisions in the governing documents of other companies has been challenged in legal proceedings, and it is possible that a court could find the Federal Forum Provision to be inapplicable or unenforceable with respect to actions arising under the Securities Act.
Any person or entity purchasing or otherwise acquiring or holding any interest in any of our common shares shall be deemed to have notice of and consented to our forum selection provisions, including the Federal Forum Provision. Additionally, our shareholders cannot waive compliance with the federal securities laws and the rules and regulations thereunder. These provisions may limit our shareholders’ ability to bring a claim in a judicial forum they find favorable for disputes with us or our directors, officers, or other employees, which may discourage lawsuits against us and our directors, officers, and other employees. Alternatively, if a court were to find the choice of forum provision contained in our articles to be inapplicable or unenforceable in an action, we may incur additional costs associated with resolving such action in other jurisdictions, which could harm our business, operating results and financial condition. See “Description of Share Capital—Certain Important Provisions of our Articles and the BCBCA—Forum Selection.”
Our articles will permit us to issue an unlimited number of common shares and preferred shares without seeking approval of the holders of common shares.
Our articles permit us to issue an unlimited number of common shares. We anticipate that we will, from time to time, issue additional common shares in the future. Subject to the requirements of the BCBCA, the NYSE and the TSX, we will not be required to obtain the approval of shareholders for the issuance of additional common shares. Any further issuances of common shares will result in immediate dilution to existing shareholders and may have an adverse effect on the value of their shareholdings.
Our articles that will become effective immediately prior to consummation of this offering will also permit us to issue an unlimited number of preferred shares, issuable in series and, subject to the requirements of the BCBCA, having such designations, rights, privileges, restrictions and conditions, including dividend and voting rights, as our board of directors may determine and which may be superior to those of the common shares. The issuance of preferred shares could, among other things, have the effect of delaying, deferring or preventing a change in control of the Company and might adversely affect the market price of our common shares. We have
57
Table of Contents
no current or immediate plans to issue any preferred shares following the consummation of this offering. Subject to the provisions of the BCBCA and the rules of the NYSE and the TSX, we will not be required to obtain the approval of the holders of common shares for the issuance of preferred shares or to determine the maximum number of shares of each series of preferred shares, create an identifying name for each series and attach such special rights or restrictions as our board of directors may determine. See “Description of Share Capital—Authorized Share Capital—Preferred Shares.”
58
Table of Contents
CAUTIONARY NOTE REGARDING FORWARD-LOOKING STATEMENTS
We have made statements under the captions “Prospectus Summary,” “Risk Factors,” “Management’s Discussion and Analysis of Financial Condition and Results of Operations,” “Business” and in other sections of this prospectus that are forward-looking statements. Forward-looking statements are neither historical facts nor assurances of future performance. Instead, they are based on our current beliefs, expectations and assumptions regarding the future of our business, future plans and strategies, and other future conditions. In some cases, you can identify these statements by forward-looking words such as “may,” “might,” “will,” “should,” “expects,” “plans,” “anticipates,” “believes,” “estimates,” “predicts,” “potential” or “continue,” the negative of these terms and other comparable terminology. These forward-looking statements, which are subject to risks, uncertainties and assumptions about us, may include projections of our future financial performance, our anticipated growth strategies and anticipated trends in our business. Forward-looking statements contained in this prospectus include, among other things, statements relating to:
| • | strategy, outlook and growth prospects, including plans for potential acquisitions and expansion to new markets and new products; |
| • | the economic, operational and financial impacts of the COVID-19 pandemic; |
| • | expectations for industry trends and the size and growth rates of addressable markets; |
| • | changes in consumer preferences; |
| • | operational and financial targets; |
| • | impact of government regulations and judicial decisions affecting products we produce or the products contained in the products we produce; and |
| • | the competitive environment in which we operate. |
These statements are only predictions based on our current expectations and projections about future events. There are important factors that could cause our actual results, level of activity, performance or achievements to differ materially from the results, level of activity, performance or achievements expressed or implied by the forward-looking statements, including those factors discussed under the caption entitled “Risk Factors.” In addition, even if results, level of activity, performance or achievements are consistent with the forward-looking statements contained in this prospectus, those results, level of activity, performance or achievements may not be indicative of results or developments in subsequent periods. Although we believe the expectations reflected in the forward-looking statements are reasonable, we cannot guarantee future results, level of activity, performance or achievements. Certain assumptions made in preparing the forward-looking statements contained in this prospectus include:
| • | our ability to implement our growth strategies; |
| • | our ability to maintain good business relationships with our suppliers and distributors; |
| • | the timing for recovery from the COVID-19 pandemic; |
| • | our ability to keep pace with changing consumer preferences; |
| • | our ability to protect our intellectual property; and |
| • | the absence of material adverse changes in our industry or the global economy. |
By their nature, forward-looking statements involve risks and uncertainties because they relate to events and depend on circumstances that may or may not occur in the future. We believe that these risks and uncertainties include, but are not limited to, the factors discussed under the caption entitled “Risk Factors,” which include, but are not limited to, the following risks:
| • | our business is highly competitive, and if we are unable to compete effectively our revenues and results of operations will suffer; |
59
Table of Contents
| • | we may not successfully develop, innovate, introduce or acquire new technologies, products and solutions that meet our customers’ needs, which may cause us to fail to attract new customers or sell new products to existing customers, which may in turn adversely affect our results of operations; |
| • | rapid changes in market trends and consumer preferences could adversely affect our financial results; |
| • | we rely on our customers’ desire for outsourcing the ideation, formulation, design, packaging and manufacturing processes, and if our customers were to reduce their dependence on such outsourcing or if we are not able to otherwise successfully maintain our customer relationships, our revenues and results of operations would be adversely affected; |
| • | we may not be able to pursue our growth strategy through acquisitions, and the failure to successfully complete and integrate acquisitions could adversely affect our growth; |
| • | failure to realize anticipated synergies of recent and future acquisitions or restructurings may adversely affect our revenues and results of operations; |
| • | a significant portion of our revenue comes from a limited number of customers, the loss of which would have a material adverse effect on our business, financial condition and results of operations; |
| • | we have a history of net losses and there is no guarantee that we will achieve profitability in the short-term; |
| • | we are subject to risks related to our international operations; |
| • | as we expand our business in the Asia Pacific region, and in particular in China, the economic, political and social conditions, as well as changes in any government policies, laws and regulations, could adversely affect our business; |
| • | interruptions and delays in manufacturing operations, including volatility and increases in the price of raw materials and energy and transportation, could adversely affect our business, revenues and reputation; |
| • | our revenue and operating income fluctuate on a seasonal basis; |
| • | we rely on complex machinery for our operations, and production involves a significant degree of risk and uncertainty in terms of operational performance and costs; |
| • | product reliability, safety and effectiveness concerns can have significant negative impacts on sales and results of operations, lead to litigation and cause reputational damage; |
| • | we are subject to risks associated with leasing and occupying real property and the inability to extend, renew or continue to lease real property in key locations, could harm our business, profitability and results of operations; |
| • | natural disasters, public health crises (such as the ongoing COVID-19 outbreak), international conflicts, terrorist acts, labor strikes, political crisis, accidents and other events could adversely affect our business and financial results by disrupting development, manufacturing or sale of our products; |
| • | our success depends on attracting and retaining talented people; significant shortfalls in recruitment or retention could adversely affect our ability to compete and achieve our strategic goals; |
| • | we rely on third-party suppliers in procuring materials for our customers and otherwise conducting our business and operations, and their failure to perform to our standards or in a timely manner could adversely affect our reputation, business, and financial results; |
| • | if we are unable to comply with regulatory requirements and industry standards, including those regarding product safety, quality, efficacy and environmental impact, we could incur significant costs and suffer reputational harm which could adversely affect results of operations; |
60
Table of Contents
| • | we incur substantial costs to comply with environmental protection and health and safety laws, and failure to comply with these laws may cause us to close, relocate or operate one or more of our plants at reduced production levels, and expose us to civil or criminal liability or other costs, which could adversely affect our operating results and future growth; changes to environmental laws could increase our costs of doing business; |
| • | our collection, use, storage, disclosure, transfer and other processing of personal information could give rise to significant costs and liabilities, including as a result of governmental regulation, conflicting legal requirements or differing views of personal privacy rights; |
| • | breaches or failures of our information technology systems or website security, the theft, unauthorized access, acquisition, use, disclosure, modification or misappropriation of personal information, the occurrence of fraudulent activity, or other cybersecurity or data security-related incidents may have an adverse impact on our business, financial condition, results of operations and prospects; |
| • | we do not own the intellectual property of all of the formulas or technical specifications of products that we manufacture, and if we are unable to protect the confidentiality of customer trade secrets, know-how and other proprietary and internally developed information, we may not be able to maintain customer relationships and our business may be adversely affected; |
| • | third parties may initiate legal proceedings alleging that we are infringing, misappropriating or otherwise violating their intellectual property rights, the outcome of which would be uncertain and could have a material adverse effect on our business, financial condition and results of operations; |
| • | insiders will continue to have substantial control over us after this offering and could limit your ability to influence the outcome of key transactions, including a change of control; and |
| • | we are governed by the corporate laws of British Columbia, Canada, which in some cases have a different effect on the rights of shareholders than the corporate laws of the United States. |
These factors should not be construed as exhaustive and should be read with the other cautionary statements in this prospectus. Although we have attempted to identify important risk factors, there may be other risk factors not presently known to us or that we presently believe are not material that could also cause actual results, level of activity, performance or achievements to differ materially from those made in or suggested by the forward-looking statements contained in this prospectus. If any of these risks materialize, or if any of the above assumptions underlying forward-looking statements prove incorrect, actual results, level of activity, performance or achievements may differ materially from those made in or suggested by the forward-looking statements contained in this prospectus.
Given these risks and uncertainties, you are cautioned not to place substantial weight or undue reliance on these forward-looking statements when making an investment decision. Moreover, neither we nor any other person assumes responsibility for the accuracy and completeness of any of these forward-looking statements. Except as required by law, we are under no duty to update any of these forward-looking statements after the date of this prospectus to conform our prior statements to actual results or revised expectations. You should, however, review the factors and risks we describe in the reports we will file from time to time with the SEC and the Canadian securities regulatory authorities, after the date of this prospectus. See “Where You Can Find More Information.”
Any references to forward-looking statements in this prospectus include forward-looking information within the meaning of applicable Canadian securities laws.
61
Table of Contents
We estimate that our net proceeds from this offering will be approximately $758.0 million, after deducting underwriting discounts and commissions but before deducting estimated offering expenses. This estimate is based on an assumed initial offering price of $14.00 per share (the midpoint of the estimated initial public offering price range set forth on the cover page of this prospectus) and assumes that the underwriters’ option to purchase additional shares from us is not exercised. If the underwriters exercise their option to purchase additional shares from us in full, we expect to receive approximately $871.7 million of net proceeds based on an assumed initial offering price of $14.00 per share (the midpoint of the estimated initial public offering price range set forth on the cover page of this prospectus).
We estimate that the offering expenses (other than the underwriting discount and commissions) will be approximately $13.0 million.
We will use the net proceeds from this offering (i) to pay offering expenses (a portion of which we have already prepaid), (ii) to repay all of our outstanding borrowings under the Revolving Facility and (iii) any remaining net proceeds to repay outstanding borrowings under the Euro Term Loan. To the extent we receive sufficient net proceeds to repay the Euro Term Loan in full, we intend to use any remaining net proceeds for general corporate purposes.
The Revolving Facility and the Euro Term Loan mature on December 21, 2023 and December 21, 2025, respectively. The Revolving Facility was drawn upon, including in connection with the 2021 Revolver Increase, to finance the Distribution Financing Transactions and related fees, as well as for ordinary course working capital purposes and other general corporate purposes. The Euro Term Loan, including the 2021 Term Loan Increase, was entered into to finance the Distribution Financing Transactions and to pay fees and expenses incurred in connection therewith, to fund the acquisition of Zobele and a portion of the acquisition of HCT Metals and to repay outstanding indebtedness. Borrowings under the Revolving Facility are based on a fluctuating rate of interest determined with reference to the applicable base rate plus applicable margin. Borrowings under the Euro Term Loan bear interest at a rate equal to Euribor for the relevant interest period plus 5%. See “Management’s Discussion and Analysis of Financial Condition and Results of Operations—Liquidity and Capital Resources—Distribution Financing Transactions” and “Description of Certain Indebtedness.”
A $1.00 increase (decrease) in the assumed initial public offering price of $14.00 per share (the midpoint of the estimated initial public offering price range set forth on the cover page of this prospectus) would increase (decrease) the amount of proceeds to us from this offering available by approximately $54.1 million, assuming the number of shares offered by us, as set forth on the cover page of this prospectus, remains the same, and after deducting the estimated underwriting discounts and commissions.
62
Table of Contents
Following the consummation of this offering, we do not currently intend to pay dividends on our common shares. We currently intend to retain any future earnings to fund the development and expansion of our business, including further acquisitions, and, therefore, we do not anticipate paying dividends on our common shares in the foreseeable future. Any future determination to pay dividends will be at the discretion of our board of directors, subject to applicable laws, and will depend on our results of operations, financial condition, capital requirements, contractual restrictions and other factors deemed relevant by our board of directors. Our future ability to pay dividends on our common shares is currently limited by the terms of our Credit Agreement and may be limited by the terms of any future debt or preferred securities. Other than in connection with the Distribution Financing Transactions, which involved a return of capital of $232.65 per Class A and Class B common shares of the Company, totaling $318.5 million, paid out on February 3, 2021, we did not declare or pay any cash dividends or distributions during the three most recently completed fiscal years and the current fiscal year. See “Management’s Discussion and Analysis of Financial Condition and Results of Operations—Liquidity and Capital Resources—Distribution Financing Transactions” and “Description of Certain Indebtedness.”
63
Table of Contents
The following table sets forth our cash and cash equivalents and capitalization as of July 31, 2021:
| • | on an actual basis; |
| • | on an as adjusted basis to reflect the Share Capital Amendments; and |
| • | on an as further adjusted basis to reflect the sale by us of 57,142,857 common shares in this offering and the application of the net proceeds from this offering as described in “Use of Proceeds” and based on an assumed initial public offering price of $14.00 per share (the midpoint of the range set forth on the cover page of this prospectus). |
This table should be read in conjunction with “Use of Proceeds,” “Selected Consolidated Financial Data,” “Management’s Discussion and Analysis of Financial Condition and Results of Operations,” “Description of Share Capital” and the financial statements and notes thereto appearing elsewhere in this prospectus.
| July 31, 2021 | ||||||||||||
| Actual | As Adjusted | As Further Adjusted |
||||||||||
| Cash and cash equivalents |
$ | 96.2 | $ | 96.2 | $ | 96.2 | ||||||
|
|
|
|
|
|
|
|||||||
| Long-term debt(1) |
$ | 1,784.0 | $ | 1,784.0 | $ | 1,048.3 | ||||||
| Revolving Facility(2) |
253.5 | 253.5 | — | |||||||||
| Term Loans |
1,519.4 | 1,519.4 | 1,037.2 | |||||||||
| USD Term Loans |
883.5 | 883.5 | 883.5 | |||||||||
| Euro Term Loans |
635.9 | 635.9 | 153.7 | |||||||||
| Finance leases and other borrowings |
11.1 | 11.1 | 11.1 | |||||||||
| Class A common shares, no par value; unlimited shares authorized, 1,353,183 shares outstanding at July 31, 2021, actual; 0 shares outstanding, as adjusted; 0 shares outstanding, as further adjusted |
1,129.2 | — | — | |||||||||
| Class B common shares, no par value; unlimited shares authorized, 16,541 shares outstanding at July 31, 2021, actual; 0 shares outstanding, as adjusted; 0 shares outstanding, as further adjusted |
13.9 | — | — | |||||||||
| Common shares, no par value; unlimited shares authorized, 0 shares outstanding at July 31, 2021, actual; 157,518,260 shares outstanding, as adjusted; 214,661,117 shares outstanding, as further adjusted(3) |
— | 1,143.1 | 1,902.7 | |||||||||
| Shares to be issued(4) |
1.1 | 1.1 | 1.1 | |||||||||
| Additional paid-in capital |
6.3 | 6.3 | 6.3 | |||||||||
| Accumulated deficit |
(229.7 | ) | (229.7 | ) | (242.9 | ) | ||||||
| Accumulated other comprehensive income |
6.2 | 6.2 | 6.2 | |||||||||
|
|
|
|
|
|
|
|||||||
| Total shareholders’ equity |
$ | 927.0 | $ | 927.0 | $ | 1,673.4 | ||||||
|
|
|
|
|
|
|
|||||||
| Total capitalization |
$ | 2,711.0 | $ | 2,711.0 | $ | 2,721.7 | ||||||
|
|
|
|
|
|
|
|||||||
| (1) | Long-term debt is net of debt transaction costs and debt issuance discounts of $49.6 million actual and as adjusted, and $31.7 million as further adjusted. Debt transaction costs and debt issuance discounts written off were $17.9 million or $13.2 million, net of tax as further adjusted. Long-term debt includes the current and long-term portions. Operating lease liabilities are excluded from the Company’s long-term debt. |
| (2) | As of the date of this prospectus, the borrowings under the Revolving Facility are $263.5 million (all of which we expect to repay with the proceeds of this offering) and we had $89.1 million of unused capacity under our Revolving Facility. |
| (3) | Includes $30.9 million and $9.6 million of underwriting discounts and commissions and estimated offering expenses payable by us, net of deferred tax effects, respectively. |
| (4) | Shares to be issued include consideration in the form of 703 Class B common shares (or 80,845 common shares, as a result of completion of the Share Capital Amendments) that the Company has the obligation to issue in connection with the acquisition of Paristy. |
64
Table of Contents
If you invest in our common shares, you will experience dilution to the extent of the difference between the initial public offering price per common share and the as further adjusted net tangible book value per common share after this offering. Dilution results from the fact that the per share initial public offering price of our common shares is substantially in excess of the as further adjusted net tangible book value per share attributable to the existing shareholders for our presently outstanding common shares.
Our as adjusted net tangible book value as of July 31, 2021 would have been approximately $(1,235.3) million, or $(7.84) per common share. As adjusted net tangible book value represents the amount of total tangible assets less total liabilities, and as adjusted net tangible book value per share represents as adjusted net tangible book value divided by the number of common shares outstanding as of July 31, 2021, both after giving effect to the Share Capital Amendments.
After giving effect to the sale of 57,142,857 common shares by us in this offering at the assumed initial public offering price of $14.00 per share (the midpoint of the estimated initial price range on the cover page of this prospectus) and the use of the net proceeds from this offering, our as further adjusted net tangible book value would have been approximately $(480.3) million, or $(2.24) per share, representing an immediate increase in as further adjusted net tangible book value of $5.60 per share to existing shareholders and an immediate dilution in as further adjusted net tangible book value of $16.24 per share to new investors.
The following table illustrates the per share dilution:
| Assumed initial public offering price per common share |
$ | 14.00 | ||
| As adjusted net tangible book value per common share as of July 31, 2021 |
(7.84 | ) | ||
| Increase in as adjusted net tangible book value per common share attributable to new investors |
5.60 | |||
|
|
|
|||
| As further adjusted net tangible book value per common share after this offering |
(2.24 | ) | ||
|
|
|
|||
| Dilution in as further adjusted net tangible book value per common share to new investors |
$ | 16.24 | ||
|
|
|
Dilution is determined by adding the negative as further adjusted net tangible book value per common share after this offering from the initial public offering price per common share.
A $1.00 increase (decrease) in the assumed initial public offering price of $14.00 per share would increase (decrease) the dilution per share to new investors by $0.75, in each case assuming the number of shares offered, as set forth on the cover page of this prospectus, remains the same.
To the extent the underwriters’ option to purchase additional common shares from us is exercised, there will be further dilution to new investors.
The following table illustrates, as of July 31, 2021, after giving effect to the sale by us of our common shares in this offering at the initial public offering price of $14.00 per share (the midpoint of the estimated initial public offering price range set forth on the cover page of this prospectus), the difference between the existing shareholders, and the investors purchasing common shares in this offering with respect to the number of our common shares purchased from us, the total consideration paid or to be paid to us, and the average price per share paid or to be paid to us, before deducting underwriting discounts and commissions and the estimated offering expenses payable by us:
| Shares purchased | Total consideration | Average price | ||||||||||||||||||
| Number | Percent | Amount | Percent | Per share | ||||||||||||||||
| Existing shareholders(1) |
157,518,260 | 73.4 | % | $ | 1,461,600,000 | 64.6 | % | $ | 9.28 | |||||||||||
| Investors purchasing common shares in this offering |
57,142,857 | 26.6 | 799,999,998 | 35.4 | 14.00 | |||||||||||||||
|
|
|
|
|
|
|
|
|
|
|
|||||||||||
| Total |
214,661,117 | 100.0 | % | $ | 2,261,599,998 | 100.0 | % | $ | 10.54 | |||||||||||
|
|
|
|
|
|
|
|
|
|||||||||||||
| (1) | Does not give effect to the returns of capital, totaling $318.5 million in the aggregate, that were effected pursuant to the Distribution Financing Transactions. |
65
Table of Contents
To the extent any of the outstanding options described below are exercised, investors will experience further dilution. Assuming the exercise of all of our outstanding options as of July 31, 2021, the number of common shares held by the existing shareholders would be increased to 171,682,465 total common shares and 75.0% of the total number of common shares to be outstanding after this offering, and the number of common shares held by investors participating in this offering remain unchanged and would be reduced to 25.0% of the total number of common shares to be outstanding after this offering. Additionally, the cash consideration paid to us by existing shareholders would be $1,583.8 million, or approximately 66.4% of the total cash consideration, and the cash consideration paid to us by new investors purchasing shares in this offering would remain $800.0 million, or approximately 33.6% of the total cash consideration. The average price per share paid to us by existing shareholders would be $9.22 and the average price per share paid to us by new investors would remain unchanged.
We may choose to raise additional capital due to market conditions or strategic considerations even if we believe we have sufficient funds for our current or future operating plans. To the extent additional capital is raised through the sale of equity or convertible debt securities, the issuance of these securities could result in further dilution to holders of our common shares.
Unless otherwise noted, the information above is based on 214,661,117 common shares outstanding as of July 31, 2021, after giving effect to the Share Capital Amendments and including the common shares to be issued in this offering, and excludes:
| • | 8,571,428 common shares issuable if the underwriters exercise their option to purchase additional common shares from us; |
| • | up to 21,466,112 common shares reserved for issuance under our Omnibus Plan, which will become effective immediately prior to or upon the consummation of this offering, including 1,836,446 common shares issuable thereunder in respect of the IPO equity awards assuming an initial public offering price of $14.00 per share (the midpoint of the estimated initial public offering price range set forth on the cover page of this prospectus) and a Black–Scholes factor of 0.4. See “Executive and Director Compensation—Description of Equity Incentive Plans—Omnibus Plan” for more information regarding our Omnibus Plan and “Executive and Director Compensation—Elements of Compensation—IPO Equity Awards” for more information regarding the IPO equity awards to be made to our named executive officers; |
| • | up to 14,164,205 common shares issuable upon the exercise of equity share option awards previously issued to certain of our executive officers under our Stock Option Plan; and |
| • | up to 80,845 common shares issuable as deferred consideration in connection with the Paristy acquisition. |
To the extent that any outstanding options are exercised under our Stock Option Plan or new awards are exercised for shares under our Omnibus Plan, there will be further dilution to investors participating in this offering. Effective as at March 30, 2021, we ceased granting new awards under our Stock Option Plan.
66
Table of Contents
SELECTED CONSOLIDATED FINANCIAL DATA
The following tables present the summary historical and combined consolidated financial data for the Company.
The statements of operations data for the fiscal years ended April 30, 2021 and 2020 and for the periods from November 30, 2018 through April 30, 2019 and from May 1, 2018 through December 20, 2018, and balance sheet data as of April 30, 2021 and 2020 have been derived from the consolidated audited financial statements of the Company included elsewhere in this prospectus.
The Combined 2019 Financial Information has been derived from the unaudited combined year ended April 30, 2019 presented herein, which combines the Successor Period from November 30, 2018 through April 30, 2019 and the Predecessor Period from May 1, 2018 through December 20, 2018. These unaudited combined results of operations disclosures are not impacted by, nor adjusted for, the impact from the completion of this offering, the Share Capital Amendments, the issuance of common shares in this offering and the use of the proceeds from this offering as described in the section entitled “Use of Proceeds.”
The statements of operations data for the three months ended July 31, 2021 and 2020 and balance sheet data as of July 31, 2021 have been derived from the consolidated unaudited financial statements of the Company included elsewhere in this prospectus. The consolidated unaudited financial statements have been prepared on the same basis as our audited consolidated financial statements and reflect all adjustments of a normal recurring nature which, in the opinion of our management, are necessary for a fair statement of the results for the interim periods presented. The results for any interim period are not necessarily indicative of the results that may be expected for the full year. Our historical results are not necessarily indicative of the results expected for any future period.
67
Table of Contents
The selected consolidated financial presented below do not purport to be indicative of the results that can be expected for any future period and should be read together with “Financial Statement Presentation,” “Capitalization,” “Prospectus Summary—Summary Consolidated Financial and Other Data,” “Supplemental Financial Information,” “Management’s Discussion and Analysis of Financial Condition and Results of Operations” and our financial statements and related notes thereto included elsewhere in this prospectus.
| Successor Period | Predecessor Period |
Combined 2019 Financial Information(1) |
||||||||||||||||||||||||||
| Three Months Ended July 31, 2021 |
Three Months Ended July 31, 2020 |
Year Ended April 30, 2021 |
Year Ended April 30, 2020 |
November 30, 2018 through April 30, 2019 |
May 1, 2018 through December 20, 2018 |
|||||||||||||||||||||||
| (in millions, except shares and per share amounts) | ||||||||||||||||||||||||||||
| Statements of Operations Data |
||||||||||||||||||||||||||||
| Revenue |
$ | 603.4 | $ | 482.4 | $ | 2,143.8 | $ | 1,093.4 | $ | 369.8 | $ | 632.8 | $ | 1,002.6 | ||||||||||||||
| Cost of revenue |
520.9 | 400.4 | 1,817.7 | 944.6 | 320.4 | 546.4 | 872.5 | |||||||||||||||||||||
|
|
|
|
|
|
|
|
|
|
|
|
|
|
|
|||||||||||||||
| Gross profit |
82.5 | 82.0 | 326.1 | 148.8 | 49.4 | 86.4 | 130.1 | |||||||||||||||||||||
| Operating expenses |
||||||||||||||||||||||||||||
| Selling, general and administrative expenses |
73.6 | 64.1 | 286.8 | 135.3 | 34.9 | 69.7 | 110.1 | |||||||||||||||||||||
| Acquisition-related costs and other expenses |
4.7 | 2.3 | 40.1 | 59.7 | 9.4 | 25.9 | 35.3 | |||||||||||||||||||||
| Impairment loss on goodwill and other intangible |
— | — | |
48.2 |
|
— | — | — | — | |||||||||||||||||||
|
|
|
|
|
|
|
|
|
|
|
|
|
|
|
|||||||||||||||
| Operating income (loss) |
4.2 | 15.6 | (49.0 | ) | (46.2 | ) | 5.1 | (9.2 | ) | (15.3 | ) | |||||||||||||||||
| Interest expense |
22.8 | 17.3 | 78.2 | 47.4 | 14.4 | 13.3 | 43.2 | |||||||||||||||||||||
| Other expense (income), net |
(3.1 | ) | 3.1 | 11.7 | 2.4 | 0.5 | 1.1 | 1.6 | ||||||||||||||||||||
|
|
|
|
|
|
|
|
|
|
|
|
|
|
|
|||||||||||||||
| Loss before income taxes |
(15.5 | ) | (4.8 | ) | (138.9 | ) | (96.0 | ) | (9.8 | ) | (23.6 | ) | (60.1 | ) | ||||||||||||||
| Income tax benefit |
(2.8 | ) | (4.2 | ) | (13.1 | ) | (14.1 | ) | (0.5 | ) | (0.9 | ) | (8.8 | ) | ||||||||||||||
|
|
|
|
|
|
|
|
|
|
|
|
|
|
|
|||||||||||||||
| Net loss |
$ | (12.7 | ) | $ | (0.6 | ) | $ | (125.8 | ) | $ | (81.9 | ) | $ | (9.3 | ) | $ | (22.7 | ) | $ | (51.3 | ) | |||||||
|
|
|
|
|
|
|
|
|
|
|
|
|
|
|
|||||||||||||||
| Weighted-average shares outstanding—basic and diluted |
1,370,427 | 1,249,151 | 1,324,110 | 857,883 | 641,424 | 309,344,128 | ||||||||||||||||||||||
|
|
|
|
|
|
|
|
|
|
|
|
|
|||||||||||||||||
| Net loss per share—basic and diluted |
$ | (9.27 | ) | $ | (0.48 | ) | $ | (95.01 | ) | $ | (95.47 | ) | $ | (14.50 | ) | $ | (0.07 | ) | ||||||||||
|
|
|
|
|
|
|
|
|
|
|
|
|
|||||||||||||||||
|
Unaudited Pro Forma Data(2) |
||||||||||||||||||||||||||||
| Pro forma weighted-average shares outstanding—basic and diluted |
1,867,321 | 1,821,004 | ||||||||||||||||||||||||||
|
|
|
|
|
|||||||||||||||||||||||||
| Pro forma net loss per share—basic and diluted |
$ | (3.80 | ) | $ | (86.33 | ) | ||||||||||||||||||||||
|
|
|
|
|
|||||||||||||||||||||||||
| (1) | See “Supplemental Financial Information” for an explanation as to how the Combined 2019 Financial Information is calculated. |
| (2) | Calculated without giving effect to the subdivision of common shares as part of the Share Capital Amendments. See Note 1, Description of Business and Basis of Presentation and Note 22, Net Loss per Share to our audited consolidated financial statements for the year ended April 30, 2021 and Note 1, Basis of Presentation and Summary of Significant Accounting Policies and Note 17, Net Loss per Share to our unaudited consolidated financial statements for the three months ended July 31, 2021. |
| Successor Period | ||||||||||||
| As of July 31, 2021 |
As of April 30, 2021 |
As of April 30, 2020 |
||||||||||
| (in millions) | ||||||||||||
| Balance Sheet Data |
||||||||||||
| Total assets |
$ | 3,640.1 | $ | 3,574.1 | $ | 3,592.4 | ||||||
| Total liabilities |
$ | 2,713.1 | $ | 2,638.7 | $ | 2,372.7 | ||||||
| Total shareholders’ equity |
$ | 927.0 | $ | 935.4 | $ | 1,219.7 | ||||||
68
Table of Contents
SUPPLEMENTAL FINANCIAL INFORMATION
We believe this section provides additional information relevant to investors about our financial performance in a manner consistent with how management views our performance, which is to assess our results across periods in a comparable manner. The presentation of unaudited supplemental financial information is for informational purposes only, and the unaudited supplemental financial information does not constitute Article 11 pro forma financial information.
The unaudited supplemental combined financial information for the fiscal year ended April 30, 2019 (the “Combined 2019 Financial Information”) presented herein combines the period from November 30, 2018 through April 30, 2019 (“Successor Period”) and the period from May 1, 2018 through December 20, 2018 (“Predecessor Period”). The unaudited supplemental combined financial information gives effect to the Acquisition in accordance with the Financial Accounting Standards Board (“FASB”) Accounting Standards Codification (“ASC”) 805, Business Combinations (“ASC 805”), as if it had occurred on May 1, 2018.
The unaudited supplemental disaggregated financial information for the fiscal years ended April 30, 2021 (the “Disaggregated 2021 Financial Information”) and April 30, 2020 (the “Disaggregated 2020 Financial Information”) presented herein exclude the impact of the 2020 Transactions, rather than giving effect to these acquisitions as if they had occurred at a certain date for the annual periods. We do so by subtracting the results of operations of the acquired businesses (based on their standalone books and records) for all periods since the applicable dates of acquisition.
These unaudited supplemental results of operations disclosures are not impacted by, nor adjusted for, the impact from the completion of this offering, the issuance of common shares, and the use of the proceeds from this offering as described in the section entitled “Use of Proceeds.”
We believe that providing only the discussion of the actual financial information comparing these periods is not sufficient for investors. Reviewing our operating results for the fiscal year ended April 30, 2019 through the use of the FASB ASC 805 pro forma adjustments related to the Acquisition provides useful information in discussing our overall operating performance compared to the results of the years ended April 30, 2021 and 2020. Reviewing our operating results for the fiscal year ended April 30, 2020 through the use of adjustments to exclude the impact of the 2020 Transactions also provides useful information in discussing our overall operating performance compared to the results of the year ended April 30, 2019. The unaudited disaggregated financial information excludes the results of operations of the businesses acquired through the 2020 Transactions, giving effect to the adjustments described in the tables below.
The unaudited supplemental financial information set forth below is based upon available information and assumptions that we believe are reasonable. The historical financial information has been adjusted to give effect to supplemental events that are: (1) directly attributable to the transactions described therein; and (2) factually supportable. The unaudited supplemental financial information is for illustrative and informational purposes only and is not intended to represent or be indicative of our financial condition or results of operations had the above transactions occurred on their actual dates or as of any other date within the periods covered by this financial information. The unaudited supplemental financial information also should not be considered representative of our future financial condition or results of operations.
69
Table of Contents
Unaudited Supplemental Combined Financial Information
| Successor Period | Predecessor Period | Combined | ||||||||||||||
| November 30, 2018 through April 30, 2019 |
May 1, 2018 through December 20, 2018 |
Adjustments | May 1, 2018 through April 30, 2019 |
|||||||||||||
| (in millions) | ||||||||||||||||
| Revenue |
$ | 369.8 | $ | 632.8 | $ | — | $ | 1,002.6 | ||||||||
| Cost of revenue |
320.4 | 546.4 | 5.7 | (a) | 872.5 | |||||||||||
|
|
|
|
|
|
|
|
|
|||||||||
| Gross profit |
49.4 | 86.4 | (5.7 | ) | 130.1 | |||||||||||
| Operating expenses |
||||||||||||||||
| Selling, general and administrative expenses |
34.9 | 69.7 | 5.5 | (b) | 110.1 | |||||||||||
| Acquisition-related costs and other expenses |
9.4 | 25.9 | — | 35.3 | ||||||||||||
|
|
|
|
|
|
|
|
|
|||||||||
| Operating income (loss) |
5.1 | (9.2 | ) | (11.2 | ) | (15.3 | ) | |||||||||
| Interest expense |
14.4 | 13.3 | 15.5 | (c) | 43.2 | |||||||||||
| Other expense (income), net |
0.5 | 1.1 | — | 1.6 | ||||||||||||
|
|
|
|
|
|
|
|
|
|||||||||
| Loss before income taxes |
(9.8 | ) | (23.6 | ) | (26.7 | ) | (60.1 | ) | ||||||||
| Income tax benefit |
(0.5 | ) | (0.9 | ) | (7.4 | )(d) | (8.8 | ) | ||||||||
|
|
|
|
|
|
|
|
|
|||||||||
| Net loss |
$ | (9.3 | ) | $ | (22.7 | ) | $ | (19.3 | ) | $ | (51.3 | ) | ||||
|
|
|
|
|
|
|
|
|
|||||||||
The adjustments presented herein give effect to the Acquisition as if it had occurred on May 1, 2018. These adjustments can be explained as follows:
| (a) | incremental depreciation expense included in cost of revenue that is related to the fair value adjustments associated with the property, plant and equipment acquired, and incremental amortization expense related to the fair value adjustments associated with the intangible assets acquired; |
| (b) | incremental depreciation expense included in selling, general and administrative expenses that is related to the fair value adjustments associated with the property, plant and equipment acquired, and incremental amortization expense related to the fair value adjustments associated with the intangible assets acquired; |
| (c) | additional interest expense associated with the issuance of debt to finance the Acquisition; and |
| (d) | the consequential income tax adjustments. |
70
Table of Contents
Unaudited Supplemental Disaggregated Financial Information
| Successor | ||||||||||||||||||||||||
| Year Ended April 30, 2021 |
Less: 2020 Transactions |
Disaggregated 2021 Financial Information |
Year Ended April 30, 2020 |
Less: 2020 Transactions |
Disaggregated 2020 Financial Information |
|||||||||||||||||||
| (in millions) | ||||||||||||||||||||||||
| Revenue |
$ | 2,143.8 | $ | (1,147.9 | )(a) | $ | 995.9 | $ | 1,093.4 | $ | (149.2 | )(a) | $ | 944.2 | ||||||||||
| Cost of revenue |
1,817.7 | (961.4 | )(b) | 856.3 | 944.6 | (125.4 | )(b) | 819.2 | ||||||||||||||||
|
|
|
|
|
|
|
|
|
|
|
|
|
|||||||||||||
| Gross profit |
326.1 | (186.5 | ) | 139.6 | 148.8 | (23.8 | ) | 125.0 | ||||||||||||||||
| Operating expenses |
||||||||||||||||||||||||
| Selling, general and administrative expenses |
286.8 | (169.7 | )(c) | 117.1 | 135.3 | (34.4 | )(c) | 100.9 | ||||||||||||||||
| Acquisition-related costs and other expenses |
40.1 | (17.9 | )(d) | 22.2 | 59.7 | (3.5 | )(d) | 56.2 | ||||||||||||||||
| Impairment loss on goodwill and other intangibles |
48.2 | (48.2 | )(e) | — | — | — | (e) | — | ||||||||||||||||
|
|
|
|
|
|
|
|
|
|
|
|
|
|||||||||||||
| Operating income (loss) |
$ | (49.0 | ) | $ | 49.3 | $ | 0.3 | $ | (46.2 | ) | $ | 14.1 | $ | (32.1 | ) | |||||||||
|
|
|
|
|
|
|
|
|
|
|
|
|
|||||||||||||
The disaggregated information is presented for the fiscal years ended April 30, 2021 and 2020. The adjustments presented represent the impact of the 2020 Transactions to arrive at disaggregated amounts, which are our results of operations excluding the amounts recorded for the seven businesses acquired through the 2020 Transactions. These adjustments can be explained as follows and include the purchase price adjustments related to the acquisitions, the transaction costs and other expenses incurred by the acquired businesses, and exclude all Knowlton Development Corporation, Inc. corporate costs as they are not allocated to operational entities:
| (a) | revenue of the seven acquired businesses since the applicable dates of acquisition; |
| (b) | cost of revenue of the seven acquired businesses since the applicable dates of acquisition; |
| (c) | selling, general and administrative expenses of the seven acquired businesses since the applicable dates of acquisition; |
| (d) | acquisition-related costs and other expenses incurred by the seven acquired businesses since their applicable dates of acquisition. This adjustment does not include acquisition-related costs and other expenses incurred by the Company (as the acquirer) in relation to the 2020 Transactions; and |
| (e) | impairment loss on goodwill and other intangibles of the seven acquired businesses since the applicable dates of acquisition. |
We believe the presentation of disaggregated information below the operating income (loss) line is not meaningful in discussing our performance and therefore is not presented. The analysis of interest expense, other expense (income), net and income tax benefit is more meaningful on an actual basis because most of these items are driven at the corporate level rather than the subsidiaries level.
71
Table of Contents
MANAGEMENT’S DISCUSSION AND ANALYSIS OF FINANCIAL CONDITION AND RESULTS OF OPERATIONS
The following discussion and analysis of our financial condition and results of operations (“MD&A”) should be read in conjunction with the “Selected Consolidated Financial Data” and “Supplemental Financial Information” sections of this prospectus and our consolidated financial statements and related notes thereto included elsewhere in this prospectus. We utilize a fiscal year from May 1 to April 30. Our fiscal quarters end on July 31, October 31, January 31 and April 30. In addition to historical consolidated financial information, the following discussion and analysis contains forward-looking statements that involve risks, uncertainties and assumptions that could cause actual results to differ materially from management’s expectations or other forward-looking statements. Factors that could cause such differences are discussed under “Cautionary Note Regarding Forward-Looking Statements,” “Risk Factors” and elsewhere in this prospectus.
Overview
We are a trusted global provider of value-added solutions to many of the world’s leading brands in the beauty, personal care and home care categories. We partner closely with both industry-leading consumer products companies and fast-growing independent brands as a critical enabler of their success through ideation, formulation, design, packaging and manufacturing of products sold under more than 1,000 different brand names. Over the past three years, we have been responsible for co-developing over 9,000 products across growing categories that include skin care, body and hair care, soaps and sanitizers, cosmetics, deodorants, sun care, fragrances, air care, fabric care, pest control and surface care products. The innovative products that we have helped to develop are sold by our brand partners in more than 70 countries worldwide.
The pace of innovation and new brand and product introduction is accelerating across the beauty, personal care and home care categories. This, in turn, has underscored the importance of rapid strategic product development partnerships with companies such as ours to accelerate the speed to market. Against that backdrop, we have benefited by building a leading suite of end-to-end value added solutions across a global platform. We believe the vertical integration of product solutions, coupled with the ability to service both established and emerging brands worldwide, provides us with a significant competitive advantage.
We provide our value-added solutions to more than 700 customers worldwide as of July 31, 2021, across 13 different product categories. Our customers include many of the most recognizable and emerging companies in the beauty, personal care and home care categories. Our customer base encompasses 18 of the 20 largest beauty, personal care and home care companies worldwide, when ranked by retail sales in 2020, according to Euromonitor.1 In total, these 18 customers had a 52% share of the beauty, personal care and home care categories in 2020, according to Euromonitor.1 As of July 31, 2021, our portfolio also included more than 200 independent and emerging customers, who we have selectively targeted as owning many of the fastest growing and most noteworthy brands.
Our operating results prior to the Acquisition for the period from May 1, 2018 through December 20, 2018 are presented as the “Predecessor Period” and our operating results following the Acquisition for the period from November 30, 2018 through April 30, 2019, along with the fiscal years ended April 30, 2021 and 2020, are presented as the “Successor Period.” The three-month periods ended July 31, 2021 and 2020 are included in the Successor Period. In addition, in this prospectus, we present operating results for the Combined 2019 Financial Information on an unaudited basis to combine both the 2019 Predecessor and the 2019 Successor periods, giving effect to the Acquisition in accordance with the FASB ASC 805, as if it had occurred on May 1, 2018. We also present operating results for the Disaggregated 2021 Financial Information and the Disaggregated 2020 Financial Information to exclude the impact of the 2020 Transactions, by subtracting the results of operations of businesses acquired through the 2020 Transactions since the applicable dates of acquisition, giving effect to the adjustments described in “Supplemental Financial Information.”
| 1 | Euromonitor International Limited. Beauty & Personal Care 2021 Retail Value RSP Fixed 2020 Exchange Rate, Home Care 2021 Retail Value RSP Fixed 2020 Exchange Rate. Data extracted April 2021. |
72
Table of Contents
Key Factors Impacting Our Performance
Our financial condition and results of operations have been, and will continue to be, affected by a number of factors, including the following:
Shifting Consumer Preferences and Behavior
Within the categories in which we operate, a number of structural shifts are taking place that favor a value-added, integrated solutions partner like us. Through digitization, consumers have more immediate access than ever before to information and influence around their purchasing choices. This has resulted in a faster pace of innovation across the beauty, personal care and home care categories, both for existing products and through a significant increase in the pace at which new brands are introduced to the market.
Ability to Offer End-to-End Solutions to our Customers
As consumer demand for newness accelerates, brand owners are increasingly partnering with us across all facets of the strategic product planning process. We believe our ability to offer integrated, end-to-end solutions across our global footprint will be a key driver of future growth.
Increasing Reliance on Outsourced Innovation
As established brands adapt to this faster-paced consumer environment, they are increasingly reliant on outsourced strategic partnerships to help drive product innovation and speed to market. Likewise, owners of emerging brands often favor an asset-lite approach, freeing up time and resources to focus on consumer connectivity. We expect that our future growth will come in part from continued outsourcing trends at larger, established brands. We believe our ability to be a trusted innovation partner for these companies, deliver flexible production capacity and support their ability to bring new and innovative products to market is key to our future performance.
Accelerating Growth Across International Markets
Industry estimates suggest that growth across our categories will continue to be delivered across each of the major regions in which we operate, including the United States and Canada; Europe, the Middle East and Africa; and the Asia Pacific region, among others. On a weighted-average basis, the markets for beauty, personal care and home care are expected to grow at a compound annual rate of 2.3%, 4.9% and 7.0% in the United States and Canada; Europe, the Middle East and Africa; and the Asia Pacific region, respectively, from 2019 through 2025, according to Euromonitor.2 China, in particular, is experiencing a period of elevated growth and is expected to grow at a compound annual growth rate of 10.2% through 2025.2 The Asia Pacific region, and in particular China, is expected to continue to be a key pillar of our international expansion strategy.
Existing Customer Dependence & Retention
Organic growth will depend on our ability to extend our existing customer relationships into the future and support these businesses as they continue to grow, including both established and emerging brands. It has become increasingly important to invest in key relationships by providing a full-service suite of integrated solutions across the value chain. This benefits scaled business that both invest in end-to-end capabilities and serve customers at each step of the value chain. We have invested in a value chain that starts with ideation and assists our customers through formulation, design, packaging and manufacturing of products.
Business Development and Acquisitions
We seek to accelerate our sales growth by expanding and further diversifying our product capabilities, category reach and geographic footprint. We do this both through organic growth initiatives and through
| 2 | Company estimate from Euromonitor International Limited, Beauty & Personal Care 2021 Fixed 2020 Exchange Rate, Home Care 2021 Fixed 2020 Exchange Rate, Retail Value RSP, Current Prices. Data extracted April 2021. |
73
Table of Contents
acquisitions. At our Knowlton, Québec facility, for example, we recently completed a multi-step investment to expand and enhance our capabilities in the antiperspirant and deodorant category. Similarly, operations at our new facility in Columbus, Ohio commenced in the second quarter of fiscal 2022, adding capabilities across a range of products, including foaming soap, hand soap, shower gel and body cream. With respect to acquisitions, we have successfully expanded our footprint in Europe and the Asia Pacific region through the purchase of Alkos, Swallowfield and Paristy. Additionally, the acquisition of Zobele extended our product portfolio and reach into the home care, fabric care and pest control categories, including highly technical dispensing devices, while the acquisition of HCT added industry leading expertise in the field of complex packaging design and production, enabling us to better service the premium beauty category. Zobele and HCT also extend our global footprint.
Strategic acquisitions to complement and expand our business have been, and are expected to continue to be, an important part of our growth strategy. Our acquisitions may impact our future financial results due to factors such as the amortization of acquired intangible assets, impairment charges or other potential charges arising from integration activities and synergy-capturing initiatives such as restructuring costs. These types of costs may affect comparability of results across periods prepared in accordance with GAAP.
As a result of our business development and acquisition activities, we recently realigned our organizational priorities to better serve our customers and be more responsive to changes in market dynamics. We believe these changes will allow us to more effectively manage our business and improve our operating results in the future.
COVID-19
The COVID-19 pandemic has negatively impacted the global economy, disrupted supply chains and created significant volatility in global financial markets. Many countries in which we operate initiated governmental restrictions in response to the COVID-19 pandemic and these actions have impacted and will continue to impact our results of operations and cash flows. Several vaccines have received regulatory approval across the world in late 2020 and early 2021 and are being distributed in our primary areas of operation, including North America and Europe. As COVID-19 vaccine adoption rates increase, certain countries have started facilitating gradual reopening of business and public settings while maintaining health and safety precautions. Uncertainty surrounding the effectiveness of the vaccines, vaccine hesitancy, the emergence of new strains such as the Delta variant, public perception and local laws and regulations enacted to combat the spread of COVID-19, will play a key role on any future impact of the COVID-19 pandemic in our operations.
Although we have experienced certain negative impacts on sales and incurred additional costs, the economic effects of the COVID-19 pandemic were offset by our diversified personal care product offerings (including skin, body and hair care), as well as the results of our 2020 Transactions, which resulted in an overall favorable impact to our consolidated sales, net loss, Adjusted EBITDA and cash flows for the fiscal year ended April 30, 2021 in comparison to the year ended April 30, 2020. Factors that contributed to the overall favorable result in the fiscal year ended April 30, 2021 are related to the nature of the products we sell, as many of our products are essential to the daily lives of consumers and, as a result, continued to experience demand during the pandemic. However, supply chain disruption, among other factors, contributed to an unfavorable impact to our consolidated gross margin, net loss and Adjusted EBITDA for the three months ended July 31, 2021 in comparison to the three months ended July 31, 2020. Our global and flexible manufacturing network enabled us to meet increased demand from our customers for these essential products. Furthermore, we have a diversified product portfolio, with varying sale prices and margins (our “sales mix”), and sales volumes. As a result of our diversified product portfolio, although some products, such as color cosmetics, experienced declining sales during the fourth quarter of fiscal year 2020 and into fiscal year 2021, other products, such as personal care and home care, experienced increased demand, which ultimately resulted in an overall positive impact on our consolidated sales, net loss, Adjusted EBITDA and cash flows. For instance, through our strategic approach to mergers and acquisitions (unrelated to the COVID-19 pandemic), we acquired Zobele on April 30, 2020. This acquisition diversified our product portfolio to offer air care, fabric care, pest control and surface care products in the home care sector that resulted in an overall positive impact on our consolidated sales, net loss, Adjusted EBITDA and cash flows despite the COVID-19 pandemic.
74
Table of Contents
Conversely, some products, such as color cosmetics, experienced declining sales during the fourth quarter of fiscal year 2020 and into fiscal year 2021. These types of products saw a decline in demand during the COVID-19 pandemic and had a negative effect on our revenue. Specifically, we concluded that the estimated fair value of the HCT reporting unit was less than its carrying value as of the end of the second quarter of fiscal year 2021, reflecting a more gradual recovery from the COVID-19 pandemic than expected, delayed into fiscal year 2022. Accordingly, an impairment charge of $47.3 million and $0.9 million for goodwill and indefinite life intangibles, respectively, was recorded. Additionally, during the third quarter of fiscal year 2021, we identified a right-of-use asset impairment trigger on one of HCT’s leases for office space. Due to the COVID-19 pandemic, HCT delayed taking possession and control of the office space until the latest possible commencement date which was January 1, 2021. Due to confinement rules and new working habits, HCT no longer plans to use the space as it was initially intended. We performed an impairment test and concluded that the asset was impaired and recorded an impairment loss of $6.1 million on the right-of-use asset within acquisition-related costs and other expenses. Refer to “Consolidated Results of Operations” section below for further discussion on the impact of the COVID-19 pandemic on our consolidated operations and by segment for the current periods as compared to historical results and “Critical Accounting Policies and Estimates” for further discussion of the impairment charges recorded during the second quarter of fiscal year 2021.
In fiscal year 2021, we continued to generate positive operating cash flows to meet our short-term liquidity needs. In the instances where we have drawn down on our Revolving Facility (as defined below), it has been subsequently repaid soon after using our operating cash flows and additional capital contributions, except that draws of approximately $86.5 million made subsequent to the year ended April 30, 2021 are expected to be repaid with proceeds from this offering. We expect to maintain access to the capital markets as a result of our satisfactory credit ratings. See the “—Liquidity and Capital Resources” and “—Quantitative and Qualitative Disclosures about Market Risk” sections below on our extended credit and most recent goodwill impairment analysis as well as the Distribution Financing Transactions.
In response to the COVID-19 pandemic and the resulting economic uncertainty, we enhanced ongoing cost alignment initiatives and ultimately made a number of changes to improve the strength of our business. Specifically, we made the following changes, most of which were short term or temporary in nature:
| • | Reduced full-time employee headcount; |
| • | Significantly reduced our contingent workforce; |
| • | Significantly lowered all discretionary spending, including travel budgets for employees; |
| • | Temporarily decreased or froze employee compensation and retirement contributions, as well as implemented furloughs; |
| • | Restricted non-essential capital expenditures; and |
| • | Implemented sanitary and social distancing measures, including mandatory masks, temperature checks and daily health questionnaires, setting up barriers/shields on-site, allowing telework for all office employees and instituting COVID-19 compliance monitoring. |
At this time, we are unable to predict with any certainty the nature, timing or magnitude of any changes in future sales, earnings, and working capital attributable to the spread of COVID-19, including ongoing supply chain disruptions and increased costs of direct labor as well as inbound and outbound freight, although we do anticipate a gradual recovery in color cosmetics in fiscal year 2022. See “Risk Factors—Natural disasters, public health crises (such as the ongoing COVID-19 pandemic), international conflicts, terrorist acts, labor strikes, political crisis, accidents and other events could adversely affect our business and financial results by disrupting development, manufacturing, distribution or sale of our products.”
75
Table of Contents
General Economic Outlook
Recent economic activity has been affected by uncertainties surrounding the 2020 U.S. Presidential and congressional elections and their potential effects on economic, trade, regulatory and tax policies. We believe such uncertainties affected consumer sentiment generally and, among other factors, resulted in an underwhelming holiday selling season. In the United States, certain questions remain around the legislative priorities of the new administration and its approach toward economic and tax reform, as these factors could have an impact on consumer and business sentiment into fiscal year 2022. On June 5, 2021, the G7 Finance Ministers announced an agreement in which the participating countries committed to new taxing rights as well as a global minimum tax rate of at least 15%. We note that only preliminary details are available at this time and that implementation of the global minimum tax is unlikely within the next year. We do not expect a material impact as a result of the agreement but will continue to assess as more details become available. We will continue to evaluate and adjust our operating strategies, foreign currency and cost management opportunities to help mitigate any impacts on our results of operations resulting from broader macroeconomic conditions and policy changes, while remaining focused on the long-term growth of our business.
Competitive Environment
We operate in a fragmented market including outsourced manufacturers focusing on a limited range of products as well as service providers serving local or regional markets. Current trends among our customers, and in particular large companies, include increased demand for innovative products, requiring suppliers to maintain or reduce product prices and to deliver products within shorter lead times. We also face the threat of competition from customer insourcing as well as from existing competitors, including those overseas who may have lower production costs. As we further expand globally, we expect to face increased local competition, especially in the Asian market where established beauty and personal care manufacturers, formulators and packaging producers currently participate and emerging service providers have gained scale. While we have long-term relationships with many of our customers, the underlying contracts may be re-bid or renegotiated from time to time, and we may not be successful in renewing on favorable terms or at all, as pricing and other competitive pressures may result in the loss of a customer relationship. To compete successfully, we must make continued investments in customer relationships and tailor our R&D efforts to anticipate customers’ and consumers’ needs. The loss of business from our larger customers, or the renewal of business on less favorable terms, may have a significant impact on our operating results. See “Business—Competition.”
Foreign Currency Exchange Rate Environment
Although our revenue and expenses have been predominantly denominated in U.S. dollars, we earn revenues, pay expenses, hold assets and incur liabilities in currencies other than the U.S. dollar, mostly due to our acquisitions denominated in other currencies. We also have a significant portion of our debt denominated in euros. As of July 31, 2021, the nominal amount of the debt denominated in euros was $659.5 million on a translated basis. Accordingly, fluctuations in foreign currency exchange rates can affect our results of operations from period to period. In particular, fluctuations in exchange rates for non-U.S. dollar currencies may reduce the U.S. dollar value of revenues, earnings and cash flows we receive from non-U.S. markets, increase our operating expenses (as measured in U.S. dollars) in those markets, negatively impact our competitiveness in those markets or otherwise adversely impact our results of operations or financial condition. Future fluctuations of foreign currency exchange rates and their impact on our results of operations and financial condition are inherently uncertain. As we continue to grow the size of our global operations, these fluctuations may be material. See “—Quantitative and Qualitative Disclosures About Market Risk—Foreign Currency Risk.”
Sustainability
Interest in environmental sustainability has increased over the past decade, and we expect that sustainability will play an increasing role in customer and consumer purchasing decisions going forward. In particular,
76
Table of Contents
concerns have been raised over the environmental impact of certain products we manufacture, including single-use products and products made from plastic. Governmental authorities in the United States and abroad continue to implement legislation aimed at reducing the amount of plastic and other wastes incapable of being recycled. Such legislation, as well as voluntary initiatives similarly aimed at reducing the level of single-use packaging waste, could reduce demand for certain of our products.
Some consumer products companies, including some of our customers, have responded to these governmental initiatives and to the perceived environmental or sustainability concerns of consumers by using only recyclable containers. As our customers may shift towards purchasing more sustainable products, we have focused certain of our innovation efforts around sustainability. Across our business, we believe we are well-positioned to benefit from growth in recycled and recyclable packaging. We continue to produce new sustainable product innovations, scout sustainable eco-friendly ingredients, lead in breakthrough clean formulations and create more sustainable packaging solutions.
We intend to continue sustainability innovation and aim to be at the leading edge of recyclability and renewability in order to offer our customers environmentally sustainable choices.
We expect to incur incremental R&D costs as a result of developing these products and/or increasing manufacturing of existing sustainable products.
Investment in Our Operations and Infrastructure
To grow our customer base and enhance our product offering, we will incur additional expenses. We intend to leverage our deep insights in the industries and markets we serve, as well as close connectivity with our customers (and understanding of their future demands) to inform investments in operations, equipment and infrastructure. We anticipate that our expenses will increase as we continue to hire additional personnel and further expand our R&D capabilities. Moreover, we intend to make capital investments in our manufacturing facilities and supply chain infrastructure. We expect to increase our spending on these investments in the future and cannot be certain that these efforts will grow our customer base or be cost-effective. However, we believe these strategies will yield long-term positive returns.
Sales Mix
We ideate, formulate, manufacture and package a wide variety of products across numerous product lines within our Beauty and Personal Care and Home Care segments, and these products are sold at different prices, are composed of different materials and involve varying levels of manufacturing complexity. In any particular period, changes in the volume of particular products sold and the prices of those products relative to other products will impact our average selling price and our cost of revenue. In addition to the impacts attributable to sales mix between the Beauty and Personal Care and Home Care segments, our results of operations are impacted by the relative margins associated with individual products within our Beauty and Personal Care and Home Care segments, which vary among products. As we continue to manufacture products at varying price points to be competitive across a wide range of prices, our overall gross margins may vary from period to period as a result of changes in the product mix.
Wage and Input Cost Inflation
In an increasingly competitive margin environment, we will continue to closely monitor rising operating costs. Both domestically in North America and globally, measures are being taken to increase minimum wages. There is a shortage of skilled labor in certain locations leading to increased wage pressure. Similarly, with an increased global focus on environmental, social and corporate-governance concerns and sustainability, input costs have been steadily rising. We believe we can continue to effectively attract and retain employees while delivering environmentally friendly products for the end consumers without impacting long-term performance.
77
Table of Contents
Public Company Costs
Following the completion of this offering, we expect to incur additional costs associated with operating as a public company when compared to historical reporting periods. The Sarbanes-Oxley Act of 2002, as well as rules adopted by the SEC, Canadian securities laws and the rules and requirements of the TSX and the NYSE, require public companies to implement specified corporate governance practices that are currently inapplicable to us as a private company. These additional rules and regulations will increase our legal, regulatory, financial and insurance compliance costs and will make some activities more time consuming and costly. We expect that these costs will include additional personnel, legal, consulting, regulatory, insurance, accounting/audit, investor relations and other expenses that we did not incur as a private company.
Factors Affecting the Comparability of Our Results of Operations
As a result of a number of factors, our historical results of operations may not be comparable from period to period or going forward. Set forth below is a brief discussion of the key factors impacting the comparability of our results of operations.
The Acquisition
A purchase agreement (the “Purchase Agreement”) was entered into on October 26, 2018 among KDC Opco, the holders of all its issued and outstanding common shares and the purchaser named therein (the “Purchaser”), which was formed by Cornell Capital LLC (“Cornell”) for the purpose of consummating the transactions under the Purchase Agreement. On December 21, 2018 (the “Closing Date”), Cornell transferred its ownership of the Purchaser to Knowlton Development Corporation, Inc., (previously known as Knowlton Development Parent, Inc.), which was incorporated by a group of investors led by Cornell in British Columbia on November 30, 2018 originally as a holding company with no assets or operations of its own. The Purchaser was subsequently amalgamated with KDC Opco immediately following the acquisition of the outstanding common shares of KDC Opco by Knowlton Development Corporation, Inc. through the Purchaser. This is referred to herein as the Acquisition. On July 1, 2021, KDC Opco changed its name to kdc/one Development Corporation, Inc. On the same day, Knowlton Development Parent, Inc., and Knowlton Development Holdco, Inc., a wholly-owned subsidiary of Knowlton Development Parent, Inc., amalgamated under the laws of British Columbia and continued as one corporation named Knowlton Development Corporation, Inc., which became the direct parent of kdc/one Development Corporation, Inc. Prior to the Acquisition, Knowlton Development Corporation, Inc.’s efforts were limited to organizational activities directly related to the Acquisition and for which it incurred acquisition-related costs. The 21-day overlap between Knowlton Development Corporation, Inc.’s incorporation and the Closing Date is not presented as a separate financial statement as there were no operations by Knowlton Development Corporation, Inc. between the date of its incorporation and the Closing Date except for the organizational activities mentioned above. Knowlton Development Corporation, Inc. currently owns no significant assets nor has any operations other than the ownership of all the common shares of KDC Opco. For additional information, see “Financial Statement Presentation.”
The Acquisition was accounted for as a business combination under the FASB ASC 805. The purchase consideration was allocated to the identifiable assets and liabilities of KDC Opco measured at their fair value as of the effective date of the Acquisition. Any excess of the purchase consideration over the fair value of the identifiable assets and liabilities of KDC Opco was recognized as goodwill in our consolidated financial statements included elsewhere in this prospectus.
Acquisitions
Since the Acquisition and as of April 30, 2021, we completed seven acquisitions across our operating segments, all in the fiscal year 2020 (the “2020 Transactions”). In addition, we acquired HCT Metals on May 3, 2021.
78
Table of Contents
The comparability of our results of operations has been materially impacted by the 2020 Transactions listed in the table below. As a result, we are presenting supplemental information in this prospectus to facilitate the review of our operating performance on a comparable basis. See “Supplemental Financial Information.”
| Acquired Company |
Acquisition Date |
Acquisition Type | ||
| Alkos |
July 1, 2019 | 100% of issued and outstanding share capital | ||
| Swallowfield |
August 23, 2019 | 100% of issued and outstanding share capital | ||
| Benchmark |
November 1, 2019 | 100% of issued and outstanding share capital | ||
| HCT |
January 23, 2020 |
100% of issued and outstanding share capital | ||
| Paristy |
March 2, 2020
|
100% of issued and outstanding share capital of Mei Shual Cosmetics Co., Pte Ltd and substantially all of the assets of Mei Shual Cosmetics Co., Ltd | ||
| CLA |
March 2, 2020 | Substantially all of the assets and assumed certain current liabilities | ||
| Zobele |
April 30, 2020 | 100% of issued and outstanding share capital |
See Note 4, Business Combinations, to our audited consolidated financial statements for the year ended April 30, 2021 and Note 3, Business Combinations, to our unaudited consolidated financial statements for the three months ended July 31, 2021 included elsewhere in this prospectus for further detail.
Components of Results of Operations
Revenue
Our principal sources of revenue are derived from providing value embedded in our product delivery to the beauty, personal care and home care categories, for brands which cover the full spectrum of distribution channels (from mass to specialty retail to direct to consumer) and price points (from mass to prestige). The transaction price typically consists of a fixed consideration based on unit price and quantity ordered.
For the sale of finished goods, we recognize revenue at a point in time when control of the finished good transfers to the customer, which is, generally, at shipping point. For certain contracts in which the finished goods inventory is warehoused and until the customer requests shipment at a later date, we recognize revenue at the completion of production as control of the finished goods has transferred to the customer. Revenue is recognized at the fair value of the amount received or expected to be received, less discounts, rebates and returns. Payment terms are short-term in nature and are generally less than six months.
Cost of revenue
Cost of revenue includes all costs directly related to the manufacturing of products, including the cost of raw materials, direct labor, packaging, direct production costs, factory overhead, depreciation expense related to manufacturing and corresponding right-of-use assets and amortization of intellectual property. Cost of revenue also includes the costs relating to warehousing, maintenance, inspection activities, freight and inventory write-downs. Additionally, cost of revenue includes a portion of costs related to employee benefits and plant start-up costs. We expect that the cost of revenue will increase on an absolute dollar basis as our business grows and as we continue to invest and support the growth of our business. As a result, we expect that cost of revenue as a percentage of revenue will vary from period to period over the short term and decrease over the long term as we achieve greater scale and operational efficiency.
79
Table of Contents
Selling, general and administrative expenses
Selling, general and administrative expenses include selling and administrative personnel costs, sales and marketing expenses, professional fees, depreciation expense related to non-manufacturing and corresponding finance lease right-of-use assets, operating lease rent expense, non-manufacturing overhead, gains and losses on the sale of property, plant and equipment, and other general and administrative expenses. Additionally, selling, general and administrative expenses include a portion of costs related to employee benefits, share-based compensation expense and amortization of customer relationships and other intangibles, as well as R&D costs, which are expensed as incurred. These costs also include the 2.5% annual cash fee payable to Cornell under the Services Agreement (as defined elsewhere in this prospectus), referred to as the “Sponsor Management Fees.” The Sponsor Management Fees are terminating in connection with this offering. See “Certain Relationships and Related Party Transactions—Services Agreement.” These costs vary based on current innovation or restructuring initiatives (unrelated to acquisitions) and cost reduction initiatives to offset impacts from the COVID-19 pandemic. We expect that our selling, general and administrative expenses will increase in absolute dollars as we grow our business and operate as a public company; however, we expect these expenses to decrease as a percentage of our revenue over time as we scale our operations.
Acquisition-related costs and other expenses
Acquisition-related costs represent costs we incur in relation to business acquisitions and include professional, due diligence and advisory fees related to each business acquisition. These costs also include the 1% fee of the enterprise value of the business acquired that forms part of the fee payable to Cornell under the Services Agreement, referred to as the “Sponsor Acquisition Fees.” The Sponsor Acquisition Fees are terminating in connection with this offering. See “Certain Relationships and Related Party Transactions—Services Agreement.” In connection with our various acquisitions, we recognize costs which are expensed as incurred, primarily relating to acquisition-specific restructuring. Other expenses also include initial public offering preparation-related costs and impairment on right-of-use assets. We expect these costs to vary from period to period depending on the size, complexity and number of future acquisitions.
Impairment loss on goodwill and other intangibles
Impairment loss on goodwill and other intangibles includes impairment charges to reduce the carrying amount of goodwill and trade name intangible assets to fair value.
Interest expense
Interest expense consists of interest associated with finance lease liabilities and our debt financing arrangements, including our Term Loans and Revolving Facility, amortization of debt transaction costs and issuance discounts.
Other expense (income), net
Other expense (income), net consists primarily of gains and losses from foreign currency transactions. This includes foreign exchange gains and losses from foreign exchange forward contracts and monetary items denominated in currencies other than the functional currency, such as intercompany loans, which are not part of the net investment in foreign operations. Other expense (income), net also consists of costs related to trade accounts receivable sold to third-party financial institutions under factoring arrangements. Factoring arrangements are only entered into for the sale of trade receivables at a single subsidiary of the Company. In addition, other expense (income), net includes changes in fair value of contingent consideration arising from the 2020 Transactions that are subsequently re-measured at fair value.
Income taxes (benefit) expense
The expense for, or benefit from, income taxes consists primarily of income taxes related to Canada, U.S. and foreign jurisdictions in which we conduct business. We regularly review deferred income tax asset for realizability
80
Table of Contents
and establish valuation allowances based on available evidence, including historical operating losses, projected future taxable income, expected timing of the reversals of existing temporary differences, and appropriate tax planning strategies. The valuation allowance is recognized when, in the opinion of management, it is more likely than not that some portion or all of the deferred income tax asset will not be realized. Deferred income tax is provided on temporary differences arising on investments in subsidiaries except where the timing of the reversal is controlled by the Company and it is probable that the temporary difference will not reverse in the foreseeable future.
Our Operating Segments
We operate in two product-centric reporting segments: (i) Beauty and Personal Care and (ii) Home Care. Beauty and Personal Care includes skin care products, body and hair care products, soaps and sanitizers, cosmetics, deodorants, sun care products and fragrances. Home Care includes air care, fabric care, pest control solutions, surface care products and auto care solutions. Further below, we set forth a discussion of our operating costs by segment. See Note 3, Revenue, to our audited consolidated financial statements for the year ended April 30, 2021 and Note 2, Revenue, to our unaudited consolidated financial statements for the three months ended July 31, 2021 included elsewhere in this prospectus for an overview of the Company’s revenue process and recognition method.
Consolidated Results of Operations
The following tables set forth our consolidated results of operations for the periods presented. This information is derived from our accompanying consolidated financial statements included elsewhere in this prospectus prepared in accordance with GAAP except as described in “Supplemental Financial Information” and “—Key Performance and Operational Metrics.” The period-to-period comparisons of our historical results are not necessarily indicative of the results that may be expected in the future including for the reasons described above under “—Factors Affecting the Comparability of Our Results of Operations.” Detailed comparisons of revenue and results are presented in the discussions of the operating segments, which follow our consolidated results discussion.
81
Table of Contents
Our operating results prior to the Acquisition for the period from May 1, 2018 through December 20, 2018 are presented as the “Predecessor Period” and our operating results for the period from November 30, 2018 through April 30, 2019, along with the fiscal years ended April 30, 2021 and 2020, are presented as the “Successor Period.” The three-month periods ended July 31, 2021 and 2020 are included in the Successor Period. In addition, in this prospectus we present operating results for the Combined 2019 Financial Information on an unaudited pro forma basis to combine the 2019 Predecessor and Successor periods, giving effect to the Acquisition in accordance with the FASB ASC 805, as if it had occurred on May 1, 2018. We also present operating results for the Disaggregated 2021 Financial Information and the Disaggregated 2020 Financial Information to exclude the impact of the 2020 Transactions, excluding the results of operations of the businesses acquired through the 2020 Transactions, giving effect to adjustments described in “Supplemental Financial Information.”
| Successor Period | Predecessor Period |
|||||||||||||||||||||||||||||||||||
| Three Months Ended July 31, 2021 |
Three Months Ended July 31, 2020 |
Year Ended April 30, 2021 (Actual) |
Disaggregated 2021 Financial Information(1) |
Year Ended April 30, 2020 (Actual) |
Disaggregated 2020 Financial Information(1) |
November 30, 2018 through April 30, 2019 (Actual) |
May 1, 2018 through December 20, 2018 (Actual) |
Combined 2019 Financial Information(1) |
||||||||||||||||||||||||||||
| (in millions except percentages) | ||||||||||||||||||||||||||||||||||||
| Revenue |
$ | 603.4 | $ | 482.4 | $ | 2,143.8 | $ | 995.9 | $ | 1,093.4 | $ | 944.2 | $ | 369.8 | $ | 632.8 | $ | 1,002.6 | ||||||||||||||||||
| Cost of revenue |
520.9 | 400.4 | 1,817.7 | 856.3 | 944.6 | 819.2 | 320.4 | 546.4 | 872.5 | |||||||||||||||||||||||||||
|
|
|
|
|
|
|
|
|
|
|
|
|
|
|
|
|
|
|
|||||||||||||||||||
| Gross profit |
82.5 | 82.0 | 326.1 | 139.6 | 148.8 | 125.0 | 49.4 | 86.4 | 130.1 | |||||||||||||||||||||||||||
| Gross margin |
13.7 | % | 17.0 | % | 15.2 | % | 14.0 | % | 13.6 | % | 13.2 | % | 13.4 | % | 13.7 | % | 13.0 | % | ||||||||||||||||||
| Selling, general and administrative expenses |
73.6 | 64.1 | 286.8 | 117.1 | 135.3 | 100.9 | 34.9 | 69.7 | 110.1 | |||||||||||||||||||||||||||
| As a percentage of revenue |
12.2 | % | 13.3 | % | 13.4 | % | 11.8 | % | 12.4 | % | 10.7 | % | 9.4 | % | 11.0 | % | 11.0 | % | ||||||||||||||||||
| Acquisition-related costs and other expenses |
4.7 | 2.3 | 40.1 | 22.2 | 59.7 | 56.2 | 9.4 | 25.9 | 35.3 | |||||||||||||||||||||||||||
| Impairment loss on goodwill and other intangibles |
— | — | 48.2 | — | — | — | — | — | — | |||||||||||||||||||||||||||
|
|
|
|
|
|
|
|
|
|
|
|
|
|
|
|
|
|
|
|||||||||||||||||||
| Operating income (loss) |
4.2 | 15.6 | (49.0 | ) | 0.3 | (46.2 | ) | (32.1 | ) | 5.1 | (9.2 | ) | (15.3 | ) | ||||||||||||||||||||||
| As a percentage of revenue |
0.7 | % | 3.2 | % | (2.3 | )% | — | % | (4.2 | )% | (3.4 | )% | 1.4 | % | (1.5 | )% | (1.5 | )% | ||||||||||||||||||
| Interest expense |
22.8 | 17.3 | 78.2 | 47.4 | 14.4 | 13.3 | 43.2 | |||||||||||||||||||||||||||||
| Other expense (income), net |
(3.1 | ) | 3.1 | 11.7 | 2.4 | 0.5 | 1.1 | 1.6 | ||||||||||||||||||||||||||||
|
|
|
|
|
|
|
|
|
|
|
|
|
|
|
|||||||||||||||||||||||
| Loss before income taxes |
(15.5 | ) | (4.8 | ) | (138.9 | ) | (96.0 | ) | (9.8 | ) | (23.6 | ) | (60.1 | ) | ||||||||||||||||||||||
| Income tax benefit |
(2.8 | ) | (4.2 | ) | (13.1 | ) | (14.1 | ) | (0.5 | ) | (0.9 | ) | (8.8 | ) | ||||||||||||||||||||||
| As a percentage of pre-tax loss |
18.1 | % | 87.5 | % | 9.4 | % | 14.7 | % | 5.1 | % | 3.8 | % | 14.6 | % | ||||||||||||||||||||||
|
|
|
|
|
|
|
|
|
|
|
|
|
|
|
|||||||||||||||||||||||
| Net loss |
$ | (12.7 | ) | $ | (0.6 | ) | $ | (125.8 | ) | $ | (81.9 | ) | $ | (9.3 | ) | $ | (22.7 | ) | $ | (51.3 | ) | |||||||||||||||
|
|
|
|
|
|
|
|
|
|
|
|
|
|
|
|||||||||||||||||||||||
| (1) | See “Supplemental Financial Information” for an explanation as to how the Disaggregated 2021 Financial Information, the Disaggregated 2020 Financial Information and Combined 2019 Financial Information are calculated. |
82
Table of Contents
Comparison of the Three Months Ended July 31, 2021 (Successor) and the Three Months Ended July 31, 2020 (Successor)
The following summarizes information comparing the components of our consolidated statements of operations for the three months ended July 31, 2021 and 2020.
Revenue
Revenue increased 25.1%, or $121.0 million, to $603.4 million for the three months ended July 31, 2021 as compared to $482.4 million for the three months ended July 31, 2020, which resulted from:
| • | higher sales volume of $77.6 million, except for soap and sanitizers shipments due to the outsized demand in the prior year, reflecting an improvement across virtually all product categories, which were negatively impacted by the COVID-19 pandemic in the prior-year period; and |
| • | favorable sales mix of $43.4 million, primarily attributable to an improvement in the Beauty and Personal Care segment reflecting increased shipments of higher priced color cosmetics and skin care products combined with a decrease in sales volume of lower priced soap and sanitizer products, offset in part by a rise in sales volume of lower priced air care products. |
See further discussion below in “—Segment Results for the Three Months Ended July 31, 2021 (Successor) and the Three Months Ended July 31, 2020 (Successor).”
Cost of revenue
Cost of revenue increased 30.1%, or $120.5 million, to $520.9 million for the three months ended July 31, 2021 as compared to $400.4 million for the three months ended July 31, 2020, which primarily resulted from:
| • | $85.6 million increase due to higher material costs attributable to higher sales volume combined with the impact of mix, as described above; |
| • | $16.8 million increase related to higher labor costs in part due to labor shortages in certain of our manufacturing facilities, which are expected to remain an issue during fiscal year 2022; |
| • | $14.9 million increase related to higher overhead costs, primarily attributable to higher sales volume, including additional warehouse space, supplies and utilities, combined with higher executive compensation as the prior-year period benefited from cost containment measures in response to the COVID-19 pandemic, higher headcount to support our growth, and wage increases; and |
| • | $2.6 million increase in plant start-up costs incurred for our new facility in Columbus; |
partly offset by
| • | $2.2 million decrease in COVID-19 costs given the evolution of the COVID-19 pandemic compared to the prior-year period. |
Gross margin
Gross margin decreased 330 basis points, to 13.7% for the three months ended July 31, 2021 as compared to 17.0% for the three months ended July 31, 2020, which resulted from:
| • | 310 basis point decrease related to higher material costs as a percentage of revenue primarily attributable to unfavorable mix, as described above; |
| • | 80 basis point decrease related to higher labor costs as a percentage of revenue in part due to labor shortages, as described above; and |
| • | 40 basis point decrease related to higher plant start-up costs as a percentage of revenue incurred for our new facility in Columbus; |
83
Table of Contents
offset by
| • | 50 basis point increase attributable to a decrease in COVID-19 costs as a percentage of revenue given the evolution of the COVID-19 pandemic as well as improved efficiencies; and |
| • | 50 basis point increase attributable to miscellaneous items, none of which were individually significant. |
Selling, general and administrative expenses
Selling, general and administrative expenses increased 14.8%, or $9.5 million, to $73.6 million for the three months ended July 31, 2021 as compared to $64.1 million for the three months ended July 31, 2020, which resulted from:
| • | $12.1 million increase primarily attributable to higher compensation as the prior-year period benefited from cost containment measures in response to the COVID-19 pandemic; |
partly offset by
| • | $2.6 million decrease attributable to miscellaneous items, none of which were individually significant. |
Acquisition-related costs and other expenses
Acquisition-related costs and other expenses increased 104.3%, or $2.4 million, to $4.7 million for the three months ended July 31, 2021 as compared to $2.3 million for the three months ended July 31, 2020, which primarily resulted from:
| • | $2.0 million increase in professional and advisory fees incurred in connection with this initial public offering. |
Interest expense
Interest expense increased 31.8%, or $5.5 million, to $22.8 million for the three months ended July 31, 2021 as compared to $17.3 million for the three months ended July 31, 2020, which primarily resulted from:
| • | $1.8 million increase due to a higher average all-in rate for the Euro Term Loan. The Euro Term Loan was converted from the First Lien Term Loan in the second quarter of fiscal year 2021 and as such, the average all-in rate was 5.0% under the Euro Term Loan for the three months ended July 31, 2021 as compared to 4.06% under the First Lien Term Loan for the three months ended July 31, 2020; |
| • | $1.5 million increase related to additional interest expense from additional proceeds from borrowings under the Revolving Facility as described in Note 13, Debt, to our consolidated financial statements, to support costs incurred at our new plant facility in Columbus; |
| • | $1.5 million increase related to additional interest expense from the incremental Euro Term Loan of €100.0 million as described in Note 13, Debt, to our consolidated financial statements, to finance the Distribution Financing Transactions; and |
| • | $1.3 million increase related to higher amortization of transaction costs and issuance discount related to long-term debt. |
Other expense (income), net
Other expense (income), net improved 200.0%, or $6.2 million, to income of $3.1 million for the three months ended July 31, 2021 as compared to expense of $3.1 million for the three months ended July 31, 2020. The income of $3.1 million for the three months ended July 31, 2021 was mainly driven by unrealized foreign exchange gains of $4.5 million mostly attributable to intercompany loans receivable, which are not included under net investment in foreign operations, whereas the expense of $3.1 million for the three months ended July 31, 2020 was mainly driven by an unfavorable change in fair value of derivative instruments of $17.9 million mostly attributable to a loss on a foreign exchange forward contract entered into in connection with the incremental Euro Term Loan of €460.0 million entered into during the first quarter of fiscal year 2021 and used to prepay the incremental term loans of $500.0 million entered into on April 30, 2020, that was largely offset by unrealized foreign exchange gains of $16.5 million mostly attributable to intercompany loans receivable, which are not included under net investment in foreign operations.
84
Table of Contents
Income tax benefit
Income tax benefit decreased 33.3%, or $1.4 million, to $2.8 million for the three months ended July 31, 2021 as compared to $4.2 million for the three months ended July 31, 2020, which primarily resulted from $2.2 million decrease stemming from the effect of a change in enacted tax rates in the United Kingdom.
Segment Results for the Three Months Ended July 31, 2021 (Successor) and the Three Months Ended July 31, 2020 (Successor)
The following summarizes information comparing certain financial information for our two operating segments, Beauty and Personal Care and Home Care, for the periods presented.
Revenue Change Drivers by Segment
| Three Months Ended July 31, | ||||||||
| 2021 | 2020 | |||||||
| (in millions except percentages) | ||||||||
| Revenue: |
||||||||
| Beauty and Personal Care |
$ | 375.8 | $ | 286.3 | ||||
| Home Care |
227.6 | 196.1 | ||||||
|
|
|
|
|
|||||
| Total revenue |
$ | 603.4 | $ | 482.4 | ||||
|
|
|
|
|
|||||
| Percentage of total revenue: |
||||||||
| Beauty and Personal Care |
62.3 | % | 59.3 | % | ||||
| Home Care |
37.7 | % | 40.7 | % | ||||
|
|
|
|
|
|||||
| Total |
100.0 | % | 100.0 | % | ||||
|
|
|
|
|
|||||
Beauty and Personal Care
| Three Months Ended July 31, | ||||||||
| 2021 | 2020 | |||||||
| (in millions except percentages) | ||||||||
| Adjusted EBITDA |
$ | 35.3 | $ | 33.3 | ||||
| Adjusted EBITDA Margin |
9.4 | % | 11.6 | % | ||||
| VACM(1) |
16.5 | % | 20.1 | % | ||||
| (1) | This is a non-GAAP financial measure. For more information regarding our use of this measure and its usefulness to investors, see the section titled “Non-GAAP Financial Measures” below. |
Revenue
Revenue for the Beauty and Personal Care segment increased 31.3%, or $89.5 million, to $375.8 million for the three months ended July 31, 2021 as compared to $286.3 million for the three months ended July 31, 2020, which resulted from:
| • | favorable sales mix change of $64.0 million, primarily due to increased shipments of higher priced color cosmetics and skin care products combined with a decrease in sales volume of lower priced soap and sanitizer products; and |
| • | higher sales volume of $25.5 million, reflecting an improvement across all product categories other than soap and sanitizers, which were negatively impacted by the COVID-19 pandemic in the prior-year period. |
Adjusted EBITDA
Adjusted EBITDA for the Beauty and Personal Care segment increased 6.0%, or $2.0 million, to $35.3 million for the three months ended July 31, 2021 as compared to $33.3 million for the three months ended July 31, 2020, which resulted from:
| • | $64.0 million increase related to a favorable sales mix change, primarily due to increased shipments of higher priced color cosmetics and skin care products combined with a decrease in sales volume of lower priced soap and sanitizer products; and |
85
Table of Contents
| • | $25.5 million increase related to higher overall sales volume, primarily reflecting an improvement across all product categories other than soap and sanitizers, which were negatively impacted by the COVID-19 pandemic in the prior-year period; |
partly offset by
| • | $56.0 million decrease due to higher material costs, reflecting the higher sales volume combined with mix; |
| • | $13.7 million decrease related to higher labor costs in part due to labor shortages; |
| • | $9.9 million decrease due to higher overhead costs, primarily attributable to higher sales volume; and |
| • | $7.9 million decrease related to higher SG&A expenses due to increased executive compensation as the prior-year period benefited from cost containment measures to offset the negative impacts of the COVID-19 pandemic, wage increases, as well as an increase in travel expenses. |
VACM
VACM for the Beauty and Personal Care segment decreased 3.6%, or 360 basis points, to 16.5% for the three months ended July 31, 2021 as compared to 20.1% for the three months ended July 31, 2020, which resulted from:
| • | 270 basis point decrease related to higher labor costs as a percentage of revenue from value added contributions in part due to labor shortages; and |
| • | 240 basis point decrease related to higher materials (excluding pass-through raw materials) as a percentage of revenue from value added contributions, due to unfavorable mix attributable to higher sales from our packaging and design business; |
partly offset by
| • | 150 basis point increase due to lower overhead and SG&A expenses as a percentage of revenue from value added contributions primarily reflecting operating leverage. |
Home Care
| Three Months Ended July 31, | ||||||||
| 2021 | 2020 | |||||||
| (in millions except percentages) | ||||||||
| Adjusted EBITDA |
$ | 26.0 | $ | 34.0 | ||||
| Adjusted EBITDA Margin |
11.4 | % | 17.3 | % | ||||
| VACM(1) |
30.7 | % | 41.0 | % | ||||
| (1) | This is a non-GAAP financial measure. For more information regarding our use of this measure and its usefulness to investors, see the section titled “Non-GAAP Financial Measures” below. |
Revenue
Revenue for the Home Care segment increased 16.1%, or $31.5 million, to $227.6 million for the three months ended July 31, 2021 as compared to $196.1 million for the three months ended July 31, 2020, which resulted from:
| • | higher sales volume of $50.4 million, virtually across all product categories, but mostly air care; |
partly offset by
| • | an unfavorable sales mix of $18.9 million, mostly attributable to higher sales volume of lower priced air care products. |
86
Table of Contents
Adjusted EBITDA
Adjusted EBITDA for the Home Care segment decreased 23.5%, or $8.0 million, to $26.0 million for the three months ended July 31, 2021 as compared to $34.0 million for the three months ended July 31, 2020, which primarily resulted from:
| • | $29.6 million decrease due to higher material costs largely attributable to higher sales volume combined with unfavorable mix; |
| • | $18.9 million decrease due to an unfavorable sales mix in air care products as discussed above; |
| • | $5.0 million decrease due to higher overhead costs, primarily attributable to higher sales volume; and |
| • | $3.1 million decrease related to higher labor costs in part due to labor shortages; |
partly offset by
| • | $50.4 million increase attributable to a favorable sales volume in the home care category as discussed above. |
VACM
VACM for the Home Care segment decreased 10.3%, or 1,030 basis points, to 30.7% for the three months ended July 31, 2021 as compared to 41.0% for the three months ended July 31, 2020, which resulted from:
| • | 550 basis point decrease due to higher overhead costs as a percentage of revenue from value added contributions largely attributable to unfavorable mix combined with higher headcount for fiscal year 2022; |
| • | 310 basis point decrease related to higher labor costs as a percentage of revenue from value added contributions, primarily due to unfavorable mix as well as labor shortages; and |
| • | 170 basis point decrease due to higher SG&A expenses as a percentage of revenue from value added contributions related to increased executive compensation as the prior-year period benefited from cost containment measures to offset the negative impacts of the COVID-19 pandemic, as well as higher headcount in the current year to support our growth, and wage increases. |
Comparison of the Year Ended April 30, 2021 (Successor), the Year Ended April 30, 2020 (Successor) and the Year Ended April 30, 2019 (Using Combined 2019 Financial Information)
The following summarizes information comparing the components of our consolidated statements of operations for the periods presented. The following discussion presents revenue, cost of revenue, gross margin, selling, general and administrative expenses and acquisition-related costs and other expenses on a disaggregated basis to improve comparability of these items over the relevant periods due to the impact of the 2020 Transactions. Interest expense, other expense (income), net and income tax benefit are only presented on an actual basis because most of these items are driven at the corporate level rather than the subsidiaries level.
Revenue
Fiscal Year Ended April 30, 2021 (Successor) vs Fiscal Year Ended April 30, 2020 (Successor)
Revenue increased 96.1%, or $1,050.4 million, to $2,143.8 million for the year ended April 30, 2021 as compared to $1,093.4 million for the year ended April 30, 2020. The 2020 Transactions contributed $998.7 million of the increase in revenues, mostly attributable to the strong performance of Zobele, mainly driven by increased demand, some of which is attributable to the COVID-19 pandemic, in the home care category led by air care, fabric care and pest control. The remaining acquisitions included in our Beauty and Personal Care segment have been negatively impacted by decreased demand, mainly in color cosmetics, partially offset by the increased demand for personal care products.
87
Table of Contents
On a disaggregated basis to exclude the impact of the 2020 Transactions, revenue increased 5.5%, or $51.7 million, to $995.9 million for the year ended April 30, 2021, as compared to $944.2 million for the year ended April 30, 2020. The $51.7 million increase in revenue, on a disaggregated basis, resulted from:
| • | favorable sales volume of $66.2 million compared to sales volumes in the prior year, reflecting higher shipments of personal care and home care products, in particular in the fourth quarter of fiscal year 2021 as compared to the fourth quarter of fiscal year 2020, which was unfavorably impacted by the COVID-19 pandemic, offset in part by lower shipments of color cosmetics; |
partly offset by
| • | an unfavorable sales mix change of $14.5 million, primarily attributable to lower sales volume of higher priced color cosmetics, combined with higher shipments of lower priced personal care and home care products. |
See further discussion below in “—Segment Results for the Fiscal Year Ended April 30, 2021 (Successor), the Fiscal Year Ended April 30, 2020 (Successor) and the Fiscal Year Ended April 30, 2019 (Using Combined 2019 Financial Information).”
Fiscal Year Ended April 30, 2020 (Successor) vs Fiscal Year Ended April 30, 2019 (Using Combined 2019 Financial Information)
Revenue increased 9.1%, or $90.8 million, to $1,093.4 million for the year ended April 30, 2020 as compared to $1,002.6 million for the year ended April 30, 2019 (using Combined 2019 Financial Information). The 2020 Transactions contributed $149.2 million of revenue in the year ended April 30, 2020, mainly driven by our acquisitions of Alkos and Swallowfield earlier in the fiscal year 2020, and HCT, acquired late in the fiscal third quarter, which were all unfavorably impacted by the COVID-19 pandemic.
On a disaggregated basis to exclude the impact of the 2020 Transactions, revenue decreased 5.8%, or $58.4 million, to $944.2 million for the year ended April 30, 2020, as compared to $1,002.6 million for the year ended April 30, 2019 (using Combined 2019 Financial Information). The $58.4 million decrease in revenue, on a disaggregated basis, resulted from:
| • | $45.7 million decrease due to unfavorable sales volume compared to the prior year, mainly reflecting lower shipments of color cosmetics, stemming from the impacts of the COVID-19 pandemic, including supply chain disruptions and temporary plant closures; and |
| • | $12.7 million decrease due to an unfavorable sales mix attributable to lower sales volume, mainly of color cosmetics, combined with increased shipments of lower priced personal care and home care products. |
See further discussion below in “—Segment Results for the Fiscal Year Ended April 30, 2021 (Successor), the Fiscal Year Ended April 30, 2020 (Successor) and the Fiscal Year Ended April 30, 2019 (Using Combined 2019 Financial Information).”
Cost of revenue
Fiscal Year Ended April 30, 2021 (Successor) vs Fiscal Year Ended April 30, 2020 (Successor)
Cost of revenue increased 92.4%, or $873.1 million, to $1,817.7 million for the year ended April 30, 2021 as compared to $944.6 million for the year ended April 30, 2020. The 2020 Transactions contributed $836.0 million of the increase in cost of revenue, mostly attributable to the strong performance of Zobele and the costs associated with fulfilling the increased demand, some of which is attributable to the COVID-19 pandemic, in the air care, fabric care and pest control categories. The remaining acquisitions included in our Beauty and Personal Care segment experienced volume related cost performance in line with the performance of the associated product category as well as increase in direct labor costs driven by overtime and other incentives driven in part by the COVID-19 pandemic.
88
Table of Contents
On a disaggregated basis to exclude the impact of the 2020 Transactions, cost of revenue increased 4.5%, or $37.1 million, to $856.3 million for the year ended April 30, 2021, as compared to $819.2 million for the year ended April 30, 2020. The $37.1 million increase in cost of revenue, on a disaggregated basis, primarily resulted from:
| • | $22.0 million increase due to higher input costs attributable to a rise in sales volume due to the effects of the COVID-19 pandemic, namely higher shipments of personal care and home care products as described above, in particular in the fourth quarter of fiscal year 2021 as compared to the fourth quarter of fiscal year 2020, offset in part by a favorable sales mix and initiatives undertaken to improve labor efficiency and continuous improvement projects; |
| • | $7.9 million increase related to higher overhead costs primarily resulting from higher compensation and warehouse expenses due to higher sales volume in the fourth quarter of fiscal year 2021; and |
| • | $7.8 million of incremental costs incurred in the current fiscal year as a result of the COVID-19 pandemic including higher direct labor costs attributable to increases in overtime and other wage incentives. |
Fiscal Year Ended April 30, 2020 (Successor) vs Fiscal Year Ended April 30, 2019 (Using Combined 2019 Financial Information)
Cost of revenue increased 8.3%, or $72.1 million, to $944.6 million for the year ended April 30, 2020 as compared to $872.5 million for the year ended April 30, 2019 (using Combined 2019 Financial Information). The 2020 Transactions contributed $125.4 million of cost of revenue, mainly driven by our acquisitions of Alkos and Swallowfield earlier in the fiscal year 2020, and HCT, acquired late in the fiscal third quarter, as described above.
On a disaggregated basis to exclude the impact of the 2020 Transactions, cost of revenue decreased 6.1%, or $53.3 million, to $819.2 million for the year ended April 30, 2020, as compared to $872.5 million for the year ended April 30, 2019 (using Combined 2019 Financial Information). The $53.3 million decrease in cost of revenue, on a disaggregated basis, primarily resulted from:
| • | $50.1 million decrease due to lower input costs attributable to the lower sales volume due to the effects of the COVID-19 pandemic combined with a favorable sales mix and labor efficiency; and |
| • | $3.1 million decrease due to a decrease in overhead costs primarily resulting from lower compensation and warehouse expenses due to lower sales volume stemming from the impacts of the COVID-19 pandemic; |
partly offset by
| • | $2.0 million increase due to higher depreciation and amortization expense resulting from increases in our property, plant and equipment. |
Gross margin
Fiscal Year Ended April 30, 2021 (Successor) vs Fiscal Year Ended April 30, 2020 (Successor)
Gross margin increased 160 basis points, to 15.2% for the year ended April 30, 2021 as compared to 13.6% for the year ended April 30, 2020. The contribution to gross margin of the businesses acquired as part of the 2020 Transactions was primarily due to Zobele (increases in air care, fabric care and pest control, some of which is attributable to the COVID-19 pandemic, as described above) as well as the net contribution to gross margin from the remaining acquisitions included in our Beauty and Personal Care segment (generally mixed performance with a decreased contribution, mainly from color cosmetics, and an increased contribution from personal care products).
89
Table of Contents
On a disaggregated basis to exclude the impact of the 2020 Transactions, gross margin increased 80 basis points, to 14.0% for the year ended April 30, 2021, as compared to 13.2% for the year ended April 30, 2020. The 80 basis points increase in gross margin, on a disaggregated basis, primarily resulted from:
| • | favorable sales mix driven from higher sales of certain personal care and home care products; |
partly offset by
| • | COVID-19 pandemic incremental costs including higher direct labor costs attributable to increases related to incremental cleaning and disinfecting combined with wage incentives. |
Fiscal Year Ended April 30, 2020 (Successor) vs Fiscal Year Ended April 30, 2019 (Using Combined 2019
Financial Information)
Gross margin increased 60 basis points, to 13.6% for the year ended April 30, 2020 as compared to 13.0% for the year ended April 30, 2019 (using Combined 2019 Financial Information). The gross margin contribution from the 2020 Transactions was mainly driven by our acquisitions of Alkos and Swallowfield earlier in the year, and HCT, acquired late in the fiscal third quarter, which were unfavorably impacted by the COVID-19 pandemic.
On a disaggregated basis to exclude the impact of the 2020 Transactions, gross margin increased 20 basis points, to 13.2% for the year ended April 30, 2020, as compared to 13.0% for the year ended April 30, 2019 (using Combined 2019 Financial Information). The 20 basis points increase in gross margin, on a disaggregated basis, primarily resulted from:
| • | favorable sales mix driven from higher sales of certain personal care and home care products; |
mostly offset by
| • | higher depreciation and amortization. |
Selling, general and administrative expenses
Fiscal Year Ended April 30, 2021 (Successor) vs Fiscal Year Ended April 30, 2020 (Successor)
Selling, general and administrative expenses increased 112.0%, or $151.5 million, to $286.8 million for the year ended April 30, 2021 as compared to $135.3 million for the year ended April 30, 2020. The 2020 Transactions contributed $135.3 million of the increase in selling, general and administrative expense, primarily attributable to the acquisition of Zobele at the end of fiscal year 2020.
On a disaggregated basis to exclude the impact of the 2020 Transactions, selling, general and administrative expenses increased 16.1%, or $16.2 million, to $117.1 million for the year ended April 30, 2021, as compared to $100.9 million for the year ended April 30, 2020. The $16.2 million increase in selling, general and administrative expenses, on a disaggregated basis, primarily resulted from:
| • | $7.3 million increase attributable to added corporate headcount, professional fees and information technology costs to support our growth strategy, net of lower travel expenses, and the favorable impact of restructuring initiatives; |
| • | $3.5 million increase in share-based compensation following adjustments made in accordance with the equitable adjustment provision of the Stock Option Plan; and |
| • | $3.3 million increase in Sponsor Management Fees, which are determined based on consolidated Adjusted EBITDA (as defined in the Services Agreement). |
As further described in Note 15, Employee benefits, to our audited consolidated financial statements for the year ended April 30, 2021 included elsewhere in this prospectus, upon the completion of this offering, our
90
Table of Contents
modified performance-based vesting options will become time-vested and vest over five years from the original grant date. As such, an expense is required for services that have been provided by the employees from the original service inception date until the date of this offering. We therefore expect to recognize that incremental share-based compensation expense of approximately $24.1 million during the quarter that this offering is completed.
Fiscal Year Ended April 30, 2020 (Successor) vs Fiscal Year Ended April 30, 2019 (Using Combined 2019 Financial Information)
Selling, general and administrative expenses increased 22.9%, or $25.2 million, to $135.3 million for the year ended April 30, 2020 as compared to $110.1 million for the year ended April 30, 2019 (using Combined 2019 Financial Information). The 2020 Transactions contributed $34.4 million of selling, general and administrative expenses, mainly driven by our acquisitions of Alkos and Swallowfield earlier in the year, and HCT, acquired late in the fiscal third quarter.
On a disaggregated basis to exclude the impact of the 2020 Transactions, selling, general and administrative expenses decreased 8.4%, or $9.2 million, to $100.9 million for the year ended April 30, 2020, as compared to $110.1 million for the year ended April 30, 2019 (using Combined 2019 Financial Information). The $9.2 million decrease in selling, general and administrative expenses, on a disaggregated basis, primarily resulted from:
| • | $14.8 million decrease due to lower share-based compensation under the Stock Option Plan following the Acquisition; |
partly offset by
| • | $4.6 million increase due to higher expenses excluding depreciation and amortization, as well as items reflecting additional compensation, professional fees, and information technology costs, to support our growth strategy; and |
| • | $2.3 million increase in sponsor fees primarily resulting from the transition between the fees paid to a prior sponsor during the Predecessor Period to the Sponsor Management Fees in the Successor Period following the Acquisition. |
Acquisition-related costs and other expenses
Fiscal Year Ended April 30, 2021 (Successor) vs Fiscal Year Ended April 30, 2020 (Successor)
Acquisition-related costs and other expenses decreased 32.8%, or $19.6 million, to $40.1 million for the year ended April 30, 2021 as compared to $59.7 million for the year ended April 30, 2020. Acquisition-related costs and other expenses relating to the 2020 Transactions, excluding acquisition-related costs incurred in the consummation of each of the 2020 Transactions, increased by $14.4 million, which is mostly attributable to restructuring activities of $8.5 million in Europe and California and to an impairment loss of $6.1 million on a right-of-use asset related to an office building space that we no longer plan to use as we initially intended due to quarantine restrictions and new working habits.
On a disaggregated basis to exclude the impact of the 2020 Transactions, acquisition-related costs and other expenses decreased 60.5%, or $34.0 million, to $22.2 million for the year ended April 30, 2021, as compared to $56.2 million for the year ended April 30, 2020. The $34.0 million decrease in acquisition-related costs and other expenses, on a disaggregated basis, primarily resulted from:
| • | acquisition-related costs of $48.7 million in the year ended April 30, 2020 incurred by corporate in connection with the 2020 Transactions; |
partly offset by
| • | $10.8 million incurred for initial public offering preparation-related costs; and |
91
Table of Contents
| • | reorganization costs of $2.9 million in the year ended April 30, 2021 related to the strategic reorganization to enable acquisition synergies and streamline the organization. |
Fiscal Year Ended April 30, 2020 (Successor) vs Fiscal Year Ended April 30, 2019 (Using Combined 2019
Financial Information)
Acquisition-related costs and other expenses increased 69.1%, or $24.4 million, to $59.7 million for the year ended April 30, 2020 as compared to $35.3 million for the year ended April 30, 2019 (using Combined 2019 Financial Information). The 2020 Transactions contributed $3.5 million of acquisition-related costs and other expenses, mostly attributable to the write-off of an indemnification asset recorded within the purchase price allocation of the acquisition of Alkos.
On a disaggregated basis to exclude the impact of the 2020 Transactions, acquisition-related costs and other expenses increased 59.2%, or $20.9 million, to $56.2 million for the year ended April 30, 2020, as compared to $35.3 million for the year ended April 30, 2019 (using Combined 2019 Financial Information). The $20.9 million increase in acquisition-related costs and other expenses, on a disaggregated basis, primarily resulted from:
| • | $13.4 million increase in our acquisition-related costs due to higher volume and more complex transactions entered into than the prior period; and |
| • | a write-off expense of $2.2 million related to indemnification assets recorded within the purchase price allocation of certain business acquisitions completed prior to the Acquisition. |
Impairment loss on goodwill and other intangibles
Impairment loss on goodwill and other intangibles was $48.2 million, for the year ended April 30, 2021 as compared to no charge for the year ended April 30, 2020. At the end of the second quarter of fiscal year 2021, we underwent a strategic reorganization to realign the business into two operating and reportable segments. Such assessment requires an evaluation of our reporting units prior to the reorganization. Accordingly, we performed a qualitative assessment and determined it was not more likely than not that goodwill was not impaired and proceeded to a quantitative assessment of the HCT reporting unit reported in the Beauty and Personal Care segment. We determined that a reduction in the projected net operating cash flows primarily attributable to the COVID-19 pandemic resulted in a reduction in the fair value of the HCT reporting unit requiring an impairment charge of $47.3 million and $0.9 million for goodwill and other intangibles, respectively.
Interest expense
Fiscal Year Ended April 30, 2021 (Successor) vs Fiscal Year Ended April 30, 2020 (Successor)
Interest expense increased 65.0%, or $30.8 million, to $78.2 million for the year ended April 30, 2021 as compared to $47.4 million for the year ended April 30, 2020. The $30.8 million increase in interest expense, on an actual basis, resulted from:
| • | $43.3 million increase related to additional interest expense from incremental term loans obtained during fiscal years 2021 and 2020, as described in Note 13, Debt, to our audited consolidated financial statements, to finance the growth of the business, including the 2020 Transactions and the Distribution Financing Transactions; and |
| • | $5.5 million increase related to higher amortization of discount and financing costs related to long-term debt; |
partly offset by
| • | $19.7 million decrease due to a lower effective rate, which was 4.9% for the year ended April 30, 2021 as compared to 7.4% for the year ended April 30, 2020. The decrease in the effective interest rate is primarily due to the decrease in LIBOR over the two periods and the decrease in the applicable rate from 4.25% to 3.75% as described in Note 13, Debt, to our audited consolidated financial statements. |
92
Table of Contents
Fiscal Year Ended April 30, 2020 (Successor) vs Fiscal Year Ended April 30, 2019 (Using Combined 2019 Financial Information)
Interest expense increased 9.7%, or $4.2 million, to $47.4 million for the year ended April 30, 2020 as compared to $43.2 million for the year ended April 30, 2019 (using Combined 2019 Financial Information). The $4.2 million increase in interest expense, on an actual basis, resulted from higher long-term borrowings to finance the 2020 Transactions (incremental term loans of $105.0 million and $300.0 million entered into on August 22, 2019 and January 23, 2020, respectively). The effective interest rates were comparable year over year.
Other expense (income), net
Fiscal Year Ended April 30, 2021 (Successor) vs Fiscal Year Ended April 30, 2020 (Successor)
Other expense (income), net increased 387.5%, or $9.3 million, to $11.7 million for the year ended April 30, 2021 as compared to $2.4 million for the year ended April 30, 2020. The $9.3 million increase in other expense (income), net, on an actual basis, primarily resulted from:
| • | $17.2 million increase attributable to an unfavorable change in fair value of derivative instruments, primarily driven by a loss on a foreign exchange forward contract entered into in connection with the incremental Euro Term Loan (as defined herein) of €460.0 million entered into during the first quarter of fiscal year 2021 and used to prepay the incremental term loans of $500.0 million entered into on April 30, 2020; |
largely offset by
| • | $11.5 million unrealized foreign exchange gain primarily driven by intercompany loans receivable, which are not included under the net investment in foreign operations. |
Income tax benefit
Fiscal Year Ended April 30, 2021 (Successor) vs Fiscal Year Ended April 30, 2020 (Successor)
Income tax benefit decreased 7.1%, or $1.0 million, to $13.1 million for the year ended April 30, 2021 as compared to $14.1 million for the year ended April 30, 2020. The $1.0 million decrease in income tax benefit, on an actual basis, primarily resulted from:
| • | $10.8 million decrease stemming from the effect of differences in tax rates in other jurisdictions; |
| • | $3.2 million decrease due to additional valuation allowance; |
| • | $2.0 million decrease related to additional non-deductible expenses; and |
| • | $1.7 million decrease related to prior year adjustments; |
partly offset by
| • | $11.4 million increase due to an increase of $42.9 million of loss before income taxes; |
| • | $3.5 million increase stemming from decreases related to unrecognized tax benefits; and |
| • | $2.3 million increase stemming from the effect of change in enacted tax rates. |
Fiscal Year Ended April 30, 2020 (Successor) vs Fiscal Year Ended April 30, 2019 (Using Combined 2019 Financial Information)
Income tax benefit increased 60.2%, or $5.3 million, to $14.1 million for the year ended April 30, 2020 as compared to $8.8 million for the year ended April 30, 2019 (using Combined 2019 Financial Information). The $5.3 million increase in income tax benefit, on an actual basis, primarily resulted from:
| • | $9.5 million increase due to an increase of $35.9 million of loss before income taxes; and |
93
Table of Contents
| • | $1.6 million increase related to prior year adjustments; |
partly offset by
| • | $2.8 million decrease stemming from the effect of change in enacted tax rates; |
| • | $1.7 million decrease stemming from the effect of differences in tax rates in other jurisdictions; and |
| • | $0.7 million decrease related to additional non-deductible expenses. |
Segment Results for the Year Ended April 30, 2021 (Successor), the Year Ended April 30, 2020 (Successor) and the Year Ended April 30, 2019 (Using Combined 2019 Financial Information)
The following summarizes information comparing certain financial information for our two operating segments, Beauty and Personal Care and Home Care for the periods presented.
Revenue Change Drivers by Segment
| Successor Period | Predecessor Period |
|||||||||||||||||||||||||||
| Year Ended April 30, 2021 (Actual) |
Disaggregated 2021 Financial Information(1) |
Year Ended April 30, 2020 (Actual) |
Disaggregated
2020 Financial Information(1) |
November 30, 2018 through April 30, 2019 (Actual) |
May 1, 2018 through December 20, 2018 (Actual) |
Combined 2019 Financial Information(1) |
||||||||||||||||||||||
| (in millions except percentages) | ||||||||||||||||||||||||||||
| Revenue: |
||||||||||||||||||||||||||||
| Beauty and Personal Care |
$ | 1,314.2 | $ | 827.5 | $ | 949.7 | $ | 800.5 | $ | 318.9 | $ | 536.2 | $ | 855.1 | ||||||||||||||
| Home Care |
829.6 | 168.4 | 143.7 | 143.7 | 50.9 | 96.6 | 147.5 | |||||||||||||||||||||
|
|
|
|
|
|
|
|
|
|
|
|
|
|
|
|||||||||||||||
| Total revenue |
$ | 2,143.8 | $ | 995.9 | $ | 1,093.4 | $ | 944.2 | $ | 369.8 | $ | 632.8 | $ | 1,002.6 | ||||||||||||||
|
|
|
|
|
|
|
|
|
|
|
|
|
|
|
|||||||||||||||
| Percentage of total revenue: |
||||||||||||||||||||||||||||
| Beauty and Personal Care |
61.3 | % | 83.1 | % | 86.9 | % | 84.8 | % | 86.2 | % | 84.7 | % | 85.3 | % | ||||||||||||||
| Home Care |
38.7 | 16.9 | 13.1 | 15.2 | 13.8 | 15.3 | 14.7 | |||||||||||||||||||||
|
|
|
|
|
|
|
|
|
|
|
|
|
|
|
|||||||||||||||
| Total |
100.0 | % | 100.0 | % | 100.0 | % | 100.0 | % | 100.0 | % | 100.0 | % | 100.0 | % | ||||||||||||||
|
|
|
|
|
|
|
|
|
|
|
|
|
|
|
|||||||||||||||
| (1) | See “Supplemental Financial Information” for an explanation as to how the Disaggregated 2021 Financial Information, Disaggregated 2020 Financial Information and the Combined 2019 Financial Information are calculated. |
Beauty and Personal Care
| Successor Period | Predecessor Period |
|||||||||||||||||||
| Year Ended April 30, 2021 (Actual) |
Year Ended April 30, 2020 (Actual) |
November 30, 2018 through April 30, 2019 (Actual) |
May 1, 2018 through December 20, 2018 (Actual) |
Combined 2019 Financial Information(1) |
||||||||||||||||
| (in millions except percentages) | ||||||||||||||||||||
| Adjusted EBITDA |
$ | 132.3 | $ | 76.4 | $ | 33.8 | $ | 46.2 | $ | 80.0 | ||||||||||
| Adjusted EBITDA Margin |
10.1 | % | 8.0 | % | 10.6 | % | 8.6 | % | 9.4 | % | ||||||||||
| VACM(2) |
17.8 | % | 16.8 | % | 24.0 | % | 19.5 | % | 21.2 | % | ||||||||||
| (1) | See “Supplemental Financial Information” for an explanation as to how the Combined 2019 Financial Information is calculated. |
| (2) | This is a non-GAAP financial measure. For more information regarding our use of this measure and its usefulness to investors, see the section titled “Non-GAAP Financial Measures” below. |
94
Table of Contents
Revenue
Fiscal Year Ended April 30, 2021 (Successor) vs Fiscal Year Ended April 30, 2020 (Successor)
Revenue for the Beauty and Personal Care segment increased 38.4%, or $364.5 million, to $1,314.2 million for the year ended April 30, 2021 as compared to $949.7 million for the year ended April 30, 2020. The 2020 Transactions contributed $337.5 million of revenue with those acquired businesses unfavorably impacted by decreased demand, mainly in color cosmetics, while favorably impacted by the increased demand for personal care products.
On a disaggregated basis to exclude the impact of the 2020 Transactions, revenue for the Beauty and Personal Care segment increased 3.4%, or $27.0 million, to $827.5 million for the year ended April 30, 2021, as compared to $800.5 million for the year ended April 30, 2020. The $27.0 million increase in revenue for the Beauty and Personal Care segment, on a disaggregated basis, resulted from:
| • | $34.5 million increase due to higher overall sales volume, primarily reflecting an increase in personal care product volume in particular in the fourth quarter of fiscal year 2021 compared to the fourth quarter of fiscal year 2020 impacted by the COVID-19 pandemic, net of lower shipments of color cosmetics; |
partly offset by
| • | $7.5 million decrease related to an unfavorable sales mix change, primarily due to lower sales volume of higher priced color cosmetics combined with higher sales volume of lower priced personal care products. |
Fiscal Year Ended April 30, 2020 (Successor) vs Fiscal Year Ended April 30, 2019 (Using Combined 2019 Financial Information)
Revenue for the Beauty and Personal Care segment increased 11.1%, or $94.6 million, to $949.7 million for the year ended April 30, 2020 as compared to $855.1 million for the year ended April 30, 2019 (using Combined 2019 Financial Information). The 2020 Transactions contributed $149.2 million of revenue, mainly driven by our acquisitions of Alkos and Swallowfield earlier in the year, and HCT, acquired late in the fiscal third quarter, which were all unfavorably impacted by the COVID-19 pandemic.
On a disaggregated basis to exclude the impact of the 2020 Transactions, revenue for the Beauty and Personal Care segment decreased 6.4%, or $54.6 million, to $800.5 million for the year ended April 30, 2020, as compared to $855.1 million for the year ended April 30, 2019 (using Combined 2019 Financial Information). The $54.6 million decrease in revenue for the Beauty and Personal Care segment, on a disaggregated basis, resulted from:
| • | $56.0 million decrease due to lower sales volume compared to the prior year, primarily reflecting lower shipments of color cosmetics stemming from the impacts of the COVID-19 pandemic, which negatively impacted the color cosmetics market; |
partly offset by
| • | $1.4 million increase due to a favorable revenue sales mix attributable to a decline in sales of lower priced single-use application products, combined with increases in favorable margins from shipments of certain personal care products. |
Adjusted EBITDA
Fiscal Year Ended April 30, 2021 (Successor) vs Fiscal Year Ended April 30, 2020 (Successor)
Adjusted EBITDA for the Beauty and Personal Care segment increased 73.2%, or $55.9 million, to $132.3 million for the year ended April 30, 2021 as compared to $76.4 million for the year ended April 30, 2020.
95
Table of Contents
The $55.9 million increase in Adjusted EBITDA for the Beauty and Personal Care segment, on an actual basis, primarily resulted from:
| • | $41.8 million increase driven by our acquisitions of Swallowfield earlier in the fiscal year 2020, HCT, acquired late in the third quarter of fiscal year 2020 and CLA, acquired in the fourth quarter of fiscal year 2020; and |
| • | $34.5 million increase related to higher overall sales volume, primarily reflecting an increase in personal care product volume, net of unfavorable color cosmetics shipments; |
partly offset by
| • | $8.8 million decrease due to higher compensation, professional fees and overhead costs to support our growth strategy; |
| • | $7.5 million decrease related to an unfavorable sales mix change, primarily due to lower sales volume of higher priced color cosmetics combined with higher sales volume of personal care products; and |
| • | $7.0 million decrease due to higher input costs, related to higher sales volume in the fourth quarter of fiscal year 2021 compared to the fourth quarter of fiscal year 2020 impacted by the COVID-19 pandemic. |
Fiscal Year Ended April 30, 2020 (Successor) vs Fiscal Year Ended April 30, 2019 (Using Combined 2019 Financial Information)
Adjusted EBITDA for the Beauty and Personal Care segment decreased 4.5%, or $3.6 million, to $76.4 million for the year ended April 30, 2020 as compared to $80.0 million for the year ended April 30, 2019 (using Combined 2019 Financial Information). The $3.6 million decrease in Adjusted EBITDA for the Beauty and Personal Care segment, on an actual basis, primarily resulted from:
| • | $56.0 million decrease due to lower sales volume compared to the prior year, reflecting lower shipments of color cosmetics stemming from the impacts of the COVID-19 pandemic; |
largely offset by
| • | $45.9 million increase due to lower input costs, related to lower sales volume stemming from the impacts of the COVID-19 pandemic; |
| • | $6.0 million increase due to lower compensation and overhead costs primarily resulting from lower sales volume stemming from the impacts of the COVID-19 pandemic; and |
| • | $2.8 million increase driven by our acquisitions of Swallowfield earlier in the fiscal year 2020, HCT, acquired late in the third quarter of fiscal year 2020 and CLA, acquired in the fourth quarter of fiscal year 2020. |
VACM
Fiscal Year Ended April 30, 2021 (Successor) vs Fiscal Year Ended April 30, 2020 (Successor)
VACM for the Beauty and Personal Care segment increased to 17.8% for the year ended April 30, 2021 as compared to 16.8% for the year ended April 30, 2020, primarily as a result of:
| • | a favorable sales mix of higher volume of personal care products with a higher VACM combined with lower volume of color cosmetics with a lower VACM; |
partially offset by
| • | the mix impact attributable to the acquisition of our newly acquired packaging and design business; and |
| • | higher compensation, professional fees, and overhead costs to support our growth strategy. |
96
Table of Contents
Fiscal Year Ended April 30, 2020 (Successor) vs Fiscal Year Ended April 30, 2019 (Using Combined 2019 Financial Information)
VACM for the Beauty and Personal Care segment decreased to 16.8% for the year ended April 30, 2020 as compared to 21.2% for the year ended April 30, 2019, primarily as a result of the mix impact attributable to the acquisition of our newly acquired packaging and design business.
Home Care
| Successor Period | Predecessor Period |
|||||||||||||||||||
| Year Ended April 30, 2021 (Actual) |
Year Ended April 30, 2020 (Actual) |
November 30, 2018 through April 30, 2019 (Actual) |
May 1, 2018 through December 20, 2018 (Actual) |
Combined 2019 Financial Information(1) |
||||||||||||||||
| (in millions except percentages) | ||||||||||||||||||||
| Adjusted EBITDA |
$ | 124.6 | $ | 26.3 | $ | 9.3 | $ | 19.2 | $ | 28.5 | ||||||||||
| Adjusted EBITDA Margin |
15.0 | % | 18.3 | % | 18.3 | % | 19.9 | % | 19.3 | % | ||||||||||
| VACM(2) |
36.7 | % | 39.4 | % | 42.1 | % | 46.2 | % | 44.7 | % | ||||||||||
| (1) | See “Supplemental Financial Information” for an explanation as to how the Combined 2019 Financial Information is calculated. |
| (2) | This is a non-GAAP financial measure. For more information regarding our use of this measure and its usefulness to investors, see the section titled “Non-GAAP Financial Measures” below. |
Revenue
Fiscal Year Ended April 30, 2021 (Successor) vs Fiscal Year Ended April 30, 2020 (Successor)
Revenue for the Home Care segment increased 477.3%, or $685.9 million, to $829.6 million for the year ended April 30, 2021 as compared to $143.7 million for the year ended April 30, 2020. The 2020 Transactions contributed $661.2 million of revenue, attributable to the strong performance of Zobele, mainly driven by increased demand, some of which was attributable to the COVID-19 pandemic, in the home care category led by air care, fabric care and pest control.
On a disaggregated basis to exclude the impact of the 2020 Transactions, revenue for the Home Care segment increased 17.2%, or $24.7 million, to $168.4 million for the year ended April 30, 2021, as compared to $143.7 million for the year ended April 30, 2020. The $24.7 million increase in revenue for the Home Care segment, on a disaggregated basis, resulted from:
| • | $27.5 million increase due to higher sales volume primarily reflecting an increase in both household and air care product volume in particular in the fourth quarter of fiscal year 2021 as compared to the fourth quarter of fiscal year 2020 as a result of the COVID-19 pandemic; |
partly offset by
| • | an unfavorable sales mix of $2.8 million, primarily attributable to higher sales volume of lower priced air care products. |
As the only acquisition in the Home Care segment (Zobele) was completed on April 30, 2020, the Disaggregated 2020 Financial Information is equal to the actual results for the year ended April 30, 2020.
97
Table of Contents
Fiscal Year Ended April 30, 2020 (Successor) vs Fiscal Year Ended April 30, 2019 (Using Combined 2019 Financial Information)
Revenue for the Home Care segment decreased 2.6%, or $3.8 million, to $143.7 million for the year ended April 30, 2020 as compared to $147.5 million for the year ended April 30, 2019 (using Combined 2019 Financial Information), on an actual basis, resulting from:
| • | $11.9 million decrease due to unfavorable sales mix attributable to higher sales volume of lower priced air care products combined with lower shipments of higher priced household care products; |
partly offset by
| • | $8.1 million increase due to higher sales volume compared to the prior period, primarily for air care products, despite disruption in the retail distribution channel and temporary manufacturing facility closures in the fourth quarter in connection with the COVID-19 pandemic. |
As the only acquisition in the Home Care segment (Zobele) was completed on April 30, 2020, the Disaggregated 2020 Financial Information is equal to the actual results.
Adjusted EBITDA
Fiscal Year Ended April 30, 2021 (Successor) vs Fiscal Year Ended April 30, 2020 (Successor)
Adjusted EBITDA for the Home Care segment increased 373.8%, or $98.3 million, to $124.6 million for the year ended April 30, 2021 as compared to $26.3 million for the year ended April 30, 2020. The $98.3 million increase in Adjusted EBITDA for the Home Care segment, on an actual basis, primarily resulted from:
| • | $90.0 million increase due to the acquisition of Zobele on April 30, 2020; and |
| • | $27.5 million increase related to higher sales volume driven by increased demand in the home care category as discussed above; |
partly offset by
| • | $15.0 million decrease due to higher input costs due to higher sales volume; and |
| • | $2.4 million decrease due to higher compensation, professional fees and overhead costs to support our growth strategy. |
Fiscal Year Ended April 30, 2020 (Successor) vs Fiscal Year Ended April 30, 2019 (Using Combined 2019 Financial Information)
Adjusted EBITDA for the Home Care segment decreased 7.7%, or $2.2 million, to $26.3 million for the year ended April 30, 2020 as compared to $28.5 million for the year ended April 30, 2019 (using Combined 2019 Financial Information). The $2.2 million decrease in Adjusted EBITDA for the Home Care segment, on an actual basis, primarily resulted from:
| • | $11.9 million decrease due to unfavorable sales mix attributable to higher sales volume of lower priced products, as discussed above; and |
| • | $2.0 million decrease due to higher compensation, travel expenses and overhead costs to support our growth strategy; |
largely offset by
| • | $8.1 million increase due to higher sales volume compared to the prior-year period, primarily for air care products, as discussed above; and |
| • | $4.2 million increase, due to lower cost of revenue related to a decrease in input costs primarily a result of higher sales for home care products with a favorable cost mix. |
98
Table of Contents
VACM
Fiscal Year Ended April 30, 2021 (Successor) vs Fiscal Year Ended April 30, 2020 (Successor)
VACM for the Home Care segment decreased to 36.7% for the year ended April 30, 2021 as compared to 39.4% for the year ended April 30, 2020, primarily as a result of:
| • | an unfavorable mix, primarily attributable to higher volume of certain home care products with a lower VACM; |
| • | the mix impact attributable to the acquisition of Zobele on April 30, 2020; and |
| • | higher direct labor costs. |
Fiscal Year Ended April 30, 2020 (Successor) vs Fiscal Year Ended April 30, 2019 (Using Combined 2019 Financial Information)
VACM for the Home Care segment decreased to 39.4% for the year ended April 30, 2021 as compared to 44.7% for the year ended April 30, 2020, primarily as a result of:
| • | an unfavorable mix primarily attributable to higher volume of certain home care products with a lower VACM; and |
| • | higher compensation, travel expenses and overhead costs to support our growth strategy. |
Key Performance and Operational Metrics
In addition to the measures presented in our consolidated financial statements included elsewhere in this prospectus, we use Adjusted EBITDA, Adjusted EBITDA Margin and VACM as key performance and operational metrics to evaluate our business, measure our performance, develop financial forecasts, and make strategic decisions.
| Successor Period | Predecessor Period |
|||||||||||||||||||||||||||
| Three Months Ended July 31, 2021 |
Three Months Ended July 31, 2020 |
Year Ended April 30, 2021 |
Year Ended April 30, 2020 |
November 30, 2018 through April 30, 2019 |
May 1, 2018 through December 20, 2018 |
Combined 2019 Financial Information(1) |
||||||||||||||||||||||
| (in millions except percentages) | ||||||||||||||||||||||||||||
| Net loss |
$ | (12.7 | ) | $ | (0.6 | ) | $ | (125.8 | ) | $ | (81.9 | ) | $ | (9.3 | ) | $ | (22.7 | ) | $ | (51.3 | ) | |||||||
| Adjusted EBITDA(2) |
$ | 54.7 | $ | 63.1 | $ | 238.5 | $ | 92.2 | $ | 39.1 | $ | 63.2 | $ | 102.3 | ||||||||||||||
| Adjusted EBITDA Margin(2) |
9.1 | % | 13.1 | % | 11.1 | % | 8.4 | % | 10.6 | % | 10.0 | % | 10.2 | % | ||||||||||||||
| VACM(2) |
18.3 | % | 25.4 | % | 22.0 | % | 17.6 | % | 24.0 | % | 22.7 | % | 23.2 | % | ||||||||||||||
| (1) | See “Supplemental Financial Information” for an explanation as to how the Combined 2019 Financial Information is calculated. |
| (2) | These are non-GAAP financial measures. For more information regarding our use of these measures and their usefulness to investors, see the section titled “Non-GAAP Financial Measures” below. |
Non-GAAP Financial Measures
To supplement our financial results presented in accordance with GAAP, we use the following key performance and operational metrics to evaluate our business, measure and analyze our performance period-over-period, develop financial forecasts, and make strategic decisions: Value-Added Contribution Margin (“VACM”), Adjusted EBITDA, and Adjusted EBITDA Margin. We believe users of the consolidated financial statements included elsewhere in this prospectus will find the non-GAAP information helpful in understanding the ongoing performance of operations separate from items that may have a disproportionate positive or negative impact on our financial results in any particular period.
99
Table of Contents
These non-GAAP financial measures are not prepared in accordance with GAAP. They are supplemental financial measures of our operating performance only and should not be considered in isolation nor as a substitute for GAAP financial measures, including net loss (for Adjusted EBITDA, Adjusted EBITDA Margin and VACM), which we consider to be the most directly comparable GAAP financial measures. All of these non-GAAP financial measures have limitations as analytical tools, and when assessing our operating performance, you should not consider these in isolation or as substitutes for net loss or other statement of operations data prepared in accordance with GAAP. Our non-GAAP measures do not have any standardized meaning prescribed by GAAP and therefore other companies may calculate any or all of these non-GAAP measures differently than we do, limiting their usefulness as a comparative tool. Where appropriate, to better understand the relationship of non-GAAP financial measures to the financial information calculated in accordance with GAAP, we have provided a quantitative reconciliation of the non-GAAP financial measures to the most directly comparable financial measures calculated and reported in accordance with GAAP. For more information on the use of non-GAAP financial information, including other non-GAAP financial measures presented in this prospectus, see “Prospectus Summary—Summary Consolidated Financial and Other Data.”
Value-Added Contribution Margin
Value-Added Contribution Margin (“VACM”) is calculated by dividing Adjusted EBITDA by revenue from value added contributions. Management believes that VACM is an important measure in analyzing the results of the business for the following reasons:
| • | our business is focused on innovation, product development and operational excellence, and, as a result, VACM reflects the way customers interact with us and the value embedded in the Company’s product delivery that we provide to them; |
| • | a significant portion of revenue from raw materials is generated through arrangements with mechanisms that pass through raw material costs, and accordingly the associated revenue is recorded as revenue from pass-through raw materials (as defined elsewhere in this prospectus) and is excluded from the calculation of VACM; and |
| • | we utilize revenue from value added contributions to assess growth between fiscal periods and to analyze the resulting margins apart from revenue from pass-through raw materials (VACM will fluctuate between periods depending upon the Company’s ability to drive sales of higher margin solutions (i.e., favorable product mix, integrated sales) and to generate operating efficiencies across our network, including the ability to scale operations, as well as changes to the product portfolio and by the nature of the Company’s acquisitions from time to time). |
As a result, we believe that VACM is the best way to measure our business in a consistent manner, taking into account that customers have the flexibility to do business with us in more than one way, with some choosing a customer-supplied materials framework (which would not result in revenue to us) while others choose a kdc/one-supplied materials framework (which would result in revenue to us equal to the pass-through cost of such materials). If VACM is not used to measure performance, the transaction with the customer that chooses a kdc/one-supplied materials framework would appear to be lower margin than the transaction with the customer that chooses a customer-supplied materials framework when the profitability to us of both transactions would be the same.
For a reconciliation of Adjusted EBITDA, see “Prospectus Summary—Summary Consolidated Financial and Other Data.” The most directly comparable GAAP measure to Adjusted EBITDA Margin and VACM is net income margin. In this prospectus we have excluded a presentation of net income margin because we have experienced a net loss for all the relevant periods and therefore the net income margin would be less than zero and consequently we believe not helpful to investors. However, wherever we present Adjusted EBITDA Margin and VACM we present net loss. For a description of the revenue from value added contributions, see “—Components of Revenue.”
100
Table of Contents
Adjusted EBITDA and Adjusted EBITDA Margin
To supplement our financial results presented in accordance with GAAP, we disclose Adjusted EBITDA, which represents net income or loss before interest expense, other expense (income), net, income tax benefit, depreciation and amortization, share-based compensation, acquisition-related costs and external consultants costs, costs associated with becoming a public company, certain incremental costs associated with the COVID-19 pandemic that we do not expect to continue to incur once COVID-19 has significantly subsided globally and operations return to pre-COVID-19 levels, plant start-up costs incurred for our new facility in Columbus before significant operations begin, including payroll and rent, sponsor fees (including the Sponsor Fees which are terminating in connection with this offering), impairment loss on assets and other intangibles and certain other adjustment items. Adjusted EBITDA Margin is calculated by dividing Adjusted EBITDA by revenue.
We use Adjusted EBITDA and Adjusted EBITDA Margin as measures of operating performance and the operating leverage in our business. We believe that these non-GAAP financial measures are useful to investors for period-to-period comparisons of our business and in understanding and evaluating our operating results for the following reasons:
| • | Adjusted EBITDA and Adjusted EBITDA Margin are widely used by investors and securities analysts to measure a company’s operating performance without regard to items such as share-based compensation expense, depreciation and amortization expense, interest expense, other expense (income), net and income taxes expense (benefit) that can vary substantially from company to company depending upon their financing, capital structures, and the method by which assets were acquired; and |
| • | Adjusted EBITDA and Adjusted EBITDA Margin provide consistency and comparability with our past financial performance, facilitate period-to-period comparisons of our primary operating results, and also facilitate comparisons with other peer companies, many of which use similar non-GAAP financial measures to supplement their GAAP results. |
For a reconciliation of Adjusted EBITDA, see “Prospectus Summary—Summary Consolidated Financial and Other Data.”
Components of Revenue
The unaudited supplemental revenue information for the three-month periods ended July 31, 2021 and 2020, the fiscal years ended April 30, 2021 and 2020 and for the periods from November 30, 2018 through April 30, 2019 and May 1, 2018 through December 20, 2018 and the 2019 Combined Financial Information presents the components of our consolidated and segment revenue in two categories: revenue from pass-through raw materials and revenue from value added contributions.
Our business is focused on innovation, product development and operational excellence, and, as a result, revenue from value added contribution reflects the way customers interact with us and the value embedded in the Company’s product delivery that we provide to them. Revenue from pass-through raw materials includes the portion of revenue generated from the raw materials and the related inbound and outbound freight included in manufactured finished goods sold through arrangements with mechanisms that pass through raw material costs.
Revenue from valued added contributions includes all other revenue earned from selling manufactured finished goods. Also included in revenue from value added contributions is revenue from raw materials from our packaging design and production business where variations in raw material prices are not passed through to the customer. See Note 3, Revenue, to our audited consolidated financial statements for the year ended April 30, 2021 and Note 2, Revenue, to our unaudited consolidated financial statements for the three months ended July 31, 2021 included elsewhere in this prospectus. The following tables set forth components of revenue for the consolidated Company and for our two operating segments, Beauty and Personal Care and Home Care, for the periods presented.
101
Table of Contents
Unaudited Consolidated Supplemental Revenue Information
| Successor Period | Predecessor Period |
|||||||||||||||||||||||||||
| Three Months Ended July 31, 2021 |
Three Months Ended July 31, 2020 |
Year Ended April 30, 2021 |
Year Ended April 30, 2020 |
November 30, 2018 through April 30, 2019 |
May 1, 2018 through December 20, 2018 |
Combined 2019 Financial Information(1) |
||||||||||||||||||||||
| (in millions) | ||||||||||||||||||||||||||||
| Revenue from pass-through raw materials |
$ | 304.9 | $ | 234.0 | $ | 1,060.6 | $ | 570.8 | $ | 207.0 | $ | 354.8 | $ | 561.8 | ||||||||||||||
| Revenue from value added contributions |
298.5 | 248.4 | 1,083.2 | 522.6 | 162.8 | 278.0 | 440.8 | |||||||||||||||||||||
|
|
|
|
|
|
|
|
|
|
|
|
|
|
|
|||||||||||||||
| Total revenue |
$ | 603.4 | $ | 482.4 | $ | 2,143.8 | $ | 1,093.4 | $ | 369.8 | $ | 632.8 | $ | 1,002.6 | ||||||||||||||
|
|
|
|
|
|
|
|
|
|
|
|
|
|
|
|||||||||||||||
| (1) | See “Supplemental Financial Information” for an explanation as to how the Combined 2019 Financial Information is calculated. |
Unaudited Supplemental Financial Information by Segment
Beauty and Personal Care
| Successor Period | Predecessor Period |
|||||||||||||||||||||||||||
| Three Months Ended July 31, 2021 |
Three Months Ended July 31, 2020 |
Year Ended April 30, 2021 |
Year Ended April 30, 2020 |
November 30, 2018 through April 30, 2019 |
May 1, 2018 through December 20, 2018 |
Combined 2019 Financial Information(1) |
||||||||||||||||||||||
| (in millions) |
||||||||||||||||||||||||||||
| Revenue from pass-through raw materials |
$ | 162.1 | $ | 120.9 | $ | 570.6 | $ | 493.8 | $ | 178.2 | $ | 299.8 | $ | 478.0 | ||||||||||||||
| Revenue from value added contributions |
213.7 | 165.4 | 743.6 | 455.9 | 140.7 | 236.4 | 377.1 | |||||||||||||||||||||
|
|
|
|
|
|
|
|
|
|
|
|
|
|
|
|||||||||||||||
| Total revenue |
$ | 375.8 | $ | 286.3 | $ | 1,314.2 | $ | 949.7 | $ | 318.9 | $ | 536.2 | $ | 855.1 | ||||||||||||||
|
|
|
|
|
|
|
|
|
|
|
|
|
|
|
|||||||||||||||
| (1) | See “Supplemental Financial Information” for an explanation as to how the Combined 2019 Financial Information is calculated. |
Home Care
| Successor Period | Predecessor Period |
|||||||||||||||||||||||||||
| Three Months Ended July 31, 2021 |
Three Months Ended July 31, 2020 |
Year Ended April 30, 2021 |
Year Ended April 30, 2020 |
November 30, 2018 through April 30, 2019 |
May 1, 2018 through December 20, 2018 |
Combined 2019 Financial Information(1) |
||||||||||||||||||||||
| (in millions) |
||||||||||||||||||||||||||||
| Revenue from pass-through raw materials |
$ | 142.8 | $ | 113.1 | $ | 490.0 | $ | 77.0 | $ | 28.8 | $ | 55.0 | $ | 83.8 | ||||||||||||||
| Revenue from value added contributions |
84.8 | 83.0 | 339.6 | 66.7 | 22.1 | 41.6 | 63.7 | |||||||||||||||||||||
|
|
|
|
|
|
|
|
|
|
|
|
|
|
|
|||||||||||||||
| Total revenue |
$ | 227.6 | $ | 196.1 | $ | 829.6 | $ | 143.7 | $ | 50.9 | $ | 96.6 | $ | 147.5 | ||||||||||||||
|
|
|
|
|
|
|
|
|
|
|
|
|
|
|
|||||||||||||||
| (1) | See “Supplemental Financial Information” for an explanation as to how the Combined 2019 Financial Information is calculated. |
102
Table of Contents
Liquidity and Capital Resources
Since inception, our operations have been financed primarily through a combination of the cash flows from operations, borrowings under the committed Revolving Facility (as defined herein), as well as issuance of debt and of equity. The Revolving Facility and all of our outstanding debt, including the Term Loans (as defined herein), are secured by a lien on our collective assets, which is senior to any other lien otherwise secured against our assets. We believe that our existing sources of cash, as described above, will be sufficient to support our operating, capital expenditure and debt service requirements for at least the next 12 months.
Historical Cash Flows
The following tables present a summary of our net cash provided by (used in) operating, investing and financing activities:
| Three Months Ended July 31, | ||||||||||||
| 2021 | 2020 | Change | ||||||||||
| (in millions) | ||||||||||||
| Operating activities |
$ | (17.6 | ) | $ | (21.9 | ) | $ | 4.3 | ||||
| Investing activities |
$ | (74.2 | ) | $ | (16.3 | ) | $ | (57.9 | ) | |||
| Financing activities |
$ | 70.3 | $ | (50.1 | ) | $ | 120.4 | |||||
| Successor Period | Successor Period |
Predecessor Period |
||||||||||||||||||||||||||
| Year Ended April 30, 2021 |
Year Ended April 30, 2020 |
Change | November 30, 2018 through April 30, 2019 |
May 1, 2018 through December 20, 2018 |
Combined 2019 Financial Information(1) |
Change | ||||||||||||||||||||||
| (in millions) |
||||||||||||||||||||||||||||
| Operating activities |
$ | 51.7 | $ | 33.3 | $ | 18.4 | $ | (47.6 | ) | $ | 28.9 | $ | (18.7 | ) | $ | 52.0 | ||||||||||||
| Investing activities |
$ | (117.7 | ) | $ | (969.5 | ) | $ | 851.8 | $ | (647.2 | ) | $ | (8.9 | ) | $ | (656.1 | ) | $ | (313.4 | ) | ||||||||
| Financing activities |
$ | 5.9 | $ | 1,107.8 | $ | (1,101.9 | ) | $ | 698.3 | $ | (8.0 | ) | $ | 690.3 | $ | 417.5 | ||||||||||||
| (1) | The amounts shown in this table for the Combined 2019 Financial Information represent the sum of the amounts for the period from November 30, 2018 through April 30, 2019 (Successor Period) and the period from May 1, 2018 through December 20, 2018 (Predecessor Period). |
Operating Activities
Three Months Ended July 31, 2021 (Successor) vs Three Months Ended July 31, 2020 (Successor)
Net cash used in operating activities improved $4.3 million, to $17.6 million for the three months ended July 31, 2021 as compared to $21.9 million for the three months ended July 31, 2020. This improvement reflects:
| • | $2.5 million increase in net loss adjusted for non-cash items; and |
| • | $1.8 million improvement in working capital, primarily reflecting favorable changes in trade and other receivables, related party payables and deferred revenue, largely offset by unfavorable changes in inventories and accounts payable and accrued expenses. |
Overall operating cash flows were negative for both of the three-month periods primarily due to higher levels of inventory in support of the business.
Fiscal Year Ended April 30, 2021 (Successor) vs Fiscal Year Ended April 30, 2020 (Successor)
Net cash provided by operating activities increased $18.4 million, to $51.7 million for the year ended April 30, 2021 as compared to $33.3 million for the year ended April 30, 2020. This increase primarily reflects:
103
Table of Contents
| • | $63.6 million decrease in net loss after adjusting for non-cash items, including a $81.1 million increase in depreciation and amortization due to additions in our property, plant and equipment, and intangible assets, an impairment charge of $48.2 million on goodwill and other intangibles, an impairment charge of $6.1 million on right-of-use assets, partly offset by $15.7 million net foreign exchange gain and $12.2 million increase in benefit for deferred income taxes; and |
| • | $48.5 million increase in accounts payable, accrued expenses and other payables related to increased expenditures to support general business growth; |
largely offset by
| • | $54.6 million increase in inventories due in part from the build-up of inventory to support sales growth in our Home Care segment and the temporary build-up resulting from the relocation of a facility, as well as shipping constraints affecting our facilities in California in the fourth quarter of fiscal year 2021; and |
| • | $44.4 million net increase in trade and other receivables and related party receivables mostly resulting from the impact of higher revenue, in particular in the fourth quarter of fiscal year 2021 as compared to the fourth quarter of fiscal year 2020, which was unfavorably impacted by the COVID-19 pandemic. |
Fiscal Year Ended April 30, 2020 (Successor) vs Fiscal Year Ended April 30, 2019 (Using Combined 2019 Financial Information)
Net cash provided by operating activities increased $52.0 million, to $33.3 million for the year ended April 30, 2020 as compared to net cash used in operating activities of $18.7 million for the year ended April 30, 2019 (using Combined 2019 Financial Information). This increase primarily reflects:
| • | $48.5 million decrease in trade and other receivables resulting from the impact of lower revenue in the fourth quarter of fiscal year 2020 due to the COVID-19 pandemic; |
| • | $37.5 million decrease in inventories due to lower shipments in the fourth quarter of fiscal year 2020 stemming from the COVID-19 pandemic; and |
| • | a non-recurring settlement of share-based compensation liability of $16.5 million for the year ended April 30, 2019; |
largely offset by
| • | $41.2 million increase in net loss after adjusting for non-cash items, including a $23.5 million increase in depreciation and amortization due to additions in our property, plant and equipment, partly offset by $14.8 million decrease in share-based compensation related to higher expense under the Predecessor’s stock option plan following the Acquisition. |
Investing Activities
Three Months Ended July 31, 2021 (Successor) vs Three Months Ended July 31, 2020 (Successor)
Net cash used in investing activities increased $57.9 million, to $74.2 million for the three months ended July 31, 2021 as compared to $16.3 million for the three months ended July 31, 2020. This increase reflects:
| • | $47.4 million increase in cash capital expenditures, primarily from the construction of our new facility in Columbus and the investment to double our capacity in our manufacturing facility in Texas; and |
| • | the acquisition of HCT Metals completed in the first quarter of fiscal year 2022 for $10.5 million. |
104
Table of Contents
Fiscal Year Ended April 30, 2021 (Successor) vs Fiscal Year Ended April 30, 2020 (Successor)
Net cash used in investing activities decreased $851.8 million, to $117.7 million for the year ended April 30, 2021 as compared to $969.5 million for the year ended April 30, 2020. This decrease primarily reflects:
| • | business combinations decrease of $927.9 million due to the 2020 Transactions completed in the year ended April 30, 2020; |
partially offset by
| • | increase in cash capital expenditures of $77.6 million, primarily from the construction of our new facility in Columbus where operations commenced in the second quarter of fiscal year 2022, and from the incremental impact of the 2020 Transactions, including capacity expansion projects at Zobele. |
Fiscal Year Ended April 30, 2020 (Successor) vs Fiscal Year Ended April 30, 2019 (Using Combined 2019 Financial Information)
Net cash used in investing activities increased $313.4 million, to $969.5 million for the year ended April 30, 2020 as compared to $656.1 million for the year ended April 30, 2019 (using Combined 2019 Financial Information). This increase primarily reflects:
| • | business combinations increase of $309.8 million related to the 2020 Transactions; and |
| • | increase in cash capital expenditures of $9.2 million. |
Financing Activities
Three Months Ended July 31, 2021 (Successor) vs Three Months Ended July 31, 2020 (Successor)
Net cash provided by financing activities increased $120.4 million, to $70.3 million for the three months ended July 31, 2021 as compared to net cash used in financing activities of $50.1 million for the three months ended July 31, 2020. This increase primarily reflects:
| • | borrowings of $76.5 million under our Revolving Facility to support large-scale organic growth initiatives and the acquisition of HCT Metals, as described above, compared to repayments of $74.0 million in the prior-year period; |
partly offset by
| • | repayment of long-term debt of $4.1 million, compared with proceeds net of repayments of $27.1 million in the prior-year period. |
Fiscal Year Ended April 30, 2021 (Successor) vs Fiscal Year Ended April 30, 2020 (Successor)
Net cash provided by financing activities decreased $1,101.9 million, to $5.9 million for the year ended April 30, 2021 as compared to $1,107.8 million for the year ended April 30, 2020. This decrease primarily reflects:
| • | decrease in net proceeds of $465.4 million under our Term Loans; |
| • | increase in returns of capital of $318.5 million as part of the Distribution Financing Transactions; |
| • | decrease in issuance of shares of $270.2 million, mostly related to issuance of shares of $150.0 million used to support various growth initiatives, as well as repay the Revolving Facility for the year ended April 30, 2021, compared to issuance of shares of $331.2 million and $90.0 million to support the growth by acquisitions of the Company for the year ended April 30, 2020; and |
| • | increase in net repayment under our Revolving Facility of $59.0 million; |
partly offset by
| • | decrease of debt issuance costs of $18.9 million. |
105
Table of Contents
Fiscal Year Ended April 30, 2020 (Successor) vs Fiscal Year Ended April 30, 2019 (Using Combined 2019 Financial Information)
Net cash provided by financing activities increased $417.5 million, to $1,107.8 million for the year ended April 30, 2020 as compared to $690.3 million for the year ended April 30, 2019 (using Combined 2019 Financial Information). The increase primarily reflects:
| • | increase in net proceeds of $405.8 million under our First Lien Term Loan; and |
| • | increase in net borrowings under our Revolving Facility of $115.0 million; |
partly offset by
| • | decrease in issuance of shares of $89.2 million, related to issuance of shares of $421.2 million to support the growth by acquisitions of the Company for the year ended April 30, 2020 compared to issuance of shares of $510.4 million in connection with the closing of the Acquisition for the year ended April 30, 2019 on a combined basis; and |
| • | increase of debt issuance costs of $13.3 million. |
Term Loans and Revolving Facility
2025 Term Loans
On December 21, 2018, we entered into a credit agreement (the “Credit Agreement”) for a term loan (the “First Lien Term Loan”) in an aggregate principal amount equal to $525.0 million, maturing on December 21, 2025. On August 22, 2019, we and our lenders executed an amendment to include incremental term loans in the amount of $105.0 million; on January 23, 2020, we and our lenders executed an amendment to increase the term loan borrowing base by $300.0 million; and on April 30, 2020, we and our lenders agreed to another incremental increase in the term loan borrowing base by $500.0 million under the same terms and conditions as the First Lien Term Loan and as a single class of borrowings.
On July 28, 2020, we entered into a term loan denominated in euros (the “Euro Term Loan” and, together with the First Lien Term Loan, the “Term Loans”) in an aggregate principal amount equal to €460.0 million maturing on December 21, 2025. We used the proceeds of the Euro Term Loan to prepay the incremental term loans by $500.0 million entered into on April 30, 2020 and pay fees and expenses and other amounts due in connection therewith.
On January 27, 2021, we and our lenders agreed to another incremental increase in the term loan borrowing base by €100.0 million under the same terms and conditions as the Term Loans and as a single class of borrowings. The incremental borrowings under this amendment were used to fund the Distribution Financing Transactions.
The Term Loans are payable in quarterly capital installments of $4.0 million and mature on December 21, 2025 with a lump-sum payment of $1,501.1 million. The Term Loans are also subject to annual mandatory prepayments equal to 50% of our excess cash flow as defined in the Credit Agreement. We have the right at any time and from time to time to prepay the Term Loans, in whole or in part, without premium or penalty. As of July 31, 2021 and April 30, 2021, the effective interest rate on the First Lien Term Loan was 4.837% and the effective interest rates on the Euro Term Loan were 5.939% and 5.937%, respectively.
Revolving Facility Due in 2023
On December 21, 2018, concurrently with the First Lien Term Loan, we entered into the Credit Agreement for a revolving credit facility (“Revolving Facility”) in an original aggregate principal amount of $75.0 million. The Revolving Facility will mature on December 21, 2023. On January 23, 2020, the Revolving Facility was increased by $50.0 million and on July 28, 2020, the Revolving Facility was further increased by $25.0 million to a maximum draw of $150.0 million.
106
Table of Contents
From May 8, 2020 to September 18, 2020, we repaid $119.0 million of the borrowings under the Revolving Facility using cash balance as well as capital contributions.
On December 4, 2020, the Revolving Facility was increased by $25.0 million; on January 27, 2021, the Revolving Facility was further increased by $170.0 million; and on February 24, 2021, the Revolving Facility was further increased by $10.0 million to a maximum draw of $355.0 million. As of April 30, 2021 and 2020, the effective interest rates on the Revolving Facility were 3.363% and 5.500%, respectively.
The interest rates applicable to the loans under the Revolving Facility are based on a fluctuating rate of interest based on reference to one of four base rates plus varying applicable margins. See “Description of Certain Indebtedness.”
As of July 31, 2021, availability under the Revolving Facility was $99.1 million net of $253.5 million of borrowings and $2.4 million of letters of credit outstanding. As of July 31, 2021 and April 30, 2021, the effective interest rates on the Revolving Facility were 3.342% and 3.363%, respectively.
The aggregate principal amount of the Term Loans and Revolving Facility outstanding is secured by a lien on any assets of or property of the Company which lien is pari passu or senior to any other lien otherwise secured.
Under the Term Loans and Revolving Facility, we are required to maintain certain financial ratios. As of July 31, 2021, we were in compliance with these financial ratios. See “Description of Certain Indebtedness.”
Distribution Financing Transactions
On or about February 3, 2021, we effected returns of capital in the aggregate amount of $318.5 million, which were distributed to our shareholders. Those returns of capital were funded, along with cash, by the 2021 Term Loan Increase and the 2021 Revolver Increase (each as defined elsewhere in this prospectus). Knowlton Development Holdco, Inc. (a wholly owned subsidiary of the Company) and KDC Opco, as well as certain of their affiliates entered into an incremental amendment dated as of January 27, 2021 (“Incremental Amendment No. 9”) to the Credit Agreement in order to amend the existing Credit Agreement in connection with the 2021 Term Loan Increase and the 2021 Revolver Increase. The terms of the Credit Agreement and Incremental Amendment No. 9 are described under “Description of Certain Indebtedness.” In connection with such returns, we made adjustments in accordance with the equitable adjustment provision of the Stock Option Plan composed of a reduction in the exercise price of options and certain adjustment payments in cash. See “Prior Sales” and “Executive and Director Compensation—Elements of Compensation—Distribution Financing Transactions.”
Capital Requirements
One of management’s primary goals is to maintain an appropriate level of liquidity through the active management of the assets and liabilities, as well as the cash flows. We manage this risk by maintaining detailed cash flow forecasts and long-term operating and strategic plans.
We expect to invest approximately $200.0 million in capital expenditures in fiscal year 2022, to further support the growth of existing customers, including through commencing operations at the new facility in Columbus, Ohio in the second quarter of fiscal year 2022, to expand capacity to meet demand, to add new technologies and to increase our footprint in Mexico. The Company expects to continue to focus its capital spending on projects that are expected to yield high after-tax returns.
On January 27, 2021, the Company incurred borrowings under the 2021 Term Loan Increase and the 2021 Revolver Increase to fund, in part with $89.7 million from their cash balance, the Distribution Financing Transactions. Common shareholders received a return of capital of $232.65 per share, totaling $318.5 million paid out on February 3, 2021. See “Description of Certain Indebtedness.”
107
Table of Contents
Our future capital requirements may vary materially and will depend on many factors, including our revenue growth, the timing and amount of cash received from customers, the timing and extent of spending on R&D efforts, expenses associated with strategic investments to increase manufacturing capacity and international expansion, executing on our acquisition strategy and overall economic conditions. See “—Overview—Key Factors Impacting Our Performance—COVID-19” for actions taken by us, in response to the impact of the COVID-19 pandemic on our business, which helped to mitigate the then expected loss of sales and uncertainties regarding account receivables and to conserve cash. To the extent that current and anticipated future sources of liquidity are insufficient to fund our future business activities and requirements, including our acquisition strategy, we may be required to seek additional equity or debt financing. The sale of additional equity would result in additional dilution to our shareholders. The incurrence of debt financing would result in increased debt service obligations and the instruments governing such debt could provide for operating and financing covenants that may restrict our operations. There can be no assurance that we will be able to raise additional capital. The inability to raise capital would adversely affect our ability to achieve our business objectives, including executing on our acquistion strategy. See “Risk Factors—An inability to raise additional capital when needed on acceptable terms, or at all, could impact our growth strategy, financial performance and share price.”
For further information regarding the terms of our Term Loans and Revolving Facility, refer to Note 13, Debt, to our audited consolidated financial statements for the year ended April 30, 2021 and Note 8, Debt, to our unaudited consolidated financial statements for the three months ended July 31, 2021 included elsewhere in this prospectus.
Debt and Contractual Financial Obligations and Commitments
As of July 31, 2021, our debt and contractual financial obligations and commitments by due dates were as follows:
| Payments due by period | ||||||||||||||||||||
| Total | Less than 1 Year |
1-3 Years | 3-5 Years | More than 5 Years |
||||||||||||||||
| (in millions) | ||||||||||||||||||||
| Term Loans—USD loans(1) |
$ | 909.5 | $ | 9.2 | $ | 18.4 | $ | 881.9 | $ | — | ||||||||||
| Term Loans—Euro loans(1) |
659.5 | 6.8 | 13.6 | 639.1 | — | |||||||||||||||
| Revolving Facility(1) |
253.5 | — | 253.5 | — | — | |||||||||||||||
| Debt-related interest(2) |
315.2 | 76.4 | 146.3 | 92.4 | 0.1 | |||||||||||||||
| Finance lease obligations and commitments(3) |
9.8 | 2.3 | 3.0 | 1.5 | 3.0 | |||||||||||||||
| Operating lease obligations(3) |
191.9 | 30.7 | 55.4 | 48.9 | 56.9 | |||||||||||||||
| Other borrowings(4) |
4.4 | — | 0.8 | 0.9 | 2.7 | |||||||||||||||
| Purchase commitments(5) |
46.9 | 44.3 | 2.6 | — | — | |||||||||||||||
|
|
|
|
|
|
|
|
|
|
|
|||||||||||
| Total(6) |
$ | 2,390.7 | $ | 169.7 | $ | 493.6 | $ | 1,664.7 | $ | 62.7 | ||||||||||
|
|
|
|
|
|
|
|
|
|
|
|||||||||||
| (1) | Reflects the principal payments for the term loans maturing on December 21, 2025 and the Revolving Facility maturing on December 21, 2023. These also assume debt repayments can be made in line with contractual payment terms and without the need for further refinancing. |
| (2) | Reflects our variable rate debt calculated using the interest rate at July 31, 2021 of 3.842% for the First Lien Term Loan, 5.000% for the Euro Term Loan and 3.342% for the Revolving Facility. Interest payments are based on the July 31, 2021 interest rates for the remaining term of variable rate debt. |
| (3) | Primarily relates to land and buildings (real estate), manufacturing equipment, material handling equipment, furniture, fixtures and office equipment, and information technology equipment. Commitments are related to leases for which the contract has been signed but the lease has not yet commenced. |
| (4) | Represents the principal payments on other borrowings. |
| (5) | Primarily pertains to capital expenditures, largely related to (i) a new facility in Columbus, Ohio, where operations commenced in the second quarter of fiscal year 2022 and (ii) the investment to double our capacity in our manufacturing facility in Texas. These purchase commitments were not recorded as liabilities on the consolidated balance sheet as of July 31, 2021, as we had not yet received the related products or services. |
| (6) | Other liabilities of $8.9 million, which include expected payments for workers’ compensation and pension obligations, have been excluded from this table due to the year of settlement not being estimable. |
108
Table of Contents
The commitment amounts in the table above are associated with contracts that are enforceable and legally binding and that specify all significant terms, including fixed or minimum services to be used, fixed, minimum or variable price provisions, and the approximate timing of the actions under the contracts. Refer to Note 9, Leases, Note 13, Debt, and Note 21, Commitments and Contingencies, to our audited consolidated financial statements for the year ended April 30, 2021 and Note 8, Debt, and Note 16, Commitments and Contingencies, to our unaudited consolidated financial statements for the three months ended July 31, 2021 included elsewhere in this prospectus for further detail on our debt and contractual financial obligations and commitments. Excluded from the above table are (i) other than lease obligations and current portion of debt, amounts recorded in current liabilities in our consolidated balance sheet; (ii) non-current liabilities that have no cash outflows associated with them (e.g., deferred revenue), or the cash outflows associated with them are uncertain or do not represent a “purchase obligation” (e.g., deferred taxes, unrecognized tax benefits, defined benefit and contribution plans, and amounts due under derivative transactions), (iii) the Sponsor Fees and quarterly reimbursements of customary expenses incurred by Cornell as the obligation does not have fixed or determinable payments and (iv) the $18.0 million fee payable to Cornell upon the completion of this offering in connection with the termination of the Services Agreement as the fee is contingent on the completion of this offering. The Sponsor Fees, which are terminating in connection with this offering, consist of a 1% fee of the enterprise value of an acquired target by the Company, and a 2.5% annual cash fee based on consolidated adjusted EBITDA as defined in the Credit Agreement. Refer to Note 20, Related Party Transactions, to our audited consolidated financial statements for the year ended April 30, 2021 and Note 15, Related Party Transactions, to our unaudited consolidated financial statements for the three months ended July 31, 2021 included elsewhere in this prospectus for further information on this balance for the periods presented.
From time to time, we enter into certain types of contracts that contingently require the parties to indemnify one another against third-party claims. The terms of such obligations vary by contract and in most instances a maximum dollar amount is not explicitly stated therein. Generally, amounts under these contracts cannot be reasonably estimated until a specific claim is asserted. No liabilities have been recorded for these obligations on our consolidated balance sheets for the periods presented.
Quarterly Results and Seasonality
Our business experiences limited seasonality. Overall, revenues are higher in our second fiscal quarter as we meet customer demand in anticipation of the calendar year-end holiday season.
The following table sets forth our unaudited quarterly consolidated statements of operations data for each of the nine quarters in the period ended July 31, 2021. The information for each of these quarters has been prepared on a basis consistent with our audited annual consolidated financial statements included elsewhere in this prospectus. The following unaudited consolidated quarterly financial data should be read in conjunction with our interim and annual consolidated financial statements and the related notes included elsewhere in this prospectus. These quarterly results are not necessarily indicative of our operating results for a full year or any future period.
| Three Months Ended | ||||||||||||||||||||||||||||||||||||
| Q1 | Q2 | Q3 | Q4 | Q1 | Q2 | Q3 | Q4 | Q1 | ||||||||||||||||||||||||||||
| July 31, 2019 |
Oct 31, 2019 |
Jan 31, 2020 |
Apr 30, 2020 |
July 31, 2020 |
Oct 31, 2020 |
Jan 31, 2021 |
Apr 30, 2021 |
July 31, 2021 |
||||||||||||||||||||||||||||
| (in millions except percentages) | ||||||||||||||||||||||||||||||||||||
| Revenue |
$ | 243.0 | $ | 281.6 | $ | 270.7 | $ | 298.1 | $ | 482.4 | $ | 546.5 | $ | 534.5 | $ | 580.4 | $ | 603.4 | ||||||||||||||||||
| Cost of revenue |
212.6 | 240.5 | 238.6 | 252.9 | 400.4 | 451.8 | 454.8 | 510.7 | 520.9 | |||||||||||||||||||||||||||
|
|
|
|
|
|
|
|
|
|
|
|
|
|
|
|
|
|
|
|||||||||||||||||||
| Gross profit |
30.4 | 41.1 | 32.1 | 45.2 | 82.0 | 94.7 | 79.7 | 69.7 | 82.5 | |||||||||||||||||||||||||||
109
Table of Contents
| Three Months Ended | ||||||||||||||||||||||||||||||||||||
| Q1 | Q2 | Q3 | Q4 | Q1 | Q2 | Q3 | Q4 | Q1 | ||||||||||||||||||||||||||||
| July 31, 2019 |
Oct 31, 2019 |
Jan 31, 2020 |
Apr 30, 2020 |
July 31, 2020 |
Oct 31, 2020 |
Jan 31, 2021 |
Apr 30, 2021 |
July 31, 2021 |
||||||||||||||||||||||||||||
| (in millions except percentages) | ||||||||||||||||||||||||||||||||||||
| Selling, general and administrative expenses |
25.9 | 30.5 | 28.8 | 50.1 | 64.1 | 69.8 | 71.8 | 81.1 | 73.6 | |||||||||||||||||||||||||||
| Acquisition-related costs and other expenses |
2.4 | 4.8 | 30.1 | 22.4 | 2.3 | 8.9 | 15.7 | 13.2 | 4.7 | |||||||||||||||||||||||||||
| Impairment loss on goodwill and other intangibles |
— | — | — | — | — | 48.2 | — | — | — | |||||||||||||||||||||||||||
|
|
|
|
|
|
|
|
|
|
|
|
|
|
|
|
|
|
|
|||||||||||||||||||
| Operating income (loss) |
2.1 | 5.8 | (26.8 | ) | (27.3 | ) | 15.6 | (32.2 | ) | (7.8 | ) | (24.6 | ) | 4.2 | ||||||||||||||||||||||
| Interest expense |
10.1 | 11.3 | 12.3 | 13.7 | 17.3 | 19.8 | 19.2 | 21.9 | 22.8 | |||||||||||||||||||||||||||
| Other expense (income), net |
— | 2.0 | (0.2 | ) | 0.6 | 3.1 | 2.6 | 4.5 | 1.5 | (3.1 | ) | |||||||||||||||||||||||||
|
|
|
|
|
|
|
|
|
|
|
|
|
|
|
|
|
|
|
|||||||||||||||||||
| Loss before income taxes |
(8.0 | ) | (7.5 | ) | (38.9 | ) | (41.6 | ) | (4.8 | ) | (54.6 | ) | (31.5 | ) | (48.0 | ) | (15.5 | ) | ||||||||||||||||||
| Income tax expense (benefit) |
(1.0 | ) | (1.8 | ) | (2.4 | ) | (8.9 | ) | (4.2 | ) | 2.4 | (5.9 | ) | (5.4 | ) | (2.8 | ) | |||||||||||||||||||
|
|
|
|
|
|
|
|
|
|
|
|
|
|
|
|
|
|
|
|||||||||||||||||||
| Net loss |
$ | (7.0 | ) | $ | (5.7 | ) | $ | (36.5 | ) | $ | (32.7 | ) | $ | (0.6 | ) | $ | (57.0 | ) | $ | (25.6 | ) | $ | (42.6 | ) | $ | (12.7 | ) | |||||||||
|
|
|
|
|
|
|
|
|
|
|
|
|
|
|
|
|
|
|
|||||||||||||||||||
| Adjusted EBITDA |
$ | 20.4 | $ | 28.9 | $ | 21.9 | $ | 21.0 | $ | 63.1 | $ | 69.4 | $ | 54.0 | $ | 52.0 | $ | 54.7 | ||||||||||||||||||
| Adjusted EBITDA margin |
8.4 | % | 10.3 | % | 8.1 | % | 7.0 | % | 13.1 | % | 12.7 | % | 10.1 | % | 9.0 | % | 9.1 | % | ||||||||||||||||||
| VACM |
18.6 | % | 22.2 | % | 17.4 | % | 13.4 | % | 25.4 | % | 24.4 | % | 19.6 | % | 19.0 | % | 18.3 | % | ||||||||||||||||||
Quarterly Trends
Revenue
Our revenue generally trended upwards in each of the quarters of fiscal year 2021 compared to the quarters of fiscal year 2020 as a result of the 2020 Transactions, net of the impact of the COVID-19 pandemic on our business. Specifically, the acquisition of Zobele diversified our product portfolio in the Home Care sector and the acquisition of HCT added packaging design and manufacturing solutions for beauty and personal care products. Our revenue tends to increase during the second quarter of each fiscal year as we meet customer demand in anticipation of the calendar year-end holiday season.
Cost of revenue
Our cost of revenue has consistently fluctuated with revenue for all periods presented due primarily to additional costs of revenue associated with higher production and the 2020 Transactions, net of a decline in production due to the COVID-19 pandemic. Additionally, the first two quarters of fiscal year 2021 benefited from COVID-19 costs containment measures that were put in place, as well as strong demand within the home care category.
Selling, general and administrative expenses
Our selling, general and administrative expenses have generally increased over the periods presented primarily reflecting the inclusion of the 2020 Transactions, as well as additional compensation, professional fees and information technology costs to support the growth in our business and anticipation of operating as a public company, as well as an increase in amortization expense (intangible assets) resulting from the incremental intangible asset base following the Acquisition and the 2020 Transactions.
Acquisition-related costs and other expenses
Our acquisition-related costs and other expenses have increased mainly due to acquisition, integration, and other costs related to the 2020 Transactions. Acquisition-related costs and other expenses have been maintained for the quarters of 2021 to support expenses of our initial public offering.
110
Table of Contents
Non-GAAP Financial Measures
Adjusted EBITDA, Adjusted EBITDA Margin and VACM
| Three Months Ended | ||||||||||||||||||||||||||||||||||||
| Q1 | Q2 | Q3 | Q4 | Q1 | Q2 | Q3 | Q4 | Q1 | ||||||||||||||||||||||||||||
| July 31, 2019 |
Oct 31, 2019 |
Jan 31, 2020 |
Apr 30, 2020 |
July 31, 2020 |
Oct 31, 2020 |
Jan 31, 2021 |
Apr 30, 2021 |
July 31, 2021 |
||||||||||||||||||||||||||||
| (in millions except percentages) | ||||||||||||||||||||||||||||||||||||
| Net loss |
$ | (7.0 | ) | $ | (5.7 | ) | $ | (36.5 | ) | $ | (32.7 | ) | $ | (0.6 | ) | $ | (57.0 | ) | $ | (25.6 | ) | $ | (42.6 | ) | $ | (12.7 | ) | |||||||||
| Adjusted for the following: |
||||||||||||||||||||||||||||||||||||
| Interest expense and other expense |
10.1 | 13.3 | 12.1 | 14.3 | 20.4 | 22.4 | 23.7 | 23.4 | 19.7 | |||||||||||||||||||||||||||
| Income tax expense (benefit) |
(1.0 | ) | (1.8 | ) | (2.4 | ) | (8.9 | ) | (4.2 | ) | 2.4 | (5.9 | ) | (5.4 | ) | (2.8 | ) | |||||||||||||||||||
| Depreciation and amortization |
14.0 | 15.9 | 17.4 | 22.9 | 36.9 | 36.9 | 38.1 | 39.4 | 37.4 | |||||||||||||||||||||||||||
| Share-based compensation(1) |
0.5 | 0.5 | 0.4 | 0.3 | 0.5 | 0.8 | 0.9 | 6.3 | 1.1 | |||||||||||||||||||||||||||
| Acquisition-related costs and external consultants costs(2) |
2.3 | 4.5 | 29.3 | 20.8 | 0.4 | 1.4 | 3.3 | 3.0 | 0.3 | |||||||||||||||||||||||||||
| Initial public offering preparation-related costs(3) |
— | — | — | 0.1 | 1.3 | 4.3 | 1.2 | 4.0 | 3.3 | |||||||||||||||||||||||||||
| COVID-19-related costs(4) |
— | — | — | 1.5 | 4.1 | 4.7 | 6.9 | 12.9 | 1.7 | |||||||||||||||||||||||||||
| Plant start-up costs(5) |
— | — | — | — | — | — | — | 0.5 | 2.6 | |||||||||||||||||||||||||||
| Sponsor fees(6) |
1.0 | 1.0 | 0.8 | 1.8 | 2.0 | 2.4 | 1.3 | 2.2 | 1.7 | |||||||||||||||||||||||||||
| Impairment loss on assets(7) |
— | — | — | — | — | 48.2 | 6.1 | — | — | |||||||||||||||||||||||||||
| Other adjustment items(8) |
0.5 | 1.2 | 0.8 | 0.9 | 2.3 | 2.9 | 4.0 | 8.3 | 2.4 | |||||||||||||||||||||||||||
|
|
|
|
|
|
|
|
|
|
|
|
|
|
|
|
|
|
|
|||||||||||||||||||
| Adjusted EBITDA |
$ | 20.4 | $ | 28.9 | $ | 21.9 | $ | 21.0 | $ | 63.1 | $ | 69.4 | $ | 54.0 | $ | 52.0 | $ | 54.7 | ||||||||||||||||||
| Adjusted EBITDA Margin |
8.4 | % | 10.3 | % | 8.1 | % | 7.0 | % | 13.1 | % | 12.7 | % | 10.1 | % | 9.0 | % | 9.1 | % | ||||||||||||||||||
| VACM |
18.6 | % | 22.2 | % | 17.4 | % | 13.4 | % | 25.4 | % | 24.4 | % | 19.6 | % | 19.0 | % | 18.3 | % | ||||||||||||||||||
| (1) | Adjustments for share-based compensation represents the grant date fair value of share-based stock options granted to employees under the Stock Option Plan and recognized as an expense in the consolidated statement of operations over the applicable vesting period of the awards. During the fourth quarter of fiscal year 2021, the adjustment for share-based compensation includes an expense of $5.5 million related to the adjustments made to the Stock Option Plan on February 7, 2021 in connection with the Distribution Financing Transactions. See Note 15, Employee Benefits, to our audited consolidated financial statements included elsewhere in this prospectus for further discussion of the adjustments made to the Stock Option Plan. |
| (2) | Adjustments for acquisition-related costs and external consultants costs include professional, due diligence and advisory fees related to acquisitions, which include the Sponsor Acquisition Fees, which are terminating in connection with this offering. These costs also include the write-off of certain indemnification assets. |
| (3) | Adjustments for initial public offering preparation-related costs include incremental and non-recurring professional and advisory fees incurred in connection with this offering. |
| (4) | Adjustments for COVID-19-related costs primarily related to temporary enhanced compensation for factory-based employees (hazard pay), as well as incremental supplies and services to support social distancing and otherwise mitigate the spread of COVID-19; we do not expect to continue to incur such costs once COVID-19 has significantly subsided globally and operations return to pre-COVID-19 levels. During the fourth quarter of fiscal year 2021, the COVID-19-related costs include a $7.1 million charge primarily for inventory and receivables that were impaired as a result of goods that could not be imported into the United States from Mexico due to regulatory restrictions. |
| (5) | Adjustments for plant start-up costs include direct costs for our new facility in Columbus incurred before significant operations begin, including payroll and rent. Operations began during the second quarter of fiscal year 2022 and will continue to ramp up throughout the course of fiscal year 2022. |
| (6) | Adjustments for sponsor fees include the Sponsor Management Fees, which are terminating in connection with this offering. See “Certain Relationships and Related Party Transactions—Services Agreement.” |
| (7) | Adjustments include a non-cash impairment charge of $48.2 million to reduce the carrying amount of goodwill and trade name intangible assets to fair value. The impairment recorded was driven in large part by the impacts of the COVID-19 pandemic on our color cosmetics business. The adjustments also include an impairment loss of $6.1 million on right-of-use assets representing the non-cash write-down for an office building lease that the Company no longer plans to use as it was initially intended. |
| (8) | Other adjustment items costs include incremental reorganization and restructuring costs, including severance related payments; litigation and related legal fees; and other incremental non-recurring expenses. |
111
Table of Contents
Adjusted EBITDA and Adjusted EBITDA Margin
To support our growth, we have also begun to make investments in our supply chain and product development efforts as well as increasing our headcount in our corporate department leading up to and through our anticipated public offering. Our Adjusted EBITDA Margin generally trended upwards in the quarters of fiscal year 2021 compared to the quarters of fiscal year 2020 as a result of the 2020 Transactions, net of the impact of the COVID-19 pandemic on our business.
Components of Revenue
The following table sets forth our consolidated revenue in two components (revenue from pass-through raw materials and revenue from value added contributions) for each of the nine quarters in the period ended July 31, 2021.
| Three Months Ended | ||||||||||||||||||||||||||||||||||||
| Q1 | Q2 | Q3 | Q4 | Q1 | Q2 | Q3 | Q4 | Q1 | ||||||||||||||||||||||||||||
| July 31, 2019 |
Oct 31, 2019 |
Jan 31, 2020 |
Apr 30, 2020 |
July 31, 2020 |
Oct 31, 2020 |
Jan 31, 2021 |
Apr 30, 2021 |
July 31, 2021 |
||||||||||||||||||||||||||||
| (in millions) | ||||||||||||||||||||||||||||||||||||
| Revenue from pass-through raw materials |
$ | 133.1 | $ | 151.4 | $ | 144.6 | $ | 141.7 | $ | 234.0 | $ | 261.9 | $ | 258.6 | $ | 306.1 | $ | 304.9 | ||||||||||||||||||
| Revenue from value added contributions |
109.9 | 130.2 | 126.1 | 156.4 | 248.4 | 284.6 | 275.9 | 274.3 | 298.5 | |||||||||||||||||||||||||||
|
|
|
|
|
|
|
|
|
|
|
|
|
|
|
|
|
|
|
|||||||||||||||||||
| Total revenue |
$ | 243.0 | $ | 281.6 | $ | 270.7 | $ | 298.1 | $ | 482.4 | $ | 546.5 | $ | 534.5 | $ | 580.4 | $ | 603.4 | ||||||||||||||||||
|
|
|
|
|
|
|
|
|
|
|
|
|
|
|
|
|
|
|
|||||||||||||||||||
Off-Balance Sheet Arrangements
We did not have any material off-balance sheet arrangements during the periods presented.
Quantitative and Qualitative Disclosures About Market Risk
We are exposed to market risk from interest rate, credit risk, and foreign currency exchange rate fluctuations. Volatility relating to these exposures is managed by utilizing a number of techniques, including working capital management, selective borrowings in specific currencies and entering into selective hedging transactions in accordance with our treasury and risk management policies.
The sensitivity of our financial instruments to market fluctuations is discussed below. See Note 2, Summary of Significant Accounting Policies, Note 5, Trade and Other Receivables, Net, Note 18, Fair Value and Note 19, Financial Instruments, to our audited consolidated financial statements for the year ended April 30, 2021 included elsewhere in this prospectus for further discussion of derivatives and hedging policies and fair value measurements.
Interest Rate Risk
We are primarily exposed to changes in short-term interest rates with respect to our cost of borrowing under our Term Loans and Revolving Facility each with a variable interest rate that mature on December 21, 2025 and December 21, 2023, respectively. We monitor our cost of borrowing under our facility and consider our funding requirements and our expectations for short-term rates in the future when entering into our debt arrangements. Based on rates as of July 31, 2021 and April 30, 2021, a hypothetical 10% change in the interest rate on our Credit Agreement, all other factors the same, would not have a material impact on our consolidated financial statements included elsewhere in this prospectus for all periods presented. We do not currently hedge our exposure to variable interest rates.
112
Table of Contents
In addition, we are assessing the impact of the discontinuation of LIBOR as a benchmark interest rate on our current financial instruments and contractual arrangements, including debt outstanding. Our Term Loans are based on EURIBOR for borrowings in euros, and the EURIBOR is not expected to be discontinued as part of the reference rate reform. The Term Loans and Revolving Facility have fallback clauses, however we, our lenders, and our counterparties are expected to negotiate the substitution of reference rates (such as the Secured Overnight Funding Rate (“SOFR”)) in our Credit Agreement for the calculation of interest rates. We do not have significant exposure to LIBOR in our derivatives or other financing arrangements. We will continue to monitor our exposure in subsequent periods. It is too early to determine how the substitution of reference rates will affect our future financing expenses. Interest rates may fluctuate if LIBOR ceases to exist or if new methods of calculating LIBOR are established. See “Risk Factors—Certain of our long-term indebtedness bears interest at variable interest rates, primarily based on LIBOR, which may be subject to regulatory guidance and/or reform that could cause interest rates under our current or future debt agreements to fluctuate or cause other unanticipated consequences.” See Note 2, Summary of Significant Accounting Policies, to our audited consolidated financial statements for the year ended April 30, 2021 and Note 1, Basis of Presentation and Summary of Significant Accounting Policies, to our unaudited consolidated financial statements for the three months ended July 31, 2021 included elsewhere in this prospectus for further discussion on the accounting implications of the discontinuation of LIBOR.
Credit Risk
Credit risk is the risk of financial loss to us if a customer or counterparty to an outstanding receivable balance fails to meet its contractual obligations. We attempt to mitigate this risk by dealing only with counterparties with good credit ratings combined with other considerations when applicable, such as the ability to obtain a guarantee in the form of an insurance policy under which a specific credit limit is approved for each individual customer that would protect us in the event of bankruptcy. We have also considered the risk of default of our customers, given the economic downturn caused by the COVID-19 pandemic.
Foreign Currency Risk
We operate internationally and are exposed to currency risk on financial assets and liabilities that are denominated in a currency other than the respective functional currencies of our entities.
To date, our revenues have been predominantly denominated in U.S. dollars, with portions denominated in other currencies. Our costs are also predominantly denominated in U.S. dollars, with portions denominated in other currencies, primarily related to our facilities located outside the United States. We also have a significant portion of our debt denominated in euros. Any unfavorable movement in the exchange rate between U.S. dollars and the currencies in which we conduct business in foreign countries could have an adverse impact on our operating results, financial position, or cash flows.
We have entered, and in the future may enter, into foreign exchange forward contracts to mitigate risk related to exchange rate fluctuations between Canadian dollars and U.S. dollars, as our exposure to fluctuations in other foreign currencies is not yet deemed significant for hedging. These financial instruments are used as a method for meeting our risk reduction objective by generating offsetting cash flows related to the underlying position with respect to the amount and timing of forecasted transactions. The terms of the derivatives range in general, from one to 12 months. We do not hold or use derivative financial instruments for trading or speculative purposes. Our foreign exchange risk management activities are governed by established policies and procedures. These policies and procedures provide a framework that allows for the management of currency exposures while ensuring the activities are conducted within our established guidelines. Our foreign exchange forward contracts are recorded at fair value in our consolidated balance sheets. We believe that the exposure to foreign currency fluctuation from operating expenses is relatively small at this time as they do not constitute a significant portion of our total expenses.
113
Table of Contents
In order to reduce exposure to fluctuations between the euro and the U.S. dollar currencies on our investments in euro functional currency foreign operations, we use a portion of our euro-denominated debt as a non-derivative hedging item to hedge a portion of our net investments in euro-denominated foreign operations. The portion of euro-denominated debt designated as net investment hedges had a carrying value of $117.7 million and $266.7 million as of July 31, 2021 and April 30, 2021, respectively.
To demonstrate foreign currency exposure, for assets and liabilities denominated in other than their functional currencies, we evaluated the effect of a hypothetical 10% shift in exchange rates against the U.S. dollar as of July 31, 2021 and April 30, 2021. For the three months ended July 31, 2021, the analyses indicated that our consolidated net loss would decrease by $9.9 million due to a 10% appreciation and increase by $9.9 million due to a 10% depreciation related to foreign exchange risk. For the year ended April 30, 2021, the analyses indicated that our consolidated net loss would decrease by $8.6 million due to a 10% appreciation and increase by $8.6 million due to a 10% depreciation related to foreign exchange risk.
Critical Accounting Policies and Estimates
Our discussion and analysis of our financial condition and results of operations are based upon our consolidated financial statements included elsewhere in this prospectus, which have been prepared in accordance with GAAP. Our accounting policies are more fully described in Note 2, Summary of Significant Accounting Policies, to our audited consolidated financial statements for the year ended April 30, 2021 and Note 1, Basis of Presentation and Summary of Significant Accounting Policies, to our unaudited consolidated financial statements for the three months ended July 31, 2021 included elsewhere in this prospectus. In preparing the consolidated financial statements, we make estimates and judgments that affect the reported amounts of assets, liabilities, shareholders’ equity, revenue, expenses and related disclosures. We re-evaluate our estimates on an on-going basis. Our estimates are based on historical experience and on various other assumptions that we believe to be reasonable under the circumstances. Because of the uncertainty inherent in these matters, actual results may differ from these estimates and could differ based upon other assumptions or conditions. The critical accounting policies that reflect our more significant judgments and estimates used in the preparation of our consolidated financial statements include those noted below.
Revenue
Revenue is recognized at a point in time when control of the finished good transfers to the customer, which is generally at the shipping point. Under certain customer contracts, we complete the production of finished goods and then hold such inventory until the customer requests shipment. For these items, we have the contractual right to receive payment once the production is completed, at which point control transfers to the customer and we recognize revenue. Our contracts principally consist of a single performance obligation related to the sale of finished goods.
We evaluate contracts with customers to whom we provide custom products to determine whether a legally enforceable right to payment exists as performance is completed, including a reasonable profit margin, in which case revenue should be recognized over time rather than at a point in time. For the three months ended July 31, 2021 and 2020, the years ended April 30, 2021 and 2020, the period from November 30, 2018 through April 30, 2019 and the period from May 1, 2018 through December 20, 2018, no contract met the criteria for recognition over time because a right to payment, including a reasonable profit margin, does not exist until our performance under the contract is completed.
Revenue from the sale of finished goods is recognized at the fair value of the amount received or expected to be received. Sales taxes and value added taxes in foreign jurisdictions that are collected from customers and remitted to governmental authorities are accounted for on a net basis and therefore are excluded from net sales. Typically included within a contract with a customer is variable consideration, such as discounts, rebates and returns. Discounts and rebates are accounted for as a reduction in the transaction price and are estimated using
114
Table of Contents
the most likely amount method. Volume rebates that are retroactive are accrued as sales are made, at the percentage that is expected to be paid out. They are adjusted if new estimates suggest the previous percentage is no longer appropriate. When expressed as a percentage of revenue, discounts and rebates have been consistent over time. Given the nature of the products sold by us, returns are not material to our consolidated financial statements included elsewhere in this prospectus.
In some contracts with a customer, we receive deferred revenue which relates primarily to advance consideration to support the acquisition, setting up and maintenance of certain equipment or production lines to be used for providing the customer with finished goods. It was determined that these promised goods and services were significantly integrated with the finished goods and, therefore, are considered to be a single performance obligation. These contracts were also evaluated to determine whether they contain a material right that the customer would not have received without entering into the contract. These contracts can be cancelled at any time by the customer. For a certain period of time, the customer may have the option to purchase the related equipment at a price equal to the unamortized advance consideration received at the date the purchase option is exercised, as calculated in accordance with the contract. Deferred revenue is also created when we receive consideration from a customer prior to transferring goods to the customer. Deferred revenue, including any material rights accounted for as a distinct performance obligation, is recognized as revenue on the basis of units shipped to the customer.
Business combinations
When we acquire a controlling financial interest in an entity or group of assets that are determined to meet the definition of a business, we apply the acquisition method described in the FASB ASC 805. Assets and liabilities of acquired businesses are included in the consolidated balance sheets at fair value at the acquisition date. Goodwill is initially measured as the excess of the consideration transferred over the fair value of the net identifiable assets including intangibles (other than goodwill) acquired and liabilities assumed. If the initial accounting for a business combination is incomplete by the end of the reporting period in which the combination occurs, we record provisional amounts for the items for which the accounting is incomplete. During the measurement period (a period not to exceed twelve months from the acquisition date), those provisional amounts are adjusted in the reporting period in which the amounts are determined, or additional assets or liabilities are recognized, to reflect new information obtained about facts and circumstances that existed at the acquisition date that, if known, would have affected the amounts recognized at that date.
The fair value estimates are based on historical information, future expectations and assumptions deemed reasonable by management, but are inherently uncertain. Determining the useful life of an intangible asset also requires judgment. Accordingly, we typically engage third-party valuation specialists, who work under the direction of management, to assist in valuing significant intangible assets acquired. Significant changes to these assumptions could have a significant impact on the fair value of identifiable intangible assets and their useful lives, which would impact the amortization expense as well as the amount of goodwill recognized.
We generally use the following methodologies for valuing our significant acquired intangible assets:
| • | Intellectual property and trade name—Relief-from-royalty method: The valuation model considers the discounted estimated royalty payments that are expected to be avoided as a result of the intellectual property or trade name being owned. The key assumptions for the model are net revenue, the royalty rate, obsolescence factor (for intellectual property), the effective tax rate and the discount rate. |
| • | Customer relationships—Multi-period excess earnings method: The valuation model considers the present value of net cash flows expected to be generated by the customer relationships, by excluding cash flows related to contributory assets. The key assumptions for the model are the attrition rate, earnings before interest, taxes, depreciation and amortization, contributory assets charges, the effective tax rate and the discount rate. |
115
Table of Contents
The trade names we acquired have indefinite lives based on the market recognition and their ability to generate revenue through changing economic conditions with no foreseeable time limit. Other intangible assets have determinable useful lives. Our estimates of the useful lives of other intangible assets are based on a number of factors including competitive environment, market share, operating plans and the macroeconomic environment.
Goodwill and other intangibles
Following initial recognition, goodwill and indefinite life intangible assets are measured at cost less any accumulated impairment losses.
Goodwill and indefinite life intangible assets are not amortized and are assessed for impairment annually in the fourth quarter or more frequently if events or changes in circumstances indicate that the carrying value may be impaired. For the purpose of annual impairment testing, indefinite life intangible assets, which correspond to trade names are tested separately using the relief from royalty valuation method. A reporting unit is the operating segment, or a component, which is one level below that operating segment. Components are aggregated as a single reporting unit if they have similar economic characteristics. In conducting our annual goodwill impairment test, we first review qualitative factors which include relevant events and circumstances that affect the fair value of the reporting unit. These events and circumstances include macroeconomic conditions, industry and competitive environment conditions, overall financial performance, reporting unit specific events and market considerations. If factors indicate that the fair value of the reporting unit is less than its carrying amount, we perform a quantitative impairment assessment of the reporting unit, analyzing the expected present value of future cash flows to quantify the amount of impairment, if any. In estimating the fair value of our reporting units, we typically forecast cash flows for five years and include an estimated terminal value at the end of the forecasted period. The key estimates and factors used in this approach include, but are not limited to, revenue growth rates and earnings before interest, income tax, depreciation and amortization expenses based on internal forecasts, a weighted-average cost of capital used to discount future cash flows, terminal growth rate, as well as our historical operating trends. We also review comparable market multiples for the industry segment. We generally engage third-party valuation specialists, who work under the direction of management, to assist in estimating the fair value of our reporting units.
During the fourth quarter of fiscal year 2020, we prepared scenarios of business projections and sensitivities attempting to model various assumptions as to how the revenues and cash flows of the business may evolve depending on how the COVID-19 pandemic and the associated containment measures affect the reporting units. The projections assumed a recovery from the COVID-19 pandemic approximately at the end of the 2021 fiscal year. Considering the impacts of the COVID-19 pandemic on our business, we concluded no impairment on goodwill and intangible assets was necessary. Fair value of our reporting units was substantially in excess of carrying value at the date of the impairment test, except for HCT which was a separate reporting unit prior to our reorganization in fiscal year 2021, as described below. A carrying amount of $571.3 million is allocated to that reporting unit and the fair value exceeded the carrying amount by 3.4%.
At the end of the second quarter of fiscal year 2021, we underwent a strategic reorganization to realign the business into two operating and reportable segments. We performed goodwill and indefinite life intangible asset impairment testing immediately before and after the reorganization. As part of the impairment testing immediately before the reorganization, we assessed the recoverability of the goodwill within the pre-reorganization reporting units. Accordingly, we performed a qualitative assessment and determined it was not more likely than not that goodwill was not impaired and proceeded to a quantitative assessment of the HCT reporting unit (we qualitatively assessed one other reporting unit which subsequently passed the quantitative assessment). We determined that a reduction in the projected net operating cash flows primarily attributable to the COVID-19 pandemic impact on our color cosmetics business resulted in a reduction in the fair value of the HCT reporting unit requiring an impairment charge of $47.3 million and $0.9 million for goodwill and indefinite life intangibles, respectively, reflecting a more gradual recovery from the COVID-19 pandemic than expected, delayed into fiscal year 2022. As part of the impairment testing immediately after the reorganization, no impairment resulted.
116
Table of Contents
We performed a quantitative impairment analysis in the last quarter of fiscal year 2021 for each reporting unit and trade names. Additional uncertainty existed in the forecasted cash flows due to the COVID-19 pandemic impact, including the projected timing of the recovery. Further, minor changes in any of the above assumptions could have had a significant effect on the determination of the estimated fair value of the Beauty and Personal Care reporting unit in the fourth quarter of fiscal year 2021. As a result of this annual impairment analysis, we determined that there was no impairment of goodwill or the trade names.
There was no impairment of goodwill and other intangibles for the three months ended July 31, 2021.
Recent Accounting Pronouncements
See Note 2, Summary of Significant Accounting Policies, to our audited consolidated financial statements for the year ended April 30, 2021 and Note 1, Basis of Presentation and Summary of Significant Accounting Policies, to our unaudited consolidated financial statements for the three months ended July 31, 2021 included elsewhere in this prospectus for further information on recently adopted accounting pronouncements and recently issued accounting pronouncements not yet adopted as of the dates of the consolidated balance sheets included in this prospectus.
Internal Control Over Financial Reporting
As we prepared the financial statements that are included in this prospectus, our management and our auditors have determined that we have material weaknesses in our internal control over financial reporting. A material weakness is a deficiency, or combination of deficiencies, in internal control over financial reporting such that there is a reasonable possibility that a material misstatement of our annual or interim consolidated financial statements will not be prevented or detected on a timely basis.
These material weaknesses primarily pertained to the financial reporting close process and information technology general controls, more specifically insufficient review of manual journal entries, lack of formalization of the reconciliation and analysis of certain key accounts, and insufficient controls around system user access (including potential consequential segregation of duties issues) and change management. We have concluded that these material weaknesses in our internal control over financial reporting occurred because, prior to this offering, we were a highly acquisitive private company and did not have the necessary business processes, systems, personnel and formalized internal controls necessary to satisfy the accounting and financial reporting requirements of a public company.
We have begun to remediate these material weaknesses and are in the process of taking the following actions:
| • | Strengthening our compliance and accounting functions with additional experienced hires to assist in our design and implementation of controls responsive to these deficiencies. |
| • | Developing and enhancing our company-wide policies and procedures, including those related to access management, change management, journal entries and account reconciliations and analyses. These policies clearly define expectations with regards to additional review controls and documentation requirements. |
| • | Supporting our financial reporting teams in the implementation of such policies and procedures, including delivering additional training to our team members on internal controls over financial reporting. |
| • | Engaging an external advisor to assist us with further evaluating the design of our internal controls, and assisting with remediation. |
See “Risk Factors—We identified certain material weaknesses in our internal control over financial reporting in the preparation of our financial statements to be filed with the SEC and the Canadian securities
117
Table of Contents
regulatory authorities, and we may identify additional material weaknesses in the future that may cause us to fail to meet our reporting obligations or result in material misstatements of our financial statements. If we fail to remediate any material weaknesses or if we otherwise fail to establish and maintain effective internal control over financial reporting, our ability to accurately and timely report our financial results could be adversely affected.”
118
Table of Contents
Company Overview
Beauty, Personal Care and Home Care, Uniquely Imagined and Expertly Delivered
We are a trusted global provider of value-added solutions to many of the world’s leading brands in the beauty, personal care and home care categories. We partner closely with both industry-leading consumer products companies and fast-growing independent brands as a critical enabler of their success through ideation, formulation, design, packaging and manufacturing of products sold under more than 1,000 different brand names. Over the past three years, we have been responsible for co-developing over 9,000 products across growing categories that include skin care, body and hair care, soaps and sanitizers, cosmetics, deodorants, sun care, fragrances, air care, fabric care, pest control and surface care products. The innovative products that we have helped to develop are sold by our brand partners in more than 70 countries worldwide.
Revenue by Category
The pace of innovation and new brand and product introduction is accelerating across the beauty, personal care and home care categories. This, in turn, has underscored the importance of rapid strategic product development partnerships with companies such as ours to accelerate the speed to market. Against that backdrop, we have benefited by building a leading suite of end-to-end, value added solutions across a global platform. We believe the vertical integration of product solutions, coupled with the ability to service both established and emerging brands worldwide, provides us with a significant competitive advantage.
We provide our value-added solutions to more than 700 customers worldwide as of July 31, 2021, across 13 different product categories. Our customers include many of the most recognizable and rapidly emerging companies in beauty, personal care and home care. Our customer base encompasses 18 of the 20 largest beauty, personal care and home care companies worldwide, when ranked by retail sales in 2020, according to Euromonitor.1 In total, these 18 customers had a 52% share of the beauty, personal care, and home care categories in 2020, according to Euromonitor.1 As of July 31, 2021, our portfolio also included more than 200 independent and emerging customers, who we have selectively targeted as being among the fastest growing and most noteworthy brands.
| 1 | Euromonitor International Limited. Beauty & Personal Care 2021 Retail Value RSP Fixed 2020 Exchange Rate, Home Care 2021 Retail Value RSP Fixed 2020 Exchange Rate. Data extracted April 2021. |
119
Table of Contents
Diverse Customer Base Underpinned by Long-Term Relationships
Our relationships with our largest customers are often multifaceted and can extend across their business portfolio to encompass multiple brands, products and geographies, creating a diversified portfolio approach aligned to multifaceted growth with resilience. We partner in the development of brands and products across the retail pricing spectrum, from mass to masstige to prestige. Products incorporating our value-added solutions are distributed across a broad array of channels from mass to specialty retail to e-commerce. We leverage our diverse suite of leading capabilities to support our customers across the product development and production cycle. Through our global footprint, we expect to be able to deliver our expertise wherever our customers choose to operate.
Global End-to-End Solutions:
Vertical Integration from Beaker to Box Enables Speed to Market
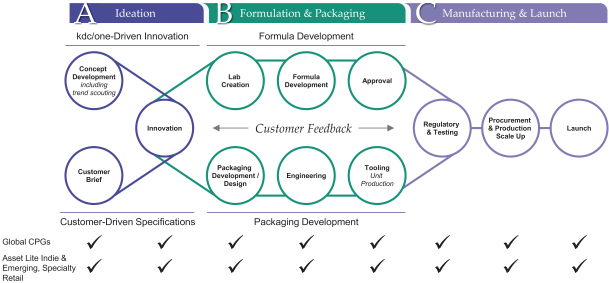
120
Table of Contents
Since fiscal year 2016, we have delivered significant growth through a combination of organic expansion and strategic acquisitions, increasing our revenue, net income (loss) (as we grew our business) and Adjusted EBITDA from $516.2 million to $2,143.8 million, $7.5 million to $(125.8) million and $61.5 million to $238.5 million, respectively, for fiscal year 2016 (with fiscal 2016 numbers derived from unaudited financial information not included in this prospectus) and fiscal year 2021, respectively. Adjusted EBITDA is a non-GAAP measure; for a reconciliation of Adjusted EBITDA to the most directly comparable financial measure in accordance with GAAP, see the section titled “Prospectus Summary—Summary Consolidated Financial and Other Data.”
Innovation is at the heart of both our culture and our value proposition. We have approximately 400 employees focused on R&D as of July 31, 2021, including chemists, formulators, engineers and designers. As of July 31, 2021, our R&D personnel operate across 22 R&D, design and creative facilities and four innovation hubs globally, connecting locally with our customers wherever they are located. For each of the year ended April 30, 2021 and the three months ended July 31, 2021, approximately 73% of our total revenue was attributable to products we helped ideate, design or develop. We believe our R&D capabilities position us as a driving force for growth in our categories. For example, teams at our four innovation hubs, which are located in North America, Europe and the Asia Pacific region, focus on identifying emerging consumer trends and developing new technologies to leverage them. Our current and prospective customers are able to utilize the technologies we develop in the customization of their own branded products.
Our track record of innovation speaks for itself. We developed or co-developed over 3,500 formulations and 7,500 packaging designs during the year ended April 30, 2021. We also own an extensive library of proprietary formulations and packaging designs to which our customers have access. Over the last three years, on average, we have played a role in the launch of more than 3,000 new products annually. Products that we have co-developed are highly regarded and have won numerous industry awards.
Select Recent Awards Enabled Through our Industry-leading Innovation Network
In addition to our focus on innovation through ideation and formulation, we have leading capabilities in product delivery systems, design and packaging. We believe that we are the leader in customized delivery and packaging solutions, making us a “go-to” partner for brands seeking to differentiate themselves in terms of performance, look and feel. Customized packaging is an increasingly important way for brands to stand out from their competition in a crowded marketplace. In partnership with our customers, our expertise has led to the creation of many of the most distinctive beauty, personal care and home care products in consumers’ homes today.
We also have a sizeable and flexible global manufacturing footprint, operating to the most rigorous standards in the industry and allowing us to seamlessly deliver solutions for the complex production
121
Table of Contents
requirements of our customers. As of July 31, 2021, our manufacturing platform includes 25 facilities across North America, Europe, Latin America and the Asia Pacific region, 12 of which are over-the-counter (“OTC”) registered. At these facilities, we are able to ideate, formulate, manufacture and package products both at scale and in shorter runs. Our global infrastructure and integrated supply chain enable us to develop and deliver complex products while also maintaining the flexibility to respond to the needs of our customers as they arise. This, in turn, allows us to seamlessly support global brand launches across our customer base. We believe the stringent standards by which we operate provide our customers with confidence in the quality of our products and in our adherence to strict regulatory standards.
Well-Invested Network to Support Our Customers Globally
We have grown significantly over the past two decades, systematically expanding our product capabilities, category reach and geographic footprint to better serve the needs of our customers globally. We have done this both organically and through acquisitions.
At our Knowlton, Québec, facility, for example, we recently completed a multi-step investment to expand and enhance our capabilities in the antiperspirant and deodorant category. We added a dedicated and flexible automated production line to support the growth of our on-trend natural deodorant products. We are currently undertaking a number of large-scale organic growth initiatives. Operations at our new facility in Columbus, Ohio commenced in the second quarter of fiscal year 2022, adding capabilities across a range of products, including foaming soap, hand soap, shower gel, hand sanitizer and body cream. We are expanding the footprint of our facility in Mexico, which is expected to increase by more than 70% and allow us, for the first time, to serve beauty and personal care customers, in addition to home care customers, through this location. We also expect to double capacity in Texas through our investment in our highly automated manufacturing facility. Each of these projects has been undertaken on the basis of supporting organic growth.
Acquisitions have also been, and we expect will continue to be, an important part of our growth. In 2020, we added industry-leading expertise in the field of complex packaging design and production through the acquisition of HCT, enabling us to better service the premium beauty category. HCT, through its global platform, increased our exposure to many of the most innovative and fast-growing emerging brands worldwide, while further expanding our relationship with many multinational leaders in the prestige beauty. We believe the vertically integrated solutions that we now provide are a differentiated and important value proposition for brands, allowing them to accelerate speed to market.
122
Table of Contents
In addition, in 2020, we added advanced capabilities in device design for the global home care category through the acquisition of Zobele, providing us with greater access to a large and growing market. Our acquisition of Paristy the same year provided us with the capability to offer leading, China-based capabilities in product formulation and manufacturing to both international beauty companies as well as leading domestic beauty brands in that region. We have developed a rich pipeline of acquisition opportunities, and we will continue to take a disciplined approach focused only on assets that we believe enable us to better serve our customers through expansive, end-to-end capabilities.
The Manifestation of Our Strategy: A Thoughtfully Executed
Organic Growth and M&A Journey Creating a Global “One-Stop”
Brand Partner
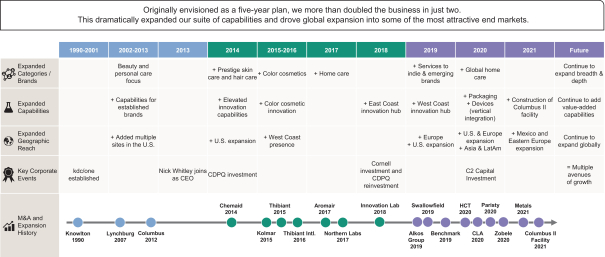
As we have extended our reach in terms of capabilities and geographies, the TAM for the value-added solutions we provide has meaningfully increased. Adding expansive capabilities in the home care category through acquisitions, and the extension of our geographic reach beyond our North American origins into Europe, Latin America and the Asia Pacific region, have enabled us to expand the size of our addressable market by a factor of nearly five from approximately $135 billion to over $654 billion, based on 2020 retail sales, according to industry information from Euromonitor.2
| 2 | Company estimate from Euromonitor International Limited. Beauty & Personal Care 2021 Retail Value RSP Fixed 2020 Exchange Rate, Home Care 2021 Retail Value RSP Fixed 2020 Exchange Rate. Data extracted April 2021. |
123
Table of Contents
Expansion of Global Addressable Market
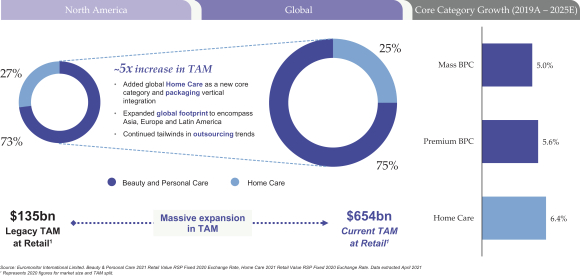
We generated total revenue of approximately $2.1 billion for the year ended April 30, 2021. Over the same period, we incurred a net loss of $125.8 million and recognized Adjusted EBITDA of $238.5 million. In addition, we generated total revenue of $603.4 million for the three months ended July 31, 2021. Over the same period, we incurred a net loss of $12.7 million and recognized Adjusted EBITDA of $54.7 million.
Many of our customer contracts allow us to effectively pass through raw material costs, providing us with a hedge against fluctuations in commodity prices. As a result, we evaluate the performance of our business on the basis of Value-Added Contribution Margin (“VACM”), which we define as Adjusted EBITDA divided by revenue from value added contributions. Our business is focused on innovation, product development and operational excellence. As a result, we believe VACM best reflects the profitable solutions we provide to our customers. We delivered VACM of 22.0% for the year ended April 30, 2021. In addition, we delivered VACM of 18.3% for the three months ended July 31, 2021.
Since fiscal year 2016, revenue (derived from unaudited financial information not included in this prospectus) from our Knowlton, Lynchburg, Columbus, Chemaid and Toronto facilities, which were our only facilities in existence at the beginning of fiscal year 2016, grew at a compounded annual growth rate of 5.6%. Although these facilities (including revenue attributable to the Toronto facility, which closed in fiscal year 2016 and had its business transferred to our Knowlton and Lynchburg facilities) generated 26% of the Company’s total fiscal year 2021 revenue, we believe this metric is meaningful as it demonstrates the growth, over an extended period of time, for a core portion of the Company’s operations. The financial information for the year ended April 30, 2016 has been derived from unaudited books and records of the Company, which are prepared on the same basis and using the same accounting principles as the audited consolidated financial statements of the Company included elsewhere in this prospectus. Similarly, Zobele, prior to its acquisition by the Company in 2020, grew its revenue (derived from unaudited financial information not included in this prospectus) between its fiscal years ended December 31, 2016 and 2019 at a compounded annual growth rate of 10.7%. Although the revenues of Zobele pre-acquisition are not reflected in the financial information included in this prospectus, we believe this metric is meaningful as it demonstrates the organic growth historically generated by Zobele.
124
Table of Contents
Key Strengths
We are focused on driving deep and lasting relationships with our customers by leveraging the following competitive strengths:
We provide value-added solutions in some of the fastest growing, most resilient and most valuable categories across the consumer landscape, underpinned by an ongoing shift towards outsourced product development and innovation
The categories in which we operate represent, in aggregate, retail sales of approximately $654 billion globally for 2020, according to Euromonitor.3 On a weighted-average basis, these categories are expected to deliver a compound annual growth rate of 5.5% from 2019 through 2025.3 Across these categories, growth is underpinned by increasing consumer demand for product innovation and new brands, which in turn favors increasing reliance by consumer products companies on outsourced support for strategic product development. Our deep industry knowledge and insights also allow us to focus on areas of growth that are higher than the category average. Examples include: our focus on partnering with fast-growing, independent and emerging brands; our ability to service the fast-paced innovation requirements of brands focused on digital marketing and distribution (who often run asset-lite business models); and our increased focus on the rapidly-growing market for clean and sustainable product and packaging solutions.
We expect to deliver significant category growth across each major region in which we operate, including the United States and Canada; Europe, the Middle East and Africa; and the Asia Pacific region. China, in particular, is experiencing a period of elevated growth and its beauty, personal care and home care markets are expected to grow at a weighted-average compound annual rate of 10.2% from 2019 through 2025, according to Euromonitor.3 We have recently expanded our capabilities in the region through the acquisitions of Paristy, HCT and Zobele.
Trusted, long-term partnerships with the industry’s leading consumer products companies and fast-growing independent and emerging brands
The breadth of our capabilities, coupled with our extensive geographic reach, allows us to develop long-term, trusted, strategic partnerships with our 700 customers, encompassing over 1,000 brands across categories and geographies. As of July 31, 2021, our customers included more than 200 independent and emerging customers, who we have selectively targeted as owning many of the fastest growing and most noteworthy brands.
We enjoy close connectivity with our customers, reflecting the important role we play across the value chain. We have the ability to coordinate with our customers at every stage of the strategic product planning process. We have often been told that our ability to provide integrated solutions across the value chain makes us the first call for our customers when they seek to partner on new products or develop new solutions. The trust that our customers place in our capabilities leads to long-tenured relationships. As of July 31, 2021, with our top 10 customers by revenue, we have an average relationship tenure of more than 30 years. We also have a track record of growing our revenue opportunities with customers over the duration of our partnership.
| 3 | Company estimate from Euromonitor International Limited. Beauty & Personal Care 2021 Fixed 2020 Exchange Rate, Home Care 2021 Fixed 2020 Exchange Rate, Retail Value RSP, Current Prices. Data extracted April 2021. |
125
Table of Contents
Differentiated Customer Solutions—Selected Case Studies
Case Study: Delivering Share of Wallet Growth With a Leading Global
CPG Customer
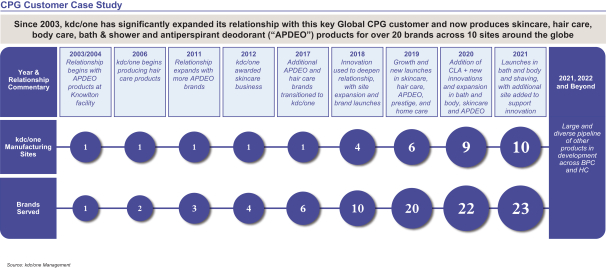
We offer a comprehensive, integrated and global portfolio of value-added solutions, including ideation, formulation, design and packaging and manufacturing
We have developed a comprehensive, integrated suite of value-added customer solutions and product capabilities. Our integrated approach allows us to offer services to our customers across every aspect of product development. We believe this is a significant competitive advantage, as we are able to partner with our customers to offer end-to-end solutions. Through our global footprint we are also able to deliver value-added solutions to customers worldwide. The comprehensive nature of our offering has allowed us both to add new customers and to increase share of spend with our existing customers.
126
Table of Contents
We support our comprehensive suite of solutions and capabilities with a sizable and flexible manufacturing footprint, operating to stringent quality standards from our customers and adhering to strict regulatory standards. As of July 31, 2021, our manufacturing platform includes 25 facilities across North America, Europe, Latin America and the Asia Pacific region. At these facilities, we are able to ideate, formulate, manufacture and package products both at scale and in shorter product runs for our customers. Our global infrastructure and integrated supply chain enable us to develop and deliver highly complex products while also maintaining the flexibility to respond to the needs of our customers as they arise. We believe the stringent standards by which we operate provide our customers with confidence as to product quality and adherence to complex regulatory standards.
We enjoy leading capabilities in product innovation and design, enabling us to partner with our customers to meet increasing consumer demand for new products and brands
We believe we have the industry’s leading capabilities in product innovation. Teams at our four innovation hubs, located in the United States, Europe and Asia, focus on identifying emerging consumer trends and developing new technologies to leverage them. As of July 31, 2021, our R&D personnel operate across 22 R&D, design and creative facilities as well as four innovation hubs globally, connecting locally with our customers wherever they are located. For each of the year ended April 30, 2021 and the three months ended July 31, 2021, approximately 73% of our total revenue was attributable to products we helped ideate, design or develop.
Our track record of innovation speaks for itself. We developed or co-developed over 3,500 formulations and 7,500 packaging designs during the year ended April 30, 2021. We also own an extensive library of proprietary formulations and packaging designs to which our customers have access. Over the last three years, on average, we have played a role in the launch of more than 3,000 new products annually.
We have a successful track record of enhancing our product capabilities, category reach and geographic footprint through both organic expansion as well as highly selective and strategic acquisitions
We have grown significantly over the past two decades, systematically expanding our product capabilities, category reach and geographic footprint to better serve the needs of our customers. We have done this both organically and through acquisitions.
Our organic growth encompasses a range of initiatives including (i) upgrading and enhancing existing facilities; (ii) expanding capacity or building out new capabilities across the kdc/one network; and (iii) the construction of brand new facilities. kdc/one has a history of consistent execution success across all these forms of organic growth, and is currently in the process of completing several significant organic growth projects across the network. Importantly, these organic investments are supported by specific customer contracts.
At our Knowlton facility, we recently expanded and enhanced our antiperspirant and deodorant capabilities through the installation of new high speed production lines, supporting the growth of our on-trend natural deodorant products. We are currently in the process of a substantial expansion of our Home Care facility in Mexico (70% increase in square footage), transforming it into a facility capable of servicing Beauty and Personal Care customers as well. Upon completion of the project, this facility will also mark the introduction of wipes technology into the kdc/one network.
Following the successful construction of our Columbus facility in 2012 and subsequent fragrance build-out in 2016, the new 570,000 square-foot complex in Columbus, Ohio adds a modern, flexible and highly automated facility to the kdc/one portfolio. While the Columbus II facility will be initially focused on the Beauty and Personal Care segment, the facility also contains 180,000 square feet of unutilized space underroof targeted to be used to support growth for our Home Care segment. We will continue to make disciplined investments in partnering with our global customers.
127
Table of Contents
We have a successful track record of acquisitions. Over our 30-year history, we have completed 16 transactions. Our current management team has completed six of those transactions over the past two years.
We have been systematic and disciplined in our approach to acquisitions. Our deep knowledge of the beauty, personal care and home care markets has allowed us to anticipate both significant industry shifts and the demands of our customers, and to identify acquisition targets that allow us to meet those demands. For example, the merger with HCT in 2020 added leading capabilities in design and packaging, which in combination with our existing platform has allowed us to provide both existing and new customers with a differentiated solution, and enhanced speed to market, from a truly integrated capability encompassing ideation to final product. The acquisition of Zobele in 2020 provided us with access to advanced device development and manufacturing capabilities in the large and growing global home care market. Similarly, our acquisitions of Zobele and Paristy, in particular, have enabled us to extend our geographic reach beyond North America to serve customers in Europe, Latin America and the Asia Pacific region. kdc/one is today a highly differentiated, vertically integrated brand enabler with global reach.
As a market leader in a fragmented industry, we believe we will benefit from ongoing opportunities to extend our reach through our buy and build strategy. We have developed a pipeline of opportunities that we will continue to monitor on a go forward basis. We will continue to be highly selective in our approach to acquisitions, focusing only on opportunities where we can add both leading capabilities and talent. We will continue to be careful and disciplined stewards of capital.
We have a diversified and resilient business model driving strong financial performance
Since fiscal year 2016, we have delivered significant growth through a combination of organic expansion and strategic acquisitions, increasing our revenue, net income (loss) (as we grew our business) and Adjusted EBITDA from $516.2 million to $2,143.8 million, $7.5 million to $(125.8) million and $61.5 million to $238.5 million, respectively, for fiscal year 2016 (with fiscal 2016 numbers derived from unaudited financial information not included in this prospectus) and fiscal year 2021, respectively. Adjusted EBITDA is a non- GAAP measure; for a reconciliation of Adjusted EBITDA to the most directly comparable financial measure in accordance with GAAP, see the section titled “Prospectus Summary—Summary Consolidated Financial and Other Data.”
Over the same period, revenue (derived from unaudited financial information not included in this prospectus) from our Knowlton, Lynchburg, Columbus, Chemaid and Toronto facilities, which were our only facilities in existence at the beginning of fiscal year 2016, grew at a compounded annual growth rate of 5.6%. Although these facilities (including revenue attributable to the Toronto facility, which closed in fiscal year 2017 and had its business transferred to our Knowlton and Lynchburg facilities) generated 26% of the Company’s total fiscal year 2021 revenue, we believe this metric is meaningful as it demonstrates the growth, over an extended period of time, for a core portion of the Company’s operations.
In many cases, we are able to pass through raw material costs to our customers by generating revenues through (i) contracts in which raw materials are either provided by or on behalf of the customer, or costs are partially or totally passed-through to the customer, and (ii) purchase orders that sometimes serve as a de facto pass-through mechanism for variations in raw material price changes, providing us with an effective hedge against fluctuations in commodity prices. As a result, we evaluate the performance of our business on the basis of VACM, which we define as Adjusted EBITDA divided by revenue from value added contributions. Our business is focused on innovation, product development and operational excellence. As a result, revenue from value added contributions reflects the way customers interact with kdc/one and the value embedded in our product delivery that we provide to them. We have recognized a net loss of $125.8 million and Adjusted EBITDA of $238.5 million for the year ended April 30, 2021. Over the same period, we delivered a VACM of 22.0%. In addition, we have recognized a net loss of $12.7 million and Adjusted EBITDA of $54.7 million for the three months ended July 31, 2021. Over the same period, we delivered a VACM of 18.3%.
128
Table of Contents
The diversification of our customer base and our product offerings also enables our business to be resilient through economic downturns. The categories on which we focus have also been resilient. For example, over the period 2007 to 2010, the beauty and personal care market grew at a compound annual growth rate of 3.7% and the home care market grew at a compound annual growth rate of 3.0%,4 while global gross domestic product grew at a compound annual growth rate of just 1.5%.
Highly experienced management team committed to supporting and enhancing kdc/one’s strong culture
Under the leadership of our President and Chief Executive Officer, Nicholas Whitley, we have built a talented and experienced multi-disciplinary and global management team to help drive growth.
We remain extremely focused on recruiting and retaining leading talent. As part of this effort, we have fostered a culture within the organization that emphasizes diversity, inclusion and respect. We have also sought to recruit individuals with a broad set of experiences to bring fresh perspectives to our business.
As part of this effort, we have made significant investments in our internal communications capabilities, increased the frequency of town-halls and conducted employee surveys all with the goal of forging stronger personal links between our team members. We believe that our corporate culture is one in which our talented managers and employees can thrive.
Drivers of Growth
We benefit from multiple drivers of future growth for our business, both organic and inorganic. Together, they enable us to capture market share and grow at a faster rate than average for the categories in which we participate.
Ability to offer our customers integrated, end-to-end solutions leveraging our global footprint
Through a combination of organic expansion and strategic acquisitions, we have built a comprehensive suite of solutions and capabilities to serve the beauty, personal care and home care categories, from ideation and formulation to design, packaging and manufacturing. This enables us to provide integrated, value-added solutions to our customers at every stage of the strategic product development process. In conjunction with our global footprint, we believe this provides us with a unique opportunity to serve the needs of our customers worldwide.
For example, we recently developed a sustainable product line for a customer, covering all aspects of the process from formulation to design and packaging, leveraging both the capabilities of our legacy kdc/one business as well as packaging solutions developed through HCT. We also have a strong track record of working with emerging brands whose founders have strong creative vision but rely on kdc/one’s experience in product ideation, formulation, design, delivery and packaging.
Significant opportunity to cross-sell our comprehensive suite of value-added solutions to both new and existing customers
We have trusted relationships with over 700 customers globally. Many of our customer relationships were initiated through the provision of category-specific solutions. As we have extended our reach with respect to capabilities, categories and geographies, we have given our customers access to a broader suite of value-added solutions. As our customer relationships expand in this way, our reputation for innovation, reliability and quality assurance has a multiplier effect on the breadth of solutions our customers ask us to deliver. We have been successful in the early stages of leveraging our network to optimize cross-selling opportunities. As illustrated below, cross-selling opportunities arise across geographies, categories, capabilities and brands.
| 4 | Euromonitor International Limited. Beauty & Personal Care 2021 Retail Value RSP Fixed 2020 Exchange Rate, Home Care 2021 Retail Value RSP Fixed 2020 Exchange Rate. Data extracted April 2021. |
129
Table of Contents
Cross-selling Opportunities
In addition to cross-selling to our existing customers, we are highly active in targeting and acquiring new customers. Over the twelve months ended March 31, 2021, we built relationships with over 100 new customers, many of which are high-growth emerging names. We believe that the opportunity to offer those new customers access to solutions across our broader footprint also represents a compelling growth opportunity.
Continue to target the fastest growing areas of demand within the categories and markets we serve
We believe that the breadth of both our customer relationships and our global footprint provide us with unique insights into the end markets we serve. This, in turn, allows us to anticipate the needs and demands of our customers and to focus on the areas which are demonstrating the most rapid growth. For example, we have been able to identify and establish relationships with more than 200 independent and emerging customers, who we have selectively targeted as owning many of the fastest growing and most noteworthy brands. Many of these brands operate asset-lite business models and rely heavily on kdc/one to provide innovative product solutions. Similarly, we have developed capabilities that are well-placed to service brands focused on digital distribution, delivering rapid innovation and shorter product runs. We have also recognized growing consumer demand for cleaner and more sustainable product formulations and packaging, and have developed industry leading solutions to help us capture an outsized share of that market.
Continue to expand our geographic reach, including in China and the Asia Pacific region more broadly
We have built a global platform that positions us well for future growth across markets including North America, Europe, Latin America and Asia. On a weighted-average basis, the markets for beauty, personal care and home care are expected to grow at a compound annual rate of 2.3%, 4.9% and 7.0% in the United States and Canada; Europe, the Middle East and Africa; and the Asia Pacific region, respectively, from 2019 through 2025, according to Euromonitor.5 We have more recently focused on establishing a strong foothold in China, in particular, through the acquisitions of Paristy, HCT and Zobele. According to Euromonitor, by 2022, the size of the beauty market in China is projected to surpass that of the United States in terms of retail sales to become the largest in the world.6 Our capabilities in China now include formulation, design and packaging and manufacturing. We can now offer value-added solutions not only to multi-national consumer products companies, but also to leading
| 5 | Company estimate from Euromonitor International Limited. Beauty & Personal Care 2021 Fixed 2020 Exchange Rate, Home Care 2021 Fixed 2020 Exchange Rate, Retail Value RSP, Current Prices. Data extracted April 2021. |
| 6 | Euromonitor International Limited. Beauty & Personal Care 2021, Fixed 2020 Exchange Rate, Retail Value RSP, Current Prices. Data extracted April 2021. |
130
Table of Contents
domestic companies who are increasingly capturing market share. In addition, through C2 Capital, a current investor, we benefit from close connectivity with Alibaba Group’s e-commerce ecosystem, which has over 800 million active consumers in China alone, according to Alibaba. This relationship provides us with unique data analytics and customer insights that we believe will help us gain market share in the region.
Expand our category, capability and geographic reach through highly selective and strategic acquisitions
We have a successful track record of expansion through acquisitions. We have developed a strong pipeline of potential acquisition opportunities which we believe will help us to further broaden our reach and grow our relationships with both existing and new customers. Our management team includes executives with significant acquisition experience, both at kdc/one and from prior roles within the corporate, investment banking and legal fields. We will continue to focus on assets that we believe are truly best-in-class with respect to their respective capabilities and leadership teams, which are additive to our ability to service the demands of our customers. We will continue to be careful and disciplined stewards of capital as we contemplate acquisition activity going forward. We take a disciplined approach to reinvestment in our business, and approved investment projects typically have payback periods of two years or less, or up to three to four years where we deliver significant infrastructure expansion.
Continue to grow profitability margins with several levers to drive future margin expansion
We have a demonstrated track record of growing our profit margins and believe we have a path to future margin expansion. There are several levers we intend to utilize to expand our margins over time. As we grow, we expect our business mix across our two primary business segments should naturally drive margin accretion over time given the relative margin and growth profile of the two segments. Additionally, we plan to continue to effectively leverage our end-to-end, vertically-integrated business model to promote cross-selling across our business segments, geographies, and product categories. For example, in our beauty and personal care business, we can utilize our newer end-to-end capabilities, like packaging innovation, that we gained through our acquisition of HCT to cross-sell additional services to existing customers. We believe there is significant opportunity to drive further cross-sell penetration across multiple kdc/one sites within our existing customer base as well as with new customers, which we believe will increase our consolidated margin profile over time. In both our beauty and personal care business and our home care business, we believe we will benefit from incremental leverage of our fixed cost base as well as our continuous improvement initiatives across the kdc/one network, particularly through achieving efficiency improvements in our labor programs. Additionally, our Columbus II facility is expected to increase production automation and create new capacity and volume that will allow for greater operating leverage.
Our Industry
The global consumer packaged goods industry (defined as containing the following categories: beverage, beauty and personal care, consumer health, eyewear, home care, packaged food, pet care, tissue and hygiene, and tobacco) is a highly attractive market given its considerable scale and stable growth profile. This market is estimated by Euromonitor to have been approximately $6.2 trillion retail sales in 2020, of which the beauty and personal care and home care categories represented $487 billion and $167 billion, respectively.7
Beauty and Personal Care
Our Beauty and Personal Care segment constituted 61.3% of our total revenue for the fiscal year ended April 30, 2021 and 62.3% of our total revenue for the three months ended July 31, 2021. Through such segment,
| 7 | Company estimate from Euromonitor International Limited. Alcoholic Drinks 2020 Off-Trade Value RSP Fixed 2019 Exchange Rates, Beauty & Personal Care 2021 Retail Value RSP Fixed 2020 Exchange Rates, Consumer Health 2021 Retail Value RSP Fixed 2020 Exchange Rates, Eyewear 2021 Retail Value RSP Fixed 2020 Exchange Rate, Home Care 2021 Retail Value RSP Fixed 2020 Exchange Rate, Hot Drinks 2021 Retail Value RSP Fixed 2020 Exchange Rate, Packaged Food 2021 Retail Value RSP Fixed 2020 Exchange Rate, Pet Care 2021 Retail Value RSP Fixed 2020 Exchange Rate, Soft Drinks 2021 Off-Trade Value RSP Fixed 2020 Exchange Rate, Tissue & Hygiene 2021 Retail Value RSP Fixed 2020 Exchange Rate, Tobacco 2020 Retail Value RSP Fixed 2019 Exchange Rate, Current Prices. Data extracted April 2021. |
131
Table of Contents
we provide solutions to approximately 590 customers worldwide with over 850 brands as of April 30, 2021. Per Euromonitor, the global beauty and personal care market is expected to reach $517 billion by 2021 and projected to grow at a 5.2% compound annual rate from 2019 through 2025.6
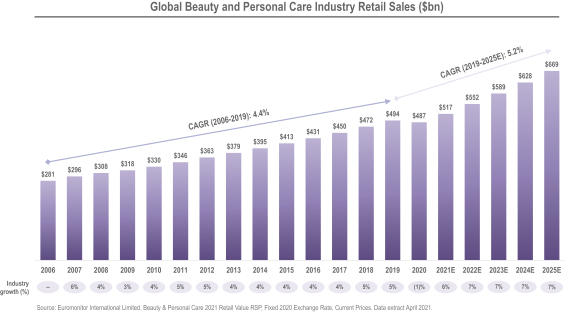
The global beauty and personal care industry is a large and attractive market exhibiting favorable growth dynamics. The pervasiveness of products within these categories in everyday life results in stable spending in the industry and contributes to the overall category’s resiliency through economic cycles, including during the most recent prolonged economic downturn from 2007 to 2010.
The category is supported by favorable consumer demand trends expected to drive future growth on a global basis. Most prominently among these is the rapid rise and dynamic development of the digital channel, which has fundamentally altered the way in which brands engage with consumers. Social media channels, which, according to Statista GmbH, can reach 3.6 billion consumers globally, provide a direct line of access to consumers, often serving as a primary discovery channel for brands and facilitating a deeper and more direct consumer connection. These direct interactions in turn provide valuable insights into consumer behaviors, enabling brands to rapidly innovate and customize their offerings in response to changing demands and preferences. As consumers become increasingly educated about products they purchase and consume, their expectations evolve and ultimately become the driving force behind the underlying demand drivers within the industry. These include:
| • | Rise of conscious consumerism: Consumers are increasingly mindful of how their purchasing decisions not only affect their own health and wellness but also the social and environmental impact of their consumption patterns. This has fueled demand for clean and “better for you” beauty brands, which cater to consumers focused on the ingredient composition and eco-friendly, sustainable packaging of their products. The influx and increasing popularity of independent brands offering natural and sustainable products has set an ingredient and manufacturing standard, leading established beauty brands to explore “better for you” options such as aluminum-free deodorants and sulfate-free and paraben-free shampoos, among numerous other types of products. |
132
Table of Contents
In addition, an increasing emphasis on personal hygiene standards is expected to drive consumer demand for personal care products. We co-develop and manufacture a number of products aligned with this trend, including soaps, body wash, shampoos and sanitizers.
| • | Premiumization across our categories: In conjunction with the above, consumers seem to be “trading up” on everyday essentials. Buying patterns suggest an increased willingness by consumers to enter higher price points for the right brand or product due to the perceived premium quality of these offerings. Perceived quality may be a result of cleaner ingredients, brand marketing, or product design and packaging. Overall, dollar retail sales are growing faster than unit sales across cosmetics and skincare, suggesting a migration to affordable luxury at “masstige” price points. |
| • | Continued outsized performance of skin care: Skin care is set to outpace the rest of the beauty and personal care category, driven in part by self-care and pampering trends. Consumers are also increasingly demanding science-backed, clinically proven and efficacious brands, qualities that support more premium pricing and will provide significant support to skin care growth. Additionally, younger consumers are entering the skin care market earlier than prior generations due to a growing emphasis on preventative aging products. As millennials enter their peak earnings years and account for a larger share of the world’s consumption, we expect spend in this category to accelerate. |
| • | Increasing emphasis on the omni-channel model: Direct-to-consumer e-commerce continues to rise as consumers increase their online engagement and spending across digital channels. The e-commerce channel for beauty and personal care is expected to grow at a 13.0% compound annual growth rate from 2019 through 2025, according to Euromonitor.8 Digitally native brands have found tremendous success leveraging e-commerce platforms and harnessing social media to create a compelling customer experience anchored around direct engagement with the consumer. Creating a cohesive customer experience, however, requires combining online engagement with offline experience. Consumers value the opportunity to touch, feel and test products directly before purchase. The offline, in-store encounter often enhances the product education and discovery process, contributing to an enhanced experience overall for consumers. |
| • | China’s role as a forward growth engine: The beauty and personal care market in China is significant, having reached $75 billion retail sales in 2020 according to Euromonitor.9 It is also rapidly growing, fueled by an increasing interest from younger generations in beauty products and routines further supported by a growing level of disposable income. According to The Brookings Institution, China’s middle-class cohort is expected to reach 1.2 billion people by 2027, representing one quarter of the world’s middle-class population. Growth within this cohort will be accompanied by higher disposable income and greater spending power, which will, in turn, drive increased consumption. Relative to the broader population, younger generations of more digitally native consumers are expected to have an outsized impact on consumer spending. This cohort has greater awareness of beauty products and trends and shows strong willingness to spend on skin care and cosmetics. Buoyed by these dynamics, China’s cosmetics market alone is expected to nearly double in size by 2025, according to Euromonitor, with ample room for continued growth in-line with per capita spend profiles.9 |
The rapid growth of China’s beauty market has supported the rise of domestic brands, which have experienced increasing popularity in recent years. The development and expansion of these domestic brands is expected to continue as their products become more accessible and accepted among Chinese consumers.
Within beauty and personal care, we focus primarily on identifying brand partners that are aligned with the growth drivers outlined above. We leverage our deep experience, market insights and operational expertise to
| 8 | Euromonitor International Limited. Retailing 2021, Fixed 2020 Exchange Rate, Retail Value RSP excluding sales tax, Current prices. Data extracted April 2021. |
| 9 | Euromonitor International Limited. Beauty & Personal Care 2021, Fixed 2020 Exchange Rate, Retail Value RSP, Current Prices. Data extracted April 2021. |
133
Table of Contents
help our customers nimbly react to consumer demand and scale their offerings appropriately. Given this value proposition, we believe we are well positioned to outpace the beauty and personal care market average, alongside the category winners.
Home Care
Our Home Care segment constituted 38.7% of our total revenue for the fiscal year ended April 30, 2021 and 37.7% of our total revenue for the three months ended July 31, 2021. Through such segment, we provide solutions to approximately 120 customers worldwide with over 200 brands as of April 30, 2021. Per Euromonitor, the home care market is expected to reach $174 billion by 2021 and is projected to grow at a 6.4% compound annual growth rate from 2019 through 2025.10
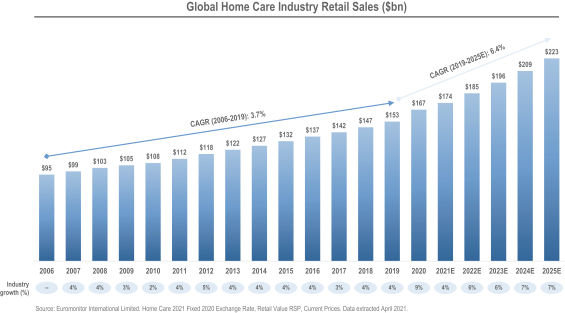
The global home care industry is an expansive and varied market benefitting from broad-based geographic growth across regions. Consumption of home care products is a perceived necessity, and heightened focus from consumers on health and home hygiene is expected to support sustained growth for the category.
Operating in today’s household category demands global scale and the ability to customize for local dynamics, all with the R&D strength to deliver the functionality that meets consumer needs. Global brands require local solutions, and often will look to outsourced strategic partners for support, in order to successfully address changing consumer preferences in a rapidly evolving market.
Key industry dynamics underlying growth within this category include:
| • | Elevated focus on hygiene and trusted products: Consumer behavior reflects an enhanced awareness of health and hygiene broadly with a desire for products from trusted brands that feature increased efficacy and consistent high quality performance. This is expected to drive organic growth across several home care categories, including surface cleaners and laundry aids, as well as demand for the high quality products that are a hallmark of kdc/one. |
| • | Well-being inside the home: Consumer habits are evolving towards more sophisticated needs and upscale product propositions, especially in developed markets. Home care is no longer viewed only as |
| 10 | Euromonitor International Limited. Home Care 2021, Fixed 2020 Exchange Rate, Retail Value RSP, Current Prices. Data extracted April 2021. |
134
Table of Contents
| a purely functional category but also as an important contributor in fostering the well-being of consumers within their home. Consumers are also increasingly focused on the comfort and cleanliness of their households, recognizing the profound impact that living conditions have on physical and mental health. In this context, fragrance as an example plays a key role both in maximizing consumer perception of cleanliness and in enhancing a positive, relaxing environment. |
| • | Innovation creating new categories: Evolving consumer preferences, including demand for more convenient and time efficient home care products, drive innovation across home care categories. In a rapidly evolving market, brands study consumer behaviors and identify opportunities to develop and launch new products addressing key concerns. Our notable product introductions include air care products for confined spaces such as bathrooms, closets and cars, all-in-one pods in laundry care, and specialty laundry enhancers to remove stubborn odors, among many others. |
| • | Growing consumer focus on ingredients and transparency: Consumers are paying increased attention to ingredients found in everyday essential products and are demanding safer and more ecologically friendly products across home care. These include products without harsh chemicals and products with reusable packaging. This shift in consumer focus has presented complexities for brands in terms of both product and packaging design and how to achieve product effectiveness without traditional synthetic ingredients. Brands are increasingly working with trusted partners like kdc/one who have expertise in clean product formulation and product and packaging design while offering differentiated, value-added solutions. |
| • | Emphasis on sustainability with focus on zero waste: The global crisis in plastic pollution and water scarcity underscores the need to pivot the current manufacturing process towards a circular economy focused on reducing, reusing and recycling. This focus on sustainability guides the new product development efforts of brands across all home care categories, manifesting most recently in several new launches of refillable, “just add water” surface care concepts. Our product and packaging design capabilities can be fundamental for brands to win in these new product executions. |
| • | Global expansion opportunity driven by growth in developing markets: The rising rate of urbanization in developing markets across the globe will further fuel demand for home care products, particularly in the Asia Pacific region, Latin America, the Middle East and Africa. As cities within these regions expand to accommodate larger populations, they become increasingly prone to pest infestation, driving consumer demand for home insecticides and other related products. The home care segment is poised to gain wallet share in the Asia Pacific region given relatively low current per capita spending on home care products within the market currently, supplemented by the positive market outlook that is set to strengthen spending power. With multiplying populations and rising disposable incomes, we expect increased focus from consumers on home health in these markets to drive demand for the home care category. |
Industry Tailwinds
As a partner to many of the largest and most recognizable companies within the beauty, personal care and home care markets, our growth tracks the market trends outlined above. Over the last several years, we have grown in excess of underlying market growth rates due to structural shifts in both markets that have served as tailwinds for our business.
Within our product categories, a number of structural shifts are taking place that favor a value-added, integrated solutions partner such as kdc/one. Through digitization, consumers have more immediate access than ever before to information and influence around their purchasing choices, giving the consumer increasingly direct influence over the nature of the products that are brought to market. This has resulted in a faster pace of innovation across the beauty, personal care and home care categories, both for existing products and through a significant increase in the rate at which new brands are introduced to the market.
135
Table of Contents
As established brands adapt to this faster-paced consumer environment, they are increasingly collaborating with strategic partners to help drive product innovation and speed to market. Likewise, owners of emerging brands often favor an asset-lite approach, freeing up time and resources to focus on consumer connectivity.
We believe the following capabilities, in particular, make kdc/one well-suited to benefit from these structural shifts:
| • | Innovation: We have developed expansive innovation capabilities, from ideation to formulation to design and packaging, allowing us to partner with our customers in addressing increasing consumer demand for new products and brands. |
| • | End-to-end solutions: As consumer demand for “newness” accelerates, brands are increasingly partnering with kdc/one across all facets of the strategic product planning process. We believe that our ability to offer integrated, end-to-end solutions on a global basis makes us a preferred partner across the categories we serve. |
| • | Speed to market: Our end-to-end capabilities reduce lead times for new products, meaning we are often able to shorten time to market compared with others in our industry and enable brands to launch simultaneously in multiple geographies, essential in a “fast beauty” environment. |
| • | Agile production capabilities: As the pace of innovation has increased, brands have shifted towards shorter product runs and more frequent innovation. Our manufacturing platform is flexible and agile, meaning that we are able to accommodate shorter runs for our customers across multiple geographies. At the same time, we are also able to scale production rapidly as brands grow. |
| • | Unique global network: We believe that partnering with kdc/one provides our customers with access to a unique network of capabilities across formulation, packaging and manufacturing; this allows them to focus investment of time and capital in meeting the needs of the consumer in a dynamic market. |
| • | Regulatory compliance and quality control: Customers rely on our expertise in complex global regulatory requirements enabling them to satisfy demand from an increasingly global consumer base. |
The structural industry shifts that favor reliance on outsourced capabilities are also creating pockets of demand from consumers, and, in turn, our direct customers, that far outpace category averages. Our deep industry expertise, coupled with constant, close communication with our customer base allows us to identify those opportunities and to focus our efforts appropriately.
We closely monitor the emerging brand landscape and now count more than 200 customers that are independent and emerging among our customer base. The pace of growth for brands that are marketed and sold in a digital environment has been particularly strong in recent years. Industry estimates suggest that e-commerce growth in beauty and personal care, for example, has outpaced brick-and-mortar distribution by a factor of thirteen over the period from 2018 through 2020.11 We have partnered with our customers to ideate, formulate, design and package products that are specifically positioned for success in a digital marketing environment.
Consumers are increasingly seeking brands and products that better reflect their own values and lifestyles. This manifests itself in many ways, including more environmentally friendly ingredients, cleaner formulations, sustainable packaging, and the way in which a company treats its employees or gives back to its community. We believe that the unique services and solutions we offer enable our brand partners to deliver cutting-edge products that are consistent with these values without compromising performance. Our broad suite of capabilities helps us partner with our customers to satisfy rapidly growing consumer demand and to help them achieve their own sustainability goals.
| 11 | Euromonitor International Limited. Retailing 2021, Fixed 2020 Exchange Rate, Retail Value RSP excluding sales tax, Current prices. Data extracted April 2021. |
136
Table of Contents
COVID-19 Impact on Our Industry and Our Performance
Although the COVID-19 pandemic presented challenges, the crisis underscored the value of our diversified business model. The diversity of our broad customer base and expansive range of product offerings mitigated an outsized impact from the pandemic. The concentration of our business mix in core essential products also provided stability from demand fluctuations impacting more discretionary categories. The resiliency of our platform also proved to be a source of strength for our customers, who turned to their trusted partners for steadfast support during times of crisis.
Our diversified category exposure, resilient infrastructure and agile production capabilities enabled us to respond rapidly to customer needs. For instance, we successfully leveraged our global footprint to swiftly shift production lines from fragrances to hand sanitizers and launched a new sanitizer product for a leading customer within eight weeks. Over the 12 months ended March 31, 2021, we won over 100 new customers in our Beauty and Personal Care and Home Care segments.
Our Services
We are a value-added solutions provider for our brand partners in the beauty, personal care and home care categories. Through our integrated platform, we are able to provide services for our customers at every stage of the product development life cycle, from concept through commercialization. Our range of solutions includes ideation, formulation, custom packaging design and manufacturing, supported by robust quality and compliance controls.
We believe our “one-stop shop” solution is a key differentiator. Our innovative product development capabilities, expansive formulation library, comprehensive portfolio of product forms and ability to ideate, formulate, manufacture and package a broad range of packaging formats help us to develop highly tailored solutions that address the most complex needs of our customers on a global basis. In addition to delivering full turn-key solutions, we also maintain the flexibility to provide customized services to our customers across the value chain.
We offer our expansive range of value-added solutions across two business segments: (i) Beauty and Personal Care and (ii) Home Care. Our diverse product offering includes the following:
| • | Beauty and Personal Care (61.3% of total revenue for the fiscal year ended April 30, 2021 and 62.3% of total revenue for the three months ended July 31, 2021) |
We offer a broad collection of high-quality products across multiple attractive verticals within the beauty and personal care categories. We participate in all key categories, providing a comprehensive suite of products and packaging that deliver a complete beauty experience and serve consumer needs from head to toe.
| • | Personal Care |
| • | Skin Care includes acne-care, cleansers, creams, foams, gels, liquids, lotions, milks, oils, ointments, serums, scrubs, toners, waxes and body butters as well as sun care products such as sunscreen, sunless tanners and after-sun products. |
| • | Hair Care includes shampoos, conditioners, detanglers, dry shampoos, color enhancers, gels, heat protectant, masks, pomades and balms, sprays and a full range of hair treatments. |
| • | Bath, Shower and Body includes a broad assortment of liquid soaps and sanitizers as well as body washes, foams, oils, sprays, cleansers, scrubs and topical creams, targeted treatments and ointments. We also produce men’s grooming products such as shave cream, balms and gels. We are also a leading manufacturer and custom formulator of antiperspirants and deodorant sticks. |
137
Table of Contents
| • | Other primarily includes health products, such as single-use applications including thin and dissolvable films, non-woven fabrics, transdermal patches for delivery of medical and first aid, oral care, ointments, targeted treatments as well as medical devices. |
| • | Beauty |
| • | Cosmetics and Fragrance includes a diversified portfolio of face, eye and lip products, as well as fine fragrances. Face makeup consists of a broad assortment of blushes, bronzers, concealers, illuminators/highlighters, liquid and powder foundations, tinted moisturizers and toners. Eye makeup includes an expansive range of eye base/primers, eyebrow-grooming products, eyeliners, eyeshadows and mascaras. Lip makeup products include lip base/primers, lip balms, lip glosses, lip liners, lip stains, lipsticks, lip primers and treatments. We also offer a wide variety of beauty tools that includes brushes and applicators, curlers, rollers, spatulas, tweezers and various other accessories. |
| • | Home Care (38.7% of total revenue for the fiscal year ended April 30, 2021 and 37.7% of total revenue for the three months ended July 31, 2021) |
We have built a diverse portfolio within the home care category that is anchored around the design and development of complex and highly technical dispensing devices for the air care and home and household markets.
| • | Air Care includes home and car fragrances in a variety of formats encompassing membranes, diffusers and plug-ins as well as products for the pet care category. |
| • | Home, Pest and Auto Care includes a comprehensive range of disinfectants, household cleaners, pastes and liquid polishes, specialty laundry and fabric care, trigger sprays and detergents. Pest control products include insecticide plug-ins, coils and mats as well as anti-moth traps. Auto care solutions include car waxes, washes, protectants and other surface cleaners that clean, shine and protect. |
Our Markets
We support our customers in numerous regions across the globe. As of July 31, 2021, our manufacturing footprint includes 25 facilities, operating in 11 countries across North America, Europe, Latin America and Asia. Our global footprint coupled with our local presence enable us to provide in-market manufacturing capabilities for our customers, who also value our ability to deliver solutions across multiple regions.
We are established in developed markets, such as North America and Europe, and have growth opportunities in fast-growing regions, including the Asia Pacific region and Latin America. For the fiscal year ended April 30, 2021, United States and Canada; Europe, the Middle East and Africa; and the Asia Pacific region represented $1.6 billion, $423.0 million and $116.8 million, respectively, of our total revenue. In addition, for the three months ended July 31, 2021, United States and Canada; Europe, the Middle East and Africa; and the Asia Pacific region represented $451.5 million, $109.2 million and $28.8 million, respectively, of our total revenue. Products that we co-developed are available in more than 70 countries worldwide, as of July 31, 2021. Our geographic diversification allows us to benefit from the stable growth of developed markets while positioning us to capture tailwinds of high-growth emerging markets.
Our Customers
We provide a comprehensive suite of services to a diverse set of over 700 customers worldwide across an expansive range of products that span the pricing spectrum from mass to prestige. Our dynamic platform enables us to partner with customers to support their specific needs. This ranges from responding to a product brief for a particular formula, solution or packaging need to proactive development with a client to conceptualize a new product or solution. We also manufacture and commercialize products based on detailed customer specifications,
138
Table of Contents
providing critical support to bring a new product to life. For each of the year ended April 30, 2021 and the three months ended July 31, 2021, approximately 73% of our total revenue was attributable to products we helped ideate, design or develop with the balance related to manufacturing-driven support.
With our breadth of capabilities, we believe we are uniquely positioned to support our clients through each phase of the product development cycle. As a result, we have cultivated a broad customer base ranging from fast-growing emerging brands to scaled, global leaders in the beauty, personal and home care categories. We collaborate with established brands, who increasingly turn to outsourced support for strategic product development. We are also a valued partner for emerging brands, who view us as a critical enabler in rapidly developing products that meet their ever-changing demands. Our customers are able to access our innovation capabilities and leverage our flexible manufacturing platform and agile production capabilities to launch new products with rapid speed to market while also ensuring business continuity for core brands.
Our customer base encompasses 18 of the 20 largest beauty, personal care and home care companies that operate in our core categories—beauty, personal care and home care—when ranked by retail sales in 2020, according to Euromonitor.12 In total, these 18 customers had a 52% share of beauty, personal care and home care categories in 2020, according to Euromonitor.10 As of July 31, 2021, our customers also included more than 200 independent and emerging customers, who we have selectively targeted as owning many of the fastest growing and most noteworthy brands. We maintain long-term, strategic partnerships with our customers, averaging relationships of more than 30 years with each of our top 10 customers. For the fiscal year ended April 30, 2021, our two largest customers represented 20.3% and 14.4%, respectively, of our total revenue. In addition, for the three months ended July 31, 2021, our two largest customers represented 20.6% and 12.5%, respectively, of our total revenue.
We believe customers value our expansive product offering and comprehensive set of capabilities, and, as a result, we are often entrenched across multiple levels via multiple touchpoints within their organizations. The high level of customer integration coupled with the breadth and depth of our capability set result in elevated strategic dialogue with customers. As a result, we frequently maintain and grow our business with customers over time as they expand into new products, categories and geographies.
Our Customer Relationships
Within our customer-centric organization, we maintain a cross-functional approach to supporting our brand partners. We align functional experts with their client counterparts to provide support and to drive collaboration across multiple levels of the organization. These dedicated teams collaborate with the customer to conceive new product concepts, and as product discussions evolve will seamlessly coordinate with functional teams within innovation, packaging and product design, and manufacturing at an early stage to ensure optimal delivery for the customer. Customers also receive local support, with dedicated resources situated in-market and well-versed in potential complexities and nuances of local regulations. This comprehensive coverage effort is complemented by strategic dialogue with senior management to ensure a cohesive approach that enhances the customer experience. This level of customer interconnectivity results in deeply entrenched relationships, whereby customers view kdc/one as a trusted partner capable of providing value-added support in a multitude of capacities.
Our functional structure is designed to preserve and enhance creativity, entrepreneurship and innovation among teams. Each integrated sales team is empowered to pursue cross-selling across our entire network, leveraging the breath of our services on a global basis to best serve the needs of our customers. Given the scope of our platform, we believe there is a meaningful yet relatively untapped opportunity to cross-sell our comprehensive suite of value-added solutions to both new and existing customers.
| 12 | Euromonitor International Limited. Beauty & Personal Care 2021 Retail Value RSP Fixed 2020 Exchange Rate, Home Care 2021 Retail Value RSP Fixed 2020 Exchange Rate. Data extracted April 2021. |
139
Table of Contents
Our Capabilities
We have built a broad set of value-add capabilities centered on innovative formulation, packaging design and manufacturing solutions of the highest quality. We believe our global infrastructure and agile supply chain enable us to support the complex production requirements of our customers while being responsive to various needs that may arise at discrete phases of the product development cycle.
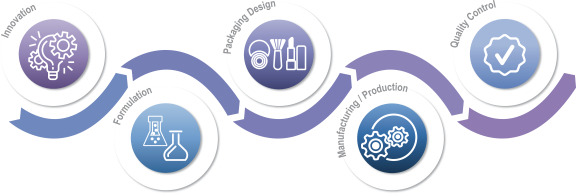
Innovation
Innovation is a core strength and critical to our value proposition for customers. We believe our innovation capabilities are industry-leading and that customers rely on our expertise to help drive ground-breaking product innovation for their brands. As of July 31, 2021, our technological capabilities are supported by an extensive team of approximately 400 experienced project managers, engineers, designers, formulators, bench chemists and lab technicians. As of July 31, 2021, our global multi-site network includes 22 R&D, design and creative facilities and four innovation hubs that specialize in trend scouting, product development and cutting-edge packaging design as of the same date. We foster innovative thinking in various creative capacities, including, but not limited to, technology scouting and start-up acceleration, to promote breakthrough product development. Our personnel are also connected locally with brand partners and focused on identifying and capitalizing on emerging consumer trends. We combine our market intuition, creative thought and technical expertise to develop proprietary solutions that help transform compelling, often multi-faceted concepts into coveted products for our customers.
We have a strong track record of bringing product innovation quickly to market for our customers. Over the past three years, we have co-developed over 9,000 new products. Our innovation capabilities are, among others, applied to formulation, dispensing devices and packaging that allow us to address different categories and brands.
Product Development
Our integrated expertise in product development, packaging innovation and manufacturing, combined with superior service, supports consistent delivery of leading solutions for our customers. Our teams are at the forefront of the latest trends and technologies, collaborating with our customers to offer complex solutions with an elevated approach reflective of each brand’s vision. The specific services we provide include formula development, efficacy testing, sensory evaluation, packaging design and development, engineering, and tooling unit production. We also leverage techniques such as 3-D printing and rapid prototyping to enhance client collaboration and support faster speed-to-market.
In partnership with our customers, we co-develop high-performance formulations across a broad range of product forms. Our capabilities include creams, lotions, solid sticks, loose and pressed powder, hot fills and gels, oils, scrubs, aerosols, thin fills, among others. Our library contains over 24,000 formulations. We also specialize in the design and
140
Table of Contents
manufacturing of innovative, high-quality packaging solutions and handle virtually all packaging formats and substrates. Customers have the option to choose from our comprehensive library of stock ranges, including over 700 options, or create completely custom designs and personalize specifications for all packaging solutions.
For the fiscal year ended April 30, 2021, we developed over 3,500 formulations and 7,500 packaging designs.
Manufacturing Process
As of July 31, 2021, our manufacturing platform includes 25 facilities strategically situated in 11 countries to serve our customers on a global basis. Our extensive manufacturing network and supply chain capabilities aim to maximize customer service, provide flexibility and ensure responsiveness, reducing logistical costs and our carbon footprint.
The agility and adaptability of our manufacturing process supports the increasing product complexity demanded by our customers. Our flexible manufacturing structure supports both longer runs with automation and shorter runs for customized products. Our equipment platform is predominantly standardized and highly reliable, and our batching processes are largely automated. Quality control is partially designed-in, leveraging advanced vision systems across many of our high-speed automated filling lines. Our process control and total productive maintenance strategies enable increased capability to swiftly adapt to new and/or changing product specifications. We employ a diverse range of process technologies with in-house subject matter experts and engineers that work closely with our customers to meet their specifications.
We design our teams to be diverse and highly capable of delivering innovation, with our R&D organization fully integrated with manufacturing for direct feedback to design. Our supply chain design and lean manufacturing capabilities drive continuous improvement of results with annual supply chain loss analysis serving as a key enabler in this endeavor. In order to remain highly competitive, we frequently benchmark our results and reapply best demonstrated systems across our manufacturing network. We believe our ability to deliver high-touch innovation with agile speed to market and operational excellence is a competitive advantage that differentiates us in the marketplace.
Procurement and Production
We maintain a diverse supplier base and cultivate strategic relationships with key suppliers to provide stability of supply as well as cost-effective and leading-edge solutions, with relationships often cultivated over many years. Sustainability is a focus during sourcing, along with quality and serviceability. We constantly seek to transform supply chain processes in the spirit of continuous improvement while providing proactive support to the sales, operations and R&D teams.
Quality Control
We maintain high standards for product quality and regulatory compliance with strict policies and procedures monitored and enforced across all of our manufacturing facilities. Our comprehensive quality assurance program monitors compliance through the production cycle to ensure operational and quality excellence.
The quality assurance organizations at our manufacturing facilities oversee self-improvement audits on a weekly, monthly, and quarterly basis to ensure compliance of our manufacturing, packaging, and testing steps with our standard operating procedures. Audits are also conducted annually by many customers and/or third-party auditors. Our standard operating procedures ensure the safety and effectiveness of the products we manufacture, in line with customer specifications and industry standards. Any deviations from these established
141
Table of Contents
procedures, should they occur, are investigated immediately to determine the root cause for the deviation, addressed via corrective and preventative actions and subject to a documented assessment that evaluates the potential impact of the deviation to avoid any further recurrence.
Intellectual Property
We believe that our intellectual property, including our trade secrets and know-how, has substantial value and has contributed significantly to the success of our business. This success depends in part upon our ability to protect our core trade secrets, know-how, technology and intellectual property. To establish and protect our proprietary rights, we rely on a combination of intellectual property rights (including patents, patent applications, trademarks, copyrights, and trade secrets, including know-how and expertise) and contracts (including license agreements, confidentiality, and non-disclosure agreements with third parties, invention assignment agreements, and other similar contractual rights).
As of July 31, 2021, we owned approximately 480 issued patents, design patents (industrial designs) and applications for patents and design patents (industrial designs) in the United States and other jurisdictions, including Brazil, Canada, China, the European Union, India, Korea, Mexico and Russia, among others. As of July 31, 2021, we also owned approximately 274 registered trademarks and trademark registrations in the United States and other jurisdictions, including Brazil, Canada, China, the European Union, United Kingdom, Switzerland, India, Japan, South Korea, Mexico, Russia and Thailand, among others.
The current registrations of our trademarks in the United States and foreign countries are effective for varying periods of time and are set to expire at various times between 2021 and 2040 and may be renewed periodically, provided that we comply with all applicable renewal requirements including, where necessary, the continued use of the trademarks in connection with similar goods. Our issued patents expire between 2021 and 2040. We cannot assure you that any of our patent applications will result in the issuance of a patent or whether the examination process will require us to narrow our claims. In addition, any patents may be contested, circumvented or found unenforceable or invalid (in whole or in part), and we may not be able to prevent third parties from infringing them.
In addition to patent and trademark protection, we own numerous URL designations and domain names, including kdc-one.com.
We may be unable to obtain, maintain, protect and enforce the intellectual property and proprietary rights necessary to conduct our business, and may be subject to claims that we infringe, misappropriate or otherwise violate the intellectual property or proprietary rights of others, which could materially harm our business. See “Risk Factors—Risks Related to Our Intellectual Property and Information Technology.”
Environmental, Social and Governance
The Company’s core values are best exemplified by our focus on Environmental, Social and Governance (“ESG”) initiatives. Not only are our customers increasingly seeking ESG-friendly solutions, we also believe that as a values-based company, we can better our communities. As ESG stewardship is ingrained across our organization, we are dedicated to evolving our efforts in support of all ESG initiatives.
Environmental Initiatives
Committed towards cleaner solutions for our customers and more sustainable brands and products for consumers, we have made great progress in implementing our various environmental and value-enhancing initiatives, which include:
| • | Tracing all of the electricity used in every kdc/one manufacturing operation to renewable energy sources; |
142
Table of Contents
| • | Purchasing carbon credits to offset all of our gas use; |
| • | Partnering with Ecovadis to aid increase visibility to the ESG efforts our suppliers make, allowing us to make educated decisions on partners and contracts; |
| • | Embarking on a network-wide water conservation project, with a five-year goal to identify and save 10 million gallons of water annually; and |
| • | Initiating a company-wide recycling initiative and efficient lighting and cooling projects. |
We are keen in delivering clean, conscious, and certified sustainable formulations to our customers. Our “Clean at kdc/one” program keeps us at the forefront of ingredient restrictions, ensuring we develop compliant formulas that deliver all the benefits consumers want while freeing them of materials perceived as harsh or unwanted.
The Company has also made great efforts to deliver sustainable product packaging to our customers and their consumers, such as:
| • | Introducing packaging compliant with recognized sustainability certificates; |
| • | Promoting the use of recycled plastics, bio plastics and refillable solutions through our packaging designs; |
| • | Using, no matter what packaging design, recycled plastics whenever possible; and |
| • | Reducing single-use plastic in our products and packaging. |
Human Capital Resources
As of July 31, 2021, we had approximately 11,700 full- and part-time employees, approximately 6,000 of whom were employed in connection with our Beauty and Personal Care segment and approximately 5,700 of whom were employed in connection with our Home Care segment. We also had approximately 3,500 temporary workforce from third-party agencies worldwide, including approximately 1,900 temporary workers in the United States and approximately 100 in Canada. Approximately 5,500 members of our full workforce were employed or contracted in the United States and approximately 800 were employed or contracted in Canada. As of July 31, 2021, approximately 2,300 of our employees were represented by a union. We believe we have a good relationship with our employees and to date, have never experienced a strike or significant work stoppage.
We strive to attract, retain and develop our employees who are critical to our success, particularly those involved in our R&D efforts. To succeed in a competitive labor market, we have developed key recruitment and retention strategies, objectives and measures that we focus on as part of the overall management of our business. These strategies, objectives and measures, outlined below, form the pillars of our human capital management framework as well as our social initiatives:
Diversity and Inclusion. Our commitment to diversity and inclusion is a defining feature of our culture. We believe that a diverse workforce is critical to our success, and we continue to focus on the hiring, retention and advancement of women and underrepresented populations. Our recent efforts have been focused in four areas: maintaining an inclusive culture that emphasizes respect for all people and fosters inclusion; setting expectations, objectives and measuring results from an employee compliance and accountability perspective; attracting, retaining, developing and promoting diverse talent; and fully integrating inclusive priorities into our leadership team. We believe that diversity is critical across all areas of our employees, customers, consumers and communities. We are planning to establish working groups to identify key areas of impact and initiate and promote diversity opportunities and stories. Across the organization, we expect to conduct assessments to drive an enterprise-wide strategy that will encompass the sharing of data and best practices while seeking to ensure executive sponsorship for key focus areas. Additionally, in 2021 we embarked on further corporate-wide programs to train and educate management on diversity and inclusion, and these programs will be rolling out to
143
Table of Contents
the full extent of our organization. These programs also aim at, reviewing and adapting hiring practices, and increase equitable pay and promotion practices, as well as creating opportunities for employees to connect and share their stories. We have launched various communications initiatives such as regular town halls, an internal social channel, a Company-wide newsletter and intranet, and employee counsels, all of which contribute to the sense of community we are adamant in fostering.
We recognize the importance and benefit of having a board of directors and senior management composed of highly talented and experienced individuals having regard to the need to foster and promote diversity among board members and senior management with respect to attributes such as gender, ethnicity, cultural background and other factors. At the moment, our management team, composed of our managers, directors, vice presidents and executive team, is in fact composed of 48% women and members of visible minorities, and upon consummation of this offering, we expect that four of our directors will be women, representing approximately 36% of our board of directors. We believe that having a diverse board of directors can offer a breadth and depth of perspectives that enhance our performance.
Health, Safety and Wellness. The success of our business is fundamentally connected to the well-being of our people. Accordingly, we are committed to the health, safety and wellness of our employees and the communities we engage with around the world. We provide our employees and their families with access to a variety of innovative, flexible and convenient health and wellness programs. In response to the COVID-19 pandemic, we implemented significant changes that we determined were in the best interest of our employees, as well as the communities in which we operate, and which comply with government regulations. Through the use of education and awareness, mandatory social distancing and mask wearing, health screenings and numerous changes to our manufacturing sites, we strive to make our workplaces a safe place for employees during the workday. We have policies and procedures in place for communicable disease outbreaks, including remote work and teleworking policies, and have developed and implemented Epidemic Prevention Work Guidelines and Preparedness Plan and General Guidelines for any confirmed cases. We plan on perpetuating these practices moving forward past the COVID-19 pandemic, as well as continuing our mental health awareness initiative to ensure both the physical and mental well-being of our people.
Compensation and Pay Equity. The philosophy behind our compensation program is to provide an attractive, flexible and market based total compensation program that is tied to performance and aligned with shareholder interests. Our goal is to be competitive in recruiting and retaining talent through high-quality compensation practices. Our compensation guiding principles are to invest in talent and potential and reward strong performance. We are committed to fair pay and strive to be externally competitive while ensuring internal equity across our organization. We have an industry-competing policy of compensation that includes (1) monetary direct compensation aimed at attracting retaining and rewarding talent composed of a base salary and performance incentive annual bonus, (2) monetary indirect compensation aimed at employee satisfaction, composed of group benefits, paid time off and retirement savings plans, and (3) non-monetary indirect compensation aimed at creating an engaged work force, composed of a recognition program, career development and promotion opportunities. We are conducting global pay equity assessments and compensation reviews, and we are actively working to improve our hiring practices, performance reviews and career development opportunities to eliminate unconscious bias that could contribute to pay inequities.
Competition
We operate in a fragmented market. The majority of our peers are relatively narrow in focus, specializing in specific geographic regions or discrete components of the customer value chain. We believe our ability to provide value-added solutions across the entire product development life cycle at scale on a global basis differentiates our platform relative to competitors.
Our competition within the beauty, personal care and home care categories includes outsourced manufacturers focusing on a limited range of products and/or solutions within a sub-set of these markets as well as service providers dedicated to serving local or regional markets. We may also compete with internal functions of consumer packaged
144
Table of Contents
goods companies that choose to develop their products with in-house capabilities. We compete primarily on the basis of our operational expertise, which includes our innovation, design and manufacturing capabilities; as well as scale, speed, security of supply, and service. To compete successfully, we must make continued investments in customer relationships and tailor our R&D efforts to anticipate customers’ and consumers’ needs.
As we further expand globally, we expect to face increased domestic competition, especially in the Asian market where established beauty and personal care manufacturers, formulators and packaging producers currently participate and emerging service providers have gained scale. The European market also contains several established manufacturers and formulators.
Properties
Our corporate headquarters and principal executive office in Canada is located in leased offices in Longueuil, Québec, the lease for which consists of approximately 10,000 square feet and expires in April 2027, and our registered office is located in Vancouver, British Columbia. We also maintain a principal executive office in the United States in Saddle Brook, New Jersey, the lease for which consists of approximately 13,000 square feet and expires in October 2028.
In addition to these principal executive offices, we occupy numerous offices, manufacturing facilities, R&D, design and creative facilities and innovation hubs in the United States and abroad. We have facilities and laboratories in 14 countries, including in seven states in the United States, covering over six million square feet in the aggregate.
The following table summarizes information with respect to the primary facilities leased or owned by us or our subsidiaries related to our Beauty and Personal Care segment and Home Care segment as of July 31, 2021:
| Location |
Type of Facility |
Primary Segment |
Area (sq. feet) | |||||
| Québec, Canada |
Head office, manufacturing, R&D facility, warehouse | Beauty and Personal Care | 408,000 | |||||
| Sonora, Mexico |
Manufacturing, R&D facility | Home Care | 578,000 | |||||
| New York, United States |
Manufacturing, warehouses, showrooms, R&D facility | Beauty and Personal Care | 372,000 | |||||
| Ohio, United States |
Manufacturing, warehouse, R&D facility | Beauty and Personal Care; Home Care |
1,034,000 | |||||
| Various locations, China |
Manufacturing, warehouse, R&D facilities, showrooms | Beauty and Personal Care; Home Care | 976,000 | |||||
We believe that all of our properties and facilities are well-maintained and are adequate for our operations and provide sufficient capacity to meet anticipated requirements. Our principal sites outside North America are located in Brazil, China, the European Union (France, Italy, Spain, Bulgaria and the Czech Republic), India, Mexico and the United Kingdom.
While some of our properties are owned, most of them are leased with leases set to expire at various times through 2038, subject to renewal options.
Regulatory Matters
We ideate, formulate, manufacture and package products in a number of jurisdictions around the world and are subject to federal, regional and local legislation in each such jurisdiction. Our manufacturing and packaging solutions, which among other industries, are intended for use in the cosmetic and personal care industries, are subject to our customers’ strict quality standards, in addition to regulatory standards across various jurisdictions. As a result, we in turn are required to adopt stringent practices to consistently meet or exceed these standards as they evolve over time and which affect both existing and new products. As we manufacture, design and package products, we aim to meet the highest industry standards and most stringent regulatory requirements applicable.
145
Table of Contents
Some of our manufacturing processes and controls are subject to regulation by governmental agencies in each of the markets in which we operate. These agencies include, but are not limited to, the following and their respective equivalent international agencies: (1) Health Canada, (2) the FDA, (3) the U.S. Environmental Protection Agency (“EPA”), (4) the U.S. Federal Trade Commission (“FTC”), (5) the Occupational Safety and Health Administration (“OSHA”), (6) the Bureau of Alcohol, Tobacco, Firearms and Explosives, (7) the Chemical Registration/Notification authorities that regulate chemicals we use in, or transport to, various countries in which we manufacture our products and (8) state and local regulatory agencies.
Products classified as cosmetics (as defined in the U.S. Federal Food, Drug and Cosmetic Act and the Food and Drugs Act (Canada)) are not subject to pre-market approval by the FDA and Health Canada, but the products must generally be safe and must be properly manufactured. In Canada, Health Canada must also be notified within 10 days of the first sale of a cosmetic or following any change to the information included in the notification. The regulations adopted and standards imposed by the FDA, Health Canada and similar foreign agencies evolve over time and can require us to make changes in our manufacturing processes and quality systems to remain in compliance. These agencies periodically inspect manufacturing and other facilities. If we fail to comply with applicable regulations and standards, we may be subject to sanctions, including fines and penalties, the recall of products and cessation of manufacturing.
Additionally, certain products, such as hand sanitizers, sunscreens, acne treatments and antiperspirant, are classified as over-the-counter (“OTC”) drugs, which have specific regulatory requirements, including ingredient and manufacturing requirements. Under the U.S. OTC monograph system, selected OTC drugs are generally recognized as safe and effective and do not require the submission and approval of a new drug application. The FDA OTC monographs include well-known ingredients and specific requirements for permitted indications, required warnings and precautions, allowable combinations of ingredients and dosage levels. Pharmaceutical products marketed under the OTC monograph system must conform to specific quality, formula and labeling requirements. In Canada, these products may be regulated as OTC drugs or as Natural Health Products (“NHPs”) depending on their composition. While Canada also has a monograph system for both OTC and NHP products, our customers must still obtain pre-market approval by Health Canada, although it may be expedited if it follows the monograph exactly. All U.S. facilities where OTC drugs are manufactured, tested, packaged, stored or distributed must comply with cGMP regulations and/or regulations promulgated by the FDA or other competent authorities. Facilities located in other countries where regulated activities occur in respect of OTCs or NHPs (such as manufacturing, testing, labelling, packaging, distributing, wholesaling and importing) may also require compliance with cGMP regulations, and/or regulations promulgated by competent authorities in the countries where the facilities are located and may include facility licensing requirements. All of our pharmaceutical products are manufactured, tested, packaged, stored and distributed according to cGMP regulations. The FDA, Health Canada and other regulators perform periodic audits to ensure that our facilities remain in compliance with all appropriate regulations. The failure of a facility to be in compliance may lead to a breach of representations made to customers or to regulatory action against us related to the products made in that facility, such as seizure, injunction or recall. Serious product quality concerns could also result in governmental actions against us that, among other things, could result in the suspension of production or distribution of our products, product seizures, loss of certain licenses or other governmental penalties, and could have a material adverse effect on our financial condition or operating results. Our customers are required to report serious adverse events associated with the use of our OTC drugs marketed in the United States, Canada and other jurisdictions.
We are also a manufacturer of certain medical devices, which are subject to regulation by numerous government agencies, including the FDA and comparable agencies outside the United States. To varying degrees, each of these agencies requires us to comply with laws and regulations governing the development, testing, manufacturing, labeling, marketing and distribution of our medical devices. Both before and after a product is commercially released, we have ongoing responsibilities under FDA and similar regulations. We are also subject to periodic inspections by the FDA and comparable agencies to determine compliance with the applicable requirements, including primarily the quality system regulations and medical device reporting regulations. In
146
Table of Contents
addition, as device manufacturers, we are permitted to promote those products solely for the uses and indications set forth in the approved product labeling.
Our business operations and properties procure, make use of and manufacture substances that are sometimes considered hazardous and are therefore subject to extensive and increasingly stringent federal, state, provincial, local and foreign laws and regulations pertaining to protection of the environment and worker health and safety, including climate change, air and greenhouse gas emissions, wastewater discharges, generation, handling and use of hazardous materials (including in consumer products), waste disposal practices and clean-up of existing environmental contamination. Failure to comply with these laws and regulations may result in significant consequences to us, including the need to close or relocate one or more of our production facilities, administrative, civil and criminal penalties, fines, sanctions, litigation, costly capital expenditures, remediation, abatement and mitigation measures, liability for damages and negative publicity. If we are unable to meet production requirements, as a result of restrictions associated with these laws and regulations or proceedings arising from our failure to comply, we can lose customer orders, which can adversely affect our future growth or require us to make incremental capital investments to ensure supply.
Under certain laws and regulations, such as the U.S. federal Superfund law or its state equivalents, or the Environment Quality Act (Québec) or its equivalent in other Canadian provinces, the obligation to investigate, remediate, monitor and clean up contamination at a property may be imposed on current and former owners, lessees or operators or on persons who may have sent waste to that facility for disposal. Liability under these laws and regulations may be imposed without regard to fault or to the legality of the activities giving rise to the contamination. Moreover, we may incur liabilities in connection with environmental conditions currently unknown to us relating to our prior, existing or future owned or leased sites or operations or those of predecessor companies whose liabilities we may have assumed or acquired.
We may incur liabilities for noncompliance, or substantial expenditures to achieve compliance, with environmental and other laws or changes thereto in the future or as a result of the application of additional laws and regulations to our business, including those limiting greenhouse gas emissions, those requiring compliance with the European Commission’s REACH procedures, or other laws and regulations concerning any potential health hazards associated with our products, and those imposing changes that would have the effect of increasing the cost of producing or would otherwise adversely affect the demand for plastic products. We have seen an increase in registration and reporting requirements concerning the use of certain chemicals, such as those subject to REACH, in a number of countries.
Our global operations are subject to the FCPA, Canada’s Corruption of Foreign Public Officials Act, other countries’ anti-corruption and anti-bribery regimes, and different regulatory structures and changes in regulatory environments, and in particular in our facilities in Brazil, India and China as a result of recent acquisitions.
Corporate Information and History
KDC Opco was initially incorporated on December 17, 1990 as 176254 Canada Inc., and thereafter changed its name to Knowlton Packaging, Inc. in 1991, to Knowlton Development Corporation Inc. in 2018 and to kdc/one Development Corporation, Inc. in 2021. In connection with the Acquisition, Knowlton Development Parent, Inc. was incorporated under the BCBCA in November 2018 to become the indirect parent company of KDC Opco. On July 1, 2021, KDC Opco changed its name to kdc/one Development Corporation Inc. On the same day, Knowlton Development Parent, Inc. and Knowlton Development Holdco, Inc., a wholly-owned subsidiary of the Knowlton Development Parent, Inc., amalgamated under the laws of British Columbia and continued as one corporation named Knowlton Development Corporation, Inc., which became the direct parent of KDC Opco. The Company owns no significant assets nor has any operations other than the ownership of all the common shares of KDC Opco.
Over the years, we grew from a manufacturer of personal care products destined to the North American market to the provider of value-added solutions in the beauty, personal care and home care segments that we are
147
Table of Contents
today, both through organic growth and our disciplined approach to acquisitions. Notable acquisitions include Chemaid Laboratories during the fiscal year ended April 30, 2015, followed by Kolmar and Acupac during the fiscal year ended April 30, 2016, Thibiant during the fiscal year ended April 30, 2017 and Aromair and Northern Labs during the fiscal year ended April 30, 2018. In 2018, we launched the “kdc/one Innovation Lab,” a think tank and idea incubator for our network sites and partners.
In November 2018, Knowlton Development Corporation, Inc. was incorporated under the BCBCA, and on December 21, 2018, kdc/one Development Corporation, Inc. was acquired by, and amalgamated with, the Purchaser, resulting in Knowlton Development Corporation, Inc. becoming the indirect parent company of KDC Opco. The Company owns no significant assets nor has any operations other than the ownership of all the common shares of KDC Opco. See “Financial Statement Presentation.”
In the year ended April 30, 2020, we completed the acquisitions of Alkos, Swallowfield, HCT, Benchmark, CLA, Paristy and Zobele, significantly expanding our geographic footprint and products capabilities.
Our principal executive offices in Canada are located at 375 Roland-Therrien Boulevard, Suite 210, Longueuil, Québec, Canada, J4H 4A6, and our telephone number is (450) 243-2000. Our registered office is located at Suite 1700, Park Place, 666 Burrard Street, Vancouver, British Columbia, Canada, V6C 2X8. We also maintain a principal executive office in the United States, located at 250 Pehle Avenue, Suite 1000, Saddle Brook, New Jersey 07663, where the kdc/one Innovation Lab is situated. Our website is www.kdc-one.com. Our website and the information contained therein or connected thereto is not incorporated into this prospectus or the registration statement of which it forms a part.
Intercorporate Relationships
The following table lists the material subsidiaries of the Company, the percentage of votes attaching to all voting securities of each subsidiary, and the jurisdiction of organization of each such subsidiary and entity.
| Subsidiaries |
Percentage of Voting Securities Owned |
Jurisdiction Where | ||
| Aromair Fine Fragrance Company |
100% | Delaware | ||
| HCT Europe Limited |
100% | United Kingdom | ||
| HCT Packaging, Inc. |
100% | New Jersey | ||
| KDC US Holdings, Inc. |
100% | Virginia | ||
| KDC/ONE Cosmetic Laboratories of America Inc. |
100% | Delaware | ||
| kdc/one Development Corporation, Inc. |
100% | British Columbia | ||
| Kolmar Laboratories, Inc. |
100% | Delaware | ||
| Northern Labs, Inc. |
100% | Delaware | ||
| Thibiant International, Inc. |
100% | California | ||
| Tri-Tech Laboratories, LLC |
100% | Delaware | ||
| Zobele Bulgaria Eood |
100% | Bulgaria | ||
| Zobele Holding S.p.A. |
100% | Italy | ||
| Zobele Instrument (Schenzhen) Co., Ltd. |
100% | China | ||
| Zobele Mexico S.A. de C.V. |
100% | Mexico | ||
| Zobele USA Inc. |
100% | United States |
Our other subsidiaries, excluding those listed above, each represent 10% or less of our total consolidated assets and 10% or less of our total consolidated revenues and together represent less than 20% of our total consolidated assets and less than 20% of our total consolidated revenues.
Legal Proceedings
From time to time, we are involved in various legal proceedings, lawsuits and claims incidental to the conduct of our business. Our businesses are also subject to extensive regulation, which may result in regulatory
148
Table of Contents
proceedings against us. Currently, there are no claims or proceedings against us that we believe will have a material adverse effect on our business, financial condition, results of operations or cash flows. However, the results of any current or future litigation cannot be predicted with certainty, and regardless of the outcome, we may incur significant costs and experience a diversion of management resources as a result of litigation.
149
Table of Contents
Executive Officers and Directors
Set forth below is certain biographical and other information regarding the directors and executive officers of our Company as of the date of this prospectus. Unless otherwise stated, the business address for our directors and executive officers is c/o 375 Roland-Therrien Boulevard, Suite 210, Longueuil, Québec, Canada J4H 4A6.
| Name |
Age | Position | ||
| Nicholas Whitley | 50 | President, Chief Executive Officer and Director | ||
| Gregg Kam | 58 | Chief Financial Officer | ||
| Wayne Swanton | 54 | President, Beauty and Personal Care | ||
| Roberto Schianchi | 58 | President, Home Care | ||
| Ian Kalinosky | 63 | President, Specialty Retail | ||
| Jacques Bougie | 73 | Director | ||
| Kevin Chance | 54 | Director | ||
| Justine Cheng | 45 | Director and Chair of the Board | ||
| Joanna Coles | 59 | Director | ||
| Marie Josée Lamothe | 53 | Director | ||
| Steven Lin | 52 | Director | ||
| Pierre Pirard | 54 | Director | ||
| Valarie Sheppard | 57 | Director | ||
| Timothy Thorpe | 51 | Director | ||
| Stephen Trevor | 57 | Director |
Nicholas Whitley has served as our President and Chief Executive Officer since January 2013 and as a member of the board of directors since 2020. Under his leadership, the Company undertook a first wave of successful acquisitions that expanded the Company’s capabilities and geographic footprint in North America. Mr. Whitley then developed and executed on a plan to further expand the capabilities of the Company across the beauty and personal care sector as well as the home care sector, which saw the Company complete seven additional acquisitions and integrations in fiscal year 2020. Before joining our Company, Mr. Whitley was President of KIK Custom Products, a division of KIK Corporation, from 2007 to 2009, where he developed and implemented an integrated approach to customer management and manufacture network. From 1999 to 2007, he held a number of senior executive positions with Cott Beverages, a public company focused on private label and contract beverage manufacturing for regional and national brands. He ended his time at Cott Beverages as Managing Director of Western Europe, in charge of three manufacturing sites in the United Kingdom and a network of third-party bottlers across Eastern and Western Europe. Mr. Whitley holds a B.S. in general agriculture (with honors) from Aberdeen University.
Gregg Kam has served as our Chief Financial Officer since June 2019. Before joining the Company, Mr. Kam was Chief Financial Officer of Sonneborn LLC, a manufacturer of specialty hydrocarbons, from 2015 to 2019 and had various roles, including Chief Financial Officer, at The Newark Group, Inc., a manufacturer of recycled paperboard products, from 2011 to 2015. From 2008 to 2011, Mr. Kam held various roles, including Chief Financial Officer, at International Specialty Products, Inc., a global specialty chemical manufacturer. His professional experience also includes various leadership roles at National Starch & Chemical Company and Unilever over the course of almost 20 years. Mr. Kam holds an MBA in finance from the New York University Stern School of Business and a B.S. in accounting and finance from the State University of New York at Buffalo. He is also a certified public accountant.
Wayne Swanton has served as our Head of Beauty and Personal Care since May 2020. Before joining kdc/one, he was Executive Vice President, Global Operations at Allergan, Inc., a global pharmaceutical company, where he led the company’s end-to-end supply chain for from 2015 to 2020. From 2006 to 2012, Mr. Swanton, a
150
Table of Contents
UK native, held various leadership positions in across Europe, the United States and Puerto Rico at Abbott Laboratories a multinational medical devices and healthcare company. Mr. Swanton currently serves on the board of directors of Working Capital Solutions Consulting and The Shine Collective, a nonprofit organization. He has previously served on the board of directors of the National Association of Manufacturers, from 2018 to 2020, and Lesideng Soup Kitchen, a nonprofit organization, from 2007 to 2012. Mr. Swanton is a fellow of the Chartered Association of Certified Accountants, UK.
Roberto Schianchi has served as Chief Executive Officer of Zobele since November 2010 and our President, Home Care since the acquisition of Zobele in April 2020. During his tenure as CEO of Zobele, Mr. Schianchi has been an active board member of several of Zobele’s subsidiaries. Before joining Zobele, Mr. Schianchi was Executive Vice President of Global Sales Groupe Sidel S.A., a designer, manufacturer and distributor of machinery for the bottling and packaging of liquids, where he was responsible for global sales. During his tenure at Sidel, from 2004 to 2010, Mr. Schianchi also served as Managing Director and a board member of several of the group’s legal entities across China, the United States, Mexico and Brazil. Mr. Schianchi holds an M.S. in mechanical engineering from the Politecnico di Milano, along with several certifications from advanced management courses at various institutions.
Ian Kalinosky has served as our President, Specialty Retail since 2013. Before joining kdc/one, he was Product Supply Director for Procter & Gamble’s North America home care business from 2008 to 2013, where he led end-to-end product supply for brands such as Swiffer, Febreze and Cascade, as well as the Go-To-Market team for the Dollar Channel. Prior to this, Mr. Kalinosky held several roles over 16 years with Duracell Batteries, including Vice President of Global Manufacturing, General Manager at Duracell (China) Ltd., and Director of Manufacturing Strategy. He currently serves as chair of the board of trustees for the New Albany (Ohio) Chamber of Commerce and previously served on the board of the Association for Manufacturing Excellence, a nonprofit organization providing operational excellence resources to small and mid-size manufacturing companies. Mr. Kalinosky holds a B.S. in business, management and economics from the State University of New York Empire State College.
Jacques Bougie has served as a member of the Company’s board of directors since 2019. Mr. Bougie was President and Chief Executive Officer of Alcan Inc., a global producer and supplier of aluminum, from 1993 to 2001. He joined Alcan in 1979 and held various positions in operations, global project management, planning and general management before being appointed President and Chief Operating Officer in 1989 and Chief Executive Officer in 1993. Since his retirement from Alcan in 2001, Mr. Bougie has been a full-time corporate director. He has served as a member of the board of directors and the chair of the audit committee of McCain Foods Ltd. since 2002 and as a member of the board of directors of CSL Group Inc. since 2007. He also chairs the advisory board of the Montréal Neurological Institute and Hospital. Mr. Bougie was the chair of the board of directors at Atrium Innovations Inc. from 2014 to 2018 and served as a member of the board of directors and as the chair of the governance and ethics committees of SNC Lavalin Group Inc. from 2013 to 2020. Additionally, he has served on the boards of Alcan Inc., Abitibi-Consolidated, BCE Mobile Communications Inc, Bell Canada, Royal Bank of Canada, Nova Chemicals Corporation, Novelis Inc., Rona Inc. and the Gairdner Foundation. Mr. Bougie holds a DSA in business from École des hautes études commerciales de Montréal and an LLB in law from the Université de Montréal. He was made an Officer of the Order of Canada in 1994.
Kevin Chance has served as a member of the Company’s board of directors since 2019. Mr. Chance has been employed by Danaher Corporation or one of its subsidiaries since November 2011. He has served in a number of roles during that tenure, including President of Molecular Devices, President of Danaher Labs, President, Products & Services at Beckman Coulter Diagnostics, Vice President of the Danaher Business System Office, and currently as the Vice President & Group Executive of the Life Science Instruments Group at DH Life Sciences, LLC, a Danaher company. In his current role, he is responsible for a portfolio of five operating companies. He is also the Danaher executive with oversight responsibility for the Danaher Business System Office. From 2009 to 2011, Mr. Chance served as President of the Chromatography & Spectrometry Division at Thermo Fisher Scientific. Mr. Chance holds a B.S. in electrical engineering from the Albert Dorman Honors
151
Table of Contents
College at the New Jersey Institute of Technology and an MBA from The Wharton School at the University of Pennsylvania.
Justine Cheng has served as a member of the Company’s board of directors since 2018. She is the chair of the board. Since 2016, she has served as a Founding Partner of Cornell Capital. Before joining Cornell Capital, Ms. Cheng worked with the private equity group at Fortress Investment Group from 2004 to 2016, where she was most recently a managing director. While at Fortress, she also served as Chief Financial Officer and Chief Operating Officer for New Senior Investment Group from 2014 to 2016 and Newcastle Investment Corp. from 2014 to 2016. Ms. Cheng previously held various private equity and investment banking positions at UBS, Credit Suisse and Donaldson Lufkin & Jenrette. Ms. Cheng serves on the board of directors of Instant Brands, a leading global manufacturer and marketer of dinnerware, cookware, storage and food prepware under brands including Instant Pot, Pyrex, Corelle, Snapware and CorningWare, and as chair of the board of INW: Innovations in Nutrition + Wellness, a leader in custom R&D, manufacturing and marketing support solutions for global brands that serve the fast-growing nutrition and wellness industry. She is also a member of the board of directors of two special-purpose acquisition companies, Northern Star Acquisition Corp. and Northern Star Acquisition Corp. III. Ms. Cheng holds a B.A. in Economics and a M.S. in International and Public Affairs from Columbia University.
Joanna Coles has served as a member of the Company’s board of directors since 2021. Ms. Coles has been a senior advisor to Cornell Capital since May 2019 and the chair and chief executive officer of Northern Star Acquisition Company I, II, III and IV since July 2020, November 2020, November 2020 and February 2021, respectively. Ms. Coles has been the Executive Producer for ABC Freeform’s The Bold Type since 2016. She was Chief Content Officer of Hearst Magazines from 2016 to 2018. She was editor-in-chief of Cosmopolitan from 2012 until 2016 and previously edited Marie Claire magazine from 2006 to 2012. Ms. Coles sits on the boards of directors of public companies Snap Inc. (Snapchat) and Sonos, Inc.; private company Density; and the non-profit Women Entrepreneurs New York City. Ms. Coles holds a B.A. in English and American literature from the University of East Anglia.
Marie Josée Lamothe has served as a member of our board of directors since 2021. Since August 2018, Mrs. Lamothe has been a Professor of Practice at McGill University (Desautels Business Faculty) and the Director of McGill’s Dobson Center for Entrepreneurship, whose mission is to transform the university’s innovation into viable startups led by global entrepreneurs, since August 2019. From 2014 to 2018, she acted as Managing Director at Google Canada, where she headed the branding and go-to-market practice. She also held several executive positions at L’Oreal between 2002 and 2014, from International Marketing Director in France, to Chief Marketing Officer and Chief Corporate Communications Officer in Canada. She is also a member of the board of directors of Fédération des Caisses Desjardins du Québec, Capital Desjardins Inc., Alimentation Couche-Tard and Lightspeed HQ. She was previously a director of Jean Coutu Group PJC Inc., from July 2016 until the privatization of the company in May 2018, and of Reitmans Canada Ltd., from April 2015 to August 2019. Mrs. Lamothe obtained a certification from MIT Sloan & MIT CSAIL Artificial Intelligence: AI Implications for Business Strategy, completed INSEAD’s L’Oreal executive management program in France, and she holds a dual B.A. in mathematics and economics, with honors, from the University of Montréal.
Steven Lin has served as a member of our board of directors since 2021. Since 2018, Mr. Lin has been a managing partner at C2 Capital Partners. He joined C2 Capital Partners from Laureate Education, Inc., where he served as President and Chief Executive Officer - North Asia, from 2011 to 2018, and President and Chief Executive Officer - Japan, from 2010 to 2011. Mr. Lin’s more than 25 years of investment, operations and management experience in Asia also include various roles at Goldman Sachs, Morgan Stanley and GMAC Commercial Holding Corp., a commercial real estate financing company. He has served on the board of directors of Bubs Australia Limited, a producer of infant formula, baby food, cereals and toddler snacks, since 2019. Mr. Lin holds a B.A. in economics from Harvard College.
Pierre Pirard has served as a member of the Company’s board of directors since 2019. Since 2017, he has worked on various interim executive management projects through his consulting firm, PBP Advisors LLC. From 2007 to 2016, Mr. Pirard was the Head of Supply Chain Management at Elizabeth Arden, Inc., a cosmetics,
152
Table of Contents
skin care and fragrance company. From 1992 to 2007, he held various positions at Johnson & Johnson’s consumer division, including Director of Planning for North America, from 2000 to 2004, and Director of Contract Manufacturing, from 2004 to 2007. Mr. Pirard holds a B.S. in engineering from Concordia University and an MBA from the University of Chicago.
Valarie Sheppard has served as a member of the Company’s board of directors since 2021. Before retiring in March 2021, Ms. Sheppard led Proctor & Gamble’s global finance, accounting and treasury team, where she was responsible for the external financial reporting, financial planning, global business development and treasury operations for company businesses and operations. She joined Proctor & Gamble as a tax analyst in 1986 and held varied roles within the company over her 35-year tenure, including finance and accounting positions in Fabric Care, Home Care and Beauty businesses, both in the U.S., and internationally. Ms. Sheppard is a board member of the Federal Reserve Bank of Cleveland; Anixter International, Inc., a supplier of goods and services for communications, security, networking, audio-visual and industrial control applications; and Cintrifuse, a Cincinnati-based start-up incubator. Ms. Sheppard holds a B.S. in accounting from Purdue University and an M.S. in industrial administration from the Krannert School of Management at Purdue University.
Timothy Thorpe has served as a member of the Company’s board of directors since 2020. From August 2013 to June 2020, Mr. Thorpe was President and CEO of HCT Packaging, Inc., which was acquired by the Company in 2020. Prior to 2013, Mr. Thorpe held various positions within HCT Group, beginning in 1999. During his tenure with HCT Group, Mr. Thorpe helped establish HCT’s Santa Monica office in 2003 and HCT’s Hong Kong office in 2007.
Stephen Trevor has served as a member of the Company’s board of directors since 2018. Mr. Trevor has been a partner at Cornell since November 2017. Before joining Cornell, from 2012 to 2017, Mr. Trevor served as Senior Managing Director at Avenue Capital Group, focused on private debt, private equity and distressed for control investments. He also served as President, Chief Executive Officer and Secretary of two special-purpose acquisition companies, Boulevard Acquisition Corp. I (2013 to 2015) and Boulevard Acquisition Corp. II (2015 to 2017), until the completion of their business combinations. From February 2011 to January 2012, Mr. Trevor served as Senior Advisor to United States Senator Kirsten Gillibrand. From 2007 to 2010, Mr. Trevor held various leadership roles at Morgan Stanley, including co-head of Merchant Banking and Private Equity, global co-head of Investment Management and was a member of Morgan Stanley’s management and risk committees. Prior to Morgan Stanley, Mr. Trevor was a partner and managing director in the Principal Investment Area in Goldman Sachs. Mr. Trevor has served on the board of directors of various companies, including Berry Plastics Corporation, Capmark Financial Group, Cobalt International Energy, L.P., Cognis, Deutsche Kabel, Messer Griesheim Holding and Wincor Nixdorf. Mr. Trevor holds a B.A. in political science and psychology from Columbia College and an MBA from Harvard Business School.
Corporate Governance
As a NYSE-listed company, we will be required to comply with the listing rules of the NYSE. The disclosure set out below includes disclosure required by Regulation S-K of the Securities Act as well by the NYSE listing rules, describing our approach to corporate governance.
The Canadian securities authorities have issued corporate governance guidelines pursuant to National Policy 58-201 Corporate Governance Guidelines (the “Corporate Governance Guidelines”), together with certain related disclosure requirements pursuant to National Instrument 58-101 Disclosure of Corporate Governance Practices (“NI 58-101”). The Corporate Governance Guidelines are recommended as “best practices” for issuers to follow. We recognize that good corporate governance plays an important role in our overall success and in enhancing shareholder value and, accordingly, we have adopted, or will be adopting in connection with the consummation of this offering, certain corporate governance policies and practices which reflect our consideration of the recommended Corporate Governance Guidelines. The disclosure set out below includes disclosure required by NI 58-101 describing our approach to corporate governance in relation to the Corporate Governance Guidelines.
153
Table of Contents
Composition of our Board of Directors
Under our articles, our board of directors will consist of a number of directors as determined from time to time by the directors. Upon consummation of this offering, our board of directors will be composed of eleven directors. Our articles provide that a director may be removed with or without cause by a resolution passed by a special majority composed of 66 2/3% of the votes cast by shareholders present in person or by proxy at a meeting and who are entitled to vote. Directors will be elected by the shareholders at each annual general meeting of shareholders. Under the BCBCA and our articles, between annual general meetings of our shareholders, the directors may appoint one or more additional directors, but the number of additional directors may not at any time exceed one-third of the number of current directors who were elected or appointed other than as additional directors.
Certain aspects of the composition and functioning of our board of directors may be subject to the rights of our principal shareholders under agreements with the Company. For example, the Shareholders’ Agreement will provide for certain director nomination rights. See “Certain Relationships and Related Party Transactions—Shareholders’ Agreement.” Subject to such agreements, nominees for election as directors will be recommended to our board of directors by our Nominating and Corporate Governance Committee in accordance with the provisions of applicable corporate law and the charter of our Nominating and Corporate Governance Committee. See “Committees of the Board—Nominating and Corporate Governance Committee.”
Majority Voting Policy
In accordance with the requirements of the TSX, our board of directors will adopt a majority voting policy to the effect that a nominee for election as a director of our Company who does not receive a greater number of votes “for” than votes “withheld” with respect to the election of directors by shareholders will be expected to tender his or her resignation to the chair of our board of directors promptly following the meeting of shareholders at which the director was elected. The Nominating and Corporate Governance Committee will consider such resignation and make a recommendation to our board of directors whether to accept it or not. Our board of directors will promptly accept the resignation unless it, in consultation with the Nominating and Corporate Governance Committee, determines that there are exceptional circumstances that should delay the acceptance of the resignation or justify rejecting it. Our board of directors will make its decision and announce it in a press release within 90 days following the applicable meeting of shareholders. A director who tenders a resignation pursuant to our majority voting policy will not participate in any meeting of our board of directors or the Nominating and Corporate Governance Committee at which the resignation is considered. Our majority voting policy will apply for uncontested director elections, which are elections where (a) the number of nominees for election as director is the same as the number of directors to be elected, as determined by the board of directors, and (b) no proxy materials are circulated in support of one or more nominees who are not part of the director nominees supported by the board of directors.
Director Term Limits and Other Mechanisms of Board Renewal
Our board of directors has not adopted director term limits, a retirement policy for its directors or other automatic mechanisms of board renewal. Rather than adopting formal term limits, mandatory age-related retirement policies and other mechanisms of board renewal, the Nominating and Corporate Governance Committee of our board of directors will develop appropriate qualifications and criteria for our board as a whole and for individual directors. The Nominating and Corporate Governance Committee will also conduct a process for the assessment of our board of directors, each committee and individual director regarding his, her or its effectiveness and contribution, and will also report evaluation results to our board of directors on a regular basis. The Nominating and Corporate Governance Committee will develop a succession plan for the board of directors, including maintaining a list of qualified candidates for director positions.
154
Table of Contents
Director Independence
Under the NYSE listing rules, an independent director means a person who, in the opinion of our board of directors, has no material relationship with our Company.
Under NI 58-101, a director is considered to be independent if he or she is independent within the meaning of Section 1.4 of National Instrument 52-110—Audit Committees (“NI 52-110”). Pursuant to NI 52-110, an independent director is a director who is free from any direct or indirect material relationship with us which could, in the view of our board of directors, be reasonably expected to interfere with the exercise of a director’s independent judgment. Our board of directors has undertaken a review of the independence of the directors and considered whether any director has a material relationship with us that could compromise his or her ability to exercise independent judgment in carrying out his or her responsibilities. Based upon information requested from and provided by each director concerning such director’s background, employment and affiliations, including family relationships, our board of directors determined that six are “independent” as defined under the listing requirements of the NYSE and NI 58-101, NI 52-110 and the BCBCA. In making this determination, our board of directors considered the current and prior relationships that each director has with our Company and our principal shareholders and all other facts and circumstances our board of directors deemed relevant in determining their independence. The board will assess on a regular basis, and at least annually, the independence of directors and, based on the recommendations of the Nominating and Corporate Governance Committee, will make a determination as to which members are independent. Justine Cheng, Joanna Coles, Stephen Trevor, Timothy Thorpe and Nicholas Whitley are considered non-independent under NI 58-101, NI 52-110 and the BCBCA because of their relationship with Cornell in the case of Justine Cheng, Joanna Coles and Stephen Trevor, with Upper Invest and the Company in the case of Timothy Thorpe, and with the Company in the case of Nicholas Whitley.
Our Company will take steps to ensure that adequate structures and processes will be in place following the consummation of this offering to permit our board of directors to function independently of management, including for purposes of encouraging an objective process for nominating directors and determining executive compensation. It is contemplated that the independent members of our board of directors will consider, on the occasion of each meeting, whether an in camera meeting without the non-independent directors and members of management would be appropriate and that they will hold an in camera meeting without the non-independent directors and members of management where appropriate.
Members of our board of directors are also members of the boards of other public companies. See “—Executive Officers and Directors.” Our board of directors has not adopted a formal director interlock policy, but keeps informed of other directorships held by its members.
Mandate of the Board of Directors
Our board of directors is responsible for supervising the management of our business and affairs. This includes appointing our Chief Executive Officer, advising management on strategic issues, approving our business and other plans and monitoring our performance against those plans and against our operating and capital budgets. Our board will adopt a formal mandate for the board of directors. The responsibilities of our board of directors upon consummation of this offering will include:
| • | adopting a strategic planning process, approving the principal business objectives for the Company and approving major business decisions and strategic initiatives; |
| • | appointing the Chief Executive Officer of the Company and developing the corporate goals and objectives that the Chief Executive Officer is responsible for meeting, and reviewing the performance of the Chief Executive Officer against such goals and objectives, among others; |
| • | overseeing communications with shareholders, other stakeholders, analysts and the public, including the adoption of measures for receiving feedback from stakeholders; and |
155
Table of Contents
| • | monitoring the implementation of procedures, policies and initiatives relating to corporate governance, risk management, corporate social responsibility, health and safety, ethics and integrity. |
Position Descriptions
Our board of directors will adopt a written position description for the chair of the board of directors, which will set out the chair’s key responsibilities, including, among others, duties relating to setting board meeting agendas, chairing board and shareholder meetings and director development. Our board of directors will also adopt a written position for the lead director, who, if appointed, will be responsible for overseeing the discharge by the board of directors of its responsibilities, including that the board evaluates the performance of management objectively and that the board understands the boundaries between the responsibilities of our board of directors and management and functions independently of our management.
Our board of directors will adopt a written position description for each of our committee chairs which will set out each of the committee chair’s key responsibilities, including, among others, duties relating to setting committee meeting agendas, chairing committee meetings and working with the respective committee and management to ensure, to the greatest extent possible, the effective functioning of the committee.
Our board of directors will adopt a written position description for our Chief Executive Officer which will set out the key responsibilities of our Chief Executive Officer, including, among other duties in relation to providing overall leadership, ensuring the development of a strategic plan and recommending such plan to our board for consideration, ensuring the development of an annual corporate plan and budget that supports the strategic plan and recommending such plan to our board of directors for consideration, and supervising day-to-day management and communicating with shareholders and regulators.
Orientation and Continuing Education
Following the consummation of this offering, we will implement an orientation program for new directors under which each new director will meet separately with the chair of our board of directors, individual directors and members of the senior management team. New directors will be provided with comprehensive orientation and education as to our business, operations and corporate governance (including the role and responsibilities of the board of directors, each committee, and directors individually).
The chair of our board of directors will be responsible for overseeing director continuing education designed to maintain or enhance the skills and abilities of our directors and to ensure that their knowledge and understanding of our business remains current. The chair of each committee will be responsible for coordinating orientation and continuing director development programs relating to the committee’s mandate.
Term Limits and Mechanisms of Board Renewal
Our board of directors has not adopted term limits for our directors or other automatic mechanisms of board renewal. Our Nominating and Corporate Governance Committee will be responsible for reviewing the composition of our board of directors to ensure that it is composed of members containing the appropriate skills and expertise to advise us. Our Nominating and Corporate Governance Committee is expected to conduct a process for the assessment of our board of directors, each committee and each director regarding his, her or its effectiveness and performance, and to report evaluation results to our board of directors. See “Committees of the Board of Directors—Nominating and Corporate Governance Committee.”
Committees of the Board
Upon the consummation of this offering, our board of directors will have three standing committees: an Audit Committee, a Compensation Committee and a Nominating and Corporate Governance Committee. The following is a brief description of our committees.
156
Table of Contents
Audit Committee
Upon the completion of this offering, Jacques Bougie, Marie Josée Lamothe and Valarie Sheppard are expected to be the members of our Audit Committee. Ms. Sheppard will be the chair of our Audit Committee. The board of directors has determined that Ms. Sheppard qualifies as an “audit committee financial expert” as such term is defined under the rules of the SEC implementing Section 407 of the Sarbanes-Oxley Act of 2002 and is “independent” for purposes of Rule 10A-3 of the Exchange Act and under the listing standards of the NYSE. We believe that our Audit Committee complies with the applicable requirements of the NYSE. We will comply with NI 52-110 and intend to rely on the exemptions for U.S.-listed issuers thereunder. Our Audit Committee is directly responsible for, among other things:
| • | selecting and overseeing the work of the independent registered public accounting firm engaged for the purpose of preparing or issuing an audit report or performing other audit, review or attest services and reviewing and auditing our financial statements; |
| • | evaluating the independence of the independent registered public accounting firm; |
| • | discussing the scope and results of the audit with the independent registered public accounting firm and reviewing, with management and that firm, our interim and year-end operating results; |
| • | establishing procedures for employees to anonymously submit concerns about questionable accounting or audit matters; |
| • | considering the adequacy of our internal controls and internal audit function; and |
| • | approving or, as permitted, pre-approving all audit and non-audit services to be performed by the independent registered public accounting firm. |
Compensation Committee
Upon the completion of this offering, Kevin Chance, Pierre Pirard and Stephen Trevor are expected to be the members of our Compensation Committee. Mr. Trevor will be the chair of our Compensation Committee. The Compensation Committee will not be composed entirely of independent directors. The independent members of our Compensation Committee will consider, on the occasion of each meeting, whether an in camera meeting without the non-independent director would be appropriate and will hold such in camera meeting without the non-independent director where appropriate. Our Compensation Committee is responsible for, among other things:
| • | reviewing and approving, or recommending that our board of directors approve, the compensation of the executive officers employed by us; |
| • | reviewing and recommending to our board of directors the compensation of our directors; |
| • | administering our share-based and equity incentive plans; |
| • | reviewing and approving, or making recommendations to our board of directors with respect to, incentive compensation and equity plans; and |
| • | reviewing our overall compensation philosophy. |
Nominating and Corporate Governance Committee
Upon the completion of this offering, Justine Cheng, Steven Lin and Pierre Pirard are expected to be the members of our Nominating and Corporate Governance Committee. Ms. Cheng will be the chair of our Nominating and Corporate Governance Committee. The Nominating and Corporate Governance Committee will not be composed entirely of independent directors. The independent members of our Nominating and Corporate Governance Committee will consider, on the occasion of each meeting, whether an in camera meeting without the non-independent director would be appropriate and will hold such in camera meeting without the non-
157
Table of Contents
independent director where appropriate. Our Nominating and Corporate Governance Committee is responsible for, among other things:
| • | assisting our board of directors in identifying prospective director nominees and recommending nominees to the board of directors; |
| • | overseeing the evaluation of the board of directors and management; |
| • | reviewing developments in corporate governance practices and developing and recommending a set of corporate governance guidelines; |
| • | reviewing material related party transactions or those that require disclosure; and |
| • | recommending members for each committee of our board of directors. |
Compensation Committee Interlocks and Insider Participation
None of our executive officers have served as a member of a compensation committee (or if no committee performs that function, the board of directors) of any other entity that has an executive officer serving as a member of our board of directors.
Code of Business Conduct and Ethics Policy
We have adopted a code of business conduct and ethics policy that applies to all of our employees, officers and directors, including those officers responsible for financial reporting. These standards are designed to deter wrongdoing and to promote honest and ethical conduct. The full texts of our code of business conduct and ethics policy will be available on our website at www.kdc-one.com and our SEDAR profile at www.sedar.com. Any waiver of the code for directors or executive officers may be made only by our board of directors or a board committee to which the board has delegated that authority and will be promptly disclosed to our shareholders as required by applicable U.S. and Canadian securities laws and the corporate governance rules of the NYSE. Amendments to the code must be approved by our board of directors and will be promptly disclosed (other than technical, administrative or non-substantive changes). Any amendments to the code, or any waivers of its requirements for which disclosure is required, will be disclosed on our website.
Our Audit Committee is responsible for reviewing and evaluating our code of business conduct and ethics policy periodically and will recommend any necessary or appropriate changes thereto to our board of directors for consideration. The Audit Committee will also assist our board of directors with the monitoring of compliance with our code of business conduct, and will be responsible for considering any waivers of our code of business conduct (other than waivers applicable to our directors or executive officers, which shall be subject to review by our board of directors as a whole).
Insider Trading Policy
Upon the consummation of this offering, we intend to adopt an insider trading policy which will prohibit our executive officers, other employees and directors from: (i) trading in our securities while in possession of material undisclosed information about us; and (ii) entering into certain derivative-based transactions that involve, directly or indirectly, securities of the Company, during a restricted period.
Interest of Directors
A director who has a material interest in a matter before our board of directors or any committee on which he or she serves is required to disclose such interest as soon as the director becomes aware of it. In situations where a director has a material interest in a matter to be considered by our board of directors or any committee on which he or she serves, such director may be required to excuse himself or herself from the meeting while
158
Table of Contents
discussions and voting with respect to the matter are taking place. Directors will also be required to comply with the relevant provisions of the BCBCA regarding conflicts of interest. See “Description of Share Capital—Certain Important Provisions of our Articles and the BCBCA.”
Complaint Reporting and Whistleblower Policy
In order to foster a climate of openness and honesty in which any concern or complaint pertaining to a suspected violation of the law, our code of business conduct and ethics policy or any of our policies, or any unethical or questionable act or behavior, the board of directors will adopt a whistleblower policy that requires that our employees promptly report such violation or suspected violation. In order to ensure that violations or suspected violations can be reported without fear of retaliation, harassment or an adverse employment consequence, our whistleblower policy will contain procedures that are aimed to facilitate confidential, anonymous submissions by our employees.
Diversity
Our commitment to diversity and inclusiveness is a defining feature of our culture. We recognize the importance and benefit of having a board of directors and senior management composed of highly talented and experienced individuals having regard to the need to foster and promote diversity among board members and senior management with respect to attributes such as gender, ethnicity, cultural background and other factors.
We expect to adopt a formal policy for nomination of directors and the appointment of our senior management team that promotes our commitment to diversity.
Upon consummation of this offering, we expect that four of our directors will be women, representing approximately 36% of our board of directors. There are no women executive officers.
We believe that having a diverse board of directors can offer a breadth and depth of perspectives that enhance our performance. The Nominating and Corporate Governance Committee values diversity of abilities, experience, perspective, education, gender, background, race and national origin. Recommendations concerning director nominees are based on merit and past performance as well as expected contribution to the board’s performance and, accordingly, diversity is taken into consideration.
We anticipate that the composition of the board of directors will in the future be shaped by the selection criteria to be developed by our board of directors and Nominating and Corporate Governance Committee, ensuring that diversity considerations are taken into account in senior management, monitoring the level of women and minority groups representation on the board and in senior management positions, continuing to broaden recruiting efforts to attract and interview qualified female candidates, and committing to retention and training to ensure that our most talented employees are promoted from within our organization, all as part of our overall recruitment and selection process to fill board or senior management positions as the need arises and subject to the rights of our principal shareholders under agreements with the Company.
Indemnification of Officers and Directors
Our articles provide that we will indemnify our directors and officers to the fullest extent permitted by the BCBCA. We have established directors’ and officers’ liability insurance that insures such persons against the costs of defense, settlement or payment of a judgment under certain circumstances.
We have entered, or will enter, into indemnification agreements with each of our directors and executive officers. These agreements, among other things, require us to indemnify each director and executive officer to the fullest extent permitted by the BCBCA. See “Descriptions of Share Capital—Certain Important Provisions of Our Articles and the BCBCA—Limitation of Liability and Indemnification.”
159
Table of Contents
Penalties or Sanctions
To the knowledge of the Company, none of our directors, executive officers or any shareholder holding a sufficient number of securities to affect materially the control of us has been subject to any penalties or sanctions imposed by a court relating to securities legislation or by a securities regulatory authority or has entered into a settlement agreement with a securities regulatory authority or been subject to any other penalties or sanctions imposed by a court or regulatory body that would likely be considered important to a reasonable investor making an investment decision.
Corporate Cease Trade Orders and Bankruptcies
Other than as set out below, to the knowledge of the Company, no director or executive officer is, as at the date of this prospectus, or has been within the 10 years prior to the date of this prospectus: (a) a director, chief executive officer or chief financial officer of any company that was subject to an order that was issued while the director or executive officer was acting in the capacity as director, chief executive officer or chief financial officer; (b) was subject to an order that was issued after the director or executive officer ceased to be a director, chief executive officer or chief financial officer and which resulted from an event that occurred while that person was acting in the capacity as director, chief executive officer or chief financial officer; or (c) a director or executive officer of any company that, while that person was acting in that capacity, or within a year of that person ceasing to act in that capacity, became bankrupt, made a proposal under any legislation relating to bankruptcy or insolvency or was subject to or instituted any proceedings, arrangement or compromise with creditors or had a receiver, receiver manager or trustee appointed to hold its assets. For the purposes of this paragraph, “order” means a cease trade order, an order similar to a cease trade order or an order that denied the relevant company access to any exemption under securities legislation, in each case, that was in effect for a period of more than 30 consecutive days. Mrs. Lamothe was a member of the board of directors of Reitmans (Canada) Limited, a Canadian retailer, from April 2015 to August 2019. On May 19, 2020, Reitmans (Canada) Limited filed for protection from creditors under the Companies’ Creditors Arrangement Act (Canada). Mrs. Lamothe was also a member of the board of directors of The Aldo Group Inc., a privately-held company, which sought protection from creditors under the Companies’ Creditors Arrangement Act (Canada) on May 7, 2020.
160
Table of Contents
EXECUTIVE AND DIRECTOR COMPENSATION
Compensation Discussion and Analysis
The purpose of this compensation discussion and analysis is to provide information regarding the material elements of compensation that were paid, awarded to, or earned by, our named executive officers for the fiscal year ended April 30, 2021 (referred to as our “named executive officers”) listed below:
| • | Nicholas Whitley, President and Chief Executive Officer; |
| • | Gregg Kam, Chief Financial Officer; |
| • | Wayne Swanton, President, Beauty and Personal Care; |
| • | Roberto Schianchi, President, Home Care; and |
| • | Ian Kalinosky, President, Specialty Retail. |
Principal Objectives of Our Compensation Program for Named Executive Officers
Our executive team is critical to our success and to building value for our shareholders. The principal objectives of our executive compensation program are to:
| • | attract, retain and motivate high-caliber executive officers who will develop, lead and advance our strategic business needs and create and maintain long-term shareholder value; |
| • | align the interests of executive officers with those of our shareholders; and |
| • | appropriately compensate executive officers in a manner that incentivizes them to create long-term shareholder value and to manage our business to meet short- and long-term goals. |
Compensation Setting Process
Our Chief Executive Officer works closely with our Compensation Committee to make recommendations regarding the compensation of our named executive officers (other than himself and Mr. Schianchi (as discussed below)). Our Compensation Committee is responsible for overseeing our executive compensation policies and compensation plans and programs. In consultation with our Chief Executive Officer, our Compensation Committee reviews our achievements as a company and those of our executive officers, as well as market practice, competitiveness and retention considerations, when determining the specific type and level of compensation of our named executive officers.
We believe the levels of compensation we provide should be competitive, reasonable and appropriate to attract, retain and motivate talent to meet our business needs. Compensation was determined with the application of subjective discretion rather than by applying a specific formula or matrix to set total compensation in relation to compensation paid by other companies. Our approach has been to consider competitive compensation practices and other factors, such as how much compensation was necessary to recruit, retain and motivate an executive officer, as well as individual performance. We expect that the specific direction, emphasis and components of our executive compensation program will continue to evolve. For example, over time, we may reduce our reliance upon subjective determinations in favor of a more empirically based approach that could involve, among other practices, benchmarking the compensation paid to our named executive officers against peer companies.
In addition, we retained a compensation consultant, Willis Towers Watson, to assess the compensation of our executive officers prior to this offering. Willis Towers Watson provided market data to assist with our Compensation Committee’s review of overall compensation. Following the completion of this offering, Willis Towers Watson will help us further consider and analyze the competitive market for corresponding positions within comparable geographic areas and companies of similar size, industry and scope of operations.
161
Table of Contents
For the named executive officers (other than our Chief Executive Officer and Mr. Schianchi (as discussed below)), our Chief Executive Officer considers such named executive officer’s responsibilities, performance and prior experience. Our Chief Executive Officer then consults with the Compensation Committee regarding his recommendations for base salary increases, annual bonus target amounts, and equity award amounts, and works with the Compensation Committee regarding the compensation program’s ability to attract, retain and motivate executive talent. These recommendations reflect compensation levels that our Chief Executive Officer believes are commensurate with such named executive officer’s individual qualifications, experience, responsibility level, functional role, knowledge, skills, individual performance and geographic location as well as our Company’s performance and competitive offerings. The Compensation Committee then recommends the compensation of our named executive officers to be approved by our board of directors.
In determining our Chief Executive Officer’s compensation, the Compensation Committee takes into consideration our overall company performance, our Chief Executive Officer’s contribution to that performance, market data gathered by Willis Towers Watson and the desire to retain and motivate the Chief Executive Officer.
Mr. Schianchi joined our executive team following the acquisition of Zobele in the fiscal year ended April 30, 2020. Mr. Schianchi’s compensation was previously determined in accordance with Zobele’s process for determining executive officer compensation and remained governed by such terms during the Zobele fiscal year ended December 30, 2020 and until the end of the fiscal year ended April 30, 2021. Going forward, Mr. Schianchi’s compensation will be set in accordance with the same process for setting compensation we use for our other executive officers (other than our Chief Executive Officer) and described above, which is expected to include an annual bonus award for the fiscal year commencing May 1, 2021.
Following completion of this offering, the Compensation Committee will administer our executive compensation program in accordance with its charter, including making recommendations to our Board of Directors for approval of various matters.
Role of Compensation Consultant
The Company retained Willis Towers Watson in June 2020 to provide guidance and advice on our executive officer compensation, as well as going forward, on compensation-related matters, including potential changes to our executive compensation structure following completion of this offering and establishment of a compensation peer group. In connection with the retention of Willis Towers Watson, our board of directors will conduct a full assessment of any potential conflicts of interest of Willis Towers Watson. As of this filing, no conflicts of interest relating to Willis Towers Watson’s services have been identified.
Elements of Compensation
The following is a discussion of the primary elements of the compensation for each of our named executive officers.
Annual Base Salary
We believe that providing each of our named executive officers a competitive annual base salary is an important component of compensation. A competitive annual base salary provides a degree of financial stability to our named executive officers that enhances their performance on behalf of our shareholders and is critical to recruiting and retaining our named executive officers. We do not have formal written policies or guidelines for setting or adjusting the annual base salary of our named executive officers but instead make a subjective determination based on certain factors. Specifically, we will consider the executive’s experience, responsibilities, performance, unique leadership skills and internal equity, as well as any changes in the competitive market environment.
162
Table of Contents
Base salaries of our named executive officers are reviewed annually by the Compensation Committee and our Chief Executive Officer, and adjustments are made as deemed appropriate. The table below sets forth the current annual base salary of our named executive officers.
| Named Executive Officer |
Annual Base Salary | |||
| Nicholas Whitley |
$ | 950,000 | ||
| Gregg Kam |
$ | 500,000 | ||
| Wayne Swanton |
$ | 550,000 | ||
| Roberto Schianchi |
€ | 580,000 | ||
| Ian Kalinosky |
$ | 400,000 | ||
For the fiscal year ended April 30, 2021, we generally froze base salaries in response to the COVID-19 pandemic, however, in connection with our Compensation Committee’s review of peer company compensation and the individual performance of our named executive officers, the Compensation Committee increased the base salaries of Nicholas Whitley from $650,000 to $950,000, effective as of October 14, 2020 and Ian Kalinosky from $360,000 to $400,000, effective as of April 1, 2021. In addition, the Compensation Committee also increased Gregg Kam’s base salary from $420,000 to $500,000 as of May 1, 2021.
Annual Cash Incentive Program
kdc/one Annual Incentive Bonus Plan
For the fiscal year ended April 30, 2021, our named executive officers (except for Mr. Schianchi, who participated in the Zobele Bonus Plan (described below)) participated in the Knowlton Development Corporation Annual Incentive Bonus Plan (the “Annual Incentive Bonus Plan”). Under the Annual Incentive Bonus Plan, bonus payments are based on each named executive officer’s bonus target and the Company’s achievement of performance metrics. Targets are set at the beginning of the year following the approval of the Company’s budget. For the fiscal year ended April 30, 2021, the bonus targets for our named executive officers, as a percentage of base salary, were as follows:
| Named Executive Officer |
Annual Incentive Bonus Plan Target (% of Base Salary) |
|||
| Nicholas Whitley |
125 | % | ||
| Gregg Kam |
60 | % | ||
| Wayne Swanton |
60 | % | ||
| Ian Kalinosky |
50 | % | ||
During the fiscal year ended April 30, 2021, we increased Mr. Kalinosky’s bonus target from 35% of base salary to 50% of base salary in connection with our Compensation Committee’s review of peer company compensation and the individual performance of our named executive officers.
For the fiscal year ended April 30, 2021, whether participants in the Annual Incentive Bonus Plan are eligible to receive bonus payments is determined based on the Company’s achievement of Adjusted EBITDA (which is prepared in accordance with IFRS and differs from the calculation of Adjusted EBITDA described in the Prospectus Summary. See “Prospectus Summary—Summary Consolidated Financial and Other Data”). The amount then payable is based on:
| • | the Company’s Adjusted EBITDA with respect to 70% of the participants bonus target (the “Adjusted EBITDA Bonus Component”), and |
| • | the participants’ individual performance, or, as applicable, the performance of the participants’ business segment, with respect to the remaining 30% of the bonus target (the “Personal Bonus Component”). |
163
Table of Contents
Participants are not eligible to receive bonus payment if the Minimum Adjusted EBITDA target (as defined below) is not achieved. For the fiscal year ended April 30, 2021, the Adjusted EBITDA target for purposes of the determination of the Adjusted EBITDA Bonus Component was $244.5 million (the “Target Adjusted EBITDA”). Depending on the level of attainment of the Target Adjusted EBITDA, the Adjusted EBITDA Bonus Component is multiplied by a bonus factor as follows:
| Company Achievement |
Bonus Factor | |||
| Below 90% of Target Adjusted EBITDA |
0.00 | |||
| 90% of Target Adjusted EBITDA (“Minimum”) |
0.70 | |||
| 100% of Target Adjusted EBITDA (“Target”) |
1.00 | |||
| 120% of Target Adjusted EBITDA (“Maximum”) |
2.00 | |||
With an incremental 0.03 for each percentage achieved between Minimum and Target and an incremental 0.05 for each percentage achieved between Target and Maximum.
The Personal Bonus Component is determined by the Chief Executive Officer and the Compensation Committee.
For the fiscal year ended April 30, 2021, the actual Adjusted EBITDA Bonus Component was 101% of the Target Adjusted EBITDA.
Due to the positive financial performance exceeding the Target Adjusted EBITDA and significant efforts and contributions of the named executive officers, the Chief Executive Officer (for each of the named executive officers other than himself) and the Compensation Committee determined individual performance to be 105% of target.
As a result, the Compensation Committee approved the following bonuses: $1,246,875 for Mr. Whitley, $264,600 for Mr. Kam, $331,840 for Mr. Swanton, which was pro rated based on his hire date of May 18, 2020, and $210,000 for Mr. Kalinosky.
Zobele Bonus Plan
Mr. Schianchi currently participates in the GLT Incentive Plan for Zobele employees (the “Zobele Bonus Plan”). Under the terms of the Zobele Bonus Plan, for the Zobele fiscal year ended December 31, 2020, Mr. Schianchi was eligible for a bonus payment based on a bonus target equal to 50% of his base salary and Zobele’s achievement of EBITDA and cash flow, weighted 60% and 40%, respectively. For the year-ended December 31, 2020, the EBITDA and cash flow targets, actual performance and percentage of target bonus earned were as follows:
| Performance Metric |
Target | Actual | Percentage of Target Bonus Earned |
|||||||||
| Zobele EBITDA |
$ | 85.8M | $ | 94.8M | 90.0 | % | ||||||
| Zobele Cash Flow |
$ | 34.5M | $ | 33.8M | 32.4 | % | ||||||
|
|
|
|||||||||||
| Total |
122.4 | % | ||||||||||
As a result of this performance, Mr. Schianchi received an annual bonus in the amount of €354,960 ($428,851 as converted to U.S. dollars based on a conversion rate as of April 30, 2021 of $0.8277 to €1, which is the same rate used for our financial reporting purposes for the year ended April 30, 2021). For the fiscal year commencing May 1, 2021, Mr. Schianchi will participate in the kdc/one Annual Incentive Bonus Plan.
Distribution Financing Transactions
During the fiscal year ended April 30, 2021, we effected a distribution to our shareholders by way of returns of capital through the Distribution Financing Transactions. See “Management’s Discussion and Analysis of
164
Table of Contents
Financial Condition and Results of Operations—Liquidity and Capital Resources—Distribution Financing Transactions.” Optionholders, including our named executive officers, were not entitled to, and did not participate, in such Distribution Financing Transactions with respect to their stock options. However, as a result of the Distribution Financing Transactions, we made certain adjustments in accordance with the equitable adjustment provision of the Stock Option Plan composed of a reduction of the exercise price of options, including the stock options of our named executive officers and a cash payment to the Optionholders to account for the reduction in value of the underlying shares. The cash payment to our named executive officers is set forth in the table below. The cash payment was paid in March 2021.
| Named Executive Officer |
Cash Payment | |||
| Nicholas Whitley |
$ | 864,106 | ||
| Gregg Kam |
$ | 217,805 | ||
| Wayne Swanton |
$ | 174,244 | ||
| Roberto Schianchi |
$ | 174,244 | ||
| Ian Kalinosky |
$ | 217,805 | ||
In addition, Messrs. Whitley and Kam received a special bonus in the amount of $800,000 and $600,000, respectively, for their work on structuring and executing the Distribution Financing Transactions.
Long-Term Equity Compensation
We have granted equity awards in the form of stock options to our named executive officers under the Stock Option Plan. Each of our named executive officers has received award(s) of stock options. When determining an award of stock options, we consider the executive’s experience, responsibilities and leadership skills as well as the retentive effect of the stock option award. Because the Company has been controlled by a private equity sponsor, option awards under the Stock Option Plan have generally been issued up front – at the closing of the Acquisition, and at the time of hire or promotion of our named executive officers. In addition, we have from time to time granted refresh equity grants to our named executive officers. However, we have not historically granted equity awards on a scheduled or regular basis. The following amounts represent the number of shares underlying each of the stock option awards granted to our named executive officers during the year ended April 30, 2021:
| Named Executive Officer |
Grant Date | Number of Shares Underlying Options |
Exercise Price Per Share(1) | |||||||
| Nicholas Whitley |
November 11, 2020 | 5,000 | $ | 1,406.60 | ||||||
| Gregg Kam |
— | — | — | |||||||
| Wayne Swanton |
July 13, 2020 | 4,929 | $ | 1,056.60 | ||||||
| Roberto Schianchi |
July 13, 2020 | 4,929 | $ | 1,056.60 | ||||||
| Ian Kalinosky |
— | — | — | |||||||
| (1) | Reflects a reduction of $193.40 per share in exercise price of the outstanding stock options under the Stock Option Plan in connection with the Distribution Financing Transactions. |
165
Table of Contents
Our stock options provide long-term incentives to our named executive officers while aligning their interests with our shareholders. Stock options have been granted in the form of nonqualified stock options. Consistent with market practice for private equity-owned companies, our stock options were granted as one-third time-vesting options and two-thirds performance-vesting options. The time-vesting portion of the stock options were scheduled to vest in equal, annual installments over a five-year period from the vesting commencement date. If there had been a change in control before the consummation of this offering, the performance-vesting portion of the options would have vested based on the multiple of invested capital (the “MOIC”) achieved by Cornell and certain other financial investors (solely for the purposes of this section, the “Sponsors”) in connection with the change in control. Assuming that a change in control does not occur before the consummation of this offering, the performance-vesting portion of the options would have vested as follows, subject to the participant’s continued employment through the applicable vesting date:
| • | 25% of the performance-vesting options will automatically convert into special time-vesting options which will vest in equal installments of 12.5% on each of the first and second anniversaries of this offering, or upon an earlier change in control of the Company, if any; |
| • | 18.75% of the performance-vesting options will vest on the date or dates upon which the Sponsors achieve a MOIC equal to at least 1.5X; |
| • | 18.75% of the performance-vesting options will vest on the date or dates upon which the Sponsors achieve a MOIC equal to at least 2X; |
| • | 18.75% of the performance-vesting options will vest on the date or dates upon which the Sponsors achieve a MOIC equal to at least 2.5X; and |
| • | 18.75% of the performance-vesting options will vest on the date or dates upon which the Sponsors achieve a MOIC equal to at least 3X. |
In addition, no portion of the performance-vesting options would have vested unless the Sponsors achieved an internal rate of return of at least eight percent (8%).
The MOIC and internal rate of return thresholds described above were generally based on actual proceeds of cash or marketable securities (excluding our shares following commencement of this offering) to the Sponsors upon sales of their equity interests in the Company, plus any cash dividends paid to Sponsors, divided by the Sponsors’ amounts invested in the Company; however, on the first date following the commencement of this offering on which the Sponsors held 20% or less of our common shares that they held immediately prior to the consummation of this offering (the “Final Performance Measurement Date”), the proceeds would have also included the value of our common shares that the Sponsors continued to hold based upon the volume weighted average share price of our shares over the immediately preceding 60 trading days.
Any performance-vesting options that did not vest as of the Final Performance Measurement Date would have been forfeited.
In May 2021, the Board of Directors approved an amendment to the performance-vesting options, effective upon the completion of this offering, to remove the performance metrics and provide that such options will be time-vesting options that vest ratably over a five-year period from the vesting commencement date.
On termination of service, any unvested options will be cancelled and forfeited without consideration; provided that in the event of a termination of a named executive officer by us without cause or by the named executive officer for good reason (each as defined in the named executive officer’s employment agreement), a pro rata portion of the time-vesting options otherwise scheduled to vest on the next annual vesting date (if any) will immediately vest. Upon a termination by us for cause, the vested portion of the option will also be cancelled and forfeited on the termination date.
The vesting features of our stock options support our retention goals by providing an incentive to our named executive officers to remain in our employ and grow the value of the company during both the time-vesting and
166
Table of Contents
performance-vesting period. Following completion of this offering, we anticipate that we will continue to use equity awards as an integral part of our executive compensation program; however, we expect to restructure our long-term equity compensation program to be a more traditional public company program, including with the Omnibus Plan described below, with more regular grants and market standard vesting terms.
In connection with the grant of options, each of our named executive officers has agreed to certain restrictive covenants that provide that during the employment period and for the 12-month period following a termination of employment, the named executive officer will not, directly or indirectly, solicit our employees or customers. In addition, the restrictive covenants also prevent each named executive officer from directly or indirectly competing with the Company during the employment period and for the 12-month period following a termination of employment. The restrictive covenant agreements contain a perpetual non-disclosure covenant.
IPO Equity Awards
In connection with this offering, our Compensation Committee approved a grant of long-term equity incentive awards to our named executive officers with a grant date value set forth in the table below. The awards will be 50% stock options and 50% restricted share units under the Omnibus Plan, and will be issued on the date the registration statement of which this prospectus forms a part is declared effective based on the issue price of our common shares in this offering and conditional upon closing of this offering.
| Named Executive Officer |
Grant Date Value | |||
| Nicholas Whitley |
$ | 3,800,000 | ||
| Gregg Kam |
$ | 650,000 | ||
| Wayne Swanton |
$ | 520,000 | ||
| Roberto Schianchi |
$ | 520,000 | ||
| Ian Kalinosky |
$ | 520,000 | ||
Allocation Among Forms of Compensation
Historically, we have not adopted any policies with respect to current compensation versus long-term compensation, with respect to cash versus non-cash compensation, or among different forms of non-cash compensation. We consider all elements as necessary for achieving our compensation objectives. Our practices as a public company following completion of this offering may vary over time.
Employment Arrangements with Named Executive Officers
Each of our named executive officers received an employment agreement or offer letter from the Company. Key elements of these agreements are outlined below.
CEO Employment Agreement
Under the terms of his employment agreement, dated January 22, 2019 and amended as of October 14, 2020, Mr. Whitley is entitled to receive an annual base salary of $950,000 and is eligible to receive a target cash bonus payment equal to 125% of his base salary upon achievement of performance conditions. The employment agreement also provides that, if Mr. Whitley’s employment is terminated by the Company without cause (other than due to death or disability) or by Mr. Whitley for good reason (each, as defined in the employment agreement) subject to his signing a release, Mr. Whitley is entitled to (i) continued payment of his base salary during the 18-month period following termination, (ii) a pro-rated annual bonus for the then-current fiscal year based on actual performance; (iii) continuation of health insurance benefits at the rate for all active employees for a period of 18 months following termination; and (iv) an amount equal to the annual bonus at target paid in equal monthly installments over a period of 18 months following the date of termination. If Mr. Whitley’s employment is terminated by reason of death or disability, he (or his heirs) will be entitled to receive a pro-rated annual bonus.
167
Table of Contents
Mr. Whitley is also subject to restrictive covenants, including perpetual confidentiality and non-disparagement covenants and 18-month post-termination restrictions on competition and solicitation of employees and service providers and customers, prospective customers and suppliers.
CFO Employment Agreement
Under the terms of his employment agreement, dated June 10, 2019, Mr. Kam is entitled to receive an annual base salary of $500,000 and is eligible to receive a target cash bonus payment equal to 60% of his base salary upon achievement of the performance conditions. The employment agreement also provides that, if Mr. Kam’s employment is terminated by the Company without cause (other than due to death or disability) or by Mr. Kam for good reason (each, as defined in the employment agreement) subject to his signing a release, Mr. Kam is entitled to (i) continued payment of his base salary during the 12-month period following termination, (ii) in the case of any termination, any unpaid annual bonus earned in respect of the fiscal year prior to the fiscal year in which termination of employment occurs; and (iii) continuation of health insurance benefits at the rate for all active employees for a period of 12 months following termination. If Mr. Kam’s employment is terminated by reason of death or disability, he (or his heirs) will be entitled to receive a pro-rated annual bonus. Mr. Kam is also subject to restrictive covenants, including perpetual confidentiality and non-disparagement covenants and 12-month post-termination restrictions on competition and 24-month post-termination restrictions on solicitation of employees and service providers and customers, prospective customers and suppliers.
Swanton Employment Agreement
Under the terms of his employment agreement, dated May 18, 2020, Mr. Swanton is entitled to receive an annual base salary of $550,000 and is eligible to receive a target cash bonus payment equal to 60% of his base salary upon achievement of the performance conditions. The employment agreement also provides that, if Mr. Swanton’s employment is terminated by the Company without cause (other than due to death or disability) or by Mr. Swanton for good reason (each, as defined in the employment agreement) subject to his signing a release, Mr. Swanton is entitled to (i) continued payment of his base salary during the 12-month period following termination, (ii) in the case of any termination, any unpaid annual bonus earned in respect of the fiscal year prior to the fiscal year in which termination of employment occurs; and (iii) continuation of health insurance benefits at the rate for all active employees for a period of 12 months following termination. If Mr. Swanton’s employment is terminated by reason of death or disability, he (or his heirs) will be entitled to receive a pro-rated annual bonus. Mr. Swanton is also subject to restrictive covenants, including perpetual confidentiality and non-disparagement covenants and 12-month post-termination restrictions on competition and 24-month post-termination restrictions on solicitation of employees and service providers and customers, prospective customers and suppliers.
Schianchi Offer Letter
Mr. Schianchi entered into an offer letter with Zobele, pursuant to which Mr. Schianchi is entitled to receive an annual salary of €580,000 and is eligible to receive a target cash bonus payment equal to 50% of his base salary. In the event of Mr. Schianchi’s termination without cause, a change in control or ownership of Zobele and Mr. Schianchi’s subsequent resignation, or his change of position, Mr. Schianchi is entitled to a payment equal to 150% of his annual salary, the average of the annual bonus paid to Mr. Schianchi over the 36-month period prior to termination and the monthly cash value of any benefit in kind granted to Mr. Schianchi, payable in equal monthly installments following dismissal. Mr. Schianchi is also subject to perpetual confidentiality covenants and 12-month post-termination restrictions on competition. In the event of a breach of the confidentiality clause, Mr. Schianchi must pay a penalty to us equal to 75% of his annual salary.
Kalinosky Employment Agreement
Under the terms of his employment agreement, dated April 1, 2021, Mr. Kalinosky is entitled to receive an annual base salary of $400,000 and is eligible to receive a target cash bonus payment, equal to 50% of his base
168
Table of Contents
salary upon achievement of certain performance conditions. The employment agreement also provides that, if Mr. Kalinosky’s employment is terminated by the Company without cause (other than due to death or disability) or by Mr. Swanton for good reason (each, as defined in the employment agreement) subject to his signing a release, Mr. Kalinosky is entitled to (i) continued payment of his base salary during the 12-month period following termination, (ii) continuation of health insurance benefits at the rate for all active employees for a period of 12 months following termination; and (iii) in the case of any termination, any unpaid annual bonus earned in respect of the fiscal year prior to the fiscal year in which termination of employment occurs. If Mr. Kalinosky’s employment is terminated by reason of death or disability, he (or his heirs) will be entitled to receive a pro-rated annual bonus. Mr. Kalinosky is also subject to restrictive covenants, including perpetual confidentiality and non-disparagement covenants and 12-month post-termination restrictions on competition and 24-month post-termination restrictions on solicitation of employees and service providers and customers, prospective customers and suppliers.
Other Benefits
Retirement Plans
We maintain a qualified defined contribution 401(k) plan for all of our employees that are eligible to participate, including Messrs. Whitley, Kam, Swanton and Kalinosky who participate in this plan on the same basis as our employees generally. Under the plan, employees may elect to defer eligible pay up to the annual maximum allowed under the Internal Revenue Code of 1986, as amended (the “Code”). The Company makes a matching contribution equal to 75% of up to 4% of compensation contributed by a participating employee.
Mr. Schianchi participates in a contributory pension scheme. The Company makes an annual special contribution of €41,378, inclusive of taxes paid on his behalf, to his contributory pension scheme.
Health, Welfare and Other Benefit Plans
Our named executive officers are entitled to the same health and welfare benefits as our employees generally. For Messrs. Whitley, Kam, Swanton and Kalinosky, this includes, as applicable, medical, dental and vision insurance, as well as flex and health savings accounts, life insurance (paid by the Company for Mr. Whitley), short-term disability insurance (fully paid by the Company), long-term disability insurance, accident insurance and critical illness insurance. Mr. Schianchi participates in the benefit plans provided to our employees in Italy, including full health insurance and yearly medical exams and life and accident insurance.
Messrs. Whitley, Kam, Swanton and Kalinosky are also entitled to a monthly car allowance in the amount of $1,600 to Mr. Whitley, $1,000 to Mr. Kam, $1,000 to Mr. Swanton and $1,300 to Mr. Kalinosky. In accordance with his employment agreement, Mr. Schianchi receives a company-provided car.
In connection with his relocation from Canada to the United States, Mr. Whitley is also entitled to receive tax planning and immigration assistance.
Our named executive officers did not receive other perquisites during the fiscal year ended April 30, 2021.
Share Ownership Guidelines
Our board of directors approved Share Ownership Guidelines to become effective in connection with this offering. The Share Ownership Guidelines apply to employees of our Company, including the named executive officers, with the title of senior vice president or above (or as otherwise designated by our board of directors) and the non-employee members of our board of directors. Applicable employees and directors are expected to attain a level of share ownership with a value equal to the applicable multiple set forth in the table below multiplied by the employee’s annual base salary or the non-employee director’s annual cash retainer fee. Shares and other
169
Table of Contents
equity awards (except for (i) options whose exercise price exceeds the fair market value of the Company’s common shares on the determination date and (ii) other equity awards that are subject to performance conditions that have not yet been satisfied) will count toward the ownership guidelines.
| Position |
Multiple of Annual Base Salary/Annual Retainer |
|||
| Chief Executive Officer |
5x | |||
| Chief Financial Officer |
3x | |||
| Division Presidents |
2.5x | |||
| Direct Reports to the Chief Executive Officer |
1x | |||
| Senior Vice Presidents |
0.5x | |||
| Non-Employee Directors |
5x | |||
Employees and directors subject to the Share Ownership Guidelines are expected to achieve the applicable level of ownership by the fifth anniversary of the effective date of the guidelines, or within five years of becoming subject to the share ownership guidelines. Until each employee or non-employee director has satisfied the minimum ownership requirements set forth in the table above, such employee or director is required to retain 50% of the shares that remain outstanding after the withholding of taxes and payment of the exercise price of stock options, as applicable, resulting from the exercise of all or any portion of their stock options.
Clawback Policy
Our board of directors approved a Clawback Policy to become effective in connection with this offering. The Clawback Policy applies to all executive officers, including the named executive officers, and any other person our Compensation Committee designates from time to time. Pursuant to the terms of the policy, we may clawback incentive compensation (i) in the event of a financial restatement in which the amount, payment and/or vesting of such incentive compensation was calculated by financial measures covered by such restatement or (ii) due to detrimental conduct by the executive officer that is likely to cause or has caused material financial, operational or reputational harm to our Company.
Compensation Risk Assessment
In connection with the completion of this offering, our Compensation Committee will perform a review of compensation policies and practices for all of our employees to determine that our compensation policies and practices are not reasonably likely to have a material adverse effect on us.
Accounting and Tax Considerations
Section 280G of the Code provides that executive officers, certain shareholders and certain other service providers could be subject to significant additional taxes if they receive payments or benefits in connection with a change in control of our Company that exceed certain limits. Section 409A of the Code also imposes additional significant taxes on the individual for deferred compensation that does not meet the requirements of Section 409A. We have not provided any named executive officer with a gross-up or other reimbursement for tax amounts the executive officer might pay pursuant to Section 280G or Section 409A of the Code.
In addition, under Section 162(m) of the Code, as a public company, we will be disallowed a tax deduction for compensation to our named executive officers, and any individual who has in the past been a named executive officer, exceeding $1,000,000 in any year. When approving the amount and form of compensation for our named executive officers in the future, our Compensation Committee will consider all elements of the cost to our Company of providing such compensation, including the potential impact of Section 162(m). However, the Board of Directors or our Compensation Committee, as applicable, may, in its judgment, authorize compensation payments that do not comply with the exemptions in Section 162(m) when it believes that such payments are
170
Table of Contents
appropriate to attract and retain executive talent. Many other Code provisions, SEC regulations and other applicable securities laws and accounting rules affect the payment of executive compensation and are generally taken into consideration as programs are developed. Our goal is to create and maintain plans that are efficient, effective and in full compliance with these requirements.
Any equity awards that may be granted to our employees, including our executive officers, pursuant to the long-term incentive plan we intend to adopt in connection with the offering will be reflected in our consolidated financial statements, based upon the applicable accounting guidance, at fair value on the grant date in accordance with FASB Accounting Standards Codification, Topic 718, “Compensation–Stock Compensation.”
Fiscal Year 2021 Summary Compensation Table
The following table sets forth information regarding the compensation awarded to, earned by or paid to each of our named executive officers during fiscal year ended April 30, 2021.
| Name and principal position |
Fiscal year |
Salary ($)(1) |
Bonus ($)(2) | Option Awards ($)(3) |
Non-equity incentive plan compensation ($)(4) |
All other compensation ($)(5) |
Total ($) |
|||||||||||||||||||||
| Nicholas Whitley President and Chief Executive Officer |
2021 | 784,500 | 1,664,106 | 1,556,667 | 1,246,875 | 38,793 | 5,290,941 | |||||||||||||||||||||
| Gregg Kam Chief Financial Officer |
2021 | 400,292 | 817,805 | — | 264,600 | 27,818 | 1,510,515 | |||||||||||||||||||||
| Wayne Swanton President, Beauty and Personal Care |
2021 | 505,577 | 174,244 | 1,309,471 | 331,840 | 15,346 | 2,336,478 | |||||||||||||||||||||
| Roberto Schianchi President, Home Care(6) |
2021 | 700,737 | 174,244 | 1,309,471 | 428,851 | 53,902 | 2,667,205 | |||||||||||||||||||||
| Ian Kalinosky President, Specialty Retail |
2021 | 354,188 | 217,805 | — | 210,000 | 23,168 | 805,161 | |||||||||||||||||||||
| (1) | The amounts in the “Salary” column represent the base salary earned by each named executive officer. Such amounts include a 20% reduction in the named executive officer’s salaries as a part of measures taken in response to the COVID-19 pandemic. Base salaries have since been restored. |
| (2) | The amounts in the “Bonus” column represent a cash payment made to option holders in accordance with the equitable adjustment provision of the Stock Option Plan as a result of the Distribution Financing Transactions. For Messrs. Whitley and Kam, such amounts also include a bonus payment in the amounts of $800,000 and $600,000, respectively, granted following the completion of the Distribution Financing Transactions. |
| (3) | Represents the aggregate grant date fair value of stock option awards calculated in accordance with FASB ASC Topic 718. In addition, these amounts include the incremental fair value (calculated in accordance with FASB ASC Topic 718) of a modification that we made to outstanding stock options to reduce their exercise prices in accordance with the equitable adjustment provision of the Stock Option Plan as a result of the Distribution Financing Transactions. The assumptions we used in valuing stock option awards are described in Note 15, Employee Benefits, to our audited consolidated financial statements included elsewhere in this prospectus. |
| (4) | The amounts in the “Non-Equity Incentive Plan Compensation” column represent the annual incentive bonus amounts earned by each named executive officer, other than Mr. Schianchi, pursuant to the kdc/one Annual Incentive Bonus Plan for the fiscal year ended April 30, 2021 and for Mr. Schianchi, the Zobele Bonus Plan for the calendar year ended December 31, 2020 will be included upon their determination by the Company. |
| (5) | Reflects the following: |
| (i) | Company matching allocations in the amounts of $11,471 to Mr. Whitley, $15,818 to Mr. Kam, $3,808 to Mr. Swanton and $7,568 to Mr. Kalinosky. |
| (ii) | Company contributions to a national public pension, in the amount of $49,992, inclusive of taxes paid on behalf of Mr. Schianchi. |
| (iii) | Car allowance in the amounts of $19,200 to Mr. Whitley, $12,000 to Mr. Kam, $11,539 to Mr. Swanton, $3,911 to Mr. Schianchi and $15,600 to Mr. Kalinosky. |
171
Table of Contents
| (iv) | For Mr. Whitley, life insurance premium payments in the amount of $8,122. This amount was paid in Canadian dollars and converted to U.S. dollars based on a conversion rate as of April 30, 2021 of $0.81354 to CAD $1, which is the same rate used for our financial reporting purposes for the year ended April 30, 2021. |
| (6) | All amounts set forth in this table and the footnotes above for Mr. Schianchi was paid in euros and converted to U.S. dollars based on a conversion rate as of April 30, 2021 of $0.8277 to €1, which was the same rate used for our financial reporting purposes for the year ended April 30, 2021. Mr. Schianchi’s base salary rate as of April 30, 2021 was €580,000. |
Fiscal Year 2021 Grants of Plan-Based Awards
The following table sets forth information regarding plan-based awards made to each of our named executive officers during the fiscal year ended April 30, 2021.
| Estimated future payouts under non-equity incentive plan awards(1) |
Estimated future payouts under equity incentive plan awards(2) |
|||||||||||||||||||||||||||||||
| Name |
Grant date |
Approval date |
Threshold ($) | Target ($) | Maximum ($) | Option awards: Number of shares underlying options (#) |
Exercise price of option awards ($/sh) |
Grant date fair value of option awards ($) |
||||||||||||||||||||||||
| Nicholas Whitley |
11/11/20 | 11/11/20 | 568,750 | 812,500 | 1,625,000 | 5,000 | 1,406.60 | 1,556,667 | ||||||||||||||||||||||||
| Gregg Kam |
— | — | 176,400 | 252,000 | 504,000 | — | — | — | ||||||||||||||||||||||||
| Wayne Swanton |
8/24/20 | 7/13/20 | 231,000 | 330,000 | 660,000 | 4,929 | 1,056.60 | 1,309,471 | ||||||||||||||||||||||||
| Roberto Schianchi(3) |
8/20/20 | 7/13/20 | 4,929 | 1,056.60 | 1,309,471 | |||||||||||||||||||||||||||
| Ian Kalinosky |
— | — | 90,526 | 129,323 | 258,647 | — | — | — | ||||||||||||||||||||||||
| (1) | For named executive officers other than Mr. Schianchi, amounts represent the target awards under the Annual Incentive Bonus Plan based on the named executive officers’ base salaries on the date of grant. The actual amount paid for the fiscal year ended April 30, 2021 to each named executive officer under the Annual Incentive Bonus Plan is included in the Summary Compensation Table under the column titled “Non-Equity Incentive Plan Compensation.” The target value represents the named executive officer’s target percentage multiplied by base salary as of the fiscal year ended April 30, 2021. During the fiscal year ended April 30, 2021, the Company approved increases in base salary for each of our named executive officers (except for Mr Schianchi). As a result, as of April 30, 2021, the threshold, target and maximum awards under the Annual Incentive Bonus Plan, respectively, for such named executive officers were (i) for Mr. Whitley, $831,250, $1,187,500 and $2,375,000, (ii) for Mr. Kam, $176,400, $252,000 and $504,000, (iii) for Mr. Swanton, $231,000, $330,000 and $660,000 and (iv) for Mr. Kalinosky, $140,000, $200,000 and $400,000. |
| (2) | Reflects the number of options granted during the fiscal year ended April 30, 2021. The exercise price was determined by our board of directors to be at least the fair market value of our common shares as of the date of grant based on the most recent valuation or financing prior to the date of grant. In addition, these amounts include the incremental fair value of a modification that we made to outstanding stock options to reduce their exercise prices in accordance with the equitable adjustment provision of the Stock Option Plan as a result of the Distribution Financing Transactions. |
| (3) | No amount is reflected for the target award granted to Mr. Schianchi under the Zobele Bonus Plan for calendar year 2020 as such award was granted to him prior to the start of the fiscal year ended April 30, 2021. The threshold, target and maximum amount of such award upon grant were $105,111, $350,368 and $525,553, respectively. The actual amount paid for calendar year 2020 to Mr. Schianchi under the Zobele Bonus Plan is included in the Summary Compensation Table under the column titled “Non-Equity Incentive Plan Compensation.” The target value represents Mr. Schianchi’s target percentage multiplied by his base salary as of the year ended December 31, 2020. |
Description of Equity Incentive Plans
Stock Option Plan
Historically, we have had one long-term incentive plan pursuant to which we have granted stock options, the Stock Option Plan. Outstanding stock options currently provide the option holder the right to purchase our common shares at the exercise price per share agreed to under an individual award following satisfaction of time-and performance-based vesting conditions. In connection with this offering, the Stock Option Plan will be amended to reflect the Share Capital Amendments and to include terms and conditions required by the NYSE and the TSX for a stock option plan, including customary provisions relating to amendment of the Stock Option Plan and awards thereunder, and restrictions regarding insider participation.
172
Table of Contents
Purpose
The purpose of the Stock Option Plan is to provide financial reward, through the grant of options to purchase our common shares to eligible persons who have contributed or are expected to contribute to our development and allow them to directly benefit from our growth, development and financial success.
Shares Available under the Stock Option Plan
As of July 31, 2021, we had 123,167 stock options outstanding under the Stock Option Plan, before giving effect to the Share Capital Amendments, subject to adjustment in the event of any recapitalization, reorganization, arrangement, merger, amalgamation, dissolution, dividend, stock dividend, or a consolidation, subdivision, reclassification, split, combination or exchange of shares or other similar change affecting the shares or the share capital of the Company, the number and kind of shares which after such change may be optioned and sold under the Stock Option Plan, the number and kind of shares or other securities subject to outstanding options, the exercise price of options and/or any other term of the options, including without limitation, the vesting terms or performance targets shall be appropriately adjusted consistent with such change in such manner as our board of directors, in its sole discretion, deems equitable to prevent substantial dilution or enlargement of the rights granted to, or available for, participants in the Stock Option Plan. Effective as at March 30, 2021, we ceased granting new awards under the Stock Option Plan. Common shares underlying forfeited, expired, terminated or lapsed awards or substitute awards under the Stock Option Plan will not become again available for awards under the Stock Option Plan, the Omnibus Plan or otherwise.
Eligibility
All of our employees, contractors and consultants may receive awards under the Stock Option Plan. As of July 31, 2021, 134 participants hold outstanding options under the Stock Option Plan.
Administration
The Stock Option Plan is administered by our Compensation Committee. The board of directors delegated its authority as administrator of the Stock Option Plan to the Compensation Committee. The Compensation Committee has discretion to:
| • | determine the time or times when, and the manner in which, each option will be vested and exercisable and the duration of the exercise term; and |
| • | interpret the Stock Option Plan and, in its sole discretion, prescribe, amend or rescind any rules and regulations necessary or appropriate for the administration of the Stock Option Plan and make such other determinations and take such actions in connection with the administration of the Stock Option Plan as it deems necessary and advisable. |
Amendment and Termination
In general, the Compensation Committee may, without the consent of the participants, amend or terminate the Stock Option Plan at any time, subject to approval of our shareholders if required by the rules of the stock exchange on which our Shares are principally traded.
Form of Awards
Awards under the Stock Option Plan are in the form of stock options not intended to qualify as “incentive stock options” under Section 422 of the Code, with the following terms:
| • | options must have an exercise price at least equal to the fair market value of our common shares on the date of grant; |
173
Table of Contents
| • | generally, a portion of the stock options granted under the Stock Option Plan provide for vesting in equal annual installments over five years from the date of grant and a portion of the stock options granted under the Stock Option Plan provide for performance-based vesting conditions before and after a public offering; and |
| • | stock options expire upon the earlier of ten years after the date of grant or 90 days after termination of service (other than termination of service due to death or disability, in which case the options may be exercised within one year thereafter, or a termination for cause, in which case the Company may immediately terminate unexercised stock options). |
Omnibus Plan
In connection with the offering, the Company will adopt a new equity compensation plan in the form of an omnibus incentive plan, or Omnibus Plan. The following is a summary of the material terms of the Omnibus Plan.
Purpose
The purpose of the Omnibus Plan is to motivate and reward those employees and other individuals who are expected to contribute significantly to our long-term success and to further align employee interests to those of our shareholders.
Plan Term
The Omnibus Plan is scheduled to expire after ten years. The term will expire sooner if, prior to the end of the ten-year term or any extension period, the maximum number of shares available for issuance under the Omnibus Plan has been issued or our board of directors terminates the Omnibus Plan.
Authorized Shares and Award Limits
Subject to adjustment, 21,466,112 common shares will be available for awards to be granted under the Omnibus Plan (other than substitute awards; that is, awards that are granted in assumption of, or in substitution for, an outstanding award previously granted by a company or other business acquired by us or with which we combine). Common shares underlying forfeited, expired, terminated or lapsed awards or substitute awards, or awards settled in cash, under the Omnibus Plan will again be available for grant under the Omnibus Plan.
The Omnibus Plan will limit the grant of awards to any participant who is a non-employee director, during any calendar year, to $750,000 in the aggregate, including cash payments and awards. The Omnibus Plan will also limit the number of shares issuable to insiders (as defined in the Company Manual of the TSX) or issued within any one-year period under the Omnibus Plan, the Stock Option Plan and any other security-based compensation arrangement to up to 10% of the issued and outstanding shares.
Administration
The board of directors or, to the extent authority is delegated by the board of directors, its Compensation Committee or other committee (in either event, the “Administrator”) will administer the Omnibus Plan and determine the following items:
| • | designate participants among eligible employees, directors, officers and consultants; |
| • | determine the types of awards (including substitute awards) to grant, the number of shares to be covered by awards, the terms and conditions of awards and prescribe the form of each award agreement (which need not be identical for each participant), whether awards may be settled or exercised in cash, shares, other awards, other property or net settlement, the circumstances under which awards may be cancelled, repurchased, forfeited or suspended, and whether awards may be deferred automatically or at the election of the holder or the Administrator; |
174
Table of Contents
| • | interpret and administer the Omnibus Plan and any instrument or agreement relating to, or award made under, the Omnibus Plan; |
| • | amend the terms or conditions of outstanding awards, including to accelerate the time or times at which an award becomes vested, unrestricted or may be exercised; |
| • | correct any defect, supply any omission and reconcile any inconsistency in the Omnibus Plan or any award to carry the Omnibus Plan into effect; |
| • | establish, amend, suspend or waive rules and regulations and appoint agents, trustees, brokers, depositories and advisors and determine such terms of their engagement as it shall deem appropriate; |
| • | establish, amend, suspend or waive such rules and regulations and appoint such agents, trustees, brokers, depositories and advisors and determine such terms of their engagement for the proper administration of the Omnibus Plan and due compliance with applicable law, stock market or exchange rules and regulations or accounting or tax rules and regulations; and |
| • | make any other determination and take any other action that it deems necessary or desirable to administer the Omnibus Plan. |
Types of Awards
The Omnibus Plan provides for grants of incentive and non-qualified stock options, SARs, restricted share units (“RSUs”), performance awards, other share-based awards and other cash-based awards:
| • | Stock Options. A stock option is a contractual right to purchase shares at a future date at a specified exercise price. The per share exercise price of a stock option (except in the case of substitute awards) will be determined by the Administrator at the time of grant but may not be less than the market price of a common share on the day prior to the grant date. The Administrator will determine the date on which each stock option becomes vested and exercisable and the expiration date of each option. No stock option will be exercisable more than ten years from the grant date. Stock options that are intended to qualify as incentive stock options must meet the requirements of Section 422 of the Code. |
| • | SARs. A SAR represents a contractual right to receive, in cash or shares, an amount equal to the appreciation of one common share from the grant date over the exercise price of such SAR. The per share exercise price of a SAR (except in the case of substitute awards) will be determined by the Administrator but may not be less than the market price of a common share on the day prior to the grant date. The Administrator will determine the date on which each SAR may be exercised or settled and the expiration date of each SAR. However, no SAR will be exercisable more than ten years from the grant date. |
| • | RSUs. An RSU represents a contractual right to receive the value of a common share at a future date, subject to specified vesting and other restrictions. |
| • | Performance Awards. Performance awards, which may be denominated in cash or shares, will be earned upon the satisfaction of performance conditions specified by the Administrator. |
| • | Other Share-Based Awards. The Administrator is authorized to grant other share-based awards, which may be denominated in common shares or factors that may influence the value of our shares. |
| • | Other Cash-Based Awards. The Administrator is authorized to grant other cash-based awards either independently or as an element of or supplement to any other award under the Omnibus Plan. |
Adjustments
In the event that the Administrator determines that, as result of any dividend or other distribution (other than an ordinary dividend or distribution), recapitalization, stock split, subdivision, reverse stock split, reorganization,
175
Table of Contents
amalgamation, merger, consolidation, separation, rights offering, split-up, spin-off, combination or other similar corporate transaction or event affecting our shares, or of changes in applicable laws, regulations or accounting principles, an adjustment is necessary in order to prevent dilution or enlargement of the benefits or potential benefits intended to be made available under the Omnibus Plan, the Administrator will adjust equitably any or all of:
| • | the number and type of shares or other securities that thereafter may be made the subject of awards; |
| • | the number and type of shares or other securities subject to outstanding awards; |
| • | the grant, acquisition, exercise or hurdle price for any award or, if deemed appropriate, make provision for a cash payment to the holder of an outstanding award; and |
| • | the terms and conditions of any outstanding awards, including the performance criteria of any performance awards. |
Termination of Service and Change of Control
The Administrator will determine the effect of a termination of employment or service on outstanding awards, including whether the awards will vest, become exercisable, settle or be forfeited. In the event of a change of control, except as otherwise provided in the applicable award agreement, the Administrator may provide for:
| • | continuation or assumption of outstanding awards under the Omnibus Plan by us (if we are the surviving corporation) or by the surviving corporation or its parent; |
| • | substitution or replacement of outstanding awards by the surviving corporation or its parent with cash (other than in respect of an option granted to a participant who is subject to Canadian taxation, unless first elected by such participant), securities, rights or other property to be paid or issued by the surviving corporation or its parent, with substantially the same terms and value as such outstanding awards under the Omnibus Plan; |
| • | acceleration of the vesting and the lapse of any restrictions applicable to an award, and in the case of an Option or SAR Award, acceleration of the right to exercise such award; |
| • | in the case of a performance award, determination of the level of attainment of the applicable performance condition(s); or |
| • | cancelation of an award in consideration of a payment, with the form, amount and timing of such payment determined by the Administrator in its sole discretion; provided that any stock options or SARs for which the exercise or base price is equal to or exceeds the per share value of the consideration to be paid in the change of control transaction may be canceled without payment of any consideration. |
Amendment and Termination
Our board of directors may amend, alter, suspend, discontinue or terminate the Omnibus Plan, or any portion thereof, provided that (1) such action shall require the prior approval, if required, of the shareholders of the Company or of any stock market or exchange on which our shares are quoted or traded, and (2) no such action shall materially adversely affect the rights of any affected participant or holder or beneficiary under any award without the consent of such person, except (i) to the extent any such action is made to cause the Omnibus Plan or award to comply with applicable law, stock market or exchange rules and regulations or accounting or tax rules and regulations, or (ii) to impose any “clawback” or recoupment provisions on any awards (including any amounts or benefits arising from such Awards) in accordance with the provisions of the Omnibus Plan.
Notwithstanding the foregoing, shareholder approval in accordance with applicable stock exchange rules shall be required for any amendment that (1) increases the maximum number of common shares that may be
176
Table of Contents
issuable pursuant to the Omnibus Plan, except in the event of an adjustment permitted by the Omnibus Plan, (2) except for adjustments permitted by the Omnibus Plan, reduces the exercise price or hurdle price of an option, SAR or similar award, (3) except in the event of an adjustment permitted by the Omnibus Plan, involves the cancelation or repurchase any underwater options, SARs or similar awards for cash or other securities, (4) involves the cancellation of any option, SAR or similar award and granting either (x) replacement options, SARs or similar awards having a lower exercise price or hurdle price or (y) RSUs, performance awards or other share-based awards in exchange, (5) extends the term of an award beyond the original expiry date to the extent such amendment benefits an insider, (6) increases the maximum number of common shares that may be issuable to insiders pursuant to the insider participation limit, or (7) amends the amendment provisions of the Omnibus Plan in a manner that reduces the range of amendments which require shareholder approval. The Administrator may also amend, alter, suspend, discontinue or terminate, or waive any conditions or rights under, any outstanding award if the foregoing conditions are met.
Except as specifically provided in an award agreement approved by the Administrator, awards granted under the Omnibus Plan are generally not transferable other than by will or the laws of descent and distribution.
Outstanding Equity Awards at Fiscal Year 2021 Year-End
The following table sets forth information regarding equity awards held by our named executive officers as of April 30, 2021.
| OPTION AWARDS | ||||||||||||||||||||
| Name |
Number
of Securities Underlying Unexercised Options exercisable (#)(1) |
Number of Securities Underlying Unexercised Options Unexercisable (#) |
Equity Incentive Plan Awards: Number of Securities Underlying Unexercised Unearned Options (#)(2) |
Option Exercise Price ($) |
Option Expiration Date |
|||||||||||||||
| Nicholas Whitley |
2,191 | 3,286 | 10,953 | 806.60 | |
5/3/2029 |
| |||||||||||||
| — | 1,667 | 3,333 | 1,406.60 | 11/11/2030 | ||||||||||||||||
| Gregg Kam |
329 | 1,314 | 3,286 | 806.60 | |
6/10/2029 |
| |||||||||||||
| Wayne Swanton |
— | 1,643 | 3,286 | 1,056.60 | |
8/24/2030 |
| |||||||||||||
| Roberto Schianchi |
329 | 1,314 | 3,286 | 1,056.60 | 8/20/2030 | |||||||||||||||
| Ian Kalinosky |
657 | |
986 |
|
3,286 | 806.60 | 5/3/2029 | |||||||||||||
| (1) | Reflects time-vesting options that vest 20% on each of the first five anniversaries of the vesting commencement date. Amounts reported as exercisable reflect time-vested options as of April 30, 2021, without taking into account the Share Capital Amendments. |
| (2) | Options in this column represent unvested performance-vesting options as of April 30, 2021. The performance-vesting options would vest and become exercisable on each measurement date based on the achievement of certain multiple of invested capital and internal rate of return performance goals. See “—Long-Term Equity Compensation” above. In May 2021, the Board of Directors approved an amendment to the performance-vesting options, effective upon the completion of this offering, to remove the performance metrics and provide that such options will be time-vesting options vesting ratably over a five-year period from the vesting commencement date. |
Potential Payments Upon Termination or Change in Control
| Name |
Benefit |
Termination Without Cause or for Good Reason ($) |
Termination due to death or Disability ($) |
Change in Control ($) |
||||||||||
| Nicholas Whitley |
Severance Benefit(1) | |
1,425,000 |
|
||||||||||
| Continuation of Health Benefits(2) | 41,012 | |||||||||||||
| Value of Accelerated Stock Options(3) | 728,680 | 9,506,000 | ||||||||||||
| Pro Rata Annual Bonus(4) | 1,246,875 | 1,246,875 | ||||||||||||
| Target Annual Bonus(5) | 1,187,500 | |||||||||||||
177
Table of Contents
| Name |
Benefit |
Termination Without Cause or for Good Reason ($) |
Termination due to death or Disability ($) |
Change in Control ($) |
||||||||||
| Gregg Kam |
Severance Benefit(1) | 500,000 | ||||||||||||
| Continuation of Health Benefits(2) | 27,341 | |||||||||||||
| Value of Accelerated Stock Options(3) | 213,590 | 2,990,650 | ||||||||||||
| Pro Rata Annual Bonus(4) | 254,600 | |||||||||||||
| Wayne Swanton |
Severance Benefit(1) | |
550,000 |
|
||||||||||
| Continuation of Health Benefits(2) | 0 | |||||||||||||
| Value of Accelerated Stock Options(3) | 131,440 | 1,971,600 | ||||||||||||
| Pro Rata Annual Bonus(4) | 331,840 | |||||||||||||
| Roberto Schianchi |
Severance Benefit(6) |
|
1,488,908 |
|
||||||||||
| Value of Accelerated Stock Options(3) | 131,440 | 1,840,000 | ||||||||||||
| Ian Kalinosky |
Severance Benefit(1) | 400,000 | ||||||||||||
| Continuation of Health Benefits(2) | 22,836 | |||||||||||||
| Value of Accelerated Stock Options(3) | 213,590 | 2,776,800 | ||||||||||||
| Pro Rata Annual Bonus(4) | 210,000 | |||||||||||||
| (1) | Such amount includes twelve months’ base salary (and for Mr. Whitley, eighteen months’ base salary) payable in substantially equal installments for twelve months (or 18 months for Mr. Whitley) after termination. |
| (2) | Such amount includes the cost of healthcare continuation for twelve months (and for Mr. Whitley, eighteen months). |
| (3) | Under the Stock Option Plan, upon a termination by us without cause or for good reason, a pro rata portion of the time-vesting options otherwise scheduled to vest on the next annual vesting date (if any) will immediately vest. In addition, on a change in control the performance-vesting options vest and become exercisable based on the achievement of multiple of invested capital and internal rate of return performance goals. The amounts in the change of control column assume the maximum achievement of the performance conditions for the performance-vesting options. |
| (4) | This amount reflects the pro rata portion of the annual cash bonus to which the named executive officer would have been entitled had he remained employed by us until the end of the fiscal year based on actual performance for such year, payable following a termination due to death or disability, when the annual cash bonus for such year would have been payable (and in the case of Mr. Whitley, also in the event of an involuntary termination without cause or resignation for good reason). |
| (5) | This amount reflects the annual cash bonus at target. |
| (6) | This amount reflects a payment equal to 150% of Mr. Schianchi’s annual salary, the average of the annual bonus paid to Mr. Schianchi over the 36-month period prior to termination and the monthly cash value of any benefit in kind granted to Mr. Schianchi, payable in equal monthly installments following dismissal (excluding legal notice required under Mr. Schianchi’s employment agreement in the amount of approximately $974,000). The amount reported was calculated in euros and covered to U.S. dollars based on a conversion rate as of April 30, 2021 of $0.8277 to €1, which was the same rate used for our financial reporting purposes for the year ended April 30, 2021. |
Director Compensation
During the fiscal year ended April 30, 2021, our directors, except for Justine Cheng, Chair, Stephen Trevor and Sunjay Gorawara (who ceased to be a director on June 22, 2021), the nominees of Cornell, and Timothy Thorpe and Nicholas Whitley, each of whom did not receive compensation for their service on the board of directors, received cash retainers at the annual rate of $50,000, paid quarterly in arrears, and stock option awards under the Stock Option Plan as follows:
| Grant Date |
Number of Shares Underlying Options(1) |
Exercise Price Per Share(1),(2) |
||||||
| May 1, 2020 |
80 | $ | 1,056.60 | |||||
| March 16, 2021(3) |
71 | $ | 1,406.60 | |||||
| (1) | Number of shares and exercise price do not take into account the Share Capital Amendments. |
| (2) | For May 1, 2020, reflects the current exercise price after adjustments as a result of the Distribution Financing Transactions. The initial exercise prices was $1,250. |
| (3) | Anne Fulenwider did not receive the March 16, 2021 stock option award due to her termination of service on January 31, 2021. |
178
Table of Contents
The stock options granted on May 1, 2020 became fully vested and exercisable on May 1, 2021. The stock options granted on March 16, 2021 will become fully vested and exercisable on March 16, 2022, subject to each director’s continued service through such date, with full acceleration in the event of a change of control (which does not include this offering). In addition, Mr. Pirard received an additional cash fee of $20,000 for his service as chair of the Audit Committee and Mr. Chance received an additional cash fee of $5,000 for his service on the Compensation Committee.
In connection with Anne Fulenwider’s, Anne Darche’s and Alexandra Wilkis Wilson’s separations from the board of directors on January 31, 2021, May 21, 2021 and May 19, 2021, respectively, the board of directors determined that their outstanding options would remain exercisable through the option expiration date.
In connection with stock option grants, our directors agree to be subject to restrictive covenants, including perpetual confidentiality and non-disparagement and 12-month post-termination restrictions on competition and 24-month post-termination restrictions on solicitation of employees and service providers and customers, prospective customers and suppliers.
The following table sets forth information concerning the compensation earned by our non-employee directors during the fiscal year ended April 30, 2021.
| Name |
Fees earned or paid in cash ($)(1) |
Stock Options ($)(2) |
All Other Compensation ($) |
Total ($) |
||||||||||||
| Jacques Bougie(3) |
50,000 | 54,084 | — | 104,084 | ||||||||||||
| Kevin Chance |
55,000 | 54,084 | — | 109,084 | ||||||||||||
| Justine Cheng |
— | — | — | — | ||||||||||||
| Anne Darche(4) |
50,000 | 54,084 | — | 104,084 | ||||||||||||
| Anne Fulenwider(5) |
37,500 | 28,240 | — | 78,240 | ||||||||||||
| Sunjay Gorawara |
— | — | — | — | ||||||||||||
| Pierre Pirard |
70,000 | 54,084 | 3,600 | (7) | 124,084 | |||||||||||
| Timothy Thorpe |
— | — | — | — | ||||||||||||
| Stephen Trevor |
— | — | — | — | ||||||||||||
| Alexandra Wilkis Wilson(6) |
50,000 | 54,084 | — | 104,084 | ||||||||||||
| (1) | Reflects cash retainers paid for the fiscal year ended April 30, 2021. |
| (2) | For Messrs. Bougie, Chance and Pirard, represents the aggregate grant date fair value of stock option awards calculated in accordance with FASB ASC Topic 718. In addition, these amounts include the incremental fair value (calculated in accordance with FASB ASC Topic 718) of a modification that we made to outstanding stock options to reduce their exercise prices in connection with the Distribution Financing Transactions. The assumptions we used in valuing stock option awards are described in Note 15, Employee Benefits, to our audited consolidated financial statements included elsewhere in this prospectus. |
| (3) | Reflects amounts paid to Mr. Bougie in Canadian Dollars as converted to U.S. Dollars based on the conversion rate as of the payment date. The actual amount paid to Mr. Bougie for the fiscal year ended April 30, 2021 was C$66,775. |
| (4) | Reflects amounts paid to Ms. Darche in Canadian dollars as converted to U.S. dollars based on the conversion rate as of the payment date. The actual amount paid to Ms. Darche for the fiscal year ended April 30, 2021 was C$64,711.86. Ms. Darche’s service on our board of directors terminated on May 21, 2021. |
| (5) | Ms. Fulenwider’s service on our board of directors terminated on January 31, 2021. |
| (6) | Ms. Wilson’s service on our board of directors terminated on May 19, 2021. |
| (7) | Reflects a cash fee paid to Mr. Pirard for consulting services provided to the Company during the fiscal year ended April 30, 2021. |
The following table sets forth information concerning the stock option awards held by our directors as of April 30, 2021:
|
Name(1) |
Grant Date | Number of Shares Underlying Options(2) |
Exercise Price Per Share(2) |
|||||||
| Anne Darche |
May 3, 2019 | 100 | $ | 806.60 | ||||||
| May 1, 2020 | 80 | $ | 1,056.60 | |||||||
| March 16, 2021 | 71 | $ | 1,406.60 | |||||||
| Alexandra Wilkis Wilson |
May 3, 2019 | 100 | $ | 806.60 | ||||||
179
Table of Contents
|
Name(1) |
Grant Date | Number of Shares Underlying Options(2) |
Exercise Price Per Share(2) |
|||||||||
| May 1, 2020 | 80 | $ | 1,056.60 | |||||||||
| March 16, 2021 | 71 | $ | 1,406.60 | |||||||||
| Jacques Bougie |
May 3, 2019 | 100 | $ | 806.60 | ||||||||
| May 1, 2020 | 80 | $ | 1,056.60 | |||||||||
| March 16, 2021 | 71 | $ | 1,406.60 | |||||||||
| Kevin Chance |
May 3, 2019 | 100 | $ | 806.60 | ||||||||
| May 1, 2020 | 80 | $ | 1,056.60 | |||||||||
| March 16, 2021 | 71 | $ | 1,406.60 | |||||||||
| Anne Fulenwider |
May 3, 2019 | 100 | $ | 806.60 | ||||||||
| May 1, 2020 | 80 | $ | 1,056.60 | |||||||||
| Pierre Pirard |
May 3, 2019 | 100 | $ | 806.60 | ||||||||
| May 1, 2020 | 80 | $ | 1,056.60 | |||||||||
| March 16, 2021 | 71 | $ | 1,406.60 | |||||||||
| (1) | In connection with Anne Fulenwider’s, Anne Darche’s and Alexandra Wilkis Wilson’s separations from the board of directors on January 31, 2021, May 21, 2021 and May 19, 2021, respectively, the board of directors determined that their outstanding options would remain exercisable through the option expiration date. |
| (2) | Amounts in this column reflect the current exercise price after adjustments as a result of the Distribution Financing Transactions. Number of shares and exercise price do not take into account the Share Capital Amendments. |
180
Table of Contents
CERTAIN RELATIONSHIPS AND RELATED PARTY TRANSACTIONS
We describe below transactions and series of similar transactions, during our last three fiscal years or currently proposed, to which we were or will be a participant, in which:
| • | the amounts involved exceeded or will exceed $120,000; and |
| • | any of our directors or executive officers (in each case, including their immediate family members) or beneficial holders of more than 5% of any class of our voting securities had or will have a direct or indirect material interest. |
Other than as described below, there have not been, nor are there any currently proposed, transactions or series of similar transactions meeting this criteria or which are required to be disclosed under applicable securities laws to which we have been or will be a participant other than compensation arrangements, which are described where required under “Executive and Director Compensation.”
The following describes the material terms of certain of our agreements as at the date of this prospectus and following the closing of the offering. The following descriptions may not be complete and are subject to, and qualified in their entirety by reference to, the terms and provisions of the agreement they relate to.
Shareholders’ Agreement
The Company entered into a shareholders’ agreement on December 21, 2018 with certain shareholders, which will be terminated upon closing of the offering and will be replaced by the Registration Rights Agreement and the Shareholders’ Agreement.
In connection with this offering, we intend to enter into the Shareholders’ Agreement with certain of our shareholders, namely CC KDC Co-Invest LP (Cayman) (an affiliate of Cornell) (“CC KDC”), CDP Investissements Inc. (“CDP,” and together with CC KDC, the “Principal Shareholders”) and Upper Invest Ltd. (a Guernsey company) (“Upper Invest”).
Board Composition and Appointment Rights
Pursuant to the terms of the Shareholders’ Agreement, our board of directors will be initially comprised of eleven directors. The Shareholders’ Agreement will require us to nominate a number of individuals designated by each of the Principal Shareholders (each a “Principal Shareholder Director”), as applicable, for election as our directors at any meeting of our shareholders where director are to be elected such that, following the election of any directors, the respective number of Principal Shareholder Directors serving as directors of our Company will be equal to, (i) if and so long as a Principal Shareholder and its affiliates together continue to beneficially own at least 40% of our common shares, 40% of the total number of directors comprising our board of directors; (ii) if and so long as a Principal Shareholder and its affiliates together continue to beneficially own at least 30% (but less than 40%) of our common shares, 30% of the total number of directors comprising our board of directors; (iii) if and so long as a Principal Shareholder and its affiliates together continue to beneficially own at least 20% (but less than 30%) of our common shares, 20% of the total number of directors comprising our board of directors, provided, in any event, that as long as CDP and its affiliates together continue to beneficially own at least 15% of our common shares, CDP will be entitled to designate two of the directors comprising our board of directors; and (iv) if and so long as a Principal Shareholder and its affiliates together continue to beneficially own at least 10% (but less than 20%) of our common shares, 10% of the total number of directors comprising our board of directors. In each case, it being understood that such number of Principal Shareholder Directors shall be rounded down to the nearest whole number.
181
Table of Contents
Other Rights
The Shareholders’ Agreement will also provide that, for so long as CC KDC is entitled to nominate a director, it will be entitled, but not obligated, subject to applicable securities laws, the rules of the NYSE and the BCBCA, to designate at least one director to each of the board committees other than the Audit Committee.
In addition, the Shareholders’ Agreement will provide that, for so long as CDP, together with its affiliates, continues to beneficially own at least 10% of our common shares, CDP will have the right to designate one individual as a non-voting observer to the board of directors. Until the earlier of five years following the closing of this offering or CDP, together with its affiliates, ceasing to beneficially own at least 10% of our common shares, CDP will also have certain consultation rights with respect to any material change in the operations at the Québec-based facilities of the Company and its subsidiaries, and certain approval rights relating to the maintenance of the Company’s global headquarters in Québec.
The Shareholders’ Agreement will also provide that, for so long as CC KDC, together with its affiliates, continues to beneficially own at least 10% of our common shares, it will have approval rights for any action on, including an increase or decrease in, the number of directors serving on the board of directors.
Registration Rights Agreement
In connection with this offering, we intend to enter into the Registration Rights Agreement with certain of our shareholders, pursuant to which, beginning 180 days following the closing of this offering (or such earlier time as permitted by the terms of the lock-up agreements executed in connection with this offering), holders of a total of approximately 150 million common shares or securities convertible into or exchangeable for such common shares (such securities, “registrable securities”) will have the right to require us to register these shares under the Securities Act under specified circumstances (and/or effect such registration pursuant to a public offering in Canada). There is a general restriction on transfer of these securities, except to specified transferees. After registration pursuant to these rights, the registrable securities will become freely tradeable without restriction under the Securities Act immediately upon the effectiveness of the registration.
Demand Registration Rights
Beginning 180 days after the closing of this offering (or such earlier time as permitted by the terms of the lock-up agreements executed in connection with this offering), subject to specified limitations to be set forth in the Registration Rights Agreement, at any time, entities affiliated with CC KDC may request registration of all or any portion of their registrable securities then outstanding under the Securities Act for purposes of a public offering (and/or effect such registration pursuant to a public offering in Canada). After any such request for registration, the holders of registrable securities will be entitled to notice of the registration and, subject to specified exemptions, have the right to require us to register all or a portion of the registrable securities then held by them in that registration. We can satisfy this demand registration, as determined by the holders requesting the registration, by (a) preparing and filing a registration statement with the SEC, (b) preparing and filing a Canadian preliminary prospectus and Canadian prospectus with the Canadian securities authorities or (c) a combination of both (a) and (b).
In addition, subject to specified limitations set forth in the Registration Rights Agreement, at any time after we become eligible to file a short-form registration statement on Form S-3 (or file a short-form Canadian prospectus under National Instrument 44-101—Short Form Prospectus Distributions), entities affiliated with CC KDC may request that we register an unlimited number of their registrable securities on Form S-3 for purposes of a public offering (and/or effect such registration pursuant to a public offering in Canada). After any such request for registration, the holders of registrable securities will be entitled to notice of the registration and, subject to specified exemptions, have the right to require us to register all or a portion of the registrable securities then held by them in that registration. We can satisfy this demand registration, as determined by the holders
182
Table of Contents
requesting the registration, by (a) preparing and filing a registration statement with the SEC, (b) preparing and filing a Canadian preliminary prospectus and Canadian prospectus with the Canadian securities authorities or (c) a combination of both (a) and (b).
We shall use our reasonable best efforts to cause such registration statements to become effective.
Piggyback Registration Rights
If at any time after the closing of this offering, we propose to register any of our common shares for our own account or for the account of one or more of our shareholders, the holders of registrable securities will be entitled to notice of the registration and, subject to specified exemptions, have the right to require us to register all or a portion of the registrable securities then held by them in that registration. We have the right to terminate or withdraw any registration statement initiated by us before the effective date of such registration.
Expenses
The Registration Rights Agreement will provide that we are required to pay all registration expenses, including all registration and filing fees; underwriting expenses; audit and accounting expenses; fees and expenses to comply with securities and “blue sky” laws; printing and copying expenses; messenger, telephone and delivery expenses; fees and expenses incurred in connection with any “road show” and marketing activities; fees and expenses of our counsel and accountants; any FINRA filing fees; reasonable fees and expenses of counsel for selling shareholders; transfer agents’, depositaries’ and registrars’ fees; and translation fees, if any.
The Registration Rights Agreement will contain customary cross-indemnification provisions, pursuant to which we are obligated to indemnify the selling shareholders in the event of material misstatements or omissions in any offering documents; or our noncompliance or alleged noncompliance with any applicable securities laws. The participating selling shareholders are obligated to indemnify us in the event of material misstatements or omissions in any offering documents attributable to those selling shareholders. The selling shareholders’ obligation is several (and not joint and several) for each such holder.
Services Agreement
In connection with the Acquisition, we entered into the Services Agreement with Cornell pursuant to which we pay Cornell a fee for financial and management consulting services to be provided to us. Pursuant to the Services Agreement, Cornell is entitled to receive the Sponsor Fees as well as quarterly reimbursements of customary expenses.
During the three months ended July 31, 2021, fiscal years ended April 30, 2021 and 2020 and the year ended April 30, 2019 (using Combined 2019 Financial Information), we recorded (i) approximately $1.7 million, $7.9 million, $4.6 million and $1.3 million of Sponsor Management Fee expenses paid to Cornell under the Services Agreement, respectively, and (ii) approximately $0.1 million, $0.0, $15.1 million and $0.0 of Sponsor Acquisition Fee expenses as well as quarterly reimbursements of customary expenses paid to Cornell, respectively. As of July 31, 2021, April 30, 2021, 2020 and 2019, we had (i) approximately $4.5 million, $3.0 million, $1.8 million and $0.0 of Sponsor Management Fees payable to Cornell, respectively, and (ii) approximately $0.1 million, $0.0, $6.6 million and $0.0 of Sponsor Acquisition Fees as well as quarterly reimbursements of customary expenses payable to Cornell, respectively.
On June 22, 2021, the Services Agreement was amended to provide for its termination upon the completion of this offering, which amendment provides that the Company will pay Cornell a one-time cash termination fee of $18.0 million.
183
Table of Contents
Commercial Transactions with Entities Controlled by Principal Owners
During the three months ended July 31, 2021, we recorded:
| • | In the normal course of business, (i) $10.7 million payable to and (ii) $11.5 million of purchases of goods and services that include injection-molded plastic and airless dispensing cosmetic components, cosmetic brushes, metal cosmetic applicators and other cosmetic components, quality assurance services, and cosmetic formulation and filling services from entities that are controlled by a member of the immediate family of Timothy Thorpe, a member of our board of directors, and whose family member controls Upper Invest, one of our principal shareholders; |
| • | in the normal course of business, $7.6 million for tax refunds for pre-acquisition state tax filings and returns payable to entities that are controlled by a member of the immediate family of Timothy Thorpe, a member of our board of directors, and whose family member controls Upper Invest, one of our principal shareholders; |
| • | in the normal course of business, (i) $0.2 million payable to and (ii) $1.9 million of cosmetics formulation and filling purchases from Bayport Laboratories, LLC in which HCT has a one-third ownership interest; |
| • | $0.2 million in revenues derived from sales transactions for finished hair care and skin care products concluded with Fekkai Brands, an entity that is controlled by Cornell; |
| • | a deferred consideration payable of $0.4 million relating to the HCT Metals acquisition; and |
| • | $0.9 million in trade and other receivables, net, related to (i) a post-close consideration adjustment of $0.7 million relating to the HCT Metals acquisition, and (ii) $0.2 million for travel and other expenses receivable from Timothy Thorpe, a member of our board of directors. |
During the fiscal year ended April 30, 2021, we recorded:
| • | In the normal course of business, (i) $8.5 million payable to and (ii) $50.9 million of purchases of goods and services that include injection-molded plastic and airless dispensing cosmetic components, cosmetic brushes, metal cosmetic applicators and other cosmetic components, quality assurance services, and cosmetic formulation and filling services from entities that are controlled by a member of the immediate family of Timothy Thorpe, a member of our board of directors, and whose family member controls Upper Invest, one of our principal shareholders; |
| • | in the normal course of business, $7.6 million for tax refunds for pre-acquisition state tax filings and returns payable to entities that are controlled by a member of the immediate family of Timothy Thorpe, a member of our board of directors, and whose family member controls Upper Invest, one of our principal shareholders; |
| • | in the normal course of business, (i) $0.2 million payable to and (ii) $2.0 million of cosmetics formulation and filling purchases from Bayport Laboratories, LLC of which HCT has a one-third ownership interest; |
| • | $1.8 million in revenues derived from sales transactions for finished hair care and skin care products concluded with Fekkai Brands, an entity that is controlled by Cornell; and |
| • | $0.4 million in trade and other receivables, net, related to (i) sales transactions of $0.2 million for finished hair care and skin care products concluded in the ordinary course of business with Fekkai Brands, an entity controlled by Cornell, and (ii) $0.2 million for travel and other expenses receivable from Timothy Thorpe, a member of our board of directors. |
184
Table of Contents
During the fiscal year ended April 30, 2020, we recorded:
| • | In the normal course of business, (i) $4.8 million payable to and (ii) $6.4 million of purchases of goods and services that include injection-molded plastic and airless dispensing cosmetic components, cosmetic brushes, metal cosmetic applicators and other cosmetic components, quality assurance services, and cosmetic formulation and filling services from entities that are controlled by a member of the immediate family of Timothy Thorpe, a member of our board of directors, and whose family member controls Upper Invest, one of our principal shareholders; |
| • | in the normal course of business, (i) $0.1 million payable to and (ii) $0.6 million of cosmetics formulation and filling purchases from Bayport Laboratories, LLC of which HCT has a one-third ownership interest; |
| • | $2.8 million in revenues derived from sales transactions for finished hair care and skin care products concluded with Fekkai Brands, an entity that is controlled by Cornell; and |
| • | $5.3 million in trade and other receivables, net, related to (i) a post-close consideration adjustment of $4.8 million relating to the HCT acquisition and (ii) $0.5 million for travel and other expenses receivable from Timothy Thorpe, a member of our board of directors. |
During the fiscal year ended April 30, 2019 (using Combined 2019 Financial Information), we recorded $1.0 million in fees paid to the former sponsor Novacap during the Predecessor Period. We did not record any other related party transactions not otherwise disclosed herein.
Indemnification Agreements
We expect to enter into an indemnification agreement with each of our executive officers and directors that provides, in general, that we will indemnify them to the fullest extent permitted by law in connection with their service to us or on our behalf. See “Management—Indemnification of Officers and Directors.”
Call Option Deed
In connection with our acquisition of HCT, we entered into a call option deed on January 23, 2020 whereby we had the option to acquire the shares of certain businesses that were controlled by a member of the immediate family of Timothy Thorpe, a member of our board of directors, and whose family member controls Upper Invest, one of our principal shareholders. The call option was exercisable at any time on or prior to January 23, 2025 for a consideration equal to the higher of (i) the fair value of the shares then acquired and (ii) the investment cost of the seller; and, in connection with the acquisition of HCT Metals, $22.5 million. A purchase agreement was executed in connection with the acquisition of HCT Metals on March 11, 2021 for a purchase price of $11.8 million, on terms varying from the call option deed. The HCT Metals transaction closed on May 3, 2021.
Related Party Transactions Policies and Procedures
Upon the consummation of this offering, we will adopt a written related person transaction policy, or the policy, which will set forth our policy with respect to the review, approval, ratification and disclosure of all related person transactions by our Audit Committee. In accordance with the policy, our Audit Committee will have overall responsibility for implementation of and compliance with the policy.
For purposes of the policy, a “related person transaction” is a transaction, arrangement or relationship (or any series of similar transactions, arrangements or relationships) in which we were, are or will be a participant and the amount involved exceeded, exceeds or will exceed $120,000, or which is required to be disclosed under applicable securities laws. A “related person transaction” does not include any employment relationship or transaction involving an executive officer and any related compensation resulting solely from that employment relationship that has been reviewed and approved by our board of directors.
185
Table of Contents
Existing arrangements and new arrangements entered into in connection with this offering that are described in this prospectus, any subsequent amendment to any such arrangement that is not material to us and any ancillary services provided in connection therewith will not require review, approval or ratification pursuant to the policy, even if otherwise considered a “related person transaction.”
Interest of Management and Others in Material Transactions
Except as set out above or described elsewhere in this prospectus, there are no material interests, direct or indirect, of any of our directors or executive officers, any shareholder that beneficially owns, or controls or directs (directly or indirectly), more than 10% of any class or series of our outstanding voting securities, or any associate or affiliate of any of the foregoing persons, in any transaction within the three years before the date in this prospectus that has materially affected or is reasonably expected to materially affect us or any of our subsidiaries.
Indebtedness of Directors, Executive Officers and Employees
As of the date of this prospectus, none of our directors, executive officers, employees, former directors, former executive officers or former employees or any of our subsidiaries, and none of their respective associates, is indebted to us or any of our subsidiaries or another entity whose indebtedness is the subject of a guarantee, support agreement, letter of credit or other similar agreement or understanding provided by us or any of our subsidiaries, except, as the case may be, for routine indebtedness as defined under applicable securities legislations.
Directed Share Program
At our request, the underwriters have reserved up to 2,857,142 common shares, or 5% of the common shares to be offered by this prospectus, for sale at the initial public offering price through a directed share program for certain persons designated by the Company.
186
Table of Contents
The following table sets forth information regarding the beneficial ownership of our common shares as of September 14, 2021, as adjusted to give effect to (i) the Share Capital Amendments, and (ii) this offering, by:
| • | each person or group whom we know to own beneficially more than 5% of our common shares; |
| • | each of our directors and named executive officers individually; and |
| • | all of our directors and executive officers as a group. |
In accordance with the rules of the SEC, beneficial ownership includes voting or investment power with respect to securities and includes shares issuable pursuant to stock options that are exercisable within 60 days of September 14, 2021. The number of shares outstanding before this offering is based on a total of 157,518,260 common shares outstanding as of September 14, 2021, assuming the completion of the Share Capital Amendments. The number of common shares outstanding after this offering includes 57,142,857 common shares being offered for sale by us in this offering, assuming no exercise of the underwriters’ option to purchase additional common shares. Unless otherwise indicated, the address for each listed shareholder is: c/o 375 Roland-Therrien Boulevard, Suite 210, Longueuil, Québec J4H 4A6, Canada. To our knowledge, except as indicated in the footnotes to this table and pursuant to applicable community property laws, the persons named in the table have sole voting and investment power with respect to all common shares.
| Shares Owned | ||||||||||||||||||||||||
| Before This Offering | After This Offering Assuming No Exercise of Underwriters’ Option |
After This Offering Assuming Underwriters’ Option is Exercised in Full |
||||||||||||||||||||||
| Name of Beneficial Owner |
Number | Percentage | Number | Percentage | Number | Percentage | ||||||||||||||||||
| Directors and Named Executive Officers |
||||||||||||||||||||||||
| Nicholas Whitley(1) |
985,780 | 1 | % | 985,780 | * | 985,780 | * | |||||||||||||||||
| Gregg Kam(2) |
226,734 | * | 226,734 | * | 226,734 | * | ||||||||||||||||||
| Ian Kalinosky(3) |
272,734 | * | 272,734 | * | 272,734 | * | ||||||||||||||||||
| Roberto Schianchi(4) |
113,367 | * | 113,367 | * | 113,367 | * | ||||||||||||||||||
| Wayne Swanton(5) |
113,367 | * | 113,367 | * | 113,367 | * | ||||||||||||||||||
| Jacques Bougie(6) |
1,066,050 | 1 | % | 1,066,050 | * | 1,066,050 | * | |||||||||||||||||
| Kevin Chance(7) |
20,700 | * | 20,700 | * | 20,700 | * | ||||||||||||||||||
| Justine Cheng |
— | * | — | * | — | * | ||||||||||||||||||
| Joanna Coles |
— | * | — | * | — | * | ||||||||||||||||||
| Marie Josée Lamothe |
— | * | — | * | — | * | ||||||||||||||||||
| Steven Lin |
— | * | — | * | — | * | ||||||||||||||||||
| Pierre Pirard(8) |
46,805 | * | 46,805 | * | 46,805 | * | ||||||||||||||||||
| Valarie Sheppard |
— | * | — | * | — | * | ||||||||||||||||||
| Timothy Thorpe |
— | * | — | * | — | * | ||||||||||||||||||
| Stephen Trevor |
— | * | — | * | — | * | ||||||||||||||||||
| All directors and executive officers as a group (15 persons) |
2,845,537 | 2 | % | 2,845,537 | 1 | % | 2,845,537 | 1 | % | |||||||||||||||
| 5% Shareholders |
||||||||||||||||||||||||
| CC KDC Co-Invest LP(9) |
93,136,890 | 59 | % | 93,136,890 | 43 | % | 93,136,890 | 42 | % | |||||||||||||||
| CDP Investissements Inc.(10) |
38,851,140 | (11) | 25 | %(11) | 38,851,140 | 18 | % | 38,851,140 | 17 | % | ||||||||||||||
| Upper Invest Ltd.(12) |
15,681,860 | 10 | % | 15,681,860 | 7 | % | 15,681,860 | 7 | % | |||||||||||||||
| * | Less than 1% on a non-diluted and fully diluted basis. |
| (1) | Includes 870,780 common shares issuable upon the exercise of options that are exercisable as of September 14, 2021 or will become exercisable within 60 days after such date. |
| (2) | Includes common shares issuable upon the exercise of options that are exercisable as of September 14, 2021 or will become exercisable within 60 days after such date. |
| (3) | Includes 226,734 common shares issuable upon the exercise of options that are exercisable as of September 14, 2021 or will become exercisable within 60 days after such date. |
187
Table of Contents
| (4) | Includes common shares issuable upon the exercise of options that are exercisable as of September 14, 2021 or will become exercisable within 60 days after such date. |
| (5) | Includes common shares issuable upon the exercise of options that are exercisable as of September 14, 2021 or will become exercisable within 60 days after such date. |
| (6) | Includes 20,700 common shares issuable upon the exercise of options that are exercisable as of September 14, 2021 or will become exercisable within 60 days after such date. |
| (7) | Includes common shares issuable upon the exercise of options that are exercisable as of September 14, 2021 or will become exercisable within 60 days after such date. |
| (8) | Includes 20,700 common shares issuable upon the exercise of options that are exercisable as of September 14, 2021 or will become exercisable within 60 days after such date. |
| (9) | CC KDC CO-Invest LP is controlled by its general partner, CC Co-Invest GP LLC. The managing member of CC Co-Invest GP LLC is Cornell Capital GP LP, which is in turn controlled by its general partner, Cornell Capital GP LLC. The sole member of Cornell Capital GP LLC is Henry Cornell. CC Co-Invest GP LLC, Cornell Capital GP LP and Cornell Capital GP LLC are collectively referred to as the Cornell Entities and each, a Cornell Entity. Each of the Cornell Entities and Henry Cornell may be deemed to beneficially own the common shares held by CC KDC CO-Invest LP, but each disclaims beneficial ownership of such shares except to the extent of its or his indirect pecuniary interest therein. The mailing address of CC KDC Co-Invest LP, each Cornell Entity and Henry Cornell is c/o Cornell Capital LLC, 499 Park Avenue, 21st Floor, New York, New York 10022. On a fully diluted basis, such shareholder would hold 93,136,890 common shares (or 93,136,890 common shares if the underwriters’ option is exercised in full), representing 40% (or 39% if the underwriters’ option is exercised in full) of outstanding common shares (assuming the full exercise of all outstanding securities convertible or exchangeable into common shares). |
| (10) | CDP Investissements Inc. is a wholly owned subsidiary of, and is controlled by, CDPQ. An investment committee consisting of nine members appointed by CDPQ at any time and from time to time has voting and dispositive power over the shares beneficially owned by CDPQ, and the approval of a majority of the members of the investment committee is required to approve an action. Under the so-called “rule of three,” if voting and dispositive decisions regarding an entity’s securities are made by three or more individuals, and a voting and dispositive decision requires the approval of a majority of those individuals, then none of the individuals is deemed a beneficial owner of the entity’s securities. As a result, none of the individual members of such investment committee is deemed to have beneficial ownership of such shares. On a fully diluted basis, such shareholder would hold 38,851,140 common shares (or 38,851,140 common shares if the underwriters’ option is exercised in full), representing 17% (or 16% if the underwriters’ option is exercised in full) of outstanding common shares (assuming the full exercise of all outstanding securities convertible or exchangeable into common shares). |
| (11) | Currently registered in the name of 9389-1034 Québec Inc., of which CDP Investissements Inc. is a shareholder. Prior to the closing of this offering, 9389-1034 Québec Inc. will be liquidated and such common shares will be distributed to and registered in the name of CDP Investissements Inc. 9389-1034 Québec Inc. currently holds an aggregate of 406,933 Class A common shares in the capital of the Company. |
| (12) | Upper Invest Ltd. is held by Barkis Trust. Barkis Trust is controlled by Clare Thorpe, who may be deemed to beneficially own the common shares held by Upper Invest Ltd. The mailing address of Clare Thorpe, c/o Upper Invest Ltd., and Upper Invest Ltd. is Frances House, Sir William Place, St Peter Port, Guernsey, GY1 3DR. On a fully diluted basis, such shareholder would hold 15,681,860 common shares (or 15,681,860 common shares if the underwriters’ option is exercised in full), representing 7% (or 7% if the underwriters’ option is exercised in full) of outstanding common shares (assuming the full exercise of all outstanding securities convertible or exchangeable into common shares). |
188
Table of Contents
DESCRIPTION OF CERTAIN INDEBTEDNESS
The following is a summary of the material provisions relating to our material indebtedness. The following summary does not purport to be complete and is subject to, and qualified in its entirety by reference to, the provisions of the corresponding agreement or instrument, including the definitions of certain terms therein that are not otherwise defined in this prospectus. You should refer to the relevant agreement or instrument for additional information, copies of which will be filed with the SEC once available.
Credit Agreement
Overview
On December 21, 2018, certain subsidiaries of Knowlton Development Corporation, Inc. entered into the Credit Agreement providing for the Revolving Facility and the Term Loans, originally in aggregate principal amounts of $75.0 million and $525.0 million, respectively.
On July 1, 2021, (i) Knowlton Development Holdco, Inc. (“Holdings”), amalgamated under the laws of British Columbia (the “Amalgamation”) with Knowlton Development Parent, Inc. (“Parent”), its parent company, and continued as one corporation named Knowlton Development Corporation, Inc. and (ii) Knowlton Development Corporation, Inc. entered into an acknowledgement agreement, pursuant to which Knowlton Development Corporation, Inc. agreed that (i) it was bound by all obligations of Holdings and Parent under and as set forth in the Credit Agreement, and (ii) all guarantees and security interests entered into by Holdings or Parent prior to the Amalgamation continued in full force and effect and were binding upon Knowlton Development Corporation, Inc., including the pledge by Knowlton Development Corporation, Inc. of 100% of the equity interests held by Knowlton Development Corporation, Inc. in KDC Opco.
The proceeds of the 2021 Revolver Increase and 2021 Term Loan Increase, together with amounts funded from cash on the balance sheet, were used in connection with the Distribution Financing Transactions and to pay transaction expenses related thereto.
Interest Rate
The interest rates applicable to the loans under the Credit Agreement are determined as described below:
(i) in the case of Revolving Loans denominated in U.S. dollars only and bearing interest at a rate determined by reference to: (1) the “ABR,” which is defined as the highest of (a) the Federal Funds Rate as of such day plus 50 basis points, (b) the published LIBO Rate for a one-month period plus 100 basis points and (c) the rate per annum quoted by the Wall Street Journal as the “Prime Rate” in the United States, provided that in no event shall the ABR be less than 0 basis points, plus (2) in each case, a rate per annum based on the First Lien Leverage Ratio (as defined in the Credit Agreement) as of the last day of the most recently ended four-fiscal quarter period equal to (x) if the First Lien Leverage Ratio is greater than 4.50:1.00, 225 basis points, (y) if the First Lien Leverage Ratio is less than or equal to 4.50:1.00 and greater than 4.00:1.00, 200 basis points or (z) if the First Lien Leverage Ratio is less than or equal to 4.00:1.00, 175 basis points;
(ii) in the case of Revolving Loans denominated in Canadian dollars only and bearing interest at an annual rate determined by reference to: (1) the “Canadian Prime Rate,” which is defined as the greater of (a) the rate per annum publicly announced by The Toronto-Dominion Bank as its prime rate, and (b) the one-month BA Rate (as defined below) plus 100 basis points, plus (2) in each case, a rate per annum based on the First Lien Leverage Ratio as of the last day of the most recently ended four-fiscal quarter period equal to (x) if the First Lien Leverage Ratio is greater than 4.50:1.00, 225 basis points, (y) if the First Lien Leverage Ratio is less than or equal to 4.50:1.00 and greater than 4.00:1.00, 200 basis points or (z) if the First Lien Leverage Ratio is less than or equal to 4.00:1.00, 175 basis points;
189
Table of Contents
(iii) in the case of Revolving Loans denominated in U.S. dollars only and bearing interest at a rate determined by reference to: (1) the “LIBO Rate,” which is defined as the published LIBO Rate for the relevant interest period, provided that in no event shall the LIBO Rate be less than 0 basis points, plus (2) in each case, a rate per annum based on the First Lien Leverage Ratio as of the last day of the most recently ended four-fiscal quarter period equal to (x) if the First Lien Leverage Ratio is greater than 4.50:1.00, 325 basis points, (y) if the First Lien Leverage Ratio is less than or equal to 4.50:1.00 and greater than 4.00:1.00, 300 basis points or (z) if the First Lien Leverage Ratio is less than or equal to 4.00:1.00, 275 basis points;
(iv) in the case of Revolving Loans denominated in Canadian dollars only and bearing interest at a rate determined by reference to: (1) the “BA Rate,” which is defined as the one-month rate for Canadian dollar denominated banks’ acceptances, for the relevant period plus 100 basis points, plus (2) in each case, a rate per annum based on the First Lien Leverage Ratio as of the last day of the most recently ended four-fiscal quarter period equal to (x) if the First Lien Leverage Ratio is greater than 4.50:1.00, 325 basis points, (y) if the First Lien Leverage Ratio is less than or equal to 4.50:1.00 and greater than 4.00:1.00, 300 basis points or (z) if the First Lien Leverage Ratio is less than or equal to 4.00:1.00, 275 basis points;
(v) in the case of Term Loans denominated in U.S. Dollars and bearing interest at an annual rate determined by reference to (A) the LIBO Rate, the LIBO Rate for the relevant period plus 375 basis points or (B) the ABR, the ABR plus 275 basis points; and
(vi) in the case of the Euro Term Loan, at an annual rate equal to the published euro interbank offered rate for the relevant interest period plus 500 basis points.
Guarantees and Security
The obligations under the Credit Agreement are guaranteed by KDC Opco (for the purposes of this section, the “Canadian Borrower”), KDC US Holdings, Inc. (the “U.S. Borrower” and, together with the Canadian Borrower, each a “Borrower”), the Company and the wholly owned subsidiaries of each Borrower other than certain excluded subsidiaries. The obligations under the Credit Agreement are secured by a first priority security interest in substantially all of the existing and future property and assets of the Company, the Borrowers and each other guarantor named therein, subject to customary exceptions.
Prepayments and Amortization
Loans under the Credit Agreement may be voluntarily prepaid in whole, or in part, in each case, without premium or penalty, subject to certain customary conditions.
Subject to certain customary exceptions, the Credit Agreement requires mandatory prepayments, but not permanent reductions of commitments thereunder, from excess cash flow, asset sales (subject to customary reinvestment rights), and the incurrence of other indebtedness not otherwise permitted under the Credit Agreement.
Principal repayments of the Term Loans of $2.3 million and €1.4 million are required quarterly (although such payments may be reduced from time to time as a result of the application of prepayments and repurchases or increased of as a result of any increase in the amount thereof, in each case in accordance with the Credit Agreement). There is no scheduled amortization under the Revolving Facility.
Restrictive Covenants and Other Matters
The Credit Agreement contains affirmative and negative covenants that are customary for financings of this type, including, among others, covenants that restrict incurrence of indebtedness, incurrence of liens, further negative pledges, restricted payments, subsidiary distributions, investments, fundamental changes, dispositions of assets, sale and lease-back transactions, and transactions with affiliates.
190
Table of Contents
The Revolving Facility also includes a springing 7.75:1.00 First Lien Leverage Ratio financial maintenance covenant that is tested on the last day of each fiscal quarter only if the outstanding Revolving Loans and certain other credit extensions under the Revolving Facility exceed 35% of the aggregate amount of the revolving credit commitments thereunder, subject to customary exclusions and conditions.
The Credit Agreement also includes customary events of default, including upon the occurrence of a change of control.
Revolving Facility
The Revolving Facility was established in the Credit Agreement in an original principal amount of $75.0 million, which was increased by $50.0 million on January 23, 2020, by an additional $25.0 million on July 28, 2020 and by an additional $25.0 million on December 4, 2020. On January 27, 2021, in connection with the Distribution Financing Transactions, the Company entered into the 2021 Revolver Increase. The Company further increased the commitments under the Revolving Facility by another $10.0 million on February 24, 2021. As of July 31, 2021, availability under the Revolving Facility was $99.1 million net of $253.5 million of borrowings and $2.4 million of letters of credit outstanding. The Revolving Facility will mature on December 21, 2023.
Term Loans
The First Lien Term Loan was provided for in the Credit Agreement in an original principal amount of $525.0 million, which was increased by $105.0 million on August 22, 2019 and again by an additional $300.0 million on January 23, 2020. The increases were used to repay borrowings under the Revolving Facility in connection with the Alkos and Swallowfield acquisitions and the HCT acquisition, respectively. On January 29, 2020, the outstanding Term Loans were replaced by new Term Loans resulting in a decrease in the interest rate on the outstanding Term Loans. Another incremental increase of $500.0 million occurred on April 30, 2020, which was used to fund a portion of the acquisition of 100% of the equity interests in Zobele. The Company entered into the Euro Term Loan, which was used to prepay $500.0 million of the First Lien Term Loan. On January 27, 2021, in connection with the Distribution Financing Transactions, the Company entered into the 2021 Term Loan Increase. The Term Loans will mature on December 21, 2025. As of July 31, 2021 and April 30, 2021, the effective interest rate on the First Lien Term Loan was 4.837%, and the effective interest rates on the Euro Term Loan were 5.939% and 5.937%, respectively.
191
Table of Contents
General
The following is a summary of the material terms of our share capital, as set forth in our articles, as the same will be effective at the time of the consummation of this offering, and certain related sections of the BCBCA. The following summary is subject to, and is qualified in its entirety by reference to, the provisions of our articles and the applicable provisions of the BCBCA. You may obtain copies of our articles as described under “Where You Can Find More Information” in this prospectus.
Share Capital Amendments
In connection with and prior to the consummation of this offering, we will amend and restate our articles to, among other things, alter the identifying name of, and modify the rights and restrictions attached to the Class A common shares and the Class B common shares so that they will be named and bear the rights and restrictions attached to the common shares as described herein, authorize an unlimited number of preferred shares, issuable in series, and provide for other changes as described herein. In connection with the closing of this offering, we will also effect a 1-for-115 subdivision of each of our outstanding common shares. All such changes to our articles are referred to in this prospectus as the “Share Capital Amendments.”
Authorized Share Capital
As of September 14, 2021, we had issued and outstanding:
| • | 1,353,183 Class A common shares held by three (3) shareholders of record; and |
| • | 16,541 Class B common shares held by fourteen (14) shareholders of record. |
At the time of the consummation of this offering, our share capital will consist of an unlimited number of common shares, without par value, and an unlimited number of preferred shares, issuable in series. Following the consummation of this offering, based on shares outstanding as of September 14, 2021, 214,661,117 common shares (or 223,232,545 common shares if the underwriters exercise their option to purchase additional common shares from us in full) and no preferred shares will be outstanding.
Common Shares
Holders of our common shares are entitled to one vote per share on all matters upon which holders of shares are entitled to vote. Subject to the prior rights of the holders of our preferred shares, the holders of our common shares are entitled to receive dividends as and when declared by our board of directors. See the section entitled “Dividend Policy.” Subject to the prior payment to the holders of our preferred shares, in the event of our liquidation, dissolution or winding-up or other distribution of our assets among our shareholders, the holders of our common shares are entitled to share pro rata in the distribution of the balance of our assets. Holders of common shares have no pre-emptive or conversion or exchange rights or other subscription rights. There are no redemption, retraction, purchase for cancellation or surrender provisions or sinking or purchase fund provisions applicable to our common shares. There is no provision in our articles requiring holders of common shares to contribute additional capital, or permitting or restricting the issuance of additional securities or any other material restrictions. The special rights or restrictions attached to the common shares are subject to and may be adversely affected by, the rights attached to any series of preferred shares that we may designate in the future.
Preferred Shares
We will be authorized to issue an unlimited number of preferred shares in one or more series. Accordingly, our board of directors is authorized, without shareholder approval but subject to the provisions of the BCBCA, to
192
Table of Contents
determine the maximum number of shares of each series, create an identifying name for each series and attach such special rights or restrictions, including dividend, liquidation and voting rights, as our board of directors may determine, and such special rights or restrictions, including dividend, liquidation and voting rights, may be superior to those of the common shares. The issuance of preferred shares, while providing flexibility in connection with possible acquisitions and other corporate purposes, could, among other things, have the effect of delaying, deferring or discouraging potential acquisition proposals and might adversely affect the market price of our common shares and the voting and other rights of the holders of common shares. We have no current plan to issue any preferred shares.
Certain Important Provisions of our Articles and the BCBCA
The following is a summary of certain important provisions of our articles and certain related sections of the BCBCA. Please note that this is only a summary and is not intended to be exhaustive. This summary is subject to, and is qualified in its entirety by reference to, the provisions of our articles and the BCBCA.
In addition, the Shareholders’ Agreement to be entered into with certain of our shareholders will provide certain rights to shareholders party thereto. See “Certain Relationships and Related Party Transactions—Shareholders’ Agreement.”
Stated Objects or Purposes
Our articles do not contain stated objects or purposes and do not place any limitations on the business that we may carry on.
Directors
Power to vote on matters in which a director is materially interested. Under the BCBCA, a director who has a material interest in a contract or transaction, whether made or proposed, that is material to us, must disclose such interest to us, subject to certain exceptions such as if the contract or transaction: (i) is an arrangement by way of security granted by us for money loaned to, or obligations undertaken by, the director, or a person in whom the director has a material interest, for our benefit or for one of our affiliates’ benefit; (ii) relates to an indemnity or insurance permitted under the BCBCA; (iii) relates to the remuneration of the director in his or her capacity as director, officer, employee or agent of our company or of one of our affiliates; (iv) relates to a loan to our company and the director, or a person in whom the director has a material interest, is the guarantor of some or all of the loan; or (v) is with a corporation that is affiliated to us and the director is also a director or senior officer of that corporation or an affiliate of that corporation.
A director who holds such disclosable interest in respect of any material contract or transaction into which we have entered or propose to enter may be required to absent himself or herself from the meeting while discussions and voting with respect to the matter are taking place. A director who holds a disclosable interest may also be liable to account to us for any profit that accrues to the director under or as a result of a contract or transaction in which the director holds a disclosable interest, unless the contract or transaction is: (i) approved by the other directors or by a special resolution of the shareholders, or (ii) the contract or transaction was entered into before the individual became a director, the disclosable interest was disclosed to the other directors or shareholders and the director who holds the disclosable interest does not vote on any decision or resolution touching on the contract or transaction. Directors will also be required to comply with certain other relevant provisions of the BCBCA regarding conflicts of interest.
Directors’ power to determine the remuneration of directors. The remuneration of our directors, if any, may be determined by our directors subject to our articles. The remuneration may be in addition to any salary or other remuneration paid to any of our employees (including executive officers) who are also directors.
193
Table of Contents
Number of shares required to be owned by a director. Neither our articles nor the BCBCA provide that a director is required to hold any of our shares as a qualification for holding his or her office. Our board of directors has discretion to prescribe minimum share ownership requirements for directors.
Shareholder Meetings
Subject to applicable exchange requirements, we must hold a general meeting of our shareholders at least once every year at a time and place determined by our board of directors, provided that the meeting must not be held later than 15 months after the preceding annual general meeting. A meeting of our shareholders may be held anywhere in or outside British Columbia. The board may also determine that a meeting of shareholders may be held entirely by means of telephone, electronic or other communications facilities that permit all participants to communicate with each other during the meeting.
A notice to convene a meeting, specifying the date, time and location of the meeting, and, where a meeting is to consider special business, the general nature of the special business must be sent to each shareholder entitled to attend the meeting and to each director not less than 21 days prior to the meeting, although, as a result of applicable securities laws, the minimum time for notice is effectively longer in most circumstances. Under the BCBCA, shareholders entitled to notice of a meeting may waive or reduce the period of notice for that meeting, provided applicable securities laws are met. The accidental omission to send notice of any meeting of shareholders to, or the non-receipt of any notice by, any person entitled to notice does not invalidate any proceedings at that meeting.
A quorum for meetings of shareholders is present if shareholders who, in the aggregate, hold at least 331⁄3% of the issued shares entitled to vote at the meeting, are present in person or represented by proxy at the meeting. If a quorum is not present at the opening of any meeting of shareholders, the meeting stands adjourned to the same day in the next week at the same time and place, unless the meeting was requisitioned by shareholders, in which case the meeting is dissolved.
Holders of our common shares are entitled to attend and vote at meetings of our shareholders except meetings at which only holders of preferred shares are entitled to vote. Except as otherwise provided with respect to any particular series of preferred shares, and except as otherwise required by law, the holders of our preferred shares are not entitled as a class to receive notice of, or to attend or vote at any meetings of our shareholders. Our directors, officers, auditor and any other persons invited by our directors or the chair of the meeting are entitled to attend any meeting of our shareholders but will not be counted in the quorum or be entitled to vote at the meeting unless he or she is a shareholder or proxyholder entitled to vote at the meeting.
Shareholder Proposals and Advance Notice Procedures
Under the BCBCA, qualified shareholders holding at least (i) one percent (1%) of our issued voting shares or (ii) voting shares with a fair market value in excess of C$2,000 may make proposals for matters to be considered at the annual general meeting of shareholders. Such proposals must be sent to us in advance of any proposed meeting by delivering a timely written notice in proper form to our registered office in accordance with the requirements of the BCBCA. The notice must include information on the business the shareholder intends to bring before the meeting. To be a qualified shareholder, a shareholder must currently be and have been a registered or beneficial owner of at least one share of the company for at least two years before the date of signing the proposal.
We have included certain advance notice provisions with respect to the election of our directors in our articles (the “Advance Notice Provisions”). The Advance Notice Provisions are intended to: (i) facilitate orderly and efficient annual general meetings or, where the need arises, special meetings; (ii) ensure that all shareholders receive adequate notice of board nominations and sufficient information with respect to all nominees; and (iii) allow shareholders to register an informed vote. Only persons who are nominated in accordance with the
194
Table of Contents
Advance Notice Provisions will be eligible for election as directors at any annual meeting of shareholders, or at any special meeting of shareholders if one of the purposes for which the special meeting was called was the election of directors.
Under the Advance Notice Provisions, a shareholder wishing to nominate a director would be required to provide us notice, in the prescribed form, within the prescribed time periods. These time periods include, (i) in the case of an annual meeting of shareholders (including annual and special meetings), not less than 30 days nor more than 65 days prior to the date of the annual meeting of shareholders; provided, that if the first public announcement of the date of the annual meeting of shareholders (the “Notice Date”) is less than 50 days before the meeting date, not later than the close of business on the 10th day following the Notice Date; and (ii) in the case of a special meeting (which is not also an annual meeting) of shareholders called for any purpose which includes electing directors, not later than the close of business on the 15th day following the Notice Date, provided that, in either instance, if notice-and-access (as defined in National Instrument 54-101—Communication with Beneficial Owners of Securities of a Reporting Issuer) is used for delivery of proxy related materials in respect of a meeting described above, and the Notice Date in respect of the meeting is not less than 50 days prior to the date of the applicable meeting, the notice must be received not later than the close of business on the 40th day before the applicable meeting.
These provisions could have the effect of delaying until the next shareholder meeting the nomination of certain persons for director that are favored by the holders of a majority of our outstanding voting securities.
Forum Selection
We have included a forum selection provision in our articles that provides that, unless we consent in writing to the selection of an alternative forum, the Supreme Court of British Columbia, Canada and the appellate courts therefrom, will be the sole and exclusive forum for (i) any derivative action or proceeding brought on our behalf; (ii) any action or proceeding asserting a claim of breach of a fiduciary duty owed by any of our directors, officers, or other employees to us; (iii) any action or proceeding asserting a claim arising pursuant to any provision of the BCBCA or our articles; or (iv) any action or proceeding asserting a claim otherwise related to the relationships among us, our affiliates and their respective shareholders, directors and/or officers, but excluding claims related to our business or the business of such affiliates. The forum selection provision also provides that our securityholders are deemed to have consented to personal jurisdiction of the courts of the Province of British Columbia and to service of process on their counsel in any foreign action initiated in violation of the foregoing provisions.
For claims brought under the Securities Act, Section 22 of the Securities Act creates concurrent jurisdiction for federal and state courts over all claims brought to enforce any duty or liability created by the Securities Act or the rules and regulations thereunder and our articles will provide that the federal district courts of the United States of America will, to the fullest extent permitted by law, be the sole and exclusive forum for resolving any complaint asserting a cause of action arising under the Securities Act (the “Federal Forum Provision”). Application of our Federal Forum Provision means that suits brought by our shareholders to enforce any duty or liability created by the Securities Act must be brought in federal court and cannot be brought in state court.
Section 27 of the Exchange Act creates exclusive federal jurisdiction over all claims brought to enforce any duty or liability created by the Exchange Act or the rules and regulations thereunder. Accordingly, actions by our shareholders to enforce any duty or liability created by the Exchange Act or the rules and regulations thereunder must be brought in federal court and our articles will provide that the federal district courts of the United States will, to the fullest extent permitted by law, be the sole and exclusive forum for resolving any complaint asserting a cause of action arising under the Exchange Act. Our shareholders will not be deemed to have waived our compliance with the federal securities laws and the regulations promulgated thereunder.
195
Table of Contents
The Federal Forum Provision is intended to apply to the fullest extent permitted by law. However, the enforceability of forum selection provisions in the governing documents of other companies has been challenged in legal proceedings, and it is possible that a court could find the Federal Forum Provision to be inapplicable or unenforceable with respect to actions arising under the Securities Act.
Any person or entity purchasing or otherwise acquiring or holding any interest in any of our common shares shall be deemed to have notice of and consented to our forum selection provisions, including the Federal Forum Provision. Additionally, our shareholders cannot waive compliance with the federal securities laws and the rules and regulations thereunder. These provisions may limit our shareholders’ ability to bring a claim in a judicial forum they find favorable for disputes with us or our directors, officers, or other employees, which may discourage lawsuits against us and our directors, officers, and other employees. Alternatively, if a court were to find the choice of forum provision contained in our articles to be inapplicable or unenforceable in an action, we may incur additional costs associated with resolving such action in other jurisdictions, which could harm our business, operating results and financial condition. See “Risk Factors—Our articles will provide that any derivative actions, actions relating to breach of fiduciary duties and other matters relating to our internal affairs will be required to be litigated in Canada, and will contain an exclusive federal forum provision for certain claims under the Securities Act, which could limit your ability to obtain a favorable judicial forum for disputes with us.”
Limitation of Liability and Indemnification
Under the BCBCA, a company may indemnify: (i) a current or former director or officer of that company; (ii) a current or former director or officer of another company if, at the time such individual held such office, such company was an affiliate of the company, or if such individual held such office at the company’s request; or (iii) an individual who, at the request of the company, held, or holds, an equivalent position in another entity (an “indemnifiable person”) against all judgments, penalties or fines, or amounts paid to settle a proceeding or an action, in respect of any civil, criminal, administrative or other legal proceeding or investigative action (whether current, threatened, pending or completed) in which he or she is involved because of that person’s position as an indemnifiable person (an “eligible proceeding”), unless: (i) the individual did not act honestly and in good faith with a view to the best interests of such company or the other entity, as the case may be; or (ii) in the case of a proceeding other than a civil proceeding, the individual did not have reasonable grounds for believing that the individual’s conduct in respect of which proceeding was brought was lawful. A company cannot indemnify an indemnifiable person if it is prohibited from doing so under its articles or by applicable law. A company may pay, as they are incurred in advance of the final disposition of an eligible proceeding, the expenses actually and reasonably incurred by an indemnifiable person in respect of that proceeding, but only if the indemnifiable person has provided an undertaking that, if it is ultimately determined that the payment of expenses was prohibited, the indemnifiable person will repay any amounts advanced. Subject to the aforementioned prohibitions on indemnification, a company must, after the final disposition of an eligible proceeding, pay the expenses actually and reasonably incurred by an indemnifiable person in respect of such eligible proceeding if such indemnifiable person has not been reimbursed for such expenses, and was wholly successful, on the merits or otherwise, in the outcome of such eligible proceeding or was substantially successful on the merits in the outcome of such eligible proceeding. On application of an indemnifiable person or us, a court may make any order the court considers appropriate in respect of an eligible proceeding, including the indemnification of penalties imposed or expenses incurred in any such proceedings and the enforcement of an indemnification agreement. As permitted by the BCBCA, our articles require us to indemnify our directors, officers, former directors or officers (and such individual’s respective heirs and legal representatives) and permit us to indemnify any person to the extent permitted by the BCBCA.
Transfer Agent and Registrar
The transfer agent and registrar for our common shares in the United States is Computershare Trust Company, N.A. at its principal office in New York, New York, and in Canada is Computershare Investor Services Inc. at its principal office in Montréal, Québec.
196
Table of Contents
Ownership and Exchange Controls
There is no limitation imposed by Canadian law or by our articles on the right of a non-resident to hold or vote our common shares, other than discussed below.
Competition Act
Limitations on the ability to acquire and hold our common shares may be imposed by the Competition Act (Canada). This legislation permits the Commissioner of Competition (the “Commissioner”), to review any acquisition or establishment, directly or indirectly, including through the acquisition of shares, of control over or of a significant interest in us. This legislation grants the Commissioner jurisdiction, for up to one year after the acquisition has been substantially completed, to challenge this type of acquisition by seeking a remedial order, including an order to prohibit the acquisition or require divestitures, from the Canadian Competition Tribunal, which may be granted where the Competition Tribunal finds that the acquisition substantially prevents or lessens, or is likely to substantially prevent or lessen, competition.
This legislation also requires any person or persons who intend to acquire more than 20% of our voting shares or, if such person or persons already own more than 20% of our voting shares prior to the acquisition, more than 50% of our voting shares, to file a notification with the Canadian Competition Bureau if certain financial thresholds are exceeded. Where a notification is required, unless an exemption is available, the legislation prohibits completion of the acquisition until the expiration of the applicable statutory waiting period, unless the Commissioner either waives or terminates such waiting period or issues an advance ruling certificate. The Commissioner’s review of a notifiable transaction for substantive competition law considerations may take longer than the statutory waiting period.
Investment Canada Act
The Investment Canada Act requires each “non-Canadian” (as defined in the Investment Canada Act) who acquires “control” of an existing “Canadian business,” to file a notification in prescribed form with the responsible federal government department or departments not later than 30 days after closing, provided the acquisition of control is not a reviewable transaction under the Investment Canada Act. Subject to certain exemptions, a transaction that is reviewable under the Investment Canada Act may not be implemented until an application for review has been filed and the responsible Minister of the federal cabinet has determined that the investment is likely to be of “net benefit to Canada” taking into account certain factors set out in the Investment Canada Act. Under the Investment Canada Act, an investment in our common shares by a non-Canadian who is an investor originating from a country with which Canada has a free trade agreement, including a United States investor, would be reviewable only if it were an investment to acquire control of us pursuant to the Investment Canada Act and our enterprise value (as determined pursuant to the Investment Canada Act and its regulations) was equal to or greater than the amount specified, which is currently C$1.565 billion. For most other investors who are not state-owned enterprises the threshold is currently C$1.043 billion for 2021.
The Investment Canada Act contains various rules to determine if there has been an acquisition of control. Generally, for purposes of determining whether an investor has acquired control of a corporation by acquiring shares, the following general rules apply, subject to certain exceptions: the acquisition of a majority of the undivided ownership interests in the voting shares of the corporation is deemed to be acquisition of control of that corporation; the acquisition of less than a majority, but one-third or more, of the voting shares of a corporation or of an equivalent undivided ownership interest in the voting shares of the corporation is presumed to be acquisition of control of that corporation unless it can be established that, on the acquisition, the corporation is not controlled in fact by the acquirer through the ownership of voting shares; and the acquisition of less than one-third of the voting shares of a corporation or of an equivalent undivided ownership interest in the voting shares of the corporation is deemed not to be acquisition of control of that corporation.
Under the national-security-review regime in the Investment Canada Act, review on a discretionary basis may also be undertaken by the federal government in respect to a much broader range of investments by a
197
Table of Contents
non-Canadian to “acquire, in whole or part, or to establish an entity carrying on all or any part of its operations in Canada.” No financial threshold applies to a national-security review. The relevant test is whether such investment by a non-Canadian could be “injurious to national security.” The responsible ministers have broad discretion to determine whether an investor is a non-Canadian and therefore subject to national-security review. Review on national-security grounds is at the discretion of the responsible ministers, and may occur on a pre- or post-closing basis.
Certain transactions relating to our common shares will generally be exempt from the Investment Canada Act, subject to the federal government’s prerogative to conduct a national-security review, including:
| • | the acquisition of our common shares by a person in the ordinary course of that person’s business as a trader or dealer in securities; |
| • | the acquisition of control of us in connection with the realization of security granted for a loan or other financial assistance and not for any purpose related to the provisions of the Investment Canada Act; and |
| • | the acquisition of control of us by reason of an amalgamation, merger, consolidation or corporate reorganization following which the ultimate direct or indirect control in fact of us, through ownership of our common shares, remains unchanged. |
Undertakings
As a condition to the Acquisition, certain undertakings were given in respect of KDC Opco’s Canadian operations to Innovation, Science and Economic Development Canada for a period of three (3) years from the date of the Acquisition. Such undertakings include maintaining its corporate headquarters and manufacturing facility in the Province of Québec, ensuring that a majority of its senior management team is Canadian, maintaining a certain level of employment in Canada, making capital and R&D expenditures to maintain and grow its business in Canada, continuing to use competitive suppliers of goods and services in Canada and increasing its annual charitable donations in Canada. Such undertakings expire on December 21, 2021. See “Risk Factors—Risks Related to Our Common Shares and this Offering—Provisions in our articles, Canadian law and certain restrictive covenants applicable to us could make an acquisition of us, which may be beneficial to our shareholders, more difficult and may prevent attempts by our shareholders to replace or remove our current management and/or limit the market price of our common shares.”
Other
There is no law, governmental decree or regulation in Canada that restricts the export or import of capital, or that would affect the remittance of dividends (if any) or other payments by us to non-resident holders of our common shares, other than withholding tax requirements.
Listing
Our common shares have been approved for listing on the NYSE and we have applied to list our common shares on the TSX, both under the symbol “KDC.” Our common shares will trade in U.S. dollars on the NYSE and in Canadian dollars on the TSX. There is no assurance that the TSX will approve our listing application, and any such listing of our common shares on the TSX will be conditional upon us fulfilling all of the listing requirements and conditions of the TSX.
Options to Purchase Securities
We have previously granted options under the Stock Option Plan, which will be amended and restated as at closing of this offering. The following table shows the aggregate number of options to purchase common shares outstanding as at July 31, 2021, assuming completion of the Share Capital Amendments, as a result of which all
198
Table of Contents
outstanding options of the Company will become options to purchase common shares. See “Description of Share Capital—Share Capital Amendments” and “Executive and Director Compensation—Description of Equity Incentive Plans—Stock Option Plan.”
In connection with the Distribution Financing Transactions, we made certain adjustments in accordance with the Stock Option Plan, including a reduction of the exercise price of all stock options. See “Management’s Discussion and Analysis of Financial Condition and Results of Operations—Liquidity and Capital Resources—Distribution Financing Transactions” and “Executive and Director Compensation—Elements of Compensation—Distribution Financing Transactions.”
| Number of Options |
Exercise Price of Option(1) ($) |
Expiration Date | ||||||||
| All of our executive officers and past executive officers, as a group (7 in total) |
5,251,590 | $ | 8.12 | From April 26, 2029 to November 11, 2030 | ||||||
| All of our directors and past directors who are not also executive officers, as a group (6 in total) |
165,025 | $ | 9.03 | From May 3, 2029 to March 16, 2031 | ||||||
| All of our employees and past employees, as a group (113 in total) |
8,747,590 | $ | 8.92 | From May 3, 2029 to March 30, 2031 | ||||||
| (1) | Represents the weighted-average exercise price of all outstanding options to purchase common shares, whether vested or unvested. |
Prior Sales
The table below summarizes the issuance by Knowlton Development Corporation, Inc. of common shares or securities convertible or exchangeable into common shares during the 12-month period preceding the date of this prospectus, including on an as adjusted basis to reflect the Share Capital Amendments and the reduction in the exercise price of options under the Stock Option Plan in connection with the Distribution Financing Transactions, as described under “Description of Share Capital—Share Capital Amendments” and “Executive and Director Compensation—Elements of Compensation—Distribution Financing Transactions.”
| As adjusted |
||||||||||||||||||||
| Date |
Type of Security |
Number of Securities |
Offering/ Issuance/ Exercise Price per Security |
Type of Security |
Number of Securities |
Offering/ Issuance/ Exercise Price per Security |
||||||||||||||
| September 16, 2020 |
Class A common shares | 84,326 | $ | 1,250 | Common shares | 9,697,490 | $ | 10.87 | ||||||||||||
| September 16, 2020 |
Class A common shares | 35,674 | $ | 1,250 | Common shares | 4,102,510 | $ | 10.87 | ||||||||||||
| September 24, 2020 |
Options to purchase Class B common shares | 1,643 | $ | 1,250 | Options to purchase common shares | 188,945 | $ | 10.87 | ||||||||||||
| September 27, 2020 |
Options to purchase Class B common shares | 1,233 | $ | 1,250 | Options to purchase common shares | 141,795 | $ | 10.87 | ||||||||||||
| November 11, 2020 |
Options to purchase Class B common shares | 15,599 | $ | 1,600 | Options to purchase common shares | 1,793,885 | $ | 13.91 | ||||||||||||
| March 16, 2021 |
Options to purchase Class B common shares | 4,322 | $ | 1,407 | Options to purchase common shares | 497,030 | $ | 12.23 | ||||||||||||
| March 19, 2021 |
Class B common shares | 54 | $ | 806.60 | Common shares | 6,210 | $ | 7.01 | ||||||||||||
| March 19, 2021 |
Class B common shares | 657 | $ | 806.60 | Common shares | 75,555 | $ | 7.01 | ||||||||||||
| March 30, 2021 |
Options to purchase Class B common shares | 4,065 | $ | 1,457 | Options to purchase common shares | 467,475 | $ | 12.67 | ||||||||||||
Comparison of British Columbia Law and Delaware Law
We are governed by the BCBCA. The following discussion summarizes material differences between the rights of holders of our common shares and the rights of holders of the common stock of a typical corporation
199
Table of Contents
incorporated under the laws of the state of Delaware, which result from differences in governing documents and the laws of British Columbia and Delaware. This summary is qualified in its entirety by reference to the Delaware General Corporation Law, or the DGCL, the BCBCA, and our articles.
| Capital Structure | ||
| Delaware Under the DGCL, the certificate of incorporation must set forth the total number of shares of stock which the corporation shall have authority to issue and the par value of each of such shares, or a statement that the shares are to be without par value. |
British Columbia Under the BCBCA, the notice of articles must describe the name of each class or series and the kind of shares of which that class or series consists, set out the maximum number of shares of each class or series that the company is authorized to issue or state that there is no maximum number, set out the par value of the shares or identify shares without par value, and set out whether special rights or restrictions attach to each class or series of shares. | |
| Dividends | ||
| Delaware The DGCL generally provides that, subject to certain restrictions, the directors of a corporation may declare and pay dividends upon the shares of its capital stock either out of the corporation’s surplus or, if there is no such surplus, out of its net profits for the fiscal year in which the dividend is declared and/or the preceding fiscal year. Further, the holders of preferred or special stock of any class or series may be entitled to receive dividends at such rates, on such conditions and at such times as stated in the certificate of incorporation. |
British Columbia Under the BCBCA, a company may pay a dividend in money or other property unless there are reasonable grounds for believing that the company is insolvent, or the payment of the dividend would render the company insolvent. The right to share or participate by way of dividend in the income of a company is automatic unless this right is otherwise excluded.
The BCBCA provides that no special rights or restrictions attached to a series of any class of shares confer on the series a priority in respect of dividends or return of capital over any other series of shares of the same class. | |
| Repurchases and Redemptions | ||
| Delaware Under the DGCL, a company can repurchase or redeem its shares out of its surplus, but generally cannot do so if doing so would impair the company’s ability to pay its debts. |
British Columbia Under the BCBCA, the purchase or other acquisition by a company of its shares is generally subject to solvency tests similar to those applicable to the payment of dividends (as set out above). Our company is permitted, under its articles, to acquire any of its shares, subject to the special rights and restrictions attached to such class or series of shares and the approval of its board of directors.
Under the BCBCA, subject to solvency tests similar to those applicable to the payment of dividends (as set out above), a company may redeem, on the terms and in the manner provided in its articles, any of its shares that has a right of redemption attached to it. Our common shares are not subject to a right of redemption. | |
| Number and Election of Directors | ||
| Delaware Under the DGCL, the board of directors must consist of at least one person, and the number of |
British Columbia Under the BCBCA, public companies must have at least three directors. Our articles provide that the | |
200
Table of Contents
| directors is generally fixed by, or in the manner provided in, the bylaws of the corporation, unless the certificate of incorporation fixes the number of directors, in which case a change in the number of directors shall be made only by amendment of the certificate. The board of directors may be divided into three classes of directors, with one-third of each class subject to election by the stockholders each year after such classification becomes effective. |
number of directors may be determined by a board resolution or an ordinary resolution of the shareholders. | |
| Constitution and Residency of Directors | ||
| Delaware The DGCL does not place any residency restrictions on the boards of directors. |
British Columbia The BCBCA does not place any residency restrictions on the boards of directors. | |
| Removal of Directors | ||
| Delaware Under the DGCL, any or all directors may be removed with or without cause by the holders of a majority of shares entitled to vote at an election of directors unless the certificate of incorporation otherwise provides or in certain other circumstances if the corporation has cumulative voting. |
British Columbia Our articles allow for the removal of a director by special resolution of the shareholders (as described below under “Shareholder Quorum and Vote Requirements”) or by the board of directors in special circumstances. | |
| Vacancies on the Board of Directors | ||
| Delaware Under the DGCL, vacancies and newly created directorships resulting from an increase in the authorized number of directors, may be filled by a majority of the directors then in office, although less than a quorum, or by a sole remaining director. |
British Columbia Under the BCBCA and our articles, a vacancy among the directors created by the removal of a director may be filled by the shareholders at the meeting at which the director is removed or, if not filled by the shareholders at such meeting, then the board may appoint a director to fill that vacancy. In the case of a casual vacancy, the remaining directors may fill the vacancy. Under the BCBCA and our articles, directors may increase the size of the board of directors by one-third of the number of current directors.
Under the BCBCA and our articles, if as a result of one or more vacancies, the number of directors in office falls below the number required for a quorum, the remaining directors may appoint as directors the number of individuals that, when added to the number of remaining directors, will constitute a quorum and/or call a shareholders’ meeting to fill any or all vacancies among directors and to conduct such other business that may be dealt with at that meeting, but must not take any other action until a quorum is obtained. | |
| Quorum for Board Meetings | ||
| Delaware Under the DGCL, a majority of the total number of directors shall constitute a quorum for the |
British Columbia Our articles provide that the quorum necessary for the transaction of the business at a meeting of the | |
201
Table of Contents
| transaction of business unless the certificate or bylaws require a greater number. The bylaws may lower the number required for a quorum to one-third the number of directors, but no less. |
board may be set by the board to a number not less than a majority of the number of directors in office or such greater number as the directors may determine from time to time and, if not so set, is deemed to be set at a majority of the number of directors then in office. | |
| Transactions with Directors and Officers | ||
| Delaware The DGCL generally provides that no transaction between a corporation and one or more of its directors or officers, or between a corporation and any other corporation or other organization in which one or more of its directors or officers, are directors or officers, or have a financial interest, shall be void or voidable solely for this reason, or solely because the director or officer is present at or participates in the meeting of the board or committee which authorizes the transaction, or solely because any such director’s or officer’s votes are counted for such purpose, if (i) the material facts as to the director’s or officer’s interest and as to the transaction are known to the board of directors or the committee, and the board or committee in good faith authorizes the transaction by the affirmative votes of a majority of the disinterested directors, even though the disinterested directors be less than a quorum; (ii) the material facts as to the director’s or officer’s interest and as to the transaction are disclosed or are known to the stockholders entitled to vote thereon, and the transaction is specifically approved in good faith by vote of the stockholders; or (iii) the transaction is fair as to the corporation as of the time it is authorized, approved or ratified, by the board of directors, a committee or the stockholders. |
British Columbia Subject to certain exceptions, the BCBCA provides that a director or senior officer of a company holds a disclosable interest in a contract or transaction if the contract or transaction is material to the company, the company has entered, or proposes to enter, into the contract or transaction, and either of the following applies to the director or senior officer: (i) the director or senior officer has a material interest in the contract; or (ii) the director or senior officer is a director or senior officer of, or has a material interest in, a person who has a material interest in the contract or transaction.
The BCBCA provides that a director or senior officer may not be held accountable for profits or gains realized from a contract or transaction with the company in which he or she has a disclosable interest, provided that the director or senior officer has made appropriate disclosure of his or her interest in the contract or transaction and the contract or transaction is then approved by a directors’ resolution or a special resolution of the shareholders.
An interested director is generally not entitled to vote on the directors’ resolution, but can vote his or her shares on the special resolution of the shareholders, to approve the contract or transaction and is entitled to be counted in the quorum for the directors’ meeting. Unless the director or senior officer properly discloses his or her interest and has the contract or transaction properly approved, the director or senior officer must account to the company for any profit he or she makes as a result of the contract or transaction.
Directors and senior officers need only disclose a contract or transaction when his or her interest in the contract or transaction is a disclosable interest. | |
| Limitation on Liability of Directors | ||
| Delaware The DGCL permits a corporation to include a provision in its certificate of incorporation eliminating or limiting the personal liability of a director to the corporation or its stockholders for |
British Columbia Under the BCBCA, a director or officer of a company must: (i) act honestly and in good faith with a view to the best interests of the company; (ii) exercise the care, diligence and skill that a | |
202
Table of Contents
| monetary damages for a breach of the director’s fiduciary duty as a director, except for liability:
• for breach of the director’s duty of loyalty to the corporation or its stockholders ;
• for acts or omissions not in good faith or which involve intentional misconduct or a knowing violation of the law;
• under Section 174 of the DGCL, which concerns unlawful payment of dividends, stock purchases or redemptions; or
• for any transaction from which the director derived an improper personal benefit. |
reasonably prudent individual would exercise in comparable circumstances; (iii) act in accordance with the BCBCA and the regulations thereunder; and (iv) subject to (i) to (iii), act in accordance with the articles of the company. These statutory duties are in addition to duties under common law and equity.
No provision in a contract or the articles of a company may relieve a director or officer of a company from the above duties.
Under the BCBCA, a director is not liable for certain acts if the director has otherwise complied with his or her duties and relied, in good faith, on (i) financial statements of the company represented to the director by an officer of the company or in a written report of the auditor of the company to fairly reflect the financial position of the company, (ii) a written report of a lawyer, accountant, engineer, appraiser or other person whose profession lends credibility to a statement made by that person, (iii) a statement of fact represented to the director by an officer of the company to be correct, or (iv) any record, information or representation that the court considers provides reasonable grounds for the actions of the director, whether or not that record was forged, fraudulently made or inaccurate or that information or representation was fraudulently made or inaccurate. Further, a director is not liable if the director did not know and could not reasonably have known that the act done by the director or authorized by the resolution voted for or consented to by the director was contrary to the BCBCA. | |
| Indemnification of Directors and Officers | ||
| Delaware Under the DGCL, a corporation may indemnify any person who is made a party to any third-party action, suit or proceeding on account of being a director, officer, employee or agent of the corporation (or was serving at the request of the corporation in such capacity for another corporation, partnership, joint venture, trust or other enterprise) against expenses, including attorney’s fees, judgments, fines and amounts paid in settlement actually and reasonably incurred by him or her in connection with the action, suit or proceeding through, among other things, a majority |
British Columbia Under the BCBCA, a company may indemnify an indemnifiable person (as defined under “Limitation of Liability and Indemnification” above) against all judgments, penalties or fines, or amounts paid to settle a proceeding or an action, in respect of any eligible proceeding (as defined under “Limitation of Liability and Indemnification” above), unless: (i) them individual did not act honestly and in good faith with a view to the best interests of such company or the other entity, as the case may be; or (ii) in the case of a proceeding other than a civil proceeding, the individual did not have reasonable grounds for believing that the individual’s conduct | |
203
Table of Contents
| vote of a quorum consisting of directors who were not parties to the suit or proceeding, if the person:
• acted in good faith and in a manner he or she reasonably believed to be in or not opposed to the best interests of the corporation; and
• in a criminal proceeding, had no reasonable cause to believe his or her conduct was unlawful.
The DGCL permits indemnification for derivative suits against expenses (including legal fees) if the person acted in good faith and in a manner the person reasonably believed to be in or not opposed to the best interests of the corporation, and only if the person is not found liable, unless a court determines the person is fairly and reasonably entitled to the indemnification. |
was lawful. A company cannot indemnify an indemnifiable person if it is prohibited from doing so under its articles or applicable law. In addition, a company must not indemnify an indemnifiable person in proceedings brought against the indemnifiable person by or on behalf of the company or an associated company.
A company may pay, as they are incurred in advance of the final disposition of an eligible proceeding, the expenses actually and reasonably incurred by an indemnifiable person in respect of that proceeding only if the indemnifiable person has provided an undertaking that, if it is ultimately determined that the payment of expenses was prohibited, the indemnifiable person will repay any amounts advanced.
Subject to the aforementioned prohibitions on indemnification, a company must, after the final disposition of an eligible proceeding, pay the expenses actually and reasonably incurred by an indemnifiable person in respect of such eligible proceeding if such indemnifiable person has not been reimbursed for such expenses, and was wholly successful, on the merits or otherwise, in the outcome of such eligible proceeding or was substantially successful on the merits in the outcome of such eligible proceeding. On application from an indemnifiable person, a court may make any order the court considers appropriate in respect of an eligible proceeding, including the indemnification of penalties imposed or expenses incurred in any such proceedings and the enforcement of an indemnification agreement. | |
| As permitted by the BCBCA, our articles require us to indemnify our directors, officers, former directors or officers (and such individual’s respective heirs and legal representatives) and permit us to indemnify any person to the extent permitted by the BCBCA. | ||
| Call and Notice of Shareholder Meetings | ||
| Delaware Under the DGCL, an annual or special stockholder meeting is held on such date, at such time and at such place as may be designated by the board of directors or any other person authorized to call such meeting under the corporation’s certificate of incorporation or bylaws. If an annual meeting for election of directors is not held on the date designated or an action by written consent to elect directors in lieu of an annual meeting has not been |
British Columbia Under the BCBCA, an annual general meeting must be held at least once each calendar year and not more than 15 months after the last annual general meeting.
Under the BCBCA, the holders of not less than five percent (5%) of the issued shares of a company that carry the right to vote at a general meeting may requisition that the directors call a meeting of shareholders for the purpose of transacting any | |
204
Table of Contents
| taken within 30 days after the date designated for the annual meeting, or if no date has been designated, for a period of 13 months after the later of the last annual meeting or the last action by written consent to elect directors in lieu of an annual meeting, the Delaware Court of Chancery may summarily order a meeting to be held upon the application of any stockholder or director.
Special meetings of the stockholders may be called by the board of directors or by such person or persons as may be authorized by the certificate of incorporation or by the bylaws. |
business that may be transacted at a general meeting. Upon receiving a requisition that complies with the technical requirements set out in the BCBCA, the directors must, subject to certain limited exceptions, call a meeting of shareholders to be held not more than four months after receiving the requisition. If the directors do not call such a meeting within 21 days after receiving the requisition, the requisitioning shareholders or any of them holding in aggregate not less than 2.5% of the issued shares of the company that carry the right to vote at general meetings may call the meeting. | |
| Shareholder Action by Written Consent | ||
| Delaware Under the DGCL, a majority of the stockholders of a corporation may act by written consent without a meeting unless such action is prohibited by the corporation’s certificate of incorporation. |
British Columbia Although it is not customary for public companies to do so, under the BCBCA, shareholder action without a meeting may be taken by a consent resolution of shareholders provided that it satisfies the thresholds for approval in a company’s articles, the BCBCA and the regulations thereunder. A consent resolution is as valid and effective as if it were a resolution passed at a meeting of shareholders. | |
| Shareholder Nominations and Proposals | ||
| Delaware Under the DGCL, the bylaws of a corporation may include provisions respecting the nomination of directors or proposals by stockholders, including requirements for advance notice to the corporation. |
British Columbia Under the BCBCA, qualified shareholders holding at least one percent (1%) of our issued voting shares or whose shares have a fair market value in excess of C$2,000 in the aggregate may make proposals for matters to be considered at the annual general meeting of shareholders. Such proposals must be sent to us in advance of any proposed meeting by delivering a timely written notice in proper form to our registered office in accordance with the requirements of the BCBCA. The notice must include information on the business the shareholder intends to bring before the meeting. To be a qualified shareholder, a shareholder must currently be and have been a registered or beneficial owner of at least one share of the company for at least two years before the date of signing the proposal.
If the proposal and a written statement in support of the proposal (if any) are submitted at least three months before the anniversary date of the previous annual meeting and the proposal and written statement (if any) meet other specified requirements, | |
205
Table of Contents
| then the company must either set out the proposal, including the names and mailing addresses of the submitting person and supporters and the written statement (if any), in the proxy circular of the company or attach the proposal and written statement thereto.
In certain circumstances, the company may refuse to process a proposal.
We have included Advance Notice Provisions (as defined under “Shareholder Proposals and Advance Notice Procedures” above) in our articles. Under the Advance Notice Provisions, a shareholder wishing to nominate a director would be required to provide us notice, in the prescribed form, within the prescribed time periods. | ||
| Shareholder Quorum and Vote Requirements | ||
| Delaware Under the DGCL, quorum for a stock corporation is a majority of the shares entitled to vote at the meeting unless the certificate of incorporation or bylaws specify a different quorum, but in no event may a quorum be less than one-third of the shares entitled to vote. Unless the DGCL, certificate of incorporation or bylaws provide for a greater vote, |
British Columbia Our articles provide that a quorum for the transaction of business at a meeting of shareholders is present if shareholders who, in the aggregate, hold at least 33 1/3% of the issued shares entitled to be voted at the meeting are present in person or represented by proxy. | |
| generally the required vote under the DGCL is a majority of the shares present in person or represented by proxy, except for the election of directors which requires a plurality of the votes cast. |
An ordinary resolution is a resolution (i) passed at a shareholders’ meeting by a simple majority, or (ii) passed, after being submitted to all of the shareholders holding shares that carry the right to vote, by being consented to in writing by shareholders who, in the aggregate, hold shares carrying at least two-thirds of the votes entitled to be cast on the resolution.
A special resolution is a resolution (i) passed by not less than two-thirds of the votes cast by the shareholders who voted in respect of the resolution at a meeting duly called and held for that purpose, or (ii) passed by being consented to in writing by all shareholders entitled to vote on the resolution. | |
| Amendment of Governing Instruments | ||
| Delaware Amendment of Certificate of Incorporation. Generally, under the DGCL, the affirmative vote of the holders of a majority of the outstanding stock entitled to vote is required to approve a proposed |
British Columbia Under the BCBCA, a company may amend its articles or notice of articles by (i) the type of resolution specified in the BCBCA, (ii) if the BCBCA does not specify a type of resolution, then | |
206
Table of Contents
| amendment to the certificate of incorporation, following the adoption of the amendment by the board of directors of the corporation, provided that the certificate of incorporation may provide for a greater vote. Under the DGCL, holders of outstanding shares of a class or series are entitled to vote separately on an amendment to the certificate of incorporation if the amendment would have certain consequences, including changes that adversely affect the rights and preferences of such class or series.
Amendment of Bylaws. Under the DGCL, after a corporation has received any payment for any of its stock, the power to adopt, amend or repeal bylaws shall be vested in the stockholders entitled to vote; provided, however, that any corporation may, in its certificate of incorporation, provide that bylaws may be adopted, amended or repealed by the board of directors. The fact that such power has been conferred upon the board of directors shall not divest the stockholders of the power nor limit their power to adopt, amend or repeal the bylaws. |
by the type specified in the company’s articles, or (iii) if the company’s articles do not specify a type of resolution, then by special resolution. The BCBCA permits many substantive changes to a company’s articles (such as a change in the company’s authorized share structure or a change in the special rights or restrictions that may be attached to a certain class or series of shares) to be changed by the resolution specified in that company’s articles.
Our articles provide that certain changes to our share structure and any creation or alteration of special rights and restrictions attached to a series or class of shares be done by way of ordinary resolution. However, if a right or special right attached to a class or series of shares would be prejudiced or interfered with by such an alteration, the BCBCA requires that holders of such class or series of shares must approve the alteration by a special separate resolution of those shareholders.
Our articles also provide that the shareholders may from time to time, by ordinary resolution, make any alteration to our notice of articles and articles as permitted by the BCBCA. | |
| Votes on Mergers, Consolidations and Sales of Assets | ||
| Delaware The DGCL provides that, unless otherwise provided in the certificate of incorporation or bylaws, the adoption of a merger agreement requires the approval of a majority of the outstanding stock of the corporation entitled to vote thereon. |
British Columbia Under the BCBCA, certain extraordinary corporate actions, such as continuances, certain amalgamations, sales, leases or other dispositions of all, or substantially all of, the undertaking of a company (other than in the ordinary course of business), liquidations, dissolutions and certain arrangements, are required to be approved by a special resolution of shareholders. | |
| Dissenter’s Rights of Appraisals | ||
| Delaware Under the DGCL, a stockholder of a Delaware corporation generally has the right to dissent from and request payment for the stockholder’s shares upon a merger or consolidation in which the Delaware corporation is participating, subject to specified procedural requirements, including that such dissenting stockholder does not vote in favor of the merger or consolidation. However, the DGCL does not confer appraisal rights, in certain circumstances, including if the dissenting |
British Columbia The BCBCA provides that shareholders of a company are entitled to exercise dissent rights in respect of certain matters and to be paid the fair value of their shares in connection therewith. The dissent right is applicable where the company resolves ton (i) alter its articles to alter the restrictions on the powers of the company or on the business it is permitted to carry on; (ii) approve certain amalgamations; (iii) approve an arrangement, where the terms of the arrangement or court orders relating | |
207
Table of Contents
| stockholder owns shares traded on a national securities exchange and will receive publicly traded shares in the merger or consolidation. Under the DGCL, a stockholder asserting appraisal rights does not receive any payment for his or her shares until the court determines the fair value or the parties otherwise agree to a value. The costs of the proceeding may be determined by the court and assessed against the parties as the court deems equitable under the circumstances. |
thereto permit dissent; (iv) sell, lease or otherwise dispose of all or substantially all of its undertaking; or (v) continue the company into another jurisdiction.
Dissent may also be permitted if authorized by resolution. A court may also make an order permitting a shareholder to dissent in certain circumstances. | |
| Anti-Takeover and Ownership Provisions | ||
| Delaware Unless an issuer opts out of the provisions of Section 203 of the DGCL, Section 203 generally prohibits a public Delaware corporation from engaging in a “business combination” with a holder of 15% or more of the corporation’s voting stock (as defined in Section 203), referred to as an interested stockholder, for a period of three years after the date of the transaction in which the interested stockholder became an interested stockholder, except as otherwise provided in Section 203. For these purposes, the term “business combination” includes mergers, asset sales and other similar transactions with an interested stockholder. |
British Columbia The BCBCA does not contain a provision comparable to Section 203 of the DGCL with respect to business combinations. | |
| Inspection of Books and Records | ||
| Delaware Under the DGCL, any holder of record of stock or a person who is the beneficial owner of shares of such stock held either in a voting trust or by a nominee on behalf of such person may, upon written demand, inspect the corporation’s books and records during business hours for a proper purpose and may make copies and extracts therefrom. |
British Columbia Under the BCBCA, directors and shareholders may, without charge, inspect certain of the records of a company. Former shareholders and directors may also inspect certain of the records, free of charge, but only those records pertaining to the times that they were shareholders or directors.
Public companies must allow all persons to inspect certain records of the company free of charge. | |
| Derivative Actions | ||
| Delaware Under the DGCL, a stockholder may bring a derivative action on behalf of a corporation to enforce the corporation’s rights if he or she was a stockholder at the time of the transaction which is the subject of the action. Additionally, under Delaware case law, a stockholder must have owned stock in the corporation continuously until and throughout the litigation to maintain a derivative |
British Columbia Under the BCBCA, a shareholder (including a beneficial shareholder), a director of a company or any person who, in the discretion of the court, is an appropriate person to make an application to court to prosecute or defend an action on behalf of a company (a derivative action) may, with judicial leave: (i) bring an action in the name and on behalf of the company to enforce a right, duty or obligation owed | |
208
Table of Contents
| action. Delaware law also requires that, before commencing a derivative action, a stockholder must make a demand on the directors of the corporation to assert the claim, unless such demand would be futile. A stockholder also may commence a class action suit on behalf of himself or herself and other similarly situated stockholders where the requirements for maintaining a class action have been met. |
to the company that could be enforced by the company itself or to obtain damages for any breach of such right, duty or obligation or (ii) defend, in the name and on behalf of the company, a legal proceeding brought against the company.
Under the BCBCA, the court may grant leave if: (i) the complainant has made reasonable efforts to cause the directors of the company to prosecute or defend the action; (ii) notice of the application for leave has been given to the company and any other person that the court may order; (iii) the complainant is acting in good faith; and (iv) it appears to the court to be in the interests of the company for the action to be prosecuted or defended.
Under the BCBCA, upon the final disposition of a derivative action, the court may make any order it determines to be appropriate. In addition, under the BCBCA, a court may order a company to pay the complainant’s interim costs, including legal fees and disbursements. However, the complainant may be held accountable for the costs on final disposition of the action. | |
| Oppression Remedy | ||
| Delaware Statutory law in Delaware does not address oppression remedy. Any remedy for complaint that the affairs of the company are being conducted or that the powers of the directors have been exercised |
British Columbia The BCBCA’s oppression remedy enables a court to make an order (interim or final) to rectify the matters complained of if the court is satisfied upon application by a shareholder (as defined below) that the affairs of | |
| in a manner that is oppressive to one or more shareholders will come from Delaware case law. |
the company are being or have been conducted or that the powers of the directors are being or have been exercised in a manner that is oppressive, or that some action of the company or resolution of shareholders has been or is threatened to be taken which is unfairly prejudicial, in each case to one or more shareholders. The applicant must be one of the persons being oppressed or prejudiced and the application must be brought in a timely manner. A “shareholder” for the purposes of the oppression remedy includes legal and beneficial owners of shares as well as any other person whom the court considers appropriate.
The oppression remedy provides the court with extremely broad and flexible jurisdiction to intervene in corporate affairs to protect shareholders. | |
209
Table of Contents
| Blank Check Preferred Shares | ||
| Delaware Under the DGCL, preferred shares may be issued under the certificate of incorporation pursuant to which the board of directors is authorized, without shareholder approval, but subject to the provisions of the DGCL, to determine, among other rights and preferences of the series, voting rights, dividends and conversion rights of the preferred series of stock.
The DGCL requires that the certificate of incorporation state the number of shares of preferred stock that the company is permitted to issue as well as the par value of such series, but can otherwise delegate the power of determining the terms of such series to the board of directors.
Such blank check preferred stock can be used a “poison pill” to prevent a takeover by providing holders of such class of preferred stock with the rights needed to slow or stop such takeover. |
British Columbia Under our articles, the preferred shares may be issued in one or more series. Accordingly, our board of directors is authorized, without shareholder approval, but subject to the provisions of the BCBCA, to determine the maximum number of shares of each series, create an identifying name for each series and attach such special rights or restrictions, including dividend, liquidation and voting rights, as our board of directors may determine. Such special rights or restrictions, including dividend, liquidation and voting rights, may be superior to those of the common shares. Under the BCBCA, each share of a series of shares must have the same special rights or restrictions as are attached to every other share of that series of shares. In addition, the special rights or restrictions attached to shares of a series of shares must be consistent with the special rights or restrictions attached to the class of shares of which the series of shares is part.
The issuance of preferred shares, while providing flexibility in connection with possible acquisitions and other corporate purposes, could, among other things, have the effect of delaying, deferring or preventing a change of control of our company and might adversely affect the market price of our common shares and the voting and other rights of the holders of common shares.
In addition, the BCBCA does not prohibit a corporation from adopting a shareholder rights plan, or “poison pill,” which could prevent a takeover attempt and also preclude shareholders from realizing a potential premium over the market value of their shares. | |
210
Table of Contents
The following description is not intended to constitute a complete analysis of all tax considerations relating to the acquisition, ownership and disposition of our common shares. You are urged to consult your own tax advisor concerning the tax considerations relevant to you having regard to your own circumstances, including tax considerations that may arise under the laws of any state, provincial, local, foreign or other taxing jurisdiction.
U.S. Federal Income Tax Considerations
The following is a description of the material U.S. federal income tax consequences to the U.S. Holders described below of owning and disposing of our common shares, but it does not purport to be a comprehensive description of all tax considerations that may be relevant to a particular person’s decision to hold our common shares. This discussion applies only to a U.S. Holder that holds our common shares as capital assets for tax purposes. In addition, it does not describe all of the tax consequences that may be relevant in light of the U.S. Holder’s particular circumstances, including alternative minimum tax consequences, the potential application of the provisions of the Code known as the Medicare contribution tax, and tax consequences applicable to U.S. Holders subject to special rules, such as:
| • | certain financial institutions; |
| • | dealers or traders in securities who use a mark-to-market method of tax accounting; |
| • | persons holding our common shares as part of a hedging transaction, straddle, wash sale, conversion transaction or integrated transaction, or persons entering into a constructive sale with respect to our common shares; |
| • | persons whose functional currency for U.S. federal income tax purposes is not the U.S. dollar; |
| • | entities classified as partnerships for U.S. federal income tax purposes; |
| • | tax-exempt entities, including an “individual retirement account” or “Roth IRA”; |
| • | persons that own or are deemed to own 10% or more of the combined voting power of our voting shares or of the total value of our shares; |
| • | persons who acquired our common shares pursuant to the exercise of an employee stock option or otherwise as compensation; or |
| • | persons holding common shares in connection with a trade or business conducted outside of the United States. |
If an entity that is classified as a partnership for U.S. federal income tax purposes holds our common shares, the U.S. federal income tax treatment of a partner will generally depend on the status of the partner and the activities of the partnership. Partnerships holding our common shares and partners in such partnerships should consult their tax advisors as to the particular U.S. federal income tax consequences of holding and disposing of our common shares.
This discussion is based on the Code, administrative pronouncements, judicial decisions, and final, temporary and proposed Treasury regulations, all as of the date hereof, any of which is subject to change, possibly with retroactive effect.
A “U.S. Holder” is a holder who, for U.S. federal income tax purposes, is a beneficial owner of common shares and is:
| • | a citizen or individual resident of the United States; |
| • | a corporation (or other entity taxable as a corporation) created or organized in or under the laws of the United States, any state therein or the District of Columbia; or |
| • | an estate or trust the income of which is subject to U.S. federal income taxation regardless of its source. |
211
Table of Contents
U.S. Holders should consult their tax advisors concerning the U.S. federal, state, local and non-U.S. tax consequences of owning and disposing of our common shares in their particular circumstances.
Except as discussed below under “Passive Foreign Investment Company Rules,” this discussion assumes that we are not, and will not become a passive foreign investment company (“PFIC”) as described below.
Taxation of Distributions
Distributions paid on our common shares, other than certain pro rata distributions of common shares, will be treated as dividends to the extent paid out of the Company’s current or accumulated earnings and profits (as determined under U.S. federal income tax principles). Because we do not maintain calculations of earnings and profits under U.S. federal income tax principles, it is expected that distributions generally will be reported to U.S. Holders as dividends. Subject to applicable limitations, dividends paid to certain non-corporate U.S. Holders may be eligible for taxation as “qualified dividend income” and therefore may be taxable at rates applicable to long-term capital gains. Dividends will constitute qualified dividend income if the common shares with respect to which such dividends are paid are readily tradable on an established securities market in the United States. Our common shares will be traded on the NYSE in connection with this offering, and therefore, dividends paid to non-corporate U.S. Holders of our common shares should be eligible for taxation as qualified dividend income.
The amount of a dividend will include any amounts that are withheld in respect of Canadian taxes. Dividends will be included in a U.S. Holder’s income on the date of the U.S. Holder’s receipt of the dividend. The amount of any dividend income paid in Canadian dollars will be the U.S. dollar amount calculated by reference to the exchange rate in effect on the date of receipt, regardless of whether the payment is in fact converted into U.S. dollars. If the dividend is converted into U.S. dollars on the date of receipt, a U.S. Holder should not be required to recognize foreign currency gain or loss in respect of the dividend income. A U.S. Holder may recognize foreign currency gain or loss if the dividend is converted into U.S. dollars after the date of receipt.
A dividend on common shares will generally be treated as foreign-source dividend income to U.S. Holders and will not be eligible for the dividends-received deduction generally available to U.S. corporations under the Code. However, if (a) we are 50% or more owned, by vote or value, by United States persons and (b) at least 10% of our earnings and profits are attributable to sources within the United States, then for foreign tax credit purposes, a portion of our dividends would be treated as derived from sources within the United States. With respect to any dividend paid for any taxable year, the United States source ratio of our dividends for foreign tax credit purposes would be equal to the portion of our earnings and profits from sources within the United States for such taxable year, divided by the total amount of our earnings and profits for such taxable year.
Subject to applicable limitations, some of which vary depending upon the U.S. Holder’s circumstances, Canadian income taxes withheld from dividends on our common shares will be creditable against the U.S. Holder’s U.S. federal income tax liability. The rules governing foreign tax credits are complex, and U.S. Holders should consult their tax advisors regarding the creditability of foreign taxes in their particular circumstances.
Sale or Other Disposition of our Common Shares
For U.S. federal income tax purposes, gain or loss realized on the sale or other disposition of our common shares will be capital gain or loss, and will be long-term capital gain or loss if the U.S. Holder held our common shares for more than one year. The amount of the gain or loss will equal the difference between the U.S. Holder’s tax basis in the common shares disposed of and the amount realized on the disposition, in each case as determined in U.S. dollars. This gain or loss will generally be U.S.-source gain or loss for foreign tax credit purposes. The U.S. foreign tax credit rules are complex and a U.S. Holder’s ability to credit foreign taxes may be subject to various limitations. Accordingly, prospective investors should consult their own advisors with respect to the application of these rules to their particular circumstances.
212
Table of Contents
Passive Foreign Investment Company Rules
We believe that we were not a PFIC for U.S. federal income tax purposes for the taxable year ended December 31, 2020 and we do not expect to become one in the foreseeable future. However, because PFIC status depends on the composition of a company’s income and assets and the market value of its assets from time to time, there can be no assurance that the Company will not be a PFIC for any taxable year.
If we were a PFIC for any taxable year during which a U.S. Holder held our common shares, gain recognized by a U.S. Holder on a sale or other disposition (including certain pledges) of the common shares would be allocated ratably over the U.S. Holder’s holding period for the common shares. The amounts allocated to the taxable year of the sale or other disposition and to any year before we became a PFIC would be taxed as ordinary income. The amount allocated to each other taxable year would be subject to tax at the highest rate in effect for individuals or corporations, as appropriate, for that taxable year, and an interest charge would be imposed on the tax on such amount. Further, to the extent that any distribution received by a U.S. Holder on its common shares (other than any distribution that the U.S. Holder receives in the first year that it holds the common shares) exceeds 125% of the average of the annual distributions on the common shares received during the preceding three years or the portion of the U.S. Holder’s holding period that preceded the year of the distribution, whichever is shorter, that distribution would be subject to taxation in the same manner as gain, described immediately above. Certain elections may be available that would result in alternative treatments (such as mark-to-market treatment) of the common shares. U.S. Holders should consult their tax advisors to determine whether any of these elections would be available and, if so, what the consequences of the alternative treatments would be in their particular circumstances.
In addition, if we were a PFIC or, with respect to particular U.S. Holder, were treated as a PFIC, for the taxable year in which we paid a dividend or for the prior taxable year, the preferential dividend rates discussed above with respect to dividends paid to certain non-corporate U.S. Holders would not apply.
If a U.S. Holder owns our common shares during any year in which we were a PFIC, the holder generally must file annual reports containing such information as the U.S. Treasury may require on IRS Form 8621 (or any successor form) with respect to the Company, generally with the holder’s federal income tax return for that year.
U.S. Holders should consult their tax advisors regarding whether we are or will be s a PFIC and the potential application of the PFIC rules to ownership of the common shares.
Information Reporting and Backup Withholding
Payments of dividends and sales proceeds that are made within the United States or through certain U.S.-related financial intermediaries generally are subject to information reporting, and may be subject to backup withholding, unless (i) the U.S. Holder is a corporation or other exempt recipient or (ii) in the case of backup withholding, the U.S. Holder provides a correct taxpayer identification number and certifies that it is not subject to backup withholding.
The amount of any backup withholding from a payment to a U.S. Holder will be allowed as a credit against the holder’s U.S. federal income tax liability and may entitle it to a refund, provided that the required information is timely furnished to the IRS.
Certain Canadian Federal Income Tax Considerations
In the opinion of Stikeman Elliott LLP, Canadian counsel to the Company and Osler, Hoskin & Harcourt LLP, Canadian counsel to the underwriters, the following is a general summary, as of the date hereof, of the principal Canadian federal income tax considerations, under the Income Tax Act (Canada) (the “Tax Act”), generally applicable to a holder who acquires as beneficial owner common shares of the Company pursuant to
213
Table of Contents
this offering and who, for the purposes of the Tax Act and at all relevant times, holds our common shares as capital property, deals at arm’s length with the Company or the underwriters, is not affiliated with the Company, has not entered into, with respect to their common shares, a “derivative forward agreement,” a “synthetic disposition arrangement” or a “dividend rental arrangement” each as defined under the Tax Act (a “Holder”). Our common shares will generally be capital property to a Holder provided the Holder does not acquire or hold such common shares in the course of carrying on a business or as part of an adventure or concern in the nature of trade.
This summary is generally applicable to a Holder who, for the purposes of the Tax Act and at all relevant times, is not (and is not deemed to be) resident in Canada and will not use or hold (and will not be deemed to use or hold) our common shares in, or in the course of, carrying on a business or part of a business in Canada (a “Non-Resident Holder”). This summary does not apply to a Non-Resident Holder that carries on an insurance business in Canada and elsewhere or an “authorized foreign bank” (as defined in the Tax Act) and such holders should consult their own tax advisors.
This summary is based upon the current provisions of the Tax Act and counsel’s understanding of the current published administrative and assessing policies and practices of the Canada Revenue Agency. The summary also takes into account the specific proposals to amend the Tax Act that have been publicly announced by or on behalf of the Minister of Finance (Canada) prior to the date hereof (the “Tax Proposals”) and assumes that all such Tax Proposals will be enacted in the form proposed. No assurance can be given that the Tax Proposals will be enacted in the form proposed or at all. This summary does not otherwise take into account or anticipate any changes in law, whether by way of legislative, judicial or administrative action or interpretation, nor does it address any provincial, territorial or foreign tax considerations.
This summary is of a general nature only and is not intended to be, nor should it be construed to be, legal or tax advice to any particular Holder. Accordingly, Holders are urged to consult their own tax advisors about the specific tax consequences to them of acquiring, holding and disposing of our common shares.
Dividends on Common Shares
Dividends paid or credited, or deemed to be paid or credited, on our common shares to a Non-Resident Holder will generally be subject to Canadian withholding tax at the rate of 25%, subject to any reduction in the rate of withholding to which that Non-Resident Holder may be entitled under an applicable income tax treaty or convention. For example, the rate of withholding tax applicable to a dividend paid on our common shares to a Non-Resident Holder who is a resident of the United States for purposes of the Canada U.S. Income Tax Convention (the “Convention”), beneficially owns the dividend and is fully entitled to the benefits of the Convention will generally be reduced to 15%.
Dispositions of Common Shares
A Non-Resident Holder will not be subject to tax under the Tax Act in respect of any capital gain realized by such Non-Resident Holder on a disposition or deemed disposition of our common shares unless our common shares constitute “taxable Canadian property” (as defined in the Tax Act) of the Non-Resident Holder at the time of disposition and the Non-Resident Holder is not entitled to relief under an applicable income tax treaty or convention between Canada and the country in which the Non-Resident Holder is resident. Generally, our common shares will not constitute taxable Canadian property of a Non-Resident Holder at any particular time provided that the common shares of the Company are listed on a “designated stock exchange” for the purposes of the Tax Act (which currently includes the TSX), unless at any time during the 60-month period immediately preceding such time: (a) at least 25% or more of the issued shares of any class or series of the share capital of the Company owned by or belonged to any combination of (x) the Non-Resident Holder, (y) persons with whom the Non-Resident Holder did not deal at arm’s length (for the purposes of the Tax Act), and (z) partnerships in which the Non-Resident Holder or a person described in (y) holds a membership interest directly or indirectly through
214
Table of Contents
one or more partnerships; and (b) more than 50% of the fair market value of the common shares of the Company was derived directly or indirectly from one, or any combination of, real or immovable property situated in Canada, Canadian resource property (as defined in the Tax Act), timber resource property (as defined in the Tax Act) or options in respect of, interests in or for civil law rights in any such property (whether or not such property exists). Notwithstanding the foregoing, our common shares may also be deemed to be “taxable Canadian property” in certain circumstances. Non-Resident Holders for whom our common shares are, or may be, taxable Canadian property should consult their own tax advisors.
215
Table of Contents
SHARES ELIGIBLE FOR FUTURE SALE
Prior to this offering, there has been no public market for our common shares. We cannot make any prediction as to the effect, if any, that sales of common shares or the availability of common shares for future sales will have on the market price of our common shares. The market price of our common shares could decline because of the sale of a large number of our common shares or the perception that such sales could occur in the future. These factors could also make it more difficult to raise funds through future offerings of common shares.
Sale of Restricted Shares
Upon the consummation of this offering, we will have 214,661,117 common shares (or 223,232,545 common shares if the underwriters exercise their option to purchase additional common shares from us in full) outstanding. Of these common shares, the 57,142,857 common shares sold in this offering (or 65,714,285 common shares if the underwriters exercise their option to purchase additional common shares from us in full) will be freely tradable, without further restriction or registration under the Securities Act, except any shares held by our “affiliates,” as that term is defined in Rule 144 under the Securities Act, or any shares purchased in our directed share program which are subject to the lock-up agreements described in “Underwriting (Conflicts of Interest).” In the absence of registration under the Securities Act, shares held by affiliates may only be sold in compliance with the limitations of Rule 144 described below or another exemption from the registration requirements of the Securities Act and subject to compliance with applicable Canadian securities laws. As defined in Rule 144, an affiliate of an issuer is a person that directly, or indirectly through one or more intermediaries, controls, is controlled by or is under common control with the issuer. Upon the completion of this offering, 157,518,260 of our outstanding common shares will be deemed “restricted securities” as that term is defined under Rule 144, and would also be subject to the “lock-up” period noted below.
Restricted securities may be sold in the public market only if they qualify for an exemption from registration under Rule 144 under the Securities Act, which is summarized below, or any other applicable exemption under the Securities Act, or pursuant to a registration statement that is effective under the Securities Act.
Rule 144
In general, a person who has beneficially owned restricted common shares for at least six months would be entitled to sell such securities, provided that (i) such person is not deemed to have been one of our affiliates at the time of, or at any time during the 90 days preceding, the sale and (ii) we are subject to the Exchange Act periodic reporting requirements for at least 90 days before the sale. Persons who have beneficially owned restricted common shares for at least six months but who are our affiliates at the time of, or any time during the 90 days preceding, the sale, would be subject to additional restrictions, by which such person would be entitled to sell within any three-month period only a number of securities that does not exceed the greater of the following:
| • | 1% of the number of our common shares then outstanding, which will equal approximately 2,146,611 common shares immediately after this offering (or approximately 2,232,325 common shares if the underwriters exercise their purchase option in full); or |
| • | the average weekly trading volume of our common shares on the NYSE during the four calendar weeks preceding the filing of a notice on Form 144 with respect to the sale; |
provided, in each case, that we are subject to the Exchange Act periodic reporting requirements for at least 90 days before the sale. Such sales both by affiliates and by non-affiliates must also comply with the manner of sale and notice provisions of Rule 144 to the extent applicable.
Lock-up Agreements
We and our officers, directors and holders of substantially all of our common shares have agreed with the underwriters, subject to certain exceptions, not to dispose of or hedge any of our common shares or securities
216
Table of Contents
convertible into or exchangeable for common shares during the period from the date of the final prospectus continuing through the date 180 days after the date of the final prospectus, except with the prior written consent of Goldman Sachs & Co. LLC. These agreements are described in the section titled “Underwriting (Conflicts of Interest).” Goldman Sachs & Co. LLC may, in its sole discretion, release any of the securities subject to these lock-up agreements at any time.
Rule 701
In general, under Rule 701 as in effect on the date of this prospectus, any of our employees, directors, officers, consultants or advisors who purchased shares from us in reliance on Rule 701 in connection with a compensatory stock or option plan or other written agreement before the effective date of this offering, or who purchased shares from us after that date upon the exercise of options granted before that date, are eligible to resell such shares 90 days after the effective date of this offering in reliance upon Rule 144. If such person is not an affiliate, such sale may be made subject only to current public information provisions of Rule 144. If such a person is an affiliate, such sale may be made under Rule 144 without compliance with the holding period requirement, but subject to the other Rule 144 restrictions described above.
Equity Incentive Plans
We intend to file one or more registration statements on Form S-8 under the Securities Act to register all common shares issued or issuable under our equity incentive plans. Any such Form S-8 registration statements will automatically become effective upon filing. Accordingly, shares registered under such registration statements will be available for sale in the open market following the expiration of the applicable lock-up period. We expect that the initial registration statement on Form S-8 will cover approximately 35,586,847 common shares. Common shares issued under our equity incentive plans after the effective date of the applicable Form S-8 registration statement will be eligible for resale in the public market without restriction, subject to Rule 144 limitations applicable to affiliates and the lock-up agreements described above.
Registration Rights
Beginning 180 days following the closing of this offering (or such earlier time as permitted by the terms of the lock-up agreements executed in connection with this offering), holders of a total of approximately 150 million common shares or securities convertible into or exchangeable for such common shares will have the right to require us to register these common shares under the Securities Act under specified circumstances. After registration pursuant to these rights, the registrable securities will become freely tradeable without restriction under the Securities Act and Canadian securities laws, as applicable, immediately upon the effectiveness of the registration. See “Certain Relationships and Related Party Transactions—Registration Rights Agreement.”
Canadian Resale Restrictions
Any sale of any of our shares which constitutes a “control distribution” under Canadian securities laws (generally a sale by a person or a group of persons holding more than 20% of our outstanding voting securities) will be subject to restrictions under Canadian securities laws in addition to those restrictions noted above, unless the sale is qualified under a prospectus filed with Canadian securities regulatory authorities, or if prior notice of the sale is filed with the Canadian securities regulatory authorities at least seven days before any sale and there has been compliance with certain other requirements and restrictions regarding the manner of sale, payment of commissions, reporting and availability of current public information about us and compliance with applicable Canadian securities laws.
217
Table of Contents
UNDERWRITING (CONFLICTS OF INTEREST)
The Company and the underwriters named below have entered into an underwriting agreement dated the date of this prospectus with respect to the common shares being offered. Subject to certain conditions, each underwriter has severally agreed to purchase the number of common shares indicated in the following table. Goldman Sachs & Co. LLC, J.P. Morgan Securities LLC, UBS Securities LLC and BMO Nesbitt Burns Inc. are the representatives of the underwriters.
| Underwriters |
Number of Common Shares |
|||
| Goldman Sachs & Co. LLC |
||||
| J.P. Morgan Securities LLC |
||||
| UBS Securities LLC |
||||
| BMO Nesbitt Burns Inc. |
||||
| BofA Securities, Inc. |
||||
| Guggenheim Securities, LLC* |
||||
| Jefferies LLC |
||||
| Morgan Stanley & Co. LLC |
||||
| RBC Capital Markets, LLC |
||||
|
|
|
|||
| Total |
57,142,857 | |||
|
|
|
|||
* Guggenheim Securities, LLC and its affiliates are not registered to sell securities in any Canadian jurisdiction and, accordingly, will only sell common shares outside Canada.
The offering is being made concurrently in the United States and in each of the provinces and territories of Canada. The common shares will be offered in the United States through those underwriters or their U.S. affiliates who are registered to offer the common shares for sale in the United States and such other registered dealers as may be designated by the underwriters. The common shares will be offered in each of the provinces and territories of Canada through those underwriters or their Canadian affiliates who are registered to offer the common shares for sale in such provinces and territories and such other registered dealers as may be designated by the underwriters. Subject to applicable law, the underwriters, or such other registered dealers as may be designated by the underwriters, may offer the common shares outside of the United States and Canada.
The underwriters will be committed to take and pay for all of the common shares being offered, if any are taken, other than the common shares covered by the option described below unless and until this option is exercised.
The underwriters will have an option to buy up to an additional 8,571,428 common shares from us to cover sales by the underwriters of a greater number of common shares than the total number set forth in the table above. They may exercise that option for 30 days from the date of this prospectus. If any common shares are purchased pursuant to this option, the underwriters will severally purchase common shares in approximately the same proportion as set forth in the table above.
The following table shows the per share and total underwriting discounts and commissions to be paid to the underwriters by us. Such amounts are shown assuming both no exercise and full exercise of the underwriters’ option to purchase 8,571,428 additional common shares.
| No Exercise | Full Exercise | |||||||
| Per Share |
||||||||
| Total (in millions) |
||||||||
Common shares sold by the underwriters to the public will initially be offered at the initial public offering price set forth on the cover page of this prospectus. After the underwriters have made a reasonable effort to sell
218
Table of Contents
all of the common shares offered by this prospectus to the public at the initial public offering price stated on the cover page of this prospectus, the offering price may be decreased and may be further changed from time to time, and the compensation realized by the underwriters will be decreased by the amount that the aggregate price paid by the purchasers for the common shares is less than the gross proceeds paid by the underwriters to us. After the initial offering of the common shares, the representatives may change the offering price and the other selling terms. The offering of the common shares by the underwriters is subject to receipt and acceptance and subject to the underwriters’ right to reject any order in whole or in part, and the right is reserved to close the subscription books at any time without notice.
The Company and its officers, directors and holders of substantially all of the Company’s common shares have agreed with the underwriters (such persons, the “lock-up parties”), subject to certain exceptions described below, not to dispose of or hedge any of their common shares or securities convertible into or exchangeable for common shares during the period from the date of this prospectus continuing through the date 180 days after the date of this prospectus, except with the prior written consent of Goldman Sachs & Co. LLC. See “Shares Eligible for Future Sale” for a discussion of certain transfer restrictions.
In the case of the Company, the restrictions described in the paragraph above do not apply, subject in certain cases to various conditions, to: (A) the common shares to be sold in this offering; (B) the common shares to be issued in connection with the Share Capital Amendments; (C) any grants of common shares that are described in this prospectus; (D) any common shares issued with respect to the vesting or exercise of any awards under equity plans that are described in this prospectus; (E) any common shares issued upon the conversion or exchange of convertible or exchangeable securities outstanding as of the date of, and described in, this prospectus; (F) the filing of a registration statement on Form S-8 and the issuance of common shares registered thereunder, relating to any equity plan or arrangements disclosed in this prospectus; (G) any common shares issued in connection with the acquisition of assets of, or a majority controlling portion of the equity of, or a business combination or joint venture with, another entity in connection with such business combination or such acquisition by the Company or any of its subsidiaries of such entity; and (H) any common shares issued in connection with joint ventures, commercial relationships or other strategic transactions; provided that the aggregate number of common shares issued or issuable pursuant to clauses (G) and (H) does not exceed 10% of the number of common shares outstanding immediately after this offering and, prior to such issuance, each recipient of any such securities executes and delivers to the representatives a lock-up agreement; and (I) confidential submission to the SEC of registration statements under the Securities Act.
In the case of directors, executive officers and other holders, the restrictions described in the paragraph above do not apply, subject in certain cases to various conditions, to: (i) the sale of common shares to the underwriters in connection with this offering or the transfer, conversion, reclassification, redemption or exchange of any securities for common shares, or any securities that may be converted, exercised or exchanged into common shares, pursuant to reorganization or recapitalization transactions in connection with this offering and described in this prospectus; provided that any common shares or securities convertible into or exerciseable or exchangeable for common shares received in such transactions remain subject to the restrictions described below; (ii) if the lock-up party is an individual, transfers of common shares or securities convertible into or exercisable or exchangeable for common shares (A) as a bona fide gift or gifts, (B) by will, other testamentary document or intestate succession, (C) to any trust for the direct or indirect benefit of the lock-up party or an immediate family member of the lock-up party, or to any other entity that is wholly-owned by such persons, (D) transfers to any immediate family member or any investment fund or other entity controlled or managed by the lock-up party, (E) by operation of law, such as pursuant to a qualified domestic order of a court (including a divorce settlement, divorce decree or separation agreement) or regulatory agency, and (F) transfers to a nominee or custodian of a person or entity to whom a disposition or transfer would be permissible under clauses (A) through (E); (iii) if the lock-up party is a corporation, partnership or other business entity, transfers or distributions of common shares or any security convertible into or exercisable or exchangeable for common shares to members, partners, shareholders or affiliates of the lock-up party (other than the Company and its controlled affiliates), including investment funds or other entities under common control or management with the lock-up party; (iv) the
219
Table of Contents
repurchase of the common shares or such other securities by the Company pursuant to a repurchase right (A) arising upon the termination of the lock-up party’s employment with the Company, provided that such repurchase right is pursuant to contractual agreements with the Company, or (B) provided for by stock option agreements or other equity award agreements; (v) transfers of common shares acquired in open market transactions after the completion of this offering; (vi) a bona fide third-party tender offer, merger, consolidation or other similar transaction made to all holders of the Company’s share capital after the consummation of this offering, involving a change of control of the Company (or similar transactions resulting in a group of persons becoming, after the closing of the transaction, the beneficial owner of more than 50% of total voting power of the voting securities of the Company), provided that in the event that such tender offer, merger, consolidation or other such transaction is not completed, the lock-up party’s common shares shall remain subject to the provisions of the lock-up agreement; (vii) (A) the exercise, solely with cash, of stock options pursuant to equity incentive plans described in this prospectus, and the receipt by the lock-up party from the Company of common shares upon such exercise; (B) the “net” or “cashless” exercise of stock options or other equity awards granted pursuant to equity incentive plans described in this prospectus; (C) any vesting or exercise of equity-based compensation granted pursuant to the Company’s equity incentive plans primarily for the purpose of satisfying any tax or other governmental withholding obligation; or (D) to the extent necessary to satisfy tax withholding requirements or exercise price due upon the vesting of restricted stock or vesting or exercise of similar rights to purchase common shares or any securities convertible into or exerciseable or exchangeable for common shares pursuant to the Company’s equity-based awards granted under equity incentive plans or pursuant to other stock purchase arrangements, in each case described in this prospectus; provided that, in each case, the underlying common shares shall continue to be subject to the restrictions on transfer set forth in the lock-up agreement, and provided, further, that, if required, any public report or filing under the Exchange Act shall indicate in the footnotes thereto the nature of the transaction; (viii) the exercise of any right with respect to, or the taking of any other action in preparation for, a registration by the Company of common shares or securities convertible into or exercisable or exchangeable for common shares; provided that no transfer of the lock-up party’s common shares proposed to be registered under this clause shall occur, and no registration statement shall be filed, during the lock-up period; provided, further, that no public announcement regarding such exercise or taking of such action shall be required or shall be voluntarily made during the lock-up period; and (ix) the establishment of a trading plan pursuant to Rule 10b5-1 under the Exchange Act or pursuant to applicable Canadian securities laws for the transfer of common shares; provided that such plan does not provide for the transfer of common shares during 180-day period after the date of this prospectus and no filing or other public announcement shall be required or shall be voluntarily made during such period (as such period may be extended) by the lock-up party or the Company as a result of the establishment of any such plan, other than a public announcement or filing under Canadian securities laws; provided that such announcement or filing shall include a statement to the effect that no transfer of the common shares may be made under such plan during such 180-day period; provided that in the case of any transfer or distribution pursuant to clause (ii) such transfer is not for value and each donee, heir, beneficiary or other transferee thereof agrees to be bound in writing by the restrictions described above; and, provided, further, that in the case of any transfer or distribution pursuant to clause (iii) through (vii), that no filing by the lock-up party or, with respect to clause (ii), any recipient of the common shares transferred, in each case, under Section 16(a) of the Exchange Act, or other public announcement shall be required or shall be made voluntarily in connection with such transfer or distribution during the 180-day period after the date of this prospectus, in each case other than a Form 5 or a filing on SEDI as required under Canadian securities law.
Goldman Sachs & Co. LLC may release the securities subject to the lock-up agreements with the underwriters described above in whole or in part at any time.
Prior to the offering, there has been no public market for our common shares. The initial public offering price will be negotiated between us and the representatives. Among the factors to be considered in determining the initial public offering price of our common shares, in addition to prevailing market conditions, will be our historical performance, estimates of our business potential and earnings prospects, an assessment of our management and the consideration of the above factors in relation to market valuation of companies in related businesses.
220
Table of Contents
Our common shares have been approved for listing on the NYSE and we have applied to list of common shares on the TSX, both under the symbol “KDC.” Listing on the TSX will be subject to fulfilling all the listing requirements of the TSX.
In connection with the offering, the underwriters may purchase and sell common shares in the open market. These transactions may include short sales, stabilizing transactions and purchases to cover positions created by short sales. Short sales involve the sale by the underwriters of a greater number of common shares than they are required to purchase in the offering, and a short position represents the amount of such sales that have not been covered by subsequent purchases. A “covered short position” is a short position that is not greater than the amount of additional common shares for which the underwriters’ option described above may be exercised. The underwriters may cover any covered short position by either exercising their option to purchase additional common shares or purchasing common shares in the open market. In determining the source of common shares to cover the covered short position, the underwriters will consider, among other things, the price of common shares available for purchase in the open market as compared to the price at which they may purchase additional common shares pursuant to the option described above. “Naked” short sales are any short sales that create a short position greater than the amount of additional common shares for which the option described above may be exercised. The underwriters must cover any such naked short position by purchasing common shares in the open market. A naked short position is more likely to be created if the underwriters are concerned that there may be downward pressure on the price of the common shares in the open market after pricing that could adversely affect investors who purchase in the offering. Stabilizing transactions consist of various bids for or purchases of common shares made by the underwriters in the open market prior to the completion of the offering.
The underwriters may also impose a penalty bid. This occurs when a particular underwriter repays to the underwriters a portion of the underwriting discount received by it because the representatives have repurchased common shares sold by or for the account of such underwriter in stabilizing or short covering transactions.
Purchases to cover a short position and stabilizing transactions, as well as other purchases by the underwriters for their own accounts, may have the effect of preventing or retarding a decline in the market price of our common shares, and together with the imposition of the penalty bid, may stabilize, maintain or otherwise affect the market price of the common shares. As a result, the price of the common shares may be higher than the price that otherwise might exist in the open market. The underwriters are not required to engage in these activities and may end any of these activities at any time. These transactions may be effected on the NYSE and the TSX, in the over-the-counter market or otherwise.
In accordance with rules and policy statements of certain Canadian securities regulatory authorities and the Universal Market Integrity Rules for Canadian Marketplaces (“UMIR”), the underwriters may not, at any time during the period of distribution, bid for or purchase common shares. The foregoing restriction is, however, subject to exceptions as permitted by such rules and policy statements and UMIR. These exceptions include a bid or purchase permitted under such rules and policy statements and UMIR, relating to market stabilization and market balancing activities and a bid or purchase on behalf of a customer where the order was not solicited.
We estimate that our share of the total expenses of the offering, excluding underwriting discounts and commissions, will be approximately $13.0 million. We have agreed to reimburse the underwriters for certain expenses and fees (including counsel fees) related to the review by FINRA, not to exceed $30,000. In addition, the underwriters have agreed to reimburse us for certain expenses in connection with this offering.
The underwriting agreement provides that the obligations of the several underwriters to pay for and accept delivery of the common shares offered by this prospectus are subject to the approval of certain legal matters by their counsel and to certain other conditions. Upon certain stated events, the obligations of the underwriters under the underwriting agreement may be terminated at any time before the closing of this offering at their discretion. We have agreed to indemnify the several underwriters against certain liabilities, including liabilities under the Securities Act of 1933 and applicable Canadian securities laws, or to contribute to payments the underwriters may be required to make in respect of those liabilities.
221
Table of Contents
The underwriters and their respective affiliates are full service financial institutions engaged in various activities, which may include sales and trading, commercial and investment banking, advisory, investment management, investment research, principal investment, hedging, market making, brokerage and other financial and non-financial activities and services. Certain of the underwriters and their respective affiliates have provided, and may in the future provide, a variety of these services to the Company and to persons and entities with relationships with the Company, for which they received or will receive customary fees and expenses. In addition, the underwriters or their affiliates are lenders under the Revolving Facility, the Euro Term Loan and the First Lien Term Loan. As a result, the underwriters or their affiliates may receive a portion of the net proceeds of this offering.
In the ordinary course of their various business activities, the underwriters and their respective affiliates, officers, directors and employees may purchase, sell or hold a broad array of investments and actively trade securities, derivatives, loans, commodities, currencies, credit default swaps and other financial instruments for their own account and for the accounts of their customers, and such investment and trading activities may involve or relate to assets, securities and/or instruments of the Company (directly, as collateral securing other obligations or otherwise) and/or persons and entities with relationships with the Company. The underwriters and their respective affiliates may also communicate independent investment recommendations, market color or trading ideas and/or publish or express independent research views in respect of such assets, securities or instruments and may at any time hold, or recommend to clients that they should acquire, long and/or short positions in such assets, securities and instruments.
Conflict of Interest
An affiliate of UBS Securities LLC is the lender under the Euro Term Loan. Because we plan to use a portion of the proceeds to repay the Euro Term Loan, the affiliate of UBS Securities LLC will receive more than 5% of the proceeds from this offering, and, as a result, UBS Securities LLC is deemed to have a “conflict of interest” within the meaning of FINRA Rule 5121. Accordingly, this offering is being conducted in compliance with the applicable provisions of FINRA Rule 5121. FINRA Rule 5121 prohibits UBS Securities LLC from making sales to discretionary accounts without the prior written approval of the account holder and requires that a “qualified independent underwriter,” as defined in FINRA Rule 5121, participate in the preparation of the registration statement of which this prospectus forms a part, and exercise its usual standards of due diligence with respect thereto. Goldman Sachs & Co. LLC is acting as the “qualified independent underwriter” for this offering. Goldman Sachs & Co. LLC will not receive any additional fees for serving as a qualified independent underwriter in connection with this offering. We have agreed to indemnify Goldman Sachs & Co. LLC against liabilities incurred in connection with acting as qualified independent underwriter, including liabilities under the Securities Act.
Directed Share Program
At our request, the underwriters have reserved up to 2,857,142 common shares, or 5% of the common shares to be offered by this prospectus, for sale at the initial public offering price through a directed share program for certain persons designated by the Company. Shares purchased through the directed share program will not be subject to a lock-up restriction, except in the case of shares purchased by any of our directors or officers and certain of our employees. The number of common shares available for sale to the general public will be reduced to the extent these individuals or entities purchase such reserved shares. Any reserved shares that are not so purchased will be offered by the underwriters to the general public on the same basis as the other shares offered by this prospectus. The underwriters will receive the same discount from such reserved shares as they will from the other common shares sold to the public in this offering. We have agreed to indemnify the underwriters against certain liabilites and expenses, including liabilities under the Securites Act, in connection with the reserved sales.
Selling Restrictions
Other than in the United States and each of the provinces and territories of Canada, no action has been taken by us or the underwriters that would permit a public offering of the common shares offered by this prospectus in
222
Table of Contents
any jurisdiction where action for that purpose is required. The common shares offered by this prospectus may not be offered or sold, directly or indirectly, nor may this prospectus or any other offering material or advertisements in connection with the offer and sale of any such common shares be distributed or published in any jurisdiction, except under circumstances that will result in compliance with the applicable rules and regulations of that jurisdiction. Persons into whose possession this prospectus comes are advised to inform themselves about and to observe any restrictions relating to the offering and the distribution of this prospectus. This prospectus does not constitute an offer to sell or a solicitation of an offer to buy any common shares offered by this prospectus in any jurisdiction in which such an offer or a solicitation is unlawful.
European Economic Area
In relation to each Member State of the European Economic Area (each a “Relevant State”), no offer of common shares which are the subject of this offering has been, or will be, made to the public in that Relevant State prior to the publication of a prospectus in relation to our common shares which has been approved by the competent authority in that Relevant State or, where appropriate, approved in another Relevant State and notified to the competent authority in that Relevant State, all in accordance with the Prospectus Regulation, except that offers of common shares may be made to the public in that Relevant State at any time under the following exemptions under the Prospectus Regulation:
| (a) | to any legal entity which is a qualified investor as defined under Article 2 of the Prospectus Regulation; |
| (b) | to fewer than 150 natural or legal persons (other than qualified investors as defined under Article 2 of the Prospectus Regulation), subject to obtaining the prior consent of the representatives for any such offer; or |
| (c) | in any other circumstances falling within Article 1(4) of the Prospectus Regulation; |
provided that no such offer of common shares shall require the Company or any underwriter to publish a prospectus pursuant to Article 3 of the Prospectus Regulation or supplement a prospectus pursuant to Article 23 of the Prospectus Regulation.
Each person in a Relevant State who initially acquires any common shares or to whom any offer is made will be deemed to have represented, acknowledged and agreed to and with the Company and the underwriters that it is a qualified investor within the meaning of Article 2 of the Prospectus Regulation.
In the case of any common shares being offered to a financial intermediary as that term is used in Article 5(1) of the Prospectus Regulation, each such financial intermediary will be deemed to have represented, acknowledged and agreed that the common shares acquired by it in the offer have not been acquired on a nondiscretionary basis on behalf of, nor have they been acquired with a view to their offer or resale to, persons in circumstances which may give rise to an offer to the public other than their offer or resale in a Relevant State to qualified investors, in circumstances in which the prior consent of the representatives has been obtained to each such proposed offer or resale.
The Company, the underwriters and their affiliates will rely upon the truth and accuracy of the foregoing representations, acknowledgements and agreements.
For the purposes of this provision, the expression an “offer to the public” in relation to any common shares in any Relevant State means the communication in any form and by any means of sufficient information on the terms of the offer and any common shares to be offered so as to enable an investor to decide to purchase or subscribe for any common shares, and the expression “Prospectus Regulation” means Regulation (EU) 2017/1129.
The above selling restriction is in addition to any other selling restrictions set out below.
223
Table of Contents
In connection with the offering, the underwriters are not acting for anyone other than the Company and will not be responsible to anyone other than the Company for providing the protections afforded to their clients nor for providing advice in relation to the offering.
United Kingdom
In relation to the United Kingdom, no offer of common shares which are the subject of this offering has been, or will be, made to the public in the United Kingdom prior to the publication of a prospectus in relation to our common shares which has been approved by the Financial Conduct Authority in the United Kingdom in accordance with the UK Prospectus Regulation and the FSMA, except that offers of common shares may be made to the public in the United Kingdom at any time under the following exemptions under the UK Prospectus Regulation and the FSMA:
| (a) | to any legal entity which is a qualified investor as defined under Article 2 of the UK Prospectus Regulation; |
| (b) | to fewer than 150 natural or legal persons (other than qualified investors as defined under Article 2 of the UK Prospectus Regulation), subject to obtaining the prior consent of the representatives for any such offer; or |
| (c) | in any other circumstances falling within section 86 of the FSMA; |
provided that no such offer of common shares shall require the Company or any underwriter to publish a prospectus pursuant to Section 85 of the FSMA or Article 3 of the UK Prospectus Regulation or supplement a prospectus pursuant to Article 23 of the UK Prospectus Regulation.
Each person in the United Kingdom who initially acquires any common shares or to whom any offer is made will be deemed to have represented, acknowledged and agreed to and with the Company and the underwriters that it is a qualified investor within the meaning of the UK Prospectus Regulation.
In the case of any common shares being offered to a financial intermediary as that term is used in Article 5(1) of the UK Prospectus Regulation, each such financial intermediary will be deemed to have represented, acknowledged and agreed that the common shares acquired by it in the offer have not been acquired on a non-discretionary basis on behalf of, nor have they been acquired with a view to their offer or resale to, persons in circumstances which may give rise to an offer to the public other than their offer or resale in the United Kingdom to qualified investors, in circumstances in which the prior consent of the representatives has been obtained to each such proposed offer or resale.
The Company, the underwriters and their affiliates will rely upon the truth and accuracy of the foregoing representations, acknowledgements and agreements.
For the purposes of this provision, the expression an “offer to the public” in relation to any common shares in the United Kingdom means the communication in any form and by any means of sufficient information on the terms of the offer and any common shares to be offered so as to enable an investor to decide to purchase or subscribe for any common shares, the expression “UK Prospectus Regulation” means Regulation (EU) 2017/1129 as it forms part of domestic law by virtue of the European Union (Withdrawal) Act 2018, and the expression “FSMA” means the Financial Services and Markets Act 2000.
In connection with the offering, the underwriters are not acting for anyone other than the Company and will not be responsible to anyone other than the Company for providing the protections afforded to their clients nor for providing advice in relation to the offering.
In the United Kingdom, this document is being distributed only to, and is directed only at, and any offer subsequently made may be directed only at persons who (i) have professional experience in matters relating to
224
Table of Contents
investments and who qualify as investment professionals within the meaning of Article 19(5) of the Financial Services and Markets Act 2000 (Financial Promotion) Order 2005 (as amended, the “Financial Promotion Order”), (ii) are persons falling within Article 49(2)(a) to (d) (“high net worth companies, unincorporated associations etc.”) of the Financial Promotion Order, (iii) are outside the United Kingdom or (iv) are persons to whom an invitation or inducement to engage in investment activity (within the meaning of Section 21 of the Financial Services and Markets Act 2000, as amended (“FSMA”)) in connection with the issue or sale of the common shares may otherwise lawfully be communicated or caused to be communicated (all such persons together being referred to as “relevant persons”). This document is directed only at relevant persons and must not be acted on or relied on by persons who are not relevant persons. Any investment or investment activity to which this document relates is available only to relevant persons and will be engaged in only with relevant persons.
Hong Kong
Our common shares may not be offered or sold in Hong Kong by means of any document other than (i) in circumstances which do not constitute an offer to the public within the meaning of the Companies (Winding Up and Miscellaneous Provisions) Ordinance (Cap. 32 of the Laws of Hong Kong) (Companies (Winding Up and Miscellaneous Provisions) Ordinance) or which do not constitute an invitation to the public within the meaning of the Securities and Futures Ordinance (Cap. 571 of the Laws of Hong Kong) (Securities and Futures Ordinance), or (ii) to “professional investors” as defined in the Securities and Futures Ordinance and any rules made thereunder or (iii) in other circumstances which do not result in the document being a “prospectus” as defined in the Companies (Winding Up and Miscellaneous Provisions) Ordinance, and no advertisement, invitation or document relating to our common shares may be issued or may be in the possession of any person for the purpose of issue (in each case whether in Hong Kong or elsewhere), which is directed at, or the contents of which are likely to be accessed or read by, the public in Hong Kong (except if permitted to do so under the securities laws of Hong Kong) other than with respect to shares which are or are intended to be disposed of only to persons outside Hong Kong or only to “professional investors” in Hong Kong as defined in the Securities and Futures Ordinance and any rules made thereunder.
Singapore
This prospectus has not been registered as a prospectus with the Monetary Authority of Singapore. Accordingly, this prospectus and any other document or material in connection with the offer or sale, or invitation for subscription or purchase, of our common shares may not be circulated or distributed, nor may our common shares be offered or sold, or be made the subject of an invitation for subscription or purchase, whether directly or indirectly, to persons in Singapore other than (i) to an institutional investor (as defined under Section 4A of the Securities and Futures Act, Chapter 289 of Singapore (the SFA)) under Section 274 of the SFA, (ii) to a relevant person (as defined in Section 275(2) of the SFA) pursuant to Section 275(1) of the SFA, or any person pursuant to Section 275(1A) of the SFA, and in accordance with the conditions specified in Section 275 of the SFA or (iii) otherwise pursuant to, and in accordance with the conditions of, any other applicable provision of the SFA, in each case subject to conditions set forth in the SFA.
Where our common shares are subscribed or purchased under Section 275 of the SFA by a relevant person which is a corporation (which is not an accredited investor (as defined in Section 4A of the SFA)) the sole business of which is to hold investments and the entire share capital of which is owned by one or more individuals, each of whom is an accredited investor, the securities (as defined in Section 239(1) of the SFA) of that corporation shall not be transferable for six months after that corporation has acquired our common shares under Section 275 of the SFA except: (i) to an institutional investor under Section 274 of the SFA or to a relevant person (as defined in Section 275(2) of the SFA), (ii) where such transfer arises from an offer in that corporation’s securities pursuant to Section 275(1A) of the SFA, (iii) where no consideration is or will be given for the transfer, (iv) where the transfer is by operation of law, (v) as specified in Section 276(7) of the SFA or (vi) as specified in Regulation 32 of the Securities and Futures (Offers of Investments) (Shares and Debentures) Regulations 2005 of Singapore (Regulation 32).
225
Table of Contents
Where our common shares are subscribed or purchased under Section 275 of the SFA by a relevant person which is a trust (where the trustee is not an accredited investor (as defined in Section 4A of the SFA)) whose sole purpose is to hold investments and each beneficiary of the trust is an accredited investor, the beneficiaries’ rights and interest (howsoever described) in that trust shall not be transferable for six months after that trust has acquired our common shares under Section 275 of the SFA except: (i) to an institutional investor under Section 274 of the SFA or to a relevant person (as defined in Section 275(2) of the SFA), (ii) where such transfer arises from an offer that is made on terms that such rights or interest are acquired at a consideration of not less than $200,000 (or its equivalent in a foreign currency) for each transaction (whether such amount is to be paid for in cash or by exchange of securities or other assets), (iii) where no consideration is or will be given for the transfer, (iv) where the transfer is by operation of law, (v) as specified in Section 276(7) of the SFA or (vi) as specified in Regulation 32.
Japan
The securities have not been and will not be registered under the Financial Instruments and Exchange Act of Japan (Act No. 25 of 1948, as amended), or the FIEA. The securities may not be offered or sold, directly or indirectly, in Japan or to or for the benefit of any resident of Japan (including any person resident in Japan or any corporation or other entity organized under the laws of Japan) or to others for reoffering or resale, directly or indirectly, in Japan or to or for the benefit of any resident of Japan, except pursuant to an exemption from the registration requirements of the FIEA and otherwise in compliance with any relevant laws and regulations of Japan.
Dubai International Financial Centre
This prospectus relates to an Exempt Offer in accordance with the Offered Securities Rules of the Dubai Financial Services Authority, or DFSA. This prospectus is intended for distribution only to persons of a type specified in the Offered Securities Rules of the DFSA. It must not be delivered to, or relied on by, any other person. The DFSA has no responsibility for reviewing or verifying any documents in connection with Exempt Offers. The DFSA has not approved this prospectus nor taken steps to verify the information set forth herein and has no responsibility for the prospectus. The common shares to which this prospectus relates may be illiquid and/or subject to restrictions on their resale. Prospective purchasers of the common shares should conduct their own due diligence on such common shares. If you do not understand the contents of this prospectus, you should consult an authorized financial advisor.
Switzerland
The common shares may not be publicly offered in Switzerland and will not be listed on the SIX Swiss Exchange (“SIX”) or on any other stock exchange or regulated trading facility in Switzerland. This document does not constitute a prospectus within the meaning of, and has been prepared without regard to the disclosure standards for issuance prospectuses under art. 652a or art. 1156 of the Swiss Code of Obligations or the disclosure standards for listing prospectuses under art. 27 ff. of the SIX Listing Rules or the listing rules of any other stock exchange or regulated trading facility in Switzerland. Neither this document nor any other offering or marketing material relating to the common shares or the offering may be publicly distributed or otherwise made publicly available in Switzerland.
Neither this document nor any other offering or marketing material relating to the offering, the Company or the common shares has been or will be filed with or approved by any Swiss regulatory authority. In particular, this document will not be filed with, and the offer of common shares will not be supervised by, the Swiss Financial Market Supervisory Authority and the offer of common shares has not been and will not be authorized under the Swiss Federal Act on Collective Investment Schemes (“CISA”). The investor protection afforded to acquirers of interests in collective investment schemes under the CISA does not extend to acquirers of common shares.
226
Table of Contents
Australia
No placement document, prospectus, product disclosure statement or other disclosure document has been lodged with the Australian Securities and Investments Commission, or ASIC, in relation to the offering. This prospectus does not constitute a prospectus, product disclosure statement or other disclosure document under the Corporations Act 2001, or the Corporations Act, and does not purport to include the information required for a prospectus, product disclosure statement or other disclosure document under the Corporations Act.
Any offer in Australia of our common shares may only be made to persons, or Exempt Investors, who are “sophisticated investors” (within the meaning of section 708(8) of the Corporations Act), “professional investors” (within the meaning of section 708(11) of the Corporations Act) or otherwise pursuant to one or more exemptions contained in section 708 of the Corporations Act so that it is lawful to offer our common shares without disclosure to investors under Chapter 6D of the Corporations Act.
The common shares applied for by Exempt Investors in Australia must not be offered for sale in Australia in the period of 12 months after the date of allotment under the offering, except in circumstances where disclosure to investors under Chapter 6D of the Corporations Act would not be required pursuant to an exemption under section 708 of the Corporations Act or otherwise or where the offer is pursuant to a disclosure document which complies with Chapter 6D of the Corporations Act. Any person acquiring our common shares must observe such Australian on-sale restrictions.
This prospectus contains general information only and does not take account of the investment objectives, financial situation or particular needs of any particular person. It does not contain any securities recommendations or financial product advice. Before making an investment decision, investors need to consider whether the information in this prospectus is appropriate to their needs, objectives and circumstances, and, if necessary, seek expert advice on those matters.
227
Table of Contents
Certain legal matters in connection with the offering relating to U.S. law will be passed upon for Knowlton Development Corporation, Inc. by Davis Polk & Wardwell LLP, New York, New York. The validity of the issuance of the common shares offered hereby and other legal matters in connection with the offering relating to Canadian law will be passed upon for Knowlton Development Corporation, Inc. by Stikeman Elliott LLP, Montréal, Québec. The underwriters in this offering are being represented by Sullivan & Cromwell LLP, New York, New York, with respect to U.S. law and Osler, Hoskin & Harcourt LLP, Montréal, Québec, with respect to Canadian law.
The consolidated financial statements of Knowlton Development Parent, Inc. (the “Company”) as of April 30, 2021 and 2020 (Successor), and for the years ended April 30, 2021 and 2020 (Successor), the period from November 30, 2018 to April 30, 2019 (Successor) and the period from May 1, 2018 to December 20, 2018 (Predecessor), have been included herein and in the registration statement in reliance upon the report of KPMG LLP, independent registered public accounting firm, appearing elsewhere herein, and upon the authority of said firm as experts in accounting and auditing. The audit report refers to a change in the method of accounting for leases and a different cost basis in the periods after the December 21, 2018 acquisition than that for the period before the acquisition.
In connection with our filing of this registration statement, we requested that KPMG LLP, our independent registered public accounting firm, affirm its independence under the rules and regulations of the Public Company Accounting Oversight Board, or the PCAOB, and the Securities and Exchange Commission, or the SEC.
Through its independence evaluation procedures, KPMG LLP identified a non-audit service and related fee arrangement at a subsidiary of the Company that are not permissible under SEC and PCAOB independence rules. During the fiscal year ended April 30, 2021, a member firm of KPMG International provided a tax legal service with a contingent fee arrangement to a Brazilian subsidiary of the Company which were permissible under the local and International Ethics Standards Board for Accountants independence rules but are prohibited under SEC and PCAOB independence rules. Such service was terminated after the service was identified as being impermissible under SEC and PCAOB independence rules.
The impermissible service was delivered to an immaterial subsidiary of the Company and the fees for this service were insignificant to the Company’s Brazilian subsidiary, the Company and to the KPMG member firm providing the service and KPMG LLP. The tax legal service provided to the Company’s Brazilian subsidiary and the contingent fee arrangement were entered into prior to the subsidiary becoming an affiliate of the Company. The activities performed in connection with the legal service were administrative in nature. The KPMG member firm that provided the service does not participate in the audit engagement of the Company, and the financial results of the Brazilian entity was not in the scope of audit procedures as part of KPMG LLP’s audit of our consolidated financial statements.
KPMG LLP considered whether the matter noted above impacted its objectivity and ability to exercise impartial judgment with regard to its engagement as our auditor and concluded that KPMG LLP is capable of exercising objective and impartial judgment on all matters encompassed within its audits. After taking into consideration the facts and circumstances of the above matter and KPMG LLP’s determination, the Audit Committee concurs with KPMG LLP’s conclusions.
228
Table of Contents
WHERE YOU CAN FIND MORE INFORMATION
We have filed with the SEC a registration statement on Form S-1 under the Securities Act with respect to the common shares offered hereby. This prospectus does not contain all of the information set forth in the registration statement and the exhibits and schedules thereto. For further information with respect to the Company and our common shares, reference is made to the registration statement and the exhibits and any schedules filed therewith. Statements contained in this prospectus as to the contents of any contract or other document referred to are not necessarily complete and, in each instance, if such contract or document is filed as an exhibit, reference is made to the copy of such contract or other document filed as an exhibit to the registration statement, each statement being qualified in all respects by such reference. The SEC maintains an internet site at www.sec.gov, from which interested persons can electronically access the registration statement, including the exhibits and any schedules thereto.
As a result of the offering, we will be required to file periodic reports and other information with the SEC. We also maintain a website at www.kdc-one.com. Our website and the information contained therein or connected thereto shall not be deemed to be incorporated into this prospectus or the registration statement of which it forms a part.
We will also be subject to the full informational requirements of the securities commissions in all provinces and territories of Canada. You are invited to read and copy any reports, statements or other information, other than confidential filings, that we intend to file with the Canadian securities regulatory authorities. These filings are also electronically available from SEDAR at www.sedar.com, the Canadian equivalent of the SEC’s Electronic Document Gathering and Retrieval System. Documents filed on SEDAR are not, and should not be considered, part of this prospectus or the registration statement of which it forms a part.
229
Table of Contents
KNOWLTON DEVELOPMENT CORPORATION, INC.
(previously Knowlton Development Parent, Inc.)(1)
INDEX TO CONSOLIDATED FINANCIAL STATEMENTS
| Page | ||||
| Financial Statements: | ||||
| As of April 30, 2021 and 2020 (Successor) and for the year ended April 30, 2021 (Successor), for the year ended April 30, 2020 (Successor) and for the periods November 30, 2018 through April 30, 2019 (Successor) and May 1, 2018 through December 20, 2018 (Predecessor). |
| |||
| F-2 | ||||
| F-5 | ||||
| F-6 | ||||
| F-7 | ||||
| F-8 | ||||
| F-10 | ||||
| F-11 | ||||
| Financial Statements (Unaudited): | ||||
| As of July 31, 2021 (Successor) and for the three months ended July 31, 2021 and 2020 (Successor). |
| |||
| F-75 | ||||
| F-76 | ||||
| F-77 | ||||
| F-78 | ||||
| F-79 | ||||
| F-80 | ||||
| (1) | See Note 1, Basis of Presentation and Summary of Significant Accounting Policies to unaudited consolidated financial statements for the three months ended July 31, 2021. |
F-1
Table of Contents

|
KPMG LLP | Telephone | (514) 840-2100 | |||
| 600 de Maisonneuve Blvd. West | Fax | (514) 840-2187 | ||||
| Suite 1500, Tour KPMG | Internet | www.kpmg.ca | ||||
| Montréal (Québec) H3A 0A3 | ||||||
| Canada |
Report of Independent Registered Public Accounting Firm
To the Shareholders and Board of Directors of Knowlton Development Parent, Inc.:
Opinion on the Consolidated Financial Statements
We have audited the accompanying consolidated balance sheets of Knowlton Development Parent, Inc. (the Company) as of April 30, 2021 and 2020 (Successor), the related consolidated statements of operations, comprehensive loss, change in shareholders’ equity, and cash flows for the years ended April 30, 2021 and 2020 (Successor), the period from November 30, 2018 to April 30, 2019 (Successor) and the period from May 1, 2018 to December 20, 2018 (Predecessor), and the related notes (collectively, the consolidated financial statements). In our opinion, the consolidated financial statements present fairly, in all material respects, the financial position of the Company as of April 30, 2021 and 2020 (Successor), and the results of its operations and its cash flows for the years ended April 30, 2021 and 2020 (Successor) and for the period from November 30, 2018 to April 30, 2019 (Successor) and the period from May 1, 2018 to December 20, 2018 (Predecessor), in conformity with U.S. generally accepted accounting principles.
Change in Accounting Principle
As discussed in Note 2 to the consolidated financial statements, the Company has changed its method of accounting for leases as of May 1, 2019 due to the adoption of Accounting Standards Codification Topic 842 Leases.
New Basis of Accounting
As discussed in Note 1 to the consolidated financial statements, effective December 21, 2018, the Company was acquired in a business combination accounted for as an acquisition. As a result of the acquisition, the consolidated financial information for the periods after the acquisition is presented on a different cost basis than that for the period before the acquisition and, therefore, is not comparable.
Basis for Opinion
These consolidated financial statements are the responsibility of the Company’s management. Our responsibility is to express an opinion on these consolidated financial statements based on our audits. We are a public accounting firm registered with the Public Company Accounting Oversight Board (United States) (PCAOB) and are required to be independent with respect to the Company in accordance with the U.S. federal securities laws and the applicable rules and regulations of the Securities and Exchange Commission and the PCAOB.
We conducted our audits in accordance with the standards of the PCAOB. Those standards require that we plan and perform the audit to obtain reasonable assurance about whether the consolidated financial statements are free of material misstatement, whether due to error or fraud. Our audits included performing procedures to assess the risks of material misstatement of the consolidated financial statements, whether due to error or fraud, and performing procedures that respond to those risks. Such procedures included examining, on a test basis, evidence regarding the amounts and disclosures in the consolidated financial statements. Our audits also included evaluating the accounting principles used and significant estimates made by management, as well as evaluating the overall presentation of the consolidated financial statements. We believe that our audits provide a reasonable basis for our opinion.
F-2
Table of Contents
Critical Audit Matter
The critical audit matter communicated below is a matter arising from the current period audit of the consolidated financial statements that was communicated or required to be communicated to the audit committee and that: (1) relates to accounts or disclosures that are material to the consolidated financial statements and (2) involved our especially challenging, subjective, or complex judgments. The communication of a critical audit matter does not alter in any way our opinion on the consolidated financial statements, taken as a whole, and we are not, by communicating the critical audit matter below, providing a separate opinion on the critical audit matter or on the accounts or disclosures to which it relates.
Goodwill impairment assessment
As discussed in note 2 to the consolidated financial statements, the Company assesses goodwill for impairment annually in the fourth quarter or more frequently if events or changes in circumstances indicate that the carrying value of a reporting unit may be impaired. As discussed in note 11 to the consolidated financial statements, the Company’s goodwill balance as of April 30, 2021 is $973.7 million, of which the Beauty & Personal Care reporting unit balance is $747.5 million. At the end of the second quarter of fiscal year 2021, the Company underwent a strategic reorganization to realign the business into two operating and reportable segments. This strategic reorganization required the Company to determine its new reporting units. The Company performed goodwill impairment testing immediately before and after the strategic reorganization and recorded a goodwill impairment loss of $47.3 million for the HCT reporting unit. In the fourth quarter of fiscal year 2021, the Company performed its annual goodwill impairment testing which results in no incremental impairment. The Company uses a discounted cash flow methodology to estimate the fair value of the reporting units. The significant assumptions used in the methodology that are subject to measurement uncertainty are revenue growth rates, earnings before interest, income tax, depreciation and amortization expenses (“EBITDA”), terminal growth and weighted average cost of capital discount rates. Additional uncertainty existed in the forecasted cash flows due to the COVID-19 pandemic impact, including the projected timing of the recovery.
We identified the goodwill impairment assessment of the HCT reporting unit and one other reporting unit prior to the strategic reorganization, and for the Beauty & Personal Care reporting unit after the strategic reorganization, as a critical audit matter. There was a high degree of auditor judgment and subjectivity required in applying procedures and evaluating evidence related to (i) the determination of the new reporting units after the strategic reorganization and (ii) the significant assumptions used in the discounted cash flow methodology, which required specialized skills and knowledge. Further, minor changes in any of the above assumptions could have had a significant effect on the determination of the estimated fair value of the Beauty & Personal Care reporting unit in the fourth quarter of fiscal year 2021.
The following are the primary procedures we performed to address this critical audit matter. We evaluated the design of certain internal controls over the Company’s goodwill impairment process. This included controls related to the determination of the estimated fair value of the reporting units and the development of the significant assumptions. We evaluated management’s determination of the new reporting units after the strategic reorganization, including the economic characteristics considered in the assessment. We compared the Company’s revenue growth rates and EBITDA used in the discounted cash flow methodology to historical actual results, the long-term strategic plan, and revenue growth rates of the industry based on publicly available market data. We compared the Company’s EBITDA to actual results to assess the Company’s ability to accurately forecast. In addition, we involved a valuation professional with specialized skills and knowledge, who assisted in:
| • | evaluating the Company’s discount rates by comparing to ranges that were independently developed using publicly available market data for peer companies |
| • | evaluating the Company’s terminal growth rates by comparing to the forecasted industry growth and economic growth independently developed using independent research and a publication |
| • | comparing the Company’s aggregate EBITDA multiple to publicly available market multiples for comparable companies. |
F-3
Table of Contents
/s/ KPMG LLP
We have served as the Company’s auditor since 2015.
Montréal, Canada
June 29, 2021, except for Note 15, as to which the date is August 27, 2021, and Note 26, as to which the date is September 13, 2021
KPMG LLP, an Ontario limited liability partnership and member firm of the KPMG global organization of independent member firms affiliated with KPMG International Limited, a private English company limited by guarantee. KPMG Canada provides services to KPMG LLP.
F-4
Table of Contents
Knowlton Development Parent, Inc.
(In millions of U.S. dollars, except share amounts)
| Successor | ||||||||
| April 30, 2021 | April 30, 2020 | |||||||
| ASSETS |
||||||||
| Current assets |
||||||||
| Cash and cash equivalents |
$ | 118.0 | $ | 173.8 | ||||
| Trade and other receivables, net |
289.9 | 272.7 | ||||||
| Related party receivables |
0.4 | 5.3 | ||||||
| Income taxes receivable |
20.3 | 22.4 | ||||||
| Inventories |
265.1 | 220.5 | ||||||
| Prepaid expenses and other current assets |
31.4 | 28.0 | ||||||
|
|
|
|
|
|||||
| Total current assets |
725.1 | 722.7 | ||||||
| Property, plant and equipment, net |
519.9 | 455.2 | ||||||
| Operating lease right-of-use assets |
144.8 | 125.1 | ||||||
| Other assets |
10.1 | 4.7 | ||||||
| Goodwill |
973.7 | 1,019.0 | ||||||
| Other intangibles, net |
1,196.5 | 1,265.7 | ||||||
| Deferred income tax asset |
4.0 | — | ||||||
|
|
|
|
|
|||||
| Total assets |
$ | 3,574.1 | $ | 3,592.4 | ||||
|
|
|
|
|
|||||
| LIABILITIES AND SHAREHOLDERS’ EQUITY |
||||||||
| Current liabilities |
||||||||
| Accounts payable |
257.1 | 219.2 | ||||||
| Related party payables |
19.3 | 13.3 | ||||||
| Accrued expenses and other payables |
158.9 | 160.0 | ||||||
| Deferred revenue |
35.6 | 31.3 | ||||||
| Income taxes payable |
12.0 | 14.9 | ||||||
| Current portion of operating lease liabilities |
22.0 | 19.2 | ||||||
| Current portion of long-term debt |
18.0 | 16.1 | ||||||
|
|
|
|
|
|||||
| Total current liabilities |
522.9 | 474.0 | ||||||
| Operating lease liabilities |
133.1 | 104.8 | ||||||
| Long-term debt |
1,701.8 | 1,486.6 | ||||||
| Deferred income tax liability |
272.4 | 302.6 | ||||||
| Other liabilities |
8.5 | 4.7 | ||||||
|
|
|
|
|
|||||
| Total liabilities |
$ | 2,638.7 | $ | 2,372.7 | ||||
|
|
|
|
|
|||||
| Commitments and contingencies (Note 21) |
||||||||
| Shareholders’ equity |
||||||||
| Class A Common Shares, no par value (unlimited shares authorized, 1,353,183 and 1,233,183 shares issued and outstanding as of April 30, 2021 and 2020, respectively); Class B Common Shares, no par value (unlimited shares authorized, 16,541 and 15,667 shares issued and outstanding as of April 30, 2021 and 2020, respectively) |
1,143.1 | 1,310.6 | ||||||
| Shares to be issued |
1.1 | — | ||||||
| Additional paid-in capital |
5.2 | 1.7 | ||||||
| Accumulated deficit |
(217.0 | ) | (91.2 | ) | ||||
| Accumulated other comprehensive income (loss) |
3.0 | (1.4 | ) | |||||
|
|
|
|
|
|||||
| Total shareholders’ equity |
935.4 | 1,219.7 | ||||||
|
|
|
|
|
|||||
| Total liabilities and shareholders’ equity |
$ | 3,574.1 | $ | 3,592.4 | ||||
|
|
|
|
|
|||||
See accompanying Notes to Consolidated Financial Statements.
F-5
Table of Contents
Knowlton Development Parent, Inc.
Consolidated Statements of Operations
(In millions of U.S. dollars, except share and per share amounts)
| Successor | Predecessor | |||||||||||||||
| For the Year ended April 30, 2021 |
For the Year ended April 30, 2020 |
For the Period from November 30, 2018 through April 30, 2019 |
For the Period from May 1, 2018 through December 20, 2018 |
|||||||||||||
| Revenue |
$ | 2,143.8 | $ | 1,093.4 | $ | 369.8 | $ | 632.8 | ||||||||
| Cost of revenue |
1,817.7 | 944.6 | 320.4 | 546.4 | ||||||||||||
|
|
|
|
|
|
|
|
|
|||||||||
| Gross profit |
326.1 | 148.8 | 49.4 | 86.4 | ||||||||||||
| Operating expenses |
||||||||||||||||
| Selling, general and administrative expenses |
286.8 | 135.3 | 34.9 | 69.7 | ||||||||||||
| Acquisition-related costs and other expenses |
40.1 | 59.7 | 9.4 | 25.9 | ||||||||||||
| Impairment loss on goodwill and other intangibles |
48.2 | — | — | — | ||||||||||||
|
|
|
|
|
|
|
|
|
|||||||||
| Operating income (loss) |
(49.0 | ) | (46.2 | ) | 5.1 | (9.2 | ) | |||||||||
| Interest expense |
78.2 | 47.4 | 14.4 | 13.3 | ||||||||||||
| Other expense (income), net |
11.7 | 2.4 | 0.5 | 1.1 | ||||||||||||
|
|
|
|
|
|
|
|
|
|||||||||
| Loss before income taxes |
(138.9 | ) | (96.0 | ) | (9.8 | ) | (23.6 | ) | ||||||||
|
|
|
|
|
|
|
|
|
|||||||||
| Income tax benefit |
(13.1 | ) | (14.1 | ) | (0.5 | ) | (0.9 | ) | ||||||||
|
|
|
|
|
|
|
|
|
|||||||||
| Net loss |
$ | (125.8 | ) | $ | (81.9 | ) | $ | (9.3 | ) | $ | (22.7 | ) | ||||
|
|
|
|
|
|
|
|
|
|||||||||
| Weighted-average shares outstanding – basic and diluted |
1,324,110 | 857,883 | 641,424 | 309,344,128 | ||||||||||||
|
|
|
|
|
|
|
|
|
|||||||||
| Net loss per share – basic and diluted |
$ | (95.01 | ) | $ | (95.47 | ) | $ | (14.50 | ) | $ | (0.07 | ) | ||||
|
|
|
|
|
|
|
|
|
|||||||||
| Unaudited Pro Forma Data(1) |
||||||||||||||||
| Pro forma weighted-average shares outstanding – basic and diluted |
1,821,004 | |||||||||||||||
|
|
|
|||||||||||||||
| Pro forma net loss per share – basic and diluted |
$ | (86.33) | ||||||||||||||
|
|
|
|||||||||||||||
| (1) | See Note 1, Description of Business and Basis of Presentation and Note 22, Net Loss per Share to consolidated financial statements. |
Net loss is attributable entirely to the shareholders of the Company.
See accompanying Notes to Consolidated Financial Statements.
F-6
Table of Contents
Knowlton Development Parent, Inc.
Consolidated Statements of Comprehensive Loss
(In millions of U.S. dollars)
| Successor | Predecessor | |||||||||||||||
| For the Year ended April 30, 2021 |
For the Year ended April 30, 2020 |
For the Period from November 30, 2018 through April 30, 2019 |
For the Period from May 1, 2018 through December 20, 2018 |
|||||||||||||
| Net loss |
$ | (125.8 | ) | $ | (81.9 | ) | $ | (9.3 | ) | $ | (22.7 | ) | ||||
| Other comprehensive income (loss), net of income taxes |
||||||||||||||||
| Foreign currency translation adjustments |
10.3 | (1.8 | ) | — | — | |||||||||||
| Net investment hedge |
(5.8 | ) | — | — | — | |||||||||||
| Gain (loss) on cash flow hedges, net of income tax (expense) benefit of $0.1, $(0.1), $0.0, and $0.6 |
(0.1 | ) | 0.4 | — | (1.7 | ) | ||||||||||
|
|
|
|
|
|
|
|
|
|||||||||
| Total other comprehensive income (loss), net of income taxes |
4.4 | (1.4 | ) | — | (1.7 | ) | ||||||||||
|
|
|
|
|
|
|
|
|
|||||||||
| Comprehensive loss |
$ | (121.4 | ) | $ | (83.3 | ) | $ | (9.3 | ) | $ | (24.4 | ) | ||||
|
|
|
|
|
|
|
|
|
|||||||||
Comprehensive loss is attributable entirely to the shareholders of the Company.
See accompanying Notes to Consolidated Financial Statements.
F-7
Table of Contents
Knowlton Development Parent, Inc.
Consolidated Statements of Change in Shareholders’ Equity
(In millions of U.S. dollars, except share amounts)
| Predecessor | ||||||||||||||||||||
| Share capital | Retained Earnings |
Accumulated Other Comprehensive Income (Loss) |
Total Equity |
|||||||||||||||||
| Shares | Amount | |||||||||||||||||||
| Balance – As of April 30, 2018 |
309,344,128 | $ | 339.8 | $ | 64.0 | $ | 0.3 | $ | 404.1 | |||||||||||
| Net loss |
— | — | (22.7 | ) | — | (22.7 | ) | |||||||||||||
| Other comprehensive loss |
— | — | — | (1.7 | ) | (1.7 | ) | |||||||||||||
|
|
|
|
|
|
|
|
|
|
|
|||||||||||
| Balance – As of December 20, 2018 |
309,344,128 | $ | 339.8 | $ | 41.3 | $ | (1.4 | ) | $ | 379.7 | ||||||||||
|
|
|
|
|
|
|
|
|
|
|
|||||||||||
| Successor | ||||||||||||||||||||||||||||||||
| Class A Common Shares |
Class B Common Shares |
Additional Paid-in Capital |
Accumulated Deficit |
Accumulated Other Comprehensive Loss |
Total Equity |
|||||||||||||||||||||||||||
| Shares | Amount | Shares | Amount | |||||||||||||||||||||||||||||
| Balance – As of November 30, 2018 |
— | $ | — | — | $ | — | $ | — | $ | — | $ | — | $ | — | ||||||||||||||||||
| Issuance of shares |
733,001 | 733.0 | 6,350 | 6.4 | — | — | — | 739.4 | ||||||||||||||||||||||||
| Net loss |
— | — | — | — | — | (9.3 | ) | — | (9.3 | ) | ||||||||||||||||||||||
|
|
|
|
|
|
|
|
|
|
|
|
|
|
|
|
|
|||||||||||||||||
| Balance – As of April 30, 2019 |
733,001 | $ | 733.0 | 6,350 | $ | 6.4 | $ | — | $ | (9.3 | ) | $ | — | $ | 730.1 | |||||||||||||||||
|
|
|
|
|
|
|
|
|
|
|
|
|
|
|
|
|
|||||||||||||||||
| Net loss |
— | — | — | — | — | (81.9 | ) | — | (81.9 | ) | ||||||||||||||||||||||
| Other comprehensive loss |
— | — | — | — | — | — | (1.4 | ) | (1.4 | ) | ||||||||||||||||||||||
| Share-based compensation |
— | — | — | — | 1.7 | — | — | 1.7 | ||||||||||||||||||||||||
| Issuance of shares |
500,182 | 561.0 | 9,317 | 10.2 | — | — | — | 571.2 | ||||||||||||||||||||||||
|
|
|
|
|
|
|
|
|
|
|
|
|
|
|
|
|
|||||||||||||||||
| Balance – As of April 30, 2020 |
1,233,183 | $ | 1,294.0 | 15,667 | $ | 16.6 | $ | 1.7 | $ | (91.2 | ) | $ | (1.4 | ) | $ | 1,219.7 | ||||||||||||||||
|
|
|
|
|
|
|
|
|
|
|
|
|
|
|
|
|
|||||||||||||||||
| Successor | ||||||||||||||||||||||||
| Class A Common Shares |
Class B Common Shares |
Shares to be Issued |
||||||||||||||||||||||
| Shares | Amount | Shares | Amount | Shares | Amount | |||||||||||||||||||
| Balance – As of April 30, 2020 |
1,233,183 | $ | 1,294.0 | 15,667 | $ | 16.6 | — | $ | — | |||||||||||||||
| Net loss |
— | — | — | — | — | — | ||||||||||||||||||
| Other comprehensive income |
— | — | — | — | — | — | ||||||||||||||||||
| Share-based compensation |
— | — | — | — | — | — | ||||||||||||||||||
| Options exercised |
— | — | 711 | 0.8 | — | — | ||||||||||||||||||
| Issuance of shares |
120,000 | 150.0 | 363 | 0.4 | — | — | ||||||||||||||||||
| Shares to be issued |
— | — | — | — | 703 | 1.1 | ||||||||||||||||||
| Repurchase of shares |
— | — | (200 | ) | (0.2 | ) | — | — | ||||||||||||||||
| Returns of capital to shareholders |
— | (314.8 | ) | — | (3.7 | ) | — | — | ||||||||||||||||
|
|
|
|
|
|
|
|
|
|
|
|
|
|||||||||||||
| Balance – As of April 30, 2021 |
1,353,183 | $ | 1,129.2 | 16,541 | $ | 13.9 | 703 | $ | 1.1 | |||||||||||||||
|
|
|
|
|
|
|
|
|
|
|
|
|
|||||||||||||
F-8
Table of Contents
| Successor | ||||||||||||||||
| Additional Paid-In Capital |
Accumulated Deficit |
Accumulated Other Comprehensive Income (Loss) |
Total Equity | |||||||||||||
| Balance – As of April 30, 2020 |
$ | 1.7 | $ | (91.2 | ) | $ | (1.4 | ) | $ | 1,219.7 | ||||||
| Net loss |
— | (125.8 | ) | — | (125.8 | ) | ||||||||||
| Other comprehensive income |
— | — | 4.4 | 4.4 | ||||||||||||
| Share-based compensation |
3.7 | — | — | 3.7 | ||||||||||||
| Options exercised |
(0.2 | ) | — | — | 0.6 | |||||||||||
| Issuance of shares |
— | — | — | 150.4 | ||||||||||||
| Shares to be issued |
— | — | — | 1.1 | ||||||||||||
| Repurchase of shares |
— | — | — | (0.2 | ) | |||||||||||
| Returns of capital to shareholders |
— | — | — | (318.5 | ) | |||||||||||
|
|
|
|
|
|
|
|
|
|||||||||
| Balance – As of April 30, 2021 |
$ | 5.2 | $ | (217.0 | ) | $ | 3.0 | $ | 935.4 | |||||||
|
|
|
|
|
|
|
|
|
|||||||||
See accompanying Notes to Consolidated Financial Statements.
F-9
Table of Contents
Knowlton Development Parent, Inc.
Consolidated Statements of Cash Flows
(In millions of U.S. dollars)
| Successor | Predecessor | |||||||||||||||
| For the Year ended April 30, 2021 |
For the Year ended April 30, 2020 |
For the Period from November 30, 2018 through April 30, 2019 |
For the Period from May 1, 2018 through December 20, 2018 |
|||||||||||||
| Cash Flows From Operating Activities |
||||||||||||||||
| Net loss |
$ | (125.8 | ) | $ | (81.9 | ) | $ | (9.3 | ) | $ | (22.7 | ) | ||||
| Adjustments to reconcile net loss to net cash provided by (used in) operating activities: |
||||||||||||||||
| Depreciation and amortization |
151.3 | 70.2 | 20.5 | 26.2 | ||||||||||||
| Amortization of debt discount and deferred financing costs |
10.6 | 5.1 | 1.0 | 1.7 | ||||||||||||
| Share-based compensation |
8.5 | 1.7 | — | 16.5 | ||||||||||||
| Change in fair value of derivative financial instruments |
— | — | — | (1.7 | ) | |||||||||||
| Benefit for deferred income taxes |
(25.6 | ) | (13.4 | ) | (0.2 | ) | (3.5 | ) | ||||||||
| Settlement of share-based compensation liability |
— | — | (16.5 | ) | — | |||||||||||
| Net foreign exchange gains |
(17.1 | ) | (1.4 | ) | — | — | ||||||||||
| Impairment loss on goodwill and other intangibles |
48.2 | — | — | — | ||||||||||||
| Impairment loss on right-of-use assets |
6.1 | — | — | — | ||||||||||||
| Other, net |
7.0 | 5.2 | 0.6 | 0.1 | ||||||||||||
| Changes in operating assets and liabilities, excluding the effect of businesses acquired: |
||||||||||||||||
| Trade and other receivables |
(11.0 | ) | 38.8 | (16.1 | ) | 6.4 | ||||||||||
| Related party receivables |
0.1 | (5.3 | ) | — | — | |||||||||||
| Inventories |
(39.7 | ) | 14.9 | 12.7 | (35.3 | ) | ||||||||||
| Prepaid expenses and other current assets |
(3.2 | ) | (1.0 | ) | (0.9 | ) | (0.1 | ) | ||||||||
| Prepaid expenses to related parties |
— | 2.7 | (2.7 | ) | — | |||||||||||
| Accounts payable, accrued expenses and other payables |
37.6 | (10.9 | ) | (35.3 | ) | 41.6 | ||||||||||
| Related party payables |
5.2 | 14.0 | (0.4 | ) | (0.9 | ) | ||||||||||
| Deferred revenue |
4.2 | 1.5 | (0.1 | ) | (0.8 | ) | ||||||||||
| Income taxes payable |
(4.7 | ) | (6.9 | ) | (0.9 | ) | 1.4 | |||||||||
|
|
|
|
|
|
|
|
|
|||||||||
| Net cash provided by (used in) operating activities |
51.7 | 33.3 | (47.6 | ) | 28.9 | |||||||||||
|
|
|
|
|
|
|
|
|
|||||||||
| Cash Flows From Investing Activities |
||||||||||||||||
| Business combinations, net of cash acquired |
(21.4 | ) | (949.3 | ) | (640.1 | ) | 0.6 | |||||||||
| Receipt of post-closing consideration |
7.1 | 5.6 | — | — | ||||||||||||
| Additions to property, plant and equipment |
(103.4 | ) | (25.8 | ) | (7.1 | ) | (9.5 | ) | ||||||||
|
|
|
|
|
|
|
|
|
|||||||||
| Net cash used in investing activities |
(117.7 | ) | (969.5 | ) | (647.2 | ) | (8.9 | ) | ||||||||
|
|
|
|
|
|
|
|
|
|||||||||
| Cash Flows From Financing Activities |
||||||||||||||||
| Proceeds from Revolving Facility |
177.0 | 119.0 | 20.0 | — | ||||||||||||
| Repayment of Revolving Facility |
(119.0 | ) | (2.0 | ) | (18.0 | ) | — | |||||||||
| Proceeds from long-term debt |
648.2 | 902.5 | 514.5 | — | ||||||||||||
| Repayment of long-term debt |
(514.3 | ) | (303.2 | ) | (313.9 | ) | (7.1 | ) | ||||||||
| Payments of finance lease liabilities |
(1.9 | ) | (1.6 | ) | — | (0.8 | ) | |||||||||
| Transaction costs related to long-term debt |
(9.2 | ) | (28.1 | ) | (14.7 | ) | (0.1 | ) | ||||||||
| Contingent consideration paid |
(2.5 | ) | — | — | — | |||||||||||
| Issuance of shares |
151.0 | 421.2 | 510.4 | — | ||||||||||||
| Repurchase of shares |
(0.1 | ) | — | — | — | |||||||||||
| Returns of capital to shareholders |
(318.5 | ) | — | — | — | |||||||||||
| Cash settlement of options |
(4.8 | ) | — | — | — | |||||||||||
|
|
|
|
|
|
|
|
|
|||||||||
| Net cash provided by (used in) financing activities |
5.9 | 1,107.8 | 698.3 | (8.0 | ) | |||||||||||
|
|
|
|
|
|
|
|
|
|||||||||
| Effect of exchange rate changes on cash and cash equivalents |
4.3 | (1.3 | ) | — | — | |||||||||||
|
|
|
|
|
|
|
|
|
|||||||||
| Net change in cash and cash equivalents |
(55.8 | ) | 170.3 | 3.5 | 12.0 | |||||||||||
|
|
|
|
|
|
|
|
|
|||||||||
| Cash and cash equivalents, beginning of period |
173.8 | 3.5 | — | 0.9 | ||||||||||||
|
|
|
|
|
|
|
|
|
|||||||||
| Cash and cash equivalents, end of period |
$ | 118.0 | $ | 173.8 | $ | 3.5 | $ | 12.9 | ||||||||
|
|
|
|
|
|
|
|
|
|||||||||
Supplemental Cash Flow Information (Note 23)
See accompanying Notes to Consolidated Financial Statements.
F-10
Table of Contents
Knowlton Development Parent, Inc.
Notes to Consolidated Financial Statements
(In millions of U.S. dollars, except share amounts)
| 1 | Description of Business and Basis of Presentation |
Description of Business
Knowlton Development Parent, Inc. and its subsidiaries (the “Company”) provide integrated product solutions to some of the largest, world-renowned consumer products companies, as well as innovative independent brands, focusing on value added and technologically advanced offerings. The Company has grown organically as well as through acquisitions to become a market leader in the global beauty and personal care and home care markets. The Company is a manufacturer and custom formulator of skin care products, body and hair care products, soaps and sanitizers, cosmetics, deodorants, sun care products, fragrances, air care, fabric care, pest control solutions, surface care products and auto care solutions, as well as a leader in the development and manufacture of complex and highly technical dispensing devices.
The Company operates in two product-centric reporting segments that are aligned with its organizational structure: (i) Beauty and Personal Care and (ii) Home Care. Beauty and Personal Care includes skin care products, body and hair care products, soaps and sanitizers, cosmetics, deodorants, sun care products and fragrances. Home Care includes air care, fabric care, pest control solutions, surface care products and auto care solutions.
Knowlton Development Parent, Inc. is domiciled in Canada and was incorporated under the Business Corporations Act (British Columbia) on November 30, 2018. The Company’s registered office is located at Suite 1700, Park Place, 666 Burrard Street, Vancouver, British Columbia, Canada, V6C 2X8. The Company’s principal executive office in Canada is located at 375 Roland-Therrien Boulevard, Suite 201, Longueuil, Québec, Canada, J4H 4A6. The Company also maintains a principal executive office in the United States, located at 250 Pehle Avenue, Suite 1000, Saddle Brook, New Jersey 07663.
Recapitalization
A purchase agreement (the “Purchase Agreement”) was entered into on October 26, 2018 among Knowlton Development Corporation Inc., the holders of all its issued and outstanding common shares and the purchaser named therein (the “Purchaser”), which was formed by Cornell Capital LLC for the purpose of consummating the transactions under the Purchase Agreement. On December 21, 2018 (the “Closing Date”), Cornell Capital LLC transferred its ownership of the Purchaser to Knowlton Development Parent, Inc., which was incorporated by a group of investors led by Cornell Capital LLC in British Columbia on November 30, 2018 originally as a holding company with no assets or operations of its own. The Purchaser was subsequently amalgamated with Knowlton Development Corporation Inc. (“KDC Opco”) immediately following the acquisition of the outstanding common shares of Knowlton Development Corporation Inc. by Knowlton Development Parent, Inc. through the Purchaser. This is referred to herein as the Acquisition. Prior to the Acquisition, Knowlton Development Parent, Inc.’s efforts were limited to organizational activities directly related to the Acquisition and for which it incurred acquisition-related costs. The 21-day overlap between Knowlton Development Parent, Inc.’s incorporation and the Closing Date is not presented as a separate financial statement as there were no operations by Knowlton Development Parent, Inc. between the date of its incorporation and the Closing Date except for the organizational activities mentioned above. Knowlton Development Parent, Inc. currently owns no significant assets nor has any operations other than the ownership of all the common shares of KDC Opco (through Knowlton Development Holdco, Inc.).
Basis of Presentation
As a result of the Acquisition, Knowlton Development Parent, Inc. was identified as the acquirer for accounting purposes, and Knowlton Development Corporation Inc. as the acquiree and accounting predecessor. The
F-11
Table of Contents
Company’s financial statement presentation distinguishes (i) a “Predecessor” period for the 234-day period from May 1, 2018 to December 20, 2018 (i.e., the 234 days of the fiscal year prior to the Closing Date), which reflects the financial statements for Knowlton Development Corporation Inc. for the period prior to the Closing Date and (ii) a “Successor” period for the years ended April 30, 2021 and 2020 and the 152-day period ended April 30, 2019 (i.e., the 152 days following Knowlton Development Parent, Inc.’s incorporation) which reflects the financial statements of the Company for the period after the Closing Date. The Acquisition was accounted for as a business combination using the acquisition method of accounting, and the Successor financial statements reflect a basis of accounting that is based on the fair value of the assets acquired and the liabilities assumed. As a result of the application of the acquisition method of accounting as of the Closing Date, the financial statements for the Predecessor period and for the Successor period are presented on a different basis and, therefore, are not comparable. The Company utilizes a fiscal year from May 1 to April 30, with quarter ends at July 31, October 31, January 31 and April 30.
Unaudited Pro Forma Information
On or about February 3, 2021, the Company effected returns of capital in the aggregate amount of $318.5, which were distributed to the Company’s shareholders (see Note 14, Shareholders’ Equity). Those returns of capital were funded, along with cash, by an increase in borrowings that took place on January 31, 2021 under the Euro Term Loan and the Revolving Facility (see Note 13, Debt). The Company intends to use all of the net proceeds it will receive from its initial public offering (“IPO”) to repay borrowings under the Credit Agreement, which includes all of the incremental borrowings used to fund the returns of capital.
Staff Accounting Bulletin 1.B.3 requires that certain distributions to owners prior to or concurrent with an IPO be considered as distributions in contemplation of that offering and therefore that pro forma basic and diluted earnings per share be presented giving effect to the number of shares whose proceeds would be used to pay such distribution.
In Note 22, Net Loss per Share, the calculation of the unaudited pro forma basic and diluted net loss per share for the year ended April 30, 2021 has been prepared to give effect to the following as if the underlying transaction had occurred on May 1, 2020:
| • | additional shares whose IPO proceeds are necessary to pay the returns of capital effected on or about February 3, 2021 based on the mid-point of the range on the cover page of the prospectus (considering that the incremental borrowings used to fund these returns of capital are intended to be repaid in full with the IPO net proceeds, for which interest expense has been excluded in the computation of pro forma net loss); |
| • | additional shares whose IPO proceeds are intended to be used to repay borrowings under the Credit Agreement (after giving effect to the repayment of debt described in the preceding bullet) based on the mid-point of the range on the cover page of the prospectus (for which interest expense has been excluded in the computation of pro forma net loss); |
| • | write-off of debt transaction costs and debt issuance discounts related to the repayment of debt described above; |
| • | additional share-based compensation expense triggered by the IPO. As further described in Note 15, Employee Benefits, upon the completion of an IPO, performance-based vesting options will vest on a straight-line basis over the first five years after the original grant date and as such, an expense is required for services that have been provided by the employees from the service inception date until the IPO; |
| • | additional sponsor fees to Cornell Capital LLC triggered by the IPO, as further described in Note 20, Related Party Transactions; and |
| F-12 |
Table of Contents
| • | the consequential income tax adjustments. |
| 2 | Summary of Significant Accounting Policies |
A summary of the significant accounting policies applied in the preparation of these consolidated financial statements is described below.
Basis of Consolidation
The consolidated financial statements included herein have been prepared in accordance with accounting principles generally accepted in the United States (“GAAP”). The consolidated financial statements include the accounts of Knowlton Development Parent, Inc. and its subsidiaries in which the Company has a controlling financial interest. All intercompany balances and transactions have been eliminated from the Company’s consolidated financial statements.
Investments in companies with interests ranging between 20% and 50%, where the Company has significant influence over the investee, are accounted for using the equity method. Investments with less than a 20% interest are recorded at cost, less impairment, plus/minus subsequent observable price changes, and are assessed quarterly to determine whether or not a triggering event has occurred that results in changes in fair value. These investments are included in other assets in the consolidated balance sheets.
Business Combinations
The Company applies the acquisition method to account for business combinations. The consideration transferred for the acquisition of a business is the fair value of the net assets transferred to the former owners of the acquired business and the equity interests issued by the Company. Identifiable assets acquired and liabilities and contingent liabilities assumed in a business combination are generally measured initially at their fair values at the acquisition date. Acquisition-related costs are expensed as incurred. Goodwill is initially measured as the excess of the consideration transferred over the fair value of the net identifiable assets including intangibles (other than goodwill) acquired and liabilities assumed.
If the agreement includes contingent consideration, such contingent consideration is measured at fair value as of the acquisition date and added to the consideration transferred. Contingent consideration is classified either as equity or as a financial liability. Amounts classified as financial liabilities are subsequently re-measured to fair value with changes in fair value recognized in other expense (income), net in the consolidated statements of operations.
If the initial accounting for a business combination is incomplete by the end of the reporting period in which the combination occurs, the Company records provisional amounts for the items for which the accounting is incomplete. During the measurement period (a period not to exceed twelve months from the acquisition date), those provisional amounts are adjusted in the reporting period in which the amounts are determined, or additional assets or liabilities are recognized, to reflect new information obtained about facts and circumstances that existed at the acquisition date that, if known, would have affected the amounts recognized at that date.
Use of Estimates
In preparing these financial statements, the Company is required to use estimates and assumptions that affect the reported amounts of assets and liabilities, the disclosure of contingent assets and liabilities at the date of the
| F-13 |
Table of Contents
financial statements and the reported amounts of revenues and expenses during the reporting period. Actual results could differ materially from those estimates and assumptions. On an ongoing basis, the Company reviews estimates, including those related to purchase acquisition accounting, allowances for current expected credit losses, the valuation allowance for deferred tax assets, the assessment of goodwill, other intangible assets and long-lived assets for impairment and useful life determinations, inventory obsolescence reserves, share-based compensation, legal and other contingency reserves.
The COVID-19 pandemic has negatively impacted the global economy, disrupted supply chains and created significant volatility in global financial markets. Many countries in which we operate initiated governmental restrictions in response to the COVID-19 pandemic and these actions have impacted and will continue to impact our results of operations and cash flows. Beginning in late 2020, several vaccines have received regulatory approval across the world and are being distributed in our primary areas of operation, including North America and Europe. As COVID-19 vaccine adoption rates increase, certain countries have started facilitating gradual reopening of business and public settings while maintaining health and safety precautions. Uncertainty surrounding the effectiveness of the vaccines, public perception and local laws, and regulations enacted to combat the spread of COVID-19, will play a key role on any future impact of the COVID-19 pandemic in our operations. A significant portion of the Company’s operations are deemed essential services by the government authorities.
The impact that the COVID-19 pandemic will have on the Company’s consolidated operations is uncertain. The Company has considered the potential impacts of the COVID-19 pandemic when developing the Company’s estimates and judgments as of April 30, 2021 and 2020 and will continue to evaluate the extent of the impact on the Company’s business and consolidated financial statements. The Company’s accounting estimates and assumptions may change over time in response to the COVID-19 pandemic and the change could be material in future periods.
Foreign Currency
The reporting currency of the Company is the U.S. dollar. Transactions in foreign currencies are translated to the respective functional currencies of the Company’s subsidiaries at the average exchange rates for the period. The monetary items denominated in currencies other than the functional currency of a subsidiary are translated at the exchange rates prevailing at the balance sheet date. Non-monetary items denominated in currencies other than the functional currency are translated at historical rates.
The assets and liabilities of foreign operations, whose functional currency is not the U.S. dollar, are translated into U.S. dollars at the exchange rates in effect at the balance sheet date. Revenue and expenses are translated at the monthly average exchange rates for the period. Differences arising from the exchange rate changes are recorded within foreign currency translation adjustments, a component of other comprehensive income (loss). The currency fluctuation related to certain long-term inter-company loans deemed to not be repayable in the foreseeable future have been recorded within foreign currency translation adjustments. The accumulated amount of exchange differences is reclassified to net earnings upon disposal of an interest in a foreign operation.
The Company recorded transactional (gains) losses of $(11.9) for the year ended April 30, 2021, $(0.3) for the year ended April 30, 2020, $0.0 for the period from November 30, 2018 through April 30, 2019, and $0.4 for the period from May 1, 2018 through December 20, 2018, which are included in profit or loss within other expense (income), net. Such transactional (gains) losses include foreign currency (gains) losses on inter-company loans that are repayable in the foreseeable future.
| F-14 |
Table of Contents
Cash and Cash Equivalents
The Company considers all highly liquid, short-term investments with original maturities of three months or less at the time of purchase to be cash equivalents. Cash equivalents consist of time deposits with a number of U.S. and non-U.S. commercial banks and money market fund investments.
Trade and Other Receivables, Net
Trade accounts receivable consist of amounts due from normal business activities. An allowance for current expected credit losses is maintained to reflect an impairment risk for trade accounts receivable based on a current expected credit loss model which factors in changes in credit quality since the initial recognition of trade accounts receivable based on customer risk categories. Current expected credit losses are also provided based on collection history and specific risks identified on a customer-by-customer basis. Trade accounts receivable are presented net of allowances for current expected credit losses.
Other receivables primarily consist of post-closing receivables from business combinations, and sales taxes receivable.
Factoring of Trade Accounts Receivable
One subsidiary of the Company sells certain of its trade accounts receivable to third-party financial institutions under the terms of factoring arrangements without recourse. Under the terms of the factoring arrangements, the Company does not service the factored trade accounts receivable and is not obligated to repurchase any trade accounts receivable that the third-party financial institutions are unable to collect or become past due. In these arrangements, substantially all of the risks and rewards associated with these receivables are transferred to the financial institutions. These transfers of trade accounts receivable qualify as true sales under Accounting Standards Codification (“ASC”) Topic 860, Transfers and Servicing, which results in all trade accounts receivable sold being derecognized in the consolidated balance sheets due to the transfer of effective control and substantially all of the risks and rewards of the trade accounts receivable. The net cash proceeds received by the Company are presented as cash flows from operating activities. The difference between the carrying amount of the trade accounts receivable sold under the agreements and the cash received at the time of transfer is recorded in the consolidated statements of operations within other expense (income), net and has not been material for the periods presented.
Amounts of trade accounts receivable under the terms of factoring arrangements which are outstanding are $2.0 and $6.9 as of April 30, 2021 and 2020, respectively.
Inventories
Inventories are measured at the lower of cost or net realizable value. Costs of inventories are determined on a first in, first out (“FIFO”) basis or on a weighted-average cost basis.
The cost of raw and consumable materials is the purchase cost, including associated delivery and warehousing costs. The cost of finished goods and work in process is the manufacturing cost, including raw and consumable materials, and other costs incurred in bringing the inventories to their existing locations and conditions as well as any appropriate share of production overheads based on normal operating capacity.
| F-15 |
Table of Contents
As necessary, the Company records write-downs for excess, slow moving and obsolete inventory. To determine these amounts, the Company regularly reviews inventory quantities on hand and compares them to estimates of historical utilization, future product demand, and production requirements.
Write-downs of inventories to net realizable value are recorded in cost of revenue in the consolidated statements of operations.
Property, Plant and Equipment, Net
Property, plant and equipment are stated at historical cost less accumulated depreciation and accumulated impairment losses. Historical cost includes expenditures that are directly attributable to the acquisition, the development and the construction of the asset. Capital projects in progress are transferred to the appropriate category of property, plant and equipment when the assets are ready for their intended use at which point depreciation of these assets commences. Repair and maintenance costs as well as plant start-up costs are expensed as incurred.
Gains and losses on disposals are recognized in selling, general and administrative expenses in the consolidated statements of operations. On disposal, the cost and associated accumulated depreciation are removed from the accounts.
Generally, depreciation is calculated on the cost of an asset using the straight-line method, over the estimated useful life of the asset.
Estimated useful lives are as follows:
| Periods | ||
| Buildings | 15 to 45 years | |
| Machinery and equipment | 3 to 20 years | |
| Computer equipment | 3 to 5 years | |
| Furniture and fixtures | 3 to 12 years | |
| Leasehold improvements | 5 to 7 years or over the lease term if it is shorter than the useful life |
Leases
Policy applicable effective May 1, 2019
The Company determines if an arrangement is a lease at the commencement date. In addition to lease agreements, the Company reviews all material contracts that could contain an embedded lease for potential embedded lease obligations.
The lease liability is recognized based on the present value of the remaining fixed or in-substance fixed lease payments discounted using the Company’s incremental borrowing rates unless the lessor’s rate implicit in the lease is readily determinable, in which case it is used. The Company uses a specific incremental borrowing rate for leases, which is determined based on the geography and term of the lease. These rates are determined based on inputs provided by external banks and updated periodically. The lease liability includes the exercise of a purchase option only if the Company is reasonably certain to exercise as of the commencement date of the lease. The residual value guarantee amount is only included in the lease liability calculation to the extent payment is probable to the lessor as
| F-16 |
Table of Contents
of the commencement of the lease. The right-of-use (“ROU”) asset is calculated based on the lease liability adjusted for any lease payments paid to the lessor at or before the commencement date (i.e., prepaid rent) and initial direct costs incurred by the Company and excluding any lease incentives received from the lessor.
Variable lease payments are payments to the lessor not included in the lease liability calculation. Variable lease payments are payments made by the Company to the lessor for the right to use a leased asset that varies because of changes in facts or circumstances (such as changes in an index or rate, volume, usage, etc.) occurring after the lease commencement date, other than predetermined contractual changes due to the passage of time (for example, predetermined rent increase amounts that are set out in the contract). Variable lease payments or charges are accounted for as incurred.
The lease term for purposes of lease accounting may include options to extend or terminate the lease when it is reasonably certain that the Company will exercise that option as of the commencement date of the lease. For operating leases, the lease expense is recognized on a straight-line basis over the lease term. For finance leases, the Company amortizes the ROU asset on a straight-line basis and records interest expense on the lease liability created at lease commencement over the lease term.
The Company accounts for its lease and non-lease components as a single component for most of its asset classes, and therefore both are included in the calculation of lease liability recognized on the consolidated balance sheets.
Leases with an initial term of twelve months or less are not recorded on the consolidated balance sheets; the Company recognizes lease expense for these leases over their lease term.
The Company adopted ASC 842 using the modified retrospective transition approach permitted under the new standard for leases that existed as of May 1, 2019 and, accordingly, the prior comparative periods were not restated. Under this method, the Company was required to assess the remaining future payments of existing leases as of May 1, 2019. The Company recognized operating lease ROU assets and liabilities of $37.6 and $35.4, respectively, as of May 1, 2019. The operating lease ROU assets included a reclassification from other intangible assets of $2.2 for favorable leases. The Company also recognized finance lease ROU assets and liabilities of $1.7 and $1.4, respectively, as of May 1, 2019.
Policy applicable before April 30, 2019
Under ASC 840, Leases, the Company’s accounting policy was as follows: leases in which a significant portion of the risks and rewards of ownership are not assumed by the Company are classified as operating leases. Payments made under operating leases (net of any incentives received from the lessor) are charged to net earnings on a straight-line basis over the lease term. Leases of property, plant and equipment where the Company has substantially all of the risks and rewards of ownership are classified as finance leases. Finance leases are capitalized at the lease’s commencement at the lower of the fair value of the leased property and the present value of the minimum lease payments. The property, plant and equipment acquired under finance leases are depreciated over the shorter of the useful life of the asset and the lease term.
| F-17 |
Table of Contents
As of April 30, 2019, the total future minimum lease payments, over the remaining lease term, relating to the Company’s operating and finance leases for each of the next five fiscal years and thereafter prior to the adoption of ASU 2016-02, were as follows:
| Operating Leases |
Finance Leases | |||||||
| Fiscal 2020 |
$ | 9.1 | $ | 0.6 | ||||
| Fiscal 2021 |
8.8 | 0.4 | ||||||
| Fiscal 2022 |
5.5 | 0.3 | ||||||
| Fiscal 2023 |
2.9 | 0.2 | ||||||
| Fiscal 2024 |
2.3 | 0.1 | ||||||
| Thereafter |
6.5 | — | ||||||
|
|
|
|
|
|||||
| Total lease payments |
$ | 35.1 | $ | 1.6 | ||||
|
|
|
|
|
|||||
Total lease payments of $36.7 represent undiscounted cash flows and do not include options to extend the lease that the Company is reasonably certain to exercise and therefore do not reconcile to the total discounted lease liability of $36.8 as of May 1, 2019 shown above.
Prior to the adoption of ASU 2016-02, the Company’s rental expense amounted to $5.8 in the period from November 30, 2018 through April 30, 2019 and $6.8 in the period from May 1, 2018 through December 20, 2018.
Goodwill and Other Intangibles, Net
Following initial recognition, goodwill and indefinite life intangible assets are measured at cost less any accumulated impairment losses.
Goodwill and indefinite life intangible assets are not amortized and are assessed for impairment annually in the fourth quarter or more frequently if events or changes in circumstances indicate that the carrying value may be impaired. Goodwill is tested for impairment at the reporting unit level, which is the same level as the Company’s reportable segments. A reporting unit is the operating segment, or a component, which is one level below that operating segment. Components are aggregated as a single reporting unit if they have similar economic characteristics.
For the purposes of annual impairment testing, the carrying amounts of goodwill are allocated to the reporting units. In conducting its annual impairment test, the Company first reviews qualitative factors to determine whether it is more likely than not that the fair value of the reporting unit is less than its carrying amount. Factors considered in a qualitative assessment include, among other things, macroeconomic conditions, industry and market considerations, financial performance of the respective reporting unit and other relevant entity and reporting unit specific considerations. If factors indicate that the fair value of the reporting unit is less than its carrying amount, the Company performs a quantitative assessment. The fair value of the reporting unit is determined by analyzing scenarios of business projections and sensitivities attempting to model various assumptions as to how the revenues and cash flows of the business may evolve depending on factors including macroeconomic conditions, industry and market considerations, cost factors and overall financial performance specific to the reporting unit. The Company estimates the fair values of its reporting units based on discounted cash flow (“DCF”) methodology reflecting the latest projections.
| F-18 |
Table of Contents
Trade names are not subject to amortization given that they are determined to have an indefinite useful life based on the market recognition and their ability to generate revenue through changing economic conditions with no foreseeable time limit. For the purpose of annual impairment testing, trade names are tested separately using the relief-from-royalty method.
Intangible assets with finite lives are carried at cost less accumulated amortization and impairment losses, if any, and are amortized on a straight-line basis over the estimated useful life of the intangible asset.
The Company’s intangible assets with finite lives are mainly composed of customer relationships and intellectual property in the form of patents, formulations and manufacturing know-how. The manufacturing know-how is composed of chassis, batch manufacturing procedures, large-scale manufacturing, and quality control documentation.
Estimated useful lives are as follows:
| Periods | ||
| Customer relationships and other |
7 to 27 years | |
| Intellectual property |
5 to 20 years |
Impairment of Long-lived Assets
Long-lived assets are comprised of property, plant and equipment, operating lease right-of-use assets and intangible assets with finite lives. Long-lived assets are reviewed for impairment whenever events or changes in circumstances indicate that the carrying amount of an asset or asset group may not be recoverable. Recoverability of assets to be held and used is measured by a comparison of the carrying amount of an asset to future undiscounted net cash flows expected to be generated by the asset. If the carrying amount of an asset exceeds its estimated undiscounted net future cash flows, an impairment charge is recognized for the amount by which the carrying amount of the asset exceeds fair value.
Cost of Revenue
Cost of revenue includes all costs directly related to the manufacturing of products, including the cost of raw materials, direct labor, packaging, direct production costs, factory overhead, depreciation expense related to manufacturing and corresponding right-of-use assets and amortization of intellectual property. For manufacturing outsourced to third-party contractors, cost of revenue represents the amount invoiced by the contractors. Cost of revenue also includes the costs relating to warehousing, maintenance, inspection activities, freight and inventory write-downs. Additionally, cost of revenue includes a portion of costs related to employee benefits and plant start-up costs.
Selling, General and Administrative Expenses
Selling, general and administrative (“SG&A”) expenses include selling and administrative personal costs, sales and marketing expenses, professional fees, depreciation expense related to non-manufacturing and corresponding finance lease right-of-use assets, operating lease rent expense, non-manufacturing overhead, gains and losses on the sale of property, plant and equipment, and other general and administrative expenses. Additionally, SG&A expenses include a portion of costs related to employee benefits, share-based compensation expense and amortization of customer relationships and other intangibles.
| F-19 |
Table of Contents
SG&A expenses include amounts for research and development (“R&D”) costs, which are expensed as incurred. For the years ended April 30, 2021 and 2020, for the period from November 30, 2018 through April 30, 2019 and for the period from May 1, 2018 through December 20, 2018, SG&A expenses include a total of $27.4, $17.3, $4.5, and $7.8 of research and development costs, respectively.
Acquisition-related Costs and Other Expenses
Acquisition-related costs and other expenses include costs incurred by the Company in relation to its business acquisitions. These expenses include professional, due diligence and advisory fees related to each business combination. These expenses also include the fee paid to Cornell Capital LLC as a result of the acquisitions.
Acquisition-related costs and other expenses also include external consultants fees related to follow-up services rendered post-acquisition, impairment loss on right-of-use assets and write-off of certain indemnification assets.
Incremental costs directly attributable to an IPO are capitalized and included in prepaid expenses and other current assets in the consolidated balance sheets, and will be charged against the gross offering proceeds in the period of the IPO. Any IPO preparation-related cost that does not meet the criteria for capitalization is expensed as incurred and included in acquisition-related costs and other expenses.
Restructuring expenses are recognized in acquisition-related costs and other expenses when the Company has approved a detailed and formal restructuring plan, and the restructuring either has commenced or has been announced.
Income Tax
The Company is subject to income taxes in Canada, the U.S. and various foreign jurisdictions. The Company utilizes the asset and liability method to account for income tax. Income tax is recognized in the consolidated statements of operations except to the extent that it relates to items recognized directly in equity, in which case the income tax is also recognized directly in equity. Current tax is the expected tax payable on the taxable income for the year using tax rates enacted at the end of the reporting year and any adjustment to tax payable in respect of previous years.
Deferred income tax is recognized in respect of temporary differences arising between the tax bases of assets and liabilities and their carrying amounts in the consolidated financial statements. Deferred income tax is determined on a non-discounted basis using tax rates and laws that have been enacted at the date of the consolidated balance sheets and will apply when the deferred income tax assets or liabilities are expected to be settled.
Deferred income tax assets are reduced by a valuation allowance when, in the opinion of management, it is more likely than not that some portion or all of the deferred income tax assets will not be realized. In addition, the Company recognizes the tax benefit from an uncertain tax position only if it is more likely than not that the tax position will be sustained on examination by the taxing authorities on the technical merits of the position. In making these assessments, management must often analyze complex tax laws of multiple jurisdictions. Accounting guidance prescribes a recognition threshold and measurement attribute for the financial statement recognition and measurement of a tax position taken or expected to be taken in tax return. Interest expense and penalties related to unrecognized tax benefits, which to date have not been material, are not recognized within income tax benefit.
| F-20 |
Table of Contents
Deferred income tax is provided on temporary differences arising on investments in subsidiaries unless the timing of the reversal of the temporary difference is controlled by the Company and undistributed earnings will be reinvested indefinitely or can be distributed on a tax-free basis.
Earnings (loss) per Share
Basic earnings (loss) per share is computed by dividing net income (loss) by the weighted-average number of common shares outstanding during each period.
Diluted earnings (loss) per share is computed using the treasury stock method on the basis of the weighted-average number of common shares plus the effects of stock options issued under the stock option plan, if dilutive.
Derivatives and Hedging Activities
The Company’s derivative financial instruments are included in prepaid expenses and other current assets and are measured at fair value. Changes in the fair value of the derivative instruments designated as cash flow hedging instruments are recorded in other comprehensive income (loss) and are recognized in cost of revenue or selling, general and administrative expenses when the hedged transaction impacts earnings. Cash flows related to derivatives are classified in the same category as the cash flows from the hedged item in the consolidated statements of cash flows. Changes in the fair value of derivative instruments not designated as hedging instruments are reported in current-period earnings within other expense (income), net.
As part of its risk management activities, the Company uses a portion of its euro-denominated debt as a non-derivative instrument to hedge a portion of the Company’s net investment in foreign operations. The foreign exchange gains and losses of the debt designated as a hedging item in a net investment hedge is recognized in accumulated other comprehensive income (loss). When a hedged net investment is disposed of, the cumulative amount recognized in accumulated other comprehensive income (loss) in relation to the hedged net investment is recognized in the consolidated statements of operations as part of the profit or loss on disposal.
Share-based Compensation
The Company offers an incentive stock option plan, which is further described in Note 15, Employee Benefits. The plan is accounted for as an equity-settled award. Accordingly, the grant-date fair value of time-based vesting options is recognized as an expense in the consolidated statements of operations, with a corresponding increase in equity, over the applicable vesting period of the awards. The Company has elected a policy to record time-based graded vesting awards on a straight-line basis. For performance-based options issued, the fair value of the instrument is measured at the grant date and expensed over the vesting term when the performance targets are considered probable of being achieved. The Company accounts for forfeitures as a reduction of compensation cost in the period when such forfeitures occur. The Company’s election to account for forfeitures when incurred is consistent with ASU 2016-09, Improvements to Employee Share-Based Payment Accounting.
The Company uses the Black-Scholes-Merton (“Black-Scholes”) or the Monte Carolo option pricing model to estimate the fair value of time-based vesting options. The Company uses the Monte Carlo option pricing model to estimate the fair value of performance-based vesting options, which valuation includes the effect of the market conditions of the award. The determination of the grant date fair value of stock option awards issued is affected by a number of variables, including the fair value of the Company’s common shares, the expected common share price volatility over the expected life of the options, the expected term of the options, risk-free interest rates, and the expected dividend yield of the Company’s common share.
| F-21 |
Table of Contents
Due to the absence of a public market trading the Company’s common shares prior to the IPO, it is necessary to estimate the fair value of the common shares underlying the share-based grants when performing fair value calculations of options using the Black-Scholes and Monte Carlo option pricing models. The Company has historically granted stock options at exercise prices at minimum equal to fair value as determined by the Company’s Board of Directors (“Board of Directors”) on the date of grant. In the absence of a public trading market, the Board of Directors, with input from management, exercises significant judgment and considers numerous objective and subjective factors to determine the fair value of the Company’s common shares as of the date of each stock option grant, including:
| • | relevant precedent transactions involving the Company’s common shares; |
| • | the Company’s actual operating and financial performance; and |
| • | current business conditions and projections. |
Employee Benefits
Termination benefits
Termination benefits are expensed at the earlier of the dates when the Company can no longer withdraw the offer of those benefits or when the Company recognizes costs for a restructuring which involves the payment of termination benefits.
Short-term employee benefits
Short-term employee benefit obligations are measured on an undiscounted basis and are expensed as the related service is provided. A liability is recognized for the amount expected to be paid under short-term cash bonus or profit-sharing plans if the Company has a present legal or constructive obligation to pay this amount as a result of past service provided by the employee, and the obligation can be estimated reliably.
Defined contributions plans
The Company maintains defined contributions plans for which the Company pays fixed contributions to administered pension insurance plans on a mandatory, contractual or voluntary basis. The Company has no legal or constructive obligation to pay further amounts. Obligations for contributions to defined contribution pension plans are recognized as an employee benefit expense as the services are provided.
Defined benefit plans
The Company also maintains defined benefit plans for certain of its subsidiaries. The liability recognized in respect of defined benefit plans is included in other liabilities in the consolidated balance sheets and represents the present value of the defined benefit obligation at the end of the reporting period, less the fair value of plan assets, if any.
Recent Accounting Pronouncements
Accounting pronouncements recently adopted
In May 2014, the Financial Accounting Standards Board (“FASB”) and the International Accounting Standards Board issued their final converged standard on revenue recognition. The standard, issued as Accounting Standards Update (“ASU”) No. 2014-09, Revenue from Contracts with Customers, by the FASB, which was
| F-22 |
Table of Contents
further modified by ASU 2016-04, Recognition of Breakage for Certain Prepaid Stored-Value Products, ASU 2016-20, Technical Corrections and Improvements to Topic 606, Revenue from Contracts with Customers, ASU 2017-05, Other Income Gains and Losses from the Derecognition of Nonfinancial Assets: Clarifying the Scope of Asset Derecognition Guidance and Accounting for Partial Sales of Nonfinancial Assets, and ASU 2018-18, The interaction between Topic 808 and Topic 606. These amend ASC Topic 808, Collaborative Arrangements, and ASC Topic 606, Revenue from Contracts with Customers. These provide a comprehensive revenue recognition model for all contracts with customers and supersedes previous revenue recognition guidance. The revenue standard contains principles that an entity will apply to determine the measurement of revenue and timing of when it is recognized. The underlying principle is that an entity will recognize revenue to depict the transfer of goods or services to its customers at an amount that the entity expects to be entitled to in exchange for those goods or services. The standard also includes enhanced disclosures. During 2016, the FASB issued several accounting updates (ASU No. 2016-08, 2016-10 and 2016-12) to clarify implementation guidance and correct unintended application of the guidance. The standard allows for either full retrospective adoption or modified retrospective adoption. The Company adopted the new standard on May 1, 2018, on a “modified retrospective” basis, which did not have a material impact on the Company’s consolidated financial statements.
In February 2016, the FASB issued its final standard on lease accounting, ASU No. 2016-02, which superseded ASC Topic 840, Leases, which was further modified in ASU No. 2018-10, Codification Improvements to Topic 842, Leases, ASU No. 2018-11, Targeted Improvements, ASU 2018-20, Narrow-Scope Improvements for Lessors and ASU No. 2019-01, Codification Improvements. These modify ASC Topic 842, Leases. The new accounting standard requires the recognition of right-of-use assets and lease liabilities on the consolidated balance sheets for all long-term leases, including operating leases. The Company elected the optional transition method and adopted the new guidance on May 1, 2019, on a modified retrospective basis, with no restatement of prior period amounts. The Company elected the package of practical expedients allowed under ASC Topic 842, which permits the Company to account for its existing operating leases as operating leases under the new guidance, without reassessing the Company’s prior conclusions about lease identification, lease classification and initial direct cost. See Note 9, Leases, for further details on the adoption of Topic 842.
In March 2016, the FASB issued ASU 2016-09, Improvements to Employee Share-Based Payment Accounting, which amends ASC 718. Under the new ASU 2016-09 guidance, companies can continue to estimate forfeitures, or they can elect to account for forfeitures as they occur by reversing compensation cost when the award is forfeited. The Company adopted this ASU as of May 1, 2019 and accounts for forfeitures as a reduction of compensation cost in the period when such forfeitures occur.
In June 2016, the FASB issued ASU No. 2016-13, which was further modified by ASU 2018-19, Codification Improvements to Topic 326, Financial Instruments—Credit Losses, ASU 2019-05, Targeted Transition Relief, ASU No. 2019-11, Codification Improvements to Topic 326, and ASU 2020-03, Codification Improvements to Financial Instruments. These modify ASC Topic 326, Financial Instruments—Credit Losses. The new accounting standards introduce the current expected credit loss model, which will require an entity to measure credit losses for certain financial instruments and financial assets, including trade receivables. Under this update, on initial recognition and at each reporting period, an entity will be required to recognize an allowance that reflects the entity’s current estimate of credit losses expected to be incurred over the life of the financial instrument. The Company adopted the accounting standard on May 1, 2019, which did not have a material impact on the Company’s consolidated financial statements.
In January 2017, the FASB issued ASU No. 2017-01, Clarifying the Definition of a Business, which amends ASC Topic 805, Business Combinations. This provides additional guidance on evaluating whether transactions should be accounted for as acquisitions of assets or businesses. The guidance requires an entity to evaluate if
| F-23 |
Table of Contents
substantially all of the fair value of the assets acquired is concentrated in a single identifiable asset or a group of similar identifiable assets. If this threshold is met, then the new guidance would define the transaction as an asset acquisition. If the threshold is not met, then the entity would, pursuant to the guidance, evaluate whether the assets meet the requirement that a business include, at a minimum, an input and substantive process that together significantly contribute to the ability to create outputs. The guidance was effective for the Company, on a prospective basis, beginning on May 1, 2018. This new guidance did not have an impact on the Company’s consolidated financial statements.
In January 2017, the FASB issued ASU No. 2017-04, Simplifying the Test for Goodwill Impairment, which amends ASC Topic 350, Intangibles-Goodwill and Other, eliminating the requirement to calculate implied fair value, essentially eliminating step two from the goodwill impairment test. The new standard requires goodwill impairment to be based upon the results of step one of the impairment test, which is defined as the excess of the carrying value of a reporting unit over its fair value. The impairment charge will be limited to the amount of goodwill allocated to that reporting unit. The new guidance was effective for the Company on a prospective basis beginning on May 1, 2020 and had no impact on adoption on the Company’s consolidated financial statements, but may impact future goodwill impairment tests.
In August 2017, the FASB issued ASU No. 2017-12, Targeted Improvements to Accounting for Hedging Activities, which amends ASC 815. This amends the eligibility criteria for hedged items and transactions to expand an entity’s ability to hedge nonfinancial and financial risk components. The new guidance eliminates the requirement to separately measure and present hedge ineffectiveness and aligns the presentation of hedge gains and losses with the underlying hedge item. The new guidance also simplifies the hedge documentation and hedge effectiveness assessment requirements. The amended presentation and disclosure requirements must be adopted on a prospective basis, while any amendments to cash flow and net investment hedge relationships that exist on the date of adoption must be applied on a “modified retrospective” basis, meaning a cumulative effect adjustment to the opening balance of retained earnings as of the beginning of the year of adoption. The new guidance was effective for the Company on May 1, 2019 and did not have a material impact on the Company’s consolidated financial statements.
In August 2018, the FASB issued ASU No. 2018-15, Customer’s Accounting for Implementation Costs Incurred in a Cloud Computing Arrangement That Is a Service Contract, which amends ASC Topic 350-40, Intangibles-Goodwill and Other-Internal-Use Software. This new guidance requires hosting arrangements that are service contracts to follow the guidance for internal-use software to determine which implementation costs can be capitalized. The new guidance was effective for the Company beginning on May 1, 2020 and did not have a material impact on the Company’s consolidated financial statements.
Accounting pronouncements not yet adopted
In December 2019, the FASB issued ASU No. 2019-12, Simplifying the Accounting for Income Taxes, which amends ASC Topic 740, Income Taxes. This ASU simplifies the accounting for income taxes by removing certain exceptions to the general principles in ASC 740 and also clarifies and amends existing guidance to improve consistent application. This new guidance is effective for the Company beginning on May 1, 2021, with early adoption permitted. While the Company is currently assessing the impact of the new guidance, it is not expected to have a material impact on the Company’s consolidated financial statements.
In March 2020, the FASB issued ASU 2020-04, Facilitation of the Effects of Reference Rate Reform on Financial Reporting, which amends ASC Topic 848, Reference Rate Reform. This ASU provides optional expedients and exceptions for applying GAAP to contracts, hedging relationships, and other transactions affected
| F-24 |
Table of Contents
by reference rate reform if certain criteria are met. This new guidance is optional and may be elected over time through December 31, 2022 as reference rate reform activities occur. This new guidance is not expected to have a material impact on the Company’s consolidated financial statements upon its initial adoption date as the Company has not made any modifications as a direct consequence of the LIBOR reform to date. The interest rates on the Company’s Term Loans (as defined in Note 13, Debt) are based on LIBOR for borrowings in U.S. dollars. The Company’s Revolving Facility (as defined in Note 13, Debt) is based on LIBOR for borrowings in U.S. dollars. As such, substantially all the Company’s long-term debt is subject to global reference rate reform. The Company’s Term Loans are based on EURIBOR for borrowings in euros, and the EURIBOR is not expected to be discontinued as part of the reference rate reform. The above debt agreements have fallback clauses to the alternate base rate (“ABR”) as defined in the credit agreement. However, the Company, its lenders, and its counterparties are expected to negotiate the substitution of reference rates (such as the Secured Overnight Funding Rate, or “SOFR”) for the calculation of interest rates under the Term Loans and the Revolving Facility in the upcoming months. It is too early to determine if any upcoming potential modifications will meet the requirements for the application of the practical expedient. The Company also references LIBOR in certain derivative instruments. It is also too early to determine how the substitution of reference rates will affect the Company’s future financing expenses.
| 3 | Revenue |
The Company’s principal sources of revenue are derived from value-added manufacturing solutions for the beauty, personal care and home care industries destined for the mass, prestige and emerging markets.
The Company determines revenue recognition through the following steps:
| • | identification of the contract, or contracts, with a customer; |
| • | identification of the performance obligations in the contract; |
| • | determination of the transaction price; |
| • | allocation of the transaction price to the performance obligations in the contract; and |
| • | recognition of revenue when, or as, the Company satisfies a performance obligation. |
The Company has established that a contract is usually a purchase order or a schedule of future minimum order quantities received from the customer, in combination with a master sales agreement when the agreement exists. The Company’s contracts principally consist of a single performance obligation related to the sale of finished goods.
The Company recognizes revenue at a point in time when it transfers control of the finished goods to the customer, which is generally at the shipping point. Under certain customer contracts, the Company completes the production of finished goods and then holds such inventory until the customer requests shipment. For these items, the Company has the contractual right to receive payment once the production is completed, at which point control transfers to the customer and the Company recognizes revenue.
The Company evaluates contracts with customers for which it provides custom products to determine whether a legally enforceable right to payment exists as performance is completed, including a reasonable profit margin, in which case revenue should be recognized over time rather than at a point in time. For the years ended April 30, 2021 and 2020, the period from November 30, 2018 through April 30, 2019 and the period from May 1, 2018 through December 20, 2018, no contract met the criteria for recognition over time because a right to payment, including a reasonable profit margin, did not exist until the Company’s performance under the contract was completed.
| F-25 |
Table of Contents
Payment terms are short-term in nature and are generally less than one year. In addition, if the good is transferred and payment is received within one year, the Company does not determine significant financing components.
Revenue from the sale of finished goods is recognized at the fair value of the amount received or expected to be received, less discounts, rebates and returns. Discounts and rebates are estimated using the most likely amount method. Given the nature of the products sold by the Company, returns are not material to the Company’s consolidated financial statements. The Company’s revenue is generated through (i) arrangements in which raw materials are either provided by or on behalf of the customer, or costs are passed through to the customer, and (ii) purchase orders that sometimes serve as a de facto pass-through mechanism for variations in raw material price changes. Under both of these agreements, the Company has limited exposure to raw material price changes. The Company is a principal and recognizes revenue on a gross basis for its contracts with customers because it controls the goods before they are transferred to the customers, as it is primarily responsible for fulfilling the promise to provide the goods to the customer and it has inventory risk before the goods have been transferred to the customer. For certain arrangements where the raw materials are provided by the customer at no cost, there is no cost of revenue or revenue recognized related to raw materials. Sales taxes and value added taxes in foreign jurisdictions that are collected from customers and remitted to governmental authorities are accounted for on a net basis and therefore are excluded from revenue.
Deferred revenue
The Company had deferred revenue in the amount of $35.6 and $31.3 as of April 30, 2021 and 2020, respectively. Such deferred revenue relates primarily to advance consideration received from customers in some contracts to support the acquisition, setting up and maintenance of certain equipment or production lines to be used for providing the customer with finished goods. It was determined these promised goods and services were significantly integrated with the finished goods and, therefore, are considered to be a single performance obligation. These contracts were also evaluated to determine whether they contain a material right that the customer would not have received without entering into the contract. These contracts can be cancelled at any time by the customer. For a certain period of time, the customer may have the option to purchase the related equipment at a price equal to the unamortized advance consideration received at the date the purchase option is exercised, as calculated in accordance with the contract. Deferred revenue is also created when the Company receives consideration from a customer prior to transferring goods to the customer. Deferred revenue, including any material rights accounted for as a distinct performance obligation, is recognized as revenue on the basis of units shipped to the customer.
For the years ended April 30, 2021 and 2020, revenue recognized during the period that was included in the contract liability at the beginning of the period amounted to $11.1 and $0.0, respectively.
The Company applies the practical expedient as per ASC 606-10-50-14 and does not disclose information related to remaining performance obligations due to their original expected durations being one year or less.
Costs to obtain a contract
The Company generally expenses sales commissions as incurred, because either the amortization period would be one year or less, or the balance with an amortization period greater than one year is not material.
| F-26 |
Table of Contents
Disaggregation of revenue
The following table presents the Company’s revenue by principal categories of similar products for the periods presented:
| Successor | Predecessor | |||||||||||||||
| For the Year ended April 30, 2021 |
For the Year ended April 30, 2020 |
For the Period from November 30, 2018 through April 30, 2019 |
For the Period from May 1, 2018 through December 20, 2018 |
|||||||||||||
| Personal Care |
$ | 1,042.9 | $ | 784.7 | $ | 267.4 | $ | 453.3 | ||||||||
| Cosmetics and Fragrance |
293.2 | 176.3 | 48.9 | 76.9 | ||||||||||||
| Air Care |
506.2 | 56.9 | 18.3 | 35.9 | ||||||||||||
| Home, Pest and Auto Care |
301.5 | 75.5 | 35.2 | 66.7 | ||||||||||||
|
|
|
|
|
|
|
|
|
|||||||||
| Total |
$ | 2,143.8 | $ | 1,093.4 | $ | 369.8 | $ | 632.8 | ||||||||
|
|
|
|
|
|
|
|
|
|||||||||
Certain revenue in these categories are generated by both segments.
See Note 24, Segment Data and Related Information, for revenue disaggregated by geographic region.
| 4 | Business Combinations |
The Company had no business acquisitions for the year ended April 30, 2021. The Company acquired the following businesses in fiscal years 2020 and 2019:
(i) Zobele Holding SpA
On April 30, 2020, the Company acquired 100% of the issued and outstanding common shares of Z Gamma B.V. (“Zobele”). Zobele is a leading global provider of complex and highly technical dispensing devices for air care, pest control and home, health and personal care categories. The acquisition added the fabric care and pest control categories to the Company’s portfolio, diversifying its offering and providing new market development and growth opportunities globally.
Goodwill recorded in connection with this acquisition is mainly attributable to the expected synergies from integration of the activities, to the skills and technical talent of the workforce and expected future cash flows arising from growth potential. Goodwill recognized of $175.9 is not expected to be deductible for income tax purposes.
(ii) Assets of Cosmetic Laboratories of America, Inc.
On March 2, 2020, the Company acquired substantially all of the assets and assumed certain current liabilities of Cosmetic Laboratories of America, Inc. (“CLA”). CLA is a market leader in the development, formulation and supply of personal care and beauty products based in Chatsworth, California. The acquisition expanded the Company’s presence with leading personal care and cosmetic product brands and offers integration opportunities with existing facilities in the West Coast of the United States.
| F-27 |
Table of Contents
Goodwill recorded in connection with this acquisition is mainly attributable to the expected synergies from integration of the activities and to the skills and technical talent of the workforce. Goodwill recognized of $22.3 is expected to be deductible for income tax purposes.
(iii) Mei Shual Cosmetics Co., Pte. Ltd and assets of Mei Shual Cosmetics Co., Ltd
On March 2, 2020, the Company acquired 100% of the issued and outstanding common shares of Mei Shual Cosmetics Co., Pte. Ltd, a Singaporean entity, and substantially all of the assets of Mei Shual Cosmetics Co., Ltd, a Taiwanese entity (collectively “Paristy”). Paristy is a market leader in East Asia in the development, formulation and production of color cosmetics and other beauty products, including powder products, and offers innovation R&D. The acquisition expanded the Company’s presence in East Asia, enhanced the Company’s technology in color cosmetics and provided growth opportunities with existing customers.
The acquisition involved non-interest-bearing deferred consideration with an estimated fair value of $21.9 at the acquisition date. The deferred consideration is payable in cash and Class B common shares to the sellers and includes bonuses for the sellers that are not contingent on their continued employment and have been included in the total consideration transferred. In the third quarter of fiscal year 2021, a payment in cash of $21.4 was made, and the Company reclassified a deferred consideration of $1.1 in shareholders’ equity. Subject to the terms of the Paristy share purchase agreement, the Company has an obligation to issue 703 Class B common shares in December 2021.
As of the acquisition date, the Company has not recognized any material contingent consideration for this acquisition. Under the original share purchase agreement, the potential contingent consideration was payable in cash and Class B common shares to the sellers and was based on a multiple of the difference between certain predetermined financial performance targets to be achieved by Paristy for the 12-month period ended April 30, 2021 and the financial performance achieved for the 12-month period ended December 31, 2019. On November 27, 2020, an amendment to the Paristy share purchase agreement was executed. The amendment finalized the calculation of the base consideration, that was based on the financial performance achieved by Paristy for the 12-month period ended December 31, 2019. This provided new information about facts and circumstances that existed at the acquisition date and as such, has been reflected in the total consideration transferred. The November 27, 2020 amendment to the share purchase agreement also extended the contingent consideration window through April 30, 2023 and payment of such earn-out became contingent on the continued employment of the sellers, and payable in cash only. This new contingent consideration did not have an impact on the total consideration transferred and will be recorded as a compensation expense.
The sellers have indemnification obligations in favor of the Company for certain claims and liabilities. The indemnification asset recorded within the purchase price allocation amounted to $5.4 (¥37.8).
Goodwill recorded in connection with this acquisition is mainly attributable to the expected synergies from integration of the activities, to the skills and technical talent of the workforce and expected future cash flows arising from growth potential. Goodwill recognized of $16.2 is not expected to be deductible for income tax purposes.
(iv) Clover Park 2 (BVI) Limited
On January 23, 2020, the Company acquired 100% of the issued and outstanding common shares of Clover Park 2 (BVI) Limited (“HCT”). HCT is an innovative, global leader delivering full-service solutions in the design, engineering, manufacturing, formulation, filling and logistics of cosmetics products to brands globally for
| F-28 |
Table of Contents
the mass, prestige and emerging markets headquartered in Santa Monica, California. The acquisition provided the Company an expanded suite of manufacturing and packaging solutions, diversified customer mix and growth opportunities globally.
As of the acquisition date, the Company has not recognized any material contingent consideration for this acquisition. The potential contingent consideration varying between $0.0 and $65.0 is payable in cash to the sellers if a certain predetermined financial performance target is achieved by HCT for the 12-month period ending March 31, 2021. A final determination is to be made no later than on or about July 31, 2021, but the Company does not expect to make any contingent consideration payments.
Goodwill recorded in connection with this acquisition is mainly attributable to the expected synergies from integration of the activities, to the skills and technical talent of the workforce and expected future cash flows arising from growth potential. Goodwill recognized of $371.1, of which $30.6 was allocated to another reporting unit, is not expected to be deductible for income tax purposes.
(v) Benchmark Cosmetic Laboratories, Inc.
On November 1, 2019, the Company acquired 100% of the issued and outstanding common shares of Benchmark Cosmetic Laboratories, Inc. (“Benchmark”). Benchmark is a leading custom formulator for established and emerging prestige beauty brands located in California. Benchmark elevated and expanded the Company’s innovation capabilities to offer enhanced R&D services to its customers and brand partners.
The acquisition involved a contingent consideration with an estimated fair value of $4.3 at the acquisition date. The potential contingent consideration varying between $0.0 and $5.0 is payable in cash to the seller if certain predetermined financial performance targets are met over a period of 52 months from the acquisition date. In the first quarter of fiscal year 2021, a payment in cash of $2.5 has been made for financial performance targets met in the first 3 months of the post-acquisition period.
Goodwill recorded in connection with this acquisition is mainly attributable to the expected synergies from integration of the activities and expected future cash flows arising from growth potential. Goodwill recognized of $12.6 is expected to be deductible for income tax purposes.
(vi) Curzon Supplies Ltd.
On August 23, 2019, the Company acquired 100% of the issued and outstanding common shares of Curzon Supplies Ltd. (“Swallowfield”). Swallowfield engages in the development, formulation and production of products for many of the world’s leading personal care and beauty brands from facilities located in the United Kingdom and the Czech Republic. Swallowfield further enhanced the Company’s presence in Europe and continued to expand the Company’s leadership in beauty, health and personal care globally.
Goodwill recorded in connection with this acquisition is mainly attributable to the expected synergies from integration of the activities, to the skills and technical talent of the workforce and expected future cash flows arising from growth potential. Goodwill recognized of $5.5 is not expected to be deductible for income tax purposes.
(vii) Alkos Group
On July 1, 2019, the Company acquired 100% of the issued and outstanding common shares of Aaxen SAS, which owned 100% of the shares of Inter Cosmétiques, Sagal Cosmétiques, and Alkos Cosmétiques (collectively
| F-29 |
Table of Contents
“Alkos”). Alkos provides makeup, skincare, cosmetic pencils and perfumed deodorant sticks and soaps to cosmetic brands globally from facilities located in France. Alkos provided the Company with a premier cosmetics manufacturer in the European market and an expanded global presence in the cosmetics industry.
As of the acquisition date, the Company has not recognized any material contingent consideration for this acquisition. The potential contingent consideration varying between $0.0 and $13.9 (€11.5) is payable in cash to the sellers upon achievement of pre-established financial performance targets over a period of three years ending December 31, 2021.
The sellers have indemnification obligations in favour of the Company for certain claims and liabilities. The indemnification asset recorded within the purchase price allocation amounted to $3.5 (€2.9).
Goodwill recorded in connection with this acquisition is mainly attributable to the expected synergies from integration of the activities, to the skills and technical talent of the workforce and expected future cash flows arising from growth potential. Goodwill recognized of $2.6 is not expected to be deductible for income tax purposes.
(viii) Knowlton Development Corporation Inc.
On December 21, 2018, the Company acquired 100% of the issued and outstanding common shares of KDC Opco (the Acquisition described in Note 1, Description of Business and Basis of Presentation). KDC Opco provides value-added solutions for the beauty, personal care and home care industries destined for the mass, prestige and emerging markets from facilities located in North America.
Goodwill recorded in connection with this acquisition is mainly attributable to the skills and technical talent of the workforce and expected future cash flows arising from growth potential. Goodwill recognized of $408.5 is not expected to be deductible for income tax purposes.
Revenue and Net Loss
The fiscal year 2020 acquisitions contributed revenue and net loss to the 2020 consolidated results of the Company since the acquisitions’ date as follows:
| HCT | Zobele(1) | Others(2) | Total | |||||||||||||
| Revenue |
$ | 51.0 | $ | — | $ | 98.2 | $ | 149.2 | ||||||||
| Net loss |
$ | 3.5 | $ | — | $ | 14.0 | $ | 17.5 | ||||||||
| (1) | Zobele was acquired on April 30, 2020. |
| (2) | Includes Alkos, Swallowfield, Benchmark, CLA and Paristy. |
The fiscal year 2019 acquisition (the Acquisition) contributed the entirety of revenue and net loss as presented on the consolidated statements of operations for the period from November 30, 2018 through April 30, 2019.
Unaudited Pro Forma Results
Fiscal year 2020 acquisitions
The following table provides the unaudited pro forma results for the Company, prepared in accordance with ASC 805, for the year ended April 30, 2020, for the period from November 30, 2018 through April 30, 2019 and
| F-30 |
Table of Contents
for the period from May 1, 2018 through December 20, 2018, as if the fiscal year 2020 acquisitions described above had occurred on May 1, 2018 (being the beginning of the comparable prior annual reporting period):
| Successor | Predecessor | |||||||||||
| Year ended April 30, 2020 |
For the Period from November 30, 2018 through April 30, 2019 |
For the Period from May 1, 2018 through December 20, 2018 |
||||||||||
| Revenue |
$ | 1,975.1 | $ | 825.1 | $ | 1,238.6 | ||||||
| Net loss |
$ | 61.9 | $ | 3.1 | $ | 80.8 | ||||||
The unaudited pro forma results were prepared based on each entity’s historical results and exclude the Acquisition. In order to reflect the acquisitions on May 1, 2018, the unaudited pro forma results include:
| • | incremental depreciation expense related to the fair value adjustments associated with the property, plant and equipment acquired; |
| • | incremental amortization expense related to the fair value adjustments associated with the intangible assets acquired; |
| • | the acquisition-related costs incurred for the fiscal year 2020 acquisitions (assumed to have been incurred during the period from May 1, 2018 through December 20, 2018); |
| • | additional interest expense associated with the issuance of debt to finance the fiscal year 2020 acquisitions; and |
| • | the consequential income tax adjustments. |
The unaudited pro forma results do not include any anticipated cost savings or other effects of the planned integration of these entities, and are not necessarily indicative of the results that would have occurred if the fiscal year 2020 acquisitions had been in effect on the date indicated, nor is it intended to be a projection of future results.
Fiscal year 2019 acquisition
The following table provides the unaudited pro forma results for the Company, prepared in accordance with ASC 805, for the twelve months ended April 30, 2019, as if the Acquisition had occurred on May 1, 2018:
| Twelve months ended April 30, 2019 |
||||
| Revenue |
$ | 1,002.6 | ||
| Net loss |
$ | 51.3 | ||
The unaudited pro forma results were prepared based on the historical information of the Predecessor and the Successor and exclude the fiscal year 2020 acquisitions. In order to reflect the acquisition on May 1, 2018, the unaudited pro forma results include:
| • | incremental depreciation expense related to the fair value adjustments associated with the property, plant and equipment acquired; |
| • | incremental amortization expense related to the fair value adjustments associated with the intangible assets acquired; |
| • | additional interest expense associated with the issuance of debt to finance the Acquisition; and |
| • | the consequential income tax adjustments. |
| F-31 |
Table of Contents
The unaudited pro forma results do not include any anticipated cost savings or other effects of the planned integration of these entities, and are not necessarily indicative of the results that would have occurred if the Acquisition had been in effect on the date indicated, nor is it intended to be a projection of future results.
If the fiscal year 2020 acquisitions had occurred on May 1, 2018 and the Acquisition had occurred on May 1, 2018 as well, unaudited pro forma revenue and net loss would have been $2,063.7 and $103.2, respectively, for the twelve months ended April 30, 2019.
Acquisition-related Costs
In connection with the acquisitions, the following acquisition-related costs were recognized within acquisition-related costs and other expenses in the consolidated statements of operations:
| Successor | Predecessor | |||||||||||
| For the Year ended April 30, 2020 |
For the Period from November 30, 2018 through April 30, 2019 |
For the Period from May 1, 2018 through December 20, 2018 |
||||||||||
| HCT |
$ | 24.4 | $ | — | $ | — | ||||||
| Zobele |
16.6 | — | — | |||||||||
| KDC |
— | 9.4 | 25.9 | |||||||||
| Others(1) |
7.7 | — | — | |||||||||
|
|
|
|
|
|
|
|||||||
| Total |
$ | 48.7 | $ | 9.4 | $ | 25.9 | ||||||
|
|
|
|
|
|
|
|||||||
| (1) | Includes Alkos, Swallowfield, Benchmark, CLA and Paristy. |
The Company did not recognize any acquisition-related costs in connection with the acquisitions for the year ended April 30, 2021.
Consideration Transferred for Business Acquisitions
The consideration transferred is detailed in the table below:
| 2020 transactions | 2019 transaction |
|||||||||||||||||||
| HCT | Zobele | Others(1) | Total | KDC | ||||||||||||||||
| Cash disbursed |
$ | 430.9 | $ | 442.7 | $ | 159.2 | $ | 1,032.8 | $ | 653.0 | ||||||||||
| Less: cash acquired |
(50.9 | ) | (30.4 | ) | (2.2 | ) | (83.5 | ) | (12.9 | ) | ||||||||||
|
|
|
|
|
|
|
|
|
|
|
|||||||||||
| Cash consideration, net of cash acquired |
380.0 | 412.3 | 157.0 | 949.3 | 640.1 | |||||||||||||||
| Contingent consideration |
— | — | 4.3 | 4.3 | — | |||||||||||||||
| Deferred consideration |
— | — | 23.5 | 23.5 | — | |||||||||||||||
| Discount on non-interest-bearing deferred consideration |
— | — | (1.6 | ) | (1.6 | ) | — | |||||||||||||
| Non-cash consideration (Note 14) |
150.0 | — | — | 150.0 | — | |||||||||||||||
| Issuance of shares (Note 14)(2) |
— | — | — | — | 229.0 | |||||||||||||||
| Post-closing consideration adjustment |
(4.8 | ) | (2.0 | ) | (1.5 | ) | (8.3 | ) | (5.6 | ) | ||||||||||
|
|
|
|
|
|
|
|
|
|
|
|||||||||||
| Total consideration transferred |
$ | 525.2 | $ | 410.3 | $ | 181.7 | $ | 1,117.2 | $ | 863.5 | ||||||||||
|
|
|
|
|
|
|
|
|
|
|
|||||||||||
| (1) | Includes Alkos, Swallowfield, Benchmark, CLA and Paristy. |
| (2) | The share price was based on the price paid by third-party investors investing into the same class of shares at the same time. |
| F-32 |
Table of Contents
The cash portion of the purchase consideration included an amount of €1.2, £2.0, $1.4, $6.0, $5.1 and $10.0 paid in escrow for Alkos, Swallowfield, Benchmark, HCT, CLA and Zobele, respectively, which will be used to settle the respective post-closing adjustments and in the case of Benchmark and CLA a portion will be used for future indemnities. The post-closing consideration adjustment receivable for HCT and Zobele has been received as of April 30, 2021.
Identified Assets Acquired and Liabilities Assumed
During the fourth quarter of fiscal year 2021, the Company closed the purchase price allocation of Zobele and made the following adjustments:
| April 30, 2020 As Reported |
Adjustments | April 30, 2021 As Adjusted |
||||||||||
| Prepaid expenses and other current assets |
$ | 2.8 | $ | (0.4 | ) | $ | 2.4 | |||||
| Property, plant and equipment |
$ | 157.6 | (1.4 | ) | $ | 156.2 | ||||||
| Goodwill |
$ | 180.4 | (4.5 | ) | $ | 175.9 | ||||||
|
|
|
|||||||||||
| Adjustments to total assets |
$ | (6.3 | ) | |||||||||
|
|
|
|||||||||||
| Accrued expenses and other payables |
$ | 27.4 | $ | 0.3 | $ | 27.7 | ||||||
| Income taxes payable |
$ | 5.8 | 4.5 | $ | 10.3 | |||||||
| Deferred income tax liability |
$ | 97.2 | (11.1 | ) | $ | 86.1 | ||||||
|
|
|
|||||||||||
| Adjustments to total liabilities |
$ | (6.3 | ) | |||||||||
|
|
|
|||||||||||
The following tables summarize the final allocation of the total purchase consideration to the fair values of the assets acquired and liabilities assumed at the acquisition date:
| 2020 transactions | ||||||||||||||||
| HCT | Zobele | Others(1) | Total | |||||||||||||
| Current assets |
||||||||||||||||
| Cash and cash equivalents |
$ | 50.9 | $ | 30.4 | $ | 2.2 | $ | 83.5 | ||||||||
| Trade and other receivables |
51.6 | 77.7 | 48.8 | 178.1 | ||||||||||||
| Income taxes receivable |
4.4 | 8.5 | 0.4 | 13.3 | ||||||||||||
| Inventories |
23.4 | 64.9 | 27.9 | 116.2 | ||||||||||||
| Prepaid expenses and other current assets |
10.0 | 2.4 | 13.6 | 26.0 | ||||||||||||
| Property, plant and equipment |
18.7 | 156.2 | 36.8 | 211.7 | ||||||||||||
| Operating lease right-of-use assets |
33.9 | 24.4 | 35.7 | 94.0 | ||||||||||||
| Other assets |
3.9 | — | 1.7 | 5.6 | ||||||||||||
| Other intangibles |
262.1 | 373.8 | 65.2 | 701.1 | ||||||||||||
|
|
|
|
|
|
|
|
|
|||||||||
| Total assets |
$ | 458.9 | $ | 738.3 | $ | 232.3 | $ | 1,429.5 | ||||||||
|
|
|
|
|
|
|
|
|
|||||||||
| Current liabilities |
||||||||||||||||
| Accounts payable |
$ | 30.8 | $ | 87.3 | $ | 37.5 | $ | 155.6 | ||||||||
| Accrued expenses and other payables(2) |
41.1 | 27.7 | 20.2 | 89.0 | ||||||||||||
| Deferred revenue |
3.3 | 26.6 | — | 29.9 | ||||||||||||
| Income taxes payable |
0.4 | 10.3 | 3.0 | 13.7 | ||||||||||||
| Current portion of operating lease liabilities |
4.9 | 3.8 | 3.8 | 12.5 | ||||||||||||
| Current portion of long-term debt(2) |
7.5 | — | — | 7.5 | ||||||||||||
| F-33 |
Table of Contents
| 2020 transactions | ||||||||||||||||
| HCT | Zobele | Others(1) | Total | |||||||||||||
| Operating lease liabilities |
$ | 29.0 | $ | 20.6 | $ | 31.9 | $ | 81.5 | ||||||||
| Long-term debt(2) |
84.5 | 208.2 | 6.1 | 298.8 | ||||||||||||
| Deferred income tax liability |
52.4 | 86.1 | 4.8 | 143.3 | ||||||||||||
| Other liabilities |
— | 2.9 | 0.3 | 3.2 | ||||||||||||
|
|
|
|
|
|
|
|
|
|||||||||
| Total liabilities |
$ | 253.9 | $ | 473.5 | $ | 107.6 | $ | 835.0 | ||||||||
|
|
|
|
|
|
|
|
|
|||||||||
| Net identifiable assets acquired |
205.0 | 264.8 | 124.7 | 594.5 | ||||||||||||
| Less: Cash acquired |
(50.9 | ) | (30.4 | ) | (2.2 | ) | (83.5 | ) | ||||||||
| Goodwill |
371.1 | 175.9 | 59.2 | 606.2 | ||||||||||||
|
|
|
|
|
|
|
|
|
|||||||||
| Total consideration transferred |
$ | 525.2 | $ | 410.3 | $ | 181.7 | $ | 1,117.2 | ||||||||
|
|
|
|
|
|
|
|
|
|||||||||
| (1) | Includes Alkos, Swallowfield, Benchmark, CLA and Paristy. |
| (2) | Shortly after closing, certain transaction costs included in accrued expenses and other payables totaling $15.9, as well as long-term debt of $295.7 were repaid by the Company. |
| 2019 transaction |
||||
| KDC | ||||
| Current assets |
||||
| Cash and cash equivalents |
$ | 12.9 | ||
| Trade and other receivables |
104.6 | |||
| Inventories |
131.6 | |||
| Prepaid expenses and other current assets |
9.6 | |||
| Property, plant and equipment |
245.4 | |||
| Other intangibles |
619.1 | |||
|
|
|
|||
| Total assets |
$ | 1,123.2 | ||
|
|
|
|||
| Current liabilities |
||||
| Accounts payable |
$ | 87.6 | ||
| Accrued expenses and other payables(1) |
69.7 | |||
| Income taxes payable |
5.9 | |||
| Current portion of long-term debt(1) |
262.2 | |||
| Long-term debt(1) |
51.2 | |||
| Deferred income tax liability |
161.5 | |||
| Other liabilities |
0.7 | |||
| Share-based compensation payable(1) |
16.5 | |||
|
|
|
|||
| Total liabilities |
$ | 655.3 | ||
|
|
|
|||
| Net identifiable assets acquired |
467.9 | |||
| Less: cash acquired |
(12.9 | ) | ||
| Goodwill |
408.5 | |||
|
|
|
|||
| Total consideration transferred |
$ | 863.5 | ||
|
|
|
|||
| (1) | Immediately after closing, certain transaction costs included in accrued expenses and other payables totaling $24.8, long-term debt (except for finance lease) and share-based compensation payable for a total of $354.6 were repaid by the Company. |
| F-34 |
Table of Contents
The fair value of trade and other receivables acquired at of the respective dates of acquisition is as noted below:
| 2020 transactions | 2019 transaction |
|||||||||||||||||||
| HCT | Zobele | Others(1) | Total | KDC | ||||||||||||||||
| Gross contractual amounts due |
$ | 52.8 | $ | 82.6 | $ | 49.1 | $ | 184.5 | $ | 105.1 | ||||||||||
| Amounts not expected to be collected |
(1.2 | ) | (4.9 | ) | (0.3 | ) | (6.4 | ) | (0.5 | ) | ||||||||||
|
|
|
|
|
|
|
|
|
|
|
|||||||||||
| Fair value of trade and other receivables, net acquired |
$ | 51.6 | $ | 77.7 | $ | 48.8 | $ | 178.1 | $ | 104.6 | ||||||||||
|
|
|
|
|
|
|
|
|
|
|
|||||||||||
| (1) | Includes Alkos, Swallowfield, Benchmark, CLA and Paristy. |
The following table details the identifiable intangible assets acquired, their fair values and estimated useful lives, as of the respective dates of acquisition:
| 2020 transactions | 2019 transaction |
|||||||||||||||||||
| HCT | Zobele | Others(1) | Total | KDC | ||||||||||||||||
| Customer relationships and other |
||||||||||||||||||||
| Fair value |
$ | 167.0 | $ | 231.0 | $ | 44.3 | $ | 442.3 | $ | 411.9 | ||||||||||
| Weighted-average estimated useful life (in years) |
14 | 15 | 11 | 20 | ||||||||||||||||
| Intellectual property |
||||||||||||||||||||
| Fair value |
$ | 81.7 | $ | 128.9 | $ | 20.9 | $ | 231.5 | $ | 168.3 | ||||||||||
| Weighted-average estimated useful life (in years) |
15 | 15 | 6 | 16 | ||||||||||||||||
| Trade names |
$ | 13.4 | $ | 13.9 | $ | — | $ | 27.3 | $ | 38.9 | ||||||||||
|
|
|
|
|
|
|
|
|
|
|
|||||||||||
| $ | 262.1 | $ | 373.8 | $ | 65.2 | $ | 701.1 | $ | 619.1 | |||||||||||
|
|
|
|
|
|
|
|
|
|
|
|||||||||||
| (1) | Includes Alkos, Swallowfield, Benchmark, CLA and Paristy. |
| 5 | Trade and Other Receivables, Net |
| April 30, 2021 | April 30, 2020 | |||||||
| Trade accounts receivable |
$ | 266.3 | $ | 255.1 | ||||
| Post-closing receivables from business combinations (Note 4) |
1.4 | 3.5 | ||||||
| Other receivables |
12.7 | 10.0 | ||||||
| Sales taxes receivable |
19.7 | 12.6 | ||||||
| Allowances for current expected credit losses |
(10.2 | ) | (8.5 | ) | ||||
|
|
|
|
|
|||||
| Total |
$ | 289.9 | $ | 272.7 | ||||
|
|
|
|
|
|||||
The past due receivables are as follows:
| April 30, 2021 | April 30, 2020 | |||||||
| Not past due |
$ | 221.2 | $ | 161.8 | ||||
| Past due 0-90 days |
29.2 | 66.9 | ||||||
| Past due more than 90 days |
15.9 | 26.4 | ||||||
|
|
|
|
|
|||||
| $ | 266.3 | $ | 255.1 | |||||
|
|
|
|
|
|||||
| F-35 |
Table of Contents
The change in the allowances for current expected credit losses in respect of trade accounts receivable is as follows:
| April 30, 2021 | April 30, 2020 | April 30, 2019 | ||||||||||
| Opening balance |
$ | 8.5 | $ | 0.6 | $ | — | ||||||
| Business combinations (Note 4) |
— | 6.4 | 0.5 | |||||||||
| Net remeasurement of allowances for current expected credit losses |
2.7 | 2.0 | 0.1 | |||||||||
| Trade accounts receivable written off |
(1.0 | ) | (0.5 | ) | — | |||||||
|
|
|
|
|
|
|
|||||||
| Ending balance |
$ | 10.2 | $ | 8.5 | $ | 0.6 | ||||||
|
|
|
|
|
|
|
|||||||
The Company’s credit risk is principally attributable to its trade and other receivables. The carrying amount of trade and other receivables in the consolidated balance sheets is presented net of an allowance for current expected credit losses (“CECL”). In its assessment of whether specific accounts receivable were collectable as of April 30, 2021, the Company used available relevant information, both from internal and external sources, relating to past events, current conditions and reasonable forecasts under the CECL methodology. This included information relating to the risk of default of its customers given the economic downturn caused by the COVID-19 pandemic. In addition, the allowance for CECL is measured on a collective pool basis, by grouping customers with trade receivables with similar characteristics. Our portfolio segmentation was characterized by similarities in initial measurement, risk attributes and the manner in which the Company monitored and assessed credit risk.
The distribution of the Company’s customers contributes to reducing the concentration of credit risk. Generally, the Company does not require collateral or other security from customers for trade accounts receivable; however, credit is only extended following an evaluation of creditworthiness. In addition, the Company performs ongoing credit reviews of the majority of its customers. A credit assessment is performed by analyzing the financial situation (when available), the payment history of the Company’s customers, the bank references, as well as all relevant historical information on the client.
For certain trade accounts receivable, the Company may obtain a guarantee in the form of an insurance policy under which a specific credit limit is approved for each individual customer and protects the Company in the event of the customer’s bankruptcy. The insurance lists the countries and the maximum payment terms under which insurance coverage is provided and sets out the premium rates applicable to sales made by the Company.
Amounts owed from one customer represented 11% and less than 10% of the total trade accounts receivable as of April 30, 2021 and 2020, respectively. Amounts owed from another customer represented less than 10% and 14% of the total trade accounts receivable as of April 30, 2021 and 2020, respectively.
Based on the distribution and credit quality of customers and initiatives to optimize the collection of amounts due under sales arrangements with customers, the Company believes that the credit risk related to trade and other receivables is limited.
| 6 | Inventories |
| April 30, 2021 | April 30, 2020 | |||||||
| Raw and consumable materials |
$ | 181.2 | $ | 151.7 | ||||
| Work in process |
34.6 | 25.1 | ||||||
| Finished goods |
49.3 | 43.7 | ||||||
|
|
|
|
|
|||||
| Total |
$ | 265.1 | $ | 220.5 | ||||
|
|
|
|
|
|||||
| F-36 |
Table of Contents
| 7 | Prepaid Expenses and Other Current Assets |
The balances of prepaid expenses and other current assets are as follows:
| April 30, 2021 | April 30, 2020 | |||||||
| Prepaid expenses |
$ | 22.5 | $ | 17.4 | ||||
| Other current assets |
8.9 | 10.6 | ||||||
|
|
|
|
|
|||||
| Total |
$ | 31.4 | $ | 28.0 | ||||
|
|
|
|
|
|||||
| 8 | Property, Plant and Equipment, Net |
As of April 30, 2021 and April 30, 2020, the Company’s property, plant and equipment balances consisted of the following:
| April 30, 2021 | April 30, 2020 | |||||||
| Land |
$ | 48.3 | $ | 44.1 | ||||
| Buildings |
100.0 | 95.4 | ||||||
| Machinery and equipment |
344.5 | 292.0 | ||||||
| Computer equipment |
12.6 | 9.7 | ||||||
| Furniture and fixtures |
9.3 | 7.6 | ||||||
| Leasehold improvements |
19.7 | 17.8 | ||||||
| Capital projects in progress |
90.9 | 27.0 | ||||||
|
|
|
|
|
|||||
| 625.3 | 493.6 | |||||||
| Accumulated depreciation and amortization |
(105.4 | ) | (38.4 | ) | ||||
|
|
|
|
|
|||||
| $ | 519.9 | $ | 455.2 | |||||
|
|
|
|
|
|||||
The increase in capital projects in progress is mostly explained by (i) a new facility in Columbus, Ohio, where operations began in fiscal year 2022 and (ii) the investment to double our capacity in our manufacturing facility in Texas.
Depreciation and amortization expense on property, plant and equipment for the years ended April 30, 2021 and 2020, for the period from November 30, 2018 through April 30, 2019 and for the period from May 1, 2018 through December 20, 2018 was $67.5, $30.0, $8.4 and $14.6, respectively.
No impairment losses were recorded for property, plant and equipment during the periods presented.
| 9 | Leases |
The Company has operating and finance leases for a variety of different assets, which include land and buildings (real estate), heavy manufacturing equipment, rolling stock (mobile and transportation equipment), furniture, fixtures and office equipment, and computer equipment.
The right-of-use assets related to operating and finance leases included in the consolidated balance sheets are as follows:
| Balance sheet location |
April 30, 2021 | April 30, 2020 | ||||||||
| Operating leases |
Operating lease right-of-use assets | $ | 144.8 | $ | 125.1 | |||||
| Finance leases |
Property, plant and equipment, net | 7.5 | 8.3 | |||||||
|
|
|
|
|
|||||||
| $ | 152.3 | $ | 133.4 | |||||||
|
|
|
|
|
|||||||
| F-37 |
Table of Contents
Operating lease and finance lease liabilities included in the consolidated balance sheets are as follows:
| Balance sheet location |
April 30, 2021 | April 30, 2020 | ||||||||
| Operating leases: |
||||||||||
| Current portion |
Current portion of operating lease liabilities | $ | 22.0 | $ | 19.2 | |||||
| Non-current portion |
Operating lease liabilities | 133.1 | 104.8 | |||||||
| Finance leases: |
||||||||||
| Current portion |
Current portion of long-term debt | 2.0 | 1.8 | |||||||
| Non-current portion |
Long-term debt | 5.3 | 6.1 | |||||||
|
|
|
|
|
|||||||
| $ | 162.4 | $ | 131.9 | |||||||
|
|
|
|
|
|||||||
The components of the lease expense reflected in the Company’s consolidated statements of operations were as follows:
| Successor | ||||||||||
| Statement of operations location |
For the Year ended April 30, 2021 |
For the Year ended April 30, 2020 |
||||||||
| Operating leases cost |
Cost of revenue and Selling, general and administrative expenses | $ | 30.7 | $ | 14.2 | |||||
| Finance leases cost: |
||||||||||
| Amortization of right-of-use assets |
Cost of revenue and Selling, general and administrative expenses | 1.9 | 1.6 | |||||||
| Interest on lease liabilities |
Interest expense | 0.3 | 0.3 | |||||||
| Variable lease cost(1) |
Cost of revenue and Selling, general and administrative expenses | 8.9 | 3.9 | |||||||
|
|
|
|
|
|||||||
| $ | 41.8 | $ | 20.0 | |||||||
|
|
|
|
|
|||||||
| (1) | Includes short-term lease cost, which is not material for the years ended April 30, 2021 and 2020. |
Supplemental cash flow information related to leases was as follows:
| Successor | ||||||||
| For the Year ended April 30, 2021 |
For the Year ended April 30, 2020 |
|||||||
| Cash paid for amounts included in the measurement of lease liabilities: |
||||||||
| Operating cash flows from operating leases |
$ | 27.5 | $ | 12.9 | ||||
| Operating cash flows from finance leases |
$ | 0.3 | $ | 0.3 | ||||
| Financing cash flows from finance leases |
$ | 1.9 | $ | 1.6 | ||||
| Lease assets obtained in exchange for new lease obligations: |
||||||||
| Operating leases |
$ | 47.5 | $ | 98.6 | ||||
| Finance leases |
$ | 0.6 | $ | 8.2 | ||||
| F-38 |
Table of Contents
During the year ended April 30, 2021, the Company entered into the following significant operating leases:
In May 2020, the Company entered into a new manufacturing building lease and recorded a right-of-use asset and a lease liability of $11.7. Annual payments start at $1.6 and end at $2.5. The initial lease term expires in fiscal year 2028. There is no renewal option.
In December 2020, the Company entered into a new manufacturing building lease and recorded a right-of-use asset and a lease liability of $5.0. Annual payments start at $0.4 and end at $0.6. The initial lease term expires in fiscal year 2036. Two options to extend the term for five additional years each are not reasonably certain to be exercised.
In February 2021, the Company entered into a new manufacturing building lease and recorded a right-of-use asset and lease liability of $15.2. Annual payments start at $1.3 and end at $1.7. The initial lease term expires in fiscal year 2036. Two options to extend the term for five additional years each are not reasonably certain to be exercised.
During the third quarter of fiscal year 2021, the Company identified a right-of-use asset impairment trigger on one of its leases. The Company entered into an office building lease on December 31, 2019. Due to the COVID-19 pandemic, the Company delayed taking possession and control of the office building suites until the latest possible commencement date which was January 1, 2021. On this date, the Company recorded a right-of-use asset and lease liability of $8.8. Annual payments start at $1.3 and end at $1.7. The initial lease term expires in fiscal year 2028. Due to confinement rules and new working habits, the Company no longer plans to use the space as it was initially intended. The Company performed an impairment test and concluded that the asset was impaired and recorded an impairment loss of $6.1 on the right-of-use asset within acquisition-related costs and other expenses. The fair value of the right-of-use asset was estimated using a discounted cash flow methodology. The right-of-use asset is reported in the Beauty and Personal Care segment.
As of April 30, 2021, the total future undiscounted lease payments, over the remaining lease term, relating to the Company’s operating and finance leases for each of the next five fiscal years and thereafter was as follows:
| Operating Leases | Finance Leases | |||||||
| Fiscal 2022 |
$ | 30.3 | $ | 2.1 | ||||
| Fiscal 2023 |
28.0 | 1.5 | ||||||
| Fiscal 2024 |
26.1 | 1.1 | ||||||
| Fiscal 2025 |
24.5 | 0.7 | ||||||
| Fiscal 2026 |
23.0 | 0.3 | ||||||
| Thereafter |
59.6 | 3.0 | ||||||
|
|
|
|
|
|||||
| Total lease payments |
$ | 191.5 | $ | 8.7 | ||||
| Less interest |
36.4 | 1.4 | ||||||
|
|
|
|
|
|||||
| Present value of lease liabilities |
$ | 155.1 | $ | 7.3 | ||||
|
|
|
|
|
|||||
| F-39 |
Table of Contents
The Company has calculated the weighted-average remaining lease term, presented in years below, and the weighted-average discount rate for the operating and finance lease population. The Company uses the incremental borrowing rate as the lease discount rate, unless the lessor’s rate implicit in the lease is readily determinable, in which case it is used.
| April 30, 2021 | ||||||||
| Operating Leases | Finance Leases | |||||||
| Weighted-average remaining lease term (years) |
7 | 9 | ||||||
| Weighted-average discount rate |
5.7 | % | 3.4 | % | ||||
| April 30, 2020 | ||||||||
| Operating Leases | Finance Leases | |||||||
| Weighted-average remaining lease term (years) |
7 | 9 | ||||||
| Weighted-average discount rate |
5.6 | % | 3.2 | % | ||||
| 10 | Other Intangibles, Net |
| April 30, 2021 | ||||||||||||||||
| Gross Value | Accumulated Amortization |
Net Value | Weighted- Average Estimated Useful Life (In Years) |
|||||||||||||
| Intangible assets with finite useful life: |
||||||||||||||||
| Customer relationships and other |
$ | 859.3 | $ | (83.8 | ) | $ | 775.5 | 17 | ||||||||
| Intellectual property |
407.5 | (53.4 | ) | 354.1 | 15 | |||||||||||
|
|
|
|
|
|
|
|||||||||||
| $ | 1,266.8 | $ | (137.2 | ) | $ | 1,129.6 | ||||||||||
| Intangible assets with indefinite useful life: |
||||||||||||||||
| Trade names |
66.9 | |||||||||||||||
|
|
|
|||||||||||||||
| $ | 1,196.5 | |||||||||||||||
|
|
|
|||||||||||||||
| April 30, 2020 | ||||||||||||||||
| Gross Value | Accumulated Amortization |
Net Value | Weighted- Average Estimated Useful Life (In Years) |
|||||||||||||
| Intangible assets with finite useful life: |
||||||||||||||||
| Customer relationships and other |
$ | 851.7 | $ | (31.6 | ) | $ | 820.1 | 17 | ||||||||
| Intellectual property |
399.8 | (20.4 | ) | 379.4 | 15 | |||||||||||
|
|
|
|
|
|
|
|||||||||||
| $ | 1,251.5 | $ | (52.0 | ) | $ | 1,199.5 | ||||||||||
| Intangible assets with indefinite useful life: |
||||||||||||||||
| Trade names |
66.2 | |||||||||||||||
|
|
|
|||||||||||||||
| $ | 1,265.7 | |||||||||||||||
|
|
|
|||||||||||||||
| F-40 |
Table of Contents
The aggregate amortization expense related to intangible assets with finite useful life for the years ended April 30, 2021 and 2020, the period from November 30, 2018 through April 30, 2019 and the period from May 1, 2018 through December 20, 2018 was $83.8, $40.2, $12.1 and $11.6 respectively.
As of October 31, 2020, the Company performed a quantitative impairment analysis of the HCT trade name utilizing the relief-from-royalty method by comparing the fair value of the trade name to its carrying value. Based on this information, the Company recognized a non-cash impairment charge of $0.9 in the consolidated statements of operations within impairment loss on goodwill and other intangibles. The impairment charge is reported in the Beauty and Personal Care segment.
A quantitative impairment analysis was performed in the fourth fiscal quarter of fiscal year 2021 for the trade names. As a result of this annual impairment analysis, the Company determined that there was no impairment of the trade names.
The estimated aggregate amortization expense related to intangible assets with finite useful life for each of the next five fiscal years is as follows:
| Fiscal | ||||||||||||||||||||
| 2022 | 2023 | 2024 | 2025 | 2026 | ||||||||||||||||
| Estimated aggregate amortization expense |
$ | 83.0 | $ | 83.0 | $ | 81.9 | $ | 78.0 | $ | 76.0 | ||||||||||
| 11 | Goodwill |
The following table presents goodwill by reportable segment:
| Beauty and Personal Care |
Home Care |
Total | ||||||||||
| Balance as of November 30, 2018 |
$ | — | $ | — | $ | — | ||||||
| Business acquisitions (Note 4) |
362.5 | 46.0 | 408.5 | |||||||||
|
|
|
|
|
|
|
|||||||
| Balance as of April 30, 2019 |
$ | 362.5 | $ | 46.0 | $ | 408.5 | ||||||
|
|
|
|
|
|
|
|||||||
| Business acquisitions (Note 4) |
430.3 | 180.4 | 610.7 | |||||||||
| Foreign currency translation adjustment |
(0.2 | ) | — | (0.2 | ) | |||||||
|
|
|
|
|
|
|
|||||||
| Balance as of April 30, 2020 |
$ | 792.6 | $ | 226.4 | $ | 1,019.0 | ||||||
|
|
|
|
|
|
|
|||||||
| Measurement period adjustments |
— | (4.5 | ) | (4.5 | ) | |||||||
| Foreign currency translation adjustment |
2.2 | 4.3 | 6.5 | |||||||||
| Impairment loss |
(47.3 | ) | — | (47.3 | ) | |||||||
|
|
|
|
|
|
|
|||||||
| Balance as of April 30, 2021 |
$ | 747.5 | $ | 226.2 | $ | 973.7 | ||||||
|
|
|
|
|
|
|
|||||||
Assessment for Impairment
For fiscal year 2020, the uncertainties around the COVID-19 pandemic required the use of judgments and estimates in the impairment testing of goodwill and trade names. The projections assume a recovery from the COVID-19 pandemic around the end of the 2021 fiscal year. The Company completed a quantitative assessment for fiscal year 2020 using these projections and determined that there was no impairment of the reporting units and trade names. As a result, no impairment losses were recorded for goodwill and trade names for the year ended April 30, 2020.
| F-41 |
Table of Contents
At the end of the second quarter of fiscal year 2021, the Company underwent a strategic reorganization to realign the business into two operating and reportable segments. This strategic reorganization required the Company to determine its new reporting units. The Company performed goodwill impairment testing immediately before and after the reorganization. In applying the goodwill impairment test, the Company has the option to perform a qualitative test (also known as “Step 0”) or a quantitative test. Under the Step 0 test, the Company first assesses qualitative factors to determine whether it is more likely than not that the fair value of the reporting units is less than their carrying value. Qualitative factors may include, but are not limited to, economic conditions, industry and market considerations, cost factors, overall financial performance of the reporting unit and other entity and reporting unit specific events. If after assessing these qualitative factors, the Company determines it is not “more likely than not” that the fair value of the reporting unit is less than the carrying value, then performing the quantitative test is unnecessary. The Company performed a Step 0 analysis and determined that it was “more likely than not” that the fair value of HCT reporting unit immediately before the reorganization was less than its carrying amount.
The Company then performed a quantitative impairment test based on updated forecasts for the HCT reporting unit which indicated a decline in operating cash flows to levels lower than previously forecasted, due in large part to the impacts of the COVID-19 pandemic. In estimating the fair value of reporting units, the Company typically forecasts cash flows for a five year period and includes an estimated terminal value at the end of the five year period. The key estimates and factors used in this approach include, but are not limited to, revenue growth rates and earnings before interest, income tax, depreciation and amortization expenses (“EBITDA”) based on internal forecasts, a weighted-average cost of capital used to discount future cash flows, terminal growth rate, as well as historical operating trends and reflecting a more gradual recovery from the COVID-19 pandemic than expected, delayed into fiscal year 2022. The Company concluded that the estimated fair value of the HCT reporting unit was less than its carrying value as of the end of the second quarter of fiscal year 2021, and recorded a non-cash goodwill impairment charge of $47.3 during the second quarter of fiscal year 2021. The charge is included within impairment loss on goodwill and other intangibles in the consolidated statements of operations.
The Company qualitatively assessed one other reporting unit and determined that it was “more likely than not” that the fair value of that reporting unit immediately before the reorganization was less than its carrying amount. That reporting unit subsequently passed the quantitative assessment.
As part of the impairment testing immediately after the reorganization, no impairment resulted.
A quantitative impairment analysis was performed in the fourth fiscal quarter of fiscal year 2021 for all reporting units. Additional uncertainty existed in the forecasted cash flows due to the COVID-19 pandemic impact, including the projected timing of the recovery. Further, minor changes in any of the above assumptions could have had a significant effect on the determination of the estimated fair value of the Beauty and Personal Care reporting unit in the fourth quarter of fiscal year 2021. As a result of this annual impairment analysis, the Company determined that there was no impairment of goodwill.
| F-42 |
Table of Contents
| 12 | Accrued Expenses and Other Payables |
The balances of accrued expenses and other payables are as follows:
| April 30, 2021 | April 30, 2020 | |||||||
| Salaries and benefits |
$ | 67.6 | $ | 59.9 | ||||
| Acquisition-related costs |
— | 19.1 | ||||||
| Accrued utilities and other expenses |
34.1 | 35.7 | ||||||
| Sales rebates |
24.9 | 9.4 | ||||||
| Sales and use taxes |
12.5 | 1.4 | ||||||
| Deferred and contingent consideration(1) |
2.0 | 26.1 | ||||||
| Other payables |
17.8 | 8.4 | ||||||
|
|
|
|
|
|||||
| Total |
$ | 158.9 | $ | 160.0 | ||||
|
|
|
|
|
|||||
| (1) | The long-term portion of contingent consideration is included within other liabilities in the consolidated balance sheets. |
| 13 | Debt |
| April 30, 2021 | April 30, 2020 | |||||||
| Terms Loans due in 2025: |
||||||||
| Principal amount |
$ | 1,583.7 | $ | 1,421.1 | ||||
| Deferred transaction costs |
(33.1 | ) | (38.6 | ) | ||||
| Unamortized issuance discount |
(19.6 | ) | (11.0 | ) | ||||
|
|
|
|
|
|||||
| Total Term Loans due in 2025 |
$ | 1,531.0 | $ | 1,371.5 | ||||
| Borrowings under revolving credit facility due in 2023 |
177.0 | 119.0 | ||||||
| Finance leases |
7.3 | 7.9 | ||||||
| Other borrowings |
4.5 | 4.3 | ||||||
|
|
|
|
|
|||||
| Total long-term debt |
$ | 1,719.8 | $ | 1,502.7 | ||||
| Less: current portion of long-term debt |
18.0 | 16.1 | ||||||
|
|
|
|
|
|||||
| Long-term debt, net of current portion |
$ | 1,701.8 | $ | 1,486.6 | ||||
|
|
|
|
|
|||||
Terms Loans Due in 2025
On December 21, 2018, the Company entered into a credit agreement (the “Credit Agreement”) for a term loan (the “First Lien Term Loan”) bearing interest at LIBOR plus 4.25% in an aggregate principal amount equal to $525.0, maturing on December 21, 2025. Upon issuance, the Company recognized transaction costs and issuance discount of $14.7 and $10.5, respectively.
The Company and the lenders executed the following amendments to the First Lien Term Loan, which resulted in an increase to the Credit Agreement under the same terms and conditions as the First Lien Term Loan and were executed as a single class of borrowings:
| • | On August 22, 2019, to increase the term loan borrowing base by $105.0 which resulted in recognized transaction costs and issuance discount of $2.7 and $0.3, respectively; and |
| • | On January 23, 2020, to increase the term loan borrowing base by $300.0 which resulted in recognized transaction costs and issuance discount of $10.2 and $1.3, respectively. |
| F-43 |
Table of Contents
On January 29, 2020, the Company and the lenders agreed to replace the outstanding term loans under the Credit Agreement, as amended, with new term loans bearing interest at LIBOR plus 3.75% (or an alternate base rate plus 2.75%). Other than resulting in a decrease in the interest rate on the outstanding debt, the new term loans have similar terms and conditions as those under the initial Credit Agreement, including, but not limited to, the payment terms and method of payments, the group of lenders, and the maturity date. The Company concluded this replacement was a modification of the existing debt rather than an extinguishment, which resulted in no gain or loss being recorded in the consolidated statements of operations.
On April 30, 2020, the Company and the lenders agreed to another incremental increase in the term loan borrowing base of $500.0 under the same terms and conditions as the First Lien Term Loan and as a single class of borrowings. The Company recognized transaction costs and issuance discount of $14.9 and $1.3, respectively, related to this amendment.
On July 28, 2020, the Company entered into a term loan denominated in euros (the “Euro Term Loan” and together with the First Lien Term Loan, the “Term Loans”) bearing interest at EURIBOR (subject to a minimum floor of 0%) plus 5% in an aggregate principal amount equal to €460.0 under the same terms and conditions as the First Lien Term Loan and as a single class of borrowings. The Company used the proceeds of the Euro Term Loan to prepay the incremental term loans of $500.0 obtained on April 30, 2020 and pay fees, expenses and other amounts due in connection therewith. The Company considered this amendment as a modification of the existing debt rather than an extinguishment, which resulted in no gain or loss being recorded in the consolidated statements of operations. The Company recognized an issuance discount of €10.5 ($12.3) related to this amendment.
On January 27, 2021, the Company and the lenders agreed to another incremental increase in the term loan borrowing base of €100.0 under the same terms and conditions as the Term Loans and forming part of the same class of borrowings as the incremental Euro Term Loan obtained on July 28, 2020. The incremental borrowings under this amendment were used to fund the returns of capital described in Note 14, Shareholders’ Equity. The Company recognized transaction costs and issuance discount of $1.7 and $0.6, respectively, related to this amendment.
Transactions costs and issuance discounts on the First Lien Term Loan are capitalized and amortized to interest expense in the consolidated statements of operations using the effective interest method over the term of the loans. As of April 30, 2021 and 2020, the effective interest rates on the First Lien Term Loan were 4.837% and 5.018%, respectively, and 5.937% on the Euro Term Loan as of April 30, 2021.
The First Lien Term Loan is payable in quarterly installments of $4.0 and matures on December 21, 2025 with a lump-sum payment of $1,511.7. The First Lien Term Loan is also subject to annual mandatory prepayments equal to 50% of the Excess Cash Flow of the Company (as defined in the Credit Agreement). The Company has the right at any time and from time to time to prepay the First Lien Term Loan, in whole or in part, without premium or penalty.
| F-44 |
Table of Contents
The Company’s interest expense is as follows:
| Successor | Predecessor | |||||||||||||||
| For the Year ended April 30, 2021 |
For the Year ended April 30, 2020 |
For the Period from November 30, 2018 through April 30, 2019 |
For the Period from May 1, 2018 through December 20, 2018 |
|||||||||||||
| Interest on long-term debt |
$ | 67.3 | $ | 42.0 | $ | 13.4 | $ | 11.6 | ||||||||
| Amortization of transaction costs and issuance discount related to long-term debt |
10.6 | 5.1 | 1.0 | 1.7 | ||||||||||||
| Interest on finance lease liabilities |
0.3 | 0.3 | — | — | ||||||||||||
|
|
|
|
|
|
|
|
|
|||||||||
| Interest expense |
$ | 78.2 | $ | 47.4 | $ | 14.4 | $ | 13.3 | ||||||||
|
|
|
|
|
|
|
|
|
|||||||||
Revolving Credit Facility Due in 2023
On December 21, 2018, concurrently with the First Lien Term Loan, the Company entered into a revolving credit facility (the “Revolving Facility”) under the Credit Agreement in an original aggregate principal amount of $75.0. Advances under the Revolving Facility bear interest from the date of each advance at the LIBOR or alternate base rate for borrowings in U.S. dollars or at the Canadian prime rate or applicable banker’s acceptance rate for borrowings in Canadian dollars, plus an applicable margin according to the ratio, on a consolidated basis, of the Term Loans and Revolving Facility to Consolidated Adjusted EBITDA (as defined in the Credit Agreement, and which is different from the Adjusted EBITDA used for the purpose of segment data in Note 24, Segment Data and Related Information). The Revolving Facility will mature on December 21, 2023. The Company has the right at any time and from time to time to prepay the amounts due under the Revolving Facility, in whole or in part without premium or penalty.
The Revolving Facility was further increased as follows:
| • | On January 23, 2020, increased by $50.0 to a maximum draw of $125.0; |
| • | On July 28, 2020, increased by $25.0 to a maximum draw of $150.0; |
| • | On December 4, 2020, increased by $25.0 to a maximum draw of $175.0; |
| • | On January 27, 2021, increased by $170.0 to a maximum draw of $345.0; and |
| • | On February 24, 2021, increased by $10.0 to a maximum draw of $355.0. |
As of April 30, 2021, availability under the Revolving Facility was $175.6 net of $177.0 of borrowings and $2.4 of letters of credit outstanding. As of April 30, 2021 and 2020, the effective interest rates on the Revolving Facility were 3.363% and 5.500%, respectively.
The aggregate principal amount of the Term Loans and Revolving Facility outstanding is secured by a lien on any assets of or property of the Company which lien is pari passu or senior to any other lien otherwise secured.
Under the Term Loans and Revolving Facility, the Company is required to maintain certain financial ratios. As of April 30, 2021, the Company was in compliance with these financial ratios.
| F-45 |
Table of Contents
Maturities of Long-term Debt
As of April 30, 2021, annual maturities of long-term debt, excluding finance leases and mandatory prepayments based on the Excess Cash Flow of the Company, are as follows:
| Years Ended April 30, |
Long-Term Debt Maturities |
|||
| 2022 |
$ | 16.0 | ||
| 2023 |
16.4 | |||
| 2024 |
193.4 | |||
| 2025 |
16.4 | |||
| 2026 |
1,520.1 | |||
| Thereafter |
2.9 | |||
|
|
|
|||
| Total |
$ | 1,765.2 | ||
| Less: Deferred transaction costs and unamortized issuance discount |
(52.7 | ) | ||
|
|
|
|||
| Total |
$ | 1,712.5 | ||
|
|
|
|||
See Note 25, Condensed Financial Information of Registrant (Parent Company Only), for condensed financial information of the registrant.
| 14 | Shareholders’ Equity |
Shareholders’ Equity (Predecessor)
Prior to the Acquisition described in Note 1, Description of Business and Basis of Presentation, the Company had 309,344,128 common shares issued and outstanding. Upon completion of the Acquisition, these shares were exchanged for Class A and Class B common shares as described below and thus are no longer outstanding.
Shareholders’ Equity (Successor)
Class A common shares are voting, participating, without par value, and without special rights or restrictions attached. Class B common shares are non-voting, participating, without par value and without special rights or restrictions attached.
On December 21, 2018, in connection with the closing of the Acquisition, 509,959 Class A and 355 Class B common shares were issued for an amount of $510.4 paid in cash. In addition, 223,042 Class A and 5,995 Class B common shares were issued to former shareholders of Knowlton Development Corporation Inc., including certain members of management, in exchange of all of the 309,344,128 issued and outstanding shares of Knowlton Development Corporation Inc., for a total value of $229.0 (see Note 4, Business Combinations).
On January 23, 2020, 291,818 Class A and 9,317 Class B common shares were issued for an amount of $331.2 paid in cash. In addition, 136,364 Class A common shares were issued to offset the HCT unpaid consideration, for a total value of $150.0 (see Note 4, Business Combinations).
On April 30, 2020, 72,000 Class A common shares were issued for an amount of $90.0 paid in cash.
On May 4, 2020, 363 Class B common shares were issued to a new shareholder for a net amount of $0.4 paid in cash.
| F-46 |
Table of Contents
On September 16, 2020, 120,000 Class A common shares were issued to existing shareholders for an amount of $150.0 paid in cash. The funds were used to repay the Revolving Facility and to finance operations.
On March 19, 2021, 711 Class B common shares have been issued upon the exercise of stock options pursuant to the Stock Option Plan for an amount of $0.6 paid in cash.
During the year ended April 30, 2021, the Company repurchased 200 Class B common shares for $0.2, of which $0.1 was paid in cash and $0.1 was offset against accounts receivable.
Shares to be Issued
On December 1, 2020, the Company reclassified a deferred consideration of $1.1 from accrued expenses and other payables to shares to be issued. This amount represents the consideration to be paid in form of Class B common shares in connection with the acquisition of Paristy (see Note 4, Business Combinations). Subject to the terms of the Paristy share purchase agreement, the Company has an obligation to issue 703 Class B common shares in December 2021.
Distribution
On or about February 3, 2021, the Company effected returns of capital in the aggregate amount of $318.5, which were distributed to the Company’s shareholders. Those returns of capital were funded, along with cash, by an increase in borrowings under the Euro Term Loan and the Revolving Facility that took place on January 27, 2021 (see Note 13, Debt). In connection with the returns of capital, the Company made adjustments in accordance with the equitable adjustment provision of the Stock Option Plan composed of a reduction in the exercise price of previously granted options and payments in cash in respect of such options that are further described in Note 15, Employee Benefits.
Accumulated Other Comprehensive Income (Loss)
The changes in the components of accumulated other comprehensive income (loss) during the years ended April 30, 2021 and 2020, and the period from November 30, 2018 through April 30, 2019 were as follows:
| Successor | ||||||||||||||||
| Foreign Currency Translation Adjustments |
Net Investment Hedge |
Cash Flow Hedges |
Total | |||||||||||||
| Total other comprehensive income, net of income taxes |
$ | — | $ | — | $ | — | $ | — | ||||||||
|
|
|
|
|
|
|
|
|
|||||||||
| Balance – As of April 30, 2019 |
$ | — | $ | — | $ | — | $ | — | ||||||||
|
|
|
|
|
|
|
|
|
|||||||||
| Other comprehensive income (loss) before reclassifications |
(1.8 | ) | — | 0.6 | (1.2 | ) | ||||||||||
| Amounts reclassified from accumulated other comprehensive income (loss) into net loss |
— | — | (0.1 | ) | (0.1 | ) | ||||||||||
| Income tax expense |
— | — | (0.1 | ) | (0.1 | ) | ||||||||||
|
|
|
|
|
|
|
|
|
|||||||||
| Total other comprehensive income (loss), net of income taxes |
(1.8 | ) | — | 0.4 | (1.4 | ) | ||||||||||
|
|
|
|
|
|
|
|
|
|||||||||
| Balance – As of April 30, 2020 |
$ | (1.8 | ) | $ | — | $ | 0.4 | $ | (1.4 | ) | ||||||
|
|
|
|
|
|
|
|
|
|||||||||
| F-47 |
Table of Contents
| Successor | ||||||||||||||||
| Foreign Currency Translation Adjustments |
Net Investment Hedge |
Cash Flow Hedges |
Total | |||||||||||||
| Other comprehensive income (loss) before reclassifications |
$ | 10.3 | $ | (5.8 | ) | $ | 2.1 | $ | 6.6 | |||||||
| Amounts reclassified from accumulated other comprehensive income (loss) into net loss |
— | — | (2.3 | ) | (2.3 | ) | ||||||||||
| Income tax benefit |
— | — | 0.1 | 0.1 | ||||||||||||
|
|
|
|
|
|
|
|
|
|||||||||
| Total other comprehensive income (loss), net of income taxes |
10.3 | (5.8 | ) | (0.1 | ) | 4.4 | ||||||||||
|
|
|
|
|
|
|
|
|
|||||||||
| Balance – As of April 30, 2021 |
$ | 8.5 | $ | (5.8 | ) | $ | 0.3 | $ | 3.0 | |||||||
|
|
|
|
|
|
|
|
|
|||||||||
| 15 | Employee Benefits |
Defined Contributions Plans
The Company offers various defined contribution retirement plans to its employees. The Company’s contributions to the plans amounted to $4.1, $2.5, $0.6, and $1.0 for the years ended April 30, 2021 and 2020, for the period from November 30, 2018 through April 30, 2019, and for the period from May 1, 2018 through December 20, 2018, respectively.
Defined Benefit Plans
The Company operates defined benefit plans in Italy, Mexico, India and Bulgaria under different regulatory frameworks, which are not considered to be material. Almost all of the plans are final salary pension plans, which provide post-employment benefits to members in the form of a guaranteed level of pension payable. Post-employment benefits are cumulative remunerations giving place to future benefits for employees, offered by the Company in exchange of current employee’s services, whose right is granted to the employee during their working relationship and is acquired by the employee and/or beneficiaries at retirement from the entity and/or upon reaching the retirement age or another eligibility condition.
The level of benefits provided depends on members’ length of service and their salary at the time of the termination of the labor contract in the final years leading up to retirement. The defined benefit plans have aggregate projected benefit obligations of $4.6 and $2.9, with no funded plan assets, as of April 30, 2021 and 2020, respectively. Pension expenses incurred for the year ended April 30, 2021 were $1.7. As the Company assumed these obligations as part of the fiscal year 2020 acquisitions, no pension expenses were incurred for the year ended April 30, 2020, for the period from November 30, 2018 through April 30, 2019, and for the period from May 1, 2018 through December 20, 2018, respectively.
Share-based Compensation (Successor)
On April 26, 2019, the Company adopted a Stock Option Plan (hereafter referred to as the “Stock Option Plan”) to grant options to directors, officers, or employees of the Company and its subsidiaries with options to purchase shares of the Company that are subject to either time-based vesting or performance-based vesting. Under the terms of the plan, the Company has the discretion to issue options for the purchase of up to 82,150 Class B common shares of the Company. During the years ended April 30, 2021 and 2020, the Company increased the number of options available for issuance by 45,475 to 127,625.
| F-48 |
Table of Contents
The options have a contractual life of 10 years. As of April 30, 2020, the vesting conditions were as follows:
| • | One third of the options subject to time-based vesting criteria will vest over the first five years after the grant date, subject to accelerated vesting upon a sale of 50% or greater of the Company’s shares; and |
| • | Two thirds of the options subject to performance and market based vesting criteria will vest upon a sale of 50% or greater of the Company’s shares, subject to the optionee’s continued service. Vesting of these options is contingent upon the achievement of certain performance goals by the Company’s sponsors (represented by majority shareholders) as measured by the multiple on invested capital (“MOIC”) and the internal rate of return (“IRR”). These performance goals are treated as market conditions. |
Effective July 13, 2020, the Company modified terms of the options granted under the Stock Option Plan to amend the vesting criteria of the performance-based vesting options for all options outstanding. As a result of the modification, 25% of performance-based vesting options will vest in equal percentages on the first and second anniversaries of an IPO. The remaining 75% of the performance-based vesting options will vest upon the Company’s sponsors receiving proceeds for the sale of the Company’s shares, subject to the optionee’s continued service, and the achievement of certain performance goals as measured by the MOIC and the IRR. These performance goals are treated as market conditions. Alternatively, the performance-based vesting options will vest upon a sale of 50% or greater of the Company’s shares, subject to the optionee’s continued service. Vesting of these options is contingent upon the achievement of certain performance goals by the Company’s sponsors as measured by the MOIC and the IRR. That modification to the Stock Option Plan did not result in any incremental compensation cost for the year ended April 30, 2021 as the achievement of the performance conditions is not currently probable of occurrence. However, the modification did result in a remeasurement of the performance-based vesting options based on the fair value of the awards at the date of modification to $253 per option with the assumptions summarized in the following table:
| Options modified on July 13, 2020 |
||||
| Weighted-average share price (in U.S. dollars)(1) |
$ | 1,100 | ||
| Weighted-average exercise price (in U.S. dollars) |
$ | 1,011 | ||
| Risk-free interest rate (%)(2) |
0.15 | % | ||
| Expected life of stock options (years)(3) |
4.75 | |||
| Expected price volatility of the Company’s shares (%)(4) |
42 | % | ||
| Expected dividends (%)(5) |
0.0 | % | ||
| (1) | See Note 2, Summary of Significant Accounting Policies, for a description of the methodology used to estimate the fair value of the common share underlying the share-based grants. |
| (2) | The risk-free interest rate is based on the U.S. Treasury strip rate for the expected term of the options. |
| (3) | The expected life reflects management’s best estimate of the exercise date. |
| (4) | Expected volatility was estimated based on historical volatility of comparable publicly traded companies in similar industries over a period equivalent to the expected term of the awards. |
| (5) | Expected dividend yield is 0.0% as the Company has not paid any dividend or distribution to shareholders out of earnings and does not anticipate paying dividends on its common shares for the foreseeable future. |
Effective February 7, 2021 and in connection with the returns of capital described in Note 14, Shareholders’ Equity, the Company made adjustments in accordance with the equitable adjustment provision of the Stock Option Plan composed of a reduction in the exercise price of a weighted-average of $194 per option for all previously granted options and payments in cash in respect of such options. Given that the provision of the Stock Option Plan allowed the Company to make such adjustments, but did not require it to do so, the adjustment was accounted for as a modification of the Stock Option Plan that resulted in an incremental aggregate compensation cost of $4.5 ($113 per option) for the time-based vesting options, of which $1.1 was expensed for the year ended
| F-49 |
Table of Contents
April 30, 2021. The modification also resulted in a remeasurement of the performance-based vesting options based on the fair value of the awards at the date of modification to $344 per option (which includes the payments in cash), resulting in an increase of $7.2 of the unrecognized share-based compensation expense related to performance-based vesting options. However, no expense was recognized as the performance conditions were not probable of being achieved. In addition, upon the cash settlement of vested and unvested options, an aggregate compensation cost of $4.4 was expensed for the year ended April 30, 2021 as a result of the deemed acceleration of vesting of time-based and performance-based vesting options. The assumptions are summarized in the following table:
| Options modified on February 7, 2021 |
||||
| Weighted-average share price (in U.S. dollars)(1) |
$ | 1,210 | ||
| Weighted-average exercise price (in U.S. dollars) |
$ | 960 | ||
| Risk-free interest rate (%)(2) |
0.76 | % | ||
| Expected life of stock options (years)(3) |
4.86 | |||
| Expected price volatility of the Company’s shares (%)(4) |
41 | % | ||
| Expected dividends (%)(5) |
0.0 | % | ||
| (1) | See Note 2, Summary of Significant Accounting Policies, for a description of the methodology used to estimate the fair value of the common share underlying the share-based grants. |
| (2) | The risk-free interest rate is based on the U.S. Treasury strip rate for the expected term of the options. |
| (3) | The expected life reflects management’s best estimate of the exercise date. |
| (4) | Expected volatility was estimated based on historical volatility of comparable publicly traded companies in similar industries over a period equivalent to the expected term of the awards. |
| (5) | Expected dividend yield is 0.0% as the Company has not paid any dividend or distribution to shareholders out of earnings and does not anticipate paying dividends on its common shares for the foreseeable future. |
The following table presents information concerning the outstanding options granted by the Company:
| Number (Units) |
Weighted- Average Exercise Price (In U.S. Dollars)(1) |
Aggregated Intrinsic Value |
Weighted- Average Estimated Useful Life (In Years) |
|||||||||||||
| Outstanding – As of the inception of the Stock Option Plan |
— | — | — | — | ||||||||||||
| Granted |
71,876 | $ | 1,009 | |||||||||||||
| Forfeited |
(11,956 | ) | $ | 1,000 | ||||||||||||
|
|
|
|||||||||||||||
| Outstanding – As of April 30, 2020 |
59,920 | $ | 1,011 | $ | 5.2 | 9 | ||||||||||
|
|
|
|||||||||||||||
| Granted |
74,197 | $ | 1,284 | |||||||||||||
| Exercised |
(711 | ) | $ | 1,000 | ||||||||||||
| Forfeited |
(7,837 | ) | $ | 1,007 | ||||||||||||
|
|
|
|||||||||||||||
| Outstanding – As of April 30, 2021 |
125,569 | $ | 992 | $ | 32.2 | 9 | ||||||||||
|
|
|
|||||||||||||||
| Vested and exercisable – As of April 30, 2021 |
9,135 | $ | 855 | $ | 3.2 | 8 | ||||||||||
|
|
|
|||||||||||||||
| (1) | Following the adjustments made to the Stock Option Plan on February 7, 2021, there was a reduction in the exercise price of all previously granted options. The weighted-average exercise prices in the table above reflect the exercise price as of the grant date, except for the exercise price as of April 30, 2021, which reflects the reduction in the exercise price. |
| F-50 |
Table of Contents
Cash received from the exercise of options during the year ended April 30, 2021 amounted to $0.6. No income tax benefit resulted from the exercise of options.
Time-based vesting options
The weighted-average estimated fair value of time-based vesting options granted during the years ended April 30, 2021 and 2020 was $381 per option and $291 per option. The fair value of time-based vesting options is estimated using the Monte Carlo and Black-Scholes option pricing models with assumptions summarized in the following table:
| 2021 Grants | 2020 Grants | |||||||
| Weighted-average share price (in U.S. dollars)(1) |
$ | 1,176 | $ | 1,009 | ||||
| Weighted-average exercise price (in U.S. dollars)(2) |
$ | 1,284 | $ | 1,009 | ||||
| Risk-free interest rate (%)(3) |
0.24 | % | 1.68 | % | ||||
| Expected life of stock options (years)(4) |
6.50 | 3.67 | ||||||
| Expected price volatility of the Company’s shares (%)(5) |
42 | % | 37 | % | ||||
| Expected dividends (%)(6) |
0.0 | % | 0.0 | % | ||||
| (1) | See Note 2, Summary of Significant Accounting Policies, for a description of the methodology used to estimate the fair value of the common share underlying the share-based grants. |
| (2) | Following the adjustments made to the Stock Option Plan on February 7, 2021, there was a reduction in the exercise price of all previously granted options. The weighted-average exercise prices in the table above reflect the exercise price as of the grant date. |
| (3) | The risk-free interest rate is based on the U.S. Treasury strip rate for the expected term of the options. |
| (4) | The expected life reflects management’s best estimate of the exercise date, as the Company does not have a history of stock option exercises. |
| (5) | Expected volatility was estimated based on historical volatility of comparable publicly traded companies in similar industries over a period equivalent to the expected life of the awards. |
| (6) | Expected dividend yield is 0.0% as the Company has not paid any dividend or distribution to shareholders out of earnings and does not anticipate paying dividends on its common shares for the foreseeable future. |
The Company recorded a share-based compensation expense of $5.1 related to time-based vesting options for the year ended April 30, 2021 in selling, general and administrative expenses ($1.7 for the year ended April 30, 2020 and $0.0 for the period from November 30, 2018 through April 30, 2019). The share-based compensation expense recorded for the year ended April 30, 2021 includes the expense related to the adjustments made to the Stock Option Plan on February 7, 2021 and discussed above. An income tax benefit of $0.3 is recognized in the consolidated statements of operations in relation with the share-based compensation for the year ended April 30, 2021.
As of April 30, 2021, $12.8 of unrecognized share-based compensation cost related to time-based vesting options granted and not forfeited is expected to be recognized as expense over a weighted-average period of approximately 3.76 years.
| F-51 |
Table of Contents
Performance-based vesting options
The weighted-average estimated fair value of performance-based vesting options granted during the years ended April 30, 2021 and 2020 was $241 per option and $151 per option. The fair value of performance-based vesting options is estimated using the Monte Carlo option pricing model with assumptions summarized in the following table:
| 2021 Grants | 2020 Grants | |||||||
| Weighted-average share price (in U.S. dollars)(1) |
$ | 1,176 | $ | 1,009 | ||||
| Weighted-average exercise price (in U.S. dollars)(2) |
$ | 1,284 | $ | 1,009 | ||||
| Risk-free interest rate (%)(3) |
0.24 | % | 1.68 | % | ||||
| Expected life of stock options (years)(4) |
5.55 | 3.67 | ||||||
| Expected price volatility of the Company’s shares (%)(5) |
42 | % | 37 | % | ||||
| Expected dividends (%)(6) |
0.0 | % | 0.0 | % | ||||
| (1) | See Note 2, Summary of Significant Accounting Policies, for a description of the methodology used to estimate the fair value of the common share underlying the share-based grants. |
| (2) | Following the adjustments made to the Stock Option Plan on February 7, 2021, there was a reduction in the exercise price of all previously granted options. The weighted-average exercise prices in the table above reflect the exercise price as of the grant date. |
| (3) | The risk-free interest rate is based on the U.S. Treasury strip rate for the expected term of the options. |
| (4) | The expected life reflects management’s best estimate of the exercise date. |
| (5) | Expected volatility was estimated based on historical volatility of comparable publicly traded companies in similar industries over a period equivalent to the expected life of the awards. |
| (6) | Expected dividend yield is 0.0% as the Company has not paid any dividend or distribution to shareholders out of earnings and does not anticipate paying dividends on its common shares for the foreseeable future. |
Since the performance targets are not considered probable of being achieved, the Company did not record any expense related to performance-based vesting options for the year ended April 30, 2021 (other than the expense of $3.4 related to the adjustments made to the Stock Option Plan on February 7, 2021 and discussed above) nor for the year ended April 30, 2020 and for the period from November 30, 2018 through April 30, 2019.
As of April 30, 2021, $24.7 of unrecognized share-based compensation cost related to performance-based vesting options is expected to be recognized as expense either upon the sale of 50% or greater of the Company’s shares or, following an IPO, when 25% of the performance-based vesting options are converted into time-based vesting options, as well as on subsequent dates on which the Company’s sponsors receive proceeds.
Subsequent to the year ended April 30, 2021, on May 3, 2021, the Compensation Committee of the Board of Directors approved an amendment to the terms of the options granted under the Stock Option Plan whereby, upon completion of an IPO, all performance-based vesting options under the plan will convert into time-based vesting options and vest over the existing vesting schedule applicable to current time-based vesting options, being straight-line over five years after the grant date. The modification will result in a remeasurement of the performance-based vesting options at the date of modification date of July 15, 2021, which is the date the amendment was communicated to the Stock Option Plan participants.
Subsequent to the year ended April 30, 2021, on May 3, 2021, the Compensation Committee of the Board of Directors approved a grant of long-term equity incentive awards to directors, executive officers and employees. The awards will be in the form of stock options and restricted share units under the new equity compensation plan adopted by the Board of Directors in connection with its IPO, which awards will be issued at the closing of the IPO, based on the issue price of the Company’s common shares in the IPO. The awards will vest on a pro-rata basis, over a three-year service period after the IPO. Total estimated share-based compensation cost associated with these awards is $16.6 and will be recognized over the service period.
| F-52 |
Table of Contents
Share-based Compensation (Predecessor)
On April 28, 2017, the members of the Board of Directors of Knowlton Development Corporation Inc. approved the adoption of a stock option plan (the “Predecessor Stock Option Plan”), granting to certain directors, officers, and employees options to acquire shares of Knowlton Development Corporation Inc. that were subject to both time-based vesting or performance-based vesting. On the closing date of the Acquisition described in Note 4, Business Combinations, all options became vested immediately as a result of the sale of Knowlton Development Corporation Inc. and were fully exercised. The share-based compensation payable of $16.5 assumed by the Company as part of the Acquisition (and as determined in the purchase price allocation) was related to the Predecessor Stock Option Plan and was repaid immediately after the closing date of the Acquisition.
The Company recorded a share-based compensation expense of $16.5 related to the Predecessor Stock Option Plan for the period from May 1, 2018 through December 20, 2018, which is included in selling, general and administrative expenses.
| 16 | Acquisition-related Costs and Other Expenses |
The Company’s acquisition-related costs and other expenses are as follows:
| Successor | Predecessor | |||||||||||||||
| For the Year ended April 30, 2021 |
For the Year ended April 30, 2020 |
For the Period from November 30, 2018 through April 30, 2019 |
For the Period from May 1, 2018 through December 20, 2018 |
|||||||||||||
| Acquisition-related costs (Note 4) |
$ | — | $ | 48.7 | $ | 9.4 | $ | 25.9 | ||||||||
| External consultants costs |
4.7 | 3.3 | — | — | ||||||||||||
| Restructuring expenses |
8.5 | 0.1 | — | — | ||||||||||||
| IPO preparation-related costs |
10.8 | 0.1 | — | — | ||||||||||||
| Impairment loss on right-of-use assets (Note 9) |
6.1 | — | — | — | ||||||||||||
| Write-off of indemnification assets |
2.3 | 5.4 | — | — | ||||||||||||
| Other expenses |
7.7 | 2.1 | — | — | ||||||||||||
|
|
|
|
|
|
|
|
|
|||||||||
| Total |
$ | 40.1 | $ | 59.7 | $ | 9.4 | $ | 25.9 | ||||||||
|
|
|
|
|
|
|
|
|
|||||||||
The restructuring expenses are mainly arising from the restructuring activities in Europe and California and are mostly related to severances. As of April 30, 2021, accrued expenses and other payables included an amount of $2.9 related to restructuring expenses. The Company does not expect to incur additional material costs related to the restructuring activities in Europe and California.
Write-off expenses relate to indemnification assets that were initially recorded within the purchase price allocation of certain business acquisitions.
| F-53 |
Table of Contents
| 17 | Income Taxes |
Income Tax Expense (Benefit)
Income tax expense (benefit) consisted of the following:
| Successor | Predecessor | |||||||||||||||
| For the Year ended April 30, 2021 |
For the Year ended April 30, 2020 |
For the Period from November 30, 2018 through April 30, 2019 |
For the Period from May 1, 2018 through December 20, 2018 |
|||||||||||||
| Canada current income tax |
$ | — | $ | 0.3 | $ | — | $ | — | ||||||||
| Foreign current income tax |
12.5 | (1.0 | ) | (0.3 | ) | 2.6 | ||||||||||
|
|
|
|
|
|
|
|
|
|||||||||
| Total current income tax |
$ | 12.5 | $ | (0.7 | ) | $ | (0.3 | ) | $ | 2.6 | ||||||
| Canada deferred income tax |
(9.8 | ) | (5.6 | ) | 0.3 | 0.4 | ||||||||||
| Foreign deferred income tax |
(15.8 | ) | (7.8 | ) | (0.5 | ) | (3.9 | ) | ||||||||
|
|
|
|
|
|
|
|
|
|||||||||
| Total deferred income tax |
$ | (25.6 | ) | $ | (13.4 | ) | $ | (0.2 | ) | $ | (3.5 | ) | ||||
|
|
|
|
|
|
|
|
|
|||||||||
| Income tax benefit |
$ | (13.1 | ) | $ | (14.1 | ) | $ | (0.5 | ) | $ | (0.9 | ) | ||||
|
|
|
|
|
|
|
|
|
|||||||||
U.S. income tax (federal, state and local) is included within foreign income tax in the table above.
The tax on the Company’s loss before income taxes differs from the theoretical amount that would arise, using the statutory tax rate applicable to profits of the consolidated entities as follows:
| Successor | ||||||||||||||||||||||||
| For the Year ended April 30, 2021 |
Percentage of Pretax Income |
For the Year ended April 30, 2020 |
Percentage of Pretax Income |
For the Period from November 30, 2018 through April 30, 2019 |
Percentage of Pretax Income |
|||||||||||||||||||
| Loss before income taxes |
$ | (138.9 | )(1) | $ | (96.0 | )(2) | $ | (9.8 | )(3) | |||||||||||||||
| Income taxes calculated at the statutory rate |
(36.8 | ) | 26.50 | % | (25.4 | ) | 26.46 | % | (2.6 | ) | 26.60 | % | ||||||||||||
| Tax effects of: |
||||||||||||||||||||||||
| Expenses not deductible for tax purposes |
11.6 | (8.35 | )% | 9.6 | (10.00 | )% | 3.0 | (30.61 | )% | |||||||||||||||
| Effect of differences in tax rates in other jurisdictions |
12.7 | (9.14 | )% | 1.9 | (1.98 | )% | 0.2 | (2.04 | )% | |||||||||||||||
| Effect of change in enacted tax rates |
(1.1 | ) | 0.79 | % | 1.2 | (1.25 | )% | — | — | % | ||||||||||||||
| F-54 |
Table of Contents
| Successor | ||||||||||||||||||||||||
| For the Year ended April 30, 2021 |
Percentage of Pretax Income |
For the Year ended April 30, 2020 |
Percentage of Pretax Income |
For the Period from November 30, 2018 through April 30, 2019 |
Percentage of Pretax Income |
|||||||||||||||||||
| Adjustments in respect of prior years |
$ | — | — | % | $ | (1.7 | ) | 1.77 | % | $ | (0.4 | ) | 4.08 | % | ||||||||||
| Unrecognized tax benefits |
(3.5 | ) | 2.52 | % | — | — | % | — | — | % | ||||||||||||||
| Effect of unrecognized deferred income tax asset |
4.4 | (3.17 | )% | 1.2 | (1.25 | )% | — | — | % | |||||||||||||||
| Federal R&D income tax credit |
(0.4 | ) | 0.29 | % | (0.8 | ) | 0.83 | % | (0.6 | ) | 6.12 | % | ||||||||||||
| Other elements |
— | — | % | (0.1 | ) | 0.10 | % | (0.1 | ) | 1.02 | % | |||||||||||||
|
|
|
|
|
|
|
|
|
|
|
|
|
|||||||||||||
| Income tax benefit |
$ | (13.1 | ) | 9.44 | % | $ | (14.1 | ) | 14.68 | % | $ | (0.5 | ) | 5.17 | % | |||||||||
|
|
|
|
|
|
|
|
|
|
|
|
|
|||||||||||||
| (1) | The loss before income taxes totals $48.1 for Canadian entities and $90.8 for foreign entities, of which $47.8 relates to U.S. entities. |
| (2) | The loss before income taxes totals $36.3 for Canadian entities and $59.7 for foreign entities, of which $44.3 relates to U.S. entities. |
| (3) | The profit (loss) before income taxes totals $6.3 for Canadian entities and $(16.1) for foreign entities, of which $(4.0) relates to U.S. entities. |
| Predecessor | ||||||||
| For the Period from May 1, 2018 through December 20, 2018 |
Percentage of Pretax Income | |||||||
| Loss before income taxes |
$ | (23.6 | )(1) | |||||
| Income taxes calculated at the statutory rate |
(6.3 | ) | 26.70 | % | ||||
| Tax effects of: |
||||||||
| Expenses not deductible for tax purposes |
5.9 | (25.00 | )% | |||||
| Effect of differences in tax rates in other jurisdictions |
0.2 | (0.85 | )% | |||||
| Effect of change in enacted tax rates |
(1.6 | ) | 6.78 | % | ||||
| Adjustments in respect of prior years |
0.3 | (1.27 | )% | |||||
| Effect of unrecognized deferred income tax asset |
1.0 | (4.24 | )% | |||||
| Federal R&D income tax credit |
(0.3 | ) | 1.27 | % | ||||
| Other elements |
(0.1 | ) | 0.42 | % | ||||
|
|
|
|
|
|||||
| Income tax benefit |
$ | (0.9 | ) | 3.81 | % | |||
|
|
|
|
|
|||||
| (1) | The loss before income taxes totals $16.9 for Canadian entities and $6.7 for U.S. entities. |
The Company’s applicable tax rate is the Canadian combined rates applicable in the jurisdiction in which the Company operates.
The enactment of the Tax Cuts and Jobs Act (“U.S. Tax Reform”) in 2017 brought about significant tax law changes, which included a reduction to the U.S. federal corporate income tax rate from 35% to 21% and allowed the immediate capital expensing of new investments in certain qualified depreciable assets which will be phased down starting in year 2023. The U.S. Tax Reform also introduced the creation of a Base Erosion Anti-abuse Tax (“BEAT”) that subjects certain payments from U.S. corporations to foreign related parties to additional taxes, and limitations to the deduction for net interest expense incurred by U.S. corporations. Since the enactment of the
| F-55 |
Table of Contents
U.S. Tax Reform, U.S. authorities have issued various proposed and finalized regulations and guidance interpreting its provisions. These interpretations have been taken into account in calculating the Company’s current year income tax provision and tax payments. The U.S. Tax Reform and these regulations are also expected to impact the Company’s income tax provisions and tax payments in future years.
The Internal Revenue Service (“IRS”) passed the Coronavirus Aid, Relief and Economic Security Act (“CARES Act”) on March 27, 2020. This bill provides various tax relief-related legislation to taxpayers in the United States. The Company anticipates that it will benefit from certain provisions of this legislation in future years, including the ability to take 100% depreciation for Qualified Improvement Property in the year placed in service, as well as the increase in the 163j interest expense limitation from 30% to 50% of adjusted income. Management has accounted for any impact of the CARES Act in these consolidated financial statements and will do the same in future consolidated financial statements to the extent there is an impact on income tax expense. For the year ended April 30, 2021, such benefit amounted to $24.4, which resulted in a deferred tax benefit of $6.0 ($13.2 and $2.7, respectively, for the year ended April 30, 2020).
On June 5, 2021, the G7 Finance Ministers announced an agreement in which the participating countries committed to new taxing rights as well as a global minimum tax rate of at least 15%. The Company notes that only preliminary details are available at this time and that implementation of the global minimum tax is unlikely within the next year. The Company does not expect a material impact as a result of the agreement, but will continue to assess as more details become available.
Amounts of Deferred Income Tax Assets and Liabilities
Significant components of deferred income tax assets and liabilities are as follows:
| April 30, 2021 | April 30, 2020 | |||||||
| Deferred Income Tax Assets |
||||||||
| Property, plant and equipment |
$ | 0.1 | $ | 9.6 | ||||
| Non-deductible reserves |
26.3 | 11.2 | ||||||
| Losses carried forward |
34.5 | 9.8 | ||||||
| Interest expense carried forward |
16.7 | — | ||||||
| R&D credits carried forward |
7.0 | — | ||||||
| Other |
10.6 | 7.0 | ||||||
|
|
|
|
|
|||||
| Total |
$ | 95.2 | $ | 37.6 | ||||
| Valuation allowance |
(19.7 | ) | (1.4 | ) | ||||
|
|
|
|
|
|||||
| Total Deferred Income Tax Assets |
$ | 75.5 | $ | 36.2 | ||||
|
|
|
|
|
|||||
| Deferred Income Tax Liabilities |
||||||||
| Property, plant and equipment |
$ | (64.9 | ) | $ | (61.3 | ) | ||
| Goodwill and other intangible assets |
(277.3 | ) | (274.5 | ) | ||||
| Other |
(1.7 | ) | (3.0 | ) | ||||
|
|
|
|
|
|||||
| Total Deferred Income Tax Liabilities |
$ | (343.9 | ) | $ | (338.8 | ) | ||
|
|
|
|
|
|||||
| Total Net Deferred Income Tax Liabilities |
$ | (268.4 | ) | $ | (302.6 | ) | ||
|
|
|
|
|
|||||
| Canada |
(23.3 | ) | (32.8 | ) | ||||
| Foreign |
(245.1 | ) | (269.8 | ) | ||||
|
|
|
|
|
|||||
| Total Net Deferred Income Tax Liabilities |
$ | (268.4 | ) | $ | (302.6 | ) | ||
|
|
|
|
|
|||||
| F-56 |
Table of Contents
The net deferred tax liability decreased by $34.2 during the year ended April 30, 2021 (increased by $140.8 during the year ended April 30, 2020). Included in that decrease is an increase of deferred income tax benefit of $25.6 (increase of $13.4 for year ended April 30, 2020) and a decrease of deferred tax benefit recorded through other comprehensive income (loss) of $0.1 (increase of $0.1 for year ended April 30, 2020). The remaining decrease of $8.5 (increase of $154.1 for year ended April 30, 2020) relates mainly to a decrease of deferred tax liabilities recorded as part of purchase accounting related to business combinations during the year of $11.1 ($154.4 for year ended April 30, 2020).
Unremitted Earnings
As of April 30, 2021, no deferred income tax liability was recognized for temporary differences arising from investments in subsidiaries because the Company controls the decisions affecting the realization of such liabilities and it is probable that the temporary differences will not reverse in the foreseeable future.
The Company continues to maintain its assertion to indefinitely reinvest undistributed foreign earnings and profits. Upon distribution of those foreign earnings and profits in the form of dividends or otherwise, the Company would be subject to income taxes and withholding taxes payable in various jurisdictions, which may be partially offset by foreign tax credits. Determination of the amount of the unrecognized deferred tax liability is not practicable because of the complexities associated with its hypothetical calculation.
Net Operating Losses, Tax Credit Carryforwards, Interest Expense Carryforwards and Valuation Allowance
The Company has net operating losses available in Canada of $45.6 as of April 30, 2021 which expire between 2027 and 2041. There are foreign net operating losses available of $90.1 as of April 30, 2021 which can be carried forward indefinitely, with the exception of certain losses from India of $1.0, which expire between 2022 and 2029 and certain losses from Netherlands of $0.3, which expire between 2022 and 2027.
The Company has investment tax credits available in Canada of $0.5 as of April 30, 2021, which expire between 2027 and 2040 and can be applied against Canadian provincial income taxes payable. The Company also has foreign investment tax credits available of $8.2 as of April 30, 2021, which $1.2 are related to U.S. entities. The remaining $7.0 is related to Spain, which expire between 2022 and 2037.
The Company has interest expense carryforwards available in Italy of $58.2, which can be carryforward indefinitely.
In assessing the realizability of deferred tax assets, the Company considers whether it is more likely than not that certain deferred tax assets will be realized. The ultimate realization of deferred tax assets is dependent upon the generation of future taxable income in those specific jurisdictions prior to the dates on which such net operating losses and other tax attributes expire. The Company is in a deferred tax liability position in Canada and the United States and considers its deferred tax assets to be realizable in these jurisdictions, with the exception of the tax benefit related to capital losses in Canada of $1.5 and the tax benefit of $1.6 related to state net operating losses in the United States that are not recognized. The Company maintained a full valuation allowance against its net deferred tax assets related to net operating losses in European jurisdictions as of April 30, 2021 of $8.4, because the Company has determined that is it more likely than not that these assets will not be fully realized based on a current evaluation of expected future taxable income and the Company is in a cumulative loss position in this jurisdiction. The Company also maintained a valuation allowance against its deferred tax assets related to R&D and foreign tax credits of $8.2 in European jurisdictions as of April 30, 2021. For the year ended April 30, 2021, the valuation allowance balance was $19.7 ($1.4 for the year ended April 30, 2020).
| F-57 |
Table of Contents
Unrecognized Tax Benefits
Unrecognized tax benefits activity for the years ended April 30, 2021 and 2020, the period from November 30, 2018 through April 30, 2019 and the period from May 1, 2018 through December 20, 2018 is as follows:
| Successor | Predecessor | |||||||||||||||
| For the Year ended April 30, 2021 |
For the Year ended April 30, 2020 |
For the Period from November 30, 2018 through April 30, 2019 |
For the Period from May 1, 2018 through December 20, 2018 |
|||||||||||||
| Opening balance |
$ | 11.0 | $ | 6.4 | $ | 6.4 | $ | 6.1 | ||||||||
| Increases as a result of business combinations |
— | 4.9 | — | — | ||||||||||||
| Increases as a result of tax positions taken during the current period |
0.6 | 1.8 | — | — | ||||||||||||
| Increases as a result of tax positions taken during prior periods |
— | — | — | 0.3 | ||||||||||||
| Decreases as a result of lapsed statutes of limitations |
(2.5 | ) | (2.1 | ) | — | — | ||||||||||
| Decreases as a result of settlements |
(1.6 | ) | — | — | — | |||||||||||
|
|
|
|
|
|
|
|
|
|||||||||
| Ending balance |
$ | 7.5 | $ | 11.0 | $ | 6.4 | $ | 6.4 | ||||||||
|
|
|
|
|
|
|
|
|
|||||||||
If all of the unrecognized tax benefits as of April 30, 2021 above were recognized it would result in a cash outflow of approximately $3.5. Although it is possible that the amount of unrecognized tax benefits with respect to uncertain tax positions will increase or decrease in the next twelve months, the Company does not expect material changes.
The Company does not recognize accrued interest and penalties related to gross unrecognized tax benefits in income tax benefit in its consolidated statements of operations. As of April 30, 2021, the Company recognized accrued interest and penalties of $1.3 in accrued expenses and other payables ($2.4 as of April 30, 2020).
In Canada, the Company’s federal and provincial income tax returns filed for the years 2017 to 2020 remain subject to examination by the taxation authorities. Tax examinations for 2017 to 2018 are currently in progress at the provincial level. In the United States, the federal income tax returns and the state income tax returns filed for the years 2017 to 2020 remain subject to examination by the taxation authorities. There are currently no examinations in progress. In other foreign jurisdictions such as the United Kingdom, Italy, Mexico and China, income tax returns for years 2015 to 2020 remain subject to examination by taxation authorities. There are currently no examinations in progress.
Tax Contingencies
The Company is subject to regular audits by federal, state, provincial and foreign tax authorities. These audits may result in additional tax liabilities. The Company believes it has appropriately provided for income taxes for all years. Several factors drive the calculation of its tax reserves. Some of these factors include: (i) the expiration of various statutes of limitations; (ii) changes in tax laws and regulations; (iii) issuance of tax rulings; and (iv) settlements with tax authorities. Changes in any of these factors may result in adjustments to the Company’s reserves, which would impact its reported financial results.
| F-58 |
Table of Contents
| 18 | Fair Value |
The following sections describe the valuation methodologies the Company uses to measure financial and non-financial instruments accounted for at fair value in accordance with the fair value hierarchy as set forth in ASC 820, Fair Value Measurement and Disclosures. Assets and liabilities are required to be categorized into three levels of fair value based upon the inputs used to value the assets or liabilities. Observable inputs reflect market data obtained from independent sources, while unobservable inputs reflect the Company’s market assumptions. Preference is given to observable inputs. These two types of inputs create the following fair value hierarchy:
| • | Level 1 - Quoted prices in active markets for identical assets or liabilities; |
| • | Level 2 - Inputs, other than the quoted prices in active markets, that are observable either directly or indirectly; and |
| • | Level 3 - Significant inputs to the valuation model that are unobservable. |
The following table presents the Company’s hierarchy for its financial assets and liabilities measured at fair value on a recurring basis as of April 30, 2021 and 2020:
| April 30, 2021 | ||||||||||||||||
| Level 1 | Level 2 | Level 3 | Total | |||||||||||||
| Assets: |
||||||||||||||||
| Foreign exchange forward contracts |
$ | — | $ | 0.3 | $ | — | $ | 0.3 | ||||||||
|
|
|
|
|
|
|
|
|
|||||||||
| Total |
$ | — | $ | 0.3 | $ | — | $ | 0.3 | ||||||||
|
|
|
|
|
|
|
|
|
|||||||||
| Liabilities: |
||||||||||||||||
| Contingent consideration |
$ | — | $ | — | $ | 2.1 | $ | 2.1 | ||||||||
|
|
|
|
|
|
|
|
|
|||||||||
| Total |
$ | — | $ | — | $ | 2.1 | $ | 2.1 | ||||||||
|
|
|
|
|
|
|
|
|
|||||||||
| April 30, 2020 | ||||||||||||||||
| Level 1 | Level 2 | Level 3 | Total | |||||||||||||
| Assets: |
||||||||||||||||
| Foreign exchange forward contracts |
$ | — | $ | 0.5 | $ | — | $ | 0.5 | ||||||||
|
|
|
|
|
|
|
|
|
|||||||||
| Total |
$ | — | $ | 0.5 | $ | — | $ | 0.5 | ||||||||
|
|
|
|
|
|
|
|
|
|||||||||
| Liabilities: |
||||||||||||||||
| Contingent consideration |
$ | — | $ | — | $ | 4.4 | $ | 4.4 | ||||||||
|
|
|
|
|
|
|
|
|
|||||||||
| Total |
$ | — | $ | — | $ | 4.4 | $ | 4.4 | ||||||||
|
|
|
|
|
|
|
|
|
|||||||||
The estimated fair values of the Company’s financial instruments are as follows:
| April 30, 2021 | April 30, 2020 | |||||||||||||||
| Carrying Amount | Fair Value | Carrying Amount | Fair Value | |||||||||||||
| Assets: |
||||||||||||||||
| Foreign exchange forward contracts |
$ | 0.3 | $ | 0.3 | $ | 0.5 | $ | 0.5 | ||||||||
| Liabilities: |
||||||||||||||||
| Terms Loans |
$ | 1,531.0 | $ | 1,583.7 | $ | 1,371.5 | $ | 1,421.1 | ||||||||
| Revolving Facility |
$ | 177.0 | $ | 177.0 | $ | 119.0 | $ | 119.0 | ||||||||
| Other borrowings |
$ | 4.5 | $ | 4.5 | $ | 4.3 | $ | 4.3 | ||||||||
| Contingent consideration |
$ | 2.1 | $ | 2.1 | $ | 4.4 | $ | 4.4 | ||||||||
| F-59 |
Table of Contents
The carrying value approximated the fair value for all of the above assets and liabilities with the exception of Term Loans for which the carrying value and the fair value were different due to the deferred transaction costs and unamortized issuance discount.
The carrying amount of cash and cash equivalents, trade and other receivables, related party receivables, accounts payable, related party payables, and accrued expenses and other payables approximates fair value because of the short-term nature of these instruments.
The fair value of the Company’s debt approximated its nominal amount due to the variable nature of the interest of the debt and the absence of significant change in the Company’s credit spread, as evidenced by recent amendments. The Company’s debt is classified within Level 2 of the valuation hierarchy.
The fair value of the Company’s foreign exchange forward contracts was determined using an industry standard valuation model, which is based on an income approach. The significant observable inputs to the model, such as swap yield curves and currency spot and forward rates, were obtained from an independent pricing service. To determine the fair value of contracts under the model, the difference between the contract price and the current forward rate was discounted using LIBOR for contracts with maturities up to 12 months and was adjusted for credit risk of the Company and counterparty as appropriate. The foreign exchange forward contracts are included within prepaid expenses and other current assets on the Company’s consolidated balance sheets.
Contingent consideration consist of potential obligations related to the Company’s acquisitions. The amounts to be paid under these obligations are contingent upon the achievement of stipulated predetermined financial targets by the business subsequent to acquisition. As of April 30, 2021, the fair value of contingent consideration related to certain acquisition earn-outs was based on using a probability weighted, discounted cash settlement valuation technique. Significant changes in the probabilities of meeting contractual performance metrics would result in a significantly higher or lower fair value measurement. As these are unobservable inputs, the Company’s contingent consideration is classified within Level 3 of the valuation hierarchy. As of April 30, 2021, the potential contingent consideration could vary between $0.0 and $16.4 (for the acquisition of Benchmark and Alkos).
The short-term portion of contingent consideration is included within accrued expenses and other payables and the long-term portion is included within other liabilities in the Company’s consolidated balance sheets.
There were no changes in valuation techniques for these assets and liabilities and there have been no transfers between the levels for the years ended April 30, 2021 and 2020.
The following table presents a reconciliation of the beginning and ending balance of the Level 3 financial instruments:
| Contingent consideration | ||||
| Balance — As of May 1, 2019 |
$ | — | ||
| Increase arising from business combinations (Note 4) |
4.3 | |||
| Changes in fair value included in other expense (income), net |
0.1 | |||
|
|
|
|||
| Balance — As of April 30, 2020 |
$ | 4.4 | ||
| Changes in fair value included in other expense (income), net |
0.2 | |||
| Payments |
(2.5 | ) | ||
|
|
|
|||
| Balance — As of April 30, 2021 |
$ | 2.1 | ||
|
|
|
|||
| F-60 |
Table of Contents
Fair Value Measurement on Nonrecurring Basis
Certain assets are measured at fair value on a nonrecurring basis and are subject to fair value adjustments only under certain circumstances. These include: (i) property, plant and equipment and intangibles with finite useful life and (ii) goodwill and intangible assets with indefinite useful life, all of which are written down to fair value when they are held for sale or determined to be impaired. The resulting fair value measurements of the assets are considered to be Level 3 measurements. Determining fair value requires the exercise of significant judgments, including judgments about appropriate discount rates, long-term growth rates, relevant comparable company earnings multiples, and the amount and timing of expected future cash flows. The cash flows employed in the analyses are based on the Company’s estimated outlook and various growth rates. Discount rate assumptions are based on an assessment of the risk inherent in the future cash flows of the respective asset group or reporting unit. In assessing the reasonableness of its determined fair values, the Company evaluates its results against other value indicators, such as comparable transactions.
The Company tests goodwill and intangible assets with indefinite useful life for impairment annually in the fourth quarter or more frequently if events or changes in circumstances indicate that the carrying value may be impaired. The Company recognized non-cash impairment charges of $48.2 in the second quarter of fiscal year 2021 to reduce the carrying value of HCT reporting unit’s goodwill and HCT trade name to their fair value (see Note 10, Other Intangibles, Net and Note 11, Goodwill).
The Company tests long-lived assets for impairment whenever events or changes in circumstances indicate that the carrying amount of an asset or asset group may not be recoverable. The Company recognized non-cash impairment charges of $6.1 in the third quarter of fiscal year 2021 to reduce the carrying value of a right-of-use asset to its fair value (see Note 9, Leases).
During the year ended April 30, 2020, the period from November 30, 2018 through April 30, 2019 and the period from May 1, 2018 through December 20, 2018, there were no impairment charges recorded.
| 19 | Financial Instruments |
Cash Flow Hedges
In order to reduce exposure to cash flows associated with changes in the CAD/USD exchange rates, the Company enters into foreign currency forward contracts. The Company designated these contracts as cash flow hedges of forecasted expenses in Canadian dollars and applied hedge accounting from the designation date. These foreign currency CAD/USD forward contracts have varying maturities through the end of April 2022. The Company had cash flow hedges outstanding with a notional amount totaling $15.9 and $34.1 as of April 30, 2021 and 2020, respectively. The Company does not hold or issue financial instruments for speculative or trading purposes.
The fair value of the Company’s derivative financial instruments designated as cash flow hedges included in the consolidated balance sheets are presented as follows:
| Balance Sheet Location |
As of April 30, 2021 | As of April 30, 2020 | ||||||||
| Foreign exchange forward contracts |
Prepaid expenses and other current assets | $ | 0.3 | $ | 0.5 | |||||
The Company did not hold any derivatives in a liability position as of April 30, 2021 and 2020.
| F-61 |
Table of Contents
Net Investment Hedge
In order to reduce exposure to fluctuations in the euro/USD exchange rate on its investments in euro functional currency foreign operations, the Company uses a portion of its euro-denominated debt which is included in long-term debt as a non-derivative hedging item to hedge a portion of the Company’s net investment in foreign operations. The portion of euro-denominated debt designated as net investment hedges had a carrying value of $266.7 as of April 30, 2021. The Company did not have any net investment hedges in place as of April 30, 2020.
Derivatives Not Designated as Hedging Instruments
The amount of losses recognized in the consolidated statements of operations and related to the Company’s derivative financial instruments not designated as hedging instruments are presented as follows:
| Successor | Predecessor | |||||||||||||||||
| Statement of operations location |
For the Year ended April 30, 2021 |
For the Year ended April 30, 2020 |
For the Period from November 30, 2018 through April 30, 2019 |
For the Period from May 1, 2018 through December 20, 2018 |
||||||||||||||
| Foreign exchange forward contracts |
Other expense (income), net |
$ | 17.9 | $ | 0.6 | $ | — | $ | 0.3 | |||||||||
The loss recognized for the year ended April 30, 2021 is principally driven by a foreign exchange forward contract entered into in connection with the incremental Euro Term Loan borrowing of €460.0 completed during the first quarter of fiscal year 2021 and used to prepay the incremental term loans of $500.0 entered into on April 30, 2020 (see Note 13, Debt).
The Company did not hold any derivative financial instrument not designated as hedging instrument as of April 30, 2021.
Credit Risk
Credit risk is the risk of financial loss to the Company if a customer or counterparty to a financial instrument fails to meet its contractual obligations and arises from the Company’s trade accounts receivable, cash and cash equivalents and derivative financial instruments. Credit risk arising from trade accounts receivable is discussed in Note 5, Trade and Other Receivables, Net.
Cash and cash equivalents and derivative financial instruments in an asset position expose the Company to credit risk arising from the potential default by counterparties that carry the Company’s cash balances or agree to deliver currencies. The Company attempts to mitigate this risk by dealing only with large financial institutions or counterparties with good credit ratings. The Company believes cash and cash equivalents are not subject to any significant credit risk. Exposure to credit risk in the event of nonperformance by any of the counterparties on derivative financial instruments is limited to the gross fair value of such instruments which totaled $0.3 as of April 30, 2021 and $0.5 as of April 30, 2020.
| F-62 |
Table of Contents
| 20 | Related Party Transactions |
The following tables present the related party balances and transactions of the Company:
| April 30, 2021 | April 30, 2020 | |||||||
| Balance with related parties are as follows: |
||||||||
| Trade and other receivables |
$ | 0.4 | $ | 5.3 | ||||
| Accounts payable |
$ | 16.3 | $ | 4.9 | ||||
| Accounts payable — acquisition-related costs |
$ | — | $ | 6.6 | ||||
| Accounts payable — sponsor fees |
$ | 3.0 | $ | 1.8 | ||||
As of April 30, 2021, trade and other receivables include (i) $0.2 ($0.0 as of April 30, 2020) from sales transactions for finished hair care and skin care products concluded with an entity that is controlled by Cornell Capital LLC, (ii) $0.2 ($0.5 as of April 30, 2020) for travel and other expenses receivable from a member of the Company’s Board of Directors and (iii) a post-close consideration adjustment of $0.0 ($4.8 as of April 30, 2020) relating to the acquisition of HCT (see Note 4, Business Combinations).
As of April 30, 2021, accounts payable include (i) $8.5 ($4.8 as of April 30, 2020) payable to entities that are controlled by a member of the immediate family of a member of the Company’s Board of Directors, and whose family member controls one of the Company’s principal shareholders, for purchases of goods and services that include injection-molded plastic and airless dispensing cosmetic components, cosmetic brushes, metal cosmetic applicators and other cosmetic components, quality assurance services, and cosmetic formulation and filling services, (ii) $7.6 ($0.0 as of April 30, 2020) payable to entities that are controlled by a member of the immediate family of a member of the Company’s Board of Directors and whose family member controls one of the Company’s principal shareholders, for tax refunds for pre-acquisition state tax filings and returns, and (iii) $0.2 ($0.1 as of April 30, 2020) payable to one of the Company’s equity method investments, for purchases of cosmetics formulation and filling.
| Successor | Predecessor | |||||||||||||||
| For the Year ended April 30, 2021 |
For the Year ended April 30, 2020 |
For the Period from November 30, 2018 through April 30, 2019 |
For the Period from May 1, 2018 through December 20, 2018 |
|||||||||||||
| Nature of transactions: |
||||||||||||||||
| Revenue |
$ | 1.8 | $ | 2.8 | $ | — | $ | — | ||||||||
| Cost of revenue |
$ | 52.9 | $ | 7.0 | $ | — | $ | — | ||||||||
| Sponsor fees |
$ | 7.9 | $ | 4.6 | $ | 1.3 | $ | 1.0 | ||||||||
| Acquisition-related costs |
$ | — | $ | 15.1 | $ | — | $ | — | ||||||||
Revenue is derived from sales transactions for finished hair care and skin care products concluded with an entity that is controlled by Cornell Capital LLC.
Cost of revenue includes (i) $50.9 and $6.4 for the years ended April 30, 2021 and 2020, $0.0 for the period from November 30, 2018 through April 30, 2019 and $0.0 for the period from May 1, 2018 through December 20, 2018, respectively, for purchases of goods and services that include injection-molded plastic and airless dispensing cosmetic components, cosmetic brushes, metal cosmetic applicators and other cosmetic components, quality assurance services, and cosmetic formulation and filling services, from entities that are controlled by a
| F-63 |
Table of Contents
member of the immediate family of a member of the Company’s Board of Directors, and whose family member controls one of the Company’s principal shareholders, and (ii) $2.0 and $0.6 for the years ended April 30, 2021 and 2020, $0.0 for the period from November 30, 2018 through April 30, 2019 and $0.0 for the period from May 1, 2018 through December 20, 2018, respectively, for purchases of cosmetics formulation and filling from one of the Company’s equity method investments.
Sponsor fees and acquisition-related costs were paid to Cornell Capital LLC in the Successor periods and to a prior sponsor in the Predecessor period. The contractual fees paid to Cornell Capital LLC consist of quarterly reimbursements of out-of-pocket expenses incurred by Cornell Capital LLC in connection with the provision of services, a 1% cash fee of the enterprise value of an acquired target by the Company, and a 2.5% annual cash fee based on consolidated Adjusted EBITDA (as defined in the Credit Agreement, and which is different from the Adjusted EBITDA used for the purpose of segment data in Note 24, Segment Data and Related Information) and contains no expiration date. On June 22, 2021, the services agreement with Cornell Capital LLC was amended so that upon the successful completion of an IPO, the services agreement will be terminated in exchange of a fixed fee of $18.0.
In connection with the acquisition of HCT (see Note 4, Business Combinations), the Company entered into a Call Option Deed on January 23, 2020, whereby the Company has the option to acquire the shares of certain businesses that are controlled by a member of the immediate family of a member of the Company’s Board of Directors, and whose family member controls one of the Company’s principal shareholders. The call option can be exercised at any time on or prior to January 23, 2025 for a consideration equal to the higher of (i) the fair value of the shares acquired; (ii) the investment cost of the seller; and (iii) in connection with the acquisition of HCT Metals, $22.5.
On March 11, 2021, the Company entered into a sale and purchase agreement to acquire all of the issued and outstanding shares of each of Geng Xian Metal Treatment (Jiangmen) Company Limited (“JiangmenCo”), a company established under the laws of the People’s Republic of China (“PRC”) and Yaochang Metal Works (Zhuhai) Company Limited (“ZhuhaiCo”), a company established under the laws of the PRC, for a purchase price of $11.8 on a cash-free and debt-free basis and subject to customary closing working capital adjustments. JiangmenCo and ZhuhaiCo collectively operate the business referred to as “HCT Metals.” This agreement was executed on terms varying from the Call Option Deed described above. ZhuhaiCo (and its predecessor entity) operates a plastic injection molding business and is a supplier of components to JiangmenCo. JiangmenCo operates an electroplating business and is a supplier to HCT. The transaction will, once closed, allow HCT to in-source and control key injection molding and electroplating capabilities, thereby allowing it to reduce supplier risks. The transaction closed on May 3, 2021.
| 21 | Commitments and Contingencies |
The Company entered into agreements consisting mainly of non-cancellable commitments for capital expenditures and operating and finance leases for which the lease has been signed but has not commenced. As of April 30, 2021, commitments amounted to $83.5, of which $79.4 were due within less than one year, $3.3 were due within one to three years, $0.7 were due within three to five years, and $0.1 were due thereafter.
The Company also has commitments related to sponsor fees in future periods (see Note 20, Related Party Transactions).
In the normal course of business, the Company is involved in various legal proceedings and is exposed to potential non-compliance with legal requirements, for which the outcomes, inflow or outflow of economic
| F-64 |
Table of Contents
benefits are uncertain. No material accrual has been recorded in relation to these items. The Company believes that the resolution of these items will not have a material favorable or unfavorable effect on its consolidated balance sheets or consolidated financial performance.
From time to time, the Company enters into certain types of contracts that contingently require the parties to indemnify one another against various categories of claims. The terms of such indemnification obligations vary by contract and in most instances no maximum dollar amount is explicitly stated therein. Amounts which may become due under these indemnification obligations cannot be estimated until a specific claim is asserted. No liabilities have been recorded for these obligations on the Company’s consolidated balance sheets for the periods presented.
| 22 | Net Loss per Share |
For the years ended April 30, 2021 and 2020, the period from November 30, 2018 through April 30, 2019 and the period from May 1, 2018 through December 20, 2018, net loss per share was as follows:
| Successor | Predecessor | |||||||||||||||
| For the Year ended April 30, 2021 |
For the Year ended April 30, 2020 |
For the Period from November 30, 2018 through April 30, 2019 |
For the Period from May 1, 2018 through December 20, 2018 |
|||||||||||||
| Amounts attributable to Knowlton Development Parent, Inc. (in millions of U.S. dollars, except share and per share data) |
||||||||||||||||
| Numerator: |
||||||||||||||||
| Net loss |
$ | (125.8 | ) | $ | (81.9 | ) | $ | (9.3 | ) | $ | (22.7 | ) | ||||
| Denominator: |
||||||||||||||||
| Weighted-average common shares outstanding – Basic |
1,324,110 | 857,883 | 641,424 | 309,344,128 | ||||||||||||
| Effect of outstanding stock options |
— | — | — | — | ||||||||||||
|
|
|
|
|
|
|
|
|
|||||||||
| Weighted-average common shares outstanding – Diluted |
1,324,110 | 857,883 | 641,424 | 309,344,128 | ||||||||||||
|
|
|
|
|
|
|
|
|
|||||||||
| Basic and diluted net loss per common share |
$ | (95.01 | ) | $ | (95.47 | ) | $ | (14.50 | ) | $ | (0.07 | ) | ||||
| F-65 |
Table of Contents
Unaudited Pro Forma Net Loss per Share
Unaudited pro forma basic and diluted net loss per share was calculated as follows, without giving effect to the subdivision of each of the outstanding common shares:
| For the Year ended April 30, 2021 (Unaudited) |
||||
| Numerator: |
||||
| Net loss, as reported |
$ | (125.8 | ) | |
| Interest expense on the repayment of incremental borrowings used to fund the returns of capital, net of tax effect |
2.0 | |||
| Interest expense on the repayment of borrowings outstanding under the Credit Agreement, net of tax effect |
9.4 | |||
| Share-based compensation expense triggered by the IPO, net of tax effect (Note 15) (1) |
(19.8 | ) | ||
| Write-off of debt transaction costs and debt issuance discounts, net of tax effect |
(9.8 | ) | ||
| Sponsor fees payable to Cornell Capital LLC triggered by the IPO, net of tax effect (Note 20) |
(13.2 | ) | ||
|
|
|
|||
| Pro forma net loss |
$ | (157.2 | ) | |
|
|
|
|||
| Denominator: |
||||
| Weighted-average common shares used to compute net loss per share – Basic and diluted |
1,324,110 | |||
| Assumed shares sold in the IPO sufficient to pay the returns of capital |
197,799 | |||
| Assumed shares sold in the IPO used to repay borrowings outstanding under the Credit Agreement |
299,095 | |||
|
|
|
|||
| Total weighted-average common shares used to compute pro forma net loss per share – Basic and diluted |
1,821,004 | |||
|
|
|
|||
| Pro forma basic and diluted net loss per common share |
$ | (86.33 | ) | |
| (1) | The July 15, 2021 modification of the performance-based options resulted in a remeasurement of the fair value of the option award, resulting in a total unrecognized expense of $70.8, of which $24.1 ($19.8 after tax) would be recognized at the date of the IPO, assuming an IPO in the second quarter of fiscal year 2022, as indicated in the table above. The remeasured fair value of $872 per option was estimated using a share price of $1,752 (based on a probability weighted-average of the Company’s most recent 409A report obtained in July 2021 and the preliminary mid-point of an indicative price range of a possible IPO), a weighted-average exercise price of $991, a risk-free interest rate of 0.72%, an expected life of stock options of 5.02 years, an estimated volatility of 40% and expected dividends of 0.0%. |
The following potentially dilutive shares were not included in the computation of historical diluted net loss per common share as the effect would have been anti-dilutive due to the net loss incurred in the period:
| Successor | Predecessor | |||||||||||||||
| For the Year ended April 30, 2021 |
For the Year ended April 30, 2020 |
For the Period from November 30, 2018 through April 30, 2019 |
For the Period from May 1, 2018 through December 20, 2018 |
|||||||||||||
| Number of stock options(1)(2) |
42,813 | 20,373 | — | — | ||||||||||||
| (1) | Represents time-based vesting options outstanding as of April 30, 2021 that would be included in the computation under the treasury stock method. |
| (2) | In the computation of pro forma diluted net loss per common share, the number of stock options for the year ended April 30, 2021 would be 125,569 given all performance-based vesting options convert to time-based vesting options upon the completion of an IPO. |
| F-66 |
Table of Contents
| 23 | Supplemental Cash Flow Information |
Supplemental cash flow information is as follows:
| Successor | Predecessor | |||||||||||||||
| For the Year ended April 30, 2021 |
For the Year ended April 30, 2020 |
For the Period from November 30, 2018 through April 30, 2019 |
For the Period from May 1, 2018 through December 20, 2018 |
|||||||||||||
| Cash: |
||||||||||||||||
| Cash paid for interest |
$ | 64.4 | $ | 43.9 | $ | 15.6 | $ | 10.0 | ||||||||
| Cash paid for income taxes, net of refunds received |
$ | 14.5 | $ | 7.4 | $ | 0.6 | $ | 1.1 | ||||||||
| Non-cash Investing Activities: |
||||||||||||||||
| Property, plant and equipment accrued but unpaid |
$ | 21.7 | $ | — | $ | — | $ | — | ||||||||
| Contingent consideration payable for business combinations |
$ | — | $ | 4.3 | $ | — | $ | — | ||||||||
| Deferred consideration payable for business combinations |
$ | — | $ | 21.9 | $ | — | $ | — | ||||||||
| Post-closing consideration adjustment receivable for business combinations |
$ | — | $ | (8.3 | ) | $ | (5.6 | ) | $ | — | ||||||
| Non-cash consideration for business combinations |
$ | — | $ | 150.0 | $ | — | $ | — | ||||||||
| Non-cash Financing Activities: |
||||||||||||||||
| Issuance of shares |
$ | — | $ | 150.0 | $ | — | $ | — | ||||||||
| Issuance of shares for business combinations |
$ | — | $ | — | $ | 229.0 | $ | — | ||||||||
| Deferred consideration payable for business combinations reclassed to shareholders’ equity |
$ | 1.1 | $ | — | $ | 229.0 | $ | — | ||||||||
During the year ended April 30, 2020, the Company repaid $295.7 of long-term debt assumed in business combinations (see Note 4, Business Combinations).
| 24 | Segment Data and Related Information |
Reportable segments include components of an enterprise about which separate financial information is available that is evaluated regularly by the Company’s Chief Operating Decision Maker (the “CODM”), for the purpose of assessing performance and allocating resources. The Company has two reportable segments: Beauty and Personal Care and Home Care. Beauty and Personal Care includes skin care products, body and hair care products, soaps and sanitizers, cosmetics, deodorants, sun care products and fragrances. Home Care includes air care, fabric care, pest control solutions, surface care products and auto care solutions. These segments have been identified based on the different products sold within each segment. No operating segments have been aggregated to form the reportable segments. As a result of the various acquisitions made throughout fiscal year 2020, the Company underwent a strategic reorganization during the fiscal year 2021 in order to recognize acquisition synergies, expand customer relationships and streamline the reporting structure. This reorganization realigned the Company’s reporting structure as two operating and reportable segments. Segment information for the year ended April 30, 2020, the period from November 30, 2018 through April 30, 2019, and the period from May 1, 2018 through December 20, 2018 has been recast to reflect the two segments that exist as a result of the reorganization. Consolidated financial information was not affected.
| F-67 |
Table of Contents
The CODM reviews revenue, capital expenditures, and adjusted EBITDA for each of the reportable segments. Adjusted EBITDA is defined as earnings before interest expense and other expense (income), net, income tax benefit, depreciation and amortization, share-based compensation, acquisition-related costs, costs associated with becoming a public company, certain incremental costs associated with COVID-19 that we do not expect to continue to incur once the COVID-19 pandemic has significantly subsided globally and operations return to pre-COVID-19 levels, plant start-up costs, sponsor fees, impairment loss on right-of-use assets, impairment loss on goodwill and other intangibles and other adjustment items. Total assets by segment is not disclosed as the CODM does not assess performance, make strategic decisions, or allocate resources based on assets.
Corporate operations include costs related to executive compensation, finance, information technology, human resources, legal and other corporate functions. The Company reports these costs as Corporate as they relate to corporate-based responsibilities and decisions, and are not included in the internal measures of segment operating performance used by the Company to measure the underlying performance of the operating segments.
Sales to the Company’s two largest customers represented approximately 20% and 14% of the Company’s revenue, respectively, for the year ended April 30, 2021, approximately 23% and 13% of the Company’s revenue, respectively, for the year ended April 30, 2020, approximately 20%, 16% and 12% for the Company’s three largest customers, respectively, for the period from November 30, 2018 through April 30, 2019, and approximately 21%, 15% and 10% for the Company’s three largest customers, respectively, for the period from May 1, 2018 through December 20, 2018. Both segments reported revenue from these customers. No other customer contributed to over 10% of revenues for these periods.
As of April 30, 2021, 56% of the Company’s long-lived assets were located in United States, 13% were located in Italy and 8% were located in Canada. As of April 30, 2020, 54% of the Company’s long-lived assets were located in United States, 13% were located in Italy and 9% were located in Canada. No other foreign country includes more than 10% of the Company’s long-lived assets as of April 30, 2021 and 2020, respectively.
Revenue by segment is as follows:
| Successor | Predecessor | |||||||||||||||
| For the Year ended April 30, 2021 |
For the Year ended April 30, 2020 |
For the Period from November 30, 2018 through April 30, 2019 |
For the Period from May 1, 2018 through December 20, 2018 |
|||||||||||||
| Revenue by Segment: |
||||||||||||||||
| Beauty and Personal Care |
$ | 1,314.2 | $ | 949.7 | $ | 318.9 | $ | 536.2 | ||||||||
| Home Care |
829.6 | 143.7 | 50.9 | 96.6 | ||||||||||||
|
|
|
|
|
|
|
|
|
|||||||||
| Total Revenue |
$ | 2,143.8 | $ | 1,093.4 | $ | 369.8 | $ | 632.8 | ||||||||
|
|
|
|
|
|
|
|
|
|||||||||
| F-68 |
Table of Contents
Revenue by geography is as follows:
| Successor | Predecessor | |||||||||||||||
| For the Year ended April 30, 2021 |
For the Year ended April 30, 2020 |
For the Period from November 30, 2018 through April 30, 2019 |
For the Period from May 1, 2018 through December 20, 2018 |
|||||||||||||
| Revenue by Geography: |
||||||||||||||||
| United States |
$ | 1,477.7 | $ | 896.5 | $ | 335.6 | $ | 552.4 | ||||||||
| Europe, Middle East & Africa |
423.0 | 117.6 | 7.9 | 7.4 | ||||||||||||
| Asia Pacific |
116.8 | 14.2 | 2.3 | 3.8 | ||||||||||||
| Canada |
75.2 | 42.0 | 16.5 | 42.4 | ||||||||||||
| Other(1) |
51.1 | 23.1 | 7.5 | 26.8 | ||||||||||||
|
|
|
|
|
|
|
|
|
|||||||||
| Total Revenue |
$ | 2,143.8 | $ | 1,093.4 | $ | 369.8 | $ | 632.8 | ||||||||
|
|
|
|
|
|
|
|
|
|||||||||
| (1) | Mostly comprised of revenue to Mexico and South America. |
Revenue by geography is presented based on the shipping destination of the products.
Capital expenditures of the segments are as follows:
| Successor | Predecessor | |||||||||||||||
| For the Year ended April 30, 2021 |
For the Year ended April 30, 2020 |
For the Period from November 30, 2018 through April 30, 2019 |
For the Period from May 1, 2018 through December 20, 2018 |
|||||||||||||
| Capital Expenditures by Segment: |
||||||||||||||||
| Beauty and Personal Care |
$ | 66.6 | $ | 17.9 | $ | 5.3 | $ | 7.3 | ||||||||
| Home Care |
56.6 | 6.4 | 1.6 | 2.0 | ||||||||||||
| Corporate |
1.9 | 1.5 | 0.2 | 0.2 | ||||||||||||
|
|
|
|
|
|
|
|
|
|||||||||
| Total Capital Expenditures |
$ | 125.1 | $ | 25.8 | $ | 7.1 | $ | 9.5 | ||||||||
|
|
|
|
|
|
|
|
|
|||||||||
| F-69 |
Table of Contents
The following table provides a reconciliation of segment adjusted EBITDA to loss before income taxes:
| Successor | Predecessor | |||||||||||||||
| For the Year ended April 30, 2021 |
For the Year ended April 30, 2020 |
For the Period from November 30, 2018 through April 30, 2019 |
For the Period from May 1, 2018 through December 20, 2018 |
|||||||||||||
| Segment Adjusted EBITDA |
||||||||||||||||
| Beauty and Personal Care |
$ | 132.3 | $ | 76.4 | $ | 33.8 | $ | 46.2 | ||||||||
| Home Care |
124.6 | 26.3 | 9.3 | 19.2 | ||||||||||||
|
|
|
|
|
|
|
|
|
|||||||||
| Total Segment Adjusted EBITDA |
256.9 | 102.7 | 43.1 | 65.4 | ||||||||||||
| Adjusted for the following: |
||||||||||||||||
| Corporate costs in the segment’s loss used by the CODM |
(18.4 | ) | (10.5 | ) | (4.0 | ) | (2.2 | ) | ||||||||
| Interest expense and other expense (income), net |
(89.9 | ) | (49.8 | ) | (14.9 | ) | (14.4 | ) | ||||||||
| Depreciation and amortization |
(151.3 | ) | (70.2 | ) | (20.5 | ) | (26.2 | ) | ||||||||
| Share-based compensation |
(8.5 | ) | (1.7 | ) | — | (16.5 | ) | |||||||||
| Acquisition-related costs |
(8.1 | ) | (56.9 | ) | (9.3 | ) | (25.3 | ) | ||||||||
| IPO preparation-related costs |
(10.8 | ) | (0.1 | ) | — | — | ||||||||||
| COVID-related costs |
(28.6 | ) | (1.5 | ) | — | — | ||||||||||
| Plant start-up costs |
(0.5 | ) | — | — | — | |||||||||||
| Sponsor fees |
(7.9 | ) | (4.6 | ) | (1.3 | ) | (1.0 | ) | ||||||||
| Impairment loss on right-of-use assets |
(6.1 | ) | — | — | — | |||||||||||
| Impairment loss on goodwill and other intangibles |
(48.2 | ) | — | — | — | |||||||||||
| Other adjustment items(1) |
(17.5 | ) | (3.4 | ) | (2.9 | ) | (3.4 | ) | ||||||||
|
|
|
|
|
|
|
|
|
|||||||||
| Loss before income taxes |
$ | (138.9 | ) | $ | (96.0 | ) | $ | (9.8 | ) | $ | (23.6 | ) | ||||
|
|
|
|
|
|
|
|
|
|||||||||
| (1) | Includes restructuring expenses of $8.5 for the year ended April 30, 2021. |
| F-70 |
Table of Contents
| 25 | Condensed Financial Information of Registrant (Parent Company Only) |
(Parent Company Only)
Condensed Balance Sheets
(In millions of U.S. dollars)
| Successor | ||||||||
| April 30, 2021 | April 30, 2020 | |||||||
| ASSETS |
||||||||
| Current assets |
||||||||
| Prepaid expenses and other current assets |
$ | 3.3 | $ | — | ||||
|
|
|
|
|
|||||
| Total current assets |
3.3 | — | ||||||
| Investment in subsidiaries |
942.2 | 1,219.9 | ||||||
| Loans to related parties |
— | 5.0 | ||||||
| Deferred income tax asset |
2.8 | 0.1 | ||||||
|
|
|
|
|
|||||
| Total assets |
$ | 948.3 | $ | 1,225.0 | ||||
|
|
|
|
|
|||||
| LIABILITIES AND SHAREHOLDERS’ EQUITY |
||||||||
| Current liabilities |
||||||||
| Related party payables |
$ | 12.6 | $ | 0.3 | ||||
| Accrued expenses and other payables |
0.3 | — | ||||||
|
|
|
|
|
|||||
| Total current liabilities |
12.9 | 0.3 | ||||||
| Long-term debt from related parties |
— | 5.0 | ||||||
|
|
|
|
|
|||||
| Total liabilities |
12.9 | 5.3 | ||||||
| Shareholders’ equity |
||||||||
| Share capital |
1,143.1 | 1,310.6 | ||||||
| Shares to be issued |
1.1 | — | ||||||
| Additional paid-in capital |
5.2 | 1.7 | ||||||
| Accumulated deficit |
(217.0 | ) | (91.2 | ) | ||||
| Accumulated other comprehensive income (loss) |
3.0 | (1.4 | ) | |||||
|
|
|
|
|
|||||
| Total shareholders’ equity |
935.4 | 1,219.7 | ||||||
|
|
|
|
|
|||||
| Total liabilities and shareholders’ equity |
$ | 948.3 | $ | 1,225.0 | ||||
|
|
|
|
|
|||||
| F-71 |
Table of Contents
(Parent Company Only)
Condensed Statements of Operations and Comprehensive Loss
(In millions of U.S. dollars)
| Successor | ||||||||||||
| For the Year ended April 30, 2021 |
For the Year ended April 30, 2020 |
For the Period from November 30, 2018 through April 30, 2019 |
||||||||||
| Selling, general and administrative expenses |
$ | 0.5 | $ | 0.5 | $ | — | ||||||
| Acquisition-related costs and other expenses |
9.9 | — | — | |||||||||
|
|
|
|
|
|
|
|||||||
| Operating loss |
(10.4 | ) | (0.5 | ) | — | |||||||
| Loss before income taxes |
(10.4 | ) | (0.5 | ) | — | |||||||
| Income tax benefit |
(2.7 | ) | (0.1 | ) | — | |||||||
|
|
|
|
|
|
|
|||||||
| Net loss before equity in net loss of subsidiaries |
(7.7 | ) | (0.4 | ) | — | |||||||
| Equity in net loss of subsidiaries |
(118.1 | ) | (81.5 | ) | (9.3 | ) | ||||||
|
|
|
|
|
|
|
|||||||
| Net loss |
$ | (125.8 | ) | $ | (81.9 | ) | $ | (9.3 | ) | |||
|
|
|
|
|
|
|
|||||||
| Equity in other comprehensive income (loss) of subsidiaries |
4.4 | (1.4 | ) | — | ||||||||
|
|
|
|
|
|
|
|||||||
| Comprehensive loss |
$ | (121.4 | ) | $ | (83.3 | ) | $ | (9.3 | ) | |||
|
|
|
|
|
|
|
|||||||
| F-72 |
Table of Contents
(Parent Company Only)
Condensed Statements of Cash Flows
(In millions of U.S. dollars)
| Successor | ||||||||||||
| For the Year ended April 30, 2021 |
For the Year ended April 30, 2020 |
For the Period from November 30, 2018 through April 30, 2019 |
||||||||||
| Cash Flows From Operating Activities |
||||||||||||
| Net loss |
$ | (125.8 | ) | $ | (81.9 | ) | $ | (9.3 | ) | |||
| Adjustment to reconcile net loss to net cash used in operating activities: |
||||||||||||
| Share-based compensation |
0.3 | 0.2 | — | |||||||||
| Benefit for deferred income taxes |
(2.7 | ) | (0.1 | ) | — | |||||||
| Equity in net loss of subsidiaries |
118.1 | 81.5 | 9.3 | |||||||||
| Other, net |
(0.1 | ) | — | — | ||||||||
| Changes in operating assets and liabilities, excluding the effect of businesses acquired |
||||||||||||
| Prepaid expenses and other current assets |
(3.3 | ) | — | — | ||||||||
| Accrued expenses and other payables |
0.3 | — | — | |||||||||
| Related party payables |
12.3 | 0.3 | — | |||||||||
|
|
|
|
|
|
|
|||||||
| Net cash used in operating activities |
(0.9 | ) | — | — | ||||||||
|
|
|
|
|
|
|
|||||||
| Cash Flows From Investing Activities |
||||||||||||
| Loan to related parties |
5.0 | (5.0 | ) | — | ||||||||
| Returns of capital from subsidiaries |
318.5 | — | — | |||||||||
| Investment in subsidiaries |
(150.0 | ) | (421.2 | ) | (510.4 | ) | ||||||
|
|
|
|
|
|
|
|||||||
| Net cash provided by (used in) investing activities |
173.5 | (426.2 | ) | (510.4 | ) | |||||||
|
|
|
|
|
|
|
|||||||
| Cash Flows From Financing Activities |
||||||||||||
| Long-term debt from related parties |
(5.0 | ) | 5.0 | — | ||||||||
| Issuance of shares |
151.0 | 421.2 | 510.4 | |||||||||
| Returns of capital to shareholders |
(318.5 | ) | — | — | ||||||||
| Repurchase of shares |
(0.1 | ) | — | — | ||||||||
|
|
|
|
|
|
|
|||||||
| Net cash provided by (used in) financing activities |
(172.6 | ) | 426.2 | 510.4 | ||||||||
|
|
|
|
|
|
|
|||||||
| Net change in cash and cash equivalents |
— | — | — | |||||||||
| Cash and cash equivalents, beginning of period |
— | — | — | |||||||||
|
|
|
|
|
|
|
|||||||
| Cash and cash equivalents, end of period |
$ | — | $ | — | $ | — | ||||||
|
|
|
|
|
|
|
|||||||
| Supplemental Cash Flow Information |
||||||||||||
| Non-cash Investing Activities: |
||||||||||||
| Non-cash consideration for business combination |
$ | — | $ | 150.0 | $ | — | ||||||
| Non-cash Financing Activities: |
||||||||||||
| Issuance of shares |
$ | — | $ | 150.0 | $ | — | ||||||
| Issuance of shares for business combination |
$ | — | $ | — | $ | 229.0 | ||||||
| F-73 |
Table of Contents
(Parent Company Only)
Note to Condensed Financial Statements of Registrant
(In millions of U.S. dollars)
Basis of Presentation
The condensed parent company-only financial statements have been prepared in accordance with Rule 12-04, Schedule I of Regulation S-X, as the restricted net assets of the subsidiaries of Knowlton Development Parent, Inc. exceed 25% of the consolidated net assets of the Company. Knowlton Development Parent, Inc. has no material assets or standalone operations other than its ownership in its subsidiaries. See Note 1, Description of Business and Basis of Presentation, for further details on the formation of Knowlton Development Parent, Inc.
The Credit Agreement, which encompasses the First Lien Term Loan and the Revolving Facility as defined in Note 13, Debt, was entered into by Knowlton Development Corporation Inc. as the Canadian Borrower and KDC US Holdings, Inc. as the U.S. Borrower. Under the terms of the Credit Agreement, as wholly-owned subsidiaries of Knowlton Development Parent, Inc., Knowlton Development Corporation Inc. and KDC US Holding, Inc. are restricted from making dividend payments, loans or advances to Knowlton Development Parent, Inc. The covenants of the Credit Agreement restrict the payment of dividends to, among other exceptions, (i) a basket for dividends to be paid once thresholds related to specified balances, financial metrics and ratios are satisfied, (ii) dividends in excess of capital contribution amounts, (iii) a basket for unlimited dividends if no event of default exists and the pro forma leverage ratio is less than or equal to 4.00 to 1.00 and (iv) dividends limited to the sum of (a) 6% per annum of proceeds of qualified IPO plus (b) 5% of market capitalization at the time of such qualified IPO.
The condensed parent-only financial statements have been prepared in accordance with GAAP using the same accounting principles and policies described in the notes to the consolidated financial statements, with the only exception being that the parent company accounts for its subsidiaries using the equity method. From its formation through February 2, 2021, Knowlton Development Parent, Inc. did not receive dividends from its subsidiaries. On February 3, 2021, Knowlton Development Parent, Inc. received a $318.5 distribution from its subsidiaries. This distribution was made in compliance with the terms of the Credit Agreement.
These condensed financial statements should be read in conjunction with the accompanying consolidated financial statements and related notes thereto.
| 26 | Subsequent Events |
The Company has evaluated subsequent events through September 13, 2021, which is the date the financial statements are available to be issued, pursuant to ASC 855-10 Subsequent Events.
On July 1, 2021, Knowlton Development Parent, Inc., and Knowlton Development Holdco, Inc., a wholly-owned subsidiary of Knowlton Development Parent, Inc., amalgamated under the laws of British Columbia and continued as one corporation named Knowlton Development Corporation, Inc. The Company’s consolidated financial statements are not adjusted for this change given it occurred subsequent to year-end.
In connection with and prior to the consummation of the IPO, the Company will amend and restate its articles to, among other things, alter the identifying name of, and modify the rights and restrictions attached to, the Class A common shares and the Class B common shares so that they will be named and bear the rights and restrictions attached to the common shares (without par value, voting and participating) and authorize an unlimited number of preferred shares, issuable in series. In connection with the closing of the IPO, the Company will also effect a 1-for-115 subdivision of each of the outstanding common shares.
| F-74 |
Table of Contents
Knowlton Development Corporation, Inc.
(In millions of U.S. dollars, except share amounts)
| July 31, 2021 | April 30, 2021 | |||||||
| (Unaudited) | ||||||||
| ASSETS |
||||||||
| Current assets |
||||||||
| Cash and cash equivalents |
$ | 96.2 | $ | 118.0 | ||||
| Trade and other receivables, net |
313.2 | 289.9 | ||||||
| Related party receivables |
0.9 | 0.4 | ||||||
| Income taxes receivable |
19.3 | 20.3 | ||||||
| Inventories |
290.5 | 265.1 | ||||||
| Prepaid expenses and other current assets |
42.3 | 31.4 | ||||||
|
|
|
|
|
|||||
| Total current assets |
762.4 | 725.1 | ||||||
| Property, plant and equipment, net |
564.3 | 519.9 | ||||||
| Operating lease right-of-use assets |
144.6 | 144.8 | ||||||
| Other assets |
9.9 | 10.1 | ||||||
| Goodwill |
979.4 | 973.7 | ||||||
| Other intangibles, net |
1,174.3 | 1,196.5 | ||||||
| Deferred income tax asset |
5.2 | 4.0 | ||||||
|
|
|
|
|
|||||
| Total assets |
$ | 3,640.1 | $ | 3,574.1 | ||||
|
|
|
|
|
|||||
| LIABILITIES AND SHAREHOLDERS’ EQUITY |
||||||||
| Current liabilities |
||||||||
| Accounts payable |
279.6 | 257.1 | ||||||
| Related party payables |
23.5 | 19.3 | ||||||
| Accrued expenses and other payables |
135.1 | 158.9 | ||||||
| Deferred revenue |
47.2 | 35.6 | ||||||
| Income taxes payable |
12.6 | 12.0 | ||||||
| Current portion of operating lease liabilities |
22.4 | 22.0 | ||||||
| Current portion of long-term debt |
17.8 | 18.0 | ||||||
|
|
|
|
|
|||||
| Total current liabilities |
538.2 | 522.9 | ||||||
| Operating lease liabilities |
133.2 | 133.1 | ||||||
| Long-term debt |
1,766.2 | 1,701.8 | ||||||
| Deferred income tax liability |
266.6 | 272.4 | ||||||
| Other liabilities |
8.9 | 8.5 | ||||||
|
|
|
|
|
|||||
| Total liabilities |
2,713.1 | 2,638.7 | ||||||
|
|
|
|
|
|||||
| Commitments and contingencies (Note 16) |
||||||||
| Shareholders’ equity |
||||||||
| Class A Common Shares, no par value (unlimited shares authorized, 1,353,183 shares issued and outstanding as of July 31, 2021 and April 30, 2021); Class B Common Shares, no par value (unlimited shares authorized, 16,541 shares issued and outstanding as of July 31, 2021 and April 30, 2021) |
1,143.1 | 1,143.1 | ||||||
| Shares to be issued |
1.1 | 1.1 | ||||||
| Additional paid-in capital |
6.3 | 5.2 | ||||||
| Accumulated deficit |
(229.7 | ) | (217.0 | ) | ||||
| Accumulated other comprehensive income |
6.2 | 3.0 | ||||||
|
|
|
|
|
|||||
| Total shareholders’ equity |
927.0 | 935.4 | ||||||
|
|
|
|
|
|||||
| Total liabilities and shareholders’ equity |
$ | 3,640.1 | $ | 3,574.1 | ||||
|
|
|
|
|
|||||
See accompanying Notes to Unaudited Consolidated Financial Statements.
F-75
Table of Contents
Knowlton Development Corporation, Inc.
Consolidated Statements of Operations
(In millions of U.S. dollars, except share and per share amounts)
| Three Months Ended July 31, | ||||||||
| 2021 | 2020 | |||||||
| (Unaudited) | ||||||||
| Revenue |
$ | 603.4 | $ | 482.4 | ||||
| Cost of revenue |
520.9 | 400.4 | ||||||
|
|
|
|
|
|||||
| Gross profit |
82.5 | 82.0 | ||||||
| Operating expenses |
||||||||
| Selling, general and administrative expenses |
73.6 | 64.1 | ||||||
| Acquisition-related costs and other expenses |
4.7 | 2.3 | ||||||
|
|
|
|
|
|||||
| Operating income |
4.2 | 15.6 | ||||||
| Interest expense |
22.8 | 17.3 | ||||||
| Other expense (income), net |
(3.1 | ) | 3.1 | |||||
|
|
|
|
|
|||||
| Loss before income taxes |
(15.5 | ) | (4.8 | ) | ||||
| Income tax benefit |
(2.8 | ) | (4.2 | ) | ||||
|
|
|
|
|
|||||
| Net loss |
$ | (12.7 | ) | $ | (0.6 | ) | ||
|
|
|
|
|
|||||
| Weighted-average shares outstanding – basic and diluted |
1,370,427 | 1,249,151 | ||||||
|
|
|
|
|
|||||
| Net loss per share – basic and diluted |
$ | (9.27 | ) | $ | (0.48 | ) | ||
|
|
|
|
|
|||||
| Unaudited Pro Forma Data(1) |
||||||||
| Pro forma weighted-average shares outstanding – basic and diluted |
1,867,321 | |||||||
|
|
|
|||||||
| Pro forma net loss per share – basic and diluted |
$ | (3.80 | ) | |||||
|
|
|
|||||||
| (1) | See Note 1, Basis of Presentation and Summary of Significant Accounting Policies and Note 17, Net Loss per Share to unaudited consolidated financial statements. |
Net loss is attributable entirely to the shareholders of the Company.
See accompanying Notes to Unaudited Consolidated Financial Statements.
F-76
Table of Contents
Knowlton Development Corporation, Inc.
Consolidated Statements of Comprehensive Income (Loss)
(In millions of U.S. dollars)
| Three Months Ended July 31, | ||||||||
| 2021 | 2020 | |||||||
| (Unaudited) | ||||||||
| Net loss |
$ | (12.7 | ) | $ | (0.6 | ) | ||
| Other comprehensive income (loss), net of income taxes |
||||||||
| Foreign currency translation adjustments |
1.5 | 4.6 | ||||||
| Net investment hedge |
1.9 | (0.8 | ) | |||||
| Gain (loss) on cash flow hedges |
(0.2 | ) | 0.5 | |||||
|
|
|
|
|
|||||
| Total other comprehensive income (loss), net of income taxes |
3.2 | 4.3 | ||||||
|
|
|
|
|
|||||
| Comprehensive income (loss) |
$ | (9.5 | ) | $ | 3.7 | |||
|
|
|
|
|
|||||
Comprehensive income (loss) is attributable entirely to the shareholders of the Company.
See accompanying Notes to Unaudited Consolidated Financial Statements.
F-77
Table of Contents
Knowlton Development Corporation, Inc.
Consolidated Statements of Change in Shareholders’ Equity
(In millions of U.S. dollars, except share amounts)
| Three Months Ended July 31, 2021 | ||||||||||||||||||||||||
| (Unaudited) | ||||||||||||||||||||||||
| Class A Common Shares | Class B Common Shares | Shares to be Issued | ||||||||||||||||||||||
| Shares | Amount | Shares | Amount | Shares | Amount | |||||||||||||||||||
| Balance – As of April 30, 2021 |
1,353,183 | $ | 1,129.2 | 16,541 | $ | 13.9 | 703 | $ | 1.1 | |||||||||||||||
| Net loss |
— | — | — | — | — | — | ||||||||||||||||||
| Other comprehensive income |
— | — | — | — | — | — | ||||||||||||||||||
| Share-based compensation |
— | — | — | — | — | — | ||||||||||||||||||
|
|
|
|
|
|
|
|
|
|
|
|
|
|||||||||||||
| Balance – As of July 31, 2021 |
1,353,183 | $ | 1,129.2 | 16,541 | $ | 13.9 | 703 | $ | 1.1 | |||||||||||||||
|
|
|
|
|
|
|
|
|
|
|
|
|
|||||||||||||
| Three Months Ended July 31, 2021 | ||||||||||||||||
| (Unaudited) | ||||||||||||||||
| Additional Paid-In Capital |
Accumulated Deficit |
Accumulated Other Comprehensive Income |
Total Equity | |||||||||||||
| Balance – As of April 30, 2021 |
$ | 5.2 | $ | (217.0 | ) | $ | 3.0 | $ | 935.4 | |||||||
| Net loss |
— | (12.7 | ) | — | (12.7 | ) | ||||||||||
| Other comprehensive income |
— | — | 3.2 | 3.2 | ||||||||||||
| Share-based compensation |
1.1 | — | — | 1.1 | ||||||||||||
|
|
|
|
|
|
|
|
|
|||||||||
| Balance – As of July 31, 2021 |
$ | 6.3 | $ | (229.7 | ) | $ | 6.2 | $ | 927.0 | |||||||
|
|
|
|
|
|
|
|
|
|||||||||
| Three Months Ended July 31, 2020 | ||||||||||||||||||||||||||||||||
| (Unaudited) | ||||||||||||||||||||||||||||||||
| Class A Common Shares |
Class B Common Shares | Additional Paid-In Capital |
Accumulated Deficit |
Accumulated Other Comprehensive Income (Loss) |
Total Equity |
|||||||||||||||||||||||||||
| Shares | Amount | Shares | Amount | |||||||||||||||||||||||||||||
| Balance – As of April 30, 2020 |
1,233,183 | $ | 1,294.0 | 15,667 | $ | 16.6 | $ | 1.7 | $ | (91.2 | ) | $ | (1.4 | ) | $ | 1,219.7 | ||||||||||||||||
| Net loss |
— | — | — | — | — | (0.6 | ) | — | (0.6 | ) | ||||||||||||||||||||||
| Other comprehensive income |
— | — | — | — | — | — | 4.3 | 4.3 | ||||||||||||||||||||||||
| Share-based compensation |
— | — | — | — | 0.5 | — | — | 0.5 | ||||||||||||||||||||||||
| Issuance of shares |
— | — | 363 | 0.4 | — | — | — | 0.4 | ||||||||||||||||||||||||
|
|
|
|
|
|
|
|
|
|
|
|
|
|
|
|
|
|||||||||||||||||
| Balance – As of July 31, 2020 |
1,233,183 | $ | 1,294.0 | 16,030 | $ | 17.0 | $ | 2.2 | $ | (91.8 | ) | $ | 2.9 | $ | 1,224.3 | |||||||||||||||||
|
|
|
|
|
|
|
|
|
|
|
|
|
|
|
|
|
|||||||||||||||||
See accompanying Notes to Unaudited Consolidated Financial Statements.
F-78
Table of Contents
Knowlton Development Corporation, Inc.
Consolidated Statements of Cash Flows
(In millions of U.S. dollars)
| Three Months Ended July 31, | ||||||||
| 2021 | 2020 | |||||||
| (Unaudited) | ||||||||
| Cash Flows From Operating Activities |
||||||||
| Net loss |
$ | (12.7 | ) | $ | (0.6 | ) | ||
| Adjustments to reconcile net loss to net cash used in operating activities: |
||||||||
| Depreciation and amortization |
37.4 | 36.9 | ||||||
| Amortization of transaction costs and issuance discount |
3.3 | 2.0 | ||||||
| Share-based compensation |
1.1 | 0.5 | ||||||
| Benefit for deferred income taxes |
(7.0 | ) | (8.7 | ) | ||||
| Net foreign exchange gains |
(5.0 | ) | (14.4 | ) | ||||
| Other, net |
2.3 | 1.2 | ||||||
| Changes in operating assets and liabilities, excluding the effect of businesses acquired: |
||||||||
| Trade and other receivables |
(22.5 | ) | (33.1 | ) | ||||
| Related party receivables |
0.5 | 5.3 | ||||||
| Inventories |
(22.8 | ) | (15.8 | ) | ||||
| Prepaid expenses and other current assets |
(11.0 | ) | (2.9 | ) | ||||
| Accounts payable, accrued expenses and other payables |
2.0 | 14.3 | ||||||
| Related party payables |
3.1 | (10.4 | ) | |||||
| Deferred revenue |
11.6 | 1.3 | ||||||
| Income taxes payable |
2.1 | 2.5 | ||||||
|
|
|
|
|
|||||
| Net cash used in operating activities |
(17.6 | ) | (21.9 | ) | ||||
|
|
|
|
|
|||||
| Cash Flows From Investing Activities |
||||||||
| Business combinations, net of cash acquired |
(10.5 | ) | — | |||||
| Additions to property, plant and equipment |
(63.7 | ) | (16.3 | ) | ||||
|
|
|
|
|
|||||
| Net cash used in investing activities |
(74.2 | ) | (16.3 | ) | ||||
|
|
|
|
|
|||||
| Cash Flows From Financing Activities |
||||||||
| Proceeds from Revolving Facility |
76.5 | — | ||||||
| Repayment of Revolving Facility |
— | (74.0 | ) | |||||
| Proceeds from long-term debt |
— | 529.4 | ||||||
| Repayment of long-term debt |
(4.1 | ) | (502.3 | ) | ||||
| Payments of finance lease liabilities |
(0.6 | ) | (0.6 | ) | ||||
| Transaction costs related to long-term debt |
(0.5 | ) | (0.5 | ) | ||||
| Contingent consideration paid |
(1.0 | ) | (2.5 | ) | ||||
| Issuance of shares |
— | 0.4 | ||||||
|
|
|
|
|
|||||
| Net cash provided by (used in) financing activities |
70.3 | (50.1 | ) | |||||
|
|
|
|
|
|||||
| Effect of exchange rate changes on cash and cash equivalents |
(0.3 | ) | — | |||||
|
|
|
|
|
|||||
| Net change in cash and cash equivalents |
(21.8 | ) | (88.3 | ) | ||||
|
|
|
|
|
|||||
| Cash and cash equivalents, beginning of period |
118.0 | 173.8 | ||||||
|
|
|
|
|
|||||
| Cash and cash equivalents, end of period |
$ | 96.2 | $ | 85.5 | ||||
|
|
|
|
|
|||||
Supplemental Cash Flow Information (Note 18)
See accompanying Notes to Unaudited Consolidated Financial Statements.
F-79
Table of Contents
Knowlton Development Corporation, Inc.
Notes to Unaudited Consolidated Financial Statements
| 1 | Basis of Presentation and Summary of Significant Accounting Policies |
Basis of Presentation
The unaudited consolidated financial statements included herein have been prepared in accordance with accounting principles generally accepted in the United States (“GAAP”) for interim financial statements. These unaudited consolidated financial statements have been prepared on the same basis as our annual consolidated financial statements and reflect all adjustments of a normal recurring nature which, in management’s opinion, are necessary for a fair statement of the results for the interim periods presented. Results for interim periods are not necessarily indicative of results for a full year. Accordingly, these unaudited consolidated financial statements should be read in conjunction with Knowlton Development Corporation, Inc. and its subsidiaries’ (the “Company”) consolidated financial statements and accompanying notes for the year ended April 30, 2021. There have been no material changes in the accounting policies adopted by the Company during the current fiscal year other than the adoption of new accounting pronouncements discussed below.
The Company utilizes a fiscal year from May 1 to April 30, with quarter ends at July 31, October 31, January 31 and April 30.
On July 1, 2021, Knowlton Development Parent, Inc., and Knowlton Development Holdco, Inc., a wholly-owned subsidiary of Knowlton Development Parent, Inc., amalgamated under the laws of British Columbia and continued as one corporation named Knowlton Development Corporation, Inc. The impact of this change on the Company’s consolidated financial statements was limited to the name change.
Unaudited Pro Forma Information
On or about February 3, 2021, the Company effected returns of capital in the aggregate amount of $318.5, which were distributed to the Company’s shareholders. Those returns of capital were funded, along with cash, by an increase in borrowings that took place on January 27, 2021 under the Euro Term Loan and the Revolving Facility (as defined in Note 8, Debt). The Company intends to use all of the net proceeds it will receive from its initial public offering (“IPO”) to repay borrowings under the Credit Agreement, which includes all of the incremental borrowings used to fund the returns of capital.
Staff Accounting Bulletin 1.B.3 requires that certain distributions to owners prior to or concurrent with an IPO be considered as distributions in contemplation of that offering and therefore that pro forma basic and diluted earnings per share be presented giving effect to the number of shares whose proceeds would be used to pay such distribution.
In Note 17, Net Loss per Share, the calculation of the unaudited pro forma basic and diluted net loss per share for the three months ended July 31, 2021 has been prepared to give effect to the following as if the underlying transaction had occurred on May 1, 2020:
| • | additional shares whose IPO proceeds are necessary to pay the returns of capital effected on or about February 3, 2021 based on the mid-point of the range on the cover page of the prospectus (considering that the incremental borrowings used to fund these returns of capital are intended to be repaid in full with the IPO net proceeds, for which interest expense has been excluded in the computation of pro forma net loss); |
| • | additional shares whose IPO proceeds are intended to be used to repay borrowings under the Credit Agreement (after giving effect to the repayment of debt described in the preceding bullet) based on the |
F-80
Table of Contents
Knowlton Development Corporation, Inc.
Notes to Unaudited Consolidated Financial Statements (Continued)
| mid-point of the range on the cover page of the prospectus (for which interest expense has been excluded in the computation of pro forma net loss); and |
| • | the consequential income tax adjustments. |
In addition to the adjustments above, in Note 22, Net Loss per Share of the Company’s annual consolidated financial statements, the calculation of the unaudited pro forma basic and diluted net loss per share for the year ended April 30, 2021 has been prepared to give effect to the following as if the underlying transaction had occurred on May 1, 2020:
| • | the July 15, 2021 modification of the performance-based vesting options resulted in a total unrecognized expense of $70.8, of which additional share-based compensation expense of $24.1 (pre-tax) triggered by the IPO. As further described in Note 10, Employee Benefits, upon the completion of an IPO, performance-based vesting options will vest on a straight-line basis over the first five years after the original grant date and as such, an expense is required for services that have been provided by the employees from the service inception date until the IPO; |
| • | write-off of debt transaction costs and debt issuance discounts of $13.3 (pre-tax) related to the repayment of debt described above; |
| • | additional sponsor fees of $18.0 (pre-tax) to Cornell Capital LLC triggered by the IPO, as further described in Note 15, Related Party Transactions; |
| • | the consequential income tax adjustments. |
Basis of Consolidation
The unaudited consolidated financial statements include the accounts of Knowlton Development Corporation, Inc. and its subsidiaries in which the Company has a controlling financial interest. All intercompany balances and transactions have been eliminated from the Company’s unaudited consolidated financial statements.
Use of Estimates
In preparing these financial statements, the Company is required to use estimates and assumptions that affect the reported amounts of assets and liabilities, the disclosure of contingent assets and liabilities at the date of the financial statements and the reported amounts of revenues and expenses during the reporting period. Actual results could differ materially from those estimates and assumptions. On an ongoing basis, the Company reviews estimates, including those related to purchase acquisition accounting, allowances for current expected credit losses, the valuation allowance for deferred tax assets, the assessment of goodwill, other intangible assets and long-lived assets for impairment and useful life determinations, inventory obsolescence reserve, share-based compensation, legal and other contingency reserves.
The COVID-19 pandemic has negatively impacted the global economy, disrupted supply chains and created significant volatility in global financial markets. Many countries in which we operate initiated governmental restrictions in response to the COVID-19 pandemic and these actions have impacted and will continue to impact our results of operations and cash flows. Beginning in late 2020, several vaccines have received regulatory approval across the world and are being distributed in our primary areas of operation, including North America and Europe. As COVID-19 vaccine adoption rates increase, certain countries have started facilitating gradual reopening of business and public settings while maintaining health and safety precautions. Uncertainty surrounding the effectiveness of the vaccines, the emergence of new strains such as the Delta variant, public
F-81
Table of Contents
Knowlton Development Corporation, Inc.
Notes to Unaudited Consolidated Financial Statements (Continued)
perception and local laws, and regulations enacted to combat the spread of COVID-19, will play a key role on any future impact of the COVID-19 pandemic in our operations. A significant portion of the Company’s operations are deemed essential services by the government authorities.
The impact that the COVID-19 pandemic will have on the Company’s consolidated operations is uncertain. The Company has considered the potential impacts of the COVID-19 pandemic when developing the Company’s estimates and judgments as of July 31, 2021 and April 30, 2021 and will continue to evaluate the extent of the impact on the Company’s business and consolidated financial statements. The Company’s accounting estimates and assumptions may change over time in response to the COVID-19 pandemic and the change could be material in future periods.
Foreign Currency
The Company recorded transactional gains of $4.5 and $16.5 for the three months ended July 31, 2021 and 2020, respectively, which are included in profit or loss within other expense (income), net. Such transactional gains include foreign currency (gains) losses on inter-company loans that are repayable in the foreseeable future.
Trade and Other Receivables, Net
Trade accounts receivable consist of amounts due from normal business activities. An allowance for current expected credit losses is maintained to reflect an impairment risk for trade accounts receivable based on a current expected credit loss model which factors in changes in credit quality since the initial recognition of trade accounts receivable based on customer risk categories. Current expected credit losses are also provided based on collection history and specific risks identified on a customer-by-customer basis. Trade accounts receivable are presented net of allowances for current expected credit losses.
Based on the distribution and credit quality of customers and initiatives to optimize the collection of amounts due under sales arrangements with customers, the Company believes that the credit risk related to trade and other receivables remains limited as of July 31, 2021. The allowances for current expected credit losses as of July 31, 2021 did not change materially from April 30, 2021.
Leases
The right-of-use assets related to finance leases are included in property, plant and equipment, net in the consolidated balance sheets. The current and non-current portion of finance lease liabilities are included in current portion of long-term debt and long-term debt, respectively, in the consolidated balance sheets.
Selling, General and Administrative Expenses
SG&A expenses include amounts for research and development (“R&D”) costs, which are expensed as incurred. For the three months ended July 31, 2021 and 2020, respectively, SG&A expenses include a total of $7.7 and $6.5 of research and development costs, respectively.
Acquisition-related Costs and Other Expenses
Acquisition-related costs and other expenses include costs incurred by the Company in relation to its business acquisitions. These expenses include professional, due diligence and advisory fees related to each business combination. These expenses also include the fee paid to Cornell Capital LLC as a result of the acquisitions.
F-82
Table of Contents
Knowlton Development Corporation, Inc.
Notes to Unaudited Consolidated Financial Statements (Continued)
Acquisition-related costs and other expenses also include external consultants fees related to follow-up services rendered post-acquisition.
Restructuring expenses are recognized in acquisition-related costs and other expenses when the Company has approved a detailed and formal restructuring plan, and the restructuring either has commenced or has been announced.
Incremental costs directly attributable to an IPO are capitalized and included in prepaid expenses and other current assets in the consolidated balance sheets, and will be charged against the gross offering proceeds in the period of the IPO. Capitalized costs directly attributable to an IPO as of July 31, 2021 and April 30, 2021 amounted to $8.6 and $3.3, respectively. Any IPO preparation-related cost that does not meet the criteria for capitalization is expensed as incurred and included in acquisition-related costs and other expenses.
Derivatives and Hedging Activities
The Company’s derivative financial instruments are included in prepaid expenses and other current assets and are measured at fair value. Changes in the fair value of the derivative instruments designated as cash flow hedging instruments are recorded in other comprehensive income (loss) and are recognized in cost of revenue or selling, general and administrative expenses when the hedged transaction impacts earnings. Cash flows related to derivatives are classified in the same category as the cash flows from the hedged item in the consolidated statements of cash flows. Changes in the fair value of derivative instruments not designated as hedging instruments are reported in current-period earnings within other expense (income), net.
As part of its risk management activities, the Company uses a portion of its euro-denominated debt as a non-derivative instrument to hedge a portion of the Company’s net investment in foreign operations. The foreign exchange gains and losses of the debt designated as a hedging item in a net investment hedge is recognized in accumulated other comprehensive income (loss). When a hedged net investment is disposed of, the cumulative amount recognized in accumulated other comprehensive income (loss) in relation to the hedged net investment is recognized in the consolidated statements of operations as part of the profit or loss on disposal.
Recent Accounting Pronouncements
Accounting pronouncements recently adopted
In December 2019, the FASB issued ASU No. 2019-12, Simplifying the Accounting for Income Taxes, which amends ASC Topic 740, Income Taxes. This ASU simplifies the accounting for income taxes by removing certain exceptions to the general principles in ASC 740 and also clarifies and amends existing guidance to improve consistent application. The new guidance was effective for the Company beginning on May 1, 2021 and did not have a material impact on the Company’s unaudited consolidated financial statements.
Accounting pronouncements not yet adopted
In March 2020, the FASB issued ASU 2020-04, Facilitation of the Effects of Reference Rate Reform on Financial Reporting, which amends ASC Topic 848, Reference Rate Reform. This ASU provides optional expedients and exceptions for applying GAAP to contracts, hedging relationships, and other transactions affected by reference rate reform if certain criteria are met. This new guidance is optional and may be elected over time through December 31, 2022 as reference rate reform activities occur. This new guidance is not expected to have a material impact on the Company’s unaudited consolidated financial statements upon its initial adoption date as
F-83
Table of Contents
Knowlton Development Corporation, Inc.
Notes to Unaudited Consolidated Financial Statements (Continued)
the Company has not made any modifications as a direct consequence of the LIBOR reform to date. The interest rates on the Company’s Terms Loans (as defined in Note 8, Debt) are based on LIBOR for borrowings in U.S dollars. The Company’s Revolving Facility (as defined in Note 8, Debt) is based on LIBOR for borrowings in U.S. dollars. As such, substantially all the Company’s long-term debt is subject to global reference rate reform. The Company’s Term Loans are based on EURIBOR for borrowings in euros, and the EURIBOR is not expected to be discontinued as part of the reference rate reform. The above debt agreements have fallback clauses to the alternate base rate (“ABR”) as defined in the credit agreement. However, the Company, its lenders, and its counterparties are expected to negotiate the substitution of reference rates (such as the Secured Overnight Funding Rate, or “SOFR”) for the calculation of interest rates under the Term Loans and the Revolving Facility in the upcoming months. It is too early to determine if any upcoming potential modifications will meet the requirements for the application of the practical expedient. The Company also references LIBOR in certain derivative instruments. It is also too early to determine how the substitution of reference rates will affect the Company’s future financing expenses.
| 2 | Revenue |
The Company’s principal sources of revenue are derived from value-added manufacturing solutions for the beauty, personal care and home care industries destined for the mass, prestige and emerging markets.
The Company determines revenue recognition through the following steps:
| • | identification of the contract, or contracts, with a customer; |
| • | identification of the performance obligations in the contract; |
| • | determination of the transaction price; |
| • | allocation of the transaction price to the performance obligations in the contract; and |
| • | recognition of revenue when, or as, the Company satisfies a performance obligation. |
The Company has established that a contract is usually a purchase order or a schedule of future minimum order quantities received from the customer, in combination with a master sales agreement when the agreement exists. The Company’s contracts principally consist of a single performance obligation related to the sale of finished goods.
The Company recognizes revenue at a point in time when it transfers control of the finished goods to the customer, which is generally at the shipping point. Under certain customer contracts, the Company completes the production of finished goods and then holds such inventory until the customer requests shipment. For these items, the Company has the contractual right to receive payment once the production is completed, at which point control transfers to the customer and the Company recognizes revenue.
The Company evaluates contracts with customers for which it provides custom products to determine whether a legally enforceable right to payment exists as performance is completed, including a reasonable profit margin, in which case revenue should be recognized over time rather than at a point in time. For the three months ended July 31, 2021 and 2020, no contract met the criteria for recognition over time because a right to payment, including a reasonable profit margin, did not exist until the Company’s performance under the contract was completed.
Payment terms are short-term in nature and are generally less than one year. In addition, if the good is transferred and payment is received within one year, the Company does not determine significant financing components.
F-84
Table of Contents
Knowlton Development Corporation, Inc.
Notes to Unaudited Consolidated Financial Statements (Continued)
Revenue from the sale of finished goods is recognized at the fair value of the amount received or expected to be received, less discounts, rebates and returns. Discounts and rebates are estimated using the most likely amount method. Given the nature of the products sold by the Company, returns are not material to the Company’s unaudited consolidated financial statements. The Company’s revenue is generated through (i) arrangements in which raw materials are either provided by or on behalf of the customer, or costs are passed through to the customer, and (ii) purchase orders that sometimes serve as a de facto pass-through mechanism for variations in raw material price changes. Under both of these agreements, the Company has limited exposure to raw material price changes. The Company is a principal and recognizes revenue on a gross basis for its contracts with customers because it controls the goods before they are transferred to the customers, as it is primarily responsible for fulfilling the promise to provide the goods to the customer and it has inventory risk before the goods have been transferred to the customer. For certain arrangements where the raw materials are provided by the customer at no cost, there is no cost of revenue or revenue recognized related to raw materials. Sales taxes and value added taxes in foreign jurisdictions that are collected from customers and remitted to governmental authorities are accounted for on a net basis and therefore are excluded from revenue.
Deferred revenue
The Company had deferred revenue in the amount of $47.2 and $35.6 as of July 31, 2021 and April 30, 2021, respectively. Such deferred revenue relates primarily to advance consideration received from customers in some contracts to support the acquisition, setting up and maintenance of certain equipment or production lines to be used for providing the customer with finished goods. It was determined these promised goods and services were significantly integrated with the finished goods and, therefore, are considered to be a single performance obligation. These contracts were also evaluated to determine whether they contain a material right that the customer would not have received without entering into the contract. These contracts can be cancelled at any time by the customer. For a certain period of time, the customer may have the option to purchase the related equipment at a price equal to the unamortized advance consideration received at the date the purchase option is exercised, as calculated in accordance with the contract. Deferred revenue is also created when the Company receives consideration from a customer prior to transferring goods to the customer. Deferred revenue, including any material rights accounted for as a distinct performance obligation, is recognized as revenue on the basis of units shipped to the customer.
For the three months ended July 31, 2021 and 2020, revenue recognized during the period that was included in the contract liability at the beginning of the period amounted to $7.7 and $4.6, respectively.
The Company applies the practical expedient as per ASC 606-10-50-14 and does not disclose information related to remaining performance obligations due to their original expected durations being one year or less.
Costs to obtain a contract
The Company generally expenses sales commissions as incurred, because either the amortization period would be one year or less, or the balance with an amortization period greater than one year is not material.
F-85
Table of Contents
Knowlton Development Corporation, Inc.
Notes to Unaudited Consolidated Financial Statements (Continued)
Disaggregation of revenue
The following table presents the Company’s revenue by principal categories of similar products for the periods presented:
| Three Months Ended July 31, |
||||||||
| 2021 | 2020 | |||||||
| Personal Care |
$ | 291.5 | $ | 230.0 | ||||
| Cosmetics and Fragrance |
93.0 | 62.0 | ||||||
| Air Care |
131.0 | 111.0 | ||||||
| Home, Pest and Auto Care |
87.9 | 79.4 | ||||||
|
|
|
|
|
|||||
| Total |
$ | 603.4 | $ | 482.4 | ||||
|
|
|
|
|
|||||
Certain revenue in these categories are generated by both segments.
See Note 19, Segment Data and Related Information, for revenue disaggregated by geographic region.
| 3 | Business Combinations |
On May 3, 2021, the Company acquired 100% of the issued and outstanding shares of each of Geng Xian Metal Treatment (Jiangmen) Company Limited (“JiangmenCo”), a company established under the laws of the People’s Republic of China (“PRC”) and Yaochang Metal Works (Zhuhai) Company Limited (“ZhuhaiCo”), a company established under the laws of the PRC. This agreement was executed on terms varying from the Call Option Deed described in Note 15, Related Party Transactions. JiangmenCo and ZhuhaiCo collectively operate the business referred to as “HCT Metals”. ZhuhaiCo (and its predecessor entity) operates a metal injection molding business and is a supplier of components to JiangmenCo. JiangmenCo operates an electroplating business and is a supplier to HCT. The transaction will allow HCT to in-source and control key injection molding and electroplating capabilities, thereby allowing it to reduce supplier risks.
The acquisition was accounted for under the acquisition method in accordance with ASC 805 Business combinations. The consideration transferred is detailed in the table below:
| As of May 3, 2021 | ||||
| Cash disbursed |
$ | 10.3 | ||
| Less: cash acquired |
(0.8 | ) | ||
|
|
|
|||
| Cash consideration, net of cash acquired |
9.5 | |||
| Deferred consideration |
1.4 | |||
| Post-closing consideration adjustment |
(0.7 | ) | ||
|
|
|
|||
| Total consideration transferred |
$ | 10.2 | ||
|
|
|
|||
F-86
Table of Contents
Knowlton Development Corporation, Inc.
Notes to Unaudited Consolidated Financial Statements (Continued)
The following table summarizes the preliminary estimate of the fair values of assets acquired and liabilities assumed at the closing date:
| As of May 3, 2021 | ||||
| Current assets |
$ | 1.4 | ||
| Inventories |
3.2 | |||
| Property, plant and equipment |
1.9 | |||
| Operating lease right-of-use assets |
1.2 | |||
|
|
|
|||
| Total assets |
$ | 7.7 | ||
|
|
|
|||
| Current liabilities |
$ | 1.4 | ||
| Operating lease liabilities |
1.2 | |||
|
|
|
|||
| Total liabilities |
$ | 2.6 | ||
|
|
|
|||
| Net identifiable assets acquired |
5.1 | |||
| Less: cash acquired |
(0.8 | ) | ||
| Goodwill |
5.9 | |||
|
|
|
|||
| Total consideration transferred |
$ | 10.2 | ||
|
|
|
|||
Goodwill, which is mainly attributable to the expected synergies from integration of the activities, was allocated to the Beauty and Personal Care segment and is not expected to be deductible for income tax purposes.
Transaction costs incurred as a result of the acquisition of $0.1 are included in acquisition-related costs and other expenses.
The operating results of HCT Metals have been included in the Company’s consolidated statements of operations since the acquisition date. Actual and pro forma revenue and results of operations for the acquisition have not been presented because they do not have a material impact to the consolidated revenue and results of operations.
During the measurement period ending no later than one year after the acquisition date, the Company will continue to obtain information to assist in finalizing the fair values of the net assets acquired, which may differ materially from these preliminary estimates. The amounts subject to finalization principally includes other intangibles and income taxes. If any measurement period adjustment is material, the Company will record such adjustment in the reporting period in which the adjustment is determined. The Company expects to finalize its allocation over the next several months, but, in any event, within one year from the closing.
The Company had no acquisitions in the year ended April 30, 2021.
| 4 | Inventories |
| July 31, 2021 | April 30, 2021 | |||||||
| Raw and consumable materials |
$ | 198.1 | $ | 181.2 | ||||
| Work in process |
37.2 | 34.6 | ||||||
| Finished goods |
55.2 | 49.3 | ||||||
|
|
|
|
|
|||||
| Total |
$ | 290.5 | $ | 265.1 | ||||
|
|
|
|
|
|||||
F-87
Table of Contents
Knowlton Development Corporation, Inc.
Notes to Unaudited Consolidated Financial Statements (Continued)
| 5 | Property, Plant and Equipment, Net |
As of July 31, 2021 and April 30, 2021, the Company’s property, plant and equipment balances consisted of the following:
| July 31, 2021 | April 30, 2021 | |||||||
| Land |
$ | 47.7 | $ | 48.3 | ||||
| Buildings |
99.8 | 100.0 | ||||||
| Machinery and equipment |
362.7 | 344.5 | ||||||
| Computer equipment |
13.0 | 12.6 | ||||||
| Furniture and fixtures |
9.6 | 9.3 | ||||||
| Leasehold improvements |
21.1 | 19.7 | ||||||
| Capital projects in progress |
130.6 | 90.9 | ||||||
|
|
|
|
|
|||||
| 684.5 | 625.3 | |||||||
| Accumulated depreciation and amortization |
(120.2 | ) | (105.4 | ) | ||||
|
|
|
|
|
|||||
| $ | 564.3 | $ | 519.9 | |||||
|
|
|
|
|
|||||
The increase in capital projects in progress is mostly explained by (i) a new facility in Columbus, Ohio, where operations began in the second quarter of fiscal year 2022 and (ii) the investment to double our capacity in our manufacturing facility in Texas.
Depreciation and amortization expense on property, plant and equipment for the three months ended July 31, 2021 and 2020 was $16.4 and $16.0, respectively.
No impairment losses were recorded for property, plant and equipment during the periods presented.
F-88
Table of Contents
Knowlton Development Corporation, Inc.
Notes to Unaudited Consolidated Financial Statements (Continued)
| 6 | Other Intangibles, Net |
| July 31, 2021 | ||||||||||||||||
| Gross Value |
Accumulated Amortization |
Net Value | Weighted- Average Estimated Useful Life (In Years) |
|||||||||||||
| Intangible assets with finite useful life: |
||||||||||||||||
| Customer relationships and other |
$ | 858.5 | $ | (96.7 | ) | $ | 761.8 | 17 | ||||||||
| Intellectual property |
406.8 | (60.9 | ) | 345.9 | 15 | |||||||||||
|
|
|
|
|
|
|
|||||||||||
| $ | 1,265.3 | $ | (157.6 | ) | $ | 1,107.7 | ||||||||||
| Intangible assets with indefinite useful life: |
||||||||||||||||
| Trade names |
66.6 | |||||||||||||||
|
|
|
|||||||||||||||
| $ | 1,174.3 | |||||||||||||||
|
|
|
|||||||||||||||
| April 30, 2021 | ||||||||||||||||
| Gross Value |
Accumulated Amortization |
Net Value | Weighted- Average Estimated Useful Life (In Years) |
|||||||||||||
| Intangible assets with finite useful life: |
||||||||||||||||
| Customer relationships and other |
$ | 859.3 | $ | (83.8 | ) | $ | 775.5 | 17 | ||||||||
| Intellectual property |
407.5 | (53.4 | ) | 354.1 | 15 | |||||||||||
|
|
|
|
|
|
|
|||||||||||
| $ | 1,266.8 | $ | (137.2 | ) | $ | 1,129.6 | ||||||||||
| Intangible assets with indefinite useful life: |
||||||||||||||||
| Trade names |
66.9 | |||||||||||||||
|
|
|
|||||||||||||||
| $ | 1,196.5 | |||||||||||||||
|
|
|
|||||||||||||||
The aggregate amortization expense related to intangible assets with finite useful life for the three months ended July 31, 2021 and 2020 was $21.0 and $20.9, respectively.
No impairment losses were recorded for other intangibles during the periods presented.
| 7 | Goodwill |
The following tables presents goodwill by reportable segment:
| Beauty and Personal Care |
Home Care |
Total | ||||||||||
| Balance as of April 30, 2021(1) |
$ | 747.5 | $ | 226.2 | $ | 973.7 | ||||||
| Business acquisition (Note 3) |
5.9 | — | 5.9 | |||||||||
| Foreign currency translation adjustment |
0.1 | (0.3 | ) | (0.2 | ) | |||||||
|
|
|
|
|
|
|
|||||||
| Balance as of July 31, 2021 |
$ | 753.5 | $ | 225.9 | $ | 979.4 | ||||||
|
|
|
|
|
|
|
|||||||
| (1) | Includes accumulated impairment losses of $47.3. |
F-89
Table of Contents
Knowlton Development Corporation, Inc.
Notes to Unaudited Consolidated Financial Statements (Continued)
| 8 | Debt |
| July 31, 2021 |
April 30, 2021 |
|||||||
| Terms Loans due in 2025: |
||||||||
| Principal amount |
$ | 1,569.0 | $ | 1,583.7 | ||||
| Deferred transaction costs |
(31.2 | ) | (33.1 | ) | ||||
| Unamortized issuance discount |
(18.4 | ) | (19.6 | ) | ||||
|
|
|
|
|
|||||
| Total Term Loans due in 2025 |
$ | 1,519.4 | $ | 1,531.0 | ||||
| Borrowings under revolving credit facility due in 2023 |
253.5 | 177.0 | ||||||
| Finance leases |
6.7 | 7.3 | ||||||
| Other borrowings |
4.4 | 4.5 | ||||||
|
|
|
|
|
|||||
| Total long-term debt |
$ | 1,784.0 | $ | 1,719.8 | ||||
| Less: current portion of long-term debt |
17.8 | 18.0 | ||||||
|
|
|
|
|
|||||
| Long-term debt, net of current portion |
$ | 1,766.2 | $ | 1,701.8 | ||||
|
|
|
|
|
|||||
Terms Loans Due in 2025
On December 21, 2018, the Company entered into a credit agreement (the “Credit Agreement”) for a term loan (the “First Lien Term Loan”) in an aggregate principal amount equal to $525.0, which was further increased by $405.0 under the same terms and conditions as the First Lien Term Loan and as a single class of borrowings. The First Lien Term Loan bears interest at LIBOR plus 3.75% (or an alternate base rate plus 2.75%).
On July 28, 2020, the Company entered into a term loan denominated in euros (the “Euro Term Loan” and, together with the First Lien Term Loan, the “Term Loans”) in an aggregate principal amount equal to €460.0 which was further increased by €100.0 under the same terms and conditions as the Term Loans and as a single class of borrowings. The Euro Term Loan bears interest at EURIBOR (subject to a minimum floor of 0%) plus 5%.
As of July 31, 2021 and April 30, 2021, the effective interest rate on the First Lien Term Loan was 4.837% and the effective interest rates on the Euro Term Loan were 5.939% and 5.937%, respectively.
The Term Loans are payable in quarterly installments of $4.0 and mature on December 21, 2025 with a lump-sum payment of $1,501.1. The Term Loans are also subject to annual mandatory prepayments equal to 50% of the Excess Cash Flow of the Company (as defined in the Credit Agreement). The Company has the right at any time and from time to time to prepay the First Lien Term Loan, in whole or in part, without premium or penalty.
The Company’s interest expense is as follows:
| Three Months Ended July 31, |
||||||||
| 2021 | 2020 | |||||||
| Interest on long-term debt |
$ | 19.4 | $ | 15.2 | ||||
| Amortization of transaction costs and issuance discount related to long-term debt |
3.3 | 2.0 | ||||||
| Interest on finance lease liabilities |
0.1 | 0.1 | ||||||
|
|
|
|
|
|||||
| Interest expense |
$ | 22.8 | $ | 17.3 | ||||
|
|
|
|
|
|||||
F-90
Table of Contents
Knowlton Development Corporation, Inc.
Notes to Unaudited Consolidated Financial Statements (Continued)
Revolving Credit Facility Due in 2023
Concurrently with the First Lien Term Loan, the Company entered into a revolving credit facility (“Revolving Facility”) under the Credit Agreement in an original aggregate principal amount of $75.0, which was further increased to a maximum draw of $355.0. Advances under the Revolving Facility bear interest from the date of each advance at the LIBOR or alternate base rate for borrowings in U.S. dollars or at the Canadian prime rate or applicable banker’s acceptance rate for borrowings in Canadian dollars, plus an applicable margin according to the ratio, on a consolidated basis, of the Term Loans and Revolving Facility to Consolidated Adjusted EBITDA (as defined in the Credit Agreement, and which is different from the Adjusted EBITDA used for the purpose of segment data in Note 19, Segment Data and Related Information). The Revolving Facility will mature on December 21, 2023. The Company has the right at any time and from time to time to prepay the amounts due under the Revolving Facility, in whole or in part, without premium or penalty.
As of July 31, 2021, availability under the Revolving Facility was $99.1 net of $253.5 of borrowings and $2.4 of letters of credit outstanding. As of July 31, 2021 and April 30, 2021, the effective interest rates on the Revolving Facility were 3.342% and 3.363%, respectively.
The aggregate principal amount of the Term Loans and Revolving Facility outstanding is secured by a lien on any assets of or property of the Company which lien is pari passu or senior to any other lien otherwise secured.
Under the Term Loans and Revolving Facility, the Company is required to maintain certain financial ratios. As of July 31, 2021, the Company was in compliance with these financial ratios.
Maturities of Long-term Debt
As of July 31, 2021, annual maturities of long-term debt, excluding finance leases and mandatory prepayments based on the Excess Cash Flow of the Company, are as follows:
| Years Ended April 30, |
Long-Term Debt Maturities |
|||
| 2022, remaining |
$ | 12.0 | ||
| 2023 |
16.4 | |||
| 2024 |
269.9 | |||
| 2025 |
16.4 | |||
| 2026 |
1,509.5 | |||
| Thereafter |
2.7 | |||
|
|
|
|||
| Total |
$ | 1,826.9 | ||
| Less: Deferred transaction costs and unamortized issuance discount |
(49.6 | ) | ||
|
|
|
|||
| Total |
$ | 1,777.3 | ||
|
|
|
|||
| 9 | Shareholders’ Equity |
Shareholders’ Equity
Class A common shares are voting, participating, without par value, and without special rights or restrictions attached. Class B common shares are non-voting, participating, without par value and without special rights or restrictions attached.
F-91
Table of Contents
Knowlton Development Corporation, Inc.
Notes to Unaudited Consolidated Financial Statements (Continued)
On May 4, 2020, 363 Class B common shares were issued to a new shareholder for a net amount of $0.4 paid in cash.
On September 16, 2020, 120,000 Class A common shares were issued to existing shareholders for an amount of $150.0 paid in cash. The funds were used to repay the Revolving Facility and to finance operations.
On March 19, 2021, 711 Class B common shares have been issued upon the exercise of stock options pursuant to the Stock Option Plan for an amount of $0.6 paid in cash.
During the year ended April 30, 2021, the Company repurchased 200 Class B common shares for $0.2, of which $0.1 was paid in cash and $0.1 was offset against accounts receivable.
Shares to be Issued
On December 1, 2020, the Company reclassified a deferred consideration of $1.1 from accrued expenses and other payables to shares to be issued. This amount represents the consideration to be paid in form of Class B common shares in connection with the acquisition of Paristy concluded on March 2, 2020. Subject to the terms of the Paristy share purchase agreement, the Company has an obligation to issue 703 Class B common shares in December 2021.
Distribution
On or about February 3, 2021, the Company effected returns of capital in the aggregate amount of $318.5, which were distributed to the Company’s shareholders. Those returns of capital were funded, along with cash, by an increase in borrowings under the Euro Term Loan and the Revolving Facility that took place on January 27, 2021. In connection with the returns of capital, the Company made adjustments in accordance with the equitable adjustment provision of the Stock Option Plan composed of a reduction in the exercise price of previously granted options and payments in cash in respect of such options.
F-92
Table of Contents
Knowlton Development Corporation, Inc.
Notes to Unaudited Consolidated Financial Statements (Continued)
Accumulated Other Comprehensive Income (Loss)
The changes in the components of accumulated other comprehensive income (loss) during the three months ended July 31, 2021 and 2020 were as follows:
| Three Months Ended July 31, 2021 | ||||||||||||||||
| Foreign Currency Translation Adjustments |
Net Investment Hedge |
Cash Flow Hedges |
Total | |||||||||||||
| Balance – As of April 30, 2021 |
$ | 8.5 | $ | (5.8 | ) | $ | 0.3 | $ | 3.0 | |||||||
|
|
|
|
|
|
|
|
|
|||||||||
| Other comprehensive income (loss) before reclassifications |
1.5 | 1.9 | (0.1 | ) | 3.3 | |||||||||||
| Amounts reclassified from accumulated other comprehensive income into net loss |
— | — | (0.2 | ) | (0.2 | ) | ||||||||||
| Income tax benefit |
— | — | 0.1 | 0.1 | ||||||||||||
|
|
|
|
|
|
|
|
|
|||||||||
| Total other comprehensive income (loss), net of income taxes |
1.5 | 1.9 | (0.2 | ) | 3.2 | |||||||||||
|
|
|
|
|
|
|
|
|
|||||||||
| Balance – As of July 31, 2021 |
$ | 10.0 | $ | (3.9 | ) | $ | 0.1 | $ | 6.2 | |||||||
|
|
|
|
|
|
|
|
|
|||||||||
| Three Months Ended July 31, 2020 | ||||||||||||||||
| Foreign Currency Translation Adjustments |
Net Investment Hedge |
Cash Flow Hedges |
Total | |||||||||||||
| Balance – As of April 30, 2020 |
$ | (1.8 | ) | $ | — | $ | 0.4 | $ | (1.4 | ) | ||||||
|
|
|
|
|
|
|
|
|
|||||||||
| Other comprehensive income (loss) before reclassifications |
4.6 | (0.9 | ) | — | 3.7 | |||||||||||
| Amounts reclassified from accumulated other comprehensive income into net loss |
— | — | 0.5 | 0.5 | ||||||||||||
| Income tax benefit |
— | 0.1 | — | 0.1 | ||||||||||||
|
|
|
|
|
|
|
|
|
|||||||||
| Total other comprehensive income (loss), net of income taxes |
4.6 | (0.8 | ) | 0.5 | 4.3 | |||||||||||
|
|
|
|
|
|
|
|
|
|||||||||
| Balance – As of July 31, 2020 |
$ | 2.8 | $ | (0.8 | ) | $ | 0.9 | $ | 2.9 | |||||||
|
|
|
|
|
|
|
|
|
|||||||||
| 10 | Employee Benefits |
Defined Contributions Plans
The Company offers various defined contribution retirement plans to its employees. The Company’s contributions to the plans amounted to $1.5 and $0.3 for the three months ended July 31, 2021 and 2020, respectively.
Defined Benefit Plans
The defined benefit plans have aggregate projected benefit obligations of $4.6 and $4.6, with no funded plan assets, as of July 31, 2021 and April 30, 2021, respectively. Pension expenses incurred for the three months ended July 31, 2021 and 2020 were $0.4 and $0.4, respectively.
F-93
Table of Contents
Knowlton Development Corporation, Inc.
Notes to Unaudited Consolidated Financial Statements (Continued)
Share-based Compensation
On April 26, 2019, the Company adopted a Stock Option Plan (hereafter referred to as the “Stock Option Plan”) to grant options to directors, officers, or employees of the Company and its subsidiaries with options to purchase shares of the Company that are subject to either time-based vesting or performance-based vesting. Under the terms of the plan, the Company has the discretion to issue options for the purchase of up to 127,625 Class B common shares of the Company.
The options have a contractual life of 10 years. As of April 30, 2021, the vesting conditions were as follows:
| • | One third of the options subject to time-based vesting criteria will vest over the first five years after the grant date, subject to accelerated vesting upon a sale of 50% or greater of the Company’s shares; and |
| • | Two thirds of the options are subject to performance-based vesting criteria. 25% will vest in equal percentages on the first and second anniversaries of an IPO. The remaining 75% of the performance-based vesting options will vest upon the Company’s sponsors receiving proceeds for the sale of the Company’s shares, subject to the optionee’s continued service, and the achievement of certain performance goals as measured by the MOIC and the IRR. These performance goals are treated as market conditions. Alternatively, the performance-based vesting options will vest upon a sale of 50% or greater of the Company’s shares, subject to the optionee’s continued service. Vesting of these options is contingent upon the achievement of certain performance goals by the Company’s sponsors as measured by the MOIC and the IRR. |
On May 3, 2021, the Compensation Committee of the Board of Directors approved an amendment to the terms of the options granted under the Stock Option Plan whereby, upon completion of an IPO, all performance-based vesting options under the plan will convert into time-based vesting options and vest over the existing vesting schedule applicable to current time-based vesting options, being straight-line over five years after the grant date. The modification date is July 15, 2021, which is the date the amendment was communicated to the Stock Option Plan participants. This modification to the Stock Option Plan did not result in any incremental compensation cost for the three months ended July 31, 2021 as the achievement of the performance conditions is not currently probable of occurrence. However, the modification did result in a remeasurement of the performance-based vesting options based on the fair value of the awards at the date of modification of $872 per option. The assumptions are summarized in the following table:
| Options modified on July 15, 2021 |
||||
| Share price (in U.S. dollars)(1) |
$ | 1,752 | ||
| Weighted-average exercise price (in U.S. dollars) |
$ | 991 | ||
| Risk-free interest rate (%)(2) |
0.72 | % | ||
| Expected life of stock options (years)(3) |
5.02 | |||
| Expected price volatility of the Company’s shares (%)(4) |
40 | % | ||
| Expected dividends (%)(5) |
0.0 | % | ||
| (1) | Fair value of the common share underlying the share-based grants was estimated using a probability weighted-average of the Company’s 409A report obtained in July 2021 and the preliminary mid-point of an indicative price range of a possible IPO. |
| (2) | The risk-free interest rate is based on the U.S. Treasury strip rate for the expected term of the options. |
| (3) | The expected life reflects management’s best estimate of the exercise date. |
| (4) | Expected volatility was estimated based on historical volatility of comparable publicly traded companies in similar industries over a period equivalent to the expected term of the awards. |
F-94
Table of Contents
Knowlton Development Corporation, Inc.
Notes to Unaudited Consolidated Financial Statements (Continued)
| (5) | Expected dividend yield is 0.0% as the Company has not paid any dividend or distribution to shareholders out of earnings and does not anticipate paying dividends on its common shares for the foreseeable future. |
The following table presents information concerning the outstanding options granted by the Company:
| Number (Units) |
Weighted- Average Exercise Price (In U.S. Dollars) |
Aggregated Intrinsic Value |
Weighted- Average Estimated Useful Life (In Years) |
|||||||||||||
| Outstanding – As of April 30, 2021 |
125,569 | $ | 992 | $ | 32.2 | 9 | ||||||||||
| Granted |
— | |||||||||||||||
| Exercised |
— | |||||||||||||||
| Forfeited |
(2,402 | ) | $ | 1,001 | ||||||||||||
|
|
|
|||||||||||||||
| Outstanding – As of July 31, 2021 |
123,167 | $ | 992 | $ | 93.6 | 9 | ||||||||||
|
|
|
|||||||||||||||
| Vested and exercisable – As of July 31, 2021 |
10,150 | $ | 870 | $ | 9.0 | 8 | ||||||||||
|
|
|
|||||||||||||||
Time-based vesting options
The Company recorded a share-based compensation expense of $1.1 and $0.5 related to time-based vesting options for the three months ended July 31, 2021 and 2020, respectively, in selling, general and administrative expenses. An income tax benefit of $0.2 and $0.0 is recognized in the consolidated statements of operations in relation with the share-based compensation for the three months ended July 31, 2021 and 2020, respectively.
As of July 31, 2021, $11.8 of unrecognized share-based compensation cost related to time-based vesting options granted and not forfeited is expected to be recognized as expense over a weighted-average period of approximately 3.49 years.
Performance-based vesting options
Since the performance targets are not considered probable of being achieved, the Company did not record any expense related to performance-based vesting options for the three months ended July 31, 2021 and 2020.
As of July 31, 2021, $70.8 of unrecognized share-based compensation cost related to performance-based vesting options is expected to be recognized as expense following an IPO, when the performance-based vesting options are converted into time-based vesting options. This unrecognized share-based compensation cost is reflective of the remeasurement of the performance-based vesting options resulting from the July 15, 2021 modification discussed above. An expense will be recognized on the date of the IPO reflecting services that have been provided by the employees from the service inception date until the date of the IPO. The remaining unrecognized compensation cost will be recognized over the remaining service period of approximately 3.49 years.
On May 3, 2021, the Compensation Committee of the Board of Directors approved a grant of long-term equity incentive awards to directors, executive officers and employees. The awards will be in the form of stock options and restricted share units under the new equity compensation plan adopted by the Board of Directors in connection with its IPO, which awards will be issued at the closing of the IPO, based on the issue price of the Company’s common shares in the IPO. The awards will vest on a pro-rata basis, over a three-year service period after the IPO. Total estimated share-based compensation cost associated with these awards is $16.6 and will be recognized over the service period.
F-95
Table of Contents
Knowlton Development Corporation, Inc.
Notes to Unaudited Consolidated Financial Statements (Continued)
| 11 | Acquisition-related Costs and Other Expenses |
The Company’s acquisition-related costs and other expenses are as follows:
| Three Months Ended July 31, | ||||||||
| 2021 | 2020 | |||||||
| Acquisition-related costs (Note 3) |
$ | 0.1 | $ | — | ||||
| External consultants costs |
0.2 | 0.4 | ||||||
| Restructuring expenses |
0.1 | 0.3 | ||||||
| IPO preparation-related costs |
3.3 | 1.3 | ||||||
| Other expenses |
1.0 | 0.3 | ||||||
|
|
|
|
|
|||||
| Total |
$ | 4.7 | $ | 2.3 | ||||
|
|
|
|
|
|||||
| 12 | Income Taxes |
On June 10, 2021, the UK Finance Act 2021 was enacted increasing the UK tax rate from 19% to 25%, effective April 1, 2023. The change resulted in the Company recording an income tax expense of $2.2 for the three months ended July 31, 2021 and a corresponding increase to deferred income tax liability.
Tax contingencies
The Company is subject to regular audits by federal, state, provincial and foreign tax authorities. These audits may result in additional tax liabilities. The Company believes it has appropriately provided for income taxes for all years. Several factors drive the calculation of its tax reserves. Some of these factors include: (i) the expiration of various statutes of limitations (ii) changes in tax law and regulations (iii) issuance of tax rulings and (iv) settlements with tax authorities. Changes in any of these factors may result in adjustments to the Company’s reserves, which would impact its reported financial results.
F-96
Table of Contents
Knowlton Development Corporation, Inc.
Notes to Unaudited Consolidated Financial Statements (Continued)
| 13 | Fair Value |
The following table presents the Company’s hierarchy for its financial assets and liabilities measured at fair value on a recurring basis as of July 31, 2021 and April 30, 2021:
| July 31, 2021 | ||||||||||||||||
| Level 1 | Level 2 | Level 3 | Total | |||||||||||||
| Assets: |
||||||||||||||||
| Foreign exchange forward contracts |
$ | — | $ | 0.1 | $ | — | $ | 0.1 | ||||||||
|
|
|
|
|
|
|
|
|
|||||||||
| Total |
$ | — | $ | 0.1 | $ | — | $ | 0.1 | ||||||||
|
|
|
|
|
|
|
|
|
|||||||||
| Liabilities: |
||||||||||||||||
| Contingent consideration |
$ | — | $ | — | $ | 1.2 | $ | 1.2 | ||||||||
|
|
|
|
|
|
|
|
|
|||||||||
| Total |
$ | — | $ | — | $ | 1.2 | $ | 1.2 | ||||||||
|
|
|
|
|
|
|
|
|
|||||||||
| April 30, 2021 | ||||||||||||||||
| Level 1 | Level 2 | Level 3 | Total | |||||||||||||
| Assets: |
||||||||||||||||
| Foreign exchange forward contracts |
$ | — | $ | 0.3 | $ | — | $ | 0.3 | ||||||||
|
|
|
|
|
|
|
|
|
|||||||||
| Total |
$ | — | $ | 0.3 | $ | — | $ | 0.3 | ||||||||
|
|
|
|
|
|
|
|
|
|||||||||
| Liabilities: |
||||||||||||||||
| Contingent consideration |
$ | — | $ | — | $ | 2.1 | $ | 2.1 | ||||||||
|
|
|
|
|
|
|
|
|
|||||||||
| Total |
$ | — | $ | — | $ | 2.1 | $ | 2.1 | ||||||||
|
|
|
|
|
|
|
|
|
|||||||||
The estimated fair values of the Company’s financial instruments are as follows:
| July 31, 2021 | April 30, 2021 | |||||||||||||||
| Carrying Amount |
Fair Value | Carrying Amount |
Fair Value | |||||||||||||
| Assets: |
||||||||||||||||
| Foreign exchange forward contracts |
$ | 0.1 | $ | 0.1 | $ | 0.3 | $ | 0.3 | ||||||||
| Liabilities: |
||||||||||||||||
| Terms Loans |
$ | 1,519.4 | $ | 1,569.0 | $ | 1,531.0 | $ | 1,583.7 | ||||||||
| Revolving Facility |
$ | 253.5 | $ | 253.5 | $ | 177.0 | $ | 177.0 | ||||||||
| Other borrowings |
$ | 4.4 | $ | 4.4 | $ | 4.5 | $ | 4.5 | ||||||||
| Contingent consideration |
$ | 1.2 | $ | 1.2 | $ | 2.1 | $ | 2.1 | ||||||||
The carrying value approximated the fair value for all of the above assets and liabilities with the exception of Term Loans for which the carrying value and the fair value were different due to the deferred transaction costs and unamortized issuance discount.
The carrying amount of cash and cash equivalents, trade and other receivables, related party receivables, accounts payable, related party payables, and accrued expenses and other payables approximates fair value because of the short-term nature of these instruments.
F-97
Table of Contents
Knowlton Development Corporation, Inc.
Notes to Unaudited Consolidated Financial Statements (Continued)
The fair value of the Company’s debt approximated its nominal amount due to the variable nature of the interest of the debt and the absence of significant change in the Company’s credit spread, as evidenced by recent amendments. The Company’s debt is classified within Level 2 of the valuation hierarchy.
The fair value of the Company’s foreign exchange forward contracts was determined using an industry standard valuation model, which is based on an income approach. The significant observable inputs to the model, such as swap yield curves and currency spot and forward rates, were obtained from an independent pricing service. To determine the fair value of contracts under the model, the difference between the contract price and the current forward rate was discounted using LIBOR for contracts with maturities up to 12 months and was adjusted for credit risk of the Company and counterparty as appropriate. The foreign exchange forward contracts are included within prepaid expenses and other current assets on the Company’s consolidated balance sheets (see Note 14, Financial Instruments).
Contingent consideration consist of potential obligations related to the Company’s acquisitions. The amounts to be paid under these obligations are contingent upon the achievement of stipulated predetermined financial targets by the business subsequent to acquisition. As of July 31, 2021, the fair value of contingent consideration related to certain acquisition earn-outs was based on using a probability weighted, discounted cash settlement valuation technique. Significant changes in the probabilities of meeting contractual performance metrics would result in a significantly higher or lower fair value measurement. As these are unobservable inputs, the Company’s contingent consideration is classified within Level 3 of the valuation hierarchy. As of July 31, 2021, the potential contingent consideration could vary between $0.0 and $15.2 (for the acquisitions of Benchmark and Alkos).
The short-term portion of contingent consideration is included within accrued expenses and other payables and the long-term portion is included within other liabilities in the Company’s consolidated balance sheets.
There were no changes in valuation techniques for these assets and liabilities and there have been no transfers between the levels as of July 31, 2021 and April 30, 2021.
The following tables present a reconciliation of the beginning and ending balance of the Level 3 financial instruments:
| Contingent consideration |
||||
| Balance – As of April 30, 2021 |
$ | 2.1 | ||
| Payments |
(1.0 | ) | ||
| Changes in fair value included in other expense (income), net |
0.1 | |||
|
|
|
|||
| Balance – As of July 31, 2021 |
$ | 1.2 | ||
|
|
|
|||
| Contingent consideration |
||||
| Balance – As of April 30, 2020 |
$ | 4.4 | ||
| Payments |
(2.5 | ) | ||
| Changes in fair value included in other expense (income), net |
0.2 | |||
|
|
|
|||
| Balance – As of July 31, 2020 |
$ | 2.1 | ||
|
|
|
|||
F-98
Table of Contents
Knowlton Development Corporation, Inc.
Notes to Unaudited Consolidated Financial Statements (Continued)
| 14 | Financial Instruments |
Cash Flow Hedges
In order to reduce exposure to cash flows associated with changes in the CAD/USD exchange rates, the Company enters into foreign currency forward contracts. The Company designated these contracts as cash flow hedges of forecasted expenses in Canadian dollars and applied hedge accounting from the designation date. These foreign currency CAD/USD forward contracts have varying maturities through the end of April 2022. The Company had cash flow hedges outstanding with a notional amount totaling $10.1 and $15.9 as of July 31, 2021 and April 30, 2021, respectively. The Company does not hold or issue financial instruments for speculative or trading purposes.
The fair value of the Company’s derivative financial instruments designated as cash flow hedges included in the consolidated balance sheets are presented as follows:
| Balance Sheet Location | July 31, 2021 | April 30, 2021 | ||||||||
| Foreign exchange forward contracts |
Prepaid expenses and other current assets |
$ | 0.1 | $ | 0.3 | |||||
The Company did not hold any derivatives in a liability position as of July 31, 2021 and April 30, 2021.
See Note 9, Shareholders’ Equity, for the changes in accumulated other comprehensive income (loss) related to cash flow hedges.
Net Investment Hedge
In order to reduce exposure to fluctuations in the euro/USD exchange rate on its investments in euro functional currency foreign operations, the Company uses a portion of its euro-denominated debt which is included in long-term debt as a non-derivative hedging item to hedge a portion of the Company’s net investment in foreign operations. The portion of euro-denominated debt designated as net investment hedges had a carrying value of $117.7 and $266.7 as of July 31, 2021 and April 30, 2021, respectively.
See Note 9, Shareholders’ Equity, for the changes in accumulated other comprehensive income (loss) related to net investment hedge.
Derivatives Not Designated as Hedging Instruments
The amount of losses recognized in the consolidated statements of operations and related to the Company’s derivative financial instruments not designated as hedging instruments are presented as follows:
|
Statement of operations location |
Three Months Ended July 31, | |||||||||
| 2021 | 2020 | |||||||||
| Foreign exchange forward contracts |
Other expense (income), net | $ | — | $ | 17.9 | |||||
The loss recognized for the three months ended July 31, 2020 is principally driven by a foreign exchange forward contract entered into in connection with the incremental Euro Term Loan borrowing of €460.0 completed during the first quarter of fiscal year 2021 and used to prepay the incremental term loans of $500.0 entered into on April 30, 2020.
F-99
Table of Contents
Knowlton Development Corporation, Inc.
Notes to Unaudited Consolidated Financial Statements (Continued)
The Company did not hold any derivative financial instrument not designated as hedging instrument as of July 31, 2021.
Credit Risk
Credit risk is the risk of financial loss to the Company if a customer or counterparty to a financial instrument fails to meet its contractual obligations and arises from the Company’s trade accounts receivable, cash and cash equivalents and derivative financial instruments. Credit risk arising from trade accounts receivable is discussed in Note 5, Trade and Other Receivables, Net, of the Company’s annual consolidated financial statements.
Cash and cash equivalents and derivative financial instruments in an asset position expose the Company to credit risk arising from the potential default by counterparties that carry the Company’s cash balances or agree to deliver currencies. The Company attempts to mitigate this risk by dealing only with large financial institutions or counterparties with good credit ratings. The Company believes cash and cash equivalents are not subject to any significant credit risk. Exposure to credit risk in the event of nonperformance by any of the counterparties on derivative financial instruments is limited to the gross fair value of such instruments which totaled $0.1 and $0.3 as of July 31, 2021 and April 30, 2021, respectively.
| 15 | Related Party Transactions |
The following tables present the related party balances and transactions of the Company:
| July 31, 2021 | April 30, 2021 | |||||||
| Balance with related parties are as follows: |
||||||||
| Trade and other receivables |
$ | 0.9 | $ | 0.4 | ||||
| Accounts payable |
$ | 18.5 | $ | 16.3 | ||||
| Accounts payable – acquisition-related costs |
$ | 0.1 | $ | — | ||||
| Accounts payable – sponsor fees |
$ | 4.5 | $ | 3.0 | ||||
| Deferred consideration (Note 3) |
$ | 0.4 | $ | — | ||||
As of July 31, 2021, trade and other receivables include (i) $0.7 ($0.0 as of April 30, 2021) for the post-close consideration adjustment relating to the acquisition of HCT Metals (see Note 3, Business Combinations), (ii) $0.0 ($0.2 as of April 30, 2021) from sales transactions for finished hair care and skin care products concluded with an entity that is controlled by Cornell Capital LLC and (iii) $0.2 ($0.2 as of April 30, 2021) for travel and other expenses receivable from a member of the Company’s Board of Directors.
F-100
Table of Contents
Knowlton Development Corporation, Inc.
Notes to Unaudited Consolidated Financial Statements (Continued)
As of July 31, 2021, accounts payable include (i) $10.7 ($8.5 as of April 30, 2021) payable to entities that are controlled by a member of the immediate family of a member of the Company’s Board of Directors, and whose family member controls one of the Company’s principal shareholders, for purchases of goods and services that include injection-molded plastic and airless dispensing cosmetic components, cosmetic brushes, metal cosmetic applicators and other cosmetic components, quality assurance services, and cosmetic formulation and filling services, (ii) $7.6 ($7.6 as of April 30, 2021) payable to entities that are controlled by a member of the immediate family of a member of the Company’s Board of Directors and whose family member controls one of the Company’s principal shareholders, for tax refunds for pre-acquisition state tax filings and returns, and (iii) $0.2 ($0.2 as of April 30, 2021) payable to one of the Company’s equity method investments, for purchases of cosmetics formulation and filling.
| Three Months Ended July 31, | ||||||||
| 2021 | 2020 | |||||||
| Nature of transactions: |
||||||||
| Revenue |
$ | 0.2 | $ | 0.5 | ||||
| Cost of revenue |
$ | 13.4 | $ | 10.1 | ||||
| Sponsor fees |
$ | 1.7 | $ | 2.0 | ||||
| Acquisition-related costs |
$ | 0.1 | $ | — | ||||
Revenue is derived from sales transactions for finished hair care and skin care products concluded with an entity that is controlled by Cornell Capital LLC.
Cost of revenue includes (i) $11.5 and $9.8 for the three months ended July 31, 2021 and 2020, respectively, for purchases of goods and services that include injection-molded plastic and airless dispensing cosmetic components, cosmetic brushes, metal cosmetic applicators and other cosmetic components, quality assurance services, and cosmetic formulation and filling services, from entities that are controlled by a member of the immediate family of a member of the Company’s Board of Directors, and whose family member controls one of the Company’s principal shareholders, and (ii) $1.9 and $0.3 for the three months ended July 31, 2021 and 2020, respectively, for purchases of cosmetics formulation and filling from one of the Company’s equity method investments.
Sponsor fees and acquisition-related costs were paid to Cornell Capital LLC. The contractual fees paid to Cornell Capital LLC consist of quarterly reimbursements of out-of-pocket expenses incurred by Cornell Capital LLC in connection with the provision of services, a 1% cash fee of the enterprise value of an acquired target by the Company, and a 2.5% annual cash fee based on consolidated Adjusted EBITDA (as defined in the Credit Agreement, and which is different from the Adjusted EBITDA used for the purpose of segment data in Note 19, Segment Data and Related Information) and contains no expiration date. On June 22, 2021, the services agreement with Cornell Capital LLC was amended so that upon the successful completion of an IPO, the services agreement will be terminated in exchange of a fixed fee of $18.0.
In connection with the acquisition of HCT concluded on January 23, 2020, the Company entered into a Call Option Deed on January 23, 2020, whereby the Company has the option to acquire the shares of certain businesses that are controlled by a member of the immediate family of a member of the Company’s Board of Directors, and whose family member controls one of the Company’s principal shareholders. The call option can be exercised at any time on or prior to January 23, 2025 for a consideration equal to the higher of (i) the fair value of the shares acquired; (ii) the investment cost of the seller; and (iii) in connection with the acquisition of HCT Metals, $22.5. The Company acquired HCT Metals on May 3, 2021 (see Note 3, Business Combinations).
F-101
Table of Contents
Knowlton Development Corporation, Inc.
Notes to Unaudited Consolidated Financial Statements (Continued)
| 16 | Commitments and Contingencies |
The Company entered into agreements consisting mainly of non-cancellable commitments for capital expenditures and operating and finance leases for which the lease has been signed but has not commenced. As of July 31, 2021, commitments amounted to $48.7, of which $44.6 is due during fiscal year 2022, $3.3 is due during fiscal years 2023 and 2024, $0.7 is due during fiscal years 2025 and 2026, and $0.1 is due thereafter.
The Company also has commitments related to sponsor fees in future periods (see Note 15, Related Party Transactions).
In the normal course of business, the Company is involved in various legal proceedings and is exposed to potential non-compliance with legal requirements, for which the outcomes, inflow or outflow of economic benefits are uncertain. No material accrual has been recorded in relation to these items. The Company believes that the resolution of these items will not have a material favorable or unfavorable effect on its consolidated balance sheets or consolidated financial performance.
From time to time, the Company enters into certain types of contracts that contingently require the parties to indemnify one another against various categories of claims. The terms of such indemnification obligations vary by contract and in most instances no maximum dollar amount is explicitly stated therein. Amounts which may become due under these indemnification obligations cannot be estimated until a specific claim is asserted. No liabilities have been recorded for these obligations on the Company’s consolidated balance sheets for the periods presented.
| 17 | Net Loss per Share |
For the three months ended July 31, 2021 and 2020, net loss per share was as follows:
| Three Months Ended July 31, | ||||||||
| 2021 | 2020 | |||||||
| Amounts attributable to Knowlton Development Corporation, Inc. (in millions of U.S. dollars, except share and per share data) |
||||||||
| Numerator: |
||||||||
| Net loss |
$ | (12.7 | ) | $ | (0.6 | ) | ||
| Denominator: |
||||||||
| Weighted-average common shares outstanding – Basic |
1,370,427 | 1,249,151 | ||||||
| Effect of outstanding stock options |
— | — | ||||||
|
|
|
|
|
|||||
| Weighted-average common shares outstanding – Diluted |
1,370,427 | 1,249,151 | ||||||
|
|
|
|
|
|||||
| Basic and diluted net loss per common share |
$ | (9.27 | ) | $ | (0.48 | ) | ||
F-102
Table of Contents
Knowlton Development Corporation, Inc.
Notes to Unaudited Consolidated Financial Statements (Continued)
Unaudited Pro Forma Net Loss per Share
Unaudited pro forma basic and diluted net loss per share was calculated as follows, without giving effect to the subdivision of each of the outstanding common shares:
| For the Three Months Ended July 31, 2021 (Unaudited) |
||||
| Numerator: |
||||
| Net loss, as reported |
$ | (12.7 | ) | |
| Interest expense on the repayment of incremental borrowings used to fund the returns of capital, net of tax effect |
2.0 | |||
| Interest expense on the repayment of borrowings outstanding under the Credit Agreement, net of tax effect |
3.6 | |||
|
|
|
|||
| Pro forma net loss |
$ | (7.1 | ) | |
|
|
|
|||
| Denominator: |
||||
| Weighted-average common shares used to compute net loss per share – Basic and diluted |
1,370,427 | |||
| Assumed shares sold in the IPO sufficient to pay the returns of capital |
197,799 | |||
| Assumed shares sold in the IPO used to repay borrowings outstanding under the Credit Agreement |
299,095 | |||
|
|
|
|||
| Total weighted-average common shares used to compute pro forma net loss per share – Basic and diluted |
1,867,321 | |||
|
|
|
|||
| Pro forma basic and diluted net loss per common share |
$ | (3.80 | ) | |
The following potentially dilutive shares were not included in the computation of historical diluted net loss per common share as the effect would have been anti-dilutive due to the net loss incurred in the period:
| Three Months Ended July 31, | ||||||||
| 2021 | 2020 | |||||||
| Number of stock options(1)(2) |
42,047 | 36,854 | ||||||
| (1) | Represents time-based vesting options outstanding as of July 31, 2021 and 2020 that would be included in the computation under the treasury stock method. |
| (2) | In the computation of pro forma diluted net loss per common share, the number of stock options for the three months ended July 31, 2021 would be 123,167 given all performance-based vesting options convert to time-based vesting options upon the completion of an IPO. |
F-103
Table of Contents
Knowlton Development Corporation, Inc.
Notes to Unaudited Consolidated Financial Statements (Continued)
| 18 | Supplemental Cash Flow Information |
Supplemental cash flow information is as follows:
| Three Months Ended July 31, | ||||||||
| 2021 | 2020 | |||||||
| Cash: |
||||||||
| Cash paid for interest |
$ | 19.1 | $ | 13.7 | ||||
| Cash paid for income taxes, net of refunds received |
$ | 2.4 | $ | 2.5 | ||||
| Non-cash Investing Activities: |
||||||||
| Property, plant and equipment accrued but unpaid |
$ | 15.5 | $ | — | ||||
| Deferred consideration payable for business combinations |
$ | 0.4 | $ | — | ||||
| Post-closing consideration adjustment receivable for business combinations |
$ | 0.7 | $ | — | ||||
| 19 | Segment Data and Related Information |
Reportable segments include components of an enterprise about which separate financial information is available that is evaluated regularly by the Company’s Chief Operating Decision Maker (the “CODM”), for the purpose of assessing performance and allocating resources. The Company has two reportable segments: Beauty and Personal Care and Home Care. Beauty and Personal Care includes skin care products, body and hair care products, soaps and sanitizers, cosmetics, deodorants, sun care products and fragrances. Home Care includes air care, fabric care, pest control solutions, surface care products and auto care solutions. These segments have been identified based on the different products sold within each segment. No operating segments have been aggregated to form the reportable segments.
The CODM reviews revenue, capital expenditures, and adjusted EBITDA for each of the reportable segments. Adjusted EBITDA is defined as earnings before interest expense and other expense (income), net, income tax benefit, depreciation and amortization, share-based compensation, acquisition-related costs, costs associated with becoming a public company, certain incremental costs associated with COVID-19 that we do not expect to continue to incur once the COVID-19 pandemic has significantly subsided globally and operations return to pre-COVID-19 levels, plant start-up costs, sponsor fees, impairment loss on right-of-use assets, impairment loss on goodwill and other intangibles and other adjustment items. Total assets by segment is not disclosed as the CODM does not assess performance, make strategic decisions, or allocate resources based on assets.
Corporate operations include costs related to executive compensation, finance, information technology, human resources, legal and other corporate functions. The Company reports these costs as Corporate as they relate to corporate-based responsibilities and decisions, and are not included in the internal measures of segment operating performance used by the Company to measure the underlying performance of the operating segments.
Sales to the Company’s two largest customers represented approximately 21% and 13% of the Company’s revenue, respectively, for the three months ended July 31, 2021 and approximately 19% and 13% of the Company’s revenue, respectively, for the three months ended July 31, 2020. Both segments reported revenue from these customers. No other customer contributed to over 10% of revenues for these periods.
As of July 31, 2021, 59% of the Company’s long-lived assets were located in United States, 12% were located in Italy and 7% were located in Canada. As of April 30, 2021, 56% of the Company’s long-lived assets were located in United States, 13% were located in Italy and 8% were located in Canada. No other foreign country includes more than 10% of the Company’s long-lived assets as of July 31, 2021 and April 30, 2021, respectively.
F-104
Table of Contents
Knowlton Development Corporation, Inc.
Notes to Unaudited Consolidated Financial Statements (Continued)
Revenue by segment is as follows:
| Three Months Ended July 31, | ||||||||
| 2021 | 2020 | |||||||
| Beauty and Personal Care |
$ | 375.8 | $ | 286.3 | ||||
| Home Care |
227.6 | 196.1 | ||||||
|
|
|
|
|
|||||
| Total Revenue |
$ | 603.4 | $ | 482.4 | ||||
|
|
|
|
|
|||||
Revenue by geography is as follows:
| Three Months Ended July 31, | ||||||||
| 2021 | 2020 | |||||||
| United States |
$ | 431.1 | $ | 312.8 | ||||
| Europe, Middle East & Africa |
109.2 | 115.3 | ||||||
| Asia Pacific |
28.8 | 23.3 | ||||||
| Canada |
20.4 | 17.2 | ||||||
| Other(1) |
13.9 | 13.8 | ||||||
|
|
|
|
|
|||||
| Total Revenue |
$ | 603.4 | $ | 482.4 | ||||
|
|
|
|
|
|||||
| (1) | Mostly comprised of revenue to Mexico and South America. |
Revenue by geography is presented based on the shipping destination of the products.
Capital expenditures of the segments are as follows:
| Three Months Ended July 31, | ||||||||
| 2021 | 2020 | |||||||
| Beauty and Personal Care |
$ | 40.5 | $ | 6.7 | ||||
| Home Care |
19.5 | 9.4 | ||||||
| Corporate |
0.8 | 0.2 | ||||||
|
|
|
|
|
|||||
| Total Capital Expenditures |
$ | 60.8 | $ | 16.3 | ||||
|
|
|
|
|
|||||
F-105
Table of Contents
Knowlton Development Corporation, Inc.
Notes to Unaudited Consolidated Financial Statements (Continued)
The following table provides a reconciliation of segment adjusted EBITDA to loss before income taxes:
| Three Months Ended July 31, |
||||||||
| 2021 | 2020 | |||||||
| Segment Adjusted EBITDA |
||||||||
| Beauty and Personal Care |
$ | 35.3 | $ | 33.3 | ||||
| Home Care |
26.0 | 34.0 | ||||||
|
|
|
|
|
|||||
| Total Segment Adjusted EBITDA |
61.3 | 67.3 | ||||||
| Adjusted for the following: |
||||||||
| Corporate costs in the segment’s loss used by the CODM |
(6.6 | ) | (4.2 | ) | ||||
| Interest expense and other expense (income), net |
(19.7 | ) | (20.4 | ) | ||||
| Depreciation and amortization |
(37.4 | ) | (36.9 | ) | ||||
| Share-based compensation |
(1.1 | ) | (0.5 | ) | ||||
| Acquisition-related costs and external consultants costs |
(0.3 | ) | (0.4 | ) | ||||
| IPO preparation-related costs |
(3.3 | ) | (1.3 | ) | ||||
| COVID-related costs |
(1.7 | ) | (4.1 | ) | ||||
| Plant start-up costs(1) |
(2.6 | ) | — | |||||
| Sponsor fees |
(1.7 | ) | (2.0 | ) | ||||
| Other adjustment items(2) |
(2.4 | ) | (2.3 | ) | ||||
|
|
|
|
|
|||||
| Loss before income taxes |
$ | (15.5 | ) | $ | (4.8 | ) | ||
|
|
|
|
|
|||||
| (1) | Includes non-capitalized costs for the Company’s new facility in Columbus before significant operations begin, including payroll and rent. |
| (2) | Includes incremental reorganization and restructuring costs, including severance related payments; litigation and related legal fees; and other incremental non-recurring expenses. |
| 20 | Restricted Net Assets |
The Credit Agreement, which encompasses the First Lien Term Loan and the Revolving Facility as defined in Note 8, Debt, was entered into by kdc/one Development Corporation, Inc. (previously known as Knowlton Development Corporation Inc.) as the Canadian Borrower and KDC US Holdings, Inc. as the US Borrower. Under the terms of the Credit Agreement, as wholly-owned subsidiaries of Knowlton Development Corporation, Inc. (previously known as Knowlton Development Parent, Inc.), the Canadian Borrower and the U.S. Borrower are restricted from making certain dividend payments, loans or advances to Knowlton Development Corporation, Inc. The covenants of the Credit Agreement restrict the payment of dividends to, among other exceptions, (i) a basket for dividends to be paid once thresholds related to specified balances, financial metrics and ratios are satisfied, (ii) dividends in excess of capital contribution amounts, (iii) a basket for unlimited dividends if no event of default exists and the pro forma leverage ratio is less than or equal to 4.00 to 1.00 and (iv) dividends limited to the sum of (a) 6% per annum of proceeds of qualified IPO plus (b) 5% of market capitalization at the time of such qualified IPO.
From its formation through the date the financial statements are available to be issued, Knowlton Development Corporation, Inc. did not receive dividends from its subsidiaries. On February 3, 2021, Knowlton Development Corporation, Inc. received a $318.5 capital distribution from its subsidiaries. This distribution was made in compliance with the terms of the Credit Agreement.
F-106
Table of Contents
Knowlton Development Corporation, Inc.
Notes to Unaudited Consolidated Financial Statements (Continued)
| 21 | Subsequent Events |
The Company has evaluated subsequent events through September 13, 2021, which is the date the financial statements are available to be issued, pursuant to ASC 855-10 Subsequent Events.
In connection with and prior to the consummation of the IPO, the Company will amend and restate its articles to, among other things, alter the identifying name of, and modify the rights and restrictions attached to, the Class A common shares and the Class B common shares so that they will be named and bear the rights and restrictions attached to the common shares (without par value, voting and participating) and authorize an unlimited number of preferred shares, issuable in series. In connection with the closing of the IPO, the Company will also effect a 1-for-115 subdivision of each of the outstanding common shares.
F-107
Table of Contents
Common Shares
Knowlton Development Corporation, Inc.
Preliminary Prospectus
Goldman Sachs & Co. LLC
J.P. Morgan
UBS Investment Bank
BMO Capital Markets
BofA Securities
Guggenheim Securities
Jefferies
Morgan Stanley
RBC Capital Markets
, 2021
Until , 2021, all dealers that buy, sell or trade our common shares, whether or not participating in this offering, may be required to deliver a prospectus. This is in addition to the dealers’ obligation to deliver a prospectus when acting as underwriters and with respect to their unsold allotments or subscriptions.
Table of Contents
Part II
INFORMATION NOT REQUIRED IN THE PROSPECTUS
Item 13. Other Expenses of Issuance and Distribution
| Amount to be Paid |
||||
| SEC registration fee |
$ | 107,542 | ||
| Canadian securities regulatory filings fees |
17,156 | |||
| FINRA filing fee |
148,357 | |||
| NYSE filing fee |
85,000 | |||
| TSX filing fee |
165,449 | |||
| Transfer agent’s fees |
7,500 | |||
| Printing and engraving expenses |
1,500,000 | |||
| Legal fees and expenses |
7,000,000 | |||
| Accounting fees and expenses |
3,528,372 | |||
| Miscellaneous |
440,624 | |||
|
|
|
|||
| Total |
$ | 13,000,000 | ||
|
|
|
|||
Each of the amounts set forth above, other than the SEC registration fee, the FINRA filing fee and the NYSE listing fee, is an estimate.
Item 14. Indemnification of Directors and Officers
The Business Corporations Act (British Columbia) (the “BCBCA”) provides that a company may indemnify (i) a current or former director or officer of that company; (ii) a current or former director or officer of another company if, at the time such individual held such office, such company was an affiliate of the company, or if such individual held such office at the company’s request; or (iii) an individual who, at the request of the company, held, or holds, an equivalent position in another entity (an “indemnifiable person”) against all judgments, penalties or fines, or amounts paid to settle a proceeding or an action, in respect of any civil, criminal, administrative or other legal proceeding or investigative action (whether current, threatened, pending or completed) in which he or she is involved because of that person’s position as an indemnifiable person (an “eligible proceeding”), unless: (i) the individual did not act honestly and in good faith with a view to the best interests of such company or the other entity, as the case may be; or (ii) in the case of a proceeding other than a civil proceeding, the individual did not have reasonable grounds for believing that the individual’s conduct in respect of which proceeding was brought was lawful. A company cannot indemnify an indemnifiable person if it is prohibited from doing so under its articles or by applicable law. A company may pay, as they are incurred in advance of the final disposition of an eligible proceeding, the expenses actually and reasonably incurred by an indemnifiable person in respect of that proceeding, but only if the indemnifiable person has provided an undertaking that, if it is ultimately determined that the payment of expenses was prohibited, the indemnifiable person will repay any amounts advanced. Subject to the aforementioned prohibitions on indemnification, a company must, after the final disposition of an eligible proceeding, pay the expenses actually and reasonably incurred by an indemnifiable person in respect of such eligible proceeding if such indemnifiable person has not been reimbursed for such expenses, and was wholly successful, on the merits or otherwise, in the outcome of such eligible proceeding or was substantially successful on the merits in the outcome of such eligible proceeding. On application of an indemnifiable person or us, a court may make any order the court considers appropriate in respect of an eligible proceeding, including the indemnification of penalties imposed or expenses incurred in any such proceedings and the enforcement of an indemnification agreement.
II-1
Table of Contents
As permitted by the BCBCA, the Registrant’s articles require the Registrant to indemnify its directors, officers, former directors or officers (and such individual’s respective heirs and legal representatives) and permit it to indemnify any person to the extent permitted by the BCBCA.
The Registrant has entered into indemnification agreements with each of its current directors and executive officers to provide these directors and executive officers additional contractual assurances regarding the scope of the indemnification set forth in the Registrant’s articles and to provide additional procedural protections. There is no pending litigation or proceeding involving a director or executive officer of the Registrant for which indemnification is sought.
The Registrant maintains standard policies of insurance under which coverage is provided (a) to its directors and officers against loss rising from claims made by reason of breach of duty or other wrongful act, and (b) to the Registrant with respect to payments which may be made by the Registrant to such officers and directors pursuant to the above indemnification provisions or otherwise as a matter of law.
The proposed form of underwriting agreement filed as Exhibit 1.1 to this registration statement provides for indemnification of directors and officers of the Registrant by the underwriters against certain liabilities.
Item 15. Recent Sales of Unregistered Securities
The following list sets forth information regarding all securities sold or issued by the Registrant and any predecessors, in the three years preceding the date of this registration statement. No underwriters were involved in these sales. There was no general solicitation of investors or advertising, and we did not pay or give, directly or indirectly, any commission or other remuneration, in connection with the offering of these shares. In each of the transactions described below, the recipients of the securities represented their intention to acquire the securities for investment only and not with a view to or for sale in connection with any distribution thereof, and appropriate legends were affixed to the securities issued in these transactions.
(a) Issuances of Share Capital
From November 30, 2018 to July 31, 2021, we issued (i) 733,001 Class A common shares and 6,350 Class B common shares as part of our December 2018 financing round, at a purchase price of $1,000 per share for an aggregate of $739,350,000; (ii) 428,182 Class A common shares and 9,317 Class B common shares as part of our January 2020 financing round, at a purchase price of $1,100 per share for an aggregate of $481,248,900; (iii) 72,000 Class A common shares as part of our April 2020 financing round, at a purchase price of $1,250 per share for an aggregate of $90,000,000; (iv) 363 Class B common shares as part of our May 2020 financing round at a purchase price of $1,100 for an aggregate of $399,300; and (v) 120,000 Class A common shares as part of our September 2020 financing round, at a purchase price of $1,250 per share for an aggregate of $150,000,000.
(b) Stock Option Grants and Option Exercises
From November 30, 2018 to July 31, 2021, we granted options to purchase an aggregate of 146,073 shares, at a weighted-average exercise price of $1,149 per share, to employees pursuant to our Stock Option Plan. Through July 31, 2021, 711 shares have been issued upon the exercise of stock options pursuant to the Stock Option Plan.
The offers, sales and issuances of the securities described in (a) and (b) above were deemed to be exempt from registration under the Securities Act of 1933 in reliance upon Section 4(a)(2) of the Securities Act as transactions by an issuer not involving any public offering. The recipients in each of these transactions acquired the securities for investment only and not with a view to or for sale in connection with any distribution thereof.
II-2
Table of Contents
Item 16. Exhibits and Financial Statement Schedules
(a) The following exhibits are filed as part of this Registration Statement:
Exhibit index
II-3
Table of Contents
II-4
Table of Contents
| * | Previously filed. |
(b) No financial statement schedules are provided because the information called for is not required or is shown either in the financial statements or the notes hereto.
Item 17. Undertakings
The undersigned Registrant hereby undertakes:
(1) The undersigned Registrant hereby undertakes to provide to the underwriters at the closing specified in the underwriting agreement certificates in such denominations and registered in such names as required by the underwriters to permit prompt delivery to each purchaser.
(2) Insofar as indemnification for liabilities arising under the Securities Act of 1933 may be permitted to directors, officers and controlling persons of the Registrant pursuant to the provisions referenced in Item 14 of this registration statement, or otherwise, the Registrant has been advised that in the opinion of the Securities and Exchange Commission such indemnification is against public policy as expressed in the Securities Act of 1933 and is, therefore, unenforceable. In the event that a claim for indemnification against such liabilities (other than the payment by the Registrant of expenses incurred or paid by a director, officer, or controlling person of the Registrant in the successful defense of any action, suit or proceeding) is asserted by such director, officer or controlling person in connection with the securities being registered hereunder, the Registrant will, unless in the opinion of its counsel the matter has been settled by controlling precedent, submit to a court of appropriate jurisdiction the question of whether such indemnification by it is against public policy as expressed in the Securities Act of 1933 and will be governed by the final adjudication of such issue.
II-5
Table of Contents
(3) The undersigned Registrant hereby undertakes that:
(a) for purposes of determining any liability under the Securities Act of 1933, the information omitted from the form of prospectus filed as part of this registration statement in reliance upon Rule 430A and contained in a form of prospectus filed by the Registrant pursuant to Rule 424(b)(1) or (4) or 497(h) under the Securities Act of 1933 shall be deemed to be part of this registration statement as of the time it was declared effective.
(b) for the purpose of determining any liability under the Securities Act of 1933, each post-effective amendment that contains a form of prospectus shall be deemed to be a new registration statement relating to the securities offered therein, and the offering of such securities at that time shall be deemed to be the initial bona fide offering thereof.
II-6
Table of Contents
Pursuant to the requirements of the Securities Act of 1933, the Registrant has duly caused this registration statement to be signed on its behalf by the undersigned, thereunto duly authorized, in Longueuil, Québec, on the 14th day of September, 2021.
| Knowlton Development Corporation, Inc.
| ||||
| By: | /s/ Nicholas Whitley | |||
| Name: | Nicholas Whitley | |||
| Title: | Chief Executive Officer | |||
Pursuant to the requirements of the Securities Act of 1933, as amended, this registration statement has been signed by the following persons in the capacities and on the dates indicated:
| Signature |
Title |
Date | ||
| /s/ Nicholas Whitley |
Chief Executive Officer (Principal Executive Officer) |
September 14, 2021 | ||
| Nicholas Whitley | ||||
| * |
Chief Financial Officer (Principal Financial Officer) |
September 14, 2021 | ||
| Gregg Kam | ||||
| * |
Chief Accounting Officer (Principal Accounting Officer) |
September 14, 2021 | ||
| Robert Grecco | ||||
| * |
Director | September 14, 2021 | ||
| Jacques Bougie | ||||
| * |
Director |
September 14, 2021 | ||
| Kevin Chance | ||||
| * |
Director and Chair of the Board |
September 14, 2021 | ||
| Justine Cheng | ||||
| * |
Director |
September 14, 2021 | ||
| Joanna Coles | ||||
| * |
Director |
September 14, 2021 | ||
| Marie Josée Lamothe | ||||
| * |
Director | September 14, 2021 | ||
| Steven Lin | ||||
| * |
Director |
September 14, 2021 | ||
| Pierre Pirard | ||||
| * |
Director |
September 14, 2021 | ||
| Valarie Sheppard | ||||
| * |
Director |
September 14, 2021 | ||
| Timothy Thorpe | ||||
| * |
Director |
September 14, 2021 | ||
| Stephen Trevor | ||||
| * By:
|
/s/ Nicholas Whitley
| |
|
Attorney-in-Fact |
II-7