Attached files
| file | filename |
|---|---|
| EX-99.1 - EX-99.1 - Core & Main, Inc. | q22021earningspressrelease.htm |
| 8-K - 8-K - Core & Main, Inc. | cnm-20210914.htm |

Fiscal 2021 Second Quarter Financial Results
© Core & Main All Rights Reserved. Confidential and Proprietary Information. Cautionary Statements 2 Cautionary Note Regarding Forward-Looking Statements This presentation and accompanying discussion may include “forward-looking statements” within the meaning of the Private Securities Litigation Reform Act of 1995. Some of the forward-looking statements can be identified by the use of forward-looking terms such as “believes,” “expects,” “may,” “will,” “shall,” “should,” “would,” “could,” “seeks,” “aims,” “projects,” “is optimistic,” “intends,” “plans,” “estimates,” “anticipates” or the negative versions of these words or other comparable terms. Forward-looking statements include, without limitation, all matters that are not historical facts. They include, without limitation, statements regarding our intentions, beliefs, assumptions or current expectations concerning, among other things, our financial position, results of operations, cash flows, prospects and growth strategies. Forward-looking statements are subject to known and unknown risks and uncertainties, many of which may be outside our control. We caution you that forward-looking statements are not guarantees of future performance or outcomes and that actual performance and outcomes, including, without limitation, our actual results of operations, financial condition and liquidity, and the development of the market in which we operate, may differ materially from those made in or suggested by the forward-looking statements contained in this presentation. In addition, even if our results of operations, financial condition and cash flows, and the development of the market in which we operate, are consistent with the forward-looking statements contained in this presentation, those results or developments may not be indicative of results or developments in subsequent periods. Furthermore, new risks and uncertainties emerge from time to time, and it is not possible for us to predict all risks and uncertainties that could have an impact on the forward-looking statements contained in this presentation. Factors that could cause actual results and outcomes to differ from those reflected in forward-looking statements include, without limitation: declines, volatility and cyclicality in the U.S. residential and non-residential construction markets; slowdowns in municipal infrastructure spending and delays in appropriations of federal funds; price fluctuations in our product costs, particularly with respect to the commodity-based products that we sell; the spread of, and response to, COVID-19, and the inability to predict the ultimate impact on us; general business and economic conditions; risks involved with acquisitions and other strategic transactions, including our ability to identify, acquire, close or integrate acquisition targets successfully; the impact of seasonality and weather-related impacts, including natural disasters or similar extreme weather events; the fragmented and highly competitive markets in which we compete and consolidation within our industry; our ability to competitively bid for municipal contracts; the development of alternatives to distributors of our products in the supply chain; our ability to hire, engage and retain key personnel, including sales representatives, qualified branch, district and region managers and senior management; our ability to identify, develop and maintain relationships with a sufficient number of qualified suppliers and the potential that our exclusive or restrictive supplier distribution rights are terminated; the availability and cost of freight and energy, such as fuel; the ability of our customers to make payments on credit sales; our ability to identify and introduce new products and product lines effectively; our ability to manage our inventory effectively; costs and potential liabilities or obligations imposed by environmental, health and safety laws and requirements; regulatory change and the costs of compliance with regulation; exposure to product liability, construction defect and warranty claims and other litigation and legal proceedings; potential harm to our reputation; difficulties with or interruptions of our fabrication services; safety and labor risks associated with the distribution of our products as well as work stoppages and other disruptions due to labor disputes; impairment in the carrying value of goodwill, intangible assets or other long-lived assets; the domestic and international political environment with regard to trade relationships and tariffs, as well as difficulty sourcing products as a result of import constraints; our ability to operate our business consistently through highly dispersed locations across the United States; interruptions in the proper functioning of our IT systems, including from cybersecurity threats; risks associated with raising capital; our ability to continue our customer relationships with short-term contracts; changes in vendor rebates or other terms of our vendor agreements; risks associated with exporting our products internationally; our ability to renew or replace our existing leases on favorable terms or at all; our ability to maintain effective internal controls over financial reporting and remediate any material weaknesses; our substantial indebtedness and the potential that we may incur additional indebtedness; the limitations and restrictions in the agreements governing our indebtedness, the Second Amended and Restated Agreement of Limited Partnership of Core & Main Holdings, LP (“Holdings”) and the Tax Receivable Agreements (as defined in the prospectus (File No. 333-256382), dated July 22, 2021, filed with the Securities and Exchange Commission pursuant to Rule 424(b) under the Securities Act of 1933, as amended, on July 26, 2021 (the “Prospectus”)); increases in interest rates and the impact of transitioning from LIBOR as the benchmark rate in contracts; changes in our credit ratings and outlook; our ability to generate the significant amount of cash needed to service our indebtedness; our organizational structure, including our payment obligations under the Tax Receivable Agreements, which may be significant; the significant influence that Clayton, Dubilier & Rice, LLC (“CD&R”) has over us and potential conflicts between the interests of CD&R and other stockholders; and risks related to other factors described under “Risk Factors” in the Prospectus. These factors are not exhaustive, and new factors may emerge or changes to the foregoing factors may occur that could impact our business. Except to the extent required by law, we undertake no obligation to update or revise any forward-looking statements, whether as a result of new information, future events or otherwise, which speak only as of the date of this presentation. Use of Non-GAAP Financial Measures In addition to providing results that are determined in accordance with GAAP, we present EBITDA, Adjusted EBITDA, Adjusted EBITDA margin, Adjusted Net Income and Net Debt Leverage, all of which are non-GAAP financial measures. These measures are not considered measures of financial performance or liquidity under GAAP and the items excluded therefrom are significant components in understanding and assessing our financial performance or liquidity. These measures should not be considered in isolation or as alternatives to GAAP measures such as net income attributable to Core & Main, Inc., cash provided by or used in operating, investing or financing activities or other financial statement data presented in the financial statements as an indicator of our financial performance or liquidity. We use EBITDA, Adjusted EBITDA, Adjusted EBITDA margin, Adjusted Net Income and Net Debt Leverage to assess the operating results and effectiveness and efficiency of our business. We present these non-GAAP financial measures because we believe that investors consider them to be important supplemental measures of performance, and we believe that these measures are frequently used by securities analysts, investors and other interested parties in the evaluation of companies in our industry. Non-GAAP financial measures as reported by us may not be comparable to similarly titled metrics reported by other companies and may not be calculated in the same manner. These measures have limitations as analytical tools, and you should not consider them in isolation or as substitutes for analysis of our results as reported under GAAP. Reconciliations of such non-GAAP measures to the most directly comparable GAAP measure and calculations of the non-GAAP measures are set forth in the appendix of this presentation. No reconciliation of the estimated range for Adjusted EBITDA for fiscal 2021 is included herein because we are unable to quantify certain amounts that would be required to be included in net income attributable to Core & Main, Inc., the most directly comparable GAAP measure, without unreasonable efforts due to the high variability and difficulty to predict certain items excluded from Adjusted EBITDA. Consequently, we believe such reconciliation would imply a degree of precision that would be misleading to investors. In particular, the effects of acquisition expenses and associated taxes cannot be reasonably predicted in light of the inherent difficulty in quantifying such items on a forward-looking basis. We expect the variability of these excluded items may have an unpredictable, and potentially significant, impact on our future GAAP results. Presentation of Financial Information The accompanying unaudited financial information presents the results of operations, financial position and cash flows of Core & Main, Inc. (“Core & Main” or the “Company”) and its subsidiaries, which includes the consolidated financial information of Holdings and its consolidated subsidiary, Core & Main LP, as the legal entity that conducts the operations of the Company. Core & Main is the primary beneficiary and general partner of Holdings and has decision making authority that significantly affects the economic performance of the entity. As a result, Core & Main consolidates the consolidated financial statements of Holdings. All intercompany balances and transactions have been eliminated in consolidation. The Company records non-controlling interests related to Partnership Interests (as defined in the Prospectus) held by the Continuing Limited Partners (as defined in the Prospectus) in Holdings. The Company’s fiscal year is a 52 or 53 week period ending on the Sunday nearest to January 31st. Quarters within the fiscal year include 13-week periods, unless a fiscal year includes a 53rd week, in which case the fourth quarter of the fiscal year will be a 14-week period. Both the three months ended August 1, 2021 and three months ended August 2, 2020 included 13 weeks, and both the six months ended August 1, 2021 and six months ended August 2, 2020 included 26 weeks. The current fiscal year ending January 30, 2022 (“fiscal 2021”) will include 52 weeks.
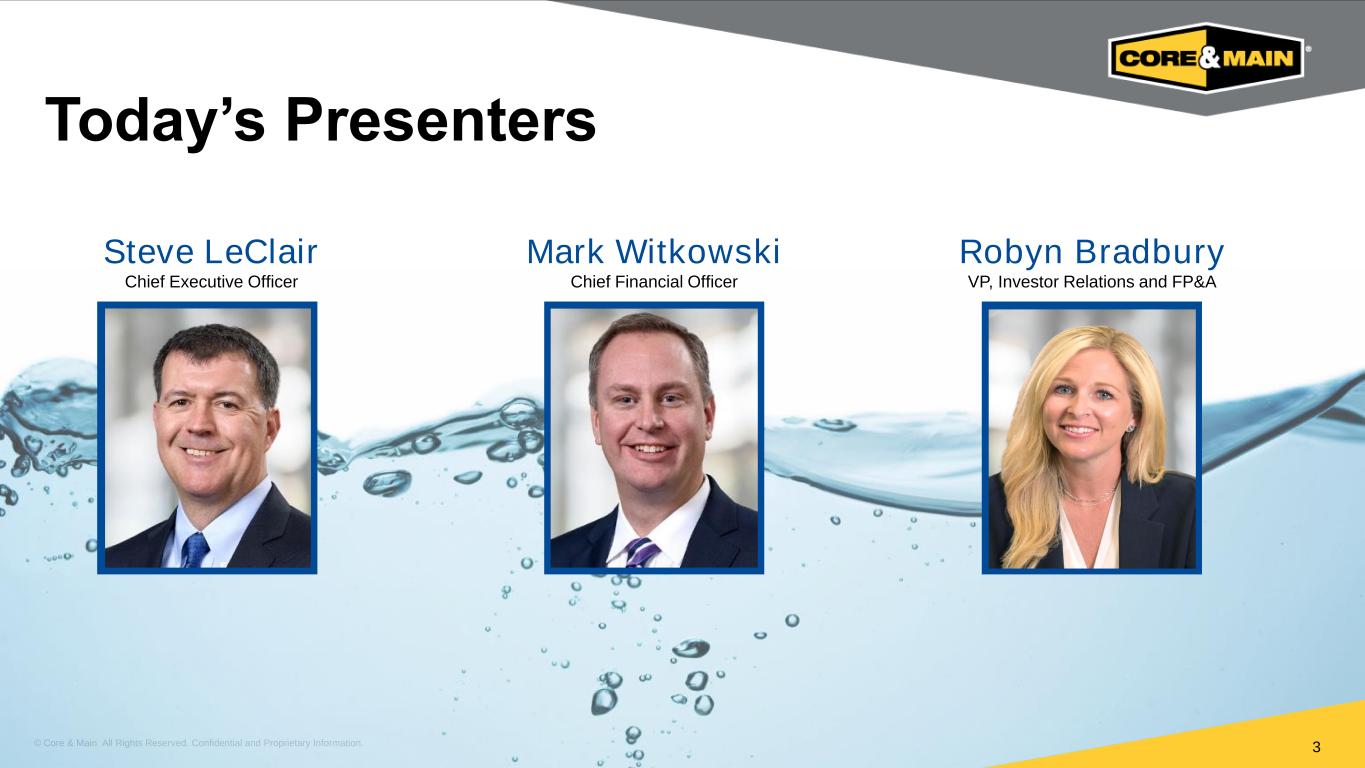
© Core & Main All Rights Reserved. Confidential and Proprietary Information. Today’s Presenters 3 000 Steve LeClair Chief Executive Officer Mark Witkowski Chief Financial Officer Robyn Bradbury VP, Investor Relations and FP&A

© Core & Main All Rights Reserved. Confidential and Proprietary Information. Agenda 4 1 Company Overview & Business Update 2 Financial Highlights 3 Q&A and Closing Remarks
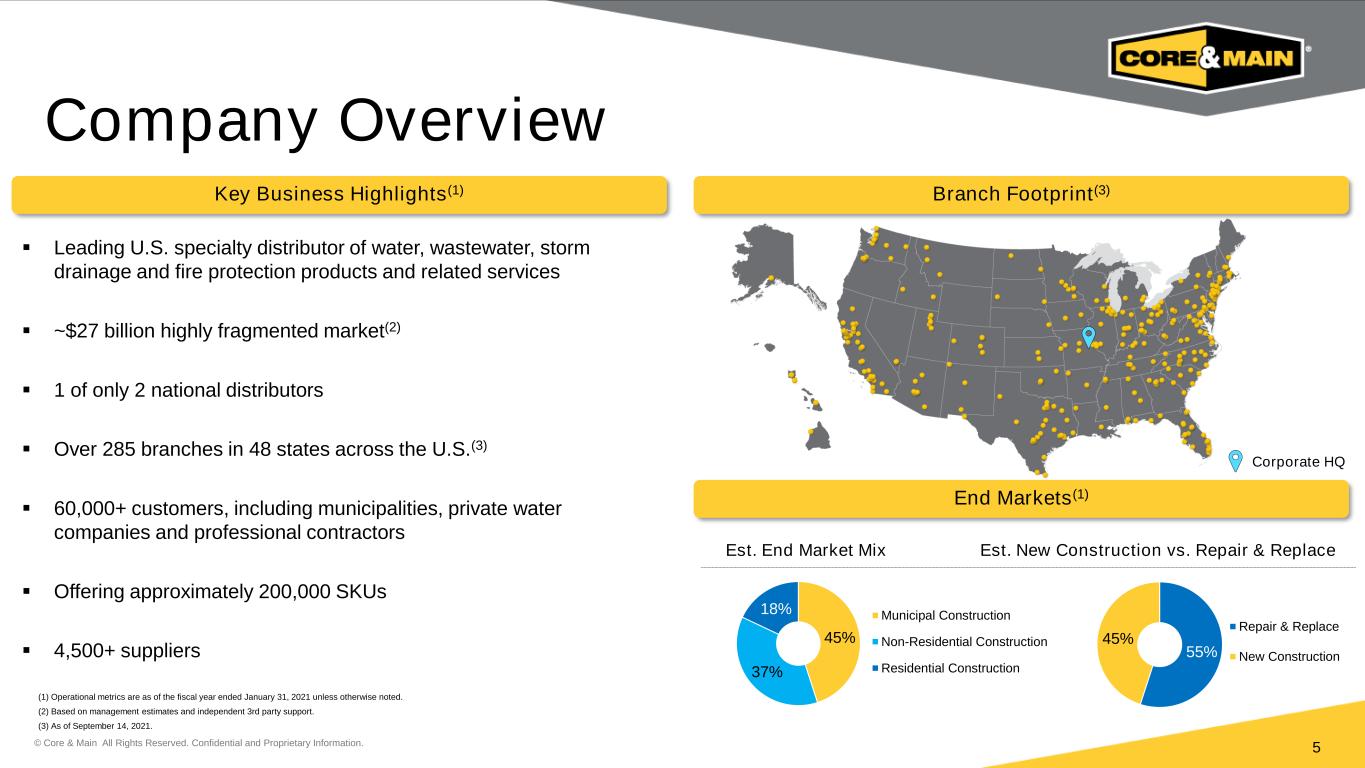
© Core & Main All Rights Reserved. Confidential and Proprietary Information. Company Overview 5 Key Business Highlights(1) Branch Footprint(3) End Markets(1) 45% 37% 18% Municipal Construction Non-Residential Construction Residential Construction 55% 45% Repair & Replace New Construction Est. End Market Mix Est. New Construction vs. Repair & Replace ▪ Leading U.S. specialty distributor of water, wastewater, storm drainage and fire protection products and related services ▪ ~$27 billion highly fragmented market(2) ▪ 1 of only 2 national distributors ▪ Over 285 branches in 48 states across the U.S.(3) ▪ 60,000+ customers, including municipalities, private water companies and professional contractors ▪ Offering approximately 200,000 SKUs ▪ 4,500+ suppliers (1) Operational metrics are as of the fiscal year ended January 31, 2021 unless otherwise noted. (2) Based on management estimates and independent 3rd party support. (3) As of September 14, 2021. Corporate HQ

© Core & Main All Rights Reserved. Confidential and Proprietary Information. Product & Service Offering 6
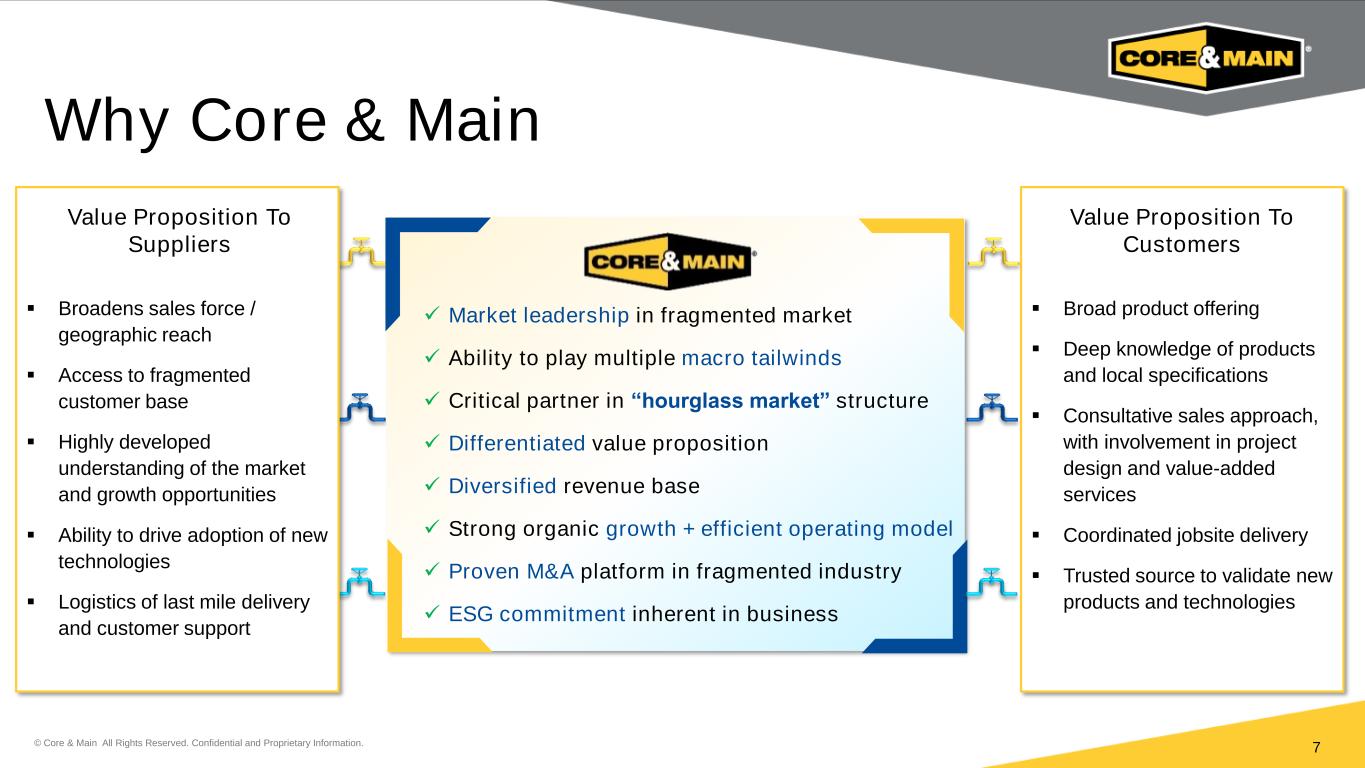
© Core & Main All Rights Reserved. Confidential and Proprietary Information. Why Core & Main 7 Value Proposition To Suppliers ▪ Broadens sales force / geographic reach ▪ Access to fragmented customer base ▪ Highly developed understanding of the market and growth opportunities ▪ Ability to drive adoption of new technologies ▪ Logistics of last mile delivery and customer support Value Proposition To Customers ▪ Broad product offering ▪ Deep knowledge of products and local specifications ▪ Consultative sales approach, with involvement in project design and value-added services ▪ Coordinated jobsite delivery ▪ Trusted source to validate new products and technologies ✓ Market leadership in fragmented market ✓ Ability to play multiple macro tailwinds ✓ Critical partner in “hourglass market” structure ✓ Differentiated value proposition ✓ Diversified revenue base ✓ Strong organic growth + efficient operating model ✓ Proven M&A platform in fragmented industry ✓ ESG commitment inherent in business
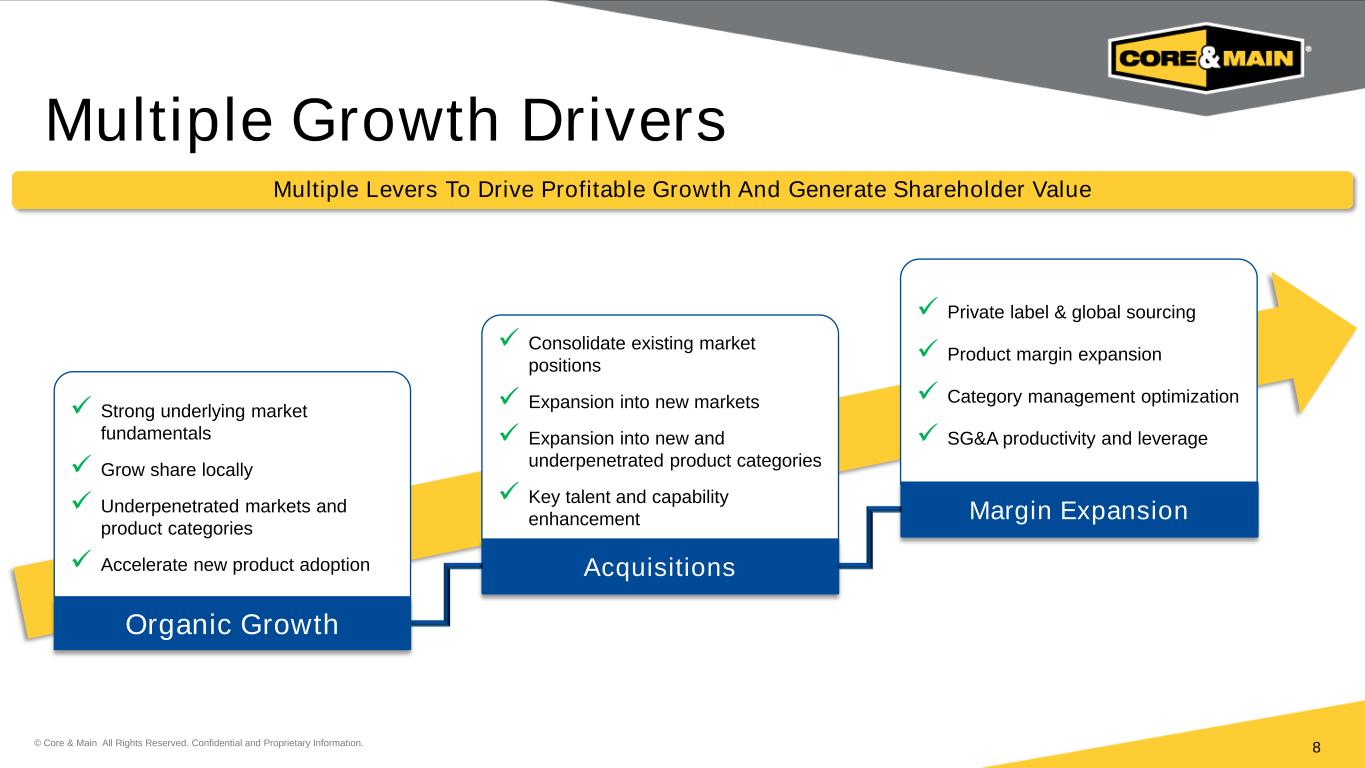
© Core & Main All Rights Reserved. Confidential and Proprietary Information. Multiple Growth Drivers 8 Multiple Levers To Drive Profitable Growth And Generate Shareholder Value ✓ Strong underlying market fundamentals ✓ Grow share locally ✓ Underpenetrated markets and product categories ✓ Accelerate new product adoption ✓ Consolidate existing market positions ✓ Expansion into new markets ✓ Expansion into new and underpenetrated product categories ✓ Key talent and capability enhancement Acquisitions ✓ Private label & global sourcing ✓ Product margin expansion ✓ Category management optimization ✓ SG&A productivity and leverage Margin Expansion Organic Growth
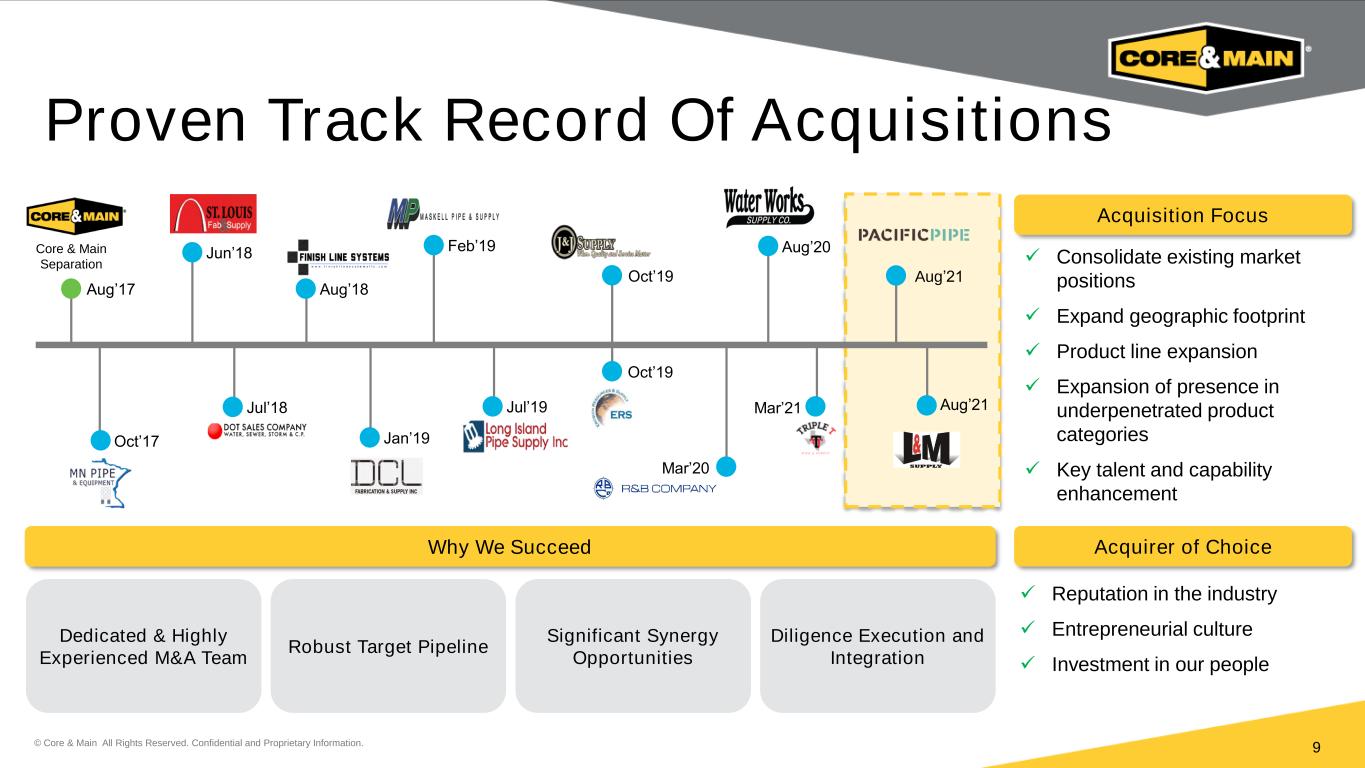
© Core & Main All Rights Reserved. Confidential and Proprietary Information. Proven Track Record Of Acquisitions 9 Dedicated & Highly Experienced M&A Team Aug’17 Core & Main Separation Oct’17 Jun’18 Jul’18 Aug’18 Jan’19 Feb’19 Jul’19 Oct’19 Oct’19 Mar’20 Aug’20 Why We Succeed Robust Target Pipeline Acquirer of Choice ✓ Reputation in the industry ✓ Entrepreneurial culture ✓ Investment in our people Mar’21 Aug’21 Aug’21 Significant Synergy Opportunities Diligence Execution and Integration Acquisition Focus ✓ Consolidate existing market positions ✓ Expand geographic footprint ✓ Product line expansion ✓ Expansion of presence in underpenetrated product categories ✓ Key talent and capability enhancement
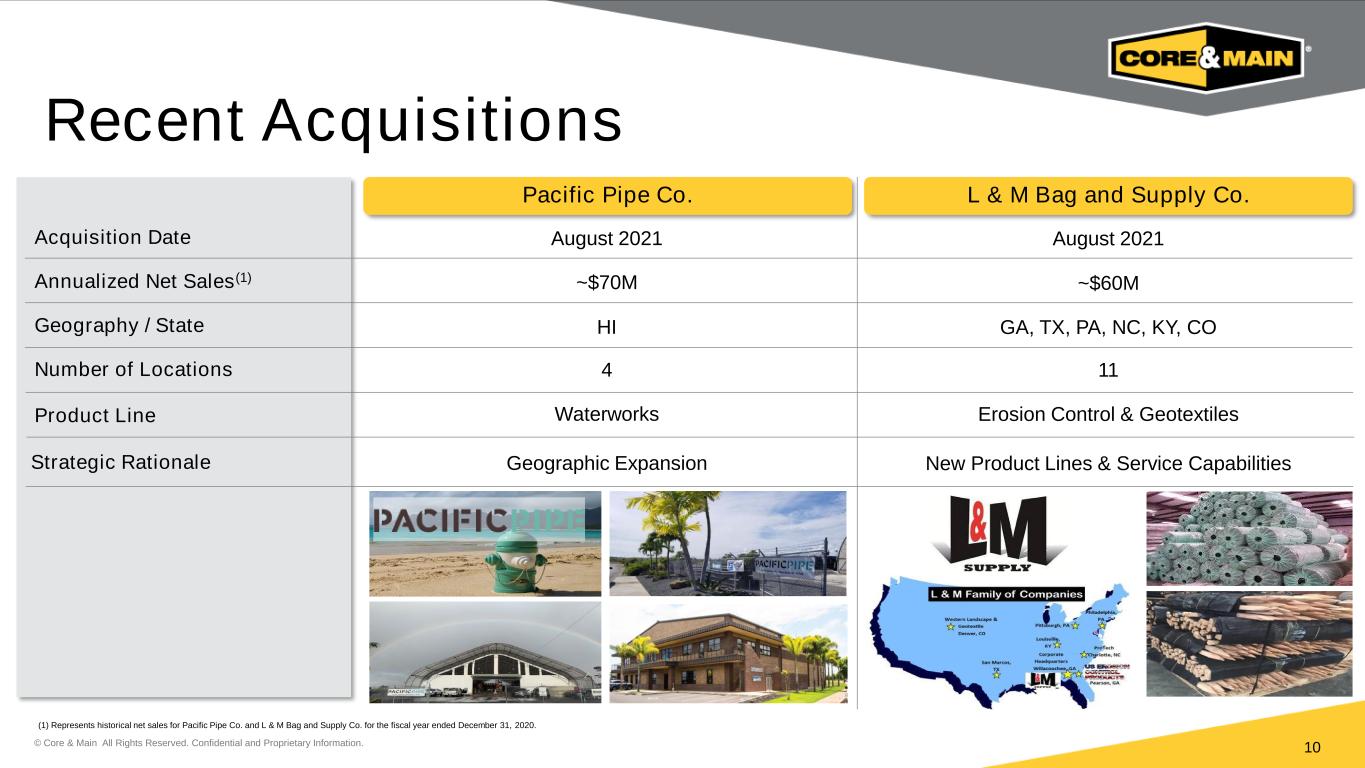
© Core & Main All Rights Reserved. Confidential and Proprietary Information. Recent Acquisitions 10 Geographic Expansion New Product Lines & Service Capabilities August 2021 L & M Bag and Supply Co.Pacific Pipe Co. Acquisition Date Annualized Net Sales(1) Strategic Rationale August 2021 ~$70M ~$60M Geography / State Number of Locations Product Line HI GA, TX, PA, NC, KY, CO 4 11 Waterworks Erosion Control & Geotextiles (1) Represents historical net sales for Pacific Pipe Co. and L & M Bag and Supply Co. for the fiscal year ended December 31, 2020.
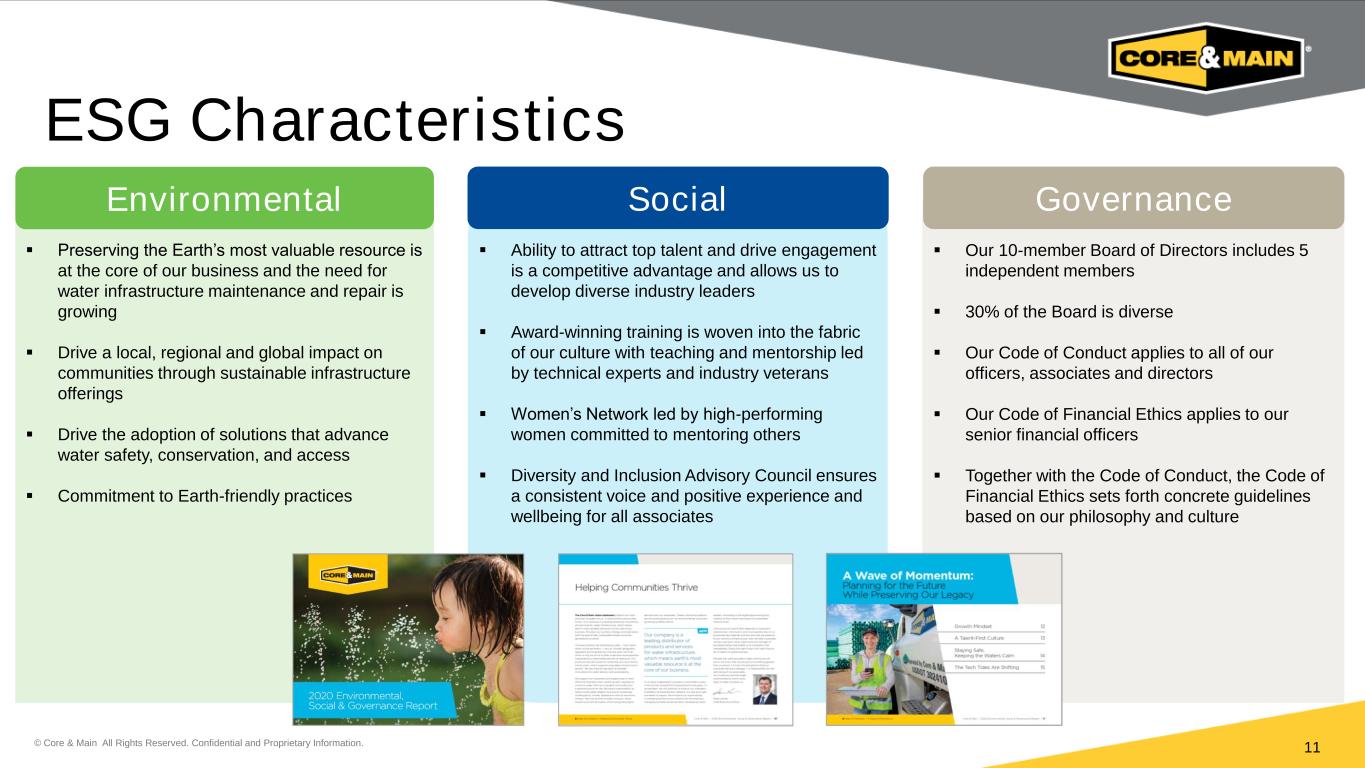
© Core & Main All Rights Reserved. Confidential and Proprietary Information. ESG Characteristics 11 ▪ Ability to attract top talent and drive engagement is a competitive advantage and allows us to develop diverse industry leaders ▪ Award-winning training is woven into the fabric of our culture with teaching and mentorship led by technical experts and industry veterans ▪ Women’s Network led by high-performing women committed to mentoring others ▪ Diversity and Inclusion Advisory Council ensures a consistent voice and positive experience and wellbeing for all associates SocialEnvironmental ▪ Our 10-member Board of Directors includes 5 independent members ▪ 30% of the Board is diverse ▪ Our Code of Conduct applies to all of our officers, associates and directors ▪ Our Code of Financial Ethics applies to our senior financial officers ▪ Together with the Code of Conduct, the Code of Financial Ethics sets forth concrete guidelines based on our philosophy and culture Governance ▪ Preserving the Earth’s most valuable resource is at the core of our business and the need for water infrastructure maintenance and repair is growing ▪ Drive a local, regional and global impact on communities through sustainable infrastructure offerings ▪ Drive the adoption of solutions that advance water safety, conservation, and access ▪ Commitment to Earth-friendly practices

© Core & Main All Rights Reserved. Confidential and Proprietary Information. Second Quarter Execution Highlights 12 ✓ Successfully executed an initial public offering of ~40 million shares of Class A common stock – Inclusive of the underwriters’ over-allotment option that was exercised subsequent to the end of the quarter – Generated gross proceeds of approximately $800 million ✓ Record Q2 Net Sales of nearly $1.3 billion, a 36% increase compared with the prior year period ✓ Net Income decreased 48% compared with the prior year period to $9.5 million – Includes $50.4 million loss on debt modification and extinguishment – Includes $17.2 million incremental equity-based compensation charge ✓ Adjusted EBITDA increased 57% compared with the prior year period to $155 million ✓ Navigating continued supply chain uncertainty, heavy demand, resource constraints and price inflation – Anticipate additional supply chain impacts as a result of Hurricane Ida ✓ Signed definitive agreements to acquire L & M Bag & Supply Co. and Pacific Pipe Co. – Closed on both acquisitions subsequent to the end of the quarter ✓ Closely monitoring the resurgence of COVID-19 across the U.S. – Prepared to reinstate COVID-19 protocols as necessary to keep our associates and customers safe ✓ Historic federal investment in U.S. infrastructure passed by the Senate – Well-positioned to capitalize on the potential tailwinds
© Core & Main All Rights Reserved. Confidential and Proprietary Information. Agenda 13 1 Company Overview & Business Update 2 Financial Highlights 3 Q&A and Closing Remarks

© Core & Main All Rights Reserved. Confidential and Proprietary Information. Second Quarter Operating Results 14 Net Sales Gross Profit Adjusted EBITDA(1) Adjusted Net Income(1) (1) Adjusted EBITDA, Adjusted EBITDA margin and Adjusted Net Income are non-GAAP financial measures. Refer to the appendix of the presentation for a reconciliation to the nearest GAAP measure. $956 $1,298 Q2'20 Q2'21 $231 $325 Q2'20 Q2'21 $99 $155 Q2'20 Q2'21 % Margin 24.1% 25.1% 10.4% 12.0% ($ in Millions) ($ in Millions) ($ in Millions) +100 bps +57% +36% +41% +160 bps% Margin(1) $19 $61 Q2'20 Q2'21 ($ in Millions) +215%
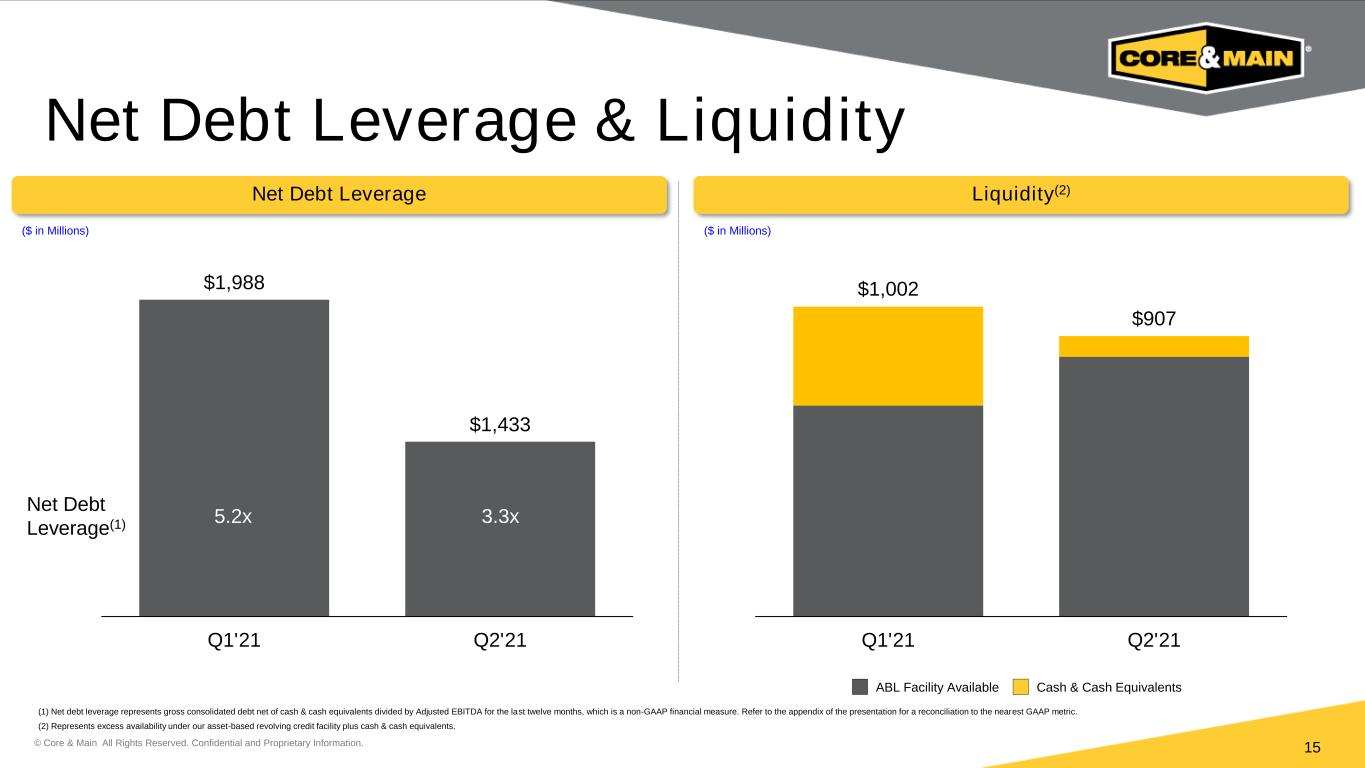
© Core & Main All Rights Reserved. Confidential and Proprietary Information. Net Debt Leverage & Liquidity 15 Net Debt Leverage Liquidity(2) ($ in Millions) ($ in Millions) (1) Net debt leverage represents gross consolidated debt net of cash & cash equivalents divided by Adjusted EBITDA for the last twelve months, which is a non-GAAP financial measure. Refer to the appendix of the presentation for a reconciliation to the nearest GAAP metric. (2) Represents excess availability under our asset-based revolving credit facility plus cash & cash equivalents. ABL Facility Available Cash & Cash Equivalents $1,988 $1,433 Q1'21 Q2'21 Net Debt Leverage(1) 5.2x 3.3x $1,002 $907 Q1'21 Q2'21
© Core & Main All Rights Reserved. Confidential and Proprietary Information. 2H’21 Outlook 16 ✓ Growth trends expected to remain positive – End market demand remains strong supported by healthy backlog and bidding activity – Continued traction against our growth initiatives expected to drive additional market share gains ✓ Supplier capacity and product availability constraints expected to continue or worsen – Prices expected to remain high in the near term ✓ Pacific Pipe and L & M Bag & Supply acquisitions will generate incremental sales growth ✓ Strong pipeline of additional M&A targets ✓ Gross margin initiatives expected to deliver year-over-year margin expansion, though tempered compared to the first half ✓ Fiscal 2021 Adjusted EBITDA expected to be in the range of $470 to $510 million, representing year-over-year growth of 37% to 49%
© Core & Main All Rights Reserved. Confidential and Proprietary Information. Agenda 17 1 Company Overview & Business Update 2 Financial Highlights 3 Q&A and Closing Remarks

© Core & Main All Rights Reserved. Confidential and Proprietary Information. 18 Leading position with size and scale in a fragmented market1 Multiple levers for organic growth3 Proven ability to execute and integrate acquisitions4 Strong value proposition & pivotal role in shaping our industry2 Why Core & Main? Beneficial industry trends with secular growth drivers5 Resilient financial profile with efficient operating model6

© Core & Main All Rights Reserved. Confidential and Proprietary Information. Appendix

© Core & Main All Rights Reserved. Confidential and Proprietary Information. Org Structure & Tax Receivable Agreements 20 Organizational Structure Tax Receivable Agreements (“TRA”) ▪ Class A & Class B common stock have the same voting rights ▪ Public ownership = 16.3% ▪ Non-controlling interests (represents Class B common stock ownership): – Reduces over time when partnership interests in Core & Main Holdings, LP and shares of Class B common stock are exchanged for shares of Class A common stock, or if more shares of Class A common stock are issued – Non-controlling interests result in adjustments to net income and equity within the financial statements Former Limited Partner TRA ▪ Relates to $104 million of tax benefits belonging to entities that merged with and into Core & Main, Inc. in connection with the Up-C structuring (tax basis step-up generated from LBO in 2017) ▪ Core & Main, Inc. will obtain 100% of these tax benefits, which will lower our cash tax rate ▪ TRA liabilities represent 85% of the tax benefits expected to be utilized ▪ TRA liabilities are payable within 120 days after the filing of the first Core & Main, Inc. tax return. First payment is expected in 2023 and annually thereafter for 15 years ▪ Q2’21 TRA liability balance: $88.6 million ▪ Relates to anticipated tax benefits totaling $827 million(1) as shares of Class B common stock and partnership interests in Core & Main Holdings, LP are exchanged for share of Class A common stock, resulting in additional tax basis step-up (estimate based on current tax rates and other factors) ▪ Core & Main will obtain 100% of the tax benefits, which will lower our future cash tax rate, and pay exchanging holders 85% of the amount of tax benefits realized ▪ TRA liability is only generated to the extent that associated tax savings are realized ▪ Q2’21 TRA liability balance: $0 ▪ Estimated TRA liability of $703 million not deemed a debt-like item due to the cash tax savings offset ▪ TRA payments will be made over the horizon that tax benefits are realized. This may be over 15 years from when exchanges occur ▪ Early terminations are possible in certain circumstances 160M 35% Continuing Limited Partner TRA Class A Common Stock Class B Common Stock 86M 65% 100%Total 246M % of TotalShare Count (1) Based on estimates and assuming the full exchange of all outstanding shares of Class B common stock and partnership interests in Core & Main Holdings, LP into shares of Class A common stock as of August 1, 2021. This calculation includes a $26.50 per share, the closing stock price on July 30, 2021, and a 25.1% combined federal and state tax rate.
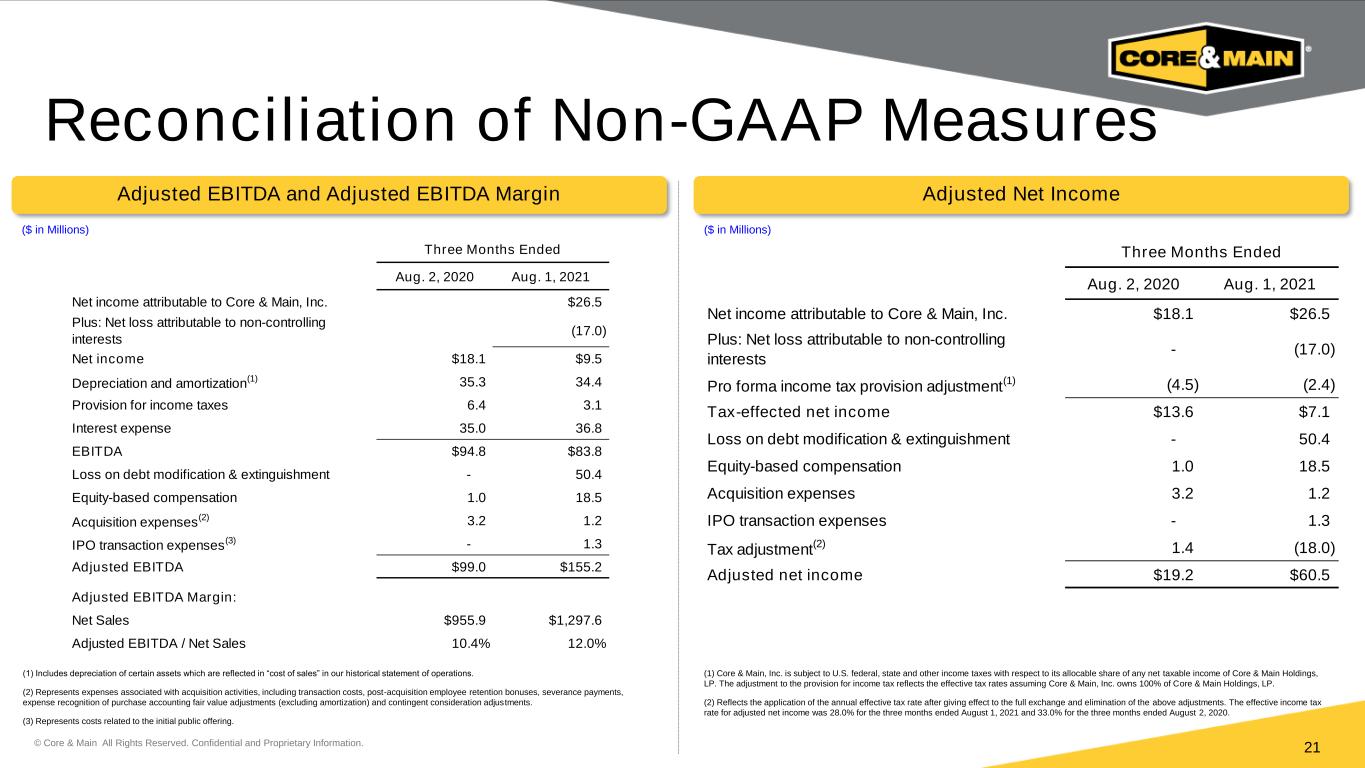
© Core & Main All Rights Reserved. Confidential and Proprietary Information. 21 Adjusted EBITDA and Adjusted EBITDA Margin Adjusted Net Income ($ in Millions) ($ in Millions) (1) Includes depreciation of certain assets which are reflected in “cost of sales” in our historical statement of operations. (2) Represents expenses associated with acquisition activities, including transaction costs, post-acquisition employee retention bonuses, severance payments, expense recognition of purchase accounting fair value adjustments (excluding amortization) and contingent consideration adjustments. (3) Represents costs related to the initial public offering. Reconciliation of Non-GAAP Measures (1) Core & Main, Inc. is subject to U.S. federal, state and other income taxes with respect to its allocable share of any net taxable income of Core & Main Holdings, LP. The adjustment to the provision for income tax reflects the effective tax rates assuming Core & Main, Inc. owns 100% of Core & Main Holdings, LP. (2) Reflects the application of the annual effective tax rate after giving effect to the full exchange and elimination of the above adjustments. The effective income tax rate for adjusted net income was 28.0% for the three months ended August 1, 2021 and 33.0% for the three months ended August 2, 2020. Aug. 2, 2020 Aug. 1, 2021 Net income attributable to Core & Main, Inc. $26.5 Plus: Net loss attributable to non-controlling interests (17.0) Net income $18.1 $9.5 Depreciation and amortization (1) 35.3 34.4 Provision for income taxes 6.4 3.1 Interest expense 35.0 36.8 EBITDA $94.8 $83.8 Loss on debt modification & extinguishment - 50.4 Equity-based compensation 1.0 18.5 Acquisition expenses (2) 3.2 1.2 IPO transaction expenses (3) - 1.3 Adjusted EBITDA $99.0 $155.2 Adjusted EBITDA Margin: Net Sales $955.9 $1,297.6 Adjusted EBITDA / Net Sales 10.4% 12.0% Three Months Ended Aug. 2, 2020 Aug. 1, 2021 Net income attributable to Core & Main, Inc. $18.1 $26.5 Plus: Net loss attributable to non-controlling interests - (17.0) Pro forma income tax provision adjustment (1) (4.5) (2.4) Tax-effected net income $13.6 $7.1 Loss on debt modification & extinguishment - 50.4 Equity-based compensation 1.0 18.5 Acquisition expenses 3.2 1.2 IPO transaction expenses - 1.3 Tax adjustment (2) 1.4 (18.0) Adjusted net income $19.2 $60.5 Three Months Ended
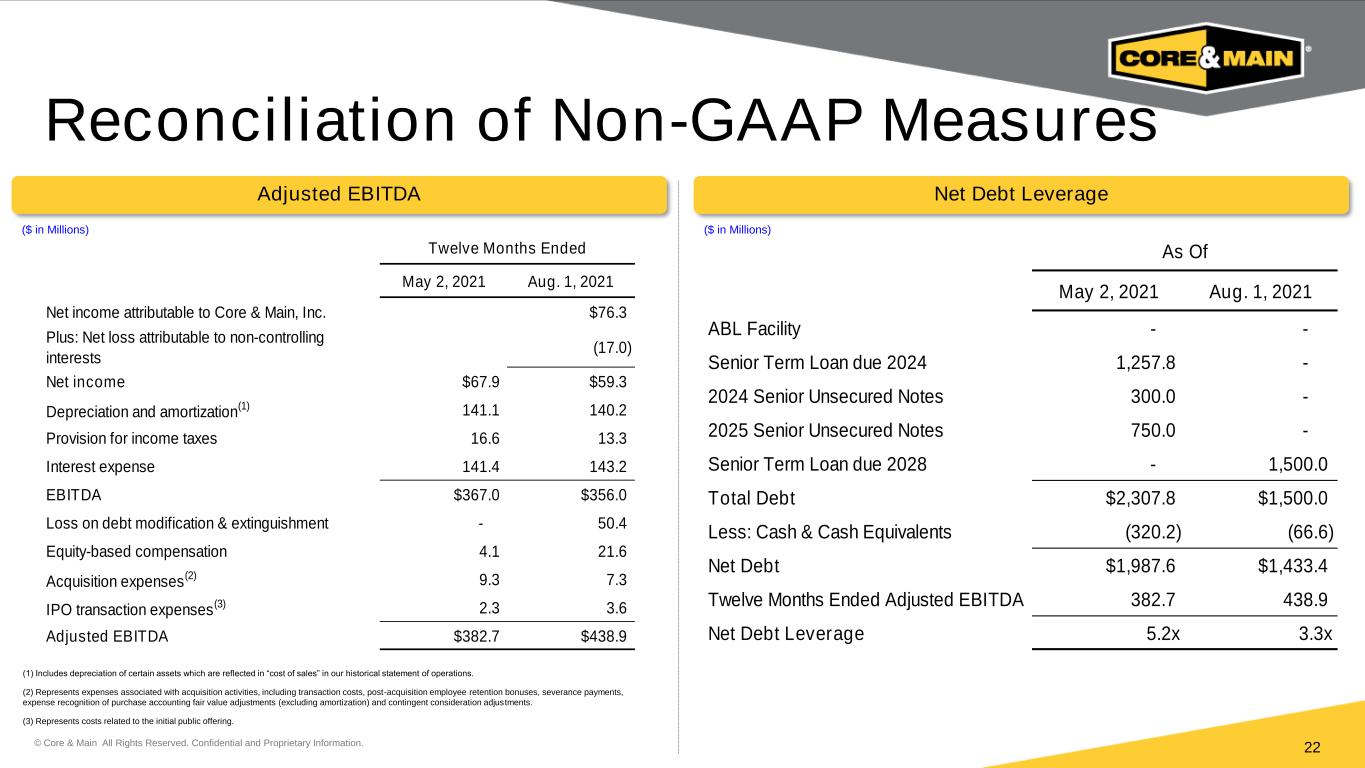
© Core & Main All Rights Reserved. Confidential and Proprietary Information. 22 Adjusted EBITDA Net Debt Leverage ($ in Millions) ($ in Millions) Reconciliation of Non-GAAP Measures May 2, 2021 Aug. 1, 2021 Net income attributable to Core & Main, Inc. $76.3 Plus: Net loss attributable to non-controlling interests (17.0) Net income $67.9 $59.3 Depreciation and amortization (1) 141.1 140.2 Provision for income taxes 16.6 13.3 Interest expense 141.4 143.2 EBITDA $367.0 $356.0 Loss on debt modification & extinguishment - 50.4 Equity-based compensation 4.1 21.6 Acquisition expenses (2) 9.3 7.3 IPO transaction expenses (3) 2.3 3.6 Adjusted EBITDA $382.7 $438.9 Twelve Months Ended May 2, 2021 Aug. 1, 2021 ABL Facility - - Senior Term Loan due 2024 1,257.8 - 2024 Senior Unsecured Notes 300.0 - 2025 Senior Unsecured Notes 750.0 - Senior Term Loan due 2028 - 1,500.0 Total Debt $2,307.8 $1,500.0 Less: Cash & Cash Equivalents (320.2) (66.6) Net Debt $1,987.6 $1,433.4 Twelve Months Ended Adjusted EBITDA 382.7 438.9 Net Debt Leverage 5.2x 3.3x As Of (1) Includes depreciation of certain assets which are reflected in “cost of sales” in our historical statement of operations. (2) Represents expenses associated with acquisition activities, including transaction costs, post-acquisition employee retention bonuses, severance payments, expense recognition of purchase accounting fair value adjustments (excluding amortization) and contingent consideration adjustments. (3) Represents costs related to the initial public offering.
