Attached files
| file | filename |
|---|---|
| EX-99.3 - EX-99.3 - NSTS Bancorp, Inc. | nsts211106_ex99-3.htm |
| EX-99.2 - EX-99.2 - NSTS Bancorp, Inc. | nsts211106_ex99-2.htm |
| EX-99.1 - EX-99.1 - NSTS Bancorp, Inc. | nsts211106_ex99-1.htm |
| EX-23.3 - EX-23.3 - NSTS Bancorp, Inc. | nsts211106_ex23-3.htm |
| EX-23.2 - EX-23.2 - NSTS Bancorp, Inc. | nsts211106_ex23-2.htm |
| EX-21 - EX-21 - NSTS Bancorp, Inc. | nsts211106_ex21.htm |
| EX-10.2 - EX-10.2 - NSTS Bancorp, Inc. | nsts211106_ex10-2.htm |
| EX-10.1 - EX-10.1 - NSTS Bancorp, Inc. | nsts211106_ex10-1.htm |
| EX-8.1 - EX-8.1 - NSTS Bancorp, Inc. | nsts211106_ex8-1.htm |
| EX-5.1 - EX-5.1 - NSTS Bancorp, Inc. | nsts211106_ex5-1.htm |
| EX-4.1 - EX-4.1 - NSTS Bancorp, Inc. | nsts211106_ex4-1.htm |
| EX-3.2 - EX-3.2 - NSTS Bancorp, Inc. | nsts211106_ex3-2.htm |
| EX-3.1 - EX-3.1 - NSTS Bancorp, Inc. | nsts211106_ex3-1.htm |
| EX-2.1 - EX-2.1 - NSTS Bancorp, Inc. | nsts211106_ex2-1.htm |
| EX-1.1 - EX-1.1 - NSTS Bancorp, Inc. | nsts211106_ex1-1.htm |
| S-1 - FORM S-1 - NSTS Bancorp, Inc. | nsts211106_s-1.htm |
Exhibit 99.4
|
Feldman Financial Advisors, Inc. |
|
|
|
8804 Mirador Place |
|
|
McLean, VA 22102 |
|
|
(202) 467-6862 |
|
North Shore MHC Waukegan, Illinois
Conversion Valuation Appraisal Report Valued as of August 31, 2021
Prepared By
Feldman Financial Advisors, Inc. McLean, Virginia
|
|
Feldman Financial Advisors, Inc. |
|
|
|
8804 Mirador Place |
|
|
McLean, VA 22102 |
|
|
(202) 467-6862 |
August 31, 2021
Board of Directors
North Shore MHC
700 South Lewis Avenue
Waukegan, Illinois 60085
Members of the Board of Directors:
At your request, we have completed and hereby provide an independent appraisal (the “Appraisal”) of the estimated pro forma market value of North Shore MHC (the “Company”) as of August 31, 2021 in conjunction with the Company’s conversion (the “Conversion”) from the mutual holding company to stock form of organization, issuance of all of its capital stock to a newly formed stock holding company known as NSTS Bancorp, Inc. (“NSTS Bancorp”), and offering for sale of NSTS Bancorp’s common stock to eligible depositors and borrowers of North Shore Trust and Savings (the “Bank”), the Bank’s employee stock ownership plan, and certain members of the general public in the subscription and community offering (the “Stock Offering”). The Conversion is being undertaken pursuant to a Plan of Conversion adopted by the Boards of Directors of the Company, the Bank, and the mid-tier stock holding company, NSTS Financial Corporation (“NSTS Financial”). The Appraisal is furnished pursuant to the filing by the Company of applications with respect to the Conversion and the Stock Offering with the Board of Governors of the Federal Reserve System and the Office of the Comptroller of the Currency.
Feldman Financial Advisors, Inc. (“Feldman Financial”) is a financial consulting and advisory firm that specializes in valuations and analyses of business enterprises and securities in the thrift, banking, and mortgage industries. The background of Feldman Financial is presented in Exhibit I. In preparing the Appraisal, we conducted an analysis of the Company that included discussions with the Company’s management, the Company’s legal counsel, Vedder Price P.C., and the Company’s independent registered public accounting firm, Plante Moran, PLLC. In addition, where appropriate, we considered information based on other available published sources that we believe are reliable; however, we cannot guarantee the accuracy and completeness of such information. We also reviewed, among other factors, the economy in the Company’s primary market area and compared the Company’s financial condition and operating performance with that of selected publicly traded thrift institutions. We reviewed conditions in the securities markets in general and in the market for thrift institution common stocks in particular.
The Appraisal is based on the Company’s representation that the information in the Conversion applications and additional evidence furnished to us by the Company and its independent auditor are truthful, accurate, and complete. We did not independently verify the financial statements and other information provided by the Company and its independent accounting firm, nor did we independently value the assets or liabilities of the Company. The Appraisal considers the Company only as a going concern and should not be considered as an indication of the liquidation value of the Company.
Feldman Financial Advisors, Inc.
Board of Directors
North Shore MHC
August 31, 2021
Page Two
Pursuant to the Plan of Conversion, the Company will convert from the mutual holding company form of organization to the stock form of organization through the following series of steps. The Company currently owns 100% of the common stock of NSTS Financial, which in turn owns 100% of the common stock of the Bank. The Company will first merge with and into NSTS Financial which will in turn immediately merge with and into NSTS Bancorp, which in turn will sell shares of common stock in the Stock Offering. When the Conversion and Stock Offering are completed, all of the outstanding capital stock of the Bank will be owned by NSTS Bancorp, and all of the common stock of NSTS Bancorp will be owned by shareholders. The Bank will operate as a wholly-owned subsidiary of NSTS Bancorp, and the Company and NSTS Financial will both cease to exist.
The Plan of Conversion provides for the establishment of a new charitable foundation, North Shore Charitable Foundation (“the Foundation”). The Foundation will be funded initially by common stock and cash received in conjunction with the Stock Offering. The contribution to the Foundation from the net proceeds of the Stock Offering will amount to shares representing 2.0% of the total outstanding shares of common stock issued in the Conversion (including shares contributed to the Foundation) and $150,000 in cash. The purpose of the Foundation is to provide financial support to charitable organizations in the communities in which the Company operates and will operate in the future and to enable these local communities to share in the Company’s long-term growth.
It is our opinion that, as of August 31, 2021, the estimated pro forma market value of the Company was within a range (the “Valuation Range”) of $34,693,880 to $46,938,780 with a midpoint of $40,816,330. Pursuant to applicable appraisal guidelines, the Valuation Range was based upon a 15% decrease from the midpoint value to determine the minimum value and a 15% increase from the midpoint value to establish the maximum value. Assuming an additional 15% increase above the maximum value would result in an adjusted maximum of $53,979,590. Based on the Valuation Range, the range of shares to be sold in the Stock Offering (excluding the Foundation shares) is as follows: $34,000,000 at the minimum, $40,000,000 at the midpoint, $46,000,000 at the maximum, and $52,800,000 at the adjusted maximum. Based on an initial offering price of $10.00 per share, the number of shares to be sold in the Stock Offering is as follows: 3,400,000 at the minimum, 4,000,000 at the midpoint, 4,600,000 at the maximum, and 5,290,000 at the adjusted maximum.
Our Appraisal is not intended, and must not be construed, to be a recommendation of any kind as to the advisability of purchasing shares of common stock in the Stock Offering. Moreover, because the Appraisal is necessarily based upon estimates and projections of a number of matters, all of which are subject to change from time to time, no assurance can be given that persons who purchase shares of stock in the Stock Offering will thereafter be able to sell such shares at prices related to the foregoing estimate of the Company’s pro forma market value. Feldman Financial is not a seller of securities within the meaning of any federal or state securities laws, and any report prepared by Feldman Financial shall not be used as an offer or solicitation with respect to the purchase or sale of any securities.
Feldman Financial Advisors, Inc.
Board of Directors
North Shore MHC
August 31, 2021
Page Three
The Valuation Range reported herein will be updated as appropriate. These updates will consider, among other factors, any developments or changes in the Company’s operating performance, financial condition, or management policies, and current conditions in the securities markets for thrift institution common stocks. Should any such new developments or changes be material, in our opinion, to the valuation of the Company, appropriate adjustments to the estimated pro forma market value will be made. The reasons for any such adjustments will be explained in detail at that time.
|
|
Respectfully submitted, |
|
|
|
|
|
Feldman Financial Advisors, Inc. |
|
|
|
|
|
Trent R. Feldman |
|
|
President |
|
|
|
 | |
|
|
Peter W. L. Williams |
|
|
Principal |

Feldman Financial Advisors, Inc.
TABLE OF CONTENTS
|
TAB |
|
|
PAGE |
|
|
|
|
|
|
|
|
|
INTRODUCTION |
1 |
||
|
|
|
|
|
|
|
I. |
Chapter One – Business of North Shore MHC |
|
||
|
|
General Overview |
4 |
||
|
|
Financial Condition |
10 |
||
|
|
Income and Expense Trends |
18 |
||
|
|
Interest Rate Risk Management |
24 |
||
|
|
Asset Quality |
28 |
||
|
|
Office Facilities |
31 |
||
|
|
Market Area |
32 |
||
|
|
Summary Outlook |
43 |
||
|
|
|
|
|
|
|
II. |
Chapter Two – Comparisons with Publicly Traded Companies |
|
||
|
|
General Overview |
45 |
||
|
|
Selection Criteria |
46 |
||
|
|
Recent Financial Comparisons |
50 |
||
|
|
|
|
|
|
|
III. |
Chapter Three – Market Value Adjustments |
|
||
|
|
General Overview |
63 |
||
|
|
Earnings Prospects |
64 |
||
|
|
Financial Condition |
65 |
||
|
|
Market Area |
66 |
||
|
|
Management |
67 |
||
|
|
Dividend Payments |
68 |
||
|
|
Liquidity of the Stock Issue |
69 |
||
|
|
Subscription Interest |
70 |
||
|
|
Recent Acquisition Activity |
71 |
||
|
|
Effect of Banking Regulations and Regulatory Reform |
73 |
||
|
|
Stock Market Conditions |
73 |
||
|
|
Adjustments Conclusion |
80 |
||
|
|
Valuation Approach |
81 |
||
|
|
Valuation Conclusion |
84 |
||
|
|
|
|
|
|
|
IV. |
Appendix -- Exhibits |
|
||
|
|
I |
Background of Feldman Financial Advisors, Inc. |
I-1 |
|
|
|
II-1 |
Consolidated Balance Sheets |
II-1 |
|
|
|
II-2 |
Consolidated Income Statements |
II-2 |
|
|
|
II-3 |
Loan Portfolio Composition |
II-3 |
|
|
|
II-4 |
Net Lending Activity |
II-4 |
|
|
|
II-5 |
Cash and Investments Composition |
II-5 |
|
|
|
II-6 |
Deposit Accounts Composition |
II-6 |
|
|
|
II-7 |
Borrowed Funds Composition |
II-7 |
|
|
|
II-8 |
Office Properties |
II-8 |
|
|
|
III |
Financial and Market Data for All Public Thrifts |
III-1 |
|
|
|
IV-1 |
Pro Forma Assumptions for the Stock Offering |
IV-1 |
|
|
|
IV-2 |
Pro Forma Conversion Valuation Range |
IV-2 |
|
|
|
IV-3 |
Pro Forma Conversion Analysis at the Midpoint Value |
IV-3 |
|
|
|
IV-4 |
Comparative Valuation Ratio Analysis |
IV-4 |
|
|
|
|
|
|
|
i
Feldman Financial Advisors, Inc.
LIST OF TABLES
|
TAB |
|
|
PAGE |
|
|
|
|
|
|
|
|
I. |
Chapter One – Business of North Shore MHC |
|
||
|
|
Table 1 |
Selected Financial Condition Data |
10 |
|
|
|
Table 2 |
Relative Balance Sheet Concentrations |
11 |
|
|
|
Table 3 |
Income Statement Summary |
19 |
|
|
|
Table 4 |
Income Statement Ratios |
21 |
|
|
|
Table 5 |
Yield and Cost Summary |
23 |
|
|
|
Table 6 |
Net Portfolio Value of Equity |
25 |
|
|
|
Table 7 |
Net Interest Income Sensitivity |
27 |
|
|
|
Table 8 |
Non-performing Asset Summary |
29 |
|
|
|
Table 9 |
Allowance for Loan Losses |
30 |
|
|
|
Table 10 |
Selected Demographic Data |
35 |
|
|
|
Table 11 |
Total Employment Force by Industry Sectors |
37 |
|
|
|
Table 12 |
Branch Office Deposit Data |
38 |
|
|
|
Table 13 |
Deposit Market Share in Lake County, Illinois |
40 |
|
|
|
Table 14 |
Deposit Market Share in the Chicago MSA |
41 |
|
|
|
|
|
|
|
|
II. |
Chapter Two – Comparisons with Publicly Traded Companies |
|
||
|
|
Table 15 |
Comparative Group Operating Summary |
49 |
|
|
|
Table 16 |
Key Financial Comparisons |
51 |
|
|
|
Table 17 |
General Operating Characteristics |
58 |
|
|
|
Table 18 |
Summary Financial Performance Ratios |
59 |
|
|
|
Table 19 |
Income and Expense Analysis |
60 |
|
|
|
Table 20 |
Balance Sheet Composition |
61 |
|
|
|
Table 21 |
Growth Rates, Credit Risk, and Loan Composition |
62 |
|
|
|
|
|
|
|
|
III. |
Chapter Three – Market Value Adjustments |
|
||
|
|
Table 22 |
Selected Demographic Data of Primary Market Areas |
67 |
|
|
|
Table 23 |
Summary of Illinois Bank and Thrift Acquisition Activity |
72 |
|
|
|
Table 24 |
Comparative One-Year Stock Index Performance |
76 |
|
|
|
Table 25 |
Comparative Three-Year Stock Index Performance |
77 |
|
|
|
Table 26 |
Summary of Standard Conversion Stock Offerings |
78 |
|
|
|
Table 27 |
Comparative Pro Forma Market Valuation Analysis |
85 |
|
ii
Feldman Financial Advisors, Inc.
INTRODUCTION
At your request, we have completed and hereby provide an independent appraisal (the “Appraisal”) of the estimated pro forma market value of North Shore MHC (the “Company”) as of August 31, 2021 in conjunction with the Company’s conversion (the “Conversion”) from the mutual holding company to stock form of organization, issuance of all of its capital stock to a newly formed stock holding company known as NSTS Bancorp, Inc. (“NSTS Bancorp”), and offering for sale of NSTS Bancorp’s common stock to eligible depositors and borrowers of North Shore Trust and Savings (the “Bank”), the Bank’s employee stock ownership plan, and certain members of the general public in the subscription and community offering (the “Stock Offering”). The Conversion is being undertaken pursuant to a Plan of Conversion adopted by the Boards of Directors of the Company, the Bank, and the mid-tier stock holding company, NSTS Financial Corporation (“NSTS Financial”). The Appraisal is furnished pursuant to the filing by the Company of applications with respect to the Conversion and the Stock Offering with the Board of Governors of the Federal Reserve System (“FRB”) and the Office of the Comptroller of the Currency (“OCC”).
Feldman Financial Advisors, Inc. (“Feldman Financial”) is a financial consulting and advisory firm that specializes in valuations and analyses of business enterprises and securities in the thrift, banking, and mortgage industries. The background of Feldman Financial is presented in Exhibit I. In preparing the Appraisal, we conducted an analysis of the Company that included discussions with the Company’s management, the Company’s legal counsel, Vedder Price P.C., and the Company’s independent registered public accounting firm, Plante Moran, PLLC. In addition, where appropriate, we considered information based on other available published sources that we believe are reliable; however, we cannot guarantee the accuracy and completeness of such information. We also reviewed, among other factors, the economy in the Company’s primary market area and compared the Company’s financial condition and operating performance with that of selected publicly traded thrift institutions. We reviewed conditions in the securities markets in general and in the market for thrift institution common stocks in particular.
1
Feldman Financial Advisors, Inc.
The Appraisal is based on the Company’s representation that the information in the Conversion applications and additional evidence furnished to us by the Company and its independent auditor are truthful, accurate, and complete. We did not independently verify the financial statements and other information provided by the Company and its independent accounting firm, nor did we independently value the assets or liabilities of the Company. The Appraisal considers the Company only as a going concern and should not be considered as an indication of the liquidation value of the Company.
Our Appraisal is not intended, and must not be construed, to be a recommendation of any kind as to the advisability of purchasing shares of common stock in the Stock Offering. Moreover, because the Appraisal is necessarily based upon estimates and projections of a number of matters, all of which are subject to change from time to time, no assurance can be given that persons who purchase shares of stock in the Stock Offering will thereafter be able to sell such shares at prices related to the foregoing estimate of the Company’s pro forma market value. Feldman Financial is not a seller of securities within the meaning of any federal or state securities laws, and any report prepared by Feldman Financial shall not be used as an offer or solicitation with respect to the purchase or sale of any securities.
The Valuation Range reported herein will be updated as appropriate. These updates will consider, among other factors, any developments or changes in the Company’s operating performance, financial condition, or management policies, and current conditions in the securities markets for thrift institution common stocks. Should any such new developments or changes be material, in our opinion, to the valuation of the Company, appropriate adjustments to the estimated pro forma market value will be made. The reasons for any such adjustments will be explained in detail at that time.
2
Feldman Financial Advisors, Inc.
I. Business of North Shore Mhc
General Overview
North Shore MHC is a federally-chartered mutual holding company that functions as the parent company of NSTS Financial, a federally-chartered mid-tier stock holding company. NSTS is the parent company of the Bank, a federally-chartered stock savings institution. The Bank was established originally in 1921 as North Shore Building and Loan, an Illinois-chartered institution. In 2005, the Bank converted to a federally-chartered savings institution and reorganized into the mutual holding company form of organization. Since its inception, the Bank has operated as a traditional savings institution focused primarily on serving the banking needs of customers in its market area of Lake County, Illinois, and adjacent communities.
The Company operates from its headquarters and main banking office in Waukegan, Illinois, along with two additional full-service branch offices located in Waukegan and Lindenhurst, Illinois, respectively. The Company also has a loan production office in Chicago, Illinois. The Company’s business consists primarily of taking deposits from the general public and investing those deposits, together with funds generated from operations, in one- to four-family residential mortgage loans and purchase investments. The Company also invests in securities, historically consisting primarily of residential mortgage-backed securities issued by U.S. Government-sponsored enterprises, collateralized mortgage obligations, municipal obligations, and U.S. Government agency obligations. The Company offers a variety of deposit accounts, including checking accounts, savings accounts, money market accounts, and certificates of deposit.
At June 30, 2021, the Company had consolidated total assets of $239.9 million, total deposits of $184.4 million, and total equity of $45.9 million (measuring 19.13% of total assets). The Company reported a net loss of -$112,000 for the year ended December 31, 2020 and net income of $414,000 for the year ended December 31, 2019. The Bank’s deposits are insured up to applicable limits by the Federal Deposit Insurance Corporation (“FDIC”). The Bank is subject to regulation, examination, and supervision primarily by the OCC and secondarily by the FDIC. The Bank is also a member of the Federal Home Loan Bank (“FHLB”) of Chicago. The Company is subject to regulation by the FRB.
3
Feldman Financial Advisors, Inc.
Over the past ten years, the Bank has emphasized conservative lending, controlled growth, and an emphasis on managing liquidity and interest rate risk. The Bank’s total assets decreased by 7.7% from $262.5 million at December 31, 2010 to $242.2 million at December 31, 2020. The Bank’s total loans decreased by 30.8% from $146.3 million at December 31, 2010 to $101.3 million at December 31, 2020. The Bank’s ratio of total loans to total deposits decreased from 67.6% at year-end 2010 to 53.3% at year-end 2020. Over this same time period, the Bank’s ratio of total equity to total assets increased from 16.16% at year-end 2010 to 18.85% at year-end 2020.
The Bank’s 100-year operating history has provided it with a familiarity of its local communities and customer base. The Bank believes that its community orientation is attractive to customers and distinguishes it from the larger banks that operate in the local market area. The Bank continues to stress high quality, personal customer service through an honest, straightforward, and upfront marketing approach and has developed a loyal customer base. The Bank relies on its experienced and committed staff to meet the needs of customers. The Bank has a diverse staff, many of whom are bilingual, to assist with effectively serving the expanding Hispanic population in Waukegan. The Bank relies on its upgraded technology infrastructure to provide efficient and effective delivery of products and services. In recent years, the local market has experienced a significant amount of consolidation among its banking institutions, resulting in opportunities to pursue customer relationships that may have been disrupted as a result of mergers and acquisitions. The Lindenhurst branch office was opened to service an increasing population in the western part of Lake County. The Bank established a loan production office in the Roscoe Village neighborhood of Chicago, Illinois in 2016 to originate loans outside of its branch network in a more densely populated metropolitan area.
4
Feldman Financial Advisors, Inc.
The Company’s current operating goal is to position the organization to succeed in an evolving and competitive financial services landscape and enhance its position as one of the leading community banking institutions in its market. The Company believes that it can provide long-term value to its stockholders, customers, employees, and the communities it serves by executing a prudent business strategy that generates increasing profitability. The Company also believes there is a significant opportunity for a community-focused banking institution to compete effectively in its primary market area and that the increased capital it will have after the completion of the Stock Offering will facilitate this objective. The Company has emphasized and invested in a strong workforce, upgraded technology, and enhanced brand awareness in its market area. The core elements of the Company’s business strategy are outlined in more detail below:
| ● | Moderately grow the loan portfolio while continuing the sale of one-to four-family residential mortgages in the secondary market. The Company’s primary lending focus has been the origination of one- to four-family residential mortgage loans. As of June 30, 2021, $87.9 million or 89.7% of the Company’s loan portfolio was secured by one- to four-family residential mortgage loans. The Company believes that prudently increasing its one-to four -family, multi-family, and commercial real estate lending offers an opportunity to enhance its profitability and growth prospects. The Company plans to continue selling a portion of its loan production into the secondary market as a means to generate non-interest income, as well as manage interest rate and credit risk as long as market conditions are favorable to do so. |
| ● | Leverage technology to enhance customer experience and drive operating efficiencies. Over the past several years, the Company expanded its digital platform to include web-based and mobile application-based online banking. The Company aims to make upgrades continually to its online and mobile banking suites. Management has emphasized streamlining of internal processes and seeks to increase operating efficiencies through automation whenever possible. The Company plans to continue to invest in convenience technologies and employee training to enhance customer experience and keep pace with consumer demands. |
5
Feldman Financial Advisors, Inc.
| ● | Increase loan production through the formation of loan production offices. The Company originates loans through its three full-service branch locations in Waukegan and Lindenhurst, Illinois, and one loan production office in Chicago. The Company is currently reviewing sites to add up to three additional loan production offices in its surrounding communities over the next few years. |
| ● | Continue to emphasize prudent credit risk management. The Company is pursuing moderate portfolio growth because it believes strong asset quality is a key to its long-term financial success. The Company’s strategy for credit risk management focuses on having an experienced team of credit professionals, well-defined policies and procedures, appropriate loan underwriting criteria, and active credit monitoring. The Company’s ratio of non-performing assets to total assets ratio was 0.24% at June 30, 2021, 0.15% at December 31, 2020, and 0.03% at December 31, 2019. Because substantially all of the Company’s loans are secured by real estate and the level of its non-performing loans has been low in recent years, the Company believes that its current allowance for loan losses is adequate to account for the probable losses inherent in its loan portfolio. |
| ● | Grow the franchise organically. The Company expects to embark on a strategy of prudent growth following the Conversion and Stock Offering. The Company seeks to expand its market share in existing and contiguous markets by leveraging its longstanding ties to the community and delivering high-quality financial solutions. Building customer relationships around low-cost and no-cost products is part of the Company’s relationship expansion strategy. These accounts can be established with a modest initial deposit, impose minimal fees, and are a viable alternative for the consumer to non-bank money service businesses. |
| ● | Recruit and retain top talent. Recruiting and retaining talented individuals to implement the Company’s business strategy will be critical to its success. While the Company believes it has assembled a strong management team, it plans to continue assessing its personnel needs and expects to add new lenders and management staff in order to facilitate planned growth and to complement the existing management team. Critical to the Company’s efforts to attract and retain talent are the Conversion and the adoption and implementation of employee stock benefit plans, consistent with federal banking regulations and subject to shareholder approval, after the Conversion. |
6
Feldman Financial Advisors, Inc.
While its equity level is solid at 19.13% of total assets as of June 30, 2021, the Company believes it must raise additional capital in order to facilitate its growth objectives and loangeneration activity, and provide a greater cushion in response to the risk profile associated with continued expansion and future economic conditions. As a stock organization upon completion of the Conversion, the Company will be organized in the ownership form used by commercial banks, most major businesses, and a large number of thrift institutions. The ability to raise new equity capital through the issuance and sale of capital stock will allow the Company the flexibility to increase its equity capital position more rapidly than by accumulating earnings.
The Company also believes that the ability to attract new capital also will help address the needs of the communities it serves and enhance its ability to expand or to make acquisitions. After the Conversion, the Company will have an increased ability to merge with or acquire other financial institutions or business enterprises; however, there are no current arrangements, understandings, or agreements regarding any such acquisition opportunities. Finally, the Company expects to benefit from its employees and directors having stock ownership in its business, since that is viewed as an effective performance incentive and a means of attracting, retaining, and compensating employees and directors.
In summary, the Company’s primary reasons for implementing the Conversion and undertaking the Stock Offering are to:
| ● | Enhance its capital base to support growth and compete more effectively in the financial services marketplace. |
| ● | Offer depositors, employees, management, and directors an equity ownership interest in NSTS Bancorp, the proposed publicly-traded holding company, and thereby an economic interest in the potential future success of NSTS Bancorp and the Bank. |
| ● | Attract and retain qualified directors, management, and employees by establishing various stock-based benefit plans. |
| ● | Increase the Company’s flexibility to structure and finance the expansion of its operations, including potential acquisitions of other financial service businesses and establishing new branches or new loan production offices. |
7
Feldman Financial Advisors, Inc.
The remainder of Chapter I examines in more detail the trends addressed in this section, including the impact of changes in the Company’s economic and competitive environment, and recent strategic initiatives. The discussion is supplemented by the exhibits in the Appendix. Exhibit II-1 summarizes the Company’s consolidated balance sheets as of December 31, 2019 and 2020 and June 30, 2021. Exhibit II-2 presents the Company’s consolidated income statements for the years ended December 31, 2019 and 2020 and the six months ended June 30, 2020 and 2021.
9
Feldman Financial Advisors, Inc.
Financial Condition
Table 1 presents selected data concerning the Company’s financial position as of December 31, 2019 and 2020 and June 30, 2021. Table 2 displays relative balance sheet concentrations as of similar period-end dates.
Table 1
Selected Financial Condition Data
As of December 31, 2019 and 2020 and June 30, 2021
(Dollars in Thousands)
|
|
|
June 30, |
|
December 31, |
||||||||||
|
|
|
2021 |
|
2020 |
|
2019 |
||||||||
|
Total assets |
|
$239,858 |
|
|
$242,219 |
|
|
$235,549 |
|
|||||
|
Cash and cash equivalents (1) |
|
26,549 |
|
|
44,304 |
|
|
52,550 |
|
|||||
|
Investment securities available for sale |
|
98,284 |
|
|
81,620 |
|
|
68,569 |
|
|||||
|
Federal Home Loan Bank stock |
|
550 |
|
|
512 |
|
|
512 |
|
|||||
|
Total loans, net (2) |
|
98,240 |
|
|
100,426 |
|
|
98,399 |
|
|||||
|
Premises and equipment, net |
|
5,146 |
|
|
5,213 |
|
|
5,400 |
|
|||||
|
Bank-owned life insurance |
|
8,978 |
|
|
8,890 |
|
|
8,707 |
|
|||||
|
Total deposits |
|
184,406 |
|
|
186,404 |
|
|
184,371 |
|
|||||
|
Federal Home Loan Bank advances |
|
5,000 |
|
|
4,000 |
|
|
- |
|
|||||
|
Total equity |
|
45,875 |
|
|
46,725 |
|
|
45,764 |
|
|||||
|
(1) |
Includes interest-bearing and time deposits with other financial institutions. |
|
(2) |
Includes loans held for sale. |
| Source: North Shore MHC, financial statements. |
Asset Composition
The Company’s total assets amounted to $239.9 million at June 30, 2021, reflecting a 1.0% or $2.3 million decrease from total assets of $242.2 million at December 31, 2020. In the prior year, the Company’s total assets increased by 2.8% or $6.7 million from $235.5 million at December 31, 2019 to $242.2 million at December 31, 2020. The recent contraction of total assets was primarily attributable to a moderate decrease of $2.2 million in total net loans from $100.4 million at December 31, 2020 to $98.2 million at June 30, 2021.
9
Feldman Financial Advisors, Inc.
Table 2
Relative Balance Sheet Concentrations
As of December 31, 2019 and 2020 and June 30, 2021
(Percent of Total Assets)
| June 30, | December 31, | |||||||||||||
| 2021 | 2020 | 2019 | ||||||||||||
| Cash and cash equivalents (1) | 11.07 | % | 18.29 | % | 22.31 | % | ||||||||
| Investment securities available for sale | 40.98 | 33.70 | 29.11 | |||||||||||
| Federal Home Loan Bank stock | 0.23 | 0.21 | 0.22 | |||||||||||
| Total loans, net (2) | 40.96 | 41.46 | 41.77 | |||||||||||
| Premises and equipment, net | 2.15 | 2.15 | 2.29 | |||||||||||
| Bank-owned life insurance | 3.74 | 3.67 | 3.70 | |||||||||||
| Other assets | 0.88 | 0.52 | 0.60 | |||||||||||
| Total assets | 100.00 | % | 100.00 | % | 100.00 | % | ||||||||
| Total deposits | 76.88 | % | 76.96 | % | 78.27 | % | ||||||||
| Federal Home Loan Bank advances | 2.08 | 1.65 | - | |||||||||||
| Other liabilities | 1.91 | 2.10 | 2.30 | |||||||||||
| Total liabilities | 80.87 | 80.71 | 80.57 | |||||||||||
| Total equity | 19.13 | 19.29 | 19.43 | |||||||||||
| Total liabilities and equity | 100.00 | % | 100.00 | % | 100.00 | % | ||||||||
|
(1) |
Includes interest-bearing and time deposits with other financial institutions. |
|
(2) |
Includes loans held for sale. |
| Source: North Shore MHC, financial statements. |
Total net loans (including loans held for sale) decreased during the first half of 2021 as total loan sales and principal repayments exceeded total loan originations. Consistent with its interest rate risk strategy, the Company has continued to sell, on a servicing released basis, a portion of its fixed-rate, one- to four-family residential mortgage originations. As a result of the recent decrease in the Company’s loan portfolio, the percentage of total net loans decreased from 41.8% of total assets at December 31, 2019 to 41.0% of total assets at June 30, 2021.
10
Feldman Financial Advisors, Inc.
Cash and cash equivalents have decreased by $26.0 million from $52.6 million at December 31, 2019 to $26.6 million at June 30, 2021. The decrease in cash and cash equivalentsprimarily reflected outgoing cash flows to purchase increased amounts of investment securities available for sale, which increased by $29.7 million from $68.6 million at December 31, 2019 to $98.3 million at June 30, 2021. The increased level of securities was related to the Company’s objectives to manage interest rate risk and increase yields on earning assets. As a result of the reallocation of liquidity, aggregate cash and cash equivalents decreased from 22.3% of total assets at December 31, 2019 to 11.1% at June 30, 2021. Concurrently, investment securities increased from 29.1% of assets at December 31, 2019 to 41.0% of total assets at June 30, 2021.
The balance sheet value of bank-owned life insurance (“BOLI”) increased moderately from $8.7 million at December 31, 2019 to $9.0 million at June 30, 2021. BOLI provides the Company with a funding offset for employee benefit plans and obligations and also generates non-interest that generally is non-taxable. The percentage of BOLI to total assets measured 3.7% of total assets at June 30, 2021.
The largest segment of the Company’s loan portfolio comprises residential estate mortgage loans. As of June 30, 2021, one- to four-family residential mortgage loans accounted for 89.7% of total loans as illustrated in Exhibit II-3. The Company’s loan portfolio also included smaller concentrations of multi-family real estate loans (5.3% of total loans), commercial real estate loans (4.7% of total loans), and consumer loans (0.3% of total loans) at June 30, 2021.
Exhibit II-4 details the Company’s recent lending activity. For the six months ended June 30, 2021, the Company originated $23.8 million of loans, including $22.7 million of one- to four-family residential mortgage loans and $1.0 million of commercial real estate loans. For the year ended December 31, 2020, the Company originated $56.5 million of loans, including $52.7 million of one- to four-family residential mortgage loans and $3.5 million of commercial real estate loans. The Company’s loan sales amounted to $35.3 million for the year ended December 31, 2020 and $13.3 million for the six months ended June 30, 2021. The Company considers its balance sheet and interest rate risk management objectives along with prevailing market conditions in making decisions as whether to hold or sell originated residential mortgage loans.
11
Feldman Financial Advisors, Inc.
At June 30, 2021, the Company had $87.9 million in one- to four-family residential mortgage loans, which represented 89.7% of total loans. Of the one- to four-family mortgage loans due after June 30, 2022, approximately $72.8 million or 84.4% consisted of fixed-rate loans and $13.4 million or 15.6% consisted of adjustable-rate loans. A small portion of the Company’s one- to four-family residential mortgage loans are considered non-conforming due to factors such as the borrower’s job status or income, the condition or age of the residence or other factors and are not readily saleable into the secondary mortgage market. The Company generally limits the loan-to-value ratios of its residential mortgage loans to 97% for adjustable-rate loans and 95% for fixed-rate loans, provided that the borrower obtains private mortgage insurance on loans that exceed 80% of the appraised value of the secured property. The Company’s fixed-rate residential mortgage loans are fully amortizing with maturities of up to 30 years, while the adjustable-rate loans have interest rates that either adjust on an annual basis or are fixed for the initial three or five years and then adjust every three or five years thereafter. At June 30, 2021, the average one- to four-family residential mortgage loan size was approximately $147,000.
At June 30, 2021, the Company had $9.8 million in commercial real estate and multi-family real estate loans, which represented 10.0% of total loans. Of this aggregate total, the Company’s commercial real estate loans amounted to $4.6 million and multi-family residential loans amounted to $5.2 million as of June 30, 2021. The Company’s commercial and multi-family real estate lending activity is consistent with its strategy to diversify the loan portfolio and increase the overall portfolio yield with shorter-maturity loans. The commercial real estate loans include 14 loans that are secured primarily by investor properties, which include one- to four-family residences. Additionally, the company has two commercial real estate loans secured by retail frontage. The two largest commercial real loans outstanding at June 30, 2021 were $2.0 million and $1.4 million, both of which were paying in accordance with all their contractual terms. The Company’s multi-family residential mortgage loans are secured by residential properties with more than four units or secured by multiple one- to four-family residential properties. The Company’s largest multi-family loan as of June 30, 2021 was a $940,000 loan secured by various one- to four-family investment homes and one multi-family apartment building located in Waukegan and North Chicago, Illinois, and was performing in accordance with its terms. At June 30, 2021, the average sizes of the Company’s multi-family residential mortgage loans and commercial real estate loans were approximately $347,000 and $169,000, respectively.
12
Feldman Financial Advisors, Inc.
The Company’s consumer loans amounted to $303,000 or 0.3% of the total loan portfolio as of June 30, 2021. The Company offers a limited range of consumer loans, principally to provide a full range of financial products to its customers. The Company’s outstanding consumer loans primarily comprised loans secured by deposits, automobile loans, and unsecured personal loans. During the six months ended June 30, 2021, the Company charged off a $99,000 unsecured consumer loan because it was six months past due but is continuing its collection efforts. There were no consumer loan charge-offs during the years ended December 31, 2019 and 2020.
Exhibit II-5 presents a summary of the Company’s portfolio of cash, short-term liquidity, and investment securities as of December 31, 2019 and 2020 and June 30, 2021. The Company’s primary investment objectives include the following: (1) manage the interest rate sensitivity of the balance sheet; (2) generate a favorable return without incurring undue interest rate and credit risk; (3) complement and supplement lending activities; and (4) provide and maintain liquidity to meet deposit withdrawal and loan funding needs. The Company’s investment strategies and policies are established by the Board of Directors.
13
Feldman Financial Advisors, Inc.
At June 30, 2021, the Company’s aggregate cash and investments amounted to $125.4 million or 52.3% of total assets. Cash and cash equivalents (including interest-bearing deposits and certificates of deposit with other financial institutions) amounted to $26.5 million or 11.1% of the Company’s total assets as of June 30, 2021. Cash and cash equivalents decreased from $52.6 million or 22.3% of total assets as of December 31, 2019 as excess liquidity has been reallocated into investment securities. The Company’s available-for-sale securities portfolio totaled $98.3 million or 41.0% of total assets at June 30, 2021 and was composed of $49.7 million of mortgage-backed securities, $29.0 million of collateralized mortgage obligations, $11.1 million of municipal obligations, and $8.4 million of U.S. Government and agency obligations. The Company’s mortgage-backed securities and obligations are issued by U.S. Government-sponsored enterprises. The Company’s available-for-sale investment securities portfolio had a weighted average yield of 1.66% at June 30, 2021. The Company also owned $550,000 of stock in the FHLB of Chicago as of June 30, 2021.
Liability Composition
Deposits are the Company’s primary external source of funds for lending and investment purposes. Exhibit II-6 presents a summary of the Company’s deposit composition as of December 31, 2019 and 2020 and June 30, 2021. Total deposits amounted to $184.4 million or 76.9% of total assets and 95.1% of total liabilities at June 30, 2021. Total deposits decreased by 1.1% or $2.0 million from $186.4 million at December 31, 2020 to $184.4 million at June 30, 2021. The Company’s certificate accounts decreased by $4.1 million in the first half of 2021, while core transaction accounts increased by $2.1 million. The ratio of core transaction accounts to total deposits has increased from 61.0% at December 31, 2019 to 65.4% at June 30, 2021, while the concentration of certificate accounts decreased from 39.0% to 34.6% over the same time period.
14
Feldman Financial Advisors, Inc.
The Company relies on customer service and longstanding relationships with customers in its primary market area to attract and retain deposits. Deposit account terms vary according to the minimum balance required, the time period that funds must remain on deposit, and the interest rate, among other factors. In determining the rates and terms of its deposit accounts, the Company considers the rates offered by competitors, liquidity needs, growth objectives, current operating strategies, and customer preferences and concerns. The Company has placed a concerted emphasis on attracting core transaction deposit accounts, which tend to represent lower cost and more stable funding sources. For the six months ended June 30, 2021, the Company’s weighted average cost of core deposits was 0.13%, the weighted average cost of certificate accounts was 1.24%, and the overall weighted average cost of deposits was 0.50%, reflecting a decline from the corresponding overall costs of 0.94% and 0.77% for the years ended December 31, 2019 and 2020, respectively.
As a member of the FHLB of Chicago, the Company may obtain FHLB borrowings based upon the security of FHLB capital stock owned and certain of the Company’s real estate mortgage loans. Historically, the Company has not utilized FHLB borrowings as a source of funds. However, the Company obtained a $4.0 million, zero-rate FHLB advance in May 2020 that subsequently matured in May 2021. The Company replaced the matured borrowing with a $5.0 million, zero-rate FHLB advance that matures in May 2022.
Equity Capital
The Company has historically maintained strong capital levels. The Company’s total equity amounted to $45.8 million or 19.13% of total assets at June 30, 2021. The ratio of total equity to assets decreased from 19.43% at December 31, 2019 and 19.29%at December 31, 2020 as the rate of moderate asset expansion outpaced the rate of capital formation due to the Company’s net operating losses in 2020 and the first half of 2021. The Company’s total equity increased by $961,000 from $45.8 million at year-end 2019 to $46.7 million at year-end largely due to an increase of $1.1 million in the Company’s accumulated other comprehensive income (“AOCI”). The Company’s AOCI is affected mainly by unrealized gains (or losses) on available-for-sale securities. The Company’s total equity decreased by $851,000 from $46.7 million at December 31, 2020 to $45.9 million at June 30, 2021 due to a decrease of $836,000 in AOCI related a decrease in the level of unrealized gains on available-for-sale securities.
15
Feldman Financial Advisors, Inc.
The Bank’s capital level remains strong in comparison to minimum regulatory requirements. The Bank’s equity capital amounted to $44.8 million or 18.69% of total assets at December 31, 2020. The Bank has opted into the Community Bank Leverage Ratio (“CBLR”) framework, which simplifies the financial reporting requirements for regulatory capital compliance for qualifying institutions. As of June 30, 2021, the Bank’s CBLR (equal to the tier 1 leverage capital ratio) was 18.45% which exceeded the regulatory capital requirement, and the Bank was considered to be well capitalized. To be considered well capitalized using the CBLR framework at June 30, 2021 required a ratio of 8.50% or higher.
While not applicable due to the Bank’s election of the CBLR framework, the Bank’s regulatory capital ratios of tier 1 leverage capital, common equity tier 1 risk-based capital, tier 1 risk-based capital, and total risk-based capital measured 18.45%, 51.60%, 51.60%, and 52.51%, respectively, as of June 30, 2021. In comparison, the minimum regulatory requirements under federal banking agency guidelines were 4.00%, 4.50%, 6.00%, and 8.00%, and the threshold requirements for regulatory well capitalized levels were 5.00%, 6.50%, 8.00%, and 10.00%, respectively, under prompt correction action provisions.
16
Feldman Financial Advisors, Inc.
Income and Expense Trends
Table 3 displays the main components of the Company’s earnings performance for the years ended December 31, 2019 and 2020 and the six months ended June 30, 2020 and 2021. Table 4 displays the Company’s principal income and expense ratios as a percent of average assets for the corresponding periods. Table 5 displays the Company’s weighted average yields on interest-earning assets and weighted average costs of interest-bearing liabilities.
General Overview
Over recent years, the Company has exhibited a recurring trend of low or negative earnings. The Company’s net income amounted to $414,000 for the year ended December 31, 2019 but declined to a net loss of -$112,000 for the year ended December 31, 2020 and a net loss of -$14,000 for the six months ended June 30, 2021. The Company reported a return on average assets (“ROA”) of 0.18% and -0.05% for 2019 and 2020, respectively, and -0.01% annualized for the six months ended June 30, 2021. The Company reported a return on average equity (“ROE”) of 0.92% and -0.24% for 2019 and 2020, respectively, and -0.06% annualized for the first half of 2021.
Compared to its asset size peer group of FDIC-insured savings institutions, the Company’s ROA of 0.18% in 2019 lagged the peer group average of 0.56% and its ROA of -0.05% in 2020 trailed the peer group average of 0.53%. Similarly, the Company’s annualized ROA of -0.01% for the first half of 2020 was below the peer group average of 0.58%. Compared to its regulatory peer group on a historical basis, the Company’s profitability trends are characterized by below-average levels of net interest income and non-interest income ratios, offset partially by lower non-interest expense ratios. The Company’s net interest margin of 1.86% for the first half of 2021 measured below the peer group average of 2.86% primarily due to the Company’s lower level of total net loans to assets, which measured 41.0% versus the peer group average of 61.4%.
17
Feldman Financial Advisors, Inc.
Table 3
Income Statement Summary
For the Years Ended December 31, 2019 and 2020
And the Six Months Ended June 30, 2020 and 2021
(Dollars in Thousands)
|
|
|
Six Months Ended |
|
Year Ended |
||||||||||||||||||
|
|
|
2021 |
2020 |
|
2020 |
|
2019 |
|||||||||||||||
|
|
|
|
|
|
|
|
|
|
|
|
|
|
|
|
|
|
||||||
|
Interest income |
|
$ |
2,565 |
|
|
$ |
3,272 |
|
|
$ |
6,011 |
|
|
$ |
7,012 |
|
||||||
|
Interest expense |
|
|
490 |
|
|
|
840 |
|
|
|
1,488 |
|
|
|
1,726 |
|
||||||
|
Net interest income |
|
|
2,075 |
|
|
|
2,432 |
|
|
|
4,523 |
|
|
|
5,286 |
|
||||||
|
Provision for loan losses |
|
|
17 |
|
|
|
220 |
|
|
|
464 |
|
|
|
97 |
|
||||||
|
Net interest income after provision |
|
|
2,058 |
|
|
|
2,212 |
|
|
|
4,059 |
|
|
|
5,189 |
|
||||||
|
|
|
|
|
|
|
|
|
|
|
|
|
|
|
|
|
|
||||||
|
Service charges on deposit accounts |
|
|
141 |
|
|
|
127 |
|
|
|
255 |
|
|
|
241 |
|
||||||
|
Gain on sale of mortgage loans |
|
|
245 |
|
|
|
146 |
|
|
|
787 |
|
|
|
285 |
|
||||||
|
Gain on sale of securities |
|
|
- |
|
|
|
59 |
|
|
|
59 |
|
|
|
- |
|
||||||
|
Gain on sale of other real estate owned |
|
|
- |
|
|
|
- |
|
|
|
- |
|
|
|
38 |
|
||||||
|
BOLI income |
|
|
88 |
|
|
|
90 |
|
|
|
182 |
|
|
|
188 |
|
||||||
|
Other income |
|
|
130 |
|
|
|
88 |
|
|
|
319 |
|
|
|
115 |
|
||||||
|
Total non-interest income |
|
|
604 |
|
|
|
510 |
|
|
|
1,603 |
|
|
|
867 |
|
||||||
|
|
|
|
|
|
|
|
|
|
|
|
|
|
|
|
|
|
||||||
|
Salaries and employee benefits |
|
|
1,691 |
|
|
|
1,799 |
|
|
|
3,691 |
|
|
|
3,514 |
|
||||||
|
Occupancy and equipment |
|
|
341 |
|
|
|
352 |
|
|
|
689 |
|
|
|
770 |
|
||||||
|
Data processing |
|
|
328 |
|
|
|
247 |
|
|
|
565 |
|
|
|
463 |
|
||||||
|
Foreclosure expenses |
|
|
8 |
|
|
|
3 |
|
|
|
12 |
|
|
|
38 |
|
||||||
|
Other expense |
|
|
545 |
|
|
|
628 |
|
|
|
1,320 |
|
|
|
943 |
|
||||||
|
Total non-interest expense |
|
|
2,913 |
|
|
|
3,028 |
|
|
|
6,277 |
|
|
|
5,728 |
|
||||||
|
|
|
|
|
|
|
|
|
|
|
|
|
|
|
|
|
|
||||||
|
Income (loss) before income taxes |
|
|
(251 |
) |
|
|
(306 |
) |
|
|
(615 |
) |
|
|
328 |
|
||||||
|
Income tax benefit |
|
|
(237 |
) |
|
|
(82 |
) |
|
|
(503 |
) |
|
|
(86 |
) |
||||||
|
Net income (loss) |
|
$ |
(14 |
) |
|
$ |
(224 |
) |
|
$ |
(112 |
) |
|
$ |
414 |
|
||||||
| Source: North Shore MHC, financial statements. |
Years Ended December 31, 2019 and 2020
Net income declined from $414,000 in 2019 to a net loss of -$112,000 in 2020. The primary reasons for the net loss in 2020 compared to 2019 were a $763,000 decrease in net interest income, a $549,000 increase in non-interest expense, and a $367,000 increase in the provision for loan losses, offset partially by a $736,000 increase in non-interest income and a $417,000 increase in the income tax benefit. The decline in net interest income was largely attributable to a decline in the Company’s net interest spread from 2.29% in 2019 to 1.86% in 2020 and an accompanying decline in the net interest margin from 2.49% in 2019 to 2.02% in 2020. The decreases in the net interest rate spread and net interest margin were mainly the result of a continuing low interest rate environment that reduced the average yields on earning assets in an amount that exceeded the reduction in the cost of funds.
18
Feldman Financial Advisors, Inc.
The increase in the provision for loan losses in 2020 reflected a combination of factors. The Company’s non-performing loans increased from $65,000 at December 31, 2019 to $355,000 at December 31, 2020. The Company also took into consideration the loan growth during the year and the uncertainty surrounding the economic impact of the coronavirus pandemic. As a result of the increased provision, the Company’s allowance for loan losses increased from $389,000 or 0.40% of total portfolio loans at December 31, 2019 to $870,000 or 0.88% of total portfolio loans at December 31, 2020.
The Company’s non-interest income increased by $736,000 from $867,000 in 2019 to $1.6 million in 2020. As a result, the ratio of non-interest income to average assets increased from 0.38% in 2019 to 0.67% in 2020. The increase in non-interest income was primarily due to a $502,000 increase in gain on sale of mortgage loans. The Company’s loan sale volume increased from $16.9 million in 2019 to $36.5 million in 2020.
The Company’s non-interest expense increased by $549,000 from $5.7 million in 2019 to $6.3 million in 2020, reflecting an increase in the non-interest expense to average assets ratio from 2.50% in 2019 to 2.62% in 2020. The primary increase in non-interest expense was salaries and employee benefits increasing by 5.0% or $177,000 from $3.5 million in 2019 to $3.7 million in 2020. Additionally, the increase in non-interest expense was driven by increases in data processing costs and professional services.
19
Feldman Financial Advisors, Inc.
Table 4
Income Statement Ratios
For the Years Ended December 31, 2019 and 2020
And the Six Months Ended June 30, 2020 and 2021
(Percent of Average Assets)
|
|
|
Year Ended |
|
|
Year Ended |
|
||||||||||||
|
|
|
2021 |
|
|
2020 |
|
|
2020 |
|
|
2019 |
|
||||||
|
Interest income |
|
|
2.13 |
% |
|
|
2.74 |
% |
|
|
2.50 |
% |
|
|
3.06 |
% |
||
|
Interest expense |
|
|
0.41 |
|
|
|
0.70 |
|
|
|
0.62 |
|
|
|
0.74 |
|
||
|
Net interest income |
|
|
1.72 |
|
|
|
2.03 |
|
|
|
1.88 |
|
|
|
2.31 |
|
||
|
Provision for loan losses |
|
|
0.01 |
|
|
|
0.18 |
|
|
|
0.19 |
|
|
|
0.04 |
|
||
|
Net interest income after provision |
|
|
1.71 |
|
|
|
1.85 |
|
|
|
1.69 |
|
|
|
2.26 |
|
||
|
|
|
|
|
|
|
|
|
|
|
|
|
|
|
|
|
|
||
|
Service charges on deposit accounts |
|
|
0.12 |
|
|
|
0.11 |
|
|
|
0.11 |
|
|
|
0.11 |
|
||
|
Gain on sale of mortgage loans |
|
|
0.20 |
|
|
|
0.12 |
|
|
|
0.33 |
|
|
|
0.12 |
|
||
|
Gain on sale of securities |
|
|
0.00 |
|
|
|
0.05 |
|
|
|
0.02 |
|
|
|
0.00 |
|
||
|
Gain on sale of other real estate owned |
|
|
0.00 |
|
|
|
0.00 |
|
|
|
0.00 |
|
|
|
0.02 |
|
||
|
BOLI income |
|
|
0.07 |
|
|
|
0.08 |
|
|
|
0.08 |
|
|
|
0.08 |
|
||
|
Other income |
|
|
0.11 |
|
|
|
0.07 |
|
|
|
0.13 |
|
|
|
0.05 |
|
||
|
Total non-interest income |
|
|
0.50 |
|
|
|
0.43 |
|
|
|
0.67 |
|
|
|
0.38 |
|
||
|
|
|
|
|
|
|
|
|
|
|
|
|
|
|
|
|
|
||
|
Salaries and employee benefits |
|
|
1.40 |
|
|
|
1.50 |
|
|
|
1.54 |
|
|
|
1.53 |
|
||
|
Occupancy and equipment |
|
|
0.28 |
|
|
|
0.29 |
|
|
|
0.29 |
|
|
|
0.34 |
|
||
|
Data processing |
|
|
0.27 |
|
|
|
0.21 |
|
|
|
0.24 |
|
|
|
0.20 |
|
||
|
Foreclosure expenses |
|
|
0.01 |
|
|
|
0.00 |
|
|
|
0.00 |
|
|
|
0.02 |
|
||
|
Other expense |
|
|
0.45 |
|
|
|
0.52 |
|
|
|
0.55 |
|
|
|
0.41 |
|
||
|
Total non-interest expense |
|
|
2.42 |
|
|
|
2.53 |
|
|
|
2.62 |
|
|
|
2.50 |
|
||
|
|
|
|
|
|
|
|
|
|
|
|
|
|
|
|
|
|
||
|
Income (loss) before income taxes |
|
|
(0.21 |
) |
|
|
(0.26 |
) |
|
|
(0.26 |
) |
|
|
0.13 |
|
||
|
Income tax benefit |
|
|
(0.20 |
) |
|
|
(0.07 |
) |
|
|
(0.21 |
) |
|
|
(0.04 |
) |
||
|
Net income (loss) |
|
|
(0.01 |
) |
|
|
(0.19 |
) |
|
|
(0.05 |
) |
|
|
0.18 |
|
||
| Source: North Shore MHC, financial statements and internal data. |
Six Months Ended June 30, 2020 and 2021
The Company reported a net loss of -$14,000 for the first half of 2021, as compared to a net loss of -$224,000 for the first half of 2020. The decrease in the loss for the 2021 period was chiefly attributable to a $203,000 decrease in the provision for loan losses and a $155,000 increase in the income tax benefit, offset partially by a $357,000 decrease in net interest income.
20
Feldman Financial Advisors, Inc.
Net interest income decreased by 14.7% or $357,000 from $2.4 million for the six months ended June 30, 2020 to $2.1 million for the six months ended June 30, 2021. The Company’s net interest spread declined from 2.00% for the first half of 2020 to 1.75% for the first half of 2021, while the net interest margin declined from 2.18% to 1.86% over the corresponding period. The Company’s weighted average yield on interest-earning assets measured 2.30% for the six months ended June 30, 2021 and its weighted average cost of interest-bearing liabilities was 0.55%. Over the comparable periods, the yield on interest-earning assets declined by 64 basis points and the cost of interest -bearing liabilities declined by only 39 basis points.
Non-interest income increased by $94,000 or 18.4% from $510,000 in the first half of 2020 to $604,000 for the first half of 2021. The increase in non-interest income was largely due to a $99,000 increase in gain on sale of mortgage loans from $146,000 in the first half of 2020 to $245,000 in the first half of 2021. The annualized ratio of non-interest income to average assets increased from 0.43% for the six months ended June 30, 2020 to 0.50% for the six months ended June 30, 2021.
Non-interest expense decreased by $115,000 or 3.8% from $3.0 million in the first half of 2020 to $2.9 million in the first half of 2021. The decrease in non-interest expense mainly reflected a $108,000 or 6.0% decrease in salaries and employee benefits from $1.8 million in the first half of 2020 to $1.7 million in the first half of 2021. The number of full-time equivalent employees decreased to 35 at June 30, 2021 as compared to 39 at June 30, 2020. This decrease was offset partially by an increase of $81,000 in data processing costs, which was related to an increase in network management costs as a result of technology upgrades to promote new products, services, and technology. The annualized ratio of non-interest expense to average assets decreased from 2.53% for the first half of 2020 to 2.42% for the first half of 2021.
21
Feldman Financial Advisors, Inc.
Table 5
Yield and Cost Summary
For the Years Ended December 31, 2019 and 2020
And the Six Months Ended June 30, 2020 and 2021
|
|
|
|
|
|
|
|
|
|
|
|||||||||
|
|
|
Six Months |
|
|
Year Ended |
|
||||||||||||
|
|
|
June 30, |
|
|
December 31, |
|
||||||||||||
|
|
|
|
2021 |
(1) |
|
|
2020 |
(1) |
|
|
2020 |
|
|
|
2019 |
|
||
|
Weighted Average Yields |
|
|
|
|
|
|
|
|
|
|
|
|
|
|
|
|
||
|
Loans receivable |
|
|
3.68 |
% |
|
|
4.26 |
% |
|
|
4.05 |
% |
|
|
4.42 |
% |
||
|
Federal funds sold and int.-bearing deposits |
|
|
0.08 |
|
|
|
0.64 |
|
|
|
0.37 |
|
|
|
2.06 |
|
||
|
Time deposits with other financial institutions |
|
|
1.08 |
|
|
|
2.39 |
|
|
|
2.11 |
|
|
|
2.66 |
|
||
|
Securities available for sale |
|
|
1.54 |
|
|
|
2.36 |
|
|
|
2.03 |
|
|
|
2.32 |
|
||
|
Federal Home Loan Bank stock |
|
|
2.26 |
|
|
|
2.34 |
|
|
|
2.54 |
|
|
|
2..13 |
|
||
|
Total interest-earning assets |
|
|
2.30 |
|
|
|
2.94 |
|
|
|
2.69 |
|
|
|
3.30 |
|
||
|
Weighted Average Costs |
|
|
|
|
|
|
|
|
|
|
|
|
|
|
|
|
||
|
Interest-bearing demand |
|
|
0.04 |
|
|
|
0.10 |
|
|
|
0.08 |
|
|
|
0.09 |
|
||
|
Money market accounts |
|
|
0.20 |
|
|
|
0.64 |
|
|
|
0.47 |
|
|
|
1.05 |
|
||
|
Savings accounts |
|
|
0.15 |
|
|
|
0.25 |
|
|
|
0.24 |
|
|
|
0.24 |
|
||
|
Certificates of deposit accounts |
|
|
1.24 |
|
|
|
1.71 |
|
|
|
1.62 |
|
|
|
1.55 |
|
||
|
Total interest-bearing deposits |
|
|
0.56 |
|
|
|
0.94 |
|
|
|
0.84 |
|
|
|
1.01 |
|
||
|
Federal Home Loan Bank borrowings |
|
|
0.00 |
|
|
|
0.00 |
|
|
|
0.00 |
|
|
|
0.00 |
|
||
|
Total interest-bearing liabilities |
|
|
0.55 |
|
|
|
0.94 |
|
|
|
0.83 |
|
|
|
1.01 |
|
||
|
Net interest rate spread (2) |
|
|
1.75 |
|
|
|
2.00 |
|
|
|
1.86 |
|
|
|
2.29 |
|
||
|
Net interest margin (3) |
|
1.86 |
|
|
|
2.18 |
|
|
|
2.02 |
|
|
|
2.49 |
|
|||
|
(1) |
Annualized ratios for the period. |
|
(2) |
Weighted average yield on interest-earning assets less the weighted average cost of interest-bearing liabilities. |
|
(3) |
Net interest income divided by average total interest-earning assets. |
| Source: North Shore MHC, financial data. |
The Company recorded an income tax benefit of $237,000 in the six months ended June 30, 2021, which reduced the pre-tax loss of -$251,000 to a net loss of -$14,000. Similarly, the Company recognized an income tax benefit of $82,000 in the six months ended June 30, 2020, which reduced the pre-tax loss of -$305,000 to a net loss of -$224,000. Previously, the Company recognized an income tax benefit of $503,000 in the year-ended December 31, 2020, which reduced the pre-tax loss of -$615,000 for the year to a net loss of -$112,000.
22
Feldman Financial Advisors, Inc.
Interest Rate Risk Management
The Company seeks to reduce its earnings vulnerability and capital risk to changes in market interest rates by managing the mismatch between asset and liability maturities and interest rates. The Company’s Asset/Liability Committee (“ALCO”) focuses on ensuring a stable and steadily increasing flow of net interest income through managing the asset and liability mix of the balance sheet. The ALCO is expected to integrate the Company’s asset/liability management process into its operational decision making, including portfolio structure, investments, business planning, funding decisions, and pricing. The ALCO is responsible for evaluating the interest rate risk inherent in the Company’s assets and liabilities, for determining the level of risk that is appropriate given the Company’s business strategy, operating environment, capital, liquidity, and performance objectives, and for managing this risk consistent with the policy and guidelines approved by the Board of Directors.
The Company attempts to manage its interest rate risk to minimize the exposure of earnings and capital to changes in market interest rates. The Company has implemented various strategies to manage its interest rate risk. By enacting these strategies, the Company believes that it is better positioned to react to changes in market interest rates. These strategies include:
| ● | Originating loans with adjustable interest rates. |
| ● | Promoting core deposit products. |
| ● | Selling a portion of fixed-rate one-to four -family residential mortgage loans. |
| ● | Maintaining investments as available -for-sale securities. |
| ● | Maintaining a meaningful level of assets in short-term liquidity holdings. |
| ● | Maintaining a substantial capital position, so as to increase the ratio of interest-earning assets relative to interest-rate sensitivity funding sources. |
| ● | Adjusting the size of the balance sheet. |
| ● | Modifying loan and deposit pricing/terms to influence customer behavior. |
23
Feldman Financial Advisors, Inc.
The Company monitors its interest rate sensitivity management through the use of models which generate estimates of the change in its net portfolio value (“NPV”) of equity over a range of interest rate scenarios. NPV represents the market value of portfolio equity, which is different from book value, and is equal to the market value of assets minus the market value of liabilities (representing the difference between incoming and outgoing discounted cash flows of assets and liabilities) with adjustments made for off-balance sheet items. The NPV ratio, under any interest rate scenario, is defined as the NPV in that scenario divided by the market value of assets in the same scenario. Table 6 sets forth the Company’s NPV as of June 30, 2021 and reflects the changes to NPV as a result of immediate and sustained changes in interest rates as indicated.
Table 6
Net
Portfolio Value of Equity
As of June 30, 2021
(Dollars in Thousands)
| Basis Point Change in Interest Rates (1) |
Estimated NPV (2) ($000s) |
Amount Change from Base ($000s) |
Percent Change from Base |
NPV Ratio (3) |
Basis Point Change in NPV Ratio | |||||||||||||||
| + 300 b.p. | $ | 29,102 | $ | (18,007 | ) | (38.22 | )% | 13.56 | % | (599) b.p. | ||||||||||
| + 200 b.p. | 35,244 | (11,865 | ) | (25.19 | )% | 15.79 | % | (376)b.p. | ||||||||||||
| + 100 b.p. | 41,654 | (5,455 | ) | (11.58 | )% | 17.92 | % | (163) b.p. | ||||||||||||
| Base | 47,109 | -- | -- | 19.55 | % | -- | ||||||||||||||
| - 100 b.p. | 51,440 | 4,331 | 9.19 | % | 20.85 | % | 130 b.p. | |||||||||||||
| - 200 b.p. | 52,744 | 5,635 | 11.96 | % | 21.26 | % | 171 b.p. | |||||||||||||
| (1) | Assumes an instantaneous uniform change in interest rates at all maturities. |
| (2) | NPV is the discounted present value of expected cash flows from assets, liabilities, and off-balance sheet contracts. |
| (3) | NPV ratio represents NPV divided by the present value of assets, which is calculated as the discounted value of incoming cash flows on interest-earning assets. |
Source: North Shore MHC, financial data.
24
Feldman Financial Advisors, Inc.
The table above indicates that at June 30, 2021, in the event of an instantaneous parallel 100 basis point increase in interest rates, the Company would experience an 11.6% decrease in NPV. In the event of an instantaneous 100 basis point decrease in interest rates, the Company would experience a 9.2% increase in NPV. The NPV simulations give no effect to any steps that the Company might take to counter the impact of such interest rate movement.
In addition to modeling changes in NPV, the Company also analyzes potential changes to net interest income for a 12-month period under rising and falling interest rate scenarios. The Company estimates its net interest income for a 12-month period, and then calculates what net interest income would be for the same period under the assumptions that the U.S. Treasury yield curve increases or decreases instantly by up to 300 basis points or decreases instantly by up to 200 basis points, in 100 point increments, with changes in interest rates representing immediate and permanent, parallel shifts in the yield curve.
Table 7 below sets forth, as of June 30, 2021, the calculation of the estimated changes in the Company’s net interest income resulting from the designated immediate changes in the U.S. Treasury yield curve. As shown in Table 7, an upward change of 100 basis points in market interest rates would increase net interest income by $30,000 and a downward change of 100 basis points would decrease net interest income by $188,000. An upward change of 200 basis points in market interest rates would decrease net interest income by $84,000 and a downward change of 200 basis points would decrease net interest income by $266,000.
25
Feldman Financial Advisors, Inc.
Table 7
Net
Interest Income Sensitivity
As of June 30, 2021
(Dollars in Thousands)
| Basis Point Change in Interest |
|
Estimated Net Interest Income |
|
Change in Net Interest Income |
|
Percent Change from Level |
||||||
| Rates (1) | ($000s) | ($000s) | (%) | |||||||||
| + 300 b.p. | $4,069 | $(321 | ) | (7.32 | )% | |||||||
| + 200 b.p. | 4,307 | (84 | ) | (1.90 | )% | |||||||
| + 100 b.p. | 4,420 | 30 | 0.69 | % | ||||||||
| Level | 4,390 | -- | -- | |||||||||
| - 100 b.p. | 4,202 | (188 | ) | (4.29 | )% | |||||||
| - 200 b.p. | 4,124 | (266 | ) | (6.06 | )% | |||||||
| (1) | Assumes an immediate uniform change in interest rates at all maturities. | |
| Source: North Shore MHC, financial data. | ||
26
Feldman Financial Advisors, Inc.
Asset Quality
Table 8 summarizes the Company’s total non-performing assets as of December 31, 2019 and 2020 and June 30, 2021. The Company has a solid record of reporting satisfactory asset quality in recent years. Non-performing assets increased from $65,000 at December 31, 2019 to $355,000 at December 31, 2020 and $568,000 at June 30, 2021. Relative to assets, non-performing assets measured 0.03%, 0.15%, and 0.24% as of December 31, 2019, December 31, 2020, and June 30, 2021, respectively. Including performing troubled debt restructurings (“TDRs”), the Company’s adjusted total non-performing assets measured 0.84%, 0.90%, and 0.94% as of year-end 2019, year-end 2020, and June 30, 2021, respectively. As of June 30, 2021, all of the Company’s non-performing assets and TDRs were secured by one-to four -family residential properties.
Table 9 summarizes the Company’s allowance for loan losses (“ALL”) as of and for the years ended December 31, 2019 and 2020 and the six months ended June 30, 2020 and 2021. The allowance for loan losses increased from $389,000 at December 31, 2019 to $870,000 at December 31, 2020, before declining to $792,000 at June 30, 2021. The Company’s provision for loan losses increased from $65,000 in 2019 to $464,000 in 2020 to reflect the expansion of the loan portfolio and the uncertain economic impact of the coronavirus pandemic. As a result, the ratio of the ALL to total loans increased from 0.40% at year-end 2019 to 0.88% at year-end 2020 and measured 0.81% at June 30, 2021. The Company recorded net loan recoveries of $31,000 and $17,000 in 2019 and 2020, respectively. For the six months ended June 30, 2021, the Company recognized net loan charge-offs of $95,000 mainly as a result of a $99,000 charge-off relating to one unsecured consumer loan. The ratio of the ALL to non-performing loans decreased from 245.1% at December 31, 2020 to 158.4% at June 30, 2021. The ratio of the ALL to non-performing loans including TDRs decreased from 40.0% at December 31, 2020 to 36.1% at June 30, 2021.
27
Feldman Financial Advisors, Inc.
Table
8
Non-performing Assets Summary
As of December 31, 2019 and 2020 and June 30, 2021
(Dollars in Thousands)
| June 30, | December 31, | ||||||||||||||
| 2021 | 2020 | 2019 | |||||||||||||
| Non-accruing Loans | |||||||||||||||
| One- to four-family residential | $ | 368 | $ | 280 | $ | 65 | |||||||||
| Multi-family residential | - | - | - | ||||||||||||
| Commercial real estate | - | - | - | ||||||||||||
| Consumer | - | - | - | ||||||||||||
| Total non-accruing loans | 368 | 280 | 65 | ||||||||||||
| Accruing Loans 90 Days or More Past Due | |||||||||||||||
| One- to four-family residential | 132 | 75 | - | ||||||||||||
| Multi-family residential | - | - | - | ||||||||||||
| Commercial real estate | - | - | - | ||||||||||||
| Consumer | - | - | - | ||||||||||||
| Total accruing loans 90+ days past due | 132 | 75 | - | ||||||||||||
| Total non-performing loans | 500 | 355 | 65 | ||||||||||||
| Real estate owned | 68 | - | - | ||||||||||||
| Total non-performing assets | $ | 568 | $ | 355 | $ | 65 | |||||||||
| Performing troubled debt restructurings (TDRs) | 1,696 | 1,824 | 1,902 | ||||||||||||
| Total non-performing assets and TDRs (1) | $ | 2,264 | $ | 2,179 | $ | 1,967 | |||||||||
| Total non-accruing loans to total loans | 0.38% | 0.28% | 0.07% | ||||||||||||
| Total non-performing loans to total loans | 0.51% | 0.36% | 0.07% | ||||||||||||
| Total non-performing loans to total assets | 0.21% | 0.15% | 0.03% | ||||||||||||
| Total non-performing assets to total assets | 0.24% | 0.15% | 0.03% | ||||||||||||
| Total non-performing assets to total assets (1) | 0.94% | 0.90% | 0.84% | ||||||||||||
(1) Including performing troubled debt restructurings.
Source: North Shore MHC, financial data.
28
Feldman Financial Advisors, Inc.
Table
9
Allowance for Loan Losses
As of or For the Years Ended December 31, 2019 and 2020
And the Six Months Ended June 30, 2020 and 2021
(Dollars in Thousands)
| Six Months Ended June 30, | Year Ended December 31, | ||||||||||||||
| 2021 | 2020 | 2019 | |||||||||||||
| Allowance at beginning of period | $ | 870 | $ | 389 | $ | 261 | |||||||||
| Charge-offs: | |||||||||||||||
| One- to four-family residential | - | - | - | ||||||||||||
| Multi-family residential | - | - | - | ||||||||||||
| Commercial real estate | - | - | - | ||||||||||||
| Consumer | (99 | ) | - | - | |||||||||||
| Total charge-offs | (99 | ) | - | - | |||||||||||
| Recoveries: | |||||||||||||||
| One- to four-family residential | 4 | 17 | 31 | ||||||||||||
| Multi-family residential | - | - | - | ||||||||||||
| Commercial real estate | - | - | - | ||||||||||||
| Consumer | - | - | - | ||||||||||||
| Total recoveries | 4 | 17 | 31 | ||||||||||||
| Net (charge-offs) recoveries | (95 | ) | 17 | 31 | |||||||||||
| Provision for loan losses | 17 | 464 | 97 | ||||||||||||
| Allowance at end of period | $ | 792 | $ | 870 | $ | 389 | |||||||||
| Allowance to non-performing loans | 158.40% | 245.07% | 598.46% | ||||||||||||
| Allowance to non-accrual loans | 215.22% | 310.71% | 598.46% | ||||||||||||
| Allowance to non-performing loans and TDRs | 36.07% | 39.93% | 19.78% | ||||||||||||
| Allowance to gross total loans | 0.81% | 0.88% | 0.40% | ||||||||||||
| Net (charge-offs) recoveries to average loans | (0.10)% | 0.02% | 0.03% | ||||||||||||
Source: North Shore MHC, financial data.
29
Feldman Financial Advisors, Inc.
Office Facilities
The Company currently conducts business from its main office in Waukegan, Illinois, and two branch offices in Waukegan and Lindenhurst, Illinois, respectively. The Company also operates a loan production office in Chicago, Illinois. Exhibit II-8 provides summary information about the Company’s office properties. The net book value of the Company’s office properties totaled $4.9 million at June 30, 2021. The Company believes that its current facilities are adequate to meet its present and foreseeable needs, subject to possible future expansion. The Company is currently reviewing sites to add up to three additional loan production offices in its surrounding communities over the next few years.
30
Feldman Financial Advisors, Inc.
Market Area
Overview of Market Area
The Company is headquartered in Waukegan, Illinois. In addition to its main office, the Company has two additional full-service offices in Waukegan and Lindenhurst, Illinois, respectively, and one loan production office in Chicago, Illinois. The Company’s market area consists of Lake County and Cook County, which are located in Illinois, and Kenosha County, which is located in Wisconsin. A map of the Company’s office network is presented below.

31
Feldman Financial Advisors, Inc.
The largest city in and the county seat of Lake County, Waukegan is located approximately halfway between Downtown Chicago and Milwaukee Mitchell International Airport. The estimated population of the city in 2021 was 84,914, making it the tenth most populous city in Illinois. Waukegan is a predominantly working-class community with a moderately sized middle-class population. The median household income in Waukegan was $51,250 in 2021.
Lake County is situated in the northeastern corner of Illinois, along the shores of Lake Michigan. Lake County had an estimated population in 2021 of 693,598, making it the third most populous county in Illinois. The county is primarily suburban, with some urban areas and some rural areas. Lake County is surrounded by Cook County and the city of Chicago to the south, McHenry County to the west, and Kenosha County, Wisconsin to the north. Lake County is home to several large national and multinational employers. The largest employers in Lake County are pharmaceutical and healthcare companies, including Abbott Laboratories, AbbVie, and Baxter International. Lake County has a diversified employment base which helps to maintain a relatively stable economy. Lake County is part of the Chicago metropolitan statistical area (“MSA”), the third most populous MSA in the nation.
Kenosha is a city in and the county seat of Kenosha County, Wisconsin. Kenosha is on the southwestern shore of Lake Michigan. The estimated population of the city in 2021 was 98,174, making it the fourth most populous city in Wisconsin. Although closer to Milwaukee, Wisconsin, the city is part of the Chicago, MSA. Once a center of industrial activity, its gradual transition into a hub for the services-based economy has made it a bedroom community within the Chicago and Milwaukee metropolitan areas. Kenosha is home to the headquarters of the tool manufacturer Snap-on Inc. and the clothing company Jockey International. Amazon, Rust-Oleum, Uline, and Associated Wholesale Grocers operate warehouses and distribution centers located in Kenosha.
32
Feldman Financial Advisors, Inc.
Kenosha County had an estimated 2021 population of 170,137, which made it the eighth most populous county in Wisconsin. The county has traditionally attracted newcomers from suburban Chicago. Kenosha County’s improvements in roads, business’s need for personnel, and quality-of-life factors have contributed to a decades-long influx of Illinois transplants, along with the direct rail link to Chicago via Metra’s Union Pacific/North Line. Similar to Lake County, Kenosha County has a diversified employment base and a relatively stable economy.
Table 10 provides selected demographic data for the United States, the Chicago MSA, Cook County (Illinois), Lake County (Illinois), and Kenosha County (Wisconsin). The Chicago MSA had an estimated 2021 population of approximately 9.4 million residents. The Chicago MSA has one of the world’s largest and most diversified economies, with more than 5 million full-time and part-time employees. The region is home to more than 400 major corporate headquarters, including 31 in the Fortune 500. The Chicago area is home to a number of the nation’s leading research universities, including the University of Chicago, Northwestern University, University of Illinois at Chicago, DePaul University, and Loyola University.
With an estimated 2021 population of 5.1 million residents, Cook County is the most populous county in Illinois and the second most populous county in the United States after Los Angeles County, California. More than 40% of all residents of Illinois live in Cook County. The county seat of Cook County is the city of Chicago, which is the most populous city in Illinois and the third most populous city in the United States. Cook County’s population has declined by 1.4% since 2010, compared to the national population growth rate of 7.2% during this period. Cook County had a median household income of $69,884, above the national median of $67,761 but slightly below the Illinois median of $70,396. Cook County’s unemployment rate of 8.8% in July 2021 was above the national rate of 5.7% and the Illinois unemployment rate of 7.0%.
33
Feldman Financial Advisors, Inc.
Table
10
Selected Demographic Data
| United States |
Chicago MSA |
Cook County (Illinois) |
Lake County (Illinois) |
Kenosha County (Wisconsin) | ||||||||||||||||
| Total Population | ||||||||||||||||||||
| 2010 - Base | 308,745,538 | 9,461,105 | 5,194,675 | 703,462 | 166,426 | |||||||||||||||
| 2021 - Current | 330,946,040 | 9,428,289 | 5,121,057 | 693,598 | 170,137 | |||||||||||||||
| 2026 - Projected | 340,574,349 | 9,402,890 | 5,080,149 | 689,306 | 172,112 | |||||||||||||||
| % Change 2010-21 | 7.19% | -0.35% | -1.42% | -1.40% | 2.23% | |||||||||||||||
| % Change 2021-26 | 2.91% | -0.27% | -0.80% | -0.62% | 1.16% | |||||||||||||||
| Age Distribution, 2021 | ||||||||||||||||||||
| 0 - 14 Age Group | 18.32% | 18.36% | 18.63% | 18.73% | 18.06% | |||||||||||||||
| 15 - 34 Age Group | 26.75% | 26.98% | 19.10% | 26.51% | 26.80% | |||||||||||||||
| 35 - 54 Age Group | 25.08% | 26.29% | 27.19% | 25.49% | 25.60% | |||||||||||||||
| 55 - 69 Age Group | 18.44% | 18.00% | 23.58% | 19.18% | 19.50% | |||||||||||||||
| 70+ Age Group | 11.40% | 10.38% | 11.50% | 10.09% | 10.04% | |||||||||||||||
| Median Age (years) | 38.9 | 38.5 | 38.0 | 39.0 | 39.1 | |||||||||||||||
| Total Households | ||||||||||||||||||||
| 2010 - Base | 116,716,292 | 3,475,726 | 1,966,356 | 241,712 | 62,650 | |||||||||||||||
| 2021 - Current | 125,732,798 | 3,508,640 | 1,975,686 | 242,455 | 64,427 | |||||||||||||||
| 2026 - Projected | 129,596,282 | 3,511,017 | 1,970,509 | 241,839 | 65,290 | |||||||||||||||
| % Change 2010-21 | 7.73% | 0.95% | 0.47% | 0.31% | 2.84% | |||||||||||||||
| % Change 2021-26 | 3.07% | 0.07% | -0.26% | -0.25% | 1.34% | |||||||||||||||
| Household Income, 2021 | ||||||||||||||||||||
| < $25,000 | 17.97% | 15.83% | 18.63% | 12.25% | 15.48% | |||||||||||||||
| $25,000 - $49,999 | 20.27% | 17.86% | 19.10% | 15.02% | 20.85% | |||||||||||||||
| $50,000 - $99,999 | 29.03% | 27.88% | 27.19% | 26.43% | 31.36% | |||||||||||||||
| $100,000 - $199,999 | 23.23% | 26.17% | 23.58% | 27.65% | 25.13% | |||||||||||||||
| $200,000+ | 9.51% | 12.26% | 11.50% | 18.65% | 7.17% | |||||||||||||||
| Average Household Income | ||||||||||||||||||||
| 2021 - Current | $96,765 | $109,122 | $103,144 | $137,052 | $90,881 | |||||||||||||||
| 2026 - Projected | $107,191 | $121,129 | $115,125 | $146,023 | $101,599 | |||||||||||||||
| % Change 2021-26 | 10.77% | 11.00% | 11.62% | 6.55% | 11.79% | |||||||||||||||
| Median Household Income | ||||||||||||||||||||
| 2021 - Current | $67,761 | $76,758 | $69,884 | $92,588 | $69,846 | |||||||||||||||
| 2026 - Projected | $73,868 | $85,408 | $77,593 | $98,648 | $76,911 | |||||||||||||||
| % Change 2021-26 | 9.01% | 11.27% | 11.03% | 6.55% | 10.12% | |||||||||||||||
| Unemployment Rate | ||||||||||||||||||||
| December 2019 | 3.4% | 3.2% | 3.2% | 3.6% | 3.0% | |||||||||||||||
| December 2020 | 6.5% | 8.2% | 9.4% | 7.0% | 4.5% | |||||||||||||||
| July 2021 | 5.7% | 7.5% | 8.8% | 4.9% | 4.8% | |||||||||||||||
34
Feldman Financial Advisors, Inc.
Table
10 (continued)
Selected Demographic Data
| United States |
Chicago MSA |
Cook County (Illinois) |
Lake County (Illinois) |
Kenosha County (Wisconsin) | ||||||||||||||||
| Total Housing Units, 2021 | 141,870,120 | 3,887,300 | 2,223,937 | 264,834 | 71,836 | |||||||||||||||
| Owner Occupied | 81,944,178 | 2,313,050 | 1,141,580 | 186,122 | 43,814 | |||||||||||||||
| Renter Occupied | 43,788,620 | 1,195,590 | 834,106 | 56,333 | 20,613 | |||||||||||||||
| Vacant | 16,137,322 | 378,660 | 248,251 | 22,379 | 7,409 | |||||||||||||||
| Owner Occupied | 57.76% | 59.50% | 51.33% | 70.28% | 60.99% | |||||||||||||||
| Renter Occupied | 30.87% | 30.76% | 37.51% | 21.27% | 28.69% | |||||||||||||||
| Vacant | 11.37% | 9.74% | 11.16% | 8.45% | 10.31% | |||||||||||||||
| Owner Occupied Units | ||||||||||||||||||||
| 2021 - Current | 81,944,178 | 2,313,050 | 1,141,580 | 186,122 | 43,814 | |||||||||||||||
| 2026 - Projected | 84,477,023 | 2,314,327 | 1,136,249 | 185,752 | 44,396 | |||||||||||||||
| % Change 2010-21 | 7.84% | 0.84% | -0.20% | 49.00% | 2.90% | |||||||||||||||
| % Change 2021-26 | 3.09% | 0.06% | -0.47% | -0.20% | 1.33% | |||||||||||||||
| Renter Occupied Units | ||||||||||||||||||||
| 2021 - Current | 43,788,620 | 1,195,590 | 834,106 | 56,333 | 20,613 | |||||||||||||||
| 2026 - Projected | 45,119,259 | 1,196,690 | 834,260 | 56,087 | 20,894 | |||||||||||||||
| % Change 2010-21 | 7.51% | 1.16% | 1.41% | -0.29% | 2.71% | |||||||||||||||
| % Change 2021-26 | 3.04% | 0.09% | 0.02% | -0.44% | 1.36% | |||||||||||||||
Source: Claritas; S&P Global; U.S. Bureau of Labor Statistics.
From 2010 to 2021, the population in Lake County declined by 1.4%, while the population in Kenosha County increased by 2.2%. The median ages in Lake County and Kenosha County were similar at 39.0 years and 39.1 years, respectively. The estimated median household income levels in 2021 were $92,588 for Lake County and $69,846 for Kenosha County. By comparison, the median household income levels for the Chicago MSA, Illinois, and Wisconsin were $76,758, $70,395, and $66,361, respectively. The July 2021 unemployment rates for Lake County and Kenosha County were 4.9% and 4.8%, respectively. The unemployment rates in July 2021 for the Chicago MSA, Illinois, and Wisconsin were 7.5, 7.0%, and 415%, respectively.
35
Feldman Financial Advisors, Inc.
Table 11 presents the total employment force by industry sectors in the combined Lake County-Kenosha County Metropolitan Division, the Chicago-Naperville-Arlington Heights Metropolitan Division, and the Chicago MSA. The aggregate labor force numbered 410,100 in the Lake County-Kenosha County Metropolitan Division. As displayed in Table 13, trade, transportation, and utilities (22.5%), professional and business services (17.1%), manufacturing (15.2%), and government (12.0%) accounted for the largest employment concentrations in the combined Lake County-Kenosha County area. The Chicago MSA evidenced the highest labor force concentrations in trade, transportation, and utilities (20.6%), professional and business services (17.8%), education and health services (15.5%), and government (11.7%).
Table
11
Total Employment Force by Industry Sectors
For the Month of June 2021
| Chicago MSA | Chicago-Naperville- Arlington Heights, Illinois (Metropolitan Division) | Lake County- Kenosha County, Illinois-Wisconsin (Metropolitan Division) | ||||||||||||||||||||||
| Industry | Total Employment | % of Total | Total Employment | % of Total | Total Employment | % of Total | ||||||||||||||||||
| Mining and natural resources | 1,800 | 0.04 | 1,300 | 0.04 | 100 | 0.02 | ||||||||||||||||||
| Construction | 178,500 | 3.97 | 134,000 | 3.74 | 15,500 | 3.78 | ||||||||||||||||||
| Manufacturing | 395,000 | 8.79 | 265,100 | 7.40 | 62,400 | 15.22 | ||||||||||||||||||
| Trade, transportation, and utilities | 928,100 | 20.64 | 726,800 | 20.29 | 92,300 | 22.51 | ||||||||||||||||||
| Information | 70,800 | 1.57 | 63,600 | 1.78 | 3,000 | 0.73 | ||||||||||||||||||
| Financial activities | 317,400 | 7.06 | 276,500 | 7.72 | 22,400 | 5.46 | ||||||||||||||||||
| Professional and business services | 799,500 | 17.78 | 676,200 | 18.87 | 70,200 | 17.12 | ||||||||||||||||||
| Education and health services | 696,800 | 15.50 | 576,400 | 16.09 | 42,900 | 10.46 | ||||||||||||||||||
| Leisure and hospitality | 399,600 | 8.89 | 306,300 | 8.55 | 39,400 | 9.61 | ||||||||||||||||||
| Other services | 182,400 | 4.06 | 150,000 | 4.19 | 12,600 | 3.07 | ||||||||||||||||||
| Government | 526,000 | 11.70 | 406,600 | 11.35 | 49,300 | 12.02 | ||||||||||||||||||
| Total Employment | 4,495,900 | 100.00 | 3,582,800 | 100.00 | 410,100 | 100.00 | ||||||||||||||||||
Source: U.S. Bureau of Labor Statistics.
36
Feldman Financial Advisors, Inc.
Overview of Office Network
Table 12 provides deposit data for the Company’s full-service banking offices from June 30, 2015 to June 30, 2020. The Company’s deposits increased by 6.1% over the observed one-year period and declined by 1.4% over the five-year period. The Company’s largest office based on deposits is the main office in Waukegan, which had total deposits of $130.8 million or 67.8% of the Company’s total deposits at June 30, 2020. The deposits at the main office have decreased from 70.3% of the Company’s total deposits at June 30, 2015 to 67.8% of the Company’s total deposits at June 30, 2020.
The branch office on North Green Bay Road in Waukegan experienced deposit growth of 8.3% from $38.7 million at June 30, 2015 to $41.9 million at June 30, 2020. The Lindenhurst branch office exhibited deposit growth of 3.5% from $19.4 million at June 30, 2015 to $20.1 million at June 30, 2020. As of June 30, 2021, the Company’s branch deposits amounted to $119.7 million at the South Lewis Avenue (Waukegan) main office location, $43.9 million at the North Green Bay Road (Waukegan) branch office, and $20.8 million at the Lindenhurst branch office.
Table 12
Branch Office Deposit Data
Data as of June 30, 2015 to 2020
| Branch Deposits at June 30, | 2019- 2020 | 2015- 2020 | ||||||||||||||||||||||||||
| 2020 | 2019 | 2015 | Growth | Growth | ||||||||||||||||||||||||
| Address | City | State | ($000) | ($000) | ($000) | (%) | (%) | |||||||||||||||||||||
| Lake County | ||||||||||||||||||||||||||||
| 700 S. Lewis Avenue | Waukegan | Illinois | 130,765 | 121,831 | 137,322 | 7.33 | (4.77 | ) | ||||||||||||||||||||
| 1233 N. Green Bay Road | Waukegan | Illinois | 41,931 | 40,011 | 38,708 | 4.80 | 8.33 | |||||||||||||||||||||
| 3060 W. Sand Lake Road | Lindenhurst | Illinois | 20,054 | 19,765 | 19,373 | 1.46 | 3.52 | |||||||||||||||||||||
| Total | 192,750 | 181,607 | 195,403 | 6.14 | (1.36 | ) | ||||||||||||||||||||||
Source: S&P Global.
37
Feldman Financial Advisors, Inc.
Deposit Market Share Analysis
Table 13 displays branch deposit data for the top 25 financial institutions (commercial banks and thrift institutions) in Lake County as of June 30, 2020 (with deposit data adjusted for subsequently completed mergers). The Company ranked 17th in Lake County out of 29 financial institutions with total deposits of $192.8 million in three offices as of June 30, 2020 for a market share of 0.8%. The deposit market share leaders in Lake County were Wintrust Financial Corp. with a market share of 28.7%, JPMorgan Chase with a market share of 20.8%, First Midwest Bancorp with a market share of 8.5%, BMO Financial Corp. (BMO Harris Bank N.A.) with a market share of 6.2%, and Bank of America Corporation with a market share of 6.2%. The deposit market total in Lake County increased by 15.4% from $21.6 billion at June 30, 2019 to $24.9 billion at June 30, 2020. Among the top 25 financial institutions in Lake County were only two thrift institutions: National Bancorp Holdings (The Federal Savings Bank) ranking 16th and North Shore MHC ranking 17th.
Table 14 displays branch deposit data for the top 25 financial institutions in the Chicago MSA as of June 30, 2020. The Company ranked 88th in the Chicago MSA out of 155 financial institutions with total deposits of $192.8 million for a market share of 0.04%. The deposit market share leaders in the Chicago MSA were JPMorgan Chase with a market share of 21.6%, BMO Financial Corp. with a market share of 16.2%, Bank of America Corporation with a market share of 9.0%, Northern Trust Corp. with a market share of 6.7%, and Wintrust Financial Corp. with a market share of 6.5%. The deposit market total in the Chicago MSA increased by 24.4% from $415.2 billion at June 30, 2019 to $516.4 billion at June 30, 2020. The two largest thrift institutions based on market share in the Chicago MSA were National Bancorp Holdings at the 37th position with deposits of $960.7 million and a market share of 0.14% and Liberty Bank for Savings at the 43rd position with deposits of $654.8 million and a market share of 0.12%.
38
Feldman Financial Advisors, Inc.
Table 13
Deposit Market Share in Lake County, Illinois
Data as of June 30, 2020
| Market Rank 2020 | Financial Institution | Type | No. of Branch Offices 2020 | Market Deposits 2020 ($000) | Market Share 2020 (%) | Market Deposits 2019 ($000) | Market Share 2019 (%) | 1-Year Deposit Growth (%) |
|||||||||||||||
| 1 | Wintrust Financial Corp. (IL) | Bank | 23 | 7,168,491 | 28.74 | 5,832,912 | 26.98 | 22.90 | |||||||||||||||
| 2 | JPMorgan Chase & Co. (NY) | Bank | 23 | 5,184,404 | 20.79 | 4,329,781 | 20.03 | 19.74 | |||||||||||||||
| 3 | First Midwest Bancorp Inc. (IL) | Bank | 11 | 2,116,455 | 8.49 | 1,953,149 | 9.03 | 8.36 | |||||||||||||||
| 4 | BMO Financial Corp. (IL) | Bank | 15 | 1,540,269 | 6.18 | 1,423,464 | 6.58 | 8.21 | |||||||||||||||
| 5 | Bank of America Corporation (NC) | Bank | 12 | 1,539,693 | 6.17 | 1,340,544 | 6.20 | 14.86 | |||||||||||||||
| 6 | Fifth Third Bancorp (OH) | Bank | 10 | 1,344,687 | 5.39 | 1,263,466 | 5.84 | 6.43 | |||||||||||||||
| 7 | PNC Financial Services Group (PA) | Bank | 13 | 937,745 | 3.76 | 828,396 | 3.83 | 13.20 | |||||||||||||||
| 8 | Northern Trust Corp. (IL) | Bank | 2 | 774,039 | 3.10 | 584,486 | 2.70 | 32.43 | |||||||||||||||
| 9 | First Bank Chicago Corp. (IL) | Bank | 1 | 582,907 | 2.34 | 570,096 | 2.64 | 2.25 | |||||||||||||||
| 10 | U.S. Bancorp (MN) | Bank | 6 | 528,205 | 2.12 | 588,086 | 2.72 | (10.18 | ) | ||||||||||||||
| 11 | Huntington Bancshares Inc. (OH) | Bank | 9 | 437,164 | 1.75 | 418,919 | 1.94 | 4.36 | |||||||||||||||
| 12 | Citigroup Inc. (NY) | Bank | 2 | 423,000 | 1.70 | 368,000 | 1.70 | 14.95 | |||||||||||||||
| 13 | CIBC Bancorp USA Inc. (IL) | Bank | 1 | 384,214 | 1.54 | 323,110 | 1.49 | 18.91 | |||||||||||||||
| 14 | First American Bank Corp. (IL) | Bank | 7 | 379,705 | 1.52 | 349,983 | 1.62 | 8.49 | |||||||||||||||
| 15 | Inland Bancorp Inc. (IL) | Bank | 2 | 327,269 | 1.31 | 336,699 | 1.56 | (2.80 | ) | ||||||||||||||
| 16 | National Bancorp Holdings Inc. (IL) | Thrift | 1 | 195,959 | 0.79 | 124,445 | 0.58 | 57.47 | |||||||||||||||
| 17 | North Shore MHC (IL) | Thrift | 3 | 192,750 | 0.77 | 181,607 | 0.84 | 6.14 | |||||||||||||||
| 18 | BankFinancial Corp (IL) | Bank | 4 | 191,853 | 0.77 | 199,991 | 0.92 | (4.07 | ) | ||||||||||||||
| 19 | AliKat Investments Inc. (IL) | Bank | 3 | 161,330 | 0.65 | 132,559 | 0.61 | 21.70 | |||||||||||||||
| 20 | HBT Financial Inc. (IL) | Bank | 2 | 118,927 | 0.48 | 111,725 | 0.52 | 6.45 | |||||||||||||||
| 21 | Associated Banc-Corp (WI) | Bank | 4 | 114,470 | 0.46 | 106,233 | 0.49 | 7.75 | |||||||||||||||
| 22 | Byline Bancorp Inc. (IL) | Bank | 1 | 104,485 | 0.42 | 71,930 | 0.33 | 45.26 | |||||||||||||||
| 23 | Cornerstone Bancorp (IL) | Bank | 1 | 96,202 | 0.39 | 80,520 | 0.37 | 19.48 | |||||||||||||||
| 24 | Parkway Bancorp Inc. (IL) | Bank | 2 | 35,286 | 0.14 | 45,969 | 0.21 | (23.24 | ) | ||||||||||||||
| 25 | Dickinson Financial Corp. (MO) | Bank | 3 | 27,113 | 0.11 | 24,981 | 0.12 | 8.53 | |||||||||||||||
| Market Total | 166 | 24,939,587 | 100.00 | 21,620,876 | 100.00 | 15.35 | |||||||||||||||||
Source: S&P Global.
39
Feldman Financial Advisors, Inc.
Table 14
Deposit Market Share in the Chicago MSA
Data as of June 30, 2020
| Market Rank 2020 | Financial Institution | Type | No. of Branch Offices 2020 | Market Deposits 2020 ($000) | Market Share 2020 (%) | Market Deposits 2019 ($000) | Market Share 2019 (%) | 1-Year Deposit Growth (%) |
|||||||||||||||
| 1 | JPMorgan Chase & Co. (NY) | Bank | 313 | 111,639,686 | 21.62 | 87,840,179 | 21.16 | 27.09 | |||||||||||||||
| 2 | BMO Financial Corp. (IL) | Bank | 208 | 83,652,475 | 16.20 | 63,391,597 | 15.27 | 31.96 | |||||||||||||||
| 3 | Bank of America Corporation (NC) | Bank | 135 | 46,345,193 | 8.97 | 35,572,365 | 8.57 | 30.28 | |||||||||||||||
| 4 | Northern Trust Corp. (IL) | Bank | 5 | 34,446,777 | 6.67 | 23,216,879 | 5.59 | 48.37 | |||||||||||||||
| 5 | Wintrust Financial Corp. (IL) | Bank | 149 | 33,773,116 | 6.54 | 27,001,510 | 6.50 | 25.08 | |||||||||||||||
| 6 | Fifth Third Bancorp (OH) | Bank | 173 | 29,088,276 | 5.63 | 23,967,415 | 5.77 | 21.37 | |||||||||||||||
| 7 | CIBC Bancorp USA Inc. (IL) | Bank | 21 | 27,228,225 | 5.27 | 20,107,899 | 4.84 | 35.41 | |||||||||||||||
| 8 | PNC Financial Services Group (PA) | Bank | 132 | 16,277,060 | 3.15 | 13,468,089 | 3.24 | 20.86 | |||||||||||||||
| 9 | Citigroup Inc. (NY) | Bank | 57 | 15,255,000 | 2.95 | 14,071,000 | 3.39 | 8.41 | |||||||||||||||
| 10 | First Midwest Bancorp Inc. (IL) | Bank | 94 | 13,930,627 | 2.70 | 12,629,974 | 3.04 | 10.30 | |||||||||||||||
| 11 | U.S. Bancorp (MN) | Bank | 128 | 12,809,540 | 2.48 | 11,969,510 | 2.88 | 7.02 | |||||||||||||||
| 12 | Huntington Bancshares Inc. (OH) | Bank | 147 | 10,297,420 | 1.99 | 9,195,398 | 2.21 | 11.98 | |||||||||||||||
| 13 | Wells Fargo & Co. (CA) | Bank | 9 | 8,871,972 | 1.72 | 7,509,449 | 1.81 | 18.14 | |||||||||||||||
| 14 | Byline Bancorp Inc. (IL) | Bank | 48 | 4,911,584 | 0.95 | 3,937,125 | 0.95 | 24.75 | |||||||||||||||
| 15 | Associated Banc-Corp (WI) | Bank | 24 | 3,758,111 | 0.73 | 4,811,685 | 1.16 | (21.90 | ) | ||||||||||||||
| 16 | First American Bank Corp. (IL) | Bank | 51 | 3,731,833 | 0.72 | 3,364,392 | 0.81 | 10.92 | |||||||||||||||
| 17 | First Bancshares Inc. (IN) | Bank | 38 | 3,579,280 | 0.69 | 3,266,977 | 0.79 | 9.56 | |||||||||||||||
| 18 | Old Second Bancorp Inc. (IL) | Bank | 29 | 2,431,436 | 0.47 | 2,038,332 | 0.49 | 19.29 | |||||||||||||||
| 19 | West Suburban Bancorp Inc. (IL) | Bank | 43 | 2,363,369 | 0.46 | 2,046,220 | 0.49 | 15.50 | |||||||||||||||
| 20 | First Busey Corp. (IL) | Bank | 17 | 2,242,623 | 0.43 | 1,931,567 | 0.47 | 16.10 | |||||||||||||||
| 21 | Republic Bancorp Co. (IL) | Bank | 19 | 1,918,462 | 0.37 | 1,695,038 | 0.41 | 13.18 | |||||||||||||||
| 22 | Parkway Bancorp Inc. (IL) | Bank | 24 | 1,917,671 | 0.37 | 2,069,923 | 0.50 | (7.36 | ) | ||||||||||||||
| 23 | Lakeside Bancorp Inc. (IL) | Bank | 9 | 1,751,291 | 0.34 | 1,451,799 | 0.35 | 20.63 | |||||||||||||||
| 24 | First Merchants Corp. (IN) | Bank | 20 | 1,694,161 | 0.33 | 1,544,153 | 0.37 | 9.71 | |||||||||||||||
| 25 | First Bank Chicago Corp. (IL) | Bank | 3 | 1,624,683 | 0.31 | 1,489,575 | 0.36 | 9.07 | |||||||||||||||
| 88 | North Shore MHC (IL) | Thrift | 3 | 192,750 | 0.04 | 181,607 | 0.04 | 6.14 | |||||||||||||||
| Market Total | 2,407 | 516,405,291 | 100.00 | 415,216,071 | 100.00 | 24.37 | |||||||||||||||||
Source: S&P Global.
40
Feldman Financial Advisors, Inc.
The Company faces significant competition in originating loans and attracting deposits. This competition stems primarily from commercial banks, other thrift institutions, credit unions, and mortgage-banking companies. Many of the financial service providers operating in the Company’s market area are significantly larger and have greater financial resources. The Company faces additional competition for deposits from online banking institutions, short-term money market funds, other corporate and government securities funds, mutual funds, and from other non-depository financial institutions such as brokerage firms and insurance companies.
Competition for residential mortgage lending in the Company’s market area is high. In addition to local and regional participants, many nationwide lenders are present in the Company’s lending market. Out-of-state mortgage banking companies were prevalent among the top ten residential lenders in Lake County and the Chicago MSA. Guaranteed Rate Inc. (Illinois) was the leading residential mortgage lender in 2020 in both Lake County and the Chicago MSA. The most active nationwide lenders operating in these local markets included JPMorgan Chase (New York), Quicken Loans LLC (Michigan), CrossCountry Mortgage LLC (Ohio), LoanDepot.com LLC (California), and Huntington National Bank (Ohio).
41
Feldman Financial Advisors, Inc.
Summary Outlook
The Company has reported low levels of profitability over the past five years, culminating in a net operating loss in 2020. The Company’s ROA has trended downward from 0.29% in 2018 to 0.18% in 2019 and -0.05% in 2020. For the six months ended June 30, 2021, the Company recorded an annualized ROA of -0.01%. The path to improved profitability for the Company has been impeded by low levels of net interest income and non-interest income.
The Company’s net interest margin remains under pressure in the current interest rate environment and its efficiency ratio is still well above peer group averages. The large concentrations of liquidity and investments have the effect of restraining the Company’s net interest income. Historically, the Company’s provision for loan losses has amounted to very small amounts; however, the increased provision in 2020 contributed to the Company’s net loss.
The Company plans to continue its emphasis on residential mortgage lending. Commercial real estate and multi-family residential loans have increased in recent years as the Company sought to improve its earning asset yields and interest rate sensitivity with shorter-maturity loans. A key element of the Company’s operating strategy is to continue to aggressively manage credit risk, so as to continue to maintain the Company’s favorable measures of credit quality. The Company’s strong capital position helps to support its net interest margin and interest rate risk management, although the loan portfolio continues to reflect a large concentration of fixed-rate residential mortgage loans.
The Company’s traditional thrift institution orientation reflects a business model that produces below-average levels of non-interest income, but also results in below-average levels of non-interest expense. The infusion of additional capital from the Stock Offering will fortify the Company’s already strong capital position and allow for the implementation of prudent growth strategies, which would serve to leverage operating expenses and provide additional flexibility to evaluate adding additional products and services that would enhance the Company’s competitive position and contribute to improved profitability.
42
Feldman Financial Advisors, Inc.
II. COMPARISONS WITH PUBLICLY TRADED THRIFTS
General Overview
The comparative market approach provides a sound basis for determining estimates of going-concern valuations where a regular and active market exists for the stocks of peer institutions. The comparative market approach was utilized in determining the estimated pro forma market value of the Company because: (1) reliable market and financial data are readily available for comparable institutions; (2) the comparative market method is required by the applicable regulatory guidelines; and (3) other alternative valuation methods (such as income capitalization, liquidation analysis, or discounted cash flow) are unlikely to produce a valuation relevant to the future trading patterns of the related equity interest. The generally employed valuation method in initial public offerings, where possible, is the comparative market approach, which also can be relied upon to determine pro forma market value in a thrift stock conversion.
The comparative market approach derives valuation benchmarks from the trading patterns of selected peer institutions which, due to certain factors such as financial performance and operating strategies, enable the appraiser to estimate the potential value of the subject institution in a stock conversion offering. The pricing and trading history of recent initial public offerings of thrifts are also examined to provide evidence of the “new issue discount” that must be considered. In Chapter II, our valuation analysis focuses on the selection and comparison of the Company with a comparable group of publicly traded thrift institutions (the “Comparative Group”). Chapter III will detail any additional discounts or premiums that we believe are appropriate to the Company’s pro forma market value.
43
Feldman Financial Advisors, Inc.
Selection Criteria
Selected market price and financial performance data for all public thrifts listed on major stock exchanges are shown in Exhibit III. The list excludes companies that are subject to being acquired under a pending transaction and companies that have a majority ownership interest controlled by a mutual holding company. Several criteria, discussed below, were used to select the individual members of the Comparative Group from the overall universe of publicly traded thrifts.
|
|
● |
Operating characteristics – An institution’s operating characteristics are the most important factors because they affect investors’ expected rates of return on a company’s stock under various business/economic scenarios, and they influence the market’s general perception of the quality and attractiveness of a given company. Operating characteristics, which may vary in importance during the business cycle, include financial variables such as profitability, balance sheet growth, capitalization, asset quality, and other factors such as lines of business and management strategies. |
|
|
● |
Degree of marketability and liquidity – Marketability of a stock reflects the relative ease and promptness with which a security may be sold when desired, at a representative current price, without material concession in price merely because of the necessity of sale. Marketability also connotes the existence of buying interest as well as selling interest and is usually indicated by trading volumes and the spread between the bid and asked price for a security. Liquidity of the stock issue refers to the organized market exchange process whereby the security can be converted into cash. We attempted to limit our selection to companies that have access to a regular trading market or price quotations, and therefore only considered companies listed on major stock exchanges. We eliminated from the Comparative Group companies whose market prices were materially influenced by announced acquisitions or other unusual circumstances. However, the expectation of continued industry consolidation is currently embedded in thrift equity valuations. |
|
|
● |
Geographic Location – The region of the country where a company operates is also of importance in selecting the comparative group. The operating environment for thrift institutions varies from region to region with respect to business and economic environments, real estate market conditions, speculative takeover activity, and investment climates. Economic and investor climates can also vary greatly within a region, particularly due to takeover activity. |
44
Feldman Financial Advisors, Inc.
The operations of the Company fit the general profile of a small to medium-sized thrift institution, concentrating primarily on real estate lending in its local market and relying on retail deposits as a funding source. Residential mortgage loans remain the core product in the Company’s loan portfolio, drawing upon its roots as a traditional home lender. The Company has made some progress in beginning to diversify its loan mix through the steady origination of commercial real estate and multi-family residential loans.
In determining the Comparative Group composition, we focused on the Company’s asset size, capitalization, asset quality, and earnings fundamentals. Attempting to concentrate on the Company’s performance characteristics and to develop a meaningful number of comparables for valuation purposes, we expanded the criteria to include a statistically significant number of companies. In addition, because of the scarcity of candidates meeting the criteria precisely, we increased the asset size constraint to generate a significant number of comparables while maintaining non-size related characteristics. As with any composition of a group of comparable companies, the selection criteria were broadened sufficiently to assemble a consequential number of members. We performed an initial screening for publicly traded thrifts headquartered in the Midwest region of the United States with total assets less than $1.0 billion. We then expanded the selection criteria to other geographic regions and applied the following selection criteria:
|
● |
Publicly traded thrift – stock-form thrift whose shares are traded on the New York Stock Exchange (“NYSE”), NYSE American, or NASDAQ Stock Market. |
|
● |
Excludes mutual holding companies – company’s corporate structure is not organized in the mutual holding company (“MHC”) form. |
|
|
● |
Seasoned trading issue – company has been publicly traded in the fully stock form for at least one year. |
|
|
● |
Non-acquisition target – company is not subject to a pending acquisition. |
|
|
● |
Asset size – total assets less than $1.0 billion. |
|
|
● |
Capital level – tangible common equity to tangible assets greater than 7.50%. |
45
Feldman Financial Advisors, Inc.
|
|
● |
Market capitalization – total market value of common stock is less than $125.0 million. |
|
|
● |
Profitability – ROA less than 1.75% to exclude any high-performing institutions. |
|
|
● |
Credit quality – non-performing assets to total assets less than 1.5%. |
As a result of applying the stated criteria, the screening process produced a reliable representation of public thrifts. A general operating summary of the 10 companies included in the Comparative Group is presented in Table 15. All of the selected companies are traded on the NASDAQ Stock Market. The Comparative Group ranged in asset size from $249.2 million at Mid-Southern Bancorp to $981.0 million at HMN Financial. The median asset size of the Comparative Group was $450.6 million and larger than the Company’s total assets of $239.9 million as of June 30, 2021.
The Comparative Group includes five thrifts based in the Midwest region, Cincinnati Bancorp (Ohio), FFBW Inc. (Wisconsin), HMN Financial (Minnesota), IF Bancorp (Illinois), and Mid-Southern Bancorp (Indiana). The Comparative Group’s remaining members are distributed among the Mid-Atlantic (four companies) and Southwest (one company) regions. Most of the public thrifts in the Midwest were excluded because either the company was not traded on a major stock exchange, is organized in the mutual holding company (“MHC”) form, or its asset size exceeded the asset threshold of $1.0 billion. The Comparative Group companies based in the Mid-Atlantic states include CBM Bancorp (Maryland), Elmira Savings Bank (New York), HV Bancorp (Pennsylvania), and WVS Financial Corp. (Pennsylvania). The one member located in the Southwest includes Home Federal Bancorp (Louisiana). While some differences inevitably may exist between the Company and the individual companies, we believe that the chosen Comparative Group, on the whole, provides a meaningful basis of financial comparison for valuation purposes.
46
Feldman Financial Advisors, Inc.
Table 15
Comparative Group Operating Summary
As of June 30, 2021
|
|
|
|
|
|
|
|
|
|
|
|
|
|
|
|
|
|
Company |
|
City |
|
St. |
|
No. of |
|
Initial |
|
Total |
|
Tang. |
|
|
|
|
|
|
|
|
|
|
|
|
|
|
|
|
|
|
|
North Shore MHC |
|
Waukegan |
|
IL |
|
3 |
|
NA |
|
$239.9 |
|
19.13 |
|
|
|
|
|
|
|
|
|
|
|
|
|
|
|
|
|
|
|
Comparative Group |
|
|
|
|
|
|
|
|
|
|
|
|
|
|
|
CBM Bancorp, Inc. |
|
Baltimore |
|
MD |
|
4 |
|
09/27/18 |
|
250.0 |
|
20.08 |
|
|
|
Cincinnati Bancorp, Inc. |
|
Cincinnati |
|
OH |
|
6 |
|
10/14/15 |
|
249.8 |
|
17.08 |
|
|
|
Elmira Savings Bank |
|
Elmira |
|
NY |
|
12 |
|
03/01/85 |
|
648.7 |
|
7.87 |
|
|
|
FFBW, Inc. |
|
Brookfield |
|
WI |
|
6 |
|
10/10/17 |
|
352.6 |
|
27.37 |
|
|
|
HMN Financial, Inc. |
|
Rochester |
|
MN |
|
14 |
|
06/30/94 |
|
981.0 |
|
10.93 |
|
|
|
Home Federal Bancorp, Inc. |
|
Shreveport |
|
LA |
|
8 |
|
01/18/05 |
|
565.7 |
|
9.32 |
|
|
|
HV Bancorp, Inc. |
|
Doylestown |
|
PA |
|
7 |
|
01/11/17 |
|
548.6 |
|
7.55 |
|
|
|
IF Bancorp, Inc. |
|
Watseka |
|
IL |
|
8 |
|
07/07/11 |
|
797.3 |
|
10.70 |
|
|
|
Mid-Southern Bancorp |
|
Salem |
|
IN |
|
3 |
|
04/08/98 |
|
249.2 |
|
19.71 |
|
|
|
WVS Financial Corp. |
|
Pittsburgh |
|
PA |
|
6 |
|
11/29/93 |
|
346.1 |
|
11.09 |
|
|
|
|
|
|
|
|
|
|
|
|
|
|
|
|
|
Source: North Shore MHC; S&P Global.
47
Feldman Financial Advisors, Inc.
Recent Financial Comparisons
Table 16 summarizes certain key financial comparisons between the Company and the Comparative Group. Tables 17 through 21 contain the detailed financial comparisons of the Company with the individual Comparative Group companies based on measures of profitability, income and expense components, capital levels, balance sheet composition, asset quality, and growth rates. Financial data for the Company, the Comparative Group, and All Public Thrift aggregate were utilized for the latest available period as of or for the last twelve months (“LTM”) ended June 30, 2021.
The Company’s LTM earnings amounted to $98,000 with an LTM ROA of 0.04%, reflecting profitability below the Comparative Group median of 0.73% and the All Public Thrift median of 0.92%. The Company’s lower ROA was attributable mainly to a lower level of net interest income and a resulting much higher efficiency ratio. The Company’s LTM ROE was 0.21% and also lagged the Comparative Group median of 7.13% and the All Public Thrift median of 8.10%. The Company’s ROA was below the ROA results of all the members of the Comparative Group. The lowest ROA results in the Comparative Group were generated by CBM Bancorp, WVS Financial, and Mid-Southern Bancorp at 0.36%, 0.39%, and 0.53%, respectively.
Based on core earnings (as adjusted to exclude securities gains, intangibles amortization expense, foreclosures expense, and other non-recurring items), the Company’s core profitability was also lower than the Comparative Group’s levels. The Company’s LTM core earnings ratio measured 0.05% of average assets and positioned below the corresponding Comparative Group median of 0.73% and the All Public Thrift median of 0.96%. The Company’s core earnings exclude the impact of $17,000 in real estate foreclosure expenses and reflect a resulting amount of core earnings equal to $115,000 for the LTM ended June 30, 2021.
48
Feldman Financial Advisors, Inc.
Table 16
Key Financial Comparisons
North Shore MHC and the Comparative Group
As of or For the Last Twelve Months Ended June 30, 2021
| North | Comparative | All Public | ||||||||
| Shore | Group | Thrift | ||||||||
| MHC | Median | Median | ||||||||
| Profitability Ratios | ||||||||||
| LTM Return on Average Assets (ROA) | 0.04 | % | 0.73 | % | 0.92 | % | ||||
| LTM Return on Average Equity (ROE) | 0.21 | 7.13 | 8.10 | |||||||
| Core Return on Avg. Assets (Core ROA) | 0.05 | 0.73 | 0.96 | |||||||
| Core Return on Avg. Equity (Core ROE) | 0.25 | 7.02 | 8.15 | |||||||
| Net Interest Margin | 1.86 | 3.02 | 3.03 | |||||||
| Efficiency Ratio | 104.83 | 69.89 | 64.60 | |||||||
| Income and Expense (% of avg. assets) | ||||||||||
| Total Interest Income | 2.19 | 3.27 | 3.29 | |||||||
| Total Interest Expense | 0.47 | 0.49 | 0.45 | |||||||
| Net Interest Income | 1.72 | 2.80 | 2.78 | |||||||
| Provision for Loan Losses | 0.11 | 0.08 | 0.05 | |||||||
| Other Operating Income | 0.70 | 0.93 | 0.58 | |||||||
| Net Securities Gains and Non-rec. Income | 0.00 | 0.00 | 0.01 | |||||||
| General and Administrative Expense | 2.53 | 2.71 | 2.56 | |||||||
| Intangibles Amortization Expense | 0.00 | 0.00 | 0.00 | |||||||
| Non-recurring Expense | 0.01 | 0.00 | 0.00 | |||||||
| Pre-tax Core Earnings | 0.59 | 0.97 | 1.02 | |||||||
| Equity Capital Ratios | ||||||||||
| Total Equity / Total Assets | 19.13 | 11.05 | 11.69 | |||||||
| Tangible Equity / Tangible Assets | 19.13 | 11.01 | 10.82 | |||||||
| Growth Rates | ||||||||||
| Total Assets | (2.54) | 8.79 | 7.37 | |||||||
| Net Total Loans | (2.86) | (5.34 | ) | (0.45 | ) | |||||
| Total Deposits | (2.63) | 12.43 | 10.45 | |||||||
49
Feldman Financial Advisors, Inc.
Table 16 (continued)
Key Financial Comparisons
North Shore MHC and the Comparative Group
As of or For the Last Twelve Months Ended June 30, 2021
| North | Comparative | All Public | ||||||||
| Shore | Group | Thrift | ||||||||
| MHC | Median | Median | ||||||||
| Balance Sheet Composition (% of total assets) | ||||||||||
| Cash and Securities | 52.27 | % | 32.70 | % | 23.76 | % | ||||
| Loans Receivable, net | 40.96 | 63.20 | 70.74 | |||||||
| Real Estate Owned | 0.03 | 0.00 | 0.00 | |||||||
| Intangible Assets | 0.00 | 0.00 | 0.11 | |||||||
| Other Assets | 6.74 | 4.65 | 4.48 | |||||||
| Total Deposits | 76.88 | 78.46 | 78.81 | |||||||
| Borrowed Funds | 2.08 | 4.13 | 8.19 | |||||||
| Other Liabilities | 1.91 | 0.45 | 1.20 | |||||||
| Total Liabilities | 80.87 | 88.95 | 88.31 | |||||||
| Total Equity | 19.13 | 11.05 | 11.69 | |||||||
| Loan Portfolio Composition (% of total loans) | ||||||||||
| Residential Real Estate Loans (1) | 88.53 | 38.48 | 28.39 | |||||||
| Other Real Estate Loans | 10.92 | 41.81 | 52.90 | |||||||
| Non-Real Estate Loans | 0.55 | 15.66 | 18.71 | |||||||
| Credit Risk Ratios | ||||||||||
| Non-performing Loans / Total Loans | 0.51 | 0.24 | 0.39 | |||||||
| Non-performing Assets / Total Assets | 0.24 | 0.17 | 0.29 | |||||||
| Reserves / Total Non-performing Loans (2) | 36.07 | 280.88 | 122.69 | |||||||
| Reserves / Total Loans | 0.80 | 1.19 | 1.11 | |||||||
(1) Includes home equity and second mortgage loans.
(2) Includes accruing troubled debt restructurings.
Source: North Shore MHC; S&P Global.
As shown in Table 19, the Company’s level of net interest income at 1.72% of average assets was significantly below the Comparative Group median of 2.80%, owing to the Company’s relatively high concentration of assets invested in cash equivalents and investment securities, which generally carry lower yields than loans. The Company’s total interest income measured 2.19% of average assets for the LTM period, trailing the Comparative Group median of 3.27%. The Company’s interest expense amounted to 0.47% of average assets and was slightly below the Comparative Group median of 0.49%. As reflected by its lower net interest margin of 1.86% versus the corresponding Comparative Group median of 3.02%, the earning power of the Company’s balance sheet is restrained by the relatively large concentration of cash and investments.
50
Feldman Financial Advisors, Inc.
The Company’s non-interest operating income totaled 0.70% of average assets, lagging behind the Comparative Group median of 0.93%. The Company’s primary sources of non-interest income include service charges on deposit accounts, gains on sale of mortgage loans, and BOLI income. Most of the Comparative Group companies reported higher levels of non-interest income, particularly expanded revenue streams from service charges related to higher levels of transaction deposit account activity and from mortgage banking operations producing significant loan origination and servicing fees and gains on sale of loans.
The Company’s loan loss provision amounted to 0.11% of average assets for the recent LTM period and was slightly higher than the Comparative Group median of 0.08%. After three consecutive years of either making low levels of provision charges or recording a credit for loan losses from 2015 to 2019, the Company recorded an increased provision in the year ended December 31, 2020 to reflect steady loan portfolio growth and the potential economic impact of the coronavirus pandemic. The Company’s total non-performing assets measured 0.24% at June 30, 2021, which was slightly higher than the Comparative Group median of 0.17% and below the All Public Thrift median of 0.29%. The Company’s non-performing loans measured 0.51% at June 30, 2021, which was higher than the Comparative Group and All Public Thrift medians of 0.24% and 0.39%, respectively. Historically, the Company has experienced a relatively low level of net loan charge-offs. The Company’s 0.80% ratio of loan loss allowance to total loans was lower than the corresponding Comparative Group median of 1.19% and All Public Thrift median of 1.11%. Furthermore, the Company’s 36.1% ratio of loan loss allowance to total non-performing loans including restructured loans was positioned below the Comparative Group median of 280.9% and All Public Thrift median of 122.7%.
51
Feldman Financial Advisors, Inc.
The Company’s operating expense ratio at 2.53% of average assets was lower than the Comparative Group median of 2.71% and All Public Thrift median of 2.56%. However, the Company’s 104.8% efficiency ratio (defined as non-interest expense less intangibles amortization and foreclosure expenses as a percent of the sum of net interest income before provision plus non-interest operating income) compared unfavorably to the Comparative Group median of 69.9%. Only two members of the Comparative Group exhibited efficiency ratios above 80% with Mid-Southern Bancorp at 83.5% and CBM Bancorp at 84.0%. Improving the efficiency ratio is a strategic goal for the Company as it seeks to leverage the operating infrastructure and staffing resources in place to grow the balance sheet and generate increased levels of market share penetration and banking activity.
As reflected in Table 20, the overall balance sheet composition of the Company reflected a much lower concentration of loans to assets versus that of the overall Comparative Group. The Company’s net total loans amounted to 41.0% of total assets as of June 30, 2021, well below the median of 63.2% for the Comparative Group. The Company’s ratio of cash and securities to total assets was 52.3% and appreciably above the median of 32.7% for the Comparative Group. The Company had no goodwill or other intangible assets on its balance sheet as of June 30, 2021, while its ratio of real estate owned at 0.03% of total assets was modestly above the Comparative Group median of 0.00%. The Company’s ratio of other assets measured 6.7% and was higher than the Comparative Group median of 4.7%. The Company’s other assets were primarily composed of BOLI (3.7% of total assets) and premises and equipment (2.1% of total assets) as of June 30, 2021.
52
Feldman Financial Advisors, Inc.
The Company’s ratio of borrowed funds to total assets amounted to 2.1% at June 30, 2021 and was lower than the Comparative Group median of 4.1%. The Company historically has not utilized borrowings as a supplemental source of funds. However, the Company obtained FHLB borrowings in 2020 and 2021 that were offered on a limited basis by the FHLB of Chicago to its member institutions as part of its coronavirus relief funding program. The Company obtained a $4.0 million, one-year, zero-rate FHLB advance in May 2020 and replaced it with a $5.0 million, one-year, zero-rate FHLB advance in May 2021.
The Company’s level of deposits at 76.9% of total assets was below the Comparative Group median of 78.5% of total assets due to the Company’s stronger capital position. The Company’s equity level before the Stock Offering was 19.13% relative to total assets as of June 30, 2021, which was higher than the Comparative Group median of 11.05% and All Public Thrift median of 11.69%.
The Company’s level of residential real estate loans (including home equity loans) measured 88.5% of total loans based on regulatory financial data as of June 30, 2021, outdistancing the Comparative Group median of 38.5% and reflective of the Company’s traditional thrift orientation. Three other members of the Comparative Group exhibited a majority of loans in the residential category: WVS Financial at 86.8%, Elmira Savings Bank at 63.6%, and Mid-Southern Bancorp at 53.4%. Other companies within the Comparative Group exhibited more diverse loan portfolio compositions with higher percentages of non-residential mortgage loans and non-real estate loans in portfolio.
53
Feldman Financial Advisors, Inc.
The Company’s concentration of non-residential real estate loans (which category includes commercial real estate, multi-family real estate, and construction and land development loans) represented 10.9% of total loans and was lower than the Comparative Group median of 41.8%. The Company also exhibited a lower level of non-real estate loans, which accounted for only 0.6% of total loans versus the Comparative Group median of 15.7%. The Company has relatively scarce amounts of consumer loans and commercial business loans in its loan portfolio as compared to most of the Comparative Group members, instead electing to concentrate on its residential lending activity.
The Company’s asset growth rate measured -2.5% over the recent LTM period versus the Comparative Group median asset growth rate of 8.8%. The Company exhibited a deposit growth rate of -2.6% versus the Comparative Group median of 12.4%. Several of the companies in the Comparative Group have experienced solid increases in deposits due to acquisitions or the inflow of funds from stimulus-related deposits into customer accounts. The Company’s loan growth rate of -2.6% compared favorably to the Comparative Group median of -5.3%. Several of the Comparative Group companies have experienced loan portfolio shrinkage due to their active participation in the U.S. Government’s Paycheck Protection Program (“PPP”) and the subsequent forgiveness of these loans from their originations of a year ago.
In summary, the Company’s recent earnings performance was well below the results exhibited by the Comparative Group, while its capital ratio (before the effect of the Stock Offering) was much stronger and its asset quality ratios were relatively comparable to the levels represented by the Comparative Group medians. The Company’s profitability was characterized by a much lower net interest margin and a lower level of non-interest income. As a result, the Company’s efficiency ratio was very unfavorable versus the Comparative Group median. Similar to most financial institutions its size, the Company is faced with the ongoing challenge of improving its efficiency ratio either through bolstering its net interest margin, enhancing non-interest income generation, or improving the efficiency and productivity of its operating infrastructure. The Company’s earnings growth outlook will depend largely on its ability to maintain satisfactory loan quality as it grows the portfolio, to improve the net interest margin across movements in the interest rate environment, and to control non-interest expense as it seeks to expand its operations and transition to a public company.
54
Feldman Financial Advisors, Inc.
| Table 17 General Operating Characteristics As of June 30, 2021 |
| City/State | Ticker | Exchange | No.
of Offices |
IPO Date |
Total Assets ($000s) |
Total Deposits ($000s) |
Total Equity ($000s) |
Tang. Common Equity ($000s) |
|||||||||||
| North Shore MHC | Waukegan, IL | NA | NA | 3 | NA | 239,858 | 184,406 | 45,875 | 45,875 | ||||||||||
| Comparative Group Average | 498,894 | 396,681 | 62,706 | 61,333 | |||||||||||||||
| Comparative Group Median | 450,582 | 341,305 | 51,457 | 50,097 | |||||||||||||||
| Comparative Group | |||||||||||||||||||
| CBM Bancorp, Inc. | Baltimore, MD | CBMB | NASDAQ | 4 | 09/27/18 | 249,994 | 192,924 | 50,188 | 50,188 | ||||||||||
| Cincinnati Bancorp, Inc. | Cincinnati, OH | CNNB | NASDAQ | 6 | 10/14/15 | 249,770 | 157,294 | 42,797 | 42,636 | ||||||||||
| Elmira Savings Bank | Elmira, NY | ESBK | NASDAQ | 12 | 03/01/85 | 648,686 | 551,245 | 62,375 | 50,005 | ||||||||||
| FFBW, Inc. | Brookfield, WI | FFBW | NASDAQ | 6 | 10/10/17 | 352,603 | 245,179 | 96,769 | 96,399 | ||||||||||
| HMN Financial, Inc. | Rochester, MN | HMNF | NASDAQ | 14 | 06/30/94 | 981,026 | 862,282 | 107,958 | 107,133 | ||||||||||
| Home Federal Bancorp, Inc. | Shreveport, LA | HFBL | NASDAQ | 8 | 01/18/05 | 565,731 | 506,596 | 52,725 | 52,725 | ||||||||||
| HV Bancorp, Inc. | Doylestown, PA | HVBC | NASDAQ | 7 | 01/11/17 | 548,561 | 437,430 | 41,437 | 41,437 | ||||||||||
| IF Bancorp, Inc. | Watseka, IL | IROQ | NASDAQ | 8 | 07/07/11 | 797,341 | 667,632 | 85,304 | 85,304 | ||||||||||
| Mid-Southern Bancorp, Inc. | Salem, IN | MSVB | NASDAQ | 3 | 04/08/98 | 249,152 | 189,065 | 49,116 | 49,116 | ||||||||||
| WVS Financial Corp. | Pittsburgh, PA | WVFC | NASDAQ | 6 | 11/29/93 | 346,078 | 157,167 | 38,389 | 38,389 | ||||||||||
Source: North Shore MHC; S&P Global.
55
Feldman Financial Advisors, Inc.
| Table 18 General Financial Performance Ratios As of or For the Last Twelve Months Ended June 30, 2021 |
| Total
Assets ($000s) |
Total
Deposits ($000s) |
Total
Equity/ Assets (%) |
Tang.
Equity/ Assets (%) |
Net
Interest Margin (%) |
Effcy. (%) |
LTM
ROA (%) |
LTM ROE (%) |
Core
ROA (%) |
Core
ROE (%) |
|||||||||||
| North Shore MHC | 239,858 | 184,406 | 19.13 | 19.13 | 1.86 | 104.83 | 0.04 | 0.21 | 0.05 | 0.25 | ||||||||||
| Comparative Group Average | 498,894 | 396,681 | 14.37 | 14.17 | 2.87 | 70.77 | 0.88 | 7.80 | 0.88 | 7.81 | ||||||||||
| Comparative Group Median | 450,582 | 341,305 | 11.05 | 11.01 | 3.02 | 69.89 | 0.73 | 7.13 | 0.73 | 7.02 | ||||||||||
| All Public Thrift Average | 4,111,292 | 2,986,828 | 12.80 | 12.02 | 3.09 | 67.23 | 1.06 | 8.31 | 1.07 | 8.76 | ||||||||||
| All Public Thrift Median | 1,617,016 | 1,321,789 | 11.69 | 10.82 | 3.03 | 64.60 | 0.92 | 8.10 | 0.96 | 8.15 | ||||||||||
| Comparative Group | ||||||||||||||||||||
| CBM Bancorp, Inc. | 249,994 | 192,924 | 20.08 | 20.08 | 3.03 | 83.99 | 0.36 | 1.65 | 0.36 | 1.65 | ||||||||||
| Cincinnati Bancorp, Inc. | 249,770 | 157,294 | 17.13 | 17.08 | 2.44 | 71.46 | 1.72 | 11.34 | 1.73 | 11.40 | ||||||||||
| Elmira Savings Bank | 648,686 | 551,245 | 9.62 | 7.87 | 3.27 | 70.89 | 0.73 | 7.91 | 0.73 | 7.97 | ||||||||||
| FFBW, Inc. | 352,603 | 245,179 | 27.44 | 27.37 | 3.54 | 73.01 | 0.66 | 2.21 | 0.72 | 2.43 | ||||||||||
| HMN Financial, Inc. | 981,026 | 862,282 | 11.00 | 10.93 | 3.34 | 60.35 | 1.53 | 13.83 | 1.53 | 13.84 | ||||||||||
| Home Federal Bancorp, Inc. | 565,731 | 506,596 | 9.32 | 9.32 | 3.31 | 60.54 | 0.99 | 10.46 | 0.99 | 10.46 | ||||||||||
| HV Bancorp, Inc. | 548,561 | 437,430 | 7.55 | 7.55 | 2.39 | 67.47 | 1.13 | 18.27 | 1.13 | 18.27 | ||||||||||
| IF Bancorp, Inc. | 797,341 | 667,632 | 10.70 | 10.70 | 2.86 | 68.89 | 0.72 | 6.35 | 0.69 | 6.07 | ||||||||||
| Mid-Southern Bancorp, Inc. | 249,152 | 189,065 | 19.71 | 19.71 | 3.01 | 83.47 | 0.53 | 2.53 | 0.53 | 2.53 | ||||||||||
| WVS Financial Corp. | 346,078 | 157,167 | 11.09 | 11.09 | 1.52 | 67.59 | 0.39 | 3.40 | 0.41 | 3.53 |
Source: North Shore MHC; S&P Global.
56
Feldman Financial Advisors, Inc.
| Table 19 Income and Expense Analysis For the Last Twelve Months Ended June 30, 2021 |
| As a Percent of Average Assets | |||||||||||||||||||||||
| Interest Income |
Interest Expense |
Net Interest Income |
Other Oper. Income |
Gains & Non-rec. Income |
Loan Loss Prov. |
Gen.
& Admin. Expense |
Amort. of Intang. |
Non-rec. Expense |
Pre-tax Core Earnings |
||||||||||||||
| North Shore MHC | 2.19 | 0.47 | 1.72 | 0.70 | 0.00 | 0.11 | 2.53 | 0.00 | 0.01 | (0.22 | ) | ||||||||||||
| Comparative Group Average | 3.15 | 0.49 | 2.66 | 1.53 | 0.00 | 0.09 | 2.94 | 0.00 | 0.00 | 1.16 | |||||||||||||
| Comparative Group Median | 3.27 | 0.49 | 2.80 | 0.93 | 0.00 | 0.08 | 2.71 | 0.00 | 0.00 | 0.97 | |||||||||||||
| All Public Thrift Average | 3.41 | 0.51 | 2.93 | 1.26 | 0.07 | 0.10 | 2.75 | 0.02 | 0.05 | 1.21 | |||||||||||||
| All Public Thrift Median | 3.29 | 0.45 | 2.78 | 0.58 | 0.01 | 0.05 | 2.56 | 0.00 | 0.00 | 1.02 | |||||||||||||
| Comparative Group | |||||||||||||||||||||||
| CBM Bancorp, Inc. | 3.45 | 0.57 | 2.89 | 0.73 | 0.00 | (0.03 | ) | 3.12 | 0.00 | 0.00 | 0.53 | ||||||||||||
| Cincinnati Bancorp, Inc. | 3.24 | 0.92 | 2.32 | 5.62 | 0.00 | 0.08 | 5.67 | 0.01 | 0.00 | 2.18 | |||||||||||||
| Elmira Savings Bank | 3.23 | 0.65 | 2.58 | 1.17 | 0.00 | 0.15 | 2.65 | 0.00 | 0.00 | 0.94 | |||||||||||||
| FFBW, Inc. | 3.60 | 0.36 | 3.23 | 0.40 | 0.00 | 0.08 | 2.66 | 0.00 | 0.01 | 0.90 | |||||||||||||
| HMN Financial, Inc. | 3.47 | 0.22 | 3.25 | 1.81 | 0.01 | 0.05 | 2.88 | 0.01 | 0.00 | 2.13 | |||||||||||||
| Home Federal Bancorp, Inc. | 3.72 | 0.61 | 3.11 | 1.01 | 0.00 | 0.33 | 2.54 | 0.00 | 0.00 | 1.25 | |||||||||||||
| HV Bancorp, Inc. | 2.58 | 0.43 | 2.15 | 3.15 | 0.00 | 0.16 | 3.58 | 0.00 | 0.00 | 1.56 | |||||||||||||
| IF Bancorp, Inc. | 3.29 | 0.56 | 2.72 | 0.84 | 0.04 | 0.11 | 2.46 | 0.00 | 0.00 | 1.00 | |||||||||||||
| Mid-Southern Bancorp, Inc. | 3.20 | 0.33 | 2.87 | 0.43 | 0.00 | 0.03 | 2.76 | 0.00 | 0.00 | 0.52 | |||||||||||||
| WVS Financial Corp. | 1.75 | 0.27 | 1.48 | 0.16 | (0.02 | ) | (0.02 | ) | 1.11 | 0.00 | 0.00 | 0.55 | |||||||||||
Source: North Shore MHC; S&P Global.
57
Feldman Financial Advisors, Inc.
| Table 20 Balance Sheet Composition As of June 30, 2021 |
| As a Percent of Total Assets | ||||||||||||||||||||
| Cash
and Securities |
Net Loans |
Real Estate |
Intang. Assets |
Other Assets |
Total Deposits |
Borrowed Funds |
Other Liabs. |
Total Liabs. |
Total Equity |
|||||||||||
| North Shore MHC | 52.27 | 40.96 | 0.03 | 0.00 | 6.74 | 76.88 | 2.08 | 1.91 | 80.87 | 19.13 | ||||||||||
| Comparative Group Average | 30.69 | 60.53 | 0.01 | 0.22 | 4.32 | 75.69 | 9.07 | 0.88 | 85.63 | 14.37 | ||||||||||
| Comparative Group Median | 32.70 | 63.20 | 0.00 | 0.00 | 4.65 | 78.46 | 4.13 | 0.78 | 88.95 | 11.05 | ||||||||||
| All Public Thrift Average | 25.45 | 67.62 | 0.05 | 0.88 | 4.44 | 77.46 | 7.36 | 1.62 | 87.20 | 12.80 | ||||||||||
| All Public Thrift Median | 23.76 | 70.74 | 0.00 | 0.11 | 4.48 | 78.81 | 5.37 | 1.20 | 88.31 | 11.69 | ||||||||||
| Comparative Group | ||||||||||||||||||||
| CBM Bancorp, Inc. | 35.84 | 60.66 | 0.00 | 0.00 | 3.50 | 77.17 | 2.00 | 0.75 | 79.92 | 20.08 | ||||||||||
| Cincinnati Bancorp, Inc. | 12.08 | 82.14 | 0.00 | 0.06 | 5.71 | 62.98 | 18.54 | 1.35 | 82.87 | 17.13 | ||||||||||
| Elmira Savings Bank | 19.67 | 72.63 | 0.00 | 1.90 | 5.80 | 84.98 | 4.25 | 1.16 | 90.38 | 9.62 | ||||||||||
| FFBW, Inc. | 38.90 | 56.15 | 0.00 | 0.10 | 4.85 | 69.53 | 2.41 | 0.61 | 72.56 | 27.44 | ||||||||||
| HMN Financial, Inc. | 31.93 | 65.71 | 0.00 | 0.08 | 2.28 | 87.90 | 0.29 | 0.81 | 89.00 | 11.00 | ||||||||||
| Home Federal Bancorp, Inc. | 33.46 | 62.01 | 0.07 | 0.00 | 4.46 | 89.55 | 0.58 | 0.56 | 90.68 | 9.32 | ||||||||||
| HV Bancorp, Inc. | 21.07 | 73.81 | 0.00 | 0.00 | 5.11 | 79.74 | 11.55 | 1.15 | 92.45 | 7.55 | ||||||||||
| IF Bancorp, Inc. | NA | 64.39 | 0.03 | 0.00 | NA | 83.73 | 4.29 | 1.27 | 89.30 | 10.70 | ||||||||||
| Mid-Southern Bancorp, Inc. | 52.60 | 44.51 | 0.04 | 0.00 | 2.85 | 75.88 | 4.01 | 0.39 | 80.29 | 19.71 | ||||||||||
| WVS Financial Corp. | NA | 23.31 | 0.00 | 0.00 | NA | 45.41 | 42.79 | 0.70 | 88.91 | 11.09 | ||||||||||
Source: North Shore MHC; S&P Global.
58
Feldman Financial Advisors, Inc.
| Table 21 Growth Rates, Credit Risk, and Loan Composition As of or For the Last Twelve Months Ended June 30, 2021 |
| Asset Growth Rate |
Loan Growth Rate |
Deposit Growth Rate |
NPLs/ Total Loans |
NPAs Total Assets |
Loan Loss Allow./ NPLs(1) |
Loan Loss Allow./ Loans |
Resid. Real Est. Loans/ Loans |
Other Real Est. Loans/ Loans |
Non- Real Est. Loans/ Loans |
||||||||||||||
| North Shore MHC | (2.54 | ) | (2.86 | ) | (2.63 | ) | 0.51 | 0.24 | 36.07 | 0.80 | 88.53 | 10.92 | 0.55 | ||||||||||
| Comparative Group Average | 10.12 | (2.09 | ) | 16.58 | 0.38 | 0.28 | 301.95 | 1.09 | 43.52 | 39.75 | 16.72 | ||||||||||||
| Comparative Group Median | 8.79 | (5.34 | ) | 12.43 | 0.24 | 0.17 | 280.88 | 1.19 | 38.48 | 41.81 | 15.66 | ||||||||||||
| All Public Thrift Average | 9.53 | 1.18 | 14.54 | 0.70 | 0.50 | 203.14 | 1.09 | 32.09 | 42.08 | 25.83 | |||||||||||||
| All Public Thrift Median | 7.37 | (0.45 | ) | 10.45 | 0.39 | 0.29 | 122.69 | 1.11 | 28.39 | 52.90 | 18.71 | ||||||||||||
| Comparative Group | |||||||||||||||||||||||
| CBM Bancorp, Inc. | 6.25 | (9.09 | ) | 13.90 | 0.17 | 0.10 | 432.71 | 1.06 | 41.54 | 39.75 | 18.71 | ||||||||||||
| Cincinnati Bancorp, Inc. | 6.85 | 12.95 | 5.39 | 0.13 | 0.10 | 132.57 | 0.81 | 44.79 | 46.10 | 9.11 | |||||||||||||
| Elmira Savings Bank | (4.02 | ) | (9.85 | ) | 0.00 | 1.05 | 0.95 | 93.84 | 1.21 | 63.58 | 21.99 | 14.44 | |||||||||||
| FFBW, Inc. | 20.19 | (1.07 | ) | 40.04 | 0.17 | 0.10 | 280.88 | 1.21 | 23.37 | 59.74 | 16.88 | ||||||||||||
| HMN Financial, Inc. | 13.70 | (4.31 | ) | 14.55 | 0.27 | 0.18 | 536.82 | 1.51 | 28.14 | 58.14 | 13.72 | ||||||||||||
| Home Federal Bancorp, Inc. | 9.17 | (6.38 | ) | 9.94 | 0.27 | 0.24 | 492.35 | 1.16 | 35.41 | 43.87 | 20.72 | ||||||||||||
| HV Bancorp, Inc. | 29.15 | 14.69 | 45.53 | 0.69 | 0.51 | 74.69 | 0.56 | 34.25 | 27.39 | 38.36 | |||||||||||||
| IF Bancorp, Inc. | 8.41 | 0.70 | 10.96 | 0.22 | 0.17 | 580.90 | 1.27 | 23.92 | 54.91 | 21.17 | |||||||||||||
| Mid-Southern Bancorp, Inc. | 14.55 | (7.18 | ) | 21.61 | 0.81 | 0.41 | 92.80 | 1.43 | 53.40 | 32.50 | 14.10 | ||||||||||||
| WVS Financial Corp. | (3.09 | ) | (11.37 | ) | 3.85 | 0.00 | 0.00 | NM | 0.69 | 86.84 | 13.13 | 0.03 | |||||||||||
(1) Includes accruing troubled debt restructurings.
Source: North Shore MHC; S&P Global.
59
Feldman Financial Advisors, Inc.
III. MARKET VALUE ADJUSTMENTS
General Overview
This concluding chapter of the Appraisal identifies certain additional adjustments to the Company’s estimated pro forma market value relative to the Comparative Group selected in Chapter II. The adjustments discussed in this chapter are made from the viewpoints of potential investors, which would include depositors holding subscription rights and unrelated parties who may purchase stock in a community offering. It is assumed that these potential investors are aware of all relevant and necessary facts as they would pertain to the value of the Company relative to other publicly traded thrift institutions and relative to alternative investments.
Our appraised value is predicated on a continuation of the current operating environment for the Company and thrift institutions in general. Changes in the Company’s operating performance along with changes in the local and national economy, the stock market, interest rates, the regulatory environment, and other external factors may occur from time to time, often with great unpredictability, which could materially impact the pro forma market value of the Company or thrift stocks in general. Therefore, the Valuation Range provided herein is subject to a more current re-evaluation prior to the actual completion of the Conversion and Stock Offering.
In addition to the comparative operating fundamentals discussed in Chapter II, it is important to address additional market value adjustments based on certain financial and other criteria, which include, among other factors:
|
|
(1) |
Earnings Prospects |
|
|
(2) |
Financial Condition |
|
|
(3) |
Market Area |
|
|
(4) |
Management |
|
|
(5) |
Dividend Payments |
|
|
(6) |
Liquidity of the Stock Issue |
60
Feldman Financial Advisors, Inc.
|
|
(7) |
Subscription Interest |
|
|
(8) |
Recent Acquisition Activity |
|
|
(9) |
Effect of Banking Regulations and Regulatory Reform |
|
|
(10) |
Stock Market Conditions |
Earnings Prospects
Earnings prospects are dependent upon the sensitivity of asset yields and liability costs to changes in market rates, the credit quality of assets, the stability of non-interest components of income and expense, and the ability to leverage the balance sheet. Each of the foregoing is an important factor for investors in assessing earnings prospects. The Company’s profitability in recent years has been restrained due to its relatively lower level of net interest income and increased provision for loan losses. These disadvantages are offset somewhat by the Company’s lower level of non-interest expense. Notwithstanding the income tax benefits which reduced the impact of negative operating returns, the Company reported net losses for the year ended December 31, 2020 and also for the six months ended June 30, 2021.
The Company’s earnings compared unfavorably to the Comparative Group for the recent LTM period. The Company’s ROA measured 0.04% versus the Comparative Group median of 0.73% and All Public Thrift median of 0.92%. On a core earnings basis which excludes non-recurring items, the Company’s core ROA of 0.05% trailed the Comparative Group median of 0.73% and the All Public Thrift Median of 0.96%.
The Company’s increased capital position after the Stock Offering will help to improve its net interest margin across changing interest rate and business cycles, provide added interest rate risk protection, and additional leverage capacity to grow the balance sheet. In the near term, the Company’s profitability will continue to be challenged by net interest margin pressure, new stock benefit plans, public company costs, and regular loan loss provisions to ensure that the Company’s reserve level increases commensurately with the risk profile of the anticipated loan portfolio expansion. Based on the Company’s earnings fundamentals and recent subpar returns, we believe that the challenges of increasing profitability warrant a downward adjustment to the Company’s pro forma market value relative to the Comparative Group.
61
Feldman Financial Advisors, Inc.
Financial Condition
As discussed and summarized in Chapter I, the Company’s balance sheet composition reflects a large concentration of cash liquidity and investments along with a loan portfolio predominantly comprising fixed-rate residential mortgage loans. The Company relies mainly on its deposit base as a funding source and utilizes borrowings sparingly to supplement deposits. Historically, the Company’s deposit base was heavily reliant upon certificate accounts. In recent years, the Company has emphasized growing its transaction accounts, which have increased to 65.4% of total deposits at June 30, 2021. Meanwhile, in the sustained low interest rate environment, certificate accounts have declined to 34.6% of total deposits.
In contrast to the Comparative Group, the Company exhibited a substantially higher level of equity capital, a lower ratio of loans to assets, and relatively comparable measures of asset quality. Before the infusion of net capital proceeds, the Company’s total equity ratio at 19.13% of assets was positioned well above the 11.05% median of the Comparative Group. The selection criteria for the Comparative Group ensured a collection of companies with solid capital positions, emphasis on real estate lending, and satisfactory asset quality, similar to the Company’s financial profile. Therefore, on the whole, we believe that no adjustment is warranted for the Company’s financial condition relative to the Comparative Group.
62
Feldman Financial Advisors, Inc.
Market Area
The members of the Comparative Group are located in the Midwest, Mid-Atlantic, and Southwest regions of the country. The market areas encompassing the Comparative Group companies include metropolitan areas such as Baltimore, Cincinnati, Milwaukee, and Pittsburgh, along with smaller metropolitan and micropolitan areas. The Comparative Group companies are characterized by a cross-section of market areas that constitute smaller to larger metropolitan areas with relatively stable economies and moderate population growth prospects.
The Company’s market area consists of Lake County and Cook County, which are located in Illinois, and Kenosha County which is located in Wisconsin. The Company’s market areas are located within the Chicago MSA. As shown in Table 22, the weighted average household income of the Chicago MSA was $76,758 and above the corresponding Comparative Group median household income within market area of $65,793. The median household income in the cities where the Company has branch locations ranged from $51,250 in Waukegan, Illinois, to $111,367 in Lindenhurst, Illinois. The population growth forecast for the Chicago MSA of -0.3% over the next five years moderately trailed the Comparative Group median and average of 0.2% and 1.1%, respectively. The population growth forecast was higher in Kenosha County at 1.2% and the city of Lindenhurst at 5.1%. Four of the Comparative Group companies displayed negative population growth forecasts for their primary market area. The July 2021 unemployment rate of 7.5% for the Chicago MSA exceeded the Comparative Group median and average rates of 5.5% and 5.6%, respectively. While the Company’s primary metropolitan market area is characterized by comparatively higher income levels, its population growth projections and unemployment rates are slightly less favorable than those of the Comparative Group. In recognition of these varying demographic factors altogether, we believe that no adjustment is warranted for market area.
63
Feldman Financial Advisors, Inc.
Table 22
Selected Demographic Data of Primary Market Areas
North Shore MHC and the Comparative Group
|
|
Wtd. Avg. |
Wtd. Avg. |
|
|
|
Median House- |
Est. Population |
Unemployment |
|
|
hold Income |
Growth |
Rate |
|
Headquarters |
2021 (1) |
2021-26 (1) |
July 2021 (2) |
Company |
Location |
($) |
(%) |
(%) |
|
|
|
|
|
North Shore MHC |
Waukegan, IL [MSA data] |
76,758 |
(0.27) |
7.5 |
|
Chicago MSA |
76,758 |
(0.27) |
7.5 |
|
Lake County, IL |
92,588 |
(0.26) |
4.9 |
|
Cook County, IL |
69,884 |
(0.80) |
8.8 |
|
Kenosha County, WI |
69,846 |
1.16 |
4.8 |
|
Waukegan, IL (city) |
51,250 |
(1.61) |
6.7 |
|
Lindenhurst, IL (city) |
111,367 |
5.06 |
NA |
Comparative Group Average [primary MSA data] |
65,082 |
0.24 |
5.5 |
|
Comparative Group Median [primary MSA data] |
65,793 |
1.11 |
5.6 |
|
Comparative Group |
|
|
|
|
CBM Bancorp, Inc. |
Baltimore, MD |
87,338 |
1.43 |
5.4 |
Cincinnati Bancorp, Inc. |
Cincinnati, OH |
68,988 |
1.70 |
5.3 |
Elmira Savings Bank |
Elmira, NY |
58,446 |
(2.06) |
5.7 |
FFBW, Inc. |
Brookfield, WI |
66,586 |
1.26 |
5.0 |
HMN Financial, Inc. |
Rochester, MN |
72,330 |
2.28 |
2.8 |
Home Federal Bancorp, Inc. |
Shreveport, LA |
45,915 |
(0.75) |
6.1 |
HV Bancorp, Inc. |
Doylestown, PA |
75,304 |
0.95 |
6.9 |
IF Bancorp, Inc. |
Watseka, IL |
50,891 |
(2.92) |
6.5 |
Mid-Southern Bancorp, Inc. |
Salem, IN |
60,023 |
1.30 |
4.5 |
WVS Financial Corp. |
Pittsburgh, PA |
64,999 |
(0.81) |
6.6 |
|
|
|
|
|
|
(1) |
Weighted average based on pro rata branch deposit totals of each company in its primary MSA (or county) markets. |
|
(2) |
Based on unemployment rate in company’s primary MSA (or county) market as ranked by deposits. |
Source: Claritas; S&P Global; U.S. Bureau of Labor Statistics.
Management
Management’s principal challenges are to generate profitable results, monitor credit risks, and control operating costs while the Company competes in an increasingly challenging financial services environment. The normal challenges facing the Company in attempting to deliver earnings growth and enhance its competitiveness remain paramount as it attempts to leverage the net capital proceeds from the Stock Offering. The Chief Executive Officer of the Bank, Stephen Lear, has 42 years of experience with the organization, and Nathan Walker, who was promoted to President of the Bank in 2020, has been with the organization for 25 years. Mr. Walker’s promotion to President was part of the Bank's long-term succession plan, ensuring key members of the management team are in place to execute the strategic plan. Other senior management includes Carissa Schoolcraft, who was promoted to Chief Financial Officer of the Bank in 2021, and Amy Avakian, the Chief Lending Officer, who has 33 years of experience.
64
Feldman Financial Advisors, Inc.
The management team has ongoing challenges ahead in improving earnings results, growing the banking franchise, and controlling operating expenses as the organization transitions to a public company. Investors will likely rely upon actual financial results as the means of evaluating the future performance of management as the Company pursues its asset growth and earnings improvement objectives. Based on these considerations, we believe that no adjustment is warranted relative to the Comparative Group for this factor.
Dividend Payments
Following the completion of the Conversion and Stock Offering, the Board of Directors of NSTS Bancorp will have the authority to declare cash dividends on the shares of common stock, subject to statutory and regulatory requirements. However, no decision has been made with respect to the payment of dividends. The payment and amount of any dividends will depend upon many factors, including the following: (1) the financial condition and operating results of NSTS Bancorp and the Bank; (2) regulatory capital requirements and limitations on dividends; (3) other uses of funds for the long-term value of stockholders; (4) tax considerations; and (5) general economic conditions. There is no assurance that NSTS Bancorp will actually pay cash dividends or that, if paid, such dividends will not be reduced or eliminated in the future.
65
Feldman Financial Advisors, Inc.
Payment of cash dividends has become commonplace among publicly traded thrifts with solid capital levels. Of the 10 members of the Comparative Group, five currently pay regular cash dividends. The median dividend yields of the Comparative Group and All Public Thrift aggregate were 0.39% and 1.37% as of August 31, 2021, respectively. Based on the anticipated strong capital levels of the Bank and NSTS Bancorp after the Stock Offering, investors are likely to expect that NSTS Bancorp will commence paying regular dividends not too long after the Stock Offering is completed as a means of enhancing shareholder returns. Therefore, we have concluded that no adjustment is warranted for purposes of dividend policy.
Liquidity of the Stock Issue
With the increased number of market makers and institutional investors following thrift stocks, the majority of initial public offerings by thrift institutions are able to develop a public market for their new stock issues. Most publicly traded thrift stocks continue to be traded on the NASDAQ Stock Market. All 10 members of the Comparative Group are listed on the NASDAQ Stock Market. NSTS Bancorp expects that its shares of common stock will be traded on the NASDAQ Stock Market under the symbol “NSTS” upon conclusion of the Stock Offering.
The development and maintenance of a public market, having the desirable characteristics of depth, liquidity, and orderliness, depend on the existence of willing buyers and sellers. The median market capitalization of the Comparative Group companies was $50.2 million as of August 31, 2021. The All Public Thrift median market capitalization was much higher at $173.9 million. Of the 10 companies in the Comparative Group, all are traded on NASDAQ Stock Market and indicated an overall average daily trading volume of approximately 3,500 shares over the LTM period. The Company’s comparably-sized stock issue on a pro forma basis would firmly suggest that, given a proposed NASDAQ market listing, it would enjoy a depth of liquidity similar to that facilitated by the Comparative Group’s market capitalizations and trading volume histories. Therefore, we have concluded that no adjustment to the Company’s pro forma market value is warranted to address the liquidity of its common stock issue.
66
Feldman Financial Advisors, Inc.
Subscription Interest
The Company has retained the services of Keefe, Bruyette & Woods, Inc. to assist in the marketing and sale of the Stock Offering. The Company’s ESOP plans to purchase shares in the Stock Offering equal to 8.00% of the total amount of common stock to be outstanding. The Company expects its directors and executive officers, together with their associates, to purchase 270,000 shares of common stock in the Stock Offering for an aggregate amount of $2.7 million based on a $10.00 offering price per share. The minimum number of shares of common stock that may be purchased in the Stock Offering is 25 shares ($250). Excluding the ESOP purchase, the maximum number of shares of common stock that may be purchased in the Stock Offering by any person or persons exercising subscription rights through a single qualifying account is 30,000 shares ($300,000 equivalent). No person together with an associate or group of persons acting in concert may purchase more than 40,000 shares ($400,000 equivalent).
Recent subscription interest in thrift stock conversion offerings has been varied. Four standard conversion offerings have been completed thus far in 2021 (all in the month of July), and two were completed in 2020. Of the four standard conversion transactions completed in 2021, two (Blue Foundry Bancorp and PB Bankshares) were fully subscribed by eligible account holders in the subscription phase and closed at the adjusted maximum of their respective offering ranges. Texas Community Bancshares closed its offering in the subscription phase at a level slightly above the minimum (between the minimum and the midpoint), while TC Bancshares closed its offering at a level slightly above the midpoint (between the midpoint and the maximum). Of the two standard offerings completed in 2020, Systematic Savings Bank closed its relatively small offering at the adjusted maximum based on results from its subscription and community offerings, while the sizable offering by Eastern Bankshares was closed at slightly below the maximum through the sale of shares entirely in the subscription offering.
67
Feldman Financial Advisors, Inc.
Investor interest in recent thrift stock issues has been supported by the overall favorable performance results of the banking industry, stable housing market conditions, after-market pricing trends, and the expectation of continued merger and acquisition activity. We are not currently aware of any additional market evidence or characteristics that may help predict the level of interest in the Company’s subscription offering. Accordingly, absent actual results of the subscription offering, we believe that subscription interest is currently a neutral factor and, at the present time, requires no further adjustment.
Recent Acquisition Activity
Table 23 summarizes recent acquisition activity involving banks and thrifts based in the state of Illinois from January 1, 2019 to August 31, 2021. There were 41 such acquisition transactions announced during this period. Table 23 displays the 17 transactions wherein financial terms are available. The largest transaction involved the merger of equals between Old National Bancorp (based in Evansville, Indiana with $23.7 billion of assets) and First Midwest Bancorp (based in Chicago, Illinois with $21.2 billion in assets). The acquisition valuation ratios paid in these transactions generally have followed the nationwide acquisition valuation trends. Given that there will be significant regulatory restrictions on the ability to acquire control of NSTS Bancorp for a period of three years following the Conversion, we do not believe that acquisition premiums are a significant factor to consider in analyzing the Company’s pro forma market value. Moreover, the standard of value applied herein does not require an acquisition value determination.
68
Feldman Financial Advisors, Inc.
Table 23
Summary of Illinois Bank and Thrift Acquisition Activity
Pending or Completed Transactions Announced Since January 1, 2019
|
|
|
|
|
Seller’s Prior Financial Data |
|
|
Offer |
|
Offer Value to |
|
|
||||
|
|
|
|
|
Total |
Equity/ |
LTM |
LTM |
|
|
Book |
Tang. |
LTM |
Total |
|
|
|
|
|
|
|
Assets |
Assets |
ROA |
ROE |
Date |
Status |
Value |
Value |
Book |
EPS |
Assets |
|
|
Buyer |
St. |
Seller |
St. |
($Mil.) |
(%) |
(%) |
(%) |
Announced |
(1) |
($Mil.) |
(%) |
(%) |
(x) |
(%) |
|
|
Overall Median |
|
|
|
276.6 |
10.83 |
0.91 |
7.38 |
NA |
NA |
44.9 |
127.1 |
129.1 |
16.7 |
11.64 |
|
|
Overall Average |
|
|
|
1,723.4 |
10.64 |
0.67 |
5.83 |
NA |
NA |
197.9 |
123.0 |
131.0 |
16.6 |
11.91 |
|
|
Scott Credit Union |
IL |
Tempo Bank |
IL |
92.9 |
11.30 |
1.42 |
14.44 |
08/20/21 |
P |
14.3 |
135.8 |
135.8 |
10.3 |
15.34 |
|
|
Finward Bancorp |
IN |
Royal Financial Inc. |
IL |
533.7 |
9.01 |
1.01 |
11.07 |
07/29/21 |
P |
52.9 |
108.0 |
113.4 |
10.2 |
9.91 |
|
|
Old Second Bancorp Inc. |
IL |
West Suburban Bancorp |
IL |
2,943.6 |
8.12 |
NA |
NA |
07/26/21 |
P |
297.3 |
124.3 |
NA |
NA |
10.10 |
|
|
Old National Bancorp |
IN |
First Midwest Bancorp (2) |
IL |
21,208.6 |
12.51 |
0.63 |
5.06 |
06/01/21 |
P |
2,468.6 |
101.8 |
165.1 |
20.4 |
11.64 |
|
|
Frst Bncp of Taylorville Inc. |
IL |
Mackinaw Valley Fin’l Svcs. |
IL |
94.1 |
9.00 |
0.16 |
1.69 |
04/23/21 |
P |
6.1 |
135.9 |
157.5 |
NA |
6.48 |
|
|
First Busey Corp. |
IL |
Cummins-American Corp. |
IL |
1,395.4 |
12.55 |
0.91 |
7.38 |
01/19/21 |
C |
130.8 |
112.4 |
112.4 |
17.1 |
9.79 |
|
|
South Porte Financial Inc. |
IL |
SouthernTrust Bancshares |
IL |
58.7 |
9.75 |
0.64 |
6.65 |
03/02/20 |
C |
7.3 |
127.2 |
127.2 |
20.8 |
12.50 |
|
|
American Pacific Bancorp |
MD |
Main Street Bancshares Inc. |
IL |
29.6 |
6.55 |
(1.78) |
(25.98) |
12/19/19 |
P |
1.2 |
45.1 |
45.1 |
NA |
3.88 |
|
|
First Waterloo Bancshares Inc. |
IL |
Best Hometown Bancorp |
IL |
114.5 |
10.83 |
NA |
NA |
10/09/19 |
C |
12.3 |
99.3 |
NA |
NA |
10.75 |
|
|
RBB Bancorp |
CA |
PGB Holdings Inc. |
IL |
223.3 |
10.96 |
1.45 |
13.12 |
09/06/19 |
C |
32.5 |
169.5 |
169.5 |
9.7 |
14.55 |
|
|
Heartland Financial USA Inc. |
IA |
Rockford B&TC |
IL |
523.4 |
8.76 |
0.11 |
1.29 |
08/13/19 |
C |
59.2 |
129.1 |
129.1 |
NM |
11.31 |
|
|
Wintrust Financial Corp. |
IL |
SBC Inc. |
IL |
594.0 |
11.19 |
1.87 |
17.19 |
07/25/19 |
C |
90.5 |
153.9 |
157.4 |
11.4 |
15.24 |
|
|
Associated Banc-Corp |
WI |
First Staunton Bancshares |
IL |
539.8 |
12.00 |
1.28 |
10.88 |
07/25/19 |
C |
76.3 |
121.9 |
126.9 |
16.7 |
14.13 |
|
|
Corporate America Family CU |
IL |
Ben Franklin Financial Inc. |
IL |
97.8 |
11.25 |
(0.55) |
(4.64) |
07/16/19 |
C |
14.2 |
127.1 |
127.1 |
NA |
14.49 |
|
|
Wintrust Financial Corp. |
IL |
STC Bancshares Corp. |
IL |
276.6 |
10.82 |
1.00 |
9.45 |
06/05/19 |
C |
44.9 |
146.2 |
146.2 |
22.3 |
16.24 |
|
|
Midland States Bancorp Inc. |
IL |
HomeStar Financial Group |
IL |
375.4 |
8.09 |
1.16 |
15.41 |
04/02/19 |
C |
9.9 |
95.0 |
95.0 |
7.1 |
2.64 |
|
|
Wintrust Financial Corp. |
IL |
Rush-Oak Corp. |
IL |
195.5 |
18.13 |
0.75 |
4.46 |
02/20/19 |
C |
46.0 |
158.1 |
158.1 |
36.2 |
23.53 |
|
|
|
|
|
|
|
|
|
|
|
|
|
|
|
|
|
|
|
(1) |
P = pending; C = completed. |
|
(2) |
Merger of equals transaction. |
Source: S&P Global.
69
Feldman Financial Advisors, Inc.
Effect of Banking Regulations and Regulatory Reform
In response to the financial crisis of 2008 and 2009, Congress took actions intended to strengthen confidence and encourage liquidity in financial institutions. The Dodd-Frank Wall Street Reform and Consumer Protection Act (“Dodd-Frank”) was enacted in 2010, and provided for new restrictions and an expanded framework of regulatory oversight for financial institutions. The legislation also created the Consumer Financial Protection Bureau that has broad authority to issue regulations governing the services and products provided by financial institutions. Community bankers believe that the Dodd-Frank legislation has led to increased compliance costs. Legislation was enacted in 2018 that preserves the fundamental elements of the post-Dodd-Frank regulatory framework, but included modifications that was expected to result in some meaningful regulatory relief for smaller and certain larger banking organizations.
As a stock savings institution insured by the FDIC and supervised by its primary regulators, the Company will continue to operate in the same regulatory environment that is substantially similar to that faced by the Comparative Group companies. As of June 30, 2021, the Company was not subject to any regulatory enforcement action and was considered well capitalized, similar to all the members of the Comparative Group. Therefore, given these factors, we believe that no specific adjustment is necessary for the effect of banking regulations and regulatory reform.
Stock Market Conditions
Financial stocks performed well in the economic recovery, and bank and thrift stocks participated fully in the sustained market rally from 2009 to 2018. Robust corporate earnings growth, sustained economic expansion, and generally low interest rates were major factors influencing equity market returns over this period, the second longest market rally in U.S. history. As the banking industry continued its recovery from the financial crisis, the FRB maintained a program of keeping rates at historic lows and implemented a series of three rate cuts in 2019. The FRB lowered the target range for the federal funds rate in July 2019 to 2.00-2.25%, in September 2019 to 1.75-2.00%, and in October 2019 to 1.50-1.75%. Favorable policy developments, including the further monetary easing by the FRB and de-escalation of the U.S.-China trade conflict, helped stocks to a strong final quarter of 2019 and lifted the S&P 500 Index to a 31.5% gain for the full year of 2019.
70
Feldman Financial Advisors, Inc.
The overall market began to experience sharp volatility in February 2020 and entered official correction levels (down 10% from 52-week highs). Interest rates dropped as a flight to safety saw long-term U.S. Treasury bonds trade at all-time lows. The market volatility was spurred by the outbreak of the coronavirus and concerns about its impact on the U.S. economy, supply chains, and consumer spending. In an extraordinary attempt to contain the coronavirus’s economic fallout, the FRB lowered the target range for the federal funds rate by 50 basis points to 1.00-1.25%. The coronavirus evolved into a global pandemic, disrupting major economies worldwide and abruptly ending the longest bull market run in U.S. history. U.S. equities fell sharply, then rebounded off their lows from March 2020 and performed strongly for the remainder of 2020.
The U.S. equity market continued to appreciate during 2021, extending the gains that began in the aftermath of March 2020, and many indexes reached all-time highs in successive months through August 2021. The successful rollout of coronavirus vaccines, unprecedented fiscal and monetary stimulus, healthy consumer balance sheets, and tightening labor markets created optimism about U.S. economic growth and helped propel stock market returns. Cyclical sectors of the market that lagged in early 2020 have recently outperformed significantly. Since the end of 2020, interest rates and commodity prices have risen, boosting the financials and energy sectors. Stock prices now reflect the market’s expectations for a sustained, strong economic recovery.
71
Feldman Financial Advisors, Inc.
Table 24 displays the one-year performance of the S&P 500 and NASDAQ Bank indexes. The NASDAQ Bank Index increased by 63.7% over the one-year period ended August 31, 2021, outperforming the broader S&P 500 Index, which was up 32.0% during this period. However, over the three-year period, the NASDAQ Bank Index is up only 7.1% as compared to the S&P 500 Index advancing 55.9%, as shown in Table 25.
A “new issue” discount that reflects investor concerns and investment risks inherent in all initial public offerings is a factor to be considered for purposes of valuing converting thrifts. Table 26 presents a summary of standard thrift conversion offerings since January 1, 2017. The pricing of these offerings confirms the presence of the new issue discount in the pro forma market valuations of converting thrifts versus existing publicly traded thrifts. The distinction of the new issue discount is most apparent with the price-to-book value ratio because the pro forma equity calculation involves combining the net new capital proceeds with the historical equity of the converting company. The median pro forma price-to-book value ratio for standard thrift conversion offerings was 59.3% for the 2020 to 2021 period, and the median pro forma price-to-tangible book ratio was 60.8%. The median pro forma price-to-earnings ratio was 16.4x for standard thrift conversion offering during the 2020 to 2021 period.
Historically, newly converted thrifts have gradually traded upward in the after-market to a range near existing thrift stock valuation levels, but found resistance approaching book value until a discernible trend in earnings improvement was evident. Pricing a new offering at a relatively high ratio in relation to pro forma book value, because of the mathematics of the calculation, would require very large increases in valuations resulting in unsustainable price-to-earnings ratios and very marginal returns on equity.
72
Feldman Financial Advisors, Inc.
Table 24
Comparative One-Year Stock Index Performance
For the One-Year Period Ended August 31, 2021
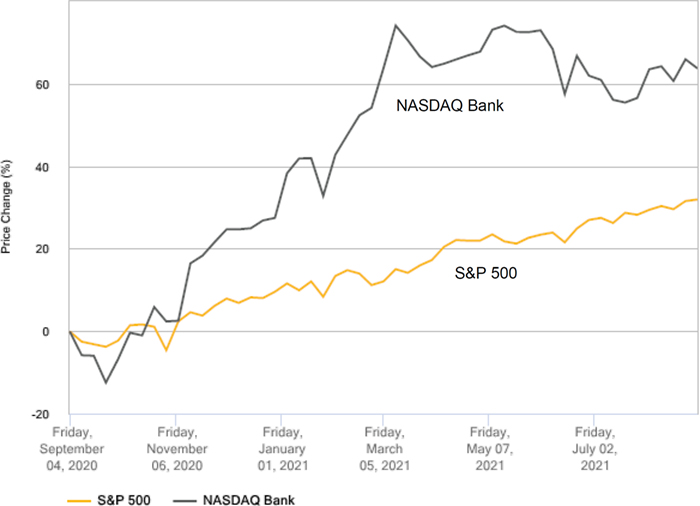
|
S&P 500 Stock Index |
+32.0% |
|
NASDAQ Bank Index |
+63.7% |
73
Feldman Financial Advisors, Inc.
Table 25
Comparative Three-Year Stock Index Performance
For the Three-Year Period Ended August 31, 2021
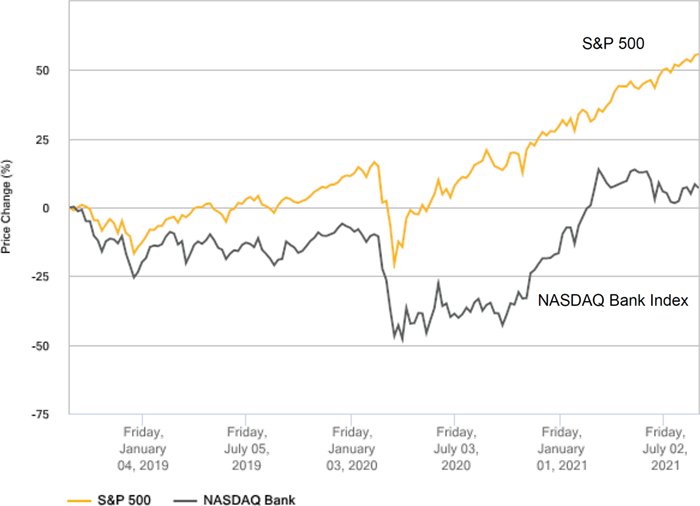
|
S&P 500 Stock Index |
+55.9% |
|
NASDAQ Bank Index |
+7.1% |
74
Feldman Financial Advisors, Inc.
Table 26
Summary of Standard Conversion Offerings
Transactions Completed Since January 1, 2017
|
Pro Forma Ratios | After-Market Price Change |
|
|||||||||||||||||||||||||||
Company |
State |
Stock Exchange |
Stock Offering Date |
Total Assets ($Mil.) |
Gross Offering Proceeds ($Mil.) |
Price/Book Value (%) |
Price/Tang. Book (%) |
Price/ LTM EPS (x) |
Tang. Eqty./Assets (%) |
IPO Price ($) |
8/31/21 Closing Price ($) |
One Day (%) |
One Week (%) |
One Month (%) |
Price Change Through 8/31/21 (%) |
|||||||||||||||
2020 to 2021 -- Average |
2,826.9 |
364.2 |
59.6 |
61.4 |
16.4 |
20.13 |
NA |
NA |
30.6 |
31.7 |
36.4 |
51.5 |
||||||||||||||||||
2020 to 2021 -- Median |
340.1 |
40.5 |
59.3 |
60.8 |
16.4 |
20.37 |
NA |
NA |
29.0 |
27.0 |
34.1 |
40.0 |
||||||||||||||||||
2017 to 2021 -- Average |
1,322.6 |
174.0 |
64.5 |
65.4 |
21.9 |
19.08 |
NA |
NA |
34.0 |
35.0 |
36.0 |
56.5 |
||||||||||||||||||
2017 to 2021 -- Median |
184.2 |
27.8 |
61.7 |
65.9 |
17.9 |
19.90 |
NA |
NA |
30.0 |
32.4 |
32.9 |
51.4 |
||||||||||||||||||
Standard Conversion Offerings |
||||||||||||||||||||||||||||||
TC Bancshares, Inc. |
GA |
NASDAQ |
07/20/21 |
363.6 |
49.0 |
59.9 |
59.9 |
14.4 |
20.84 |
10.00 |
12.98 |
21.1 |
20.7 |
28.9 |
29.8 |
|||||||||||||||
Blue Foundry Bancorp |
NJ |
NASDAQ |
07/15/21 |
1,963.6 |
277.7 |
66.1 |
66.1 |
15.4 |
19.90 |
10.00 |
13.49 |
29.0 |
27.0 |
34.1 |
34.9 |
|||||||||||||||
Texas Community Bancshares, Inc. |
TX |
NASDAQ |
07/14/21 |
316.5 |
32.1 |
53.2 |
56.0 |
16.4 |
17.83 |
10.00 |
15.50 |
50.8 |
53.5 |
54.0 |
55.0 |
|||||||||||||||
PB Bankshares, Inc. |
PA |
NASDAQ |
07/14/21 |
281.1 |
27.8 |
61.7 |
61.7 |
17.4 |
15.10 |
10.00 |
14.00 |
30.8 |
32.4 |
29.0 |
40.0 |
|||||||||||||||
Eastern Bankshares, Inc. |
MA |
NASDAQ |
10/14/20 |
13,996.5 |
1,792.9 |
58.2 |
65.9 |
18.4 |
23.10 |
10.00 |
19.78 |
21.5 |
24.8 |
36.2 |
97.8 |
|||||||||||||||
Systematic Savings Bank |
MO |
OTC |
10/13/20 |
40.0 |
6.0 |
58.7 |
58.7 |
NM |
24.01 |
10.00 |
NA |
NA |
NA |
NA |
NA |
|||||||||||||||
Eureka Homestead Bancorp, Inc. |
LA |
OTC |
07/09/19 |
98.4 |
14.3 |
60.6 |
60.6 |
44.7 |
21.53 |
10.00 |
12.96 |
21.0 |
21.0 |
21.7 |
29.6 |
|||||||||||||||
Richmond Mutual Bancorporation |
IN |
NASDAQ |
07/01/19 |
882.8 |
130.3 |
74.5 |
74.5 |
18.9 |
19.09 |
10.00 |
15.28 |
36.5 |
35.0 |
32.9 |
52.8 |
|||||||||||||||
CBM Bancorp, Inc. |
MD |
NASDAQ |
09/27/18 |
184.2 |
42.3 |
73.5 |
73.5 |
41.7 |
26.69 |
10.00 |
15.00 |
28.0 |
26.2 |
21.2 |
50.0 |
|||||||||||||||
Sidney Federal S&L Association |
NE |
OTC |
07/26/18 |
16.7 |
1.3 |
71.0 |
71.0 |
NM |
10.83 |
10.00 |
6.01 |
NA |
NA |
NA |
(39.9) |
|||||||||||||||
Eagle Financial Bancorp, Inc. |
OH |
OTC |
07/20/17 |
119.3 |
15.7 |
61.7 |
61.7 |
10.2 |
20.28 |
10.00 |
18.55 |
49.2 |
50.5 |
60.9 |
85.5 |
|||||||||||||||
Heritage NOLA Bancorp, Inc. |
LA |
OTC |
07/12/17 |
104.1 |
16.5 |
72.5 |
72.5 |
NM |
20.48 |
10.00 |
14.35 |
22.2 |
19.9 |
16.0 |
43.5 |
|||||||||||||||
PCSB Financial Corporation |
NY |
NASDAQ |
04/20/17 |
1,240.9 |
178.3 |
68.6 |
70.4 |
36.5 |
18.42 |
10.00 |
18.23 |
64.6 |
63.1 |
63.6 |
82.3 |
|||||||||||||||
HV Bancorp, Inc. |
PA |
NASDAQ |
01/11/17 |
177.1 |
21.8 |
70.7 |
70.7 |
22.7 |
15.46 |
10.00 |
21.66 |
36.7 |
40.8 |
40.0 |
116.6 |
|||||||||||||||
Community Savings Bancorp, Inc. |
OH |
OTC |
01/10/17 |
53.6 |
4.4 |
57.3 |
57.3 |
6.1 |
12.68 |
10.00 |
21.25 |
30.0 |
40.0 |
30.0 |
112.5 |
|||||||||||||||
Source: S&P Global.
75
Feldman Financial Advisors, Inc.
Accordingly, thrift conversions continue to be priced at discounts to comparable publicly traded companies. This is due to the relatively high pro forma equity ratios, expected low returns on equity, and the uncertainty regarding the prospects of an institution to leverage the balance sheet prudently and effectively in the current interest rate environment and against the backdrop of an increasingly competitive banking sector and volatile equities market.
For the 5,001 FDIC-insured commercial banks and savings institutions, full-year 2020 net income totaled $147.9 billion, a decline of $84.9 billion or 36.5% from 2019. The decline was primarily attributable to higher provision expenses in the first half of 2020 tied to pandemic-related deterioration in economic activity. Provision expenses increased by $77.1 billion or 140% and net interest income declined by $20.0 billion or 3.7%. The banking industry’s average net interest margin declined 54 basis points from 3.36% in 2019 to 2.82% in 2020. The average ROA declined from 1.29% in 2019 to 0.72% in 2020.
The asset growth rate of the banking industry increased from 3.9% in 2019 to17.4% in 2020, while the deposit growth rate increased from 4.8% to 22.6% in 2020. The injection of stimulus-related funds into the economic system increased the industry’s holdings of liquid assets and deposit liabilities. The ratio of non-performing assets to total assets increased from 0.55% at year-end 2019 to 0.61% at year-end 2020. Largely due to the banking industry’s significant asset expansion in 2020, the average equity capital ratio declined from 11.32% at year-end 2019 to 10.17% at year-end 2020.
For the first half of 2021, the banking industry’s ROA improved to 1.31% as compared to 0.37% for the first half of 2020. The improvement from the year-ago period reflected a dramatic reduction in the provision for loan losses. As of June 30, 2021, the average equity capital ratio for the industry measured 10.12% of total assets and the ratio of non-performing assets to total assets was 0.51%. The average net interest margin contracted further by 44 basis points from 2.97% in the first half of 2020 to 2.53% in the first half of 2021.
76
Feldman Financial Advisors, Inc.
Bank and thrift industry earnings results have continued to be solid in comparison to historical levels, but earnings growth has been challenged recently by eroding net interest margins and increasing credit-related charges. Industry operating expenses generally continue to rise in the face of sluggish growth in non-interest operating income. While bank and thrift industry capital levels remain strong and overall asset quality has stabilized, there continue to be volatile swings in the market for bank and thrift stocks in response to the economic outlook and the anxiety in the overall market that is contributing to the current fluctuations. Therefore, we believe that with the heightened uncertainty attendant to prevailing stock market conditions, the new issue discount continues to be highly relevant because of the risks and uncertainties associated with a new stock offering in the current market and warrants a downward adjustment.
Adjustments Conclusion
It is our opinion that the Company’s pro forma market value should be discounted relative to the Comparative Group. Our conclusion is based on downward adjustments for earnings prospects related to its recent history of subpar returns and the new issue discount underlying current stock market conditions. Converting thrifts are often valued at meaningful discounts to peer trading companies relative to price-to-book value and price-to-tangible book value ratios. Due to initially low post-offering earnings from the re-investment of net offering proceeds at relatively low rates without the benefit of immediate leverage, resulting price-to-earnings ratios may reflect premiums to established trading companies. It is the judgment of the appraiser to balance the relative dynamics of price-to-book and price-to-earnings discounts or premiums.
77
Feldman Financial Advisors, Inc.
Valuation Approach
In determining the estimated pro forma market value of the Company, we have employed the comparative company approach and considered the following pricing ratios: price-to-book value per share (“P/B”), price-to-tangible book value per share (“P/TB”), price-to-earnings per share (“P/E”), and price-to-assets (“P/A”). Table 27 presents the trading market valuation ratios of the Comparative Group and All Public Thrift averages and medians as of August 31, 2021. As shown in Table 27, the average P/B ratio for the Comparative Group was 96.3%. Five members of the Comparative Group were valued at levels under book value (P/B ratio less than 100.0%). The average P/TB ratio for the Comparative Group was 98.5%. Higher equity levels have a restraining impact on P/B and P/TB ratios because of the accompanying challenge to generate competitive ROE results on such excess capital. Among the Comparative Group members, FFBW, Inc. reported the highest equity capital ratio at 27.44% along with a P/B ratio of 83.6%. The average P/E ratio based on LTM earnings for the Comparative Group was 17.0x. On a core earnings basis, the average core P/E ratio of the Comparative Group was 16.7x. Some companies within the Comparative Group and All Public Thrift aggregate generated P/E ratios that were either negative or distortedly high due to low levels of profitability, and their corresponding P/E ratios are expressed as “NM” or non-meaningful.
Investors continue to make decisions to purchase thrift conversion stocks and more seasoned thrift issues based upon consideration of core earnings profitability and P/B comparisons. The P/E ratio remains an important valuation ratio in the current thrift stock market. However, as noted above, the P/E ratio is not useful for companies reporting negative or low earnings. The Company’s earnings for the LTM ended June 30, 2021 amounted to $98,000 and its LTM core earnings amounted to $115,000. On a pro forma basis, after making adjustments for re-investment of net offering proceeds and expensing charges related to the implementation of various stock benefit plans, including the ESOP, restricted stock plan (“RSP”), and stock option plan, the Company’s pro forma earnings are reduced to negative levels and renders the P/E approach irrelevant for valuation purposes.
78
Feldman Financial Advisors, Inc.
Based on our comparative financial and valuation analyses, we concluded that the Company should be discounted relative to the trading valuation ratios of the overall Comparative Group. In consideration of the foregoing factors along with the additional adjustments discussed in this chapter, we have determined pro forma P/B and P/TB ratios of 51.5% at the midpoint for the Company, which reflects an aggregate midpoint of approximately $40.8 million for the Valuation Range based on the assumptions summarized in Exhibit IV and including the issuance of 2.0% of the to-be-outstanding common shares to the Foundation. Employing a range of 15% above and below the midpoint, the resulting minimum value of approximately $34.7 million reflects a 46.9% P/B ratio and the resulting maximum value of approximately $46.9 million reflects a 55.6% P/B ratio. The adjusted maximum value, computed as an additional 15% above the maximum, is positioned at approximately $54.0 million and a P/B ratio of 59.7%. The Company’s pro forma P/B and P/TB ratios are equivalent since the Company had no intangible assets as of June 30, 2021.
The Company’s pro forma earnings base is negative and results in non-meaningful P/E ratios. Similarly, the Company’s pro forma core earnings result for the recent LTM period is also negative and therefore disallows usage of the P/E approach on a core earnings basis. As of August 31, 2021, the Comparative Group’s average P/E ratio was 17.0x and its average core P/E ratio was 16.7x.
79
Feldman Financial Advisors, Inc.
The Company’s pro forma midpoint P/B and P/TB ratios of 51.5% reflect a discount of 46.5% to the Comparative Group average P/B ratio of 96.3% and a 47.7% discount to the Comparative Group average P/TB ratio of 98.5%. The Company’s pro forma maximum P/B and P/TB ratios of 55.6% reflect discounts of 42.3% and 43.6% to the Comparative Group average P/B and P/TB ratios, respectively. At the adjusted maximum, the Company’s pro forma P/B and P/TB ratios of 59.7% are positioned at a 38.0% discount to the Comparative Group median P/B and a discount of 39.4% to the Comparative Group median P/TB ratio.
Based on the price-to-assets valuation metric, the Company’s pro forma midpoint of the Valuation Range at $40.8 million reflects a corresponding P/A ratio of 14.94%, ranging from 12.95% at the minimum valuation to 16.86% and 18.98% at the maximum and adjusted maximum, respectively. The Company’s solid capitalization level resulted in a midpoint P/A ratio of 14.94% versus the Comparative Group average of 13.73%. While the Company’s pro forma P/B and P/TB ratios reflect material discounts to the Comparative Group, the Company’s pro forma P/A ratios reflect a slight discount to the Comparative Group at the pro forma minimum, but increasing levels of premiums at the pro forma midpoint, maximum, and adjusted maximum values.
The Company’s strong pro forma P/A ratios reflect the substantial capital ratios evidenced by NSTS Bancorp on a pro forma consolidated basis, which range from equity-to-assets ratios of 27.61% at the minimum valuation and 29.00% at the midpoint valuation to 30.33% at the maximum valuation and 31.81% at the adjusted maximum valuation. Among all of the public thrifts shown in Exhibit III, only two have equity-to-assets ratios in excess of 25.0%: FFBW Inc. at 27.44% and William Penn Bancorporation, which recently completed a second-step conversion, at 26.38%. The superior equity capital levels of the Company after completion of the Conversion and Stock Offering will provide greater expansion opportunity and flexibility, but also present challenges in generating competitive returns on equity.
80
Feldman Financial Advisors, Inc.
Valuation Conclusion
It is our opinion that, as of August 31, 2021, the estimated pro forma market value of the Company was within a Valuation Range of $34,693,880 to $46,938,780 with a midpoint of $40,816,330. Pursuant to applicable appraisal guidelines, the Valuation Range was based upon a 15% decrease from the midpoint value to determine the minimum value and a 15% increase from the midpoint value to establish the maximum value. Assuming an additional 15% increase above the maximum value would result in an adjusted maximum of $53,979,590. Based on the Valuation Range, the range of shares to be sold in the Stock Offering (excluding the Foundation shares) is as follows: $34,000,000 at the minimum, $40,000,000 at the midpoint, $46,000,000 at the maximum, and $52,800,000 at the adjusted maximum. Based on an initial offering price of $10.00 per share, the number of shares to be sold in the Stock Offering is as follows: 3,400,000 at the minimum, 4,000,000 at the midpoint, 4,600,000 at the maximum, and 5,290,000 at the adjusted maximum. Table 27 compares the Company’s pro forma valuation ratios to the market valuation ratios of the Comparative Group.
Exhibit IV-1 displays the assumptions utilized in calculating the pro forma financial consequences of the Stock Offering. Exhibit IV-2 displays the pro forma financial data at the minimum, midpoint, maximum, and adjusted maximum levels of the Valuation Range. Exhibit IV-3 provides more detailed data and calculations at the pro forma midpoint level of the Valuation Range. Exhibit IV-4 compares the pro forma valuation ratios with the averages and medians reported by the Comparative Group.
81
Feldman Financial Advisors, Inc.
Table 27
Comparative Pro Forma Market Valuation Analysis
Computed from Market Price Data as of August 31, 2021
| Current | Total | Price/ | Price/ | Price/ | Price/ | Price/ | Total | Tang. | Current | |||||||||||||||||||||
| Stock | Market | LTM | Core | Book | Tang. | Total | Equity/ | Equity/ | Dividend | |||||||||||||||||||||
| Price | Value | EPS | EPS | Value | Book | Assets | Assets | Assets | Yield | |||||||||||||||||||||
| Company | ($) | ($Mil.) | (x) | (x) | (%) | (%) | (%) | (%) | (%) | (%) | ||||||||||||||||||||
| NSTS Bancorp, Inc.(1) | ||||||||||||||||||||||||||||||
| Pro Forma Minimum | 10.00 | 34.7 | NM | NM | 46.9 | 46.9 | 12.95 | 27.61 | 27.61 | 0.00 | ||||||||||||||||||||
| Pro Forma Midpoint | 10.00 | 40.8 | NM | NM | 51.5 | 51.5 | 14.94 | 29.00 | 29.00 | 0.00 | ||||||||||||||||||||
| Pro Forma Maximum | 10.00 | 46.9 | NM | NM | 55.6 | 55.6 | 16.86 | 30.33 | 30.33 | 0.00 | ||||||||||||||||||||
| Pro Forma Adj. Maximum | 10.00 | 54.0 | NM | NM | 59.7 | 59.7 | 18.98 | 31.81 | 31.81 | 0.00 | ||||||||||||||||||||
| Comparative Group Average | NA | 56.3 | 17.0 | 16.7 | 96.3 | 98.5 | 13.73 | 14.37 | 14.17 | 1.13 | ||||||||||||||||||||
| Comparative Group Median | NA | 50.2 | 11.5 | 11.5 | 99.3 | 101.4 | 10.85 | 11.05 | 11.01 | 0.39 | ||||||||||||||||||||
| All Public Thrift Average(2) | NA | 561.2 | 15.2 | 14.7 | 114.8 | 127.4 | 14.38 | 12.80 | 12.02 | 1.60 | ||||||||||||||||||||
| All Public Thrift Median(2) | NA | 173.9 | 12.1 | 12.2 | 104.4 | 107.7 | 13.08 | 11.69 | 10.82 | 1.37 | ||||||||||||||||||||
| Comparative Group | ||||||||||||||||||||||||||||||
| CBM Bancorp, Inc. | 15.00 | 49.3 | NM | NM | 105.4 | 105.4 | 21.16 | 20.08 | 20.08 | 0.00 | ||||||||||||||||||||
| Cincinnati Bancorp, Inc. | 14.64 | 42.9 | 10.1 | 10.0 | 101.3 | 101.7 | 17.36 | 17.13 | 17.08 | 0.00 | ||||||||||||||||||||
| Elmira Savings Bank | 14.39 | 51.1 | 10.4 | 10.4 | 81.9 | 102.1 | 7.87 | 9.62 | 7.87 | 4.17 | ||||||||||||||||||||
| FFBW, Inc. | 11.50 | 73.8 | 37.1 | 34.8 | 83.6 | 83.9 | 22.94 | 27.44 | 27.37 | 0.00 | ||||||||||||||||||||
| HMN Financial, Inc. | 23.32 | 104.0 | 7.6 | 7.6 | 100.3 | 101.1 | 11.04 | 11.00 | 10.93 | 0.00 | ||||||||||||||||||||
| Home Federal Bancorp, Inc. | 18.01 | 56.0 | 11.5 | 11.5 | 114.5 | 114.5 | 10.67 | 9.32 | 9.32 | 2.22 | ||||||||||||||||||||
| HV Bancorp, Inc. | 21.66 | 47.1 | 6.5 | 6.5 | 113.7 | 113.7 | 8.59 | 7.55 | 7.55 | 0.00 | ||||||||||||||||||||
| IF Bancorp, Inc. | 22.25 | 67.7 | 11.9 | 12.6 | 86.4 | 86.4 | 9.67 | 10.70 | 10.70 | 1.57 | ||||||||||||||||||||
| Mid-Southern Bancorp, Inc. | 15.25 | 43.5 | 36.3 | 36.3 | 98.4 | 98.4 | 19.39 | 19.71 | 19.71 | 0.79 | ||||||||||||||||||||
| WVS Financial Corp. | 15.80 | 27.5 | 21.4 | 20.6 | 77.6 | 77.6 | 8.60 | 11.09 | 11.09 | 2.53 | ||||||||||||||||||||
| (1) | Pro forma ratios assume an estimated pro forma market value of $34.7 million at the minimum, $40.8 million at the midpoint, $46.9 million at the maximum, and $54.0 million at the adjusted maximum (inclusive of the shares of common stock issued to the charitable foundation). |
| (2) | All public thrifts traded on a major exchange, excluding mutual holding companies and companies being acquired in announced merger transactions. |
Source: North Shore MHC; S&P Global.
82
Feldman Financial Advisors, Inc.
Exhibit I
Background of Feldman Financial Advisors, Inc.
Overview of Firm
Feldman Financial Advisors provides consulting and advisory services to financial institutions and mortgage companies in the areas of corporate valuations, mergers and acquisitions, strategic planning, branch sales and purchases, developing and implementing regulatory business and capital plans, and expert witness testimony and analysis. Our senior staff members have been involved in the stock conversion process since 1982 and have valued more than 350 converting institutions.
Feldman Financial Advisors was incorporated in February 1996 by a group of consultants who were previously associated with Credit Suisse First Boston and Kaplan Associates. Each of the principals at Feldman Financial Advisors has more than 35 years of experience in consulting, and all were officers of their prior firm. Our senior staff collectively has worked with more than 1,000 commercial banks, savings institutions, credit unions, insurance companies, and mortgage companies nationwide. The firm’s office is located outside of Washington, D.C. in McLean, Virginia.
Background of Senior Professional Staff
Trent Feldman - President. Trent is a nationally recognized expert in providing strategic advice to and valuing financial service companies and advising on mergers and acquisitions. Trent was with Kaplan Associates for 14 years and was one of three founding principals at that firm. Trent also has worked at the Federal Home Loan Bank Board and with the California legislature. Trent holds Bachelor’s and Master’s Degrees from the University of California, Los Angeles.
Peter Williams - Principal. Peter specializes in merger and acquisition analysis, mutual-to-stock conversion valuations, corporate valuations, strategic business plans, and fair value accounting analysis. Peter previously was with Kaplan Associates for 13 years. Peter also worked as a Corporate Planning Analyst with the Wilmington Trust Company in Delaware. Peter holds a BA in Economics from Yale University and an MBA in Finance and Investments from The George Washington University.
I-1
Feldman Financial Advisors, Inc.
Exhibit II-1
Consolidated Balance Sheets
North Shore MHC
As of December 31, 2019 and 2020 and June 30, 2021
(Dollars in Thousands)
| June 30, | December 31, | ||||||||||||||||
| 2021 | 2020 | 2019 | |||||||||||||||
| Assets | |||||||||||||||||
| Cash and due from banks | $ | 1,086 | $ | 884 | $ | 1,008 | |||||||||||
| Interest-bearing bank deposits | 19,264 | 30,984 | 31,372 | ||||||||||||||
| Time deposits with other financial institutions | 6,199 | 12,436 | 20,171 | ||||||||||||||
| Investment securities available for sale | 98,284 | 81,620 | 68,569 | ||||||||||||||
| Federal Home Loan Bank stock | 550 | 512 | 512 | ||||||||||||||
| Loans held for sale | 379 | 1,972 | 722 | ||||||||||||||
| Loans, net of unearned income | 98,654 | 99,325 | 98,065 | ||||||||||||||
| Allowance for loan losses | (792 | ) | (870 | ) | (388 | ) | |||||||||||
| Loans, net | 97,861 | 98,455 | 97,677 | ||||||||||||||
| Premises and equipment, net | 5,146 | 5,213 | 5,400 | ||||||||||||||
| Accrued interest receivable | 680 | 672 | 636 | ||||||||||||||
| Bank-owned life insurance | 8,978 | 8,890 | 8,707 | ||||||||||||||
| Other assets | 1,432 | 580 | 775 | ||||||||||||||
| Total Assets | $ | 239,858 | $ | 242,219 | $ | 235,549 | |||||||||||
| Liabilities and Equity | |||||||||||||||||
| Deposits: | |||||||||||||||||
| Non-interest bearing accounts | $ | 11,835 | $ | 9,734 | $ | 7,301 | |||||||||||
| Demand and NOW checking | 17,975 | 16,364 | 12,750 | ||||||||||||||
| Money market accounts | 45,578 | 50,143 | 52,928 | ||||||||||||||
| Savings accounts | 45,229 | 42,250 | 39,567 | ||||||||||||||
| Time deposits over $250,000 | 8,950 | 10,705 | 10,804 | ||||||||||||||
| Other time deposits | 54,838 | 57,207 | 61,022 | ||||||||||||||
| Total Deposits | 184,406 | 186,404 | 184,371 | ||||||||||||||
| Escrow deposits | 1,468 | 1,519 | 1,509 | ||||||||||||||
| Other borrowings | 5,000 | 4,000 | - | ||||||||||||||
| Accrued expenses and other liabilities | 3,109 | 3,571 | 3,904 | ||||||||||||||
| Total Liabilities | 193,983 | 195,493 | 189,785 | ||||||||||||||
| Retained earnings | 45,305 | 45,319 | 45,431 | ||||||||||||||
| Accumulated other comprehensive income, net | 570 | 1,406 | 333 | ||||||||||||||
| Total Equity | 45,875 | 46,725 | 45,764 | ||||||||||||||
| Total Liabilities and Equity | $ | 239,858 | $ | 242,219 | $ | 235,549 | |||||||||||
Source: North Shore MHC, financial statements.
II-1
Feldman Financial Advisors, Inc.
Exhibit II-2
Consolidated Income Statements
North Shore MHC
For the Years Ended December 31, 2019 and 2020
And the Six Months Ended June 30, 2020 and 2021
(Dollars in Thousands)
| Six Months Ended | Year Ended | |||||||||||||||||||||||
| June 30, | December 31, | |||||||||||||||||||||||
| 2020 | 2019 | 2020 | 2019 | |||||||||||||||||||||
| Interest income | $ | 2,565 | $ | 3,272 | $ | 6,011 | $ | 7,012 | ||||||||||||||||
| Interest expense | 490 | 840 | 1,488 | 1,726 | ||||||||||||||||||||
| Net interest income | 2,075 | 2,432 | 4,523 | 5,286 | ||||||||||||||||||||
| Provision for loan losses | 17 | 220 | 464 | 97 | ||||||||||||||||||||
| Net interest income after provision | 2,058 | 2,212 | 4,059 | 5,189 | ||||||||||||||||||||
| Service charges on deposit accounts | 141 | 127 | 255 | 241 | ||||||||||||||||||||
| Gain on sale of mortgage loans | 245 | 146 | 787 | 285 | ||||||||||||||||||||
| Gain on sale of securities | - | 59 | 59 | - | ||||||||||||||||||||
| Gain on sale of other real estate owned | - | - | - | 38 | ||||||||||||||||||||
| Rental income on office building | 21 | 21 | 42 | 42 | ||||||||||||||||||||
| BOLI income | 88 | 90 | 182 | 188 | ||||||||||||||||||||
| Other income | 109 | 67 | 277 | 73 | ||||||||||||||||||||
| Total non-interest income | 604 | 510 | 1,603 | 867 | ||||||||||||||||||||
| Salaries and employee benefits | 1,691 | 1,799 | 3,691 | 3,514 | ||||||||||||||||||||
| Occupancy and equipment | 341 | 352 | 689 | 770 | ||||||||||||||||||||
| Data processing | 328 | 247 | 565 | 463 | ||||||||||||||||||||
| Advertising | 38 | 39 | 68 | 101 | ||||||||||||||||||||
| Supervisory fees and assessments | 63 | 53 | 117 | 89 | ||||||||||||||||||||
| Loan expenses | 72 | 59 | 141 | 101 | ||||||||||||||||||||
| Foreclosure expenses | 8 | 3 | 12 | 38 | ||||||||||||||||||||
| Other expense | 372 | 476 | 995 | 653 | ||||||||||||||||||||
| Total non-interest income | 2,913 | 3,028 | 6,277 | 5,728 | ||||||||||||||||||||
| Income (loss) before income taxes | (251 | ) | (306 | ) | (615 | ) | 328 | |||||||||||||||||
| Income tax benefit | (237 | ) | (82 | ) | (503 | ) | (86 | ) | ||||||||||||||||
| Net income (loss) | $ | (14 | ) | $ | (224 | ) | $ | (112 | ) | $ | 414 | |||||||||||||
Source: North Shore MHC, financial statements.
II-2
Feldman Financial Advisors, Inc.
Exhibit II-3
Loan Portfolio Composition
North Shore MHC
As of December 31, 2019 and 2020 and June 30, 2021
(Dollars in Thousands)
| June 30, | December 31, | ||||||||||||||||||||||||||||
| 2021 | 2020 | 2019 | |||||||||||||||||||||||||||
| Loan | Amount | Percent | Amount | Percent | Amount | Percent | |||||||||||||||||||||||
| Category | (000s) | (%) | (000s) | (%) | (000s) | (%) | |||||||||||||||||||||||
| First mortage loans: | |||||||||||||||||||||||||||||
| One- to four-family residential | $ | 87,874 | 89.72 | $ | 87,198 | 88.38 | $ | 88,030 | 90.41 | ||||||||||||||||||||
| Multi-family residential | 5,202 | 5.31 | 5,736 | 5.81 | 6,438 | 6.61 | |||||||||||||||||||||||
| Commercial real estate | 4,565 | 4.66 | 5,340 | 5.41 | 2,682 | 2.75 | |||||||||||||||||||||||
| Total first mortgage loans | 97,641 | 99.69 | 98,274 | 99.61 | 97,150 | 99.78 | |||||||||||||||||||||||
| Consumer loans | 303 | 0.31 | 385 | 0.39 | 217 | 0.22 | |||||||||||||||||||||||
| Gross total loans | 97,944 | 100.00 | 98,659 | 100.00 | 97,367 | 100.00 | |||||||||||||||||||||||
| Net deferred loan costs | 709 | 666 | 699 | ||||||||||||||||||||||||||
| Allowance for loan losses | (792 | ) | (870 | ) | (389 | ) | |||||||||||||||||||||||
| Net total loans (1) | $ | 97,861 | $ | 98,455 | $ | 97,677 | |||||||||||||||||||||||
(1) Excludes loans held for sale.
Source: North Shore MHC, financial data.
II-3
Feldman Financial Advisors, Inc.
Exhibit II-4
Net Lending Activity
North Shore MHC
For the Years Ended December 31, 2019 and 2020
And the Six Months Ended June 30, 2020 and 2021
(Dollars in Thousands)
| Six Months Ended | Year Ended | |||||||||||||||||||||
| June 30, | December 31, | |||||||||||||||||||||
| 2021 | 2020 | 2020 | 2019 | |||||||||||||||||||
| Loan Originations | ||||||||||||||||||||||
| One- to four-family residential loans | $ | 22,737 | $ | 17,419 | $ | 52,674 | $ | 34,706 | ||||||||||||||
| Commercial real estate loans | 1,012 | 1,255 | 3,527 | - | ||||||||||||||||||
| Multi-family residential loans | - | - | - | 854 | ||||||||||||||||||
| Consumer loans | 12 | 14 | 334 | 161 | ||||||||||||||||||
| Total loan originations | 23,761 | 18,688 | 56,535 | 35,721 | ||||||||||||||||||
| Loan Sales and Repayments | ||||||||||||||||||||||
| Loans sold | (13,661 | ) | (8,771 | ) | (36,476 | ) | (16,912 | ) | ||||||||||||||
| Loan principal repayments | (12,244 | ) | (6,977 | ) | (17,534 | ) | (21,214 | ) | ||||||||||||||
| Total loan sales and repayments | (25,905 | ) | (15,748 | ) | (54,010 | ) | (38,126 | ) | ||||||||||||||
| Increase (decrease) due to other items, net | (42 | ) | (199 | ) | (497 | ) | (29 | ) | ||||||||||||||
| Net increase in total loans, net (1) | $ | (2,186 | ) | $ | 2,741 | $ | 2,028 | $ | (2,434 | ) | ||||||||||||
(1) Includes loans held for sale.
Source: North Shore MHC, financial data.
II-4
Feldman Financial Advisors, Inc.
Exhibit II-5
Cash and Investments Composition
North Shore MHC
As of December 31, 2019 and 2020 and June 30, 2021
(Dollars in Thousands)
| June 30, | December 31, | |||||||||||||||||||||
| 2021 | 2020 | 2019 | ||||||||||||||||||||
| Cash or Investment | Amount | Percent | Amount | Percent | Amount | Percent | ||||||||||||||||
| Category | (000s) | (%) | (000s) | (%) | (000s) | (%) | ||||||||||||||||
| Cash and due from banks | $ | 1,086 | 0.87 | $ | 884 | 0.70 | $ | 1,008 | 0.83 | |||||||||||||
| Interest-bearing deposits | 19,264 | 15.36 | 30,984 | 24.51 | 31,372 | 25.79 | ||||||||||||||||
| Certificates of deposit | 6,199 | 4.94 | 12,436 | 9.84 | 20,171 | 16.58 | ||||||||||||||||
| Total cash and cash equivalents | 26,549 | 21.17 | 44,304 | 35.04 | 52,550 | 43.20 | ||||||||||||||||
| Available-for-sale securities: | ||||||||||||||||||||||
| Mortgage-backed securities | 49,721 | 39.66 | 43,094 | 34.08 | 30,032 | 24.69 | ||||||||||||||||
| U.S. Govt. and agency obligations | 8,448 | 6.74 | 7,147 | 5.65 | 6,977 | 5.74 | ||||||||||||||||
| Municipal obligations | 11,105 | 8.86 | 10,980 | 8.68 | 19,112 | 15.71 | ||||||||||||||||
| Collateralized mortgage obligations | 29,010 | 23.14 | 20,399 | 16.13 | 12,449 | 10.23 | ||||||||||||||||
| Total available-for-sale securities | 98,284 | 78.39 | 81,620 | 64.55 | 68,569 | 56.37 | ||||||||||||||||
| Other investments: | ||||||||||||||||||||||
| Federal Home Loan Bank stock | 550 | 0.44 | 512 | 0.41 | 512 | 0.42 | ||||||||||||||||
| Total cash and investments | $ | 125,382 | 100.00 | $ | 126,437 | 100.00 | $ | 121,632 | 100.00 | |||||||||||||
| Percent of total assets (%) | ||||||||||||||||||||||
| Cash and cash equivalents | 11.07 | 18.29 | 22.31 | |||||||||||||||||||
| Available-for-sale securities | 40.98 | 33.70 | 29.11 | |||||||||||||||||||
| Federal Home Loan Bank stock | 0.23 | 0.21 | 0.22 | |||||||||||||||||||
| Total cash and investments | 52.27 | 52.20 | 51.64 | |||||||||||||||||||
Source: North Shore MHC, financial statements.
II-5
Feldman Financial Advisors, Inc.
Exhibit II-6
Deposit Accounts Composition
North Shore MHC
As of December 31, 2019 and 2020 and June 30, 2021
(Dollars in Thousands)
| June 30, | December 31, | |||||||||||||||||||||
| 2021 | 2020 | 2019 | ||||||||||||||||||||
| Deposit Account | Amount | Percent | Amount | Percent | Amount | Percent | ||||||||||||||||
| Category | (000s) | (%) | (000s) | (%) | (000s) | (%) | ||||||||||||||||
| Savings accounts | $ | 45,229 | 24.53 | $ | 42,250 | 22.68 | $ | 39,567 | 21.47 | |||||||||||||
| Interest-bearing checking | 17,975 | 9.74 | 16,365 | 8.78 | 12,750 | 6.92 | ||||||||||||||||
| Non-interest bearing | 11,836 | 6.42 | 9,734 | 5.22 | 7,301 | 3.96 | ||||||||||||||||
| Money market accounts | 45,578 | 24.72 | 50,143 | 26.90 | 52,927 | 28.71 | ||||||||||||||||
| Total Non-certificates | 120,618 | 65.41 | 118,492 | 63.57 | 112,545 | 61.04 | ||||||||||||||||
| Certificates of deposit: | ||||||||||||||||||||||
| 0.00% - 0.99% | 32,420 | 17.57 | 27,025 | 14.49 | 4,432 | 2.39 | ||||||||||||||||
| 1.00% - 1.99% | 9,863 | 5.34 | 17,326 | 9.28 | 38,674 | 20.97 | ||||||||||||||||
| 2.00% - 2.99% | 19,995 | 10.84 | 22,073 | 11.84 | 27,276 | 14.79 | ||||||||||||||||
| 3.00% or more | 1,510 | 0.82 | 1,488 | 0.80 | 1,444 | 0.78 | ||||||||||||||||
| Total Certificates | 63,788 | 34.59 | 67,912 | 36.43 | 71,826 | 38.96 | ||||||||||||||||
| Total Deposits | $ | 184,406 | 100.00 | $ | 186,404 | 100.00 | $ | 184,371 | 100.00 | |||||||||||||
Source: North Shore MHC, financial data.
II-6
Feldman Financial Advisors, Inc.
Exhibit II-7
Borrowed Funds Composition
North Shore MHC
As of or For the Years Ended December 31, 2019 and 2020
And the Six Months Ended June 30, 2021
(Dollars in Thousands)
| Six Months | |||||||||||
| Ended | Year Ended | ||||||||||
| June 30, | December 31, | ||||||||||
| 2021 | 2020 | 2019 | |||||||||
| Federal Home Loan Bank Advances | |||||||||||
| Average balance outstanding during the period | $4,227 | $879 | - | ||||||||
| Balance outstanding at end of period | $5,000 | $4,000 | - | ||||||||
| Maximum amount of borrowings outstanding at any month-end during the period | $5,000 | $4,000 | - | ||||||||
| Weighted average interest rate during the period | 0.00% | 0.00% | - | ||||||||
| Weighted average interest rate at end of period | 0.00% | 0.00% | - | ||||||||
Source: North Shore MHC, financial data.
II-7
Feldman Financial Advisors, Inc.
Exhibit II-8
Office Properties
North Shore MHC
As of June 30, 2021
(Dollars in Thousands)
| Leased | Date of | Net Book | |
| or | Lease | Value | |
| Location | Owned | Expiration | ($000s) |
| Main Office | |||
| 700 South Lewis Avenue | Owned | NA | $ 723 |
| Waukegan, Illinois 60085 | |||
| Branch Offices | |||
| 1233 North Green Bay Road | Owned | NA | 955 |
| Waukegan, Illinois 60085 | |||
| 3060 West Sand Lake Road | Owned | NA | 3,261 |
| Lindenhurst, Illinois 60046 | |||
| Loan Production Office | |||
| 2149 West Roscoe Street | Leased | 12/31/31 | NA |
| Chicago, Illinois 60046308 | |||
Source: North Shore MHC.
II-8
Feldman Financial Advisors, Inc.
Exhibit III
Financial and Market Data for All Public Thrifts
| Company | State | Ticker | Total Assets ($Mil.) | Total Equity/ Assets (%) | Tang. Equity/ Assets (%) | LTM ROA (%) | LTM ROE (%) | Closing Price 8/31/21 ($) | Total Market Value ($Mil.) | Price/ LTM EPS (x) | Price/ Core EPS (x) | Price/ Book Value (%) | Price/ Tang. Book (%) | Price/ Total Assets (%) | Div. Yield (%) | ||||||||||||||||||||||||||||
| All Public Thrifts (1) | |||||||||||||||||||||||||||||||||||||||||||
| 1895 Bancorp of Wisconsin, Inc. | WI | BCOW | 606 | 9.96 | 9.96 | 0.25 | 2.26 | 10.94 | 70.1 | 40.5 | NA | 88.3 | 88.3 | NA | 0.00 | ||||||||||||||||||||||||||||
| Affinity Bancshares, Inc. | GA | AFBI | 787 | 14.95 | 12.86 | 0.95 | 8.10 | 13.76 | 94.6 | 12.6 | 12.2 | 80.4 | 95.7 | 12.02 | 0.00 | ||||||||||||||||||||||||||||
| Axos Financial, Inc. | NV | AX | 14,266 | 9.82 | 9.08 | 1.52 | 16.52 | 48.48 | 2,877.5 | 13.6 | 12.7 | 205.3 | 223.8 | 20.16 | 0.00 | ||||||||||||||||||||||||||||
| Blue Foundry Bancorp | NJ | BLFY | 2,577 | 7.95 | 7.94 | NA | (2.52 | ) | 13.49 | 384.8 | NA | NA | NA | NA | 0.05 | 0.00 | |||||||||||||||||||||||||||
| Broadway Financial Corporation | CA | BYFC | 1,041 | 13.78 | 11.30 | (0.57 | ) | (4.94 | ) | 3.67 | 160.3 | NM | NM | 187.4 | 236.6 | 25.36 | 0.00 | ||||||||||||||||||||||||||
| Capitol Federal Financial, Inc. | KS | CFFN | 9,650 | 12.83 | 12.70 | 0.79 | 5.88 | 11.54 | 1,564.4 | 21.0 | 21.2 | 129.5 | 130.9 | 16.60 | 2.95 | ||||||||||||||||||||||||||||
| Carver Bancorp, Inc. | NY | CARV | 683 | 7.57 | 7.57 | (0.86 | ) | (11.89 | ) | 18.66 | 65.0 | NM | NM | 240.0 | 240.0 | 9.85 | 0.00 | ||||||||||||||||||||||||||
| CBM Bancorp, Inc. | MD | CBMB | 250 | 20.08 | 20.08 | 0.36 | 1.65 | 15.00 | 49.3 | NM | NM | 105.4 | 105.4 | 21.16 | 0.00 | ||||||||||||||||||||||||||||
| Cincinnati Bancorp, Inc. | OH | CNNB | 250 | 17.13 | 17.08 | 1.72 | 11.34 | 14.64 | 42.9 | 10.1 | 10.0 | 101.3 | 101.7 | 17.36 | 0.00 | ||||||||||||||||||||||||||||
| Elmira Savings Bank | NY | ESBK | 649 | 9.62 | 7.87 | 0.73 | 7.91 | 14.39 | 51.1 | 10.4 | 10.4 | 81.9 | 102.1 | 22.94 | 4.17 | ||||||||||||||||||||||||||||
| ESSA Bancorp, Inc. | PA | ESSA | 1,822 | 10.93 | 10.23 | 0.85 | 8.29 | 16.72 | 164.4 | 10.5 | 10.6 | 88.7 | 95.6 | 9.70 | 2.87 | ||||||||||||||||||||||||||||
| FFBW, Inc. | WI | FFBW | 353 | 27.44 | 27.37 | 0.66 | 2.21 | 11.50 | 73.8 | 37.1 | NA | 83.6 | 83.9 | 22.94 | 0.00 | ||||||||||||||||||||||||||||
| First Northwest Bancorp | WA | FNWB | 1,787 | 10.55 | 10.55 | 0.84 | 7.33 | 18.84 | 170.5 | 12.8 | 15.3 | 101.9 | 101.9 | 10.76 | 1.27 | ||||||||||||||||||||||||||||
| FS Bancorp, Inc. | WA | FSBW | 2,223 | 10.88 | 10.61 | 2.12 | 19.81 | 34.17 | 283.2 | 6.7 | 6.6 | 117.8 | 121.1 | 12.81 | 1.64 | ||||||||||||||||||||||||||||
| Generations Bancorp NY, Inc. | NY | GBNY | 380 | 11.19 | 10.82 | 0.48 | 5.39 | 10.82 | 26.6 | 14.8 | 28.4 | 62.5 | 65.0 | 7.00 | 0.00 | ||||||||||||||||||||||||||||
| HarborOne Bancorp, Inc. | MA | HONE | 4,616 | 15.28 | 13.91 | 1.42 | 9.07 | 14.13 | 730.0 | 11.9 | 11.8 | 111.6 | 124.6 | 17.06 | 1.42 | ||||||||||||||||||||||||||||
| Hingham Institution for Savings | MA | HIFS | 2,974 | 11.02 | 11.02 | 2.47 | 23.38 | 324.50 | 695.2 | 10.3 | 13.6 | 212.1 | 212.1 | 23.38 | 0.63 | ||||||||||||||||||||||||||||
| Home Federal Bancorp, Inc. | MN | HMNF | 981 | 11.00 | 10.93 | 1.53 | 13.83 | 23.32 | 104.0 | 7.6 | 7.6 | 100.3 | 101.1 | 11.04 | 0.00 | ||||||||||||||||||||||||||||
| Home Federal Bancorp, Inc. | LA | HFBL | 566 | 9.32 | 9.32 | 0.99 | 10.46 | 18.01 | 56.0 | 11.5 | 11.5 | 114.5 | 114.5 | 10.67 | 2.22 | ||||||||||||||||||||||||||||
| HV Bancorp, Inc. | PA | HVBC | 549 | 7.55 | 7.55 | 1.13 | 18.27 | 21.66 | 47.1 | 6.5 | 6.5 | 113.7 | 113.7 | 8.59 | 0.00 | ||||||||||||||||||||||||||||
| IF Bancorp, Inc. | IL | IROQ | 797 | 10.70 | 10.70 | 0.72 | 6.35 | 22.25 | 67.7 | 11.9 | 12.7 | 84.5 | 84.5 | 9.04 | 1.57 | ||||||||||||||||||||||||||||
| Kearny Financial Corp. | NJ | KRNY | 7,284 | 14.32 | 11.72 | 0.86 | 5.79 | 12.69 | 942.2 | 16.5 | 15.8 | 96.1 | 121.0 | 13.76 | 3.15 | ||||||||||||||||||||||||||||
| Magyar Bancorp, Inc. | NJ | MGYR | 842 | 7.27 | 7.27 | 0.70 | 8.52 | 10.56 | 75.0 | 14.0 | 15.8 | 122.3 | 122.3 | 8.90 | 0.00 | ||||||||||||||||||||||||||||
| Mid-Southern Bancorp, Inc. | IN | MSVB | 249 | 19.71 | 19.71 | 0.53 | 2.53 | 15.25 | 43.5 | 36.3 | 36.3 | 98.4 | 98.4 | 19.39 | 0.79 | ||||||||||||||||||||||||||||
| New York Community Bancorp, Inc. | NY | NYCB | 57,469 | 12.03 | 8.16 | 1.08 | 8.86 | 12.52 | 5,822.2 | 10.3 | 11.7 | 90.8 | 146.0 | 10.22 | 5.43 | ||||||||||||||||||||||||||||
| Northeast Community Bancorp, Inc. | NY | NECB | 1,077 | 14.94 | 14.89 | 1.40 | 8.79 | 10.62 | 173.9 | 12.7 | NA | 107.9 | 108.3 | 16.12 | 2.26 | ||||||||||||||||||||||||||||
| Northfield Bancorp, Inc. | NJ | NFBK | 5,427 | 13.88 | 13.21 | 1.09 | 7.98 | 16.90 | 858.6 | 14.0 | 13.0 | 114.1 | 120.7 | 15.83 | 3.08 | ||||||||||||||||||||||||||||
| PCSB Financial Corporation | NY | PCSB | 1,875 | 14.64 | 14.36 | 0.68 | 4.55 | 18.23 | 287.5 | 21.7 | 21.8 | 104.7 | 107.2 | 15.33 | 1.32 | ||||||||||||||||||||||||||||
| Provident Bancorp, Inc. | MA | PVBC | 1,585 | 14.61 | 14.61 | 1.00 | 6.26 | 16.23 | 226.1 | 19.3 | 17.7 | 127.9 | 127.9 | 18.68 | 0.99 | ||||||||||||||||||||||||||||
| Provident Financial Holdings, Inc. | CA | PROV | 1,184 | 10.75 | 10.75 | 0.64 | 6.05 | 17.40 | 130.8 | 17.4 | 23.4 | 103.1 | 103.1 | 11.09 | 3.22 | ||||||||||||||||||||||||||||
| Provident Financial Services, Inc. | NJ | PFS | 13,217 | 12.69 | 9.52 | 1.26 | 9.98 | 22.07 | 1,685.7 | 10.5 | 10.5 | 102.4 | 141.5 | 13.00 | 4.17 |
III-1
Feldman Financial Advisors, Inc.
Exhibit III (continued)
Financial and Market Data for All Public Thrifts
| Company | State | Ticker | Total Assets ($Mil.) | Total Equity/ Assets (%) | Tang. Equity/ Assets (%) | LTM ROA (%) | LTM ROE (%) | Closing Price 8/31/21 ($) | Total Market Value ($Mil.) | Price/ LTM EPS (x) | Price/ Core EPS | Price/ Book Value (%) | Price/ Tang. Book (%) | Price/ Total Assets (%) | Div. Yield (%) | ||||||||||||||||||||||||||||
| Prudential Bancorp, Inc. | PA | PBIP | 1,125 | 11.68 | 11.17 | 0.54 | 4.86 | 14.80 | 115.4 | 18.7 | 20.8 | 88.4 | 92.9 | 10.32 | 1.89 | ||||||||||||||||||||||||||||
| Randolph Bancorp, Inc. | MA | RNDB | 744 | 13.53 | 13.53 | 2.95 | 21.36 | 20.11 | 98.0 | 4.9 | 4.8 | 104.9 | 105.0 | 14.20 | 0.00 | ||||||||||||||||||||||||||||
| Riverview Bancorp, Inc. | WA | RVSB | 1,617 | 9.71 | 8.14 | 1.06 | 10.31 | 7.34 | 162.3 | 10.5 | 10.7 | 104.2 | 126.5 | 10.11 | 2.72 | ||||||||||||||||||||||||||||
| Spirit of Texas Bancshares, Inc. | TX | STXB | 3,085 | 12.25 | 9.71 | 1.38 | 11.56 | 23.65 | 406.1 | 9.8 | 9.3 | 107.5 | 139.4 | 13.16 | 2.03 | ||||||||||||||||||||||||||||
| Sterling Bancorp, Inc. | MI | SBT | 3,417 | 9.57 | 9.57 | (0.16 | ) | (1.82 | ) | 5.31 | 268.0 | NM | NM | 82.0 | 82.0 | 7.84 | 0.00 | ||||||||||||||||||||||||||
| Territorial Bancorp Inc. | HI | TBNK | 2,132 | 11.78 | 11.78 | 0.90 | 7.57 | 25.29 | 227.7 | 12.3 | 13.6 | 94.8 | 94.8 | 11.18 | 3.64 | ||||||||||||||||||||||||||||
| Timberland Bancorp, Inc. | WA | TSBK | 1,740 | 11.69 | 10.85 | 1.72 | 14.52 | 29.04 | 242.6 | 8.7 | 8.7 | 119.2 | 129.7 | 13.94 | 2.89 | ||||||||||||||||||||||||||||
| Triumph Bancorp, Inc. | TX | TBK | 6,016 | 13.17 | 8.83 | 2.00 | 15.90 | 82.22 | 2,035.0 | 18.1 | 18.9 | 276.2 | 448.0 | 34.58 | 0.00 | ||||||||||||||||||||||||||||
| TrustCo Bank Corp NY | NY | TRST | 6,123 | 9.45 | 9.44 | 0.96 | 9.95 | 32.09 | 618.2 | 11.0 | 11.0 | 106.8 | 106.9 | 10.10 | 4.25 | ||||||||||||||||||||||||||||
| Waterstone Financial, Inc. | WI | WSBF | 2,202 | 19.61 | 19.58 | 4.25 | 22.45 | 20.28 | 484.1 | 5.2 | 5.1 | 118.4 | 118.6 | 23.22 | 3.94 | ||||||||||||||||||||||||||||
| Western New England Bancorp, Inc. | MA | WNEB | 2,477 | 9.03 | 8.47 | 0.77 | 8.13 | 8.58 | 206.5 | 11.3 | 10.9 | 92.3 | 99.1 | 8.34 | 2.33 | ||||||||||||||||||||||||||||
| William Penn Bancorporation | PA | WMPN | 822 | 26.38 | 25.85 | 0.49 | 2.93 | 12.00 | 182.0 | 46.2 | 45.7 | 83.9 | 86.2 | 22.14 | 1.07 | ||||||||||||||||||||||||||||
| WSFS Financial Corporation | DE | WSFS | 15,149 | 12.42 | 9.13 | 1.92 | 15.01 | 45.41 | 2,158.6 | 8.1 | 7.9 | 114.6 | 161.7 | 14.25 | 1.15 | ||||||||||||||||||||||||||||
| WVS Financial Corp. | PA | WVFC | 346 | 11.09 | 11.09 | 0.39 | 3.40 | 15.80 | 27.5 | 21.4 | 20.6 | 77.6 | 77.6 | 8.60 | 2.53 | ||||||||||||||||||||||||||||
| Average | 4,111 | 12.80 | 12.02 | 1.06 | 8.31 | NA | 561.2 | 15.2 | 14.7 | 114.8 | 127.4 | 14.38 | 1.59 | ||||||||||||||||||||||||||||||
| Median | 1,617 | 11.69 | 10.82 | 0.92 | 8.10 | NA | 173.9 | 12.1 | 12.2 | 104.4 | 107.7 | 13.08 | 1.32 |
(1) Public thrifts traded on NYSE, NYSE American, and NASDAQ stock markets; excludes companies subject to pending acquisitions or mutual holding company ownership.
Source: S&P Global Market Intelligence.
III-2
Feldman Financial Advisors, Inc.
Exhibit IV-1
Pro Forma Assumptions for the Stock Offering
| 1. | The total amount of the net offering proceeds was fully invested at the beginning of the applicable period. |
| 2. | The net offering proceeds are invested to yield a return of 0.87%, which represented the yield on five-year U.S. Treasury securities at June 30, 2021. The effective income tax rate was assumed to be 21.0%, resulting in a net after-tax yield of 0.69%. |
| 3. | It is assumed that 8.0% of the total shares of common stock to be sold in the Stock Offering will be acquired by the Company’s employee stock ownership plan (“ESOP”). Pro forma adjustments have been made to earnings and equity to reflect the impact of the ESOP. The annual expense is estimated based on a 25-year loan to the ESOP from the Company. No re-investment is assumed on proceeds used to fund the ESOP. |
| 4. | It is assumed that that the Company’s restricted stock plan (“RSP”) will purchase in the open market a number of shares equal to 4.0% of the total shares sold in the Stock Offering. Also, it is assumed that these shares are acquired at the initial public offering price of $10.00 per share. Pro forma adjustments have been made to earnings and equity to reflect the impact of the RSP. The annual expense is estimated based on a five-year vesting period. No re-investment is assumed on proceeds used to fund the RSP. |
| 5. | It is assumed that an additional 10.0% of the total shares sold in the Stock Offering will be reserved for issuance by the Company’s stock option plan. The pro forma net income has been adjusted to reflect the expense associated with the granting of options at an assumed options value of $3.56 per option. It is further assumed that options for all shares reserved under the plan were granted to plan participants at the beginning of the period and 25.0% were non-qualified options for income tax purposes, the options would vest at a rate of 20.0% per year, and compensation expense will be recognized on a straight-line basis over the five-year vesting period |
| 6. | The fair value of stock options has been estimated at $3.56 per option using the Black-Scholes option pricing model with the following assumptions: a grant-date share price and option exercise price of $10.00; dividend yield of 0.00%; an expected option life of 10 years; a risk-free interest rate of 1.45%; and a volatility rate of 24.79% based on the NASDAQ Bank Index. |
| 7. | Fixed offering expenses are estimated at $1,400,000. As a variable component of offering expenses, sales commission expenses paid to the marketing agent equal 1.00% of the amount of stock sold in the Stock Offering. |
| 8. | No effect has been given to withdrawals from deposit accounts for the purpose of purchasing common stock in the Stock Offering. |
| 9. | No effect has been given in the pro forma equity calculation for the assumed earnings on the net proceeds. |
IV-1
Feldman Financial Advisors, Inc.
Exhibit IV-2
North Shore MHC
Pro Forma Conversion Valuation Range
Historical Financial Data as of June 30, 2021
(Dollars in Thousands, Except Per Share Data)
| MINIMUM | MIDPOINT | MAXIMUM | ADJ. MAX. | |||||||||
| Total shares outstanding | 3,469,388 | 4,081,633 | 4,693,878 | 5,397,959 | ||||||||
| Shares sold in the offering | 3,400,000 | 4,000,000 | 4,600,000 | 5,290,000 | ||||||||
| Shares issued to foundation | 69,388 | 81,633 | 93,878 | 107,959 | ||||||||
| Offering price | $10.00 | $10.00 | $10.00 | $10.00 | ||||||||
| Pro forma market value | $34,694 | $40,816 | $46,939 | $53,980 | ||||||||
| Gross offering proceeds | $34,000 | $40,000 | $46,000 | $52,900 | ||||||||
| Less: estimated offering expenses | (1,740 | ) | (1,800 | ) | (1,860 | ) | (1,929 | ) | ||||
| Net offering proceeds | 32,260 | 38,200 | 44,140 | 50,971 | ||||||||
| Less: cash contribution to foundation | (150 | ) | (150 | ) | (150 | ) | (150 | ) | ||||
| Less: ESOP purchase | (2,776 | ) | (3,265 | ) | (3,755 | ) | (4,318 | ) | ||||
| Less: RSP purchase | (1,388 | ) | (1,633 | ) | (1,878 | ) | (2,159 | ) | ||||
| Net investable proceeds | $27,946 | $33,152 | $38,357 | $44,344 | ||||||||
| Net income - LTM ended 6/30/21 | $98 | $98 | $98 | $98 | ||||||||
| Pro forma income on net proceeds | 192 | 228 | 264 | 305 | ||||||||
| Pro forma ESOP adjustment | (88 | ) | (103 | ) | (119 | ) | (136 | ) | ||||
| Pro forma RSP adjustment | (219 | ) | (258 | ) | (297 | ) | (341 | ) | ||||
| Pro forma option adjustment | (234 | ) | (275 | ) | (317 | ) | (364 | ) | ||||
| Pro forma net income | ($251 | ) | ($310 | ) | ($371 | ) | ($438 | ) | ||||
| Pro forma earnings per share | ($0.08 | ) | ($0.08 | ) | ($0.09 | ) | ($0.09 | ) | ||||
| Core earnings - LTM ended 6/30/21 | $115 | $115 | $115 | $115 | ||||||||
| Pro forma income on net proceeds | 192 | 228 | 264 | 305 | ||||||||
| Pro forma ESOP adjustment | (88 | ) | (103 | ) | (119 | ) | (136 | ) | ||||
| Pro forma RSP adjustment | (219 | ) | (258 | ) | (297 | ) | (341 | ) | ||||
| Pro forma option adjustment | (234 | ) | (275 | ) | (317 | ) | (364 | ) | ||||
| Pro forma core earnings | ($234 | ) | ($293 | ) | ($354 | ) | ($421 | ) | ||||
| Pro forma core earnings per share | ($0.07 | ) | ($0.08 | ) | ($0.08 | ) | ($0.08 | ) | ||||
| Total equity - 6/30/21 | $45,875 | $45,875 | $45,875 | $45,875 | ||||||||
| Net offering proceeds | 32,260 | 38,200 | 44,140 | 50,971 | ||||||||
| Plus: common stock issued to foundation | 694 | 816 | 939 | 1,080 | ||||||||
| Less: charitable contribution expense | (667 | ) | (763 | ) | (860 | ) | (971 | ) | ||||
| Less: ESOP purchase | (2,776 | ) | (3,265 | ) | (3,755 | ) | (4,318 | ) | ||||
| Less: RSP purchase | (1,388 | ) | (1,633 | ) | (1,878 | ) | (2,159 | ) | ||||
| Pro forma total equity | $73,998 | $79,230 | $84,461 | $90,478 | ||||||||
| Pro forma book value | $21.33 | $19.41 | $17.99 | $16.76 | ||||||||
| Tangible equity - 6/30/21 | $45,875 | $45,875 | $45,875 | $45,875 | ||||||||
| Net offering proceeds | 32,260 | 38,200 | 44,140 | 50,971 | ||||||||
| Plus: common stock issued to foundation | 694 | 816 | 939 | 1,080 | ||||||||
| Less: charitable contribution expense | (667 | ) | (763 | ) | (860 | ) | (971 | ) | ||||
| Less: ESOP purchase | (2,776 | ) | (3,265 | ) | (3,755 | ) | (4,318 | ) | ||||
| Less: RSP purchase | (1,388 | ) | (1,633 | ) | (1,878 | ) | (2,159 | ) | ||||
| Pro forma tangible equity | $73,998 | $79,230 | $84,461 | $90,478 | ||||||||
| Pro forma tangible book value | $21.33 | $19.41 | $17.99 | $16.76 | ||||||||
| Total assets - 6/30/21 | $239,858 | $239,858 | $239,858 | $239,858 | ||||||||
| Net offering proceeds | 32,260 | 38,200 | 44,140 | 50,971 | ||||||||
| Plus: common stock issued to foundation | 694 | 816 | 939 | 1,080 | ||||||||
| Less: charitable contribution expense, net | (667 | ) | (763 | ) | (860 | ) | (971 | ) | ||||
| Less: ESOP purchase | (2,776 | ) | (3,265 | ) | (3,755 | ) | (4,318 | ) | ||||
| Less: RSP purchase | (1,388 | ) | (1,633 | ) | (1,878 | ) | (2,159 | ) | ||||
| Pro forma total assets | $267,981 | $273,213 | $278,444 | $284,461 | ||||||||
| Pro Forma Ratios: | ||||||||||||
| Price / LTM EPS | NM | NM | NM | NM | ||||||||
| Price / Core EPS | NM | NM | NM | NM | ||||||||
| Price / Book Value | 46.88% | 51.52% | 55.59% | 59.67% | ||||||||
| Price / Tangible Book Value | 46.88% | 51.52% | 55.59% | 59.67% | ||||||||
| Price / Total Assets | 12.95% | 14.94% | 16.86% | 18.98% | ||||||||
| Total Equity / Assets | 27.61% | 29.00% | 30.33% | 31.81% | ||||||||
| Tangible Equity / Assets | 27.61% | 29.00% | 30.33% | 31.81% |
IV-2
Feldman Financial Advisors, Inc.
Exhibit IV-3
Pro Forma Conversion Analysis at the Midpoint Value
North Shore MHC
Historical Financial Data as of June 30, 2021
| Valuation Parameters | Symbol | Data | |||||
| Net income -- LTM | Y | $ | 98,000 | ||||
| Core earnings -- LTM | Y | 115,000 | |||||
| Net worth | B | 45,875,000 | |||||
| Tangible net worth | B | 45,875,000 | |||||
| Total assets | A | 239,858,000 | |||||
| Expenses in conversion | X | 1,800,000 | |||||
| Other proceeds not reinvested | O | 4,898,000 | |||||
| ESOP purchase | E | 3,265,000 | |||||
| ESOP expense (pre-tax) | F | 130,380 | |||||
| RSP purchase | M | 1,633,000 | |||||
| RSP expense (pre-tax) | N | 326,582 | |||||
| Stock option expense (pre-tax) | Q | 290,612 | |||||
| Cash contribution to foundation | C | 150,000 | |||||
| Stock contribution to foundation | K | 816,330 | |||||
| Option expense tax-deductible | D | 25.00% | |||||
| Re-investment rate (after-tax) | R | 0.69% | |||||
| Tax rate | T | 21.00% | |||||
| Shares for EPS | S | 92.32% | |||||
| Pro Forma Valuation Ratios at Midpoint Value | |||||||
| Price / LTM EPS | P/E | NM | |||||
| Price / Core EPS | P/E | NM | |||||
| Price / Book Value | P/B | 51.52% | |||||
| Price / Tangible Book | P/TB | 51.52% | |||||
| Price / Assets | P/A | 14.94% | |||||
| Pro Forma Calculation at Midpoint Value | Based on | |||||
| V | = | (P/E / S)*((Y-R*(O+X)-(F+N)*(1-T)-(Q-Q*D*T))) | = | $40,816,330 | [LTM earnings] | |
| 1 - (P/E / S) * R | ||||||
| V | = | (P/E / S)*((Y-R*(O+X)-(F+N)*(1-T)-(Q-Q*D*T)) | = | $40,816,330 | [Core earnings] | |
| 1 - (P/E / S) * R | ||||||
| V | = | P/B * (B + K - X - E - M - (C+K)*(1-T))) | = | $40,816,330 | [Book value] | |
| 1 - P/B | ||||||
| V | = | P/TB * (B + K - X - E - M - (C+K)*(1-T))) | = | $40,816,330 | [Tangible book] | |
| 1 - P/TB | ||||||
| V | = | P/A * (A + K - X - E - M - (C+K)*(1-T)) | = | $40,816,330 | [Total assets] | |
| 1 - P/A | ||||||
| Pro Forma | Valuation | Offering | Foundation | |||||||||||||
| Valuation Range | Range | Range | Shares | |||||||||||||
| Minimum | = | $40,816,330 | x | 0.85 | = | $34,693,880 | $34,000,000 | $693,880 | ||||||||
| Midpoint | = | $40,816,330 | x | 1.00 | = | $40,816,330 | $40,000,000 | $816,330 | ||||||||
| Maximum | = | $40,816,330 | x | 1.15 | = | $46,938,780 | $46,000,000 | $938,780 | ||||||||
| Adj. Max. | = | $46,938,780 | x | 1.15 | = | $53,979,590 | $52,900,000 | $1,079,590 | ||||||||
IV-3
Feldman Financial Advisors, Inc.
Exhibit IV-4
Comparative Valuation Ratio Analysis
Pro Forma Conversion Valuation
Computed from Market Price Data as of August 31, 2021
| North | Comparative | All Public | |||||||||||
| Valuation | Symbol | Shore | Group | Thrifts (1) | |||||||||
| Ratio | MHC | Average | Median | Average | Median | ||||||||
| Price / LTM EPS | P/E | ||||||||||||
| 17.0 | 11.5 | 15.2 | 12.1 | ||||||||||
| Minimum | (x) | NM | NA | NA | NA | NA | |||||||
| Midpoint | NM | NA | NA | NA | NA | ||||||||
| Maximum | NM | NA | NA | NA | NA | ||||||||
| Adjusted Maximum | NM | NA | NA | NA | NA | ||||||||
| Price / Core EPS | P/E | ||||||||||||
| 16.7 | 11.5 | 14.7 | 12.2 | ||||||||||
| Minimum | (x) | NM | NA | NA | NA | NA | |||||||
| Midpoint | NM | NA | NA | NA | NA | ||||||||
| Maximum | NM | NA | NA | NA | NA | ||||||||
| Adjusted Maximum | NM | NA | NA | NA | NA | ||||||||
| Price / Book Value | P/B | ||||||||||||
| 96.3 | 99.3 | 114.8 | 104.4 | ||||||||||
| Minimum | (%) | 46.9 | -51.3% | -52.8% | -59.1% | -55.1% | |||||||
| Midpoint | 51.5 | -46.5% | -48.1% | -55.1% | -50.7% | ||||||||
| Maximum | 55.6 | -42.3% | -44.0% | -51.6% | -46.8% | ||||||||
| Adjusted Maximum | 59.7 | -38.0% | -39.9% | -48.0% | -42.9% | ||||||||
| Price / Tangible Book | P/TB | ||||||||||||
| 98.5 | 101.4 | 127.4 | 107.7 | ||||||||||
| Minimum | (%) | 46.9 | -52.4% | -53.8% | -63.2% | -56.5% | |||||||
| Midpoint | 51.5 | -47.7% | -49.2% | -59.6% | -52.2% | ||||||||
| Maximum | 55.6 | -43.6% | -45.2% | -56.4% | -48.4% | ||||||||
| Adjusted Maximum | 59.7 | -39.4% | -41.2% | -53.2% | -44.6% | ||||||||
| Price / Total Assets | P/A | ||||||||||||
| 13.73 | 10.85 | 14.38 | 13.08 | ||||||||||
| Minimum | (%) | 12.95 | -5.7% | 19.3% | -10.0% | -1.0% | |||||||
| Midpoint | 14.94 | 8.8% | 37.6% | 3.9% | 14.2% | ||||||||
| Maximum | 16.86 | 22.8% | 55.3% | 17.2% | 28.9% | ||||||||
| Adjusted Maximum | 18.98 | 38.2% | 74.8% | 32.0% | 45.1% | ||||||||
(1) Excludes companies subject to mutual holding company ownership or pending acquisition.
IV-4