Attached files
| file | filename |
|---|---|
| EX-99.1 - EX-99.1 - MIMEDX GROUP, INC. | a20210913reclinicaltrialre.htm |
| 8-K - 8-K - MIMEDX GROUP, INC. | mdxg-20210913.htm |

1 ADVANCING REGENERATIVE MEDICINE TREATMENT THROUGH PLACENTAL SCIENCE Investor Presentation September 2021
2 DISCLAIMER & CAUTIONARY STATEMENTS This presentation includes forward-looking statements. Forward-looking statements are subject to risks and uncertainties, and the Company cautions investors against placing undue reliance on such statements. Actual results may differ materially from those set forth in the forward-looking statements. Such forward-looking statements include statements regarding: • future sales or sales growth; • the Company’s plans to review and conduct additional analyses of the clinical trial data from its plantar fasciitis, Achilles tendonitis, and knee osteoarthritis clinical trials and expectations regarding the results of such analyses, including expectations regarding safety and efficacy, and the value of safety data from the trials and these analyses; the Company’s expectations regarding its mdHACM product’s potential use as a safe and effective treatment option, and that it may be an effective treatment for persons battling inflammatory conditions; the Company’s plans for completing 12-month safety visit follow-up and its timing; plans for meetings with the FDA, and planned biologics license application (BLA) submissions to the FDA, and their timing; plans for future clinical trials, including the Company’s decision to pursue or not pursue, and their timing; • estimates of potential market size for the Company’s future products; • plans for expansion outside of the U.S., or the potential to expand the Company’s portfolio of products through licensing transactions or additional clinical research; the effectiveness of amniotic tissue as a therapy for any particular indication or condition; • expected spending on research and development in 2021; • the Company’s long-term strategy for value creation, the status of its pipeline products, expectations for future products, and expectations for future growth;

3 DISCLAIMER & CAUTIONARY STATEMENTS Additional forward-looking statements may be identified by words such as "believe," "expect," "may," "plan," "potential," "will," "preliminary," and similar expressions, and are based on management's current beliefs and expectations. Forward-looking statements are subject to risks and uncertainties, and the Company cautions investors against placing undue reliance on such statements. Actual results may differ materially from those set forth in the forward-looking statements. Factors that could cause actual results to differ from expectations include: • future sales are uncertain and are affected by competition, access to customers, patient access to healthcare providers, and many other factors; • the results of a clinical trial or trials may not demonstrate that the product is safe or effective, or may have little or no statistical value; the Company may change its plans due to unforeseen circumstances, and delay or alter the timeline for future trials, analyses, or public announcements; the timing of any meeting with the FDA depends on many factors and is outside of the Company’s control, and the results from any meeting are uncertain; a BLA submission requires a number of prerequisites, including favorable study results and statistical support, and completion of a satisfactory FDA inspection of the Company’s manufacturing facility or facilities; plans for future clinical trials depend on the results of pending clinical trials, discussion with the FDA, and other factors; and conducting clinical trials is a time-consuming, expensive, and uncertain process; • the future market for the Company’s products can depend on regulatory approval of such products, which might not occur at all or when expected, and is based in part on assumptions regarding the number of patients who elect less acute and more acute treatment than the Company’s products, market acceptance of the Company’s products, and adequate reimbursement for such therapies; • the process of obtaining regulatory clearances or approvals to market a biological product or medical device from the FDA or similar regulatory authorities outside of the U.S. is costly and time consuming, and such clearances or approvals may not be granted on a timely basis, or at all, and the ability to obtain the rights to market additional, suitable products depends on negotiations with third parties which may not be forthcoming; • the results of a clinical trial or trials may have little or no statistical value, or may fail to demonstrate that the product is safe or effective; and • expected spending can depend in part on the results of pending clinical trials; The Company describes additional risks and uncertainties in the Risk Factors section of its most recent annual report and quarterly reports filed with the Securities and Exchange Commission. Any forward-looking statements speak only as of the date of this press release and the Company assumes no obligation to update any forward-looking statement.
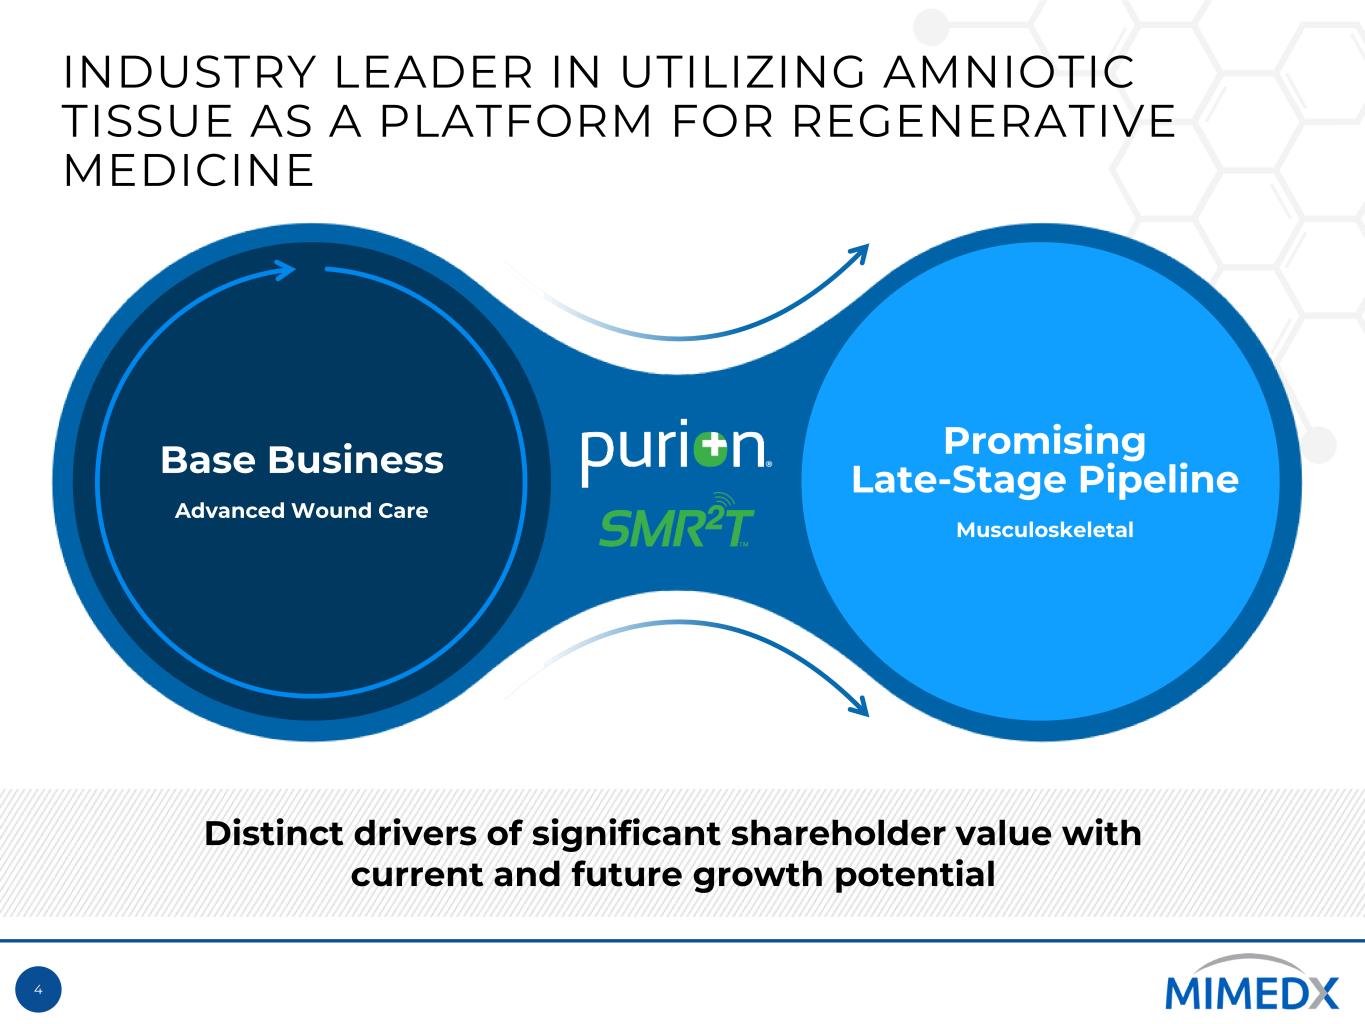
4 Base Business Advanced Wound Care Promising Late-Stage Pipeline Musculoskeletal INDUSTRY LEADER IN UTILIZING AMNIOTIC TISSUE AS A PLATFORM FOR REGENERATIVE MEDICINE Distinct drivers of significant shareholder value with current and future growth potential

5 PLAN TO PROGRESS KOA PROGRAM TO PHASE 3 CONFIRMATORY EFFICACY STUDIES STATISTICAL DIFFERENCES BETWEEN PATIENTS TREATED WITH mdHACM AND WITH PLACEBO Assessment TOTAL TRIAL (446 PATIENTS) Pre-Interim Analysis (190 patients) Post-Interim Analysis (256 patients) VAS Not significant Not significant Not significant WOMAC – Total Not significant Significant Not significant WOMAC – Pain Not significant Significant Not significant WOMAC – Function Not significant Significant Not significant • Phase 2B Knee Osteoarthritis (KOA) study top-line interim results demonstrate varied efficacy signals between patient cohorts • Top-line results from an interim analysis of six-month efficacy data did not meet primary endpoints • Pre-Interim Analysis Cohort treatment group demonstrated a greater improvement in WOMAC-Total, WOMAC-Pain and WOMAC-Function scores, with statistically significant separation between treatment and placebo-treated patients at both the three-month and six-month endpoints • VAS and WOMAC scores improved for both groups • Product was found safe and well-tolerated mdHACM = micronized dehydrated Human Amnion Chorion Membrane; VAS = Visual Analog Scale ; WOMAC = Western Ontario and McMaster Universities Osteoarthritis Index; Table summarizes elements of the Phase 2B KOA clinical trial results, highlighting a statistically significant difference between patients in the product treatment group and the placebo group, and where there was no such statistically significant difference. It should be noted that overall, VAS and WOMAC scores improved for both groups in this clinical trial. The top line results between pre- and post-interim analysis require further examination of potential factors that may have contributed to the observed differences.

6 Current IND Studies Do Not Plan to Proceed with BLA PLAN TO PROGRESS KOA PROGRAM TO PHASE 3 CONFIRMATORY EFFICACY STUDIES Knee Osteoarthritis: • Anticipate two Phase 3 KOA studies will be required to file a BLA • 6-month open-label extension and safety readout anticipated in October 2021 • Plan to provide update for BLA timing following FDA review and discussion • Continued R&D investment focused on: - Underlying disease process - Potential benefit to cartilaginous tissues - Advancing understanding of mdHACM mechanism of action Plantar Fasciitis: • Study did not meet its primary endpoints • Do not plan to pursue a BLA filing for PF at this time Future Longer- Term IND Studies Planned Near- Term IND Studies mdHACM treatment found safe and well-tolerated throughout both studies There can be no assurance that clinical trials are conducted or completed on schedule, that trial results are favorable, or that we obtain regulatory approval for our products and indications.
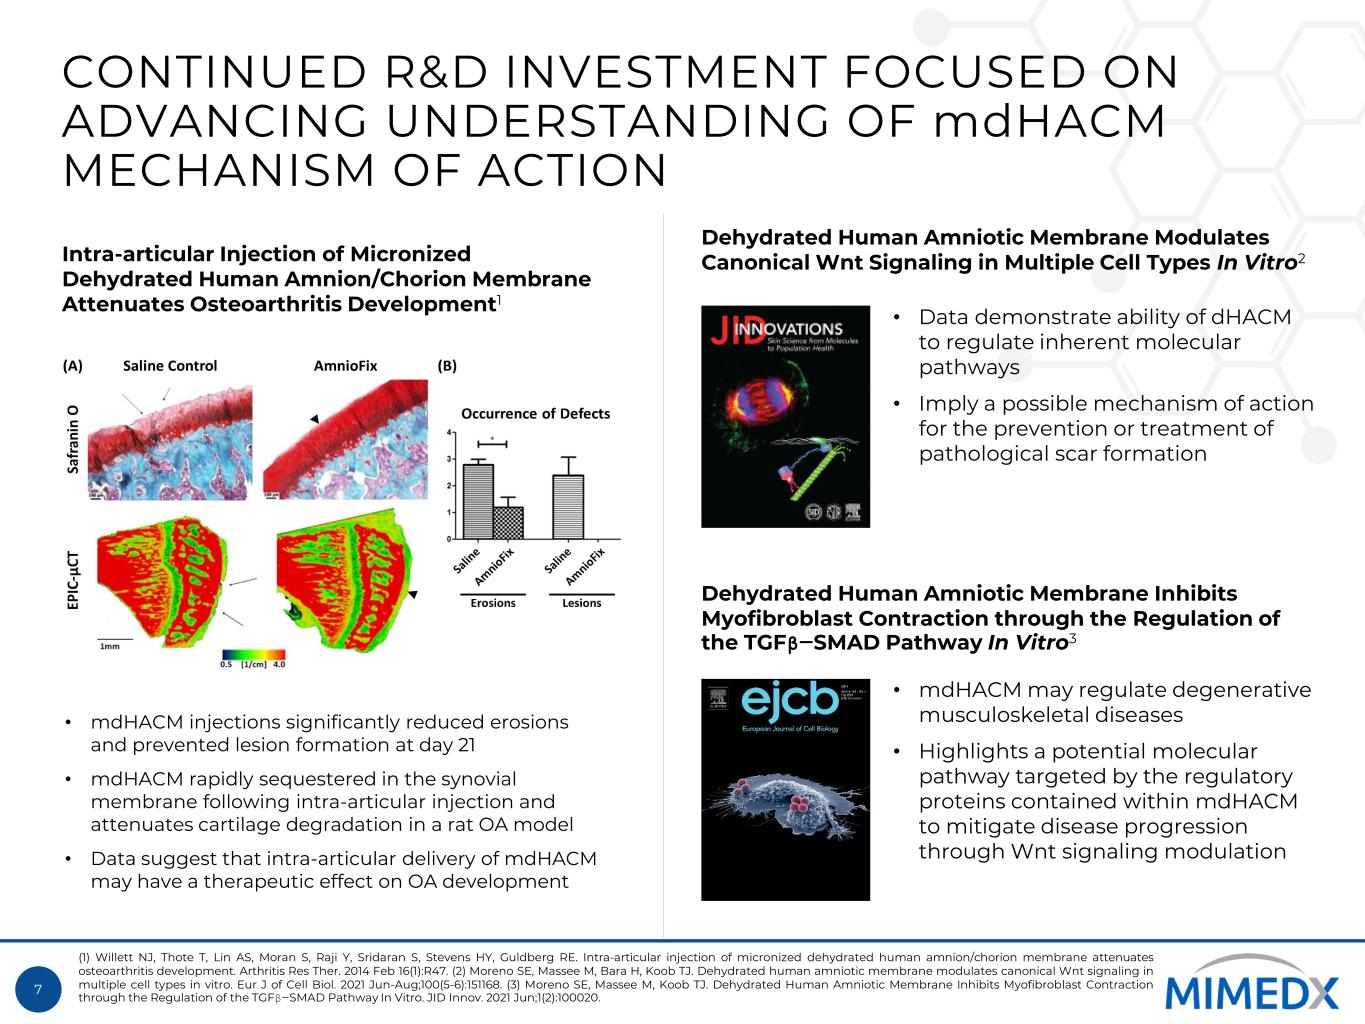
7 CONTINUED R&D INVESTMENT FOCUSED ON ADVANCING UNDERSTANDING OF mdHACM MECHANISM OF ACTION • mdHACM injections significantly reduced erosions and prevented lesion formation at day 21 • mdHACM rapidly sequestered in the synovial membrane following intra-articular injection and attenuates cartilage degradation in a rat OA model • Data suggest that intra-articular delivery of mdHACM may have a therapeutic effect on OA development Intra-articular Injection of Micronized Dehydrated Human Amnion/Chorion Membrane Attenuates Osteoarthritis Development1 (1) Willett NJ, Thote T, Lin AS, Moran S, Raji Y, Sridaran S, Stevens HY, Guldberg RE. Intra-articular injection of micronized dehydrated human amnion/chorion membrane attenuates osteoarthritis development. Arthritis Res Ther. 2014 Feb 16(1):R47. (2) Moreno SE, Massee M, Bara H, Koob TJ. Dehydrated human amniotic membrane modulates canonical Wnt signaling in multiple cell types in vitro. Eur J of Cell Biol. 2021 Jun-Aug;100(5-6):151168. (3) Moreno SE, Massee M, Koob TJ. Dehydrated Human Amniotic Membrane Inhibits Myofibroblast Contraction through the Regulation of the TGFβ‒SMAD Pathway In Vitro. JID Innov. 2021 Jun;1(2):100020. • Data demonstrate ability of dHACM to regulate inherent molecular pathways • Imply a possible mechanism of action for the prevention or treatment of pathological scar formation • mdHACM may regulate degenerative musculoskeletal diseases • Highlights a potential molecular pathway targeted by the regulatory proteins contained within mdHACM to mitigate disease progression through Wnt signaling modulation Dehydrated Human Amniotic Membrane Modulates Canonical Wnt Signaling in Multiple Cell Types In Vitro2 Dehydrated Human Amniotic Membrane Inhibits Myofibroblast Contraction through the Regulation of the TGFβ‒SMAD Pathway In Vitro3

8 Initial IND Submissions End of Phase 2 Meeting Pre-BLA or NDA Meeting Market Application Submissions Basic Research Prototype Design or Discovery Preclinical Development Clinical Development FDA Filing / Approval & Launch PreparationPhase 1 Phase 3Phase 2 IND Review Phase and Ongoing Submissions Application Review Phase D im en si on s Safety Medical Utility Industrial- ization Material Selection Structure Activity Relationship In Vitro and Animal Testing Human and Animal Testing Safety Follow Up In Vitro and Computer Model Evaluation In Vitro and Animal Models Human Efficacy Evaluation Physical Design Characterization Small-Scale Production Manufacturing Scale-up Refined Specifications Mass Production In d u st ry – FD A In te ra ct io n s D u ri n g D ev el op m en t THE BLA PROCESS IS LENGTHY AND REQUIRES CAREFUL PLANNING AND COORDINATION WITH THE FDA MIMEDX has assembled the right Board and Management Team with the relevant clinical, scientific and regulatory expertise required to navigate the BLA pathway Pre-IND Meeting 120 Day Safety Update Industry – FDA Interactions During Development The process of obtaining an approved BLA, including clinical trial development and execution as well as manufacturing processes, requires the expenditure of substantial time, effort and financial resources and may take years to complete. Clinical trials may not be successful or may return results that do not support approval. The FDA may not grant approval of our BLA on a timely basis, or at all, or we may decide not to pursue a BLA for certain products or indications, or may need to conduct additional trials for a given indication.

9 Existing Base Business Drive disease state awareness across care continuum Publish additional data Expand into additional wound applications FOUR KEY DRIVERS TO ACHIEVE GROWTH IN BASE BUSINESS Portfolio Expansion Advance market assessments and analytics Leverage clinical and regulatory expertise Invest in prioritized new markets Maximize base business Enhance sales force productivity and commercial analytics Highlight clinical and economic value Continue product innovation Explore additional priority markets Identify wound care adjacencies PURSUE INTERNATIONAL EXPANSION ENHANCE PORTFOLIO VALUE TARGET NEW BUSINESS EXPAND THE MARKET

10 TARGETED INVESTMENT FOR GEOGRAPHIC EXPANSION Current primary market 1-2 year expansion 2-3 year expansion * Establishment of reimbursement pricing may take until mid-2022 to finalize, based on the JMHLW approval calendar. Source: Global Data Tissue Engineered-Skin Sub Data Model Wound Management Japan, Germany and UK Year 2020 – retrieved Sept 2020; Management estimates; MIMEDX Addressable Market represents assumed, eventual 15% penetration of the addressable market. Reaching this level is subject to numerous risks and uncertainties, including regulatory and market acceptance, and appropriate reimbursement. Investors are cautioned that actual results may differ materially. Received Regulatory Approval by the Japanese Ministry of Health, Labour and Welfare (JMHLW) to market EPIFIX in Japan, with Launch targeted for 1H22 JAPAN UK GERMANY Total Wound Care Market ~$430M ~$380M ~$740M DFU + VLU (patients) 650K 225K 500K MIMEDX Addressable Market (patients) 100K 35K 80K Approval Status Approved Approved Approved Reimbursement Status 3-6 months post-approval* In process In process

11 FINANCIAL STRENGTH FORTIFIES SUSTAINABLE AND PROFITABLE GROWTH Adj. Free Cash Flow3 $19M (1) Trailing twelve months period ended June 30, 2021. Adjusted Net Sales and Adjusted Gross Margin are non-GAAP measurements and exclude impact of Revenue Transition amounts; Refer to slide 14 for the respective GAAP amount and to slide 20 for more information. (2) Calculated on a trailing twelve-month basis for each period. Adjusted Net Sales and Adjusted EBITDA are non-GAAP measurements. Refer to slides 20 and 21 for more information and reconciliation to the nearest GAAP figure. (3) Adjusted Free Cash Flow is calculated as Adjusted EBITDA less capital expenditures and patent application costs; Refer to slide 21 for more information. 14.3% 14.3% 12.7% 13.3% 9.6% 2Q 2020 3Q 2020 4Q 2020 1Q 2021 2Q 2021 Adjusted EBITDA as % of Adjusted Net Sales2 Adjusted Net Sales1 $259M Adjusted Gross Margin1 83.3% Net Cash at 6/30/2021 $85M Net Loss1 $46M Includes: • $1.9M benefit from Revenue Transition • $8.2M loss on extinguishment of debt • $37.6M charge for Investigation, Restatement and Related Expenses Advanced Wound Care (Section 361) $225M Section 351 $34M Estimated 2021 Adjusted Gross Margins Estimated 2021 Adjusted Net Sales $245M-$255M Estimated 2021 R&D Expense $17M-$22M 83-85% (consistent with 2020)

12 2021 OBJECTIVES SUPPORT CURRENT AND FUTURE GROWTH POTENTIAL Commercial Top-line growth >10% (excludes impact of enforcement discretion) Sales force growth >10% Japan approval Pursue organic and inorganic growth opportunities Operations CGMP compliance R&D Interim data readouts (PF/KOA/AT) Peer-reviewed clinical, scientific and economic publications Accelerate late-stage pipeline File additional INDs
13 APPENDIX

14 INDUSTRY LEADER IN UTILIZING AMNIOTIC TISSUE AS A PLATFORM FOR REGENERATIVE MEDICINE 2,000,000+ Allografts Distributed4 83.3% Gross Margin2 $261.0M TTM 6/30/21 Net Sales1 $2.1B Market Cap3 1,000+ patients studied under IND clinical programs11 (1) Net sales for the TTM ended June 30, 2021, as reported in applicable SEC filing; (2) Represents GAAP gross margin for the TTM period ended June 30, 2021 (3) Based on closing stock price on September 10, 2021 and ~137 million fully diluted shares; (4) As of July 31, 2021; (5) Sen CK. Human Wounds and Its Burden: An Updated Compendium of Estimates. Adv Wound Care (New Rochelle). 2019;8(2):39-48. doi:10.1089/wound.2019.0946; (6) BioMed GPS SmartTrak; (7) Nussbaum SR, Carter MJ, Fife CE, DaVanzo J, Haught R, Nusgart M, et al. An economic evaluation of the impact, cost, and Medicare policy implications of chronic nonhealing wounds. Value Health. 2018;21(1):27–32; (8) D. G. Armstrong, M. A. Swerdlow, A. A. Armstrong, M. S. Conte, W. V. Padula, and S. A. Bus, “Five year mortality and direct costs of care for people with diabetic foot complications are comparable to cancer,” Journal of Foot and Ankle Research, vol. 13, no. 1. BioMed Central Ltd., Mar. 24, 2020, doi: 10.1186/s13047-020-00383-2. (9) Global Data Knee Reconstruction Data Model United States 2020 (10) Tong KB, Furia J. Economic burden of plantar fasciitis treatment in the United States. Am J Orthop (Belle Mead NJ). 2010;39(5):227-231; (11) MIMEDX IND Clinical Trial Programs; Plantar Fasciitis Phase 2B: 147; Plantar Fasciitis Phase 3: 276; Knee Osteoarthritis Phase 2B: 430+; Achilles Tendonitis Phase 3: 158. 30M (U.S.) with diabetes5 2.9M chronic wounds6 Reimbursement coverage, U.S.: 300M+ lives 10,000+ ft2 of ISO Class 7 clean room space 17.5M+ U.S. KOA patients9 2M+ U.S. patients treated for PF annually10 ~800 Employees4 289 Field Sales Personnel4 $6.2-$18.7B Medicare cost of DFU/yr7 $60K/yr Cost of amputation care8 Pioneer with leading brands and a late-stage pipeline

15 BASE BUSINESS HAS STABILIZED AND IS NOW POSITIONED FOR GROWTH Adjusted Net Sales1 ($M) Net Sales ($M) (1) Adjusted net sales excludes impact of Revenue Transition amounts. Adjusted net sales is a non-GAAP measurement. Refer to slides 20 and 21 for more information and reconciliation to the nearest GAAP measure; (2) Section 361 includes Tissue + Cord sales. Section 351 includes Micronized + Particulate sales. (3) Non-GAAP. Please refer to slide 20 for a reconciliation to GAAP. $62 $54 $64 $69 $60 $68 1Q20 2Q20 3Q20 4Q20 1Q21 2Q21 $57 $52 $63 $68 $60 $68 1Q20 2Q20 3Q20 4Q20 1Q21 2Q21 $49 $46 $55 $59 $52 $59 1Q20 2Q20 3Q20 4Q20 1Q21 2Q21 Section 361 vs. Section 351 Sales Breakdown2,3 2020 1H21 1H 2021 TTM Sales by Care Setting 30% 29% 30% 11% Private Office Out-patient In-patient Other 87% 13% 87% 13% Advanced Wound Care/Section 361 Net Sales3 +27.1% +30.6% +29.5% Section 361 Section 351 Section 361 Section 351

16 SUMMARY BALANCE SHEETS ($ millions) 4Q19 1Q20 2Q20 3Q20 4Q20 1Q21 2Q21 Assets Cash and Cash Equivalents 69.1 53.5 48.2 109.6 95.8 84.7 85.0 Accounts Receivable, net 32.3 31.9 30.1 33.0 35.4 35.4 37.2 Inventory, net 9.1 9.2 10.6 11.0 10.4 11.6 10.1 Other Current Assets 12.7 21.2 18.7 17.9 19.0 18.3 15.4 Total Current Assets 123.2 115.9 107.6 171.5 160.6 150.0 147.7 Property and Equipment 12.3 11.8 10.8 10.3 11.4 11.0 10.3 Other Assets 31.6 31.2 32.5 31.5 30.0 29.8 29.1 Total Assets 167.2 158.9 150.9 213.3 202.0 190.8 187.1 Liabilities and Stockholders’ Equity (Deficit) Current Liabilities 67.3 63.7 63.7 57.3 59.2 55.4 50.6 Long Term Debt, net 61.9 61.6 61.5 47.6 47.7 47.8 47.9 Other Liabilities 3.5 3.2 2.9 4.4 3.7 3.6 3.3 Total Liabilities 132.8 128.6 128.1 109.3 110.6 106.8 101.8 Convertible Preferred Stock 0.0 0.0 0.0 91.1 91.6 92.0 92.5 Stockholders’ Equity (Deficit) 34.4 30.3 22.9 12.9 (0.2) (8.0) (7.2) Total Liabilities and Stockholders’ Equity (Deficit) 167.2 158.9 150.9 213.3 202.0 190.8 187.1
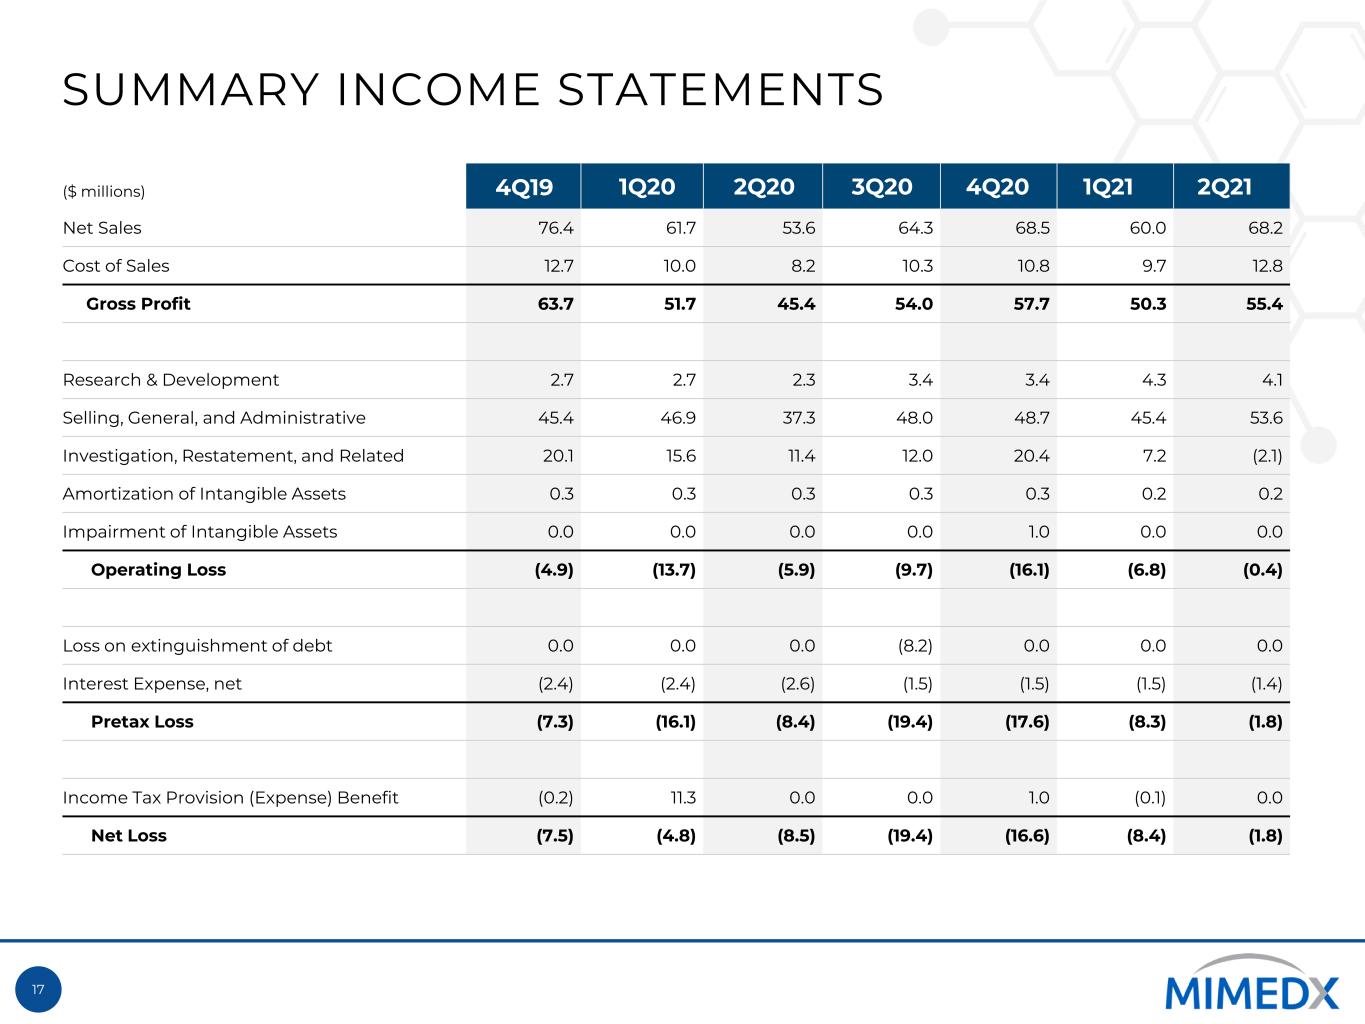
17 SUMMARY INCOME STATEMENTS ($ millions) 4Q19 1Q20 2Q20 3Q20 4Q20 1Q21 2Q21 Net Sales 76.4 61.7 53.6 64.3 68.5 60.0 68.2 Cost of Sales 12.7 10.0 8.2 10.3 10.8 9.7 12.8 Gross Profit 63.7 51.7 45.4 54.0 57.7 50.3 55.4 Research & Development 2.7 2.7 2.3 3.4 3.4 4.3 4.1 Selling, General, and Administrative 45.4 46.9 37.3 48.0 48.7 45.4 53.6 Investigation, Restatement, and Related 20.1 15.6 11.4 12.0 20.4 7.2 (2.1) Amortization of Intangible Assets 0.3 0.3 0.3 0.3 0.3 0.2 0.2 Impairment of Intangible Assets 0.0 0.0 0.0 0.0 1.0 0.0 0.0 Operating Loss (4.9) (13.7) (5.9) (9.7) (16.1) (6.8) (0.4) Loss on extinguishment of debt 0.0 0.0 0.0 (8.2) 0.0 0.0 0.0 Interest Expense, net (2.4) (2.4) (2.6) (1.5) (1.5) (1.5) (1.4) Pretax Loss (7.3) (16.1) (8.4) (19.4) (17.6) (8.3) (1.8) Income Tax Provision (Expense) Benefit (0.2) 11.3 0.0 0.0 1.0 (0.1) 0.0 Net Loss (7.5) (4.8) (8.5) (19.4) (16.6) (8.4) (1.8)

18 SUMMARY CASH FLOW STATEMENTS ($ millions) 4Q19 1Q20 2Q20 3Q20 4Q20 1Q21 2Q21 Net Loss (7.5) (4.8) (8.5) (19.4) (16.6) (8.4) (1.8) Share-Based Compensation 2.9 3.3 4.4 3.7 3.9 3.2 4.1 Depreciation 1.6 1.5 1.4 1.5 1.3 1.2 1.3 Other Non-Cash Effects 1.2 1.2 1.3 9.5 1.7 1.1 0.9 Changes in Assets (14.2) (8.2) 2.9 (1.8) (6.2) 0.1 1.9 Changes in Liabilities (7.0) (5.3) (4.7) 1.9 5.5 (3.9) (4.8) Net Cash Flows (Used in) Provided By Operating Activities (23.1) (12.3) (3.1) (4.6) (10.4) (6.7) 1.6 Purchases of Property and Equipment (0.7) (1.0) (0.4) (0.7) (2.2) (1.9) (0.4) Patent Application Costs (0.1) (0.1) (0.1) 0.0 (0.1) (0.2) (0.0) Net Cash Flows Used in Investing Activities (0.8) (1.1) (0.5) (0.7) (2.3) (2.1) (0.4) Preferred Stock Net Proceeds 0.0 0.0 0.0 93.4 (0.8) 0.0 0.0 Proceeds from Term Loan 0.0 0.0 10.0 49.5 0.0 0.0 0.0 Repayment of Term Loan (0.9) (0.9) (10.9) (72.0) 0.0 0.0 0.0 Prepayment Premium on Term Loan 0.0 0.0 0.0 (1.4) 0.0 0.0 0.0 Deferred Financing Cost 0.0 0.0 0.0 (2.8) (0.3) 0.0 0.0 Stock Repurchased for Tax Withholdings on Vesting of Restricted Stock (0.2) (1.5) (0.8) (0.1) 0.0 (3.2) (1.4) Proceeds from Exercise of Stock Options 0.0 0.3 0.0 0.1 0.0 0.9 0.5 Net Cash Flows (Used in) Provided By Financing Activities (1.1) (2.2) (1.8) 66.7 (1.1) (2.3) (0.9) Beginning Cash Balance 94.1 69.1 53.5 48.2 109.6 95.8 84.7 Change in Cash (25.1) (15.5) (5.3) 61.4 (13.8) (11.1) 0.3 Ending Cash Balance 69.1 53.5 48.2 109.6 95.8 84.7 85.0
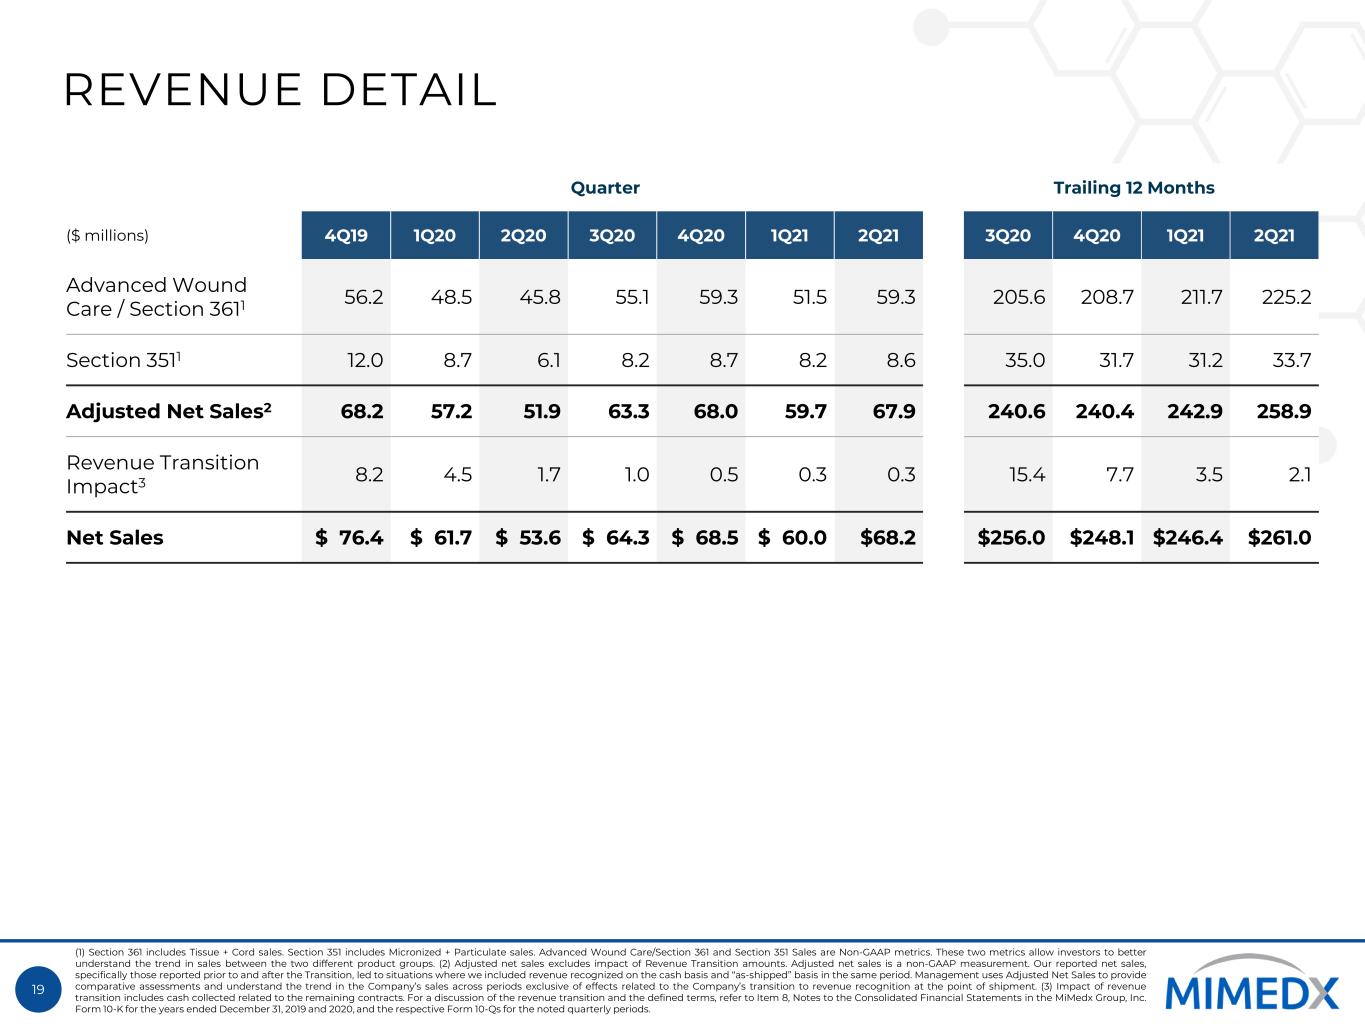
19 REVENUE DETAIL Quarter Trailing 12 Months ($ millions) 4Q19 1Q20 2Q20 3Q20 4Q20 1Q21 2Q21 3Q20 4Q20 1Q21 2Q21 Advanced Wound Care / Section 3611 56.2 48.5 45.8 55.1 59.3 51.5 59.3 205.6 208.7 211.7 225.2 Section 3511 12.0 8.7 6.1 8.2 8.7 8.2 8.6 35.0 31.7 31.2 33.7 Adjusted Net Sales2 68.2 57.2 51.9 63.3 68.0 59.7 67.9 240.6 240.4 242.9 258.9 Revenue Transition Impact3 8.2 4.5 1.7 1.0 0.5 0.3 0.3 15.4 7.7 3.5 2.1 Net Sales $ 76.4 $ 61.7 $ 53.6 $ 64.3 $ 68.5 $ 60.0 $68.2 $256.0 $248.1 $246.4 $261.0 (1) Section 361 includes Tissue + Cord sales. Section 351 includes Micronized + Particulate sales. Advanced Wound Care/Section 361 and Section 351 Sales are Non-GAAP metrics. These two metrics allow investors to better understand the trend in sales between the two different product groups. (2) Adjusted net sales excludes impact of Revenue Transition amounts. Adjusted net sales is a non-GAAP measurement. Our reported net sales, specifically those reported prior to and after the Transition, led to situations where we included revenue recognized on the cash basis and “as-shipped” basis in the same period. Management uses Adjusted Net Sales to provide comparative assessments and understand the trend in the Company’s sales across periods exclusive of effects related to the Company’s transition to revenue recognition at the point of shipment. (3) Impact of revenue transition includes cash collected related to the remaining contracts. For a discussion of the revenue transition and the defined terms, refer to Item 8, Notes to the Consolidated Financial Statements in the MiMedx Group, Inc. Form 10-K for the years ended December 31, 2019 and 2020, and the respective Form 10-Qs for the noted quarterly periods.

20 NON-GAAP METRICS RECONCILIATION ($ millions) 4Q19 1Q20 2Q20 3Q20 4Q20 1Q21 2Q21 Net Sales – Reported 76.4 61.7 53.6 64.3 68.5 60.0 68.2 Less: Revenue Transition Impact1 (8.2) (4.5) (1.7) (1.0) (0.5) (0.3) (0.3) Adjusted Net Sales 68.2 57.2 51.9 63.3 68.0 59.7 67.9 Gross Profit 63.7 51.7 45.4 54.0 57.7 50.3 55.4 Less: Revenue Transition Impact1 (7.1) (3.9) (1.5) (0.9) (0.4) (0.2) (0.3) Adjusted Gross Profit 56.6 47.8 44.0 53.1 57.3 50.1 55.1 Adjusted Gross Margin 83.0% 83.6% 84.8% 83.9% 84.2% 83.9% 81.3% Adjusted EBITDA 14.1 3.1 10.2 6.9 10.3 4.7 2.9 Less: Capital Expenditures (0.7) (1.0) (0.4) (0.7) (2.2) (1.9) (0.4) Less: Patent Application Costs (0.1) (0.1) (0.1) 0.0 (0.1) (0.2) (0.0) Adjusted Free Cash Flow 13.3 2.0 9.7 6.2 8.0 2.6 2.5 (1) Impact of revenue transition includes cash collected related to the remaining contracts. For a discussion of the revenue transition and the defined terms, refer to Item 8, Notes to the Consolidated Financial Statements in the MiMedx Group, Inc. Form 10-K for the years ended December 31, 2019 and 2020, and the respective Form 10-Qs for the noted quarterly periods.

21 ADJUSTED EBITDA RECONCILIATION ($ millions) 4Q19 1Q20 2Q20 3Q20 4Q20 1Q21 2Q21 Net Loss (7.5) (4.8) (8.5) (19.4) (16.6) (8.4) (1.8) Depreciation & Amortization 1.8 1.8 1.7 1.8 1.6 1.5 1.5 Interest Expense 2.4 2.4 2.6 1.5 1.5 1.5 1.4 Loss on Extinguishment of Debt 0.0 0.0 0.0 8.2 0.0 0.0 0.0 Income Tax 0.3 (11.3) 0.0 0.0 (1.0) 0.1 (0.0) EBITDA (3.0) (12.0) (4.2) (7.9) (14.5) (5.5) 1.1 Investigation, Restatement & Related 20.1 15.6 11.4 12.0 20.4 7.2 (2.1) Revenue Transition1 (5.9) (3.9) (1.5) (0.9) (0.4) (0.2) (0.3) Impairment of intangible assets 0.0 0.0 0.0 0.0 1.0 0.0 0.0 Share-Based Compensation 2.9 3.3 4.4 3.7 3.9 3.2 4.1 Adjusted EBITDA2 14.1 3.1 10.2 6.9 10.4 4.7 2.8 (1) Impact of revenue transition includes cash collected related to the remaining contracts. For a discussion of the revenue transition and the defined terms, refer to Item 8, Notes to the Consolidated Financial Statements in the MiMedx Group, Inc. Form 10-K for the years ended December 31, 2019 and 2020, and the respective Form 10-Qs for the noted quarterly periods. (2) Adjusted EBITDA consists of GAAP net loss excluding: (i) depreciation, (ii) amortization of intangibles, (iii) interest expense, (iv) loss on extinguishment of debt, (v) income tax provision, (vi) costs incurred in connection with Audit Committee Investigation, Restatement, and Related; (vii) the effect of the change in revenue recognition on net loss, (viii) Impairment of intangible assets, and (ix) share-based compensation. Investigation, Restatement & Related: • Audit Committee Investigation completed in 2Q19 • Restatement activities completed in 2Q20 • Going forward, remainder is legal costs for Company matters, resolution costs for Company matters, recoveries from insurance providers, and indemnification costs under agreements with former officers and directors
