Attached files
Exhibit 99.3
PRO FORMA VALUATION REPORT
MUTUAL HOLDING COMPANY
STOCK OFFERING
CFSB Bancorp, Inc. | Quincy, Massachusetts
HOLDING COMPANY FOR:
Colonial Federal Savings Bank | Quincy, Massachusetts
Valuation Date: August 20, 2021

1311-A Dolley Madison Boulevard, Suite 2A
McLean, Virginia 22101
703.528.1700
rpfinancial.com
August 20, 2021
Board of Directors
Colonial Federal Savings Bank
15 Beach Street
Quincy, Massachusetts 02170
Members of the Board of Directors:
At your request, we have completed and hereby provide an independent appraisal (“Appraisal”) of the estimated pro forma market value of the common stock which is to be issued in connection with the stock issuance transaction described below.
This Appraisal is furnished pursuant to the requirements stipulated in the Code of Federal Regulations and has been prepared in accordance with the “Guidelines for Appraisal Reports for the Valuation of Savings and Loan Associations Converting from Mutual to Stock Form of Organization” (the “Valuation Guidelines”) of the Office of Thrift Supervision (“OTS”) and accepted by the Federal Reserve Board (“FRB”), the Office of the Comptroller of the Currency (“OCC”) and the Federal Deposit Insurance Corporation (“FDIC”), and applicable regulatory interpretations thereof.
Description of Plan of Reorganization and Stock Issuance
The board of directors of Colonial Federal Savings Bank (“Colonial” or the “Bank”) has approved the Plan of Reorganization pursuant to which the Bank will reorganize from a federally-chartered mutual savings bank into a two-tier mutual holding company structure. After the reorganization, CFSB Bancorp, Inc. (“CFSB” or the “Company”) will be the mid-tier stock holding company and Colonial MHC (the “MHC”) will be the top-tier mutual holding company. After the offering, purchasers in the offering will own 45% and the MHC will own 55% of the outstanding shares of common stock of the Company. After the reorganization is completed, the Company will own all of the outstanding capital stock of the Bank.
CFSB Bancorp will offer its common stock in a subscription offering to Eligible Account Holders, Tax-Qualified Employee Plans, Supplemental Eligible Account Holders and Other Members as such terms are defined for purposes of applicable regulatory guidelines governing stock offerings by mutual institutions. To the extent that shares remain available for purchase after satisfaction of all subscriptions received in the subscription offering, the shares may be offered for sale to members of the general public in a community offering and a syndicated or firm commitment offering.
At this time, no other activities are contemplated for the Company other than 100% ownership of its subsidiary, the Bank, investment of the net cash proceeds retained at the holding company level and extending a loan to the employee stock ownership plan (the “ESOP”). In the future, CFSB Bancorp may acquire or organize other operating subsidiaries, diversify into other banking-related activities, pay dividends or repurchase its stock, although there are no specific plans to undertake such activities at the present time.
| 1311-A Dolley Madison Boulevard, Suite 2A | Telephone: (703) 528-1700 | |
| McLean, VA 22101 | Fax No.: (703) 528-1788 | |
| www.rpfinancial.com | Toll-Free No.: (866) 723-0594 | |
| E-Mail: mail@rpfinancial.com |
Board of Directors
August 20, 2021
Page 2
The Plan provides for a contribution to the a newly-established charitable foundation incorporated by Colonial Federal Savings Bank (the “Foundation”). The Foundation contribution will be funded with a $250,000 cash contribution and 2% of the number of shares outstanding at the close of the offering. The purpose of the Foundation is to provide financial support to charitable organizations in the communities in which Colonial operates and to enable those communities to share in Colonial’s long-term growth. The Foundation is dedicated completely to community activities and the promotion of charitable causes.
RP® Financial, LC.
RP® Financial, LC. (“RP Financial”) is a financial consulting firm serving the financial services industry nationwide that, among other things, specializes in financial valuations and analyses of business enterprises and securities, including the pro forma valuation for savings institutions converting from mutual-to-stock form. The background and experience of RP Financial is detailed in Exhibit V-1. We believe that, except for the fee we will receive for the Appraisal, we are independent of the Bank and the other parties engaged by Colonial to assist in the minority stock offering process.
Valuation Methodology
In preparing our Appraisal, we have reviewed the regulatory applications of the Company, the Bank and the MHC, including the prospectus as filed with the FRB, the OCC and the Securities and Exchange Commission (“SEC”). We have conducted a financial analysis of Colonial that has included a review of audited financial information for the years ended 2017 through 2021 and conducted a review of various unaudited information and internal financial reports through June 30, 2021, and had due diligence related discussions with the Bank’s management; Wolf & Company, P.C., the Bank’s independent auditor; Luse Gorman, PC, the Bank’s counsel for the stock issuance and Piper Sandler & Company, the Bank’s marketing advisor in connection with the stock offering. All assumptions and conclusions set forth in the Appraisal were reached independently from such discussions. In addition, where appropriate, we have considered information based on other available published sources that we believe are reliable. While we believe the information and data gathered from all these sources are reliable, we cannot guarantee the accuracy and completeness of such information.
We have investigated the competitive environment within which Colonial operates and have assessed Colonial’s relative strengths and weaknesses. We have kept abreast of the changing regulatory and legislative environment for financial institutions and analyzed the potential impact on Colonial and the industry as a whole. We have analyzed the potential effects of the stock offering on Colonial’s operating characteristics and financial performance as they relate to the pro forma market value of CFSB Bancorp. We have reviewed the economic and demographic characteristics of the Bank’s primary market area. We have compared Colonial’s financial performance and condition with selected publicly-traded thrifts in accordance with the Valuation Guidelines, as well as all publicly-traded thrifts and thrift holding companies. We have reviewed the current conditions in the securities markets in general and the market for thrift stocks in particular, including the market for existing thrift issues and initial public offerings by thrifts and thrift holding companies. We have excluded from such analyzes thrifts subject to announced or rumored acquisitions, and/or institutions that exhibit other unusual characteristics.
Board of Directors
August 20, 2021
Page 3
The Appraisal is based on Colonial’s representation that the information contained in the regulatory applications and additional information furnished to us by Colonial and its independent auditor, legal counsel and other authorized agents are truthful, accurate and complete. We did not independently verify the financial statements and other information provided by Colonial, or its independent auditor, legal counsel and other authorized agents nor did we independently value the assets or liabilities of Colonial. The valuation considers Colonial only as a going concern and should not be considered as an indication of Colonial’s liquidation value.
Our appraised value is predicated on a continuation of the current operating environment for Colonial and for all thrifts and their holding companies. Changes in the local, state and national economy, the legislative and regulatory environment for financial institutions and mutual holding companies, the stock market, interest rates, and other external forces (such as natural disasters or significant world events) may occur from time to time, often with great unpredictability and may materially impact the value of thrift stocks as a whole or the value of CFSB Bancorp’s stock alone. It is our understanding that there are no current plans for selling control of CFSB Bancorp following completion of the stock offering. To the extent that such factors can be foreseen, they have been factored into our analysis.
The estimated pro forma market value is defined as the price at which CFSB Bancorp’s common stock, immediately upon completion of the stock offering, would change hands between a willing buyer and a willing seller, neither being under any compulsion to buy or sell and both having reasonable knowledge of relevant facts.
Valuation Conclusion
Based on the foregoing, it is our opinion that, as of August 20, 2021, the estimated aggregate pro forma market value of the shares to be issued immediately following the conversion, both shares issued publicly as well as to the MHC and the Foundation, equaled $50,000,000 at the midpoint, equal to 5,000,000 shares offered at a per share value of $10.00. Pursuant to conversion guidelines, the 15% offering range indicates a minimum value of $42,500,000 and a maximum value of $57,500,000. Based on the $10.00 per share offering price determined by the Board, this valuation range equates to total shares outstanding of 4,250,000 at the minimum and 5,750,000 at the maximum. In the event the appraised value is subject to an increase, the aggregate pro forma market value may be increased up to a super maximum value of $66,125,000 without a resolicitation. Based on the $10.00 per share offering price, the super maximum value would result in total shares outstanding of 6,612,500.
The Board of Directors has established a public offering range such that the public ownership of the Company will constitute a 43.0% ownership interest, prior to the issuance of shares to the Foundation. Accordingly, the offering to the public of the minority stock will equal $18,275,000 at the minimum, $21,500,000 at the midpoint, $24,725,000 at the maximum and $28,433,750 at the super maximum of the valuation range. Based on the public offering range and inclusive of the shares issued to the Foundation, equal to 2.0% of the shares issued in the conversion, the public ownership of shares will represent 45.0% of the shares issued throughout the valuation range.
Board of Directors
August 20, 2021
Page 4
Limiting Factors and Considerations
The valuation is not intended, and must not be construed, as a recommendation of any kind as to the advisability of purchasing shares of the common stock. Moreover, because such valuation is determined in accordance with applicable regulatory guidelines and is necessarily based upon estimates and projections of a number of matters, all of which are subject to change from time to time, no assurance can be given that persons who purchase shares of common stock in the stock offering will thereafter be able to buy or sell such shares at prices related to the foregoing valuation of the estimated pro forma market value thereof. The appraisal reflects only a valuation range as of this date for the pro forma market value of CFSB Bancorp immediately upon issuance of the stock and does not take into account any trading activity with respect to the purchase and sale of common stock in the secondary market on the date of issuance of such securities or at anytime thereafter following the completion of the stock offering.
RP Financial’s valuation was based on the financial condition and operations of Colonial as of June 30, 2021, the date of the financial data included in the prospectus.
RP Financial is not a seller of securities within the meaning of any federal and state securities laws and any report prepared by RP Financial shall not be used as an offer or solicitation with respect to the purchase or sale of any securities. RP Financial maintains a policy which prohibits RP Financial, its principals or employees from purchasing stock of its client institutions.
This valuation will be updated as provided for in the conversion regulations and guidelines. These updates will consider, among other things, any developments or changes in the financial performance and condition of Colonial, management policies, and current conditions in the equity markets for thrift shares, both existing issues and new issues. These updates may also consider changes in other external factors which impact value including, but not limited to: various changes in the legislative and regulatory environment for financial institutions, the stock market and the market for thrift stocks, and interest rates. Should any such new developments or changes be material, in our opinion, to the valuation of the shares, appropriate adjustments to the estimated pro forma market value will be made. The reasons for any such adjustments will be explained in the update at the date of the release of the update. The valuation will also be updated at the completion of CFSB Bancorp’s stock offering.
| Respectfully submitted, |
| RP® FINANCIAL, LC. |

|
| James P. Hennessey |
| Director |
| RP® Financial, LC. | TABLE OF CONTENTS i |
TABLE OF CONTENTS
CFSB Bancorp, Inc.
Quincy, Massachusetts
| PAGE | ||||||
| DESCRIPTION |
NUMBER | |||||
| CHAPTER ONE |
OVERVIEW AND FINANCIAL ANALYSIS |
|||||
| Introduction |
I.1 | |||||
| Plan of Reorganization and Minority Stock Issuance |
I.1 | |||||
| Strategic Overview |
I.2 | |||||
| Balance Sheet Trends |
I.5 | |||||
| Income and Expense Trends |
I.8 | |||||
| Interest Rate Risk Management |
I.11 | |||||
| Lending Activities and Strategy |
I.12 | |||||
| Loan Originations, Purchases and Sales |
I.15 | |||||
| Asset Quality |
I.15 | |||||
| Funding Composition and Strategy |
I.16 | |||||
| Subsidiary Operations |
I.16 | |||||
| CHAPTER TWO |
OPERATING ENVIRONMENT AND MARKET AREA |
|||||
| Introduction |
II.1 | |||||
| Primary Market Area Overview |
II.1 | |||||
| Market Area Demographics |
II.2 | |||||
| Primary Market Area Employment Sectors |
II.5 | |||||
| Major Market Area Employers |
II.5 | |||||
| Market Area Unemployment Data |
II.7 | |||||
| Deposit Trends and Competition |
II.7 | |||||
| Competition |
II.9 | |||||
| CHAPTER THREE |
PEER GROUP ANALYSIS |
|||||
| Peer Group Selection |
III.1 | |||||
| Financial Condition |
III.6 | |||||
| Income and Expense Components |
III.8 | |||||
| Loan Composition |
III.12 | |||||
| Credit Risk |
III.14 | |||||
| Interest Rate Risk |
III.14 | |||||
| Summary |
III.17 | |||||
| RP® Financial, LC. | TABLE OF CONTENTS |
ii
TABLE OF CONTENTS
CFSB Bancorp, Inc.
Quincy, Massachusetts
(continued)
| PAGE | ||||
| DESCRIPTION | NUMBER | |||
| CHAPTER FOUR VALUATION ANALYSIS |
||||
| Introduction |
IV.1 | |||
| Appraisal Guidelines |
IV.1 | |||
| RP Financial Approach to the Valuation |
IV.1 | |||
| Valuation Analysis |
IV.2 | |||
| 1. Financial Condition |
IV.2 | |||
| 2. Profitability, Growth and Viability of Earnings |
IV.4 | |||
| 3. Asset Growth |
IV.5 | |||
| 4. Primary Market Area |
IV.6 | |||
| 5. Dividends |
IV.7 | |||
| 6. Liquidity of the Shares |
IV.8 | |||
| 7. Marketing of the Issue |
IV.9 | |||
| A. The Public Market |
IV.9 | |||
| B. The New Issue Market |
IV.15 | |||
| C. The Acquisition Market |
IV.17 | |||
| 8. Management |
IV.18 | |||
| 9. Effect of Government Regulation and Regulatory Reform |
IV.18 | |||
| Summary of Adjustments |
IV.18 | |||
| Valuation Approaches: Fully-Converted Basis |
IV.19 | |||
| Basis of Valuation - Fully-Converted Pricing Ratios |
IV.20 | |||
| 1. Price-to-Earnings (“P/E”) |
IV.20 | |||
| 2. Price-to-Book (“P/B”) |
IV.21 | |||
| 3. Price-to-Assets (“P/A”) |
IV.24 | |||
| Comparison to Publicly-Traded MHCs |
IV.25 | |||
| Comparison to Recent Offerings |
IV.28 | |||
| Valuation Conclusion |
IV.29 | |||
| RP® Financial, LC. | LIST OF TABLES iii |
LIST OF TABLES
CFSB Bancorp, Inc.
Quincy, Massachusetts
| TABLE | ||||||
| NUMBER |
DESCRIPTION |
PAGE | ||||
| 1.1 |
Historical Balance Sheets |
I.6 | ||||
| 1.2 |
Historical Income Statements |
I.9 | ||||
| 2.1 |
Summary Demographic Data |
II.4 | ||||
| 2.2 |
Primary Market Area Employment Sectors |
II.5 | ||||
| 2.3 |
Largest Private Employers in the Boston Metropolitan Area |
II.6 | ||||
| 2.4 |
Unemployment Trends |
II.7 | ||||
| 2.5 |
Deposit Summary |
II.8 | ||||
| 2.6 |
Market Area Deposit Competitors – As of June 30, 2020 |
II.9 | ||||
| 3.1 |
Peer Group of Public Savings Institutions |
III.3 | ||||
| 3.2 |
Balance Sheet Composition and Growth Rates |
III.7 | ||||
| 3.3 |
Income as a Percent of Average Assets and Yields, Costs, Spreads |
III.9 | ||||
| 3.4 |
Loan Portfolio Composition and Related Information |
III.13 | ||||
| 3.5 |
Credit Risk Measures and Related Information |
III.15 | ||||
| 3.6 |
Interest Rate Risk Measures and Net Interest Income Volatility |
III.16 | ||||
| 4.1 |
Peer Group Market Area Unemployment Rates |
IV.7 | ||||
| 4.2 |
Pricing Characteristics and After-Market Trends |
IV.16 | ||||
| 4.3 |
Valuation Adjustments |
IV.19 | ||||
| 4.4 |
Public Market Pricing Versus Peer Group (Fully Converted Basis) |
IV.22 | ||||
| 4.5 |
Public Market Pricing Versus Peer Group (MHC Basis) |
IV.23 | ||||
| 4.6 |
Publicly-Traded MHCs (Fully Conv. Basis) versus the Peer Group |
IV.26 | ||||
| 4.7 |
Peer Group of MHC Institutions (Fully Converted Basis) |
IV.27 | ||||
| RP® Financial, LC. | OVERVIEW AND FINANCIAL ANALYSIS I.1 |
I. OVERVIEW AND FINANCIAL ANALYSIS
Introduction
Colonial Federal Savings Bank (“Colonial” or the “Bank”), established in 1889, is a federally-chartered savings bank headquartered in Quincy, Massachusetts. The Company’s operations are conducted through the headquarters office location and three full-service branch offices, all of which are located within Norfolk County, Massachusetts. A map of Colonial’s branch office locations is provided in Exhibit I-1.
Colonial is a member of the Federal Home Loan Bank (“FHLB”) system and its deposits are insured up to the maximum allowable amount by the Federal Deposit Insurance Corporation (“FDIC”). As of June 30, 2021, Colonial had total assets of $338.9 million, total deposits of $284.6 million and total equity of $48.6 million equal to 14.36% of total assets. The Bank’s audited financial statements are included by reference as Exhibit I-2.
Plan of Reorganization and Minority Stock Issuance
On September 8, 2021, the Board of Directors of Colonial adopted the Plan of Reorganization and Minority Stock Issuance (the “Plan”). Pursuant to the Plan, Colonial will reorganize into the “two-tier” mutual holding company form of organization. In connection with the Plan, Colonial has organized a new Maryland stock holding company named CFSB Bancorp, Inc. (“CFSB Bancorp” or the “Company”), which will issue a majority of its common stock to a mutual holding company to be called 15 Beach MHC (the “MHC”) and sell a minority of its common stock to the public. When the reorganization and minority stock offering are completed, all of the outstanding capital stock of Colonial will be owned by Colonial. The MHC will own a controlling interest in the Company of % and the Company will become a subsidiary of the MHC.
CFSB Bancorp will offer its common stock in a subscription offering to Eligible Account Holders, Tax-Qualified Plans including Colonial’s employee stock ownership plan (the “ESOP”) and 401(k) plan, and Supplemental Eligible Account Holders as such terms are defined for purposes of applicable regulatory guidelines governing stock offerings by mutual institutions. To the extent that shares remain available for purchase after satisfaction of all subscriptions received in the subscription offering, the shares may be offered for sale to members of the general public in a community offering and a syndicated or firm commitment offering. It is anticipated that %
| RP® Financial, LC. | OVERVIEW AND FINANCIAL ANALYSIS I.2 |
of the net proceeds from the stock offering will be invested in Colonial and the balance of the net proceeds will be retained by the Company.
At this time, no other activities are contemplated for the Company other than the ownership of the Bank and funding a loan to the newly-formed ESOP and reinvestment of the proceeds that are retained by the Company. In the future, Colonial may acquire or organize other operating subsidiaries, diversify into other banking-related activities, pay dividends or repurchase its stock, although there are no specific plans to undertake such activities at the present time.
The Plan provides for the establishment of a new charitable foundation (the “Foundation”). The Foundation’s contribution will be funded with 2% of the outstanding shares of common stock issued in the mutual holding company reorganization and $250,000 and a $250,000 cash contribution. The purpose of the Foundation is to provide financial support to charitable organizations in the communities in which Colonial operates and to enable those communities to share in the Company’s long-term growth. The Foundation will be dedicated completely to community activities and the promotion of charitable causes.
Strategic Overview
Colonial maintains a local community banking emphasis, with a primary strategic objective of meeting the borrowing and savings needs of its local customer base. Colonial’s historical operating strategy has been a traditional thrift operating strategy, in which lending has emphasized originating 1-4 family residential mortgage loans and funding has been largely generated through retail deposits. While the Bank’s business plan calls for continuing to originate 1-4 family loans for portfolio, the Bank will continue to originate other types of loans primarily including mortgage loans secured by commercial and multi-family properties. The Bank’s objective is to fund asset growth primarily through deposit growth, emphasizing growth of lower cost core deposits.
Investments serve as a supplement to the Bank’s lending activities and the investment portfolio is considered to be indicative of a low risk investment philosophy. As of June 30, 2021, the Bank’s holdings of investment securities consisted of mortgage-backed securities that are guaranteed or insured by government sponsored enterprises (“GSEs”) and U.S. Government agency obligations. The Bank also maintained a material part of its June 30, 2021, balance sheet in cash and equivalents including interest-bearing deposits in other financial institutions. The Bank’s lending and investment strategies have generally supported management of credit risk
| RP® Financial, LC. | OVERVIEW AND FINANCIAL ANALYSIS I.3 |
exposure and, in recent years, the balance of non-performing assets have been at near zero levels.
Retail deposits have consistently served as the primary interest-bearing funding source for the Bank. Unlike a traditional thrift that relies on certificates of deposit, however, the Bank has successfully diversified its retail deposit into demand deposits, money market accounts and savings accounts which comprise approximately 61% of total deposits. The Bank utilizes borrowings as a supplemental funding source to facilitate management of funding costs and interest rate risk. Borrowing currently consist of FHLB advances.
Colonial’s earnings base is largely dependent upon net interest income and operating expense levels. The Bank has historically been effective in preserving its net interest income to average assets ratio. However, in fiscal 2020 and 2021, the Bank has experienced some net interest margin compression, due to such factors as the relatively flat yield curve and a shift in the Bank’s interest-earning asset mix towards a higher concentration of lower yielding cash and investments. Non-interest operating income has been a small contributor to the Bank’s earnings in recent years. Operating expenses have trended higher in recent years but remained in a relatively narrow range as a percent of average assets. Loan loss provisions have been at nominal levels reflecting that the Bank has had little or no non-performing assets and/or loan chargeoffs.
The post-offering business plan of the Bank is expected to remain consistent with current strategic objectives. Specifically, Colonial will continue to be an independent community-oriented financial institution with a commitment to lending in local markets with operations funded primarily by retail deposits. Moderate growth strategies will continue to be implemented within the context of managing the Bank’s exposure to risk.
The operating environment in 2020 and the first six months of 2021 posed significant challenges to the Bank and the entire world as a result of the global pandemic. As a result of the COVID-19 pandemic, the Bank initiated all of the recommended CDC and Commonwealth of Massachusetts protocols for safety. The Bank’s operation has adjusted to the new norms of ensuring the virus does not spread within the Bank, either through staff, customer or vendor interaction. As part of the strategic discussion, the backdrop of operations which have taken place for banks operationally and especially in customer action and interaction have been an impetus for the corporate restructuring into the mutual holding company form which will provide additional operating flexibility in the future from a capital and structural standpoint.
| RP® Financial, LC. | OVERVIEW AND FINANCIAL ANALYSIS I.4 |
Accordingly, a key component of the Bank’s business plan is to complete a mutual-to-stock conversion offering. The Bank’s strengthened capital position will increase operating flexibility and facilitate implementation of planned growth strategies. Additionally, in the near term, the stock conversion offering will serve to substantially increase regulatory capital and liquidity. Colonial’s higher capital position resulting from the infusion of stock proceeds will also serve to reduce interest rate risk, particularly through enhancing the Bank’s interest-earning assets/interest-bearing liabilities (“IEA/IBL”) ratio. The additional funds realized from the stock offering will serve to raise the level of interest-earning assets funded with equity and, thereby, reduce the ratio of interest-earning assets funded with interest-bearing liabilities as the balance of interest-bearing liabilities will initially remain relatively unchanged following the conversion, which may facilitate a reduction in Colonial’s funding costs. Colonial’s strengthened capital position will also position the Bank to pursue expansion opportunities. Such expansion could potentially include acquiring another financial institution or acquiring additional branch offices to gain a market presence in nearby markets that are complementary to the Bank’s existing branch network. At this time, the Bank has no specific plans for expansion through acquisitions.
The projected uses of proceeds are highlighted below.
| • | CFSB Bancorp, Inc. The Company is expected to retain 50% of the net offering proceeds. At present, funds at the Company level, net of the loan to the ESOP, are expected to be primarily invested initially into liquid funds held as a deposit at the Bank. Over time, the funds may be utilized for various corporate purposes, possibly including acquisitions, infusing additional equity into the Bank, repurchases of common stock, and the payment of regular and/or special cash dividends. |
| • | Colonial. Approximately 50% of the net stock proceeds will be infused into the Bank in exchange for all of the Bank’s newly issued stock. Cash proceeds (i.e., net proceeds less deposits withdrawn to fund stock purchases) infused into the Bank are anticipated to become part of general operating funds and are expected to be primarily utilized to fund loan growth over time. |
Overall, it is the Bank’s objective to pursue growth that will serve to increase returns, while, at the same time, growth will not be pursued that could potentially compromise the overall risk associated with Colonial’s operations.
| RP® Financial, LC. | OVERVIEW AND FINANCIAL ANALYSIS I.5 |
Balance Sheet Trends
Table 1.1 shows the Company’s historical balance sheet data for the past five years. From fiscal yearend June 30, 2017 through June 30, 2021, Colonial’s assets increased at a 3.39% annual rate. Asset growth was largely driven by growth in the cash and investment portfolio as loan growth was less than 1% annually over the last four fiscal years. A summary of Colonial’s key operating ratios for the past five years is presented in Exhibit I-3.
Colonial’s loans receivable portfolio has fluctuated in a narrow range from yearend 2017 through June 30, 2021, with the balance increasing modestly through the end of fiscal 2020 while decreasing in the most recent fiscal year as a result of heavy refinancing activity within the loan portfolio. Additionally, the Bank was impacted by comparatively modest loan demand for commercial loans in the COVID-19 pandemic environment. In addition, the loan portfolio composition has remained relatively stable over the last five fiscal years with the portfolio primarily comprised of permanent 1-4 family residential loans which equaled 79.15% of total loans as of the fiscal year ended June 30, 2021. The balance of the loan portfolio was primarily comprised of mortgage loans which have primarily consisted of a mix of multi-family and commercial mortgage loans as well as second mortgage and home equity loans secured by 1-4 family properties. The Bank also holds relatively small balances of consumer non-mortgage loans which totaled $2.1 million, or 1.2% of total loans.
The intent of the Company’s investment policy is to provide adequate liquidity and to generate a favorable return within the context of supporting Colonial’s overall credit and interest rate risk objectives. The Company is still evaluating options for the reinvestment of funds retained by the Company, one of which would be to place the funds on deposit with the Bank. Since yearend 2017, the Company’s level of cash and investment securities (inclusive of FHLB stock) ranged from a low of 36.07% of assets at yearend 2018 to a high of 43.70% of assets at yearend 2021, with the recent increase the result of significant deposit growth achieved in the COVID-19 pandemic operating environment coupled with limited loan growth.
As of June 30, 2021, the balance of cash and investments equaled $148.5 million or 43.84% of assets. Municipal and corporate bonds totaling $38.4 million and $38.1 million respectively, comprised the largest components of the investment portfolio and together, equaled 22.6% of the loan portfolio. Mortgage-backed securities totaling $28.0 million (8.3% of assets) were also a significant component of the investment portfolio at June 30, 2021. As of June 30, 2021, investments maintained as held to maturity totaled $105.1 and investments maintained as
| RP® Financial, LC. | OVERVIEW AND FINANCIAL ANALYSIS I.6 |
Table 1.1
Colonial Federal Savings Bank
Historical Balance Sheet Data
| Compounded | ||||||||||||||||||||||||||||||||||||||||||||
| As of the Fiscal Year Ended June 30, | Annual | |||||||||||||||||||||||||||||||||||||||||||
| 2017 | 2018 | 2019 | 2020 | 2021 | Growth Rate | |||||||||||||||||||||||||||||||||||||||
| Amount | Pct(1) | Amount | Pct(1) | Amount | Pct(1) | Amount | Pct(1) | Amount | Pct(1) | Pct | ||||||||||||||||||||||||||||||||||
| ($000) | (%) | ($000) | (%) | ($000) | (%) | ($000) | (%) | ($000) | (%) | (%) | ||||||||||||||||||||||||||||||||||
| Total Amount of: |
||||||||||||||||||||||||||||||||||||||||||||
| Assets |
$ | 296,400 | 100.00 | % | $ | 298,924 | 100.00 | % | $ | 298,924 | 100.00 | % | $ | 308,764 | 100.00 | % | $ | 338,854 | 100.00 | % | 3.40 | % | ||||||||||||||||||||||
| Cash and equivalents |
8,668 | 2.92 | % | 7,873 | 2.63 | % | 7,873 | 2.63 | % | 15,790 | 5.11 | % | 40,678 | 12.00 | % | 47.18 | % | |||||||||||||||||||||||||||
| Securities available for sale |
1,070 | 0.36 | % | 756 | 0.25 | % | 756 | 0.25 | % | 524 | 0.17 | % | 2,294 | 0.68 | % | 21.00 | % | |||||||||||||||||||||||||||
| Securities held to maturity |
104,202 | 35.16 | % | 97,967 | 32.77 | % | 97,967 | 32.77 | % | 98,584 | 31.93 | % | 105,114 | 31.02 | % | 0.22 | % | |||||||||||||||||||||||||||
| Federal Home Loan Bank stock |
934 | 0.32 | % | 1,220 | 0.41 | % | 1,220 | 0.41 | % | 879 | 0.28 | % | 453 | 0.13 | % | -16.55 | % | |||||||||||||||||||||||||||
| Loans receivable (net) |
168,251 | 56.76 | % | 177,330 | 59.32 | % | 177,330 | 59.32 | % | 179,043 | 57.99 | % | 174,433 | 51.48 | % | 0.91 | % | |||||||||||||||||||||||||||
| Fixed assets |
2,836 | 0.96 | % | 3,286 | 1.10 | % | 3,286 | 1.10 | % | 3,096 | 1.00 | % | 3,459 | 1.02 | % | 5.09 | % | |||||||||||||||||||||||||||
| BOLI |
8,320 | 2.81 | % | 8,553 | 2.86 | % | 8,553 | 2.86 | % | 8,783 | 2.84 | % | 9,250 | 2.73 | % | 2.68 | % | |||||||||||||||||||||||||||
| Other Assets |
2,119 | 0.71 | % | 1,939 | 0.65 | % | 1,939 | 0.65 | % | 2,065 | 0.67 | % | 3,173 | 0.94 | % | 10.62 | % | |||||||||||||||||||||||||||
| Deposits |
$ | 245,941 | 82.98 | % | $ | 242,490 | 81.12 | % | $ | 242,490 | 81.12 | % | $ | 251,151 | 81.34 | % | $ | 284,634 | 84.00 | % | 3.72 | % | ||||||||||||||||||||||
| FHLB advances |
5,000 | 1.69 | % | 8,774 | 2.94 | % | 8,774 | 2.94 | % | 7,719 | 2.50 | % | 918 | 0.27 | % | -34.54 | % | |||||||||||||||||||||||||||
| Other liabilities |
3,828 | 1.29 | % | 4,191 | 1.40 | % | 4,191 | 1.40 | % | 4,476 | 1.45 | % | 4,657 | 1.37 | % | 5.02 | % | |||||||||||||||||||||||||||
| Stockholders’ equity |
$ | 41,631 | 14.05 | % | $ | 43,469 | 14.54 | % | $ | 43,469 | 14.54 | % | $ | 45,418 | 14.71 | % | $ | 48,645 | 14.36 | % | 3.97 | % | ||||||||||||||||||||||
| Tangible stockholders’ equity |
$ | 41,631 | 14.05 | % | $ | 43,469 | 14.54 | % | $ | 43,469 | 14.54 | % | $ | 45,418 | 14.71 | % | $ | 48,645 | 14.36 | % | 3.97 | % | ||||||||||||||||||||||
| Net Unrealized Gain/(Loss) on Investment/MBS Available for Sale |
$ | 25 | 0.01 | % | $ | 19 | 0.01 | % | $ | 19 | 0.01 | % | $ | 10 | 0.00 | % | $ | 17 | 0.01 | % | — | |||||||||||||||||||||||
| Loans/Deposits |
68.41 | % | 73.13 | % | 73.13 | % | 71.29 | % | 61.28 | % | ||||||||||||||||||||||||||||||||||
| Offices Open |
4 | 4 | 4 | 4 | 4 | |||||||||||||||||||||||||||||||||||||||
| (1) | Ratios are as a percent of ending assets. |
Source: Preliminary prospectus; audited financial statements and RP Financial calculations.
| RP® Financial, LC. | OVERVIEW AND FINANCIAL ANALYSIS I.7 |
available for sale totaled $2.3 million. Investments maintained as available-at June 30, 2021 had a net unrealized gain of $23,000 while held-to-maturity investments had an unrealized gain equal to $2.3 million. Exhibit I-4 provides historical detail of the Bank’s investment portfolio. As of June 30, 2021, the Bank also held $40.3 million of cash and cash equivalents and $453,000 of FHLB stock.
The Bank also maintains an investment in bank-owned life insurance (“BOLI”) policies, which cover the lives of certain officers and Trustees of the Bank. The life insurance policies earn tax-exempt income through cash value accumulation and death proceeds. As of June 30, 2021, the cash surrender value of the Bank’s BOLI equaled $9.3 million.
Since yearend 2017, Colonial’s funding needs have been addressed through a combination of deposits, borrowings and internal cash flows. From yearend 2017 through June 30, 2021, the Bank’s deposits increased at a 3.72% annual rate. Deposits as a percent of assets increased from 82.98% at yearend 2017 to 84.00% at June 30, 2021. Deposits growth was sustained throughout the period covered in Table 1.1. Deposit growth trends in recent years reflect that deposit growth has primarily consisted of core deposits and, to a lesser extent, growth certificates of deposit (“CDs”). Core deposits comprised 60.80% of total deposits at June 30, 2021, versus 60.51% of total deposits at June 30, 2017, which reflects only nominal change.
Borrowings serve as an alternative funding source for the Bank to address funding needs for growth and to support management of deposit costs and interest rate risk. From yearend 2017 through the fiscal year ended June 30, 2021, borrowings were at modest levels peaking at $8.8 million as of June 30, 2018 and 2019, but had diminished to $918,000 or 0.27% of assets as of June 30, 2021. Borrowings currently held by the Bank consist of FHLB advances.
The Bank’s equity increased at a 3.94% annual rate from yearend 2017 through June 30, 2021, which was largely related to retention of earnings. A stronger rate of equity growth relative to asset growth since yearend 2017 provided for an increase in the Bank’s equity-to-assets ratio from 14.05% at yearend 2017 to 14.36% at June 30, 2021. Based on the foregoing, the Bank has a very strong capital position even before the proceeds to be realized from the Minority Stock Issuance. The addition of stock proceeds will serve to strengthen the Bank’s capital position, as well as support growth opportunities. At the same time, the increase in Colonial’s pro forma capital position will initially depress its ROE.
| RP® Financial, LC. | OVERVIEW AND FINANCIAL ANALYSIS I.8 |
Income and Expense Trends
Table 1.2 shows the Bank’s historical income statements for the past five fiscal years through June 30, 2021. The Bank’s reported earnings have reflected a declining trend over the last five fiscal years notwithstanding the modest balance sheet growth realized over the period. In this regard, net income has declined from $2.0 million or 0.69% of average assets during 2017 to a low of $1.4 million or 0.42% of average assets in fiscal 2021.
Net interest income and operating expenses represent the primary components of the Bank’s recurring earnings, while non-operating income has been a limited contributor to the Bank’s earnings. Loan loss provisions have had a modest impact on the Bank’s earnings over the past five years. Non-operating gains and losses generally have been negligible and thus, Colonial’s operations are primarily reliant on core operations. In view of the traditional thrift business model employed by Colonial, earnings are driven the difference between net interest income and operating expenses. The declining earnings trend, notwithstanding asset growth realized over the last five fiscal years, reflects the impact of low interest rates and loan portfolio shrinkage, both of which have contributed to declining asset yields and spread compression.
During the period covered in Table 1.2, the Bank’s net interest income to average assets ratio has diminished from a fiscal year end peak level of $8.1 million or 2.73 percent of average assets to only $7.4 million, or 2.16% of average assets as of the 2021 fiscal year end. The downward trend in the Bank’s net interest income ratio since 2017 has been primarily due to two factors as follows: (1) limited growth in the loan portfolio which has limited the Bank’s yield potential and in recent periods; and (2) historically low interest rates have resulted in the loan portfolio repricing downward faster than funding costs (which are at near zero rates).
The impact of spread compression is revealed in the yield/cost data shown in Exhibit I-5, which shows that Colonial’s spreads decreased from 2.28% in fiscal 2020, to 2.15% in fiscal 2021. Moreover, during this period, the Bank’s average yield on interest-earnings assets diminished by 44 basis points whereas the cost of funds declined by 32 basis points over the corresponding timeframe.
| RP® Financial, LC. | OVERVIEW AND FINANCIAL ANALYSIS I.9 |
Table 1.2
Colonial Federal Savings Bank
Historical Income Statements
| For the Fiscal Year Ended June 30, | ||||||||||||||||||||||||||||||||||||||||
| 2017 | 2018 | 2019 | 2020 | 2021 | ||||||||||||||||||||||||||||||||||||
| Amount | Pct(1) | Amount | Pct(1) | Amount | Pct(1) | Amount | Pct(1) | Amount | Pct(1) | |||||||||||||||||||||||||||||||
| ($000) | (%) | ($000) | (%) | ($000) | (%) | ($000) | (%) | ($000) | (%) | |||||||||||||||||||||||||||||||
| Interest Income |
$ | 9,197 | 3.13 | % | $ | 9,758 | 3.28 | % | $ | 9,972 | 3.34 | % | $ | 10,370 | 3.31 | % | $ | 9,482 | 2.86 | % | ||||||||||||||||||||
| Interest Expense |
(1,448 | ) | -0.49 | % | (1,645 | ) | -0.55 | % | (2,049 | ) | -0.69 | % | (2,715 | ) | -0.87 | % | (2,076 | ) | -0.63 | % | ||||||||||||||||||||
|
|
|
|
|
|
|
|
|
|
|
|
|
|
|
|
|
|
|
|
|
|||||||||||||||||||||
| Net Interest Income |
$ | 7,749 | 2.64 | % | $ | 8,113 | 2.73 | % | $ | 7,923 | 2.65 | % | $ | 7,655 | 2.44 | % | $ | 7,406 | 2.23 | % | ||||||||||||||||||||
| Provision for Loan Losses |
(106 | ) | -0.04 | % | (180 | ) | -0.06 | % | (60 | ) | -0.02 | % | (50 | ) | -0.02 | % | (60 | ) | -0.02 | % | ||||||||||||||||||||
|
|
|
|
|
|
|
|
|
|
|
|
|
|
|
|
|
|
|
|
|
|||||||||||||||||||||
| Net Interest Income after Provisions |
$ | 7,643 | 2.60 | % | $ | 7,933 | 2.67 | % | $ | 7,863 | 2.63 | % | $ | 7,605 | 2.43 | % | $ | 7,346 | 2.22 | % | ||||||||||||||||||||
| Other Income |
667 | 0.23 | % | 677 | 0.23 | % | 681 | 0.23 | % | 648 | 0.21 | % | 643 | 0.19 | % | |||||||||||||||||||||||||
| Operating Expense |
(5,737 | ) | -1.95 | % | (6,061 | ) | -2.04 | % | (6,271 | ) | -2.10 | % | (6,252 | ) | -2.00 | % | (6,351 | ) | -1.92 | % | ||||||||||||||||||||
|
|
|
|
|
|
|
|
|
|
|
|
|
|
|
|
|
|
|
|
|
|||||||||||||||||||||
| Net Operating Income |
$ | 2,573 | 0.88 | % | $ | 2,549 | 0.86 | % | $ | 2,272 | 0.76 | % | $ | 2,001 | 0.64 | % | $ | 1,638 | 0.49 | % | ||||||||||||||||||||
| Non-Operating Income/Expense |
||||||||||||||||||||||||||||||||||||||||
| Gain(Loss) on Sale/Impair of Investments |
$ | 0 | 0.00 | % | $ | 0 | 0.00 | % | $ | 0 | 0.00 | % | $ | 0 | 0.00 | % | $ | 0 | 0.00 | % | ||||||||||||||||||||
| Income/(Loss) Before Tax |
$ | 2,573 | 0.88 | % | $ | 2,549 | 0.86 | % | $ | 2,272 | 0.76 | % | $ | 2,001 | 0.64 | % | $ | 1,638 | 0.49 | % | ||||||||||||||||||||
| Income Tax Provision (Benefit) |
(547 | ) | -0.19 | % | (696 | ) | -0.23 | % | (316 | ) | -0.11 | % | (278 | ) | -0.09 | % | (246 | ) | -0.07 | % | ||||||||||||||||||||
|
|
|
|
|
|
|
|
|
|
|
|
|
|
|
|
|
|
|
|
|
|||||||||||||||||||||
| Net Income (Loss) |
$ | 2,026 | 0.69 | % | $ | 1,853 | 0.62 | % | $ | 1,956 | 0.65 | % | $ | 1,723 | 0.55 | % | $ | 1,392 | 0.42 | % | ||||||||||||||||||||
| Expense Coverage Ratio (2) |
135.1 | % | 133.9 | % | 126.3 | % | 122.4 | % | 116.6 | % | ||||||||||||||||||||||||||||||
| Efficiency Ratio (3) |
68.2 | % | 69.0 | % | 72.9 | % | 75.3 | % | 78.9 | % | ||||||||||||||||||||||||||||||
| Effective Tax Rate Cost (Benefit) |
-21.3 | % | -27.3 | % | -13.9 | % | -13.9 | % | -15.0 | % | ||||||||||||||||||||||||||||||
| Return on Equity |
2.28 | % | 2.90 | % | 3.95 | % | 5.47 | % | 3.85 | % | ||||||||||||||||||||||||||||||
| (1) | Ratios are as a percent of average assets. |
| (2) | Expense coverage ratio calculated as net interest income before provisions for loan losses divided by operating expenses. |
| (3) | Efficiency ratio calculated as op. exp. divided by the sum of net int. inc. before prov. for loan losses plus other income (excluding net gains). |
Source: Preliminary prospectus; audited financial statements and RP Financial calculations.
| RP® Financial, LC. | OVERVIEW AND FINANCIAL ANALYSIS I.10 |
Non-interest operating income has historically been a modest contributor to the Bank’s income statement and averaged 0.21% of average assets for the most recent three fiscal years and equaled only 0.19% of average assets for the fiscal year ended June 30, 2021. Most of this income is gained from deposit account fees and the BOLI investment income. Importantly, the limited fee income is reflective of the traditional thrift business model employed by the Bank where the majority of income is generated through net interest income. Given recent trends with regard to market interest rate levels which have limited the Bank’s spreads, earnings have diminished as a result.
Operating expenses represent the other major component of the Bank’s income statement, and as shown in Table 1.2, and reflect the limited cost inherent in Colonial’s traditional thrift operating strategy. Operating expenses have increased modestly in dollar terms since the end of fiscal 2017, increasing from $5.7 million, or 1.95% of average assets to a level of $6.4 million or 1.92% of average assets in fiscal 2021. Upward pressure will be placed on the Bank’s expense ratio following the stock offering, due to expenses associated with operating as a publicly-traded company, including expenses related to the stock benefit plans, auditing and legal costs.
Overall, during the past five years, the Bank’s expense coverage ratios (net interest income divided by operating expenses) declined continuously, from a high of 135.1% in fiscal 2017, to 116.6% in fiscal 2021. Similarly, the Bank’s efficiency ratio (operating expenses as a percent of the sum of net interest income and other operating income) reflected an adverse trend in core earnings, increasing from 68.2% in fiscal 2017, to 78.9% in fiscal 2021.
During the period covered in Table 1.2, the amount of loan loss provisions established has been very low, as the Bank’s has experienced favorable asset quality and loan chargeoffs have been minimal. For the twelve months ended June 30, 2021, the Bank reported loan loss provisions of $60,000 or 0.02% of average assets. As of June 30, 2021 the Bank maintained loan loss allowances of $1.7 million, equal to 0.98% of total loans receivable. The Bank does not have any non-accrual, classified or criticized loans as of June 30, 2021. Exhibit I-6 sets forth the Bank’s loan loss allowance activity for the past two years.
Over the past five years, the Bank’s effective tax rate ranged from a 12.1% during 2021 to a high of 27.3% during fiscal 2017. The relatively high effective tax rates recorded for 2017 includes a reduction in the value of the Bank’s deferred tax assets and a corresponding charge to income tax expense of $212,000, as the result of the reduction in the Bank’s federal marginal
| RP® Financial, LC. | OVERVIEW AND FINANCIAL ANALYSIS I.11 |
tax rate from 34% to 21%. The Bank’s marginal effective federal tax rate is 21% while corporate earnings are taxed at an effective rate of 9%, with exception of income in the securities corporation which is taxed at a lower rate of 1.32%, both of which are deductible expenses for federal income tax purposes. For purposes of estimating the pro forma impact of the conversion offering, we have assumed a 25.08% effective rate consistent with the prospectus disclosure.
Interest Rate Risk Management
Colonial’s balance sheet is asset-sensitive in the shorter-term and, thus, the net interest margin will typically be favorably affected during periods of rising and higher interest rates. Colonial measures its interest rate risk exposure by use of the economic value of equity (“EVE”) methodology, which provides an analysis of estimated changes in the Bank’s EVE under the assumed instantaneous changes in the U.S. treasury yield curve. Utilizing figures as of June 30, 2021, based on a 2.0% instantaneous and sustained increase in interest rates, the EVE model indicates that the Bank’s EVE would decrease by 11.4% (see Exhibit I-7).
The Bank pursues strategies to manage interest rate risk, particularly with respect to seeking to limit the repricing mismatch between interest rate sensitive assets and liabilities. The Bank manages interest rate risk from the asset side of the balance sheet through diversifying into other types of lending beyond 1-4 family permanent fixed rate mortgage loans such as originating commercial real estate, commercial business and construction/land loans, all of which have shorter terms to repricing or maturity and carry higher interest rates. On the liability side of the balance sheet, management of interest rate risk has been pursued through attempting to retain the balance of deposits in lower cost and less interest rate sensitive transaction and savings accounts and attempting to lengthen the term-to-maturity of the CD portfolio. The Bank has also lengthened the term-to-maturity of the borrowings portfolio, to the extent possible. Core deposits, which consist of transaction and savings accounts, comprised 60.8% of the Bank’s deposits at June 30, 2021. As of June 30, 2021, of the Bank’s total loans due after June 30, 2022, ARM loans comprised 21.4% of those loans (see Exhibit I-8). In addition, the Bank maintains a notable balance of cash and cash equivalents, which provide for short-term to maturity funds on the balance sheet. Finally, the Bank maintains an equity position of over 14% of assets on a pre-offering basis, representing interest-free funds that can be used to fund earning assets. The infusion of stock proceeds will serve to further limit the Bank’s interest rate risk exposure, as most of the net proceeds will be redeployed into interest-earning assets and the increase in the Bank’s equity will lessen the proportion of interest rate sensitive liabilities funding assets.
| RP® Financial, LC. | OVERVIEW AND FINANCIAL ANALYSIS I.12 |
There are numerous limitations inherent in interest rate risk analyses such as the credit risk of Bank’s loans pursuant to changing interest rates. Additionally, such analyses do not measure the impact of changing spread relationships, as interest rates among various asset and liability accounts rarely move in tandem, as the shape of the yield curve for various types of assets and liabilities is constantly changing in response to investor perceptions and economic events and circumstances.
Lending Activities and Strategy
Colonial operates two principal lending activities: (1) the origination of 1-4 family residential first and second position mortgage loans, with the first position fixed rate loans mostly sold in the secondary market; and, (2) commercial real estate/multifamily/commercial and industrial/construction lending as part of a commercial lending focus. The overall lending strategy is to diversify its overall loan portfolio, shorten the term-to-maturity or repricing, and increase the overall yield earned on loans. Details of the Bank’s loan portfolio composition are shown in Exhibit I-9, while Exhibit I-10 provides details of the Bank’s loan portfolio by contractual maturity date.
Residential Real Estate Lending
Colonial’s historical lending focus has been the origination of first position 1-4 family residential real estate loans. As of June 30, 2021, residential first and second position mortgage loans equaled $139.7 million, or 79.2% of total loans. The majority of the residential mortgage portfolio is fixed rate as adjustable loans totaled only $9.5 million or 6.8% of total residential loans. As shown in Exhibit I-9, the balance of residential mortgage loans has decreased since June 30, 2020, as low interest rates have provided the impetus for mortgage borrowers to refinance, often with other lenders including mortgage bankers and brokers.
Colonial’s first mortgage loans are generally underwritten to Fannie Mae or Freddie Mac origination guidelines and thus are deemed to be “conforming” loans with terms of 10 to 30 years. Most of the 1-4 family mortgage loans are secured by residences in the Colonial’s market, along with contiguous areas in eastern Massachusetts. Loan-to-value ratios (“LTV”) of mortgage loans are generally limited to an 80% LTV, whichever is lower, or up to 100% if the loans carry private mortgage insurance. Adjustable rate loans have an initial fixed interest rate period of one, three or five years, followed by annual adjustments to the interest rate, with a 2% period cap on changes in interest rates and a 6% lifetime interest rate cap. Colonial does not offer “interest
| RP® Financial, LC. | OVERVIEW AND FINANCIAL ANALYSIS I.13 |
only” “negative amortization”, subprime or Alt-A loans, which have higher risk underwriting characteristics.
Second Mortgage and Home Equity Loans
As an adjunct to residential lending, the Bank also has a small portfolio of second mortgages and home equity lines of credit which totaled $2.5 million, or 1.4% of the Bank’s loan portfolio as of June 30, 2021. Second mortgages loans and home equity lines of credit are multi-purpose loans used to finance various home or personal needs, where a one- to four-family primary or secondary residence serves as collateral. Colonial generally originates home equity lines of credit on owner-occupied properties with adjustable rates of interest based on the Prime Rate plus a margin. The Bank generally originates home equity lines of credit with a maximum loan-to-value ratio of 80% (including the value of the underlying mortgage loan) and with terms of up to 20 years.
Commercial Real Estate/Multi-Family Lending
As of June 30, 2021, commercial real estate/multi-family loans totaled $32.2 million, or 18.3% of the total loan portfolio, which reflects a reduction from the aggregate balance of $36.6 million as of the prior fiscal year end. Overall, the relative proportion of commercial and multi-family loans to total loans has remained relatively stable over the last five fiscal years.
Commercial real estate loans (“CRE”) totaled $16.4 million as of June 30, 2021. The Bank’s commercial real estate loans are generally secured by office and industrial buildings, warehouses, small retail facilities and restaurants within its markets and are most typically originated with adjustable interest rates. Multi-family loans, which totaled $15.9 million as of June 30, 2021, are typically secured by properties consisting of five or more rental units, with the properties within the lending primary market area.
Commercial real estate loans originated by the Bank are primarily adjustable rate as adjustable rate loans totaled $13.1 million, or 79.8% of commercial real estate loans had adjustable rates as of June 30, 2021. Interest rates on adjustable-rate commercial real estate loans adjust and generally are fixed for the first five years of the loan and adjust annually thereafter based on the U.S. Treasury one-year constant maturity rate, plus a margin.
Multi-family real estate loans are generally secured by properties consisting of five or more rental units in eastern Massachusetts. The Bank offers multi-family real estate loans with terms of up to 30 years and emphasizes adjustable rate loans which totaled $13.6 million,
| RP® Financial, LC. | OVERVIEW AND FINANCIAL ANALYSIS I.14 |
or 85.9% of multi-family real estate loans as of June 30, 2021. Interest rates on adjustable-rate multi-family real estate loans adjust and the interest rate is generally indexed to the one-year U.S. Treasury constant maturity rate, plus a margin.
Commercial and multi-family mortgage loans are generally priced at a higher rate of interest, have larger balances and involve a greater risk profile than 1-4 residential mortgage loans. In addition, the payments on commercial and multi-family mortgage loans are dependent on successful operations and management of the property. When originating income producing property loans, the Bank evaluates the qualifications and financial condition of the borrower, as well as the value and condition of the property securing the loan. The Bank will also generally require and obtain personal guarantees from the principals.
Consumer Lending (including HELOCs)
To a minor extent, Colonial originates personal consumer loans to individuals who reside or work in the Bank’s market area, including loans secured by home equity lines of credit and personal consumer loans. As of June 30, 2021, personal consumer loans totaled $0.6 million and consisted mostly of new and used automobile loans, and loans secured by CDs. The Bank offers such loans as a convenience to customers and does not emphasize such loans. These loans help to expand and create stronger customer relationships and opportunities for cross-marketing. Consumer loans have greater risk compared to mortgage loans, due to their dependence on the borrower’s continuing financial stability.
At June 30, 2021, home equity lines of credit totaled $1.6 million in outstanding balances. The underwriting standards utilized for home equity lines of credit include a determination of the applicant’s credit history, an assessment of the applicant’s ability to meet existing obligations and payments on the proposed loan and the value of the collateral securing the loan. Home equity lines of credit are offered with a loan-to-value ratio up to 80%. Colonial’s home equity lines of credit are generally 10-year balloon loans. The Bank’s home equity lines of credit have adjustable rates of interest which are indexed to the prime rate of interest.
| RP® Financial, LC. | OVERVIEW AND FINANCIAL ANALYSIS I.15 |
Loan Originations, Purchases and Sales
All lending activities are conducted by bank personnel located at the office locations, underwritten pursuant to bank policies and procedures. Loan sources typically include loan officers, marketing efforts, the existing customer base, walk-in customers and referrals from real estate brokers, builders and attorneys. The Bank generally originates loans for portfolio and has not sold loans over the last several fiscal years.
Colonial has also periodically purchased participation loans from other financial institutions in the market area, primarily within the state of Massachusetts. Such loans are underwritten according to the Bank’s underwriting criteria and procedures. At June 30, 2021, the outstanding balances of loan participations totaled $2.6 million or 2.1% of the loan portfolio, which consisted of five borrower relationships secured by commercial and multi-family mortgage loans
Asset Quality
Historically, the Company’s credit quality measures have implied relatively limited credit risk exposure, given the focus on 1-4 family permanent mortgage loans and conservative loan underwriting practices. Further, most loans are secured by property in the local market area. As of the end of the last two fiscal years, Colonial has had a zero level of non-performing assets (“NPAs”) (see Exhibit I-11 for details with respect to the Company’s asset quality). Balances of OREO have been minimal, and there have been zero balances of accruing troubled debt restructured loans.
Colonial maintains allowances for loan and lease losses (“ALLL”) to recognize probable losses associated with the loan portfolio. For the year ended June 30, 2021, the ratio of allowances to total loans equaled 0.98%. Given the lack of NPAs, the reserve coverage ratios are not meaningful (See Exhibit I-6 for details with respect to the Bank’s valuation allowances and loan charge-offs).
The overall level of NPAs remains low and loan charge-offs have been limited, reflective of Colonial’s conservative lending operations. The Bank’s management reviews and classifies loans on a monthly basis and establishes loan loss provisions based on the overall quality, size, and composition of the loan portfolio, as well as other factors such as historical loss experience, industry trends, and local real estate market and economic conditions
| RP® Financial, LC. | OVERVIEW AND FINANCIAL ANALYSIS I.16 |
Funding Composition and Strategy
Colonial has traditionally utilized both deposits and borrowings as funding sources. At June 30, 2021, deposits equaled $284.6 million. Exhibit I-12 sets forth the Bank’s deposit composition since June 30, 2020 and Exhibit I-13 provides the maturity composition of the certificate of deposit (“CD”) portfolio at June 30, 2021 for all CDs. CDs constitute the largest portion of the Bank’s deposit base, totaling 39.2% of deposits at June 30, 2021 versus 47.1% of deposits as of June 30, 2020. Checking and savings accounts equaled $173.1 million, or 60.8% of total deposits as of June 30, 2021, versus $146.7 million, or 52.9% of total deposits at June 30, 2020.
Colonial has historically utilized borrowed funds as a funding source, and such borrowings totaled only $918,000 as of June 30, 2021 with the funds used to support short term funding and liquidity objectives.
Subsidiary Activities
Colonial has one subsidiary, Beach Street Securities Corporation, which was incorporated in Massachusetts in 1997 to buy, sell and hold investments for its own account. Upon completion of the reorganization, Colonial will become the wholly-owned subsidiary of CFSB Bancorp, Inc.
| RP Financial, LC. | OPERATING ENVIRONMENT AND MARKET AREA Page II.1 |
II. OPERATING ENVIRONMENT AND MARKET AREA
Introduction
Colonial conducts operations out of a main office and corporate headquarters in Quincy, Massachusetts, and three full services branch offices in Quincy, Weymouth and Holbrook, Massachusetts. All of the Bank’s facilities are located in Norfolk County, which is located directly south of the city of Boston, Massachusetts. The county includes twenty-eight eastern Massachusetts communities, all of which are residential suburbs of Boston. Norfolk County is also the wealthiest county in Massachusetts, indicative of a strong economy relative to other nearby areas.
The Bank focuses on providing personal service while meeting the needs of its retail and business customer base, emphasizes personalized banking services to retail customers and offers a broad array of deposit services including demand deposits, regular savings accounts, money market deposits, certificates of deposit and individual retirement accounts. Lending operations are focused on real estate secured lending, including residential mortgage lending/mortgage banking and real estate secured commercial lending.
Future business and growth opportunities will be partially influenced by economic and demographic characteristics of the regional markets, particularly the future growth and stability of the regional economy, and the nature and intensity of the competitive environment for financial institutions. These factors outlined herein have been considered in the analysis of the Bank’s pro forma market value.
Primary Market Area Overview
The primary market area for business operations is the eastern portion of the Commonwealth of Massachusetts, which includes the Boston metropolitan statistical area (the “Boston MSA”). To a much lesser extent, the Bank conducts business (primarily lending) in contiguous areas. Eastern Massachusetts is a relatively well-developed area settled in the early part of the country’s history that has a wide range of new and old housing and commercial building stock. Geographically, the market area covers a small area, and thus the Bank’s current branch office network provides access to a material portion of the statewide population base. Such operations are essentially limited to the southern portion of the Boston MSA (the region containing all of the Bank’s offices) and the southeastern region of Massachusetts.
| RP Financial, LC. | OPERATING ENVIRONMENT AND MARKET AREA Page II.2 |
The market area served by the Company, characterized primarily as the Boston MSA, has a highly developed and diverse economy, with the region’s many colleges and universities serving to attract industries in need of a highly skilled and educated workforce. Healthcare, high-tech and financial services companies constitute major sources of employment in the regional market area, as well as the colleges and universities that populate the Boston MSA. Tourism also is a prominent component of market area’s economy, as Boston annually ranks as one of the nation’s top tourist destinations.
Colonial holds a small market share of deposits in the primary market area, given its asset size, number and size of competitors and the overall population base, and thus has potential for additional growth. Similar to other areas of the country, Colonial operates in a competitive environment and competes with a number of national, regional and locally-based financial institutions. In addition, the Bank faces competition from mortgage banking companies, consumer finance companies, investment houses, mutual funds, insurance companies and other financial intermediaries. Competitive factors have intensified with the growth of electronic delivery systems.
Market Area Demographics
As shown in Table 2.1, Norfolk County, where all of the Bank’s branches are located, reported a population of 711,000 as of 2021, has increased over the last five years at a 0.5% annual rate and is projected to continue to increase at the same rate over the next six years. The Boston MSA’s population size reached 4.9 million in 2021, also increasing at a 0.5% annual rate over the past five years. These growth rates are in line with recent and expected statewide and national population growth rates. This represents a favorable statistic for financial institutions such as Colonial, as the demand for personal financial services may likely improve in the near term future. Additional detail regarding the demographic trends of the local market has been included in Table 2.1.
Similar to the population trends noted above, the number of households also recorded an increase in Norfolk County from 2016 to 2021, with the growth rate of 0.4% while Boston MSA’s household growth rate was slightly higher at 0.5%, reflecting a nationwide trend towards smaller household sizes. Households are also projected to increase at the same rate over the next five years. Norfolk County’s historical and projected changes in households were also similar to the levels reported by the state of Massachusetts and the United States. The population base in Norfolk County is also somewhat older than Massachusetts and the nation, as Norfolk County
| RP Financial, LC. | OPERATING ENVIRONMENT AND MARKET AREA Page II.3 |
reported a slightly lower proportion of residents between the ages of 0 and 34, and a higher proportion of residents above 34 years of age, as compared to state and nationwide aggregates.
Reflecting the above mentioned high levels of personal income, Norfolk County’s median household income was notably higher than both the statewide and nationwide averages. Similarly, per capita income levels were highest in Norfolk County, indicative of the more urban nature of the county as well as the wealth of the market. Median household income in Norfolk County equaled $108,468 in 2021, while the state’s median income was $87,126. Projected increases in median household income and per capita income for Norfolk County approximate the projected rates for the state and nation over the next five years, indicating a continuation of a high level of financial strength to the area. As for the Boston metropolitan area, per capita income levels reached $55,237, higher than both statewide and nationwide income levels, yet still below Norfolk County equal to $60,544. Household income distribution figures presented in Table 2.1 support these higher income statistics, as Norfolk County maintained a significantly higher percentage of households with income higher than $100,000. For example, 53.4% of the residents of Norfolk County reported incomes in excess of $100,000, versus 44.1% for the Commonwealth of Massachusetts and 32.7% for the nation.
| RP Financial, LC. | OPERATING ENVIRONMENT AND MARKET AREA Page II.4 |
Table 2.1
Colonial FSB
Summary Demographic Data
| Year | Growth Rate | |||||||||||||||||||
| 2016 | 2021 | 2026 | 2016-2021 | 2021-2026 | ||||||||||||||||
| (%) | (%) | |||||||||||||||||||
| Population (000) |
||||||||||||||||||||
| USA |
322,431 | 330,946 | 340,574 | 0.5 | % | 0.6 | % | |||||||||||||
| Massachusetts |
6,810 | 6,928 | 7,085 | 0.3 | % | 0.4 | % | |||||||||||||
| Boston-Cambridge-Newton, MA-NH |
4,790 | 4,908 | 5,042 | 0.5 | % | 0.5 | % | |||||||||||||
| Norfolk, MA |
699 | 711 | 729 | 0.4 | % | 0.5 | % | |||||||||||||
| Households (000) |
||||||||||||||||||||
| USA |
122,265 | 125,733 | 129,596 | 0.6 | % | 0.6 | % | |||||||||||||
| Massachusetts |
2,661 | 2,721 | 2,792 | 0.4 | % | 0.5 | % | |||||||||||||
| Boston-Cambridge-Newton, MA-NH |
1,864 | 1,920 | 1,980 | 0.6 | % | 0.6 | % | |||||||||||||
| Norfolk, MA |
269 | 275 | 283 | 0.4 | % | 0.5 | % | |||||||||||||
| Median Household Income ($) |
||||||||||||||||||||
| USA |
55,551 | 67,761 | 73,868 | 4.1 | % | 1.7 | % | |||||||||||||
| Massachusetts |
69,807 | 87,126 | 96,373 | 4.5 | % | 2.0 | % | |||||||||||||
| Boston-Cambridge-Newton, MA-NH |
76,046 | 96,785 | 107,822 | 4.9 | % | 2.2 | % | |||||||||||||
| Norfolk, MA |
88,926 | 108,468 | 118,393 | 4.1 | % | 1.8 | % | |||||||||||||
| Per Capita Income ($) |
||||||||||||||||||||
| USA |
30,002 | 37,689 | 41,788 | 4.7 | % | 2.1 | % | |||||||||||||
| Massachusetts |
38,791 | 50,520 | 56,238 | 5.4 | % | 2.2 | % | |||||||||||||
| Boston-Cambridge-Newton, MA-NH |
42,009 | 55,237 | 61,516 | 5.6 | % | 2.2 | % | |||||||||||||
| Norfolk, MA |
47,509 | 60,544 | 65,959 | 5.0 | % | 1.7 | % | |||||||||||||
| 2021 Age Distribution (%) |
0-14 Yrs. | 15-34 Yrs. | 35-54 Yrs. | 55-69 Yrs. | 70+ Yrs. | |||||||||||||||
| USA |
18.3 | 26.8 | 25.1 | 18.4 | 11.4 | |||||||||||||||
| Massachusetts |
16.0 | 27.0 | 25.5 | 19.6 | 11.9 | |||||||||||||||
| Boston-Cambridge-Newton, MA-NH |
16.1 | 27.4 | 26.0 | 19.1 | 11.3 | |||||||||||||||
| Norfolk, MA |
16.7 | 25.1 | 26.1 | 20.0 | 12.1 | |||||||||||||||
| 2021 HH Income Dist. (%) |
Less Than 25,000 |
$25,000 to 50,000 |
$50,000 to 100,000 |
$100,000+ | ||||||||||||
| USA |
18.0 | 20.3 | 29.0 | 32.7 | ||||||||||||
| Massachusetts |
15.6 | 15.3 | 25.0 | 44.1 | ||||||||||||
| Boston-Cambridge-Newton, MA-NH |
14.2 | 13.4 | 23.8 | 48.6 | ||||||||||||
| Norfolk, MA |
11.2 | 12.0 | 23.5 | 53.4 | ||||||||||||
| Source: | S&P Global Market Intelligence. |
| RP Financial, LC. | OPERATING ENVIRONMENT AND MARKET AREA Page II.5 |
Primary Market Area Employment Sectors
Table 2.2 provides an overview of employment by economic sector for the Commonwealth of Massachusetts, the Boston Metropolitan Area and Norfolk County. As shown, Massachusetts, the Boston MSA and Norfolk County reported the largest proportions of employment in services, education and healthcare, finance and wholesale/retail trade, indicative of a relatively diversified employment base. Overall, the distribution of employment exhibited in the primary market area is indicative of a diverse economic environment, and the employment base is thus not deemed to be overly dependent on a single economic sector.
Table 2.2
Colonial FSB
Primary Market Area Employment Sectors
(Percent of Labor Force)
| Employment Sector |
Massachusetts | Boston-Cambridge- Newton, MA-NH |
Norfolk, MA | |||||||||
| (%) | ||||||||||||
| Services |
26.6 | % | 28.1 | % | 27.9 | % | ||||||
| Education,Healthcare, Soc. Serv. |
28.3 | % | 27.4 | % | 28.3 | % | ||||||
| Government |
1.8 | % | 1.9 | % | 2.1 | % | ||||||
| Wholesale/Retail Trade |
10.9 | % | 10.6 | % | 8.1 | % | ||||||
| Finance/Insurance/Real Estate |
15.7 | % | 15.8 | % | 17.3 | % | ||||||
| Manufacturing |
4.6 | % | 4.6 | % | 4.6 | % | ||||||
| Construction |
5.6 | % | 5.3 | % | 5.5 | % | ||||||
| Information |
2.2 | % | 2.5 | % | 2.5 | % | ||||||
| Transportation/Utility |
3.9 | % | 3.6 | % | 3.6 | % | ||||||
| Agriculture |
0.4 | % | 0.3 | % | 0.2 | % | ||||||
|
|
|
|
|
|
|
|||||||
| 100.0 | % | 100 | % | 100 | % | |||||||
Source: S&P Global Market Intelligence
Major Market Area Employers
Table 2.3 below presents a list of the major private employers in the Boston MSA. In addition, the Federal, state and local governments As shown, the specific companies include various economic sectors such as health care, education, services, retail and technology. These economic sectors generally contain higher-income jobs that provide support for the local economy.
| RP Financial, LC. | OPERATING ENVIRONMENT AND MARKET AREA Page II.6 |
Table 2.3
Colonial Federal Savings Bank
Largest Private Employers in the Boston Metropolitan Area
| Rank |
Employer |
City |
Number of Employees |
|||||
| 1 | Massachusetts General Hospital |
Boston |
16,999 | |||||
| 2 | Brigham & Women’s Hospital |
Boston |
13,303 | |||||
| 3 | Dan Farber Cancer Institute |
Boston |
10,000 | |||||
| 4 | Raytheon Systems Intl Co |
Andover |
10,000 | |||||
| 5 | U Mass System Admin Ofc |
Worcester |
10,000 | |||||
| 6 | Coldwell Banker Realty |
Lexington |
8,200 | |||||
| 7 | Boston Children’s Hospital |
Boston |
8,000 | |||||
| 8 | Beth Israel Deaconess Med Ctr |
Boston |
7,743 | |||||
| 9 | Umass Memorial Medical Ctr |
Worcester |
7,033 | |||||
| 10 | Staples Inc |
Framingham |
6,600 | |||||
| 11 | Massachusetts Bay Trnsprtn |
Boston |
6,001 | |||||
| 12 | Mass General For Child |
Salem |
5,800 | |||||
| 13 | Lahey Hospital & Medical Ctr |
Burlington |
5,787 | |||||
| 14 | Boston Medical Ctr Corp |
Boston |
5,335 | |||||
| 15 | Boston University Sch-Medicine |
Boston |
5,000 | |||||
| 16 | Dell EMC Corp |
Hopkinton |
5,000 | |||||
| 17 | Floating Hospital For Children |
Boston |
5,000 | |||||
| 18 | Southcoast Wound Care Ctr |
Fall River |
4,134 | |||||
| 19 | Dana-Farber Cancer Institute |
Boston |
4,098 | |||||
| 20 | Cape Cod Healthcare Inc |
Hyannis |
4,000 | |||||
| 21 | GE Aviation |
Lynn |
4,000 | |||||
| 22 | Massachusetts Institute-Tech |
Lexington |
4,000 | |||||
| 23 | Sensata Technologies Inc |
Attleboro |
4,000 | |||||
| 24 | Medical Information Tech Inc |
Westwood |
3,700 | |||||
| 25 | Mit Lincoln Laboratory |
Lexington |
3,535 | |||||
| 26 | Tufts Medical Ctr |
Boston |
3,527 | |||||
| 27 | State Street Corp |
Boston |
3,500 | |||||
| 28 | Cambridge Health Alliance |
Cambridge |
3,296 | |||||
| 29 | Boston Police Dept |
Boston |
3,000 | |||||
| 30 | Boston University Gotlieb |
Boston |
3,000 | |||||
| 31 | Genesis Hr Solutions |
Burlington |
3,000 | |||||
| 32 | Houghton Mifflin Harcourt Co |
Boston |
3,000 | |||||
| 33 | Jamaica Plain VA Medical Ctr |
Jamaica Plain |
3,000 | |||||
| 34 | Kronos Inc |
Lowell |
3,000 | |||||
| 35 | Smith & Nephew |
Andover |
3,000 | |||||
| 36 | Tufts Associated Health Plans |
Watertown |
3,000 | |||||
| 37 | USPS |
Boston |
2,800 | |||||
| 38 | Depuy Inc |
Raynham |
2,600 | |||||
| 39 | North Reading School District |
North Reading |
2,600 | |||||
| 40 | Bose Corp |
Framingham |
2,500 | |||||
Source: www.careerinfonet.org
| RP Financial, LC. | OPERATING ENVIRONMENT AND MARKET AREA Page II.7 |
Market Area Unemployment Data
Comparative unemployment rates for Boston MSA and Norfolk County as well as for the U.S. and the Commonwealth of Massachusetts are shown in Table 2.4. The unemployment data reveals that the respective June 2021 unemployment rates for Norfolk County and Massachusetts of 4.9% and 5.4% were lower than the U.S. unemployment rate of 6.1%, indicating a somewhat more favorable economic environment. Moreover, all geographic areas showed marked improvement over the last year which where the impact of the pandemic caused unemployment to surge on a temporary basis. At the same time, the reduction in unemployment rates while not at pre-pandemic levels has been relatively favorable.
Table 2.4
Colonial FSB
Unemployment Trends
| Unemployment Rate | Net | |||||||||||
| Region |
June 2020 | June 2021 | Change | |||||||||
| USA |
11.2 | % | 6.1 | % | -5.1 | % | ||||||
| Massachusetts |
14.8 | % | 5.4 | % | -9.4 | % | ||||||
| Boston-Cambridge-Newton, MA-NH |
14.2 | % | 5.0 | % | -9.2 | % | ||||||
| Norfolk, MA |
14.2 | % | 4.9 | % | -9.3 | % | ||||||
Source: S&P Global Market Intelligence
Deposit Trends and Competition
The competitive environment for financial institution products and services on a national, regional and local level can be expected to become even more competitive in the future. Consolidation in the banking industry provides economies of scale to the larger institutions, while the increased presence of investment options provides consumers with attractive investment alternatives to financial institutions.
Table 2.5 displays deposit market trends and deposit market share, respectively, for commercial banks and savings institutions for the Commonwealth of Massachusetts and the Bank’s market area of Norfolk County and Boston MSA from June 30, 2015 to June 30, 2020. Deposit growth trends are important indicators of a market area’s current and future prospects for growth. Massachusetts’s financial institution deposits increased at an annualized rate of 6.1% over the five year time period shown in Table 2.5, with commercial banks increasing deposits at
| RP Financial, LC. | OPERATING ENVIRONMENT AND MARKET AREA Page II.8 |
an annual rate of 6.1%, while savings and loan associations recorded an annual decline of 5.7. Commercial banks dominate the deposit market in Massachusetts, and as of June 30, 2021, commercial banks held a market share of 82.2% of total bank and thrift deposits.
Within Norfolk County, the table indicates that total deposits from 2015 to 2020 increased at an annual rate of 7.2%, a modest faster growth rate than the state as a whole. The specific data indicated that most competitors in the county experienced increases in deposits over the five year period, indicating a level of strength to the general economic, demographic and banking environment. Colonial recorded an increase in deposits at an annual rate of 3.7%, while savings institutions overall recorded an annualized increase of 2.1% in the same time period. As of June 30, 2021, the Bank’s deposit market share of total Norfolk County deposits was 0.8%, a decline from 1.0% as of June 30, 2015.
Colonial’s deposit market share figure is representative of the overall size of the deposit base in Norfolk County (within Boston MSA), and the Bank’s overall size. While future deposit gains and market share gains may be likely given the low current market share, the competitive environment has proven to be significant. The Bank’s ability to raise deposits is also impacted by the number of office locations and its relative equity position. As of June 30, 2020, there were 43 banks and thrifts operating within Norfolk County.
Table 2.5
Colonial FSB
Deposit Summary
| As of June 30, | ||||||||||||||||||||||||||||
| 2015 | 2020 | Deposit | ||||||||||||||||||||||||||
| Market | No. of | Market | No. of | Growth Rate | ||||||||||||||||||||||||
| Deposits | Share | Branches | Deposits | Share | Branches | 2015-2020 | ||||||||||||||||||||||
| (Dollars in Thousands) | (%) | |||||||||||||||||||||||||||
| Massachusetts |
$ | 371,439,000 | 100.0 | % | 2,191 | $ | 498,537,000 | 100.0 | % | 2,118 | 6.1 | % | ||||||||||||||||
| Commercial Banks |
304,253,000 | 81.9 | % | 1,338 | 409,892,000 | 82.2 | % | 1,293 | 6.1 | % | ||||||||||||||||||
| Savings Institutions |
67,185,000 | 18.1 | % | 853 | 88,645,000 | 17.8 | % | 825 | 5.7 | % | ||||||||||||||||||
| Boston-Cambridge-Newton, MA-NH |
$ | 328,769,848 | 100.0 | % | 1,516 | $ | 439,183,225 | 100.0 | % | 1,512 | 6.0 | % | ||||||||||||||||
| Commercial Banks |
$ | 293,706,926 | 89.3 | % | 1,131 | $ | 391,731,915 | 89.2 | % | 1,124 | 5.9 | % | ||||||||||||||||
| Savings Institutions |
$ | 35,062,922 | 10.7 | % | 385 | $ | 47,451,310 | 10.8 | % | 388 | 6.2 | % | ||||||||||||||||
| Colonial FSB |
233,122 | 0.1 | % | 4 | 279,123 | 0.1 | % | 4 | 3.7 | % | ||||||||||||||||||
| Norfolk County |
$ | 23,348,000 | 100.0 | % | 245 | $ | 33,064,000 | 100.0 | % | 248 | 7.2 | % | ||||||||||||||||
| Commercial Banks |
14,106,000 | 60.4 | % | 143 | 22,818,000 | 69.0 | % | 148 | 10.1 | % | ||||||||||||||||||
| Savings Institutions |
9,241,000 | 39.6 | % | 102 | 10,247,000 | 31.0 | % | 90 | 2.1 | % | ||||||||||||||||||
| Colonial FSB |
233,122 | 1.0 | % | 4 | 279,123 | 0.8 | % | 4 | 3.7 | % | ||||||||||||||||||
Source: FDIC.
| RP Financial, LC. | OPERATING ENVIRONMENT AND MARKET AREA Page II.9 |
Competition
The Bank faces notable competition in both deposit gathering and lending activities, including direct competition with several financial institutions that primarily have a local or regional presence. Securities firms, credit unions, and mutual funds also represent major sources of competition in raising deposits. In many cases, these competitors are also seeking to provide some or all of the community-oriented services as Colonial. With regard to lending competition, the Bank encounters the most significant competition from the same institutions providing deposit services. In addition, the Bank competes with mortgage companies, independent mortgage brokers, and credit unions in originating mortgage loans. Some of Colonial’s largest competitors include Bank of America, Citizens Financial Group, Banco Santander and Independent Bank. Competitive pressures will also likely continue to build as the financial services industry continues to consolidate and as non-bank financial services providers continue to proliferate. Table 2.6 lists the Bank’s largest competitors in the market area counties, based on deposit market share as noted parenthetically.
Table 2.6
Colonial FSB
Market Area Deposit Competitors - As of June 30, 2020
| Location |
Name |
Market Share |
Rank | |||||
| (%) | ||||||||
| Boston-Cambridge-Newton, MA-NH |
Bank of America Corporation (NC) |
30.16 | ||||||
| Citizens Financial Group, Inc. (RI) |
16.64 | |||||||
| Banco Santander S.A. |
7.15 | |||||||
| The Toronto-Dominion Bank |
5.71 | |||||||
| Eastern Bankshares Inc. (MA) |
3.67 | |||||||
| First Repub Bank (CA) |
3.29 | |||||||
| Independent Bank Corp. (MA) |
2.56 | |||||||
| Colonial FSB (MA) |
0.09 | 69 of 105 | ||||||
| Norfolk County, MA |
Bank of America Corporation (NC) |
23.72 | ||||||
| Citizens Financial Group, Inc. (RI) |
14.55 | |||||||
| Independent Bank Corp. (MA) |
6.03 | |||||||
| NB Financial MHC (MA) |
5.71 | |||||||
| Banco Santander S.A. |
5.13 | |||||||
| Brookline Bancorp Inc. (MA) |
4.33 | |||||||
| 1831 Bancorp MHC (MA) |
3.87 | |||||||
| Colonial FSB (MA) |
0.84 | 23 of 43 | ||||||
Source: S&P Global Market Intelligence.
| RP® Financial, LC. | PEER GROUP ANALYSIS III.1 |
III. PEER GROUP ANALYSIS
This chapter presents an analysis of Colonial’s operations versus a group of comparable institutions (the “Peer Group”) selected from the universe of all publicly-traded savings institutions in a manner consistent with the regulatory valuation guidelines. The basis of the pro forma market valuation of Colonial is derived from the pricing ratios of the Peer Group institutions, incorporating valuation adjustments for key differences in relation to the Peer Group. Since no Peer Group can be exactly comparable to Colonial, key areas examined for differences are: financial condition; profitability, growth and viability of earnings; asset growth; primary market area; dividends; liquidity of the shares; marketing of the issue; management; and effect of government regulations and regulatory reform.
Peer Group Selection
The Peer Group selection process is governed by the general parameters set forth in the regulatory valuation guidelines. Accordingly, the Peer Group is comprised of only those publicly-traded savings institutions whose common stock is either listed on the NYSE or NASDAQ, since their stock trading activity is regularly reported and generally more frequent than non-publicly traded and closely-held institutions. Institutions that are not listed on the NYSE or NASDAQ are inappropriate, since the trading activity for thinly-traded or closely-held stocks are typically highly irregular in terms of frequency and price and thus may not be a reliable indicator of market value. We have also excluded from the Peer Group those companies under acquisition or subject to rumored acquisition and recent conversions (less than one year), since their pricing ratios are subject to unusual distortion and/or have limited trading history. A recent listing of the universe of all publicly-traded savings institutions is included as Exhibit III-1.
Ideally, the Peer Group, which must have at least 10 members to comply with the regulatory valuation guidelines, should be comprised of publicly-traded MHCs with comparable resources, strategies and financial characteristics as Colonial Bancorp. However, there are currently only twelve publicly-traded MHCs in total, of which two including Cullman Bancorp and PDL Community Bancorp have announced plans for a second step conversion. Accordingly, in deriving a Peer Group comprised of institutions with relatively comparable characteristics as Colonial Bancorp, the companies selected for Colonial Bancorp’s Peer Group are all fully-converted companies. The valuation adjustments applied in the Chapter IV analysis will take
| RP® Financial, LC. | PEER GROUP ANALYSIS III.2 |
into consideration differences between the Company’s MHC form of ownership relative to the fully-converted Peer Group companies. Also included in Chapter IV is a pricing analysis of the publicly-traded MHCs on a fully-converted basis.
From the universe of publicly-traded thrifts, we selected thirteen institutions with characteristics similar to those of CFS Bancorp on a pro forma basis. In the selection process, given the asset size of Colonial, which implies the level of resources and efficiencies of the institution, along with the potential number of shares outstanding and float. The selection criteria used along with the identification of the Peer Group is listed in Table 3.1 and is discussed further below:
| • | The Peer Group must operate in the Bank’s Company’s market or in market areas with similar operating and economic environments which we have limited to the New England, Mid-Atlantic and Midwest Regions of the U.S; and |
| • | The Peer Group must have total assets of less than $1.3 billion. |
Table 3.1 shows the general characteristics of each of the 12 Peer Group companies and Exhibit III-2 provides summary demographic and deposit market share data for the primary market areas served by each of the Peer Group companies. While there are expectedly some differences between the Peer Group companies and Colonial, we believe that the Peer Group companies, on average, provide a good basis for valuation subject to valuation adjustments. The following sections present a comparison of Colonial’s financial condition, income and expense trends, loan composition, interest rate risk and credit risk versus the Peer Group as of the most recent publicly available date.
In addition to the selection criteria used to identify the Peer Group companies, a summary description of the key comparable characteristics of each of the Peer Group companies relative to Colonial’s characteristics is detailed below.
| • | CBM Bancorp, Inc. of Maryland. Comparable due to similar interest-earning asset composition including moderate balance of loans. In addition, a reported equity/assets ratio which is very strong in excess of 20% enhances having completed a stock conversion in 2018 which enhances the comparability to the Bank on a pro forma basis. |
| RP® Financial, LC. | PEER GROUP ANALYSIS III.3 |
Table 3.1
Peer Group of Public Savings Institutions
As of June 30, 2021 or the Most Recent Date Available.
| As of August 20, 2021 |
||||||||||||||||||||||||||||
| Ticker |
Financial Institution |
Exchange |
Region |
City |
State |
Total Assets |
Offices | Fiscal Mth End |
Conv. Date |
Stock Price |
Market Value |
|||||||||||||||||
| ($Mil) | ($) | ($Mil) | ||||||||||||||||||||||||||
| CBMB |
CBM Bancorp, Inc. |
NASDAQCM | MA | Baltimore |
MD | 250 | 4 | Dec | 9/27/2018 | 14.75 | 48 | |||||||||||||||||
| CNNB |
Cincinnati Bancorp, Inc. |
NASDAQCM | MW | Cincinnati |
OH | 250 | 6 | Dec | 10/14/2015 | 14.10 | 41 | |||||||||||||||||
| ESBK |
Elmira Savings Bank |
NASDAQCM | MA | Elmira |
NY | 649 | 12 | Dec | 3/1/1985 | 13.86 | 49 | |||||||||||||||||
| FFBW |
FFBW, Inc. |
NASDAQCM | MW | Brookfield |
WI | 353 | 6 | Dec | 10/10/2017 | 11.35 | 73 | |||||||||||||||||
| GBNY |
Generations Bancorp NY, Inc. |
NASDAQCM | MA | Seneca Falls |
NY | 380 | 10 | Dec | 7/10/2006 | 10.28 | 25 | |||||||||||||||||
| HMNF |
HMN Financial, Inc. |
NASDAQGM | MW | Rochester |
MN | 981 | 14 | Dec | 6/30/1994 | 22.99 | 103 | |||||||||||||||||
| HVBC |
HV Bancorp, Inc. |
NASDAQCM | MA | Doylestown |
PA | 549 | 7 | Dec | 1/11/2017 | 21.83 | 47 | |||||||||||||||||
| IROQ |
IF Bancorp, Inc. |
NASDAQCM | MW | Watseka |
IL | 745 | (1) | 8 | Jun | 7/7/2011 | 21.67 | 66 | ||||||||||||||||
| MSVB |
Mid-Southern Bancorp, Inc. |
NASDAQCM | MW | Salem |
IN | 249 | 3 | Dec | 4/8/1998 | 15.39 | 44 | |||||||||||||||||
| PBIP |
Prudential Bancorp, Inc. |
NASDAQGM | MA | Philadelphia |
PA | 1,125 | 10 | Sep | 3/29/2005 | 14.10 | 110 | |||||||||||||||||
| RNDB |
Randolph Bancorp, Inc. |
NASDAQGM | NE | Stoughton |
MA | 744 | 5 | Dec | 7/1/2016 | 20.32 | 99 | |||||||||||||||||
| WVFC |
WVS Financial Corp. |
NASDAQGM | MA | Pittsburgh |
PA | 346 | 6 | Jun | 11/29/1993 | 16.23 | 28 | |||||||||||||||||
Source: S&P Global Market Intelligence
| (1) | As of March 31, 2021 or the most recent date available. |
| RP® Financial, LC. | PEER GROUP ANALYSIS III.4 |
| • | Cincinnati Bancorp. Of Ohio. Comparable based on its high capital ratio and focus on mortgage lending. At the same Cincinnati Bancorp has strong earnings supported by gains on sale of mortgage loans whereas Colonial is primarily a portfolio lender. |
| • | Mid-Southern Bancorp, Inc. of Indiana. Comparable due to similar asset size and size of branch office network, and modest operating returns as a percent of average assets. In addition, the balance of loans is comparatively modest for Mid-Southern Bancorp at less than 50% of assets enhancing the comparability to the Bank. |
| • | FFBW, Inc. of Wisconsin Comparable due to similar interest-earning asset composition including moderate balance of loans. In addition, a reported equity/assets ratio which is very strong in excess of 20% enhances having completed a second step stock conversion in 2020 which enhances the comparability to the Bank on a pro forma basis. |
| • | Generations Bancorp NY of New York. Generations Bancorp was included in the Peer Group based on its similar assets size and modest earnings level which was at the low end of the Peer Group range and relatively comparable to Colonial’s earnings. Moreover, Generations Bancorp is primarily a residential mortgage lender based on its recent loan portfolio composition. |
| • | HMN Financial, Inc. of Minnesota. HMN Financial was included in the Peer Group based primarily on its location in the Midwest and asset size of less than $1 billion which RP Financial concluded would be evaluated similarly to the Bank on a pro forma basis from a pricing perspective. |
| • | HV Bancorp, Inc. of Pennsylvania. Comparable due to similar size of branch office network, and similar ratio of residential mortgage loans as a percent of assets reflecting a similar business model. Additionally, while the level of interest income is comparable, HV Bancorp’s earnings have been supported by gains on the sale of loans which contrast to the Bank’s portfolio lending strategy. |
| • | IF Bancorp, Inc. of Illinois. In comparison to Colonial, IF Bancorp had a relatively similar asset size and branch network. IF Bancorp’s focus on mortgage lending including a high proportion of MBS enhances its comparability to the Bank. |
| • | Mid-Southern Bancorp, Inc. of Indiana. Mid-Southern Bancorp has the lowest proportion of loans and most significant investment in securities which is highly comparable to the Bank’s asset composition which also has a low proportion of whole loans. Coupled with a broadly similar funding structure, the balance sheet composition of Colonial compares closely to Mid-Southern Bancorp. |
| • | Prudential Bancorp, Inc. of Pennsylvania. Comparable due to similar level of loans as a percent of assets and earnings are comparatively modest reflecting its thin net interest margin. |
| • | Randolph Bancorp, Inc. of Massachusetts. This comparable company also operates in markets in and south of Boston in areas making it highly comparable to the Bank’s market. In addition, Randolph Bancorp’s loan portfolio is focused on residential mortgages although its focus on loans originated for resale reflects a difference relative to Colonial’s portfolio lending strategy. |
| RP® Financial, LC. | PEER GROUP ANALYSIS III.5 |
| • | WVS Financial Corp. of Pennsylvania. Like Colonial, WVS Financial operates with a low ratio of loans and a more significant investment in securities. As a result, net interest income and overall earnings are comparatively modest and thus, comparable to Colonial’s earnings profile. |
In aggregate, the Peer Group companies maintained a somewhat higher level of tangible equity as the industry average (12.72% of assets versus 11.70% for all public companies), generated lower earnings as a percent of average assets (0.66% core ROAA versus 0.88% for all public companies), and earned a lower ROE. The Peer Group’s average P/TB ratio and average core P/E multiple were lower compared to the respective averages for all publicly-traded fully converted thrifts.
| All Fully Converted Publicly-Traded |
Peer Group | |||||||
| Financial Characteristics (Averages) |
||||||||
| Assets ($Mil) |
$ | 3,876 | $ | 552 | ||||
| Market capitalization ($Mil) |
$ | 524 | $ | 61 | ||||
| Tangible equity/assets (%) |
11.47 | % | 14.03 | % | ||||
| Core return on average assets (%) |
1.07 | 0.99 | ||||||
| Core return on average equity (%) |
8.36 | 8.58 | ||||||
| Pricing Ratios (Averages)(1) |
||||||||
| Price/earnings (x) |
12.36 | x | 11.58 | x | ||||
| Price/tangible book (%) |
123.03 | % | 93.00 | % | ||||
| Price/assets (%) |
13.12 | % | 12.30 | % | ||||
| (1) | Based on market prices as of August 20, 2021. |
The following sections present a comparison of Colonial’s financial condition, income and expense trends, loan composition, interest rate risk and credit risk versus the figures reported by the Peer Group. Figures referenced for the Peer Group are on a median basis unless otherwise noted. The conclusions drawn from the comparative analysis are then factored into the valuation analysis discussed in the final section of the valuation.
| RP® Financial, LC. | PEER GROUP ANALYSIS III.6 |
Financial Condition
Table 3.2 shows comparative balance sheet measures for Colonial and the Peer Group, reflecting the expected similarities and some differences given the selection procedures outlined above. The Bank’s and Peer Group ratios reflect balances as of June 30, 2021, or the latest date available. Colonial’s equity-to-assets ratio of 14.36% was higher than the Peer Group’s median equity ratio of 11.44%. The Bank’s pro forma equity position will increase with the addition of stock proceeds, with such ratio extending the advantage above the Peer Group’s ratio. Tangible equity-to-assets ratios for the Bank and the Peer Group equaled 14.36% and 11.15%, respectively. The increase in Colonial’s pro forma equity ratio will be favorable from a risk perspective and in terms of future earnings potential that could be realized through leverage and lower funding costs. At the same time, the Bank’s higher pro forma equity ratio will depress return on equity. Both Colonial’s and the Peer Group’s equity ratios reflected surpluses with respect to the regulatory capital requirements, with the Bank’s ratios currently higher than the Peer Group’s ratios except for the total capital ratio. On a pro forma basis, the Bank’s regulatory surpluses will continue to be higher than the Peer Group figures.
The interest-earning asset compositions for the Bank and the Peer Group were similar, with loans constituting the bulk of interest-earning assets for both. The Bank’s loans-to-assets ratio of 51.48% was lower than the comparable Peer Group ratio of 66.69% based on the median. Comparatively, the Bank’s cash/equivalents-to-assets ratio of 12.00% was higher than the median ratio for the Peer Group of 7.33%. Colonial reported a higher level of investment securities and BOLI of 34.56% compared to a combined median ratio of 14.31% for the Peer Group. Colonial’s earning assets amounted to 95.3% of assets, which was higher than the comparable Peer Group average ratio of 94.9%.
Colonial’s funding liabilities reflected a broadly similar funding strategy that relied on a similar level of deposits as the Peer Group’s funding composition. The Bank’s deposits equaled 84.00% of assets, which was modestly higher than the Peer Group’s median ratio of 77.02%. Comparatively, the Peer Group maintained a higher level of borrowings, equal to 4.52% versus less than one percent for Colonial.
| RP® Financial, LC. | PEER GROUP ANALYSIS III.7 |
Table 3.2
Balance Sheet Composition and Growth Rates
Comparable Institution Analysis
As of June 30, 2021 or the Most Recent Date Available.
| Balance Sheet as a Percent of Assets | Balance Sheet Annual Growth Rates | Bank Level Regulatory Capital | ||||||||||||||||||||||||||||||||||||||||||||||||||||||||||||||||||||||||||||||||||||||||
| Cash & | MBS & | Net | Borrowed | Sub. | Total | Goodwill | Tangible | MBS, Cash & | Borrows. | Total | Tangible | Tier 1 | Tier 1 | Risk-Based | ||||||||||||||||||||||||||||||||||||||||||||||||||||||||||||||||||||||||||||
| Equivalents | Invest | BOLI | Loans (1) | Deposits | Funds | Debt | Equity | & Intang | Equity | Assets | Investments | Loans | Deposits | &Sub debt | Equity | Equity | Leverage | Risk-Based | Capital | |||||||||||||||||||||||||||||||||||||||||||||||||||||||||||||||||||||||
| Colonial FSB |
||||||||||||||||||||||||||||||||||||||||||||||||||||||||||||||||||||||||||||||||||||||||||
| June 30, 2021 |
12.00 | % | 31.83 | % | 2.73 | % | 51.48 | % | 84.00 | % | 0.27 | % | 0.00 | % | 14.36 | % | 0.00 | % | 14.36 | % | 9.75 | % | 28.30 | % | -2.57 | % | 13.33 | % | -88.11 | % | 7.11 | % | 7.11 | % | 14.40 | % | 28.67 | % | 29.68 | % | ||||||||||||||||||||||||||||||||||||||||||||||||||
| All Public Savings Institutions |
||||||||||||||||||||||||||||||||||||||||||||||||||||||||||||||||||||||||||||||||||||||||||
| Averages |
11.93 | % | 13.14 | % | 1.67 | % | 68.77 | % | 77.77 | % | 7.20 | % | 0.38 | % | 12.44 | % | 0.65 | % | 11.50 | % | 10.70 | % | 49.43 | % | 2.10 | % | 16.45 | % | -28.19 | % | 12.72 | % | 13.71 | % | 11.11 | % | 16.58 | % | 18.09 | % | ||||||||||||||||||||||||||||||||||||||||||||||||||
| Medians |
8.93 | % | 11.52 | % | 1.81 | % | 71.01 | % | 78.77 | % | 5.37 | % | 0.00 | % | 11.68 | % | 0.07 | % | 10.76 | % | 7.09 | % | 29.31 | % | -0.17 | % | 11.99 | % | -27.80 | % | 4.97 | % | 5.66 | % | 10.91 | % | 15.34 | % | 16.94 | % | ||||||||||||||||||||||||||||||||||||||||||||||||||
| Peer Group |
||||||||||||||||||||||||||||||||||||||||||||||||||||||||||||||||||||||||||||||||||||||||||
| Averages |
10.66 | % | 21.01 | % | 1.70 | % | 63.25 | % | 74.16 | % | 7.19 | % | 0.15 | % | 14.27 | % | 0.25 | % | 14.02 | % | 7.68 | % | 34.29 | % | 0.32 | % | 14.10 | % | -28.82 | % | 8.60 | % | 10.28 | % | 12.74 | % | 18.77 | % | 19.74 | % | ||||||||||||||||||||||||||||||||||||||||||||||||||
| Medians |
7.33 | % | 12.68 | % | 1.63 | % | 66.69 | % | 77.02 | % | 4.52 | % | 0.00 | % | 11.44 | % | 0.00 | % | 11.15 | % | 6.55 | % | 30.55 | % | 0.16 | % | 10.02 | % | -33.78 | % | 4.97 | % | 6.10 | % | 10.73 | % | 16.03 | % | 16.80 | % | ||||||||||||||||||||||||||||||||||||||||||||||||||
| Peer Group |
||||||||||||||||||||||||||||||||||||||||||||||||||||||||||||||||||||||||||||||||||||||||||
| CBMB |
CBM Bancorp, Inc. | MD | 26.71 | % | 9.13 | % | 1.95 | % | 60.66 | % | 77.17 | % | 2.00 | % | 0.00 | % | 20.08 | % | 0.00 | % | 20.08 | % | 6.25 | % | 51.13 | % | -9.09 | % | 13.90 | % | -50.00 | % | -6.67 | % | -6.67 | % | 18.49 | % | 30.98 | % | 32.14 | % | ||||||||||||||||||||||||||||||||||||||||||||||||
| CNNB |
Cincinnati Bancorp, Inc. | OH | 6.90 | % | 5.18 | % | 1.69 | % | 82.14 | % | 62.98 | % | 18.54 | % | 0.00 | % | 17.13 | % | 0.06 | % | 17.07 | % | 6.85 | % | -23.81 | % | 12.95 | % | 5.39 | % | 10.86 | % | 10.46 | % | 10.57 | % | 15.25 | % | 18.90 | % | 19.77 | % | ||||||||||||||||||||||||||||||||||||||||||||||||
| ESBK |
Elmira Savings Bank | NY | 16.63 | % | 3.04 | % | 2.42 | % | 72.63 | % | 84.98 | % | 4.25 | % | 0.00 | % | 9.62 | % | 1.90 | % | 7.72 | % | -4.02 | % | 23.63 | % | -9.85 | % | 0.00 | % | -53.06 | % | 4.84 | % | 6.10 | % | 8.19 | % | 13.73 | % | 14.98 | % | ||||||||||||||||||||||||||||||||||||||||||||||||
| FFBW |
FFBW, Inc. | WI | 23.94 | % | 14.96 | % | 2.81 | % | 56.15 | % | 69.53 | % | 2.41 | % | 0.00 | % | 27.44 | % | 0.00 | % | 27.44 | % | 20.19 | % | 72.60 | % | -1.07 | % | 40.04 | % | -37.04 | % | -5.10 | % | NA | 21.73 | % | 33.61 | % | 34.70 | % | |||||||||||||||||||||||||||||||||||||||||||||||||
| GBNY |
Generations Bancorp NY, Inc. | NY | 4.02 | % | 10.41 | % | 2.06 | % | 75.61 | % | 81.68 | % | 5.81 | % | 0.00 | % | 11.19 | % | 0.42 | % | 10.77 | % | 2.09 | % | 6.97 | % | 1.38 | % | 1.91 | % | -33.78 | % | 45.02 | % | 47.97 | % | 10.62 | % | 14.16 | % | 14.86 | % | ||||||||||||||||||||||||||||||||||||||||||||||||
| HMNF |
HMN Financial, Inc. | MN | 10.23 | % | 21.69 | % | 0.00 | % | 65.71 | % | 87.90 | % | 0.29 | % | 0.00 | % | 11.00 | % | 0.08 | % | 10.92 | % | 13.70 | % | 90.22 | % | -4.31 | % | 14.55 | % | -22.41 | % | 10.03 | % | 10.21 | % | 10.01 | % | 14.18 | % | 15.43 | % | ||||||||||||||||||||||||||||||||||||||||||||||||
| HVBC |
HV Bancorp, Inc. | PA | 14.50 | % | 6.58 | % | 1.18 | % | 73.81 | % | 79.74 | % | 9.73 | % | 1.82 | % | 7.55 | % | 0.00 | % | 7.55 | % | 29.15 | % | 133.97 | % | 14.69 | % | 45.53 | % | -23.62 | % | 17.53 | % | 17.53 | % | 8.10 | % | 13.41 | % | 14.10 | % | ||||||||||||||||||||||||||||||||||||||||||||||||
| IROQ |
IF Bancorp, Inc. | (2 | ) | IL | 4.80 | % | 24.14 | % | 1.24 | % | 67.67 | % | 82.80 | % | 4.52 | % | 0.00 | % | 11.20 | % | 0.00 | % | 11.20 | % | 8.95 | % | 30.55 | % | 2.01 | % | 15.78 | % | -45.56 | % | 5.10 | % | 5.10 | % | 10.48 | % | NA | NA | ||||||||||||||||||||||||||||||||||||||||||||||||
| MSVB |
Mid-Southern Bancorp, Inc. | IN | 7.44 | % | 45.16 | % | 1.56 | % | 44.51 | % | 75.88 | % | 4.01 | % | 0.00 | % | 19.71 | % | 0.00 | % | 19.71 | % | 14.55 | % | 44.17 | % | -7.18 | % | 21.61 | % | 0.00 | % | -3.58 | % | -3.58 | % | 16.33 | % | NA | NA | ||||||||||||||||||||||||||||||||||||||||||||||||||
| PBIP |
Prudential Bancorp, Inc. | PA | 7.23 | % | 32.63 | % | 2.93 | % | 54.20 | % | 65.00 | % | 20.83 | % | 0.00 | % | 11.68 | % | 0.57 | % | 11.11 | % | -5.28 | % | -17.32 | % | 4.35 | % | 0.57 | % | -19.90 | % | 2.44 | % | 2.65 | % | 10.83 | % | 16.63 | % | 17.82 | % | ||||||||||||||||||||||||||||||||||||||||||||||||
| RNDB |
Randolph Bancorp, Inc. | MA | 4.69 | % | 7.13 | % | 1.17 | % | 82.64 | % | 76.86 | % | 6.72 | % | 0.00 | % | 13.53 | % | 0.00 | % | 13.53 | % | 2.78 | % | -34.87 | % | 11.28 | % | 6.13 | % | -42.48 | % | 19.14 | % | 19.16 | % | 12.63 | % | 15.56 | % | 16.79 | % | ||||||||||||||||||||||||||||||||||||||||||||||||
| WVFC |
WVS Financial Corp. | PA | 0.84 | % | 72.10 | % | 1.44 | % | 23.31 | % | 45.41 | % | NA | 0.00 | % | 11.09 | % | 0.00 | % | 11.09 | % | -3.09 | % | NA | -11.37 | % | 3.85 | % | NA | 4.00 | % | 4.00 | % | 10.23 | % | 16.50 | % | 16.80 | % | |||||||||||||||||||||||||||||||||||||||||||||||||||
| (1) | Includes loans held for sale. |
| (2) | As of March 31, 2021 or the latest date available. |
Source: S&P Global Market Intelligence, LC. and RP® Financial, LC. calculations. The information provided in this table has been obtained from sources we believe are reliable, but we cannot guarantee the accuracy or completeness of such information.
Copyright (c) 2021 by RP® Financial, LC.
| RP® Financial, LC. | PEER GROUP ANALYSIS III.8 |
Total interest-bearing liabilities maintained by the Bank and the Peer Group, as a percent of assets, equaled 84.27% and 81.51%, respectively. Following the increase in equity provided by the net proceeds of the stock offering, the Bank’s ratio of interest-bearing liabilities as a percent of assets will decline to more in line with the Peer Group’s ratio. A key measure of balance sheet strength for a thrift institution is its IEA/IBL ratio. Presently, the Bank’s IEA/IBL ratio is lower than the Peer Group’s ratio, based on IEA/IBL ratios of 113.1% and 116.4%, respectively. The additional equity realized from stock proceeds will serve to strengthen Colonial’s IEA/IBL ratio in comparison to the Peer Group ratio, as the increase in equity provided by the infusion of stock proceeds will lower the level of interest-bearing liabilities funding assets and will be primarily deployed into interest-earning assets.
The growth rate section of Table 3.2 shows annual growth rates for key balance sheet items, with growth rates for Colonial based on the 12 months ended June 30, 2021, and the Peer Group numbers based on annual growth rates for the 12 months ended June 30, 2021 or the latest date available for the Peer Group companies. Colonial recorded asset growth of 9.75%, higher than the Peer Group’s asset growth of 6.55%. Important from a valuation perspective, the growth was primarily related to the reinvestment of an influx of deposit funds into investment securities as Colonial’s loan portfolio shrank by 2.57% over the last twelve months. Similarly, the Peer Group’s loan portfolio realized minimal growth equal 0.16% over the most recent twelve month period while the portfolio of cash and investment increased by 30.55% based on the median.
Reflecting the recent levels of net income, Colonial’s equity increased at a 7.11% annual rate, versus a 4.97% increase for the Peer Group based on the median. The increase in equity realized from stock proceeds will likely depress the Bank’s equity growth rate initially following the stock offering. Dividend payments and stock repurchases, pursuant to regulatory limitations and guidelines could also potentially slow the Bank’s equity growth rate in the longer term following the stock offering.
Income and Expense Components
Table 3.3 displays statements of operations for the Bank and the Peer Group, with the income ratios based on earnings for the 12 months ended June 30, 2021, for the Bank and the Peer Group, or latest 12-month period available.
| RP® Financial, LC. | PEER GROUP ANALYSIS III.9 |
Table 3.3
Income as Percent of Average Assets and Yields, Costs, Spreads
Comparable Institution Analysis
For the 12 Months Ended June 30, 2021 or the Most Recent 12 Months Available
| Net Interest Income | Non-Interest Income | Non-Op. Items | Yields, Costs, and Spreads | |||||||||||||||||||||||||||||||||||||||||||||||||||||||||||||||||||||||
| Net Income (2) |
Income | Expense | NII | Loss Provis. on IEA |
NII After Provis. |
Gain on Sale of Loans |
Other Non-Int Income |
Total Non-Int Expense |
Net Gains/ Losses (1) |
Extrao. Items |
Provision for Taxes |
Yield On IEA |
Cost Of IBL |
Yld-Cost Spread |
MEMO: Assets/ FTE Emp. |
MEMO: Effective Tax Rate (2) |
||||||||||||||||||||||||||||||||||||||||||||||||||||||||||
| (%) | (%) | (%) | (%) | (%) | (%) | (%) | (%) | (%) | (%) | (%) | (%) | (%) | (%) | (%) | ($000) | (%) | ||||||||||||||||||||||||||||||||||||||||||||||||||||||||||
| Colonial FSB |
||||||||||||||||||||||||||||||||||||||||||||||||||||||||||||||||||||||||||
| June 30, 2021 |
0.42 | % | 2.86 | % | 0.63 | % | 2.23 | % | 0.02 | % | 2.22 | % | 0.00 | % | 0.19 | % | 1.92 | % | 0.00 | % | 0.00 | % | 0.07 | % | 2.88 | % | 0.83 | % | 2.05 | % | $ | 10,924 | 15.02 | % | ||||||||||||||||||||||||||||||||||||||||
| All Public Savings Insitutions |
||||||||||||||||||||||||||||||||||||||||||||||||||||||||||||||||||||||||||
| Averages |
0.93 | % | 3.44 | % | 0.54 | % | 2.92 | % | 0.10 | % | 2.82 | % | 0.85 | % | 0.41 | % | 2.75 | % | 0.01 | % | 0.00 | % | 0.31 | % | 3.64 | % | 0.74 | % | 2.91 | % | $ | 8,915 | 22.60 | % | ||||||||||||||||||||||||||||||||||||||||
| Medians |
0.86 | % | 3.38 | % | 0.50 | % | 2.88 | % | 0.07 | % | 2.79 | % | 0.13 | % | 0.34 | % | 2.48 | % | 0.00 | % | 0.00 | % | 0.27 | % | 3.56 | % | 0.70 | % | 2.89 | % | $ | 7,351 | 23.02 | % | ||||||||||||||||||||||||||||||||||||||||
| Peer Group |
||||||||||||||||||||||||||||||||||||||||||||||||||||||||||||||||||||||||||
| Averages |
0.98 | % | 3.17 | % | 0.57 | % | 2.60 | % | 0.07 | % | 2.53 | % | 1.46 | % | 0.44 | % | 3.18 | % | 0.04 | % | 0.00 | % | 0.29 | % | 3.41 | % | 0.77 | % | 2.65 | % | $ | 6,063 | 20.95 | % | ||||||||||||||||||||||||||||||||||||||||
| Medians |
0.70 | % | 3.24 | % | 0.50 | % | 2.75 | % | 0.08 | % | 2.70 | % | 0.40 | % | 0.41 | % | 2.82 | % | 0.00 | % | 0.00 | % | 0.20 | % | 3.47 | % | 0.69 | % | 2.81 | % | $ | 5,690 | 23.05 | % | ||||||||||||||||||||||||||||||||||||||||
| Peer Group |
||||||||||||||||||||||||||||||||||||||||||||||||||||||||||||||||||||||||||
| CBMB |
CBM Bancorp, Inc. | MD | 0.36 | % | 3.45 | % | 0.57 | % | 2.89 | % | -0.03 | % | 2.92 | % | 0.58 | % | 0.15 | % | 3.12 | % | 0.00 | % | 0.00 | % | 0.17 | % | 3.63 | % | 1.01 | % | 2.62 | % | $ | 6,245 | 31.62 | % | ||||||||||||||||||||||||||||||||||||||
| CNNB |
Cincinnati Bancorp, Inc. | OH | 1.72 | % | 3.24 | % | 0.92 | % | 2.32 | % | 0.08 | % | 2.24 | % | 4.90 | % | 0.72 | % | 5.68 | % | 0.00 | % | 0.00 | % | 0.45 | % | 3.40 | % | 1.17 | % | 2.23 | % | $ | 3,123 | 20.88 | % | ||||||||||||||||||||||||||||||||||||||
| ESBK |
Elmira Savings Bank | NY | 0.73 | % | 3.23 | % | 0.65 | % | 2.58 | % | 0.15 | % | 2.43 | % | 0.77 | % | 0.39 | % | 2.65 | % | 0.00 | % | 0.00 | % | 0.21 | % | 4.11 | % | 0.90 | % | 3.21 | % | $ | 5,643 | 22.16 | % | ||||||||||||||||||||||||||||||||||||||
| FFBW |
FFBW, Inc. | WI | 0.66 | % | 3.60 | % | 0.36 | % | 3.23 | % | 0.08 | % | 3.15 | % | 0.18 | % | 0.22 | % | 2.66 | % | NA | 0.00 | % | 0.20 | % | 3.94 | % | 0.66 | % | 3.28 | % | $ | 5,974 | 23.02 | % | |||||||||||||||||||||||||||||||||||||||
| GBNY |
Generations Bancorp NY, Inc. | NY | 0.48 | % | 3.64 | % | 0.61 | % | 3.03 | % | 0.15 | % | 2.88 | % | 0.00 | % | 0.70 | % | 3.34 | % | 0.32 | % | 0.00 | % | 0.08 | % | 3.99 | % | 0.80 | % | 3.19 | % | $ | 4,005 | 13.62 | % | ||||||||||||||||||||||||||||||||||||||
| HMNF |
HMN Financial, Inc. | MN | 1.53 | % | 3.47 | % | 0.22 | % | 3.25 | % | 0.05 | % | 3.20 | % | 1.02 | % | 0.79 | % | 2.89 | % | 0.01 | % | 0.00 | % | 0.60 | % | 3.57 | % | 0.36 | % | 3.21 | % | $ | 5,737 | 28.32 | % | ||||||||||||||||||||||||||||||||||||||
| HVBC |
HV Bancorp, Inc. | PA | 1.13 | % | 2.58 | % | 0.43 | % | 2.15 | % | 0.16 | % | 1.99 | % | 2.94 | % | 0.21 | % | 3.58 | % | 0.00 | % | 0.00 | % | 0.44 | % | 2.87 | % | 0.63 | % | 2.24 | % | $ | 3,743 | 27.92 | % | ||||||||||||||||||||||||||||||||||||||
| IROQ |
IF Bancorp, Inc. | IL | 0.79 | % | 3.42 | % | 0.70 | % | 2.72 | % | 0.01 | % | 2.71 | % | 0.23 | % | 0.57 | % | 2.47 | % | 0.06 | % | 0.00 | % | 0.31 | % | 3.53 | % | 0.71 | % | 2.82 | % | $ | 7,183 | 27.93 | % | ||||||||||||||||||||||||||||||||||||||
| MSVB |
Mid-Southern Bancorp, Inc. | IN | 0.53 | % | 3.20 | % | 0.33 | % | 2.87 | % | 0.03 | % | 2.84 | % | 0.00 | % | 0.43 | % | 2.76 | % | 0.00 | % | 0.00 | % | -0.01 | % | 3.35 | % | 0.50 | % | 2.85 | % | $ | 5,084 | -2.23 | % | ||||||||||||||||||||||||||||||||||||||
| PBIP |
Prudential Bancorp, Inc. | PA | 0.54 | % | 3.23 | % | 1.32 | % | 1.91 | % | 0.14 | % | 1.77 | % | 0.02 | % | 0.18 | % | 1.45 | % | 0.08 | % | 0.00 | % | 0.06 | % | 3.41 | % | 1.55 | % | 1.86 | % | $ | 11,592 | 9.55 | % | ||||||||||||||||||||||||||||||||||||||
| RNDB |
Randolph Bancorp, Inc. | MA | 2.95 | % | 3.19 | % | 0.41 | % | 2.78 | % | 0.07 | % | 2.70 | % | 6.86 | % | 0.73 | % | 6.41 | % | -0.05 | % | 0.00 | % | 0.88 | % | 3.39 | % | 0.58 | % | 2.81 | % | $ | 3,721 | 23.08 | % | ||||||||||||||||||||||||||||||||||||||
| WVFC |
WVS Financial Corp. | PA | 0.39 | % | 1.75 | % | 0.27 | % | 1.48 | % | -0.02 | % | 1.49 | % | 0.00 | % | 0.16 | % | 1.11 | % | -0.02 | % | 0.00 | % | 0.14 | % | 1.80 | % | 0.34 | % | 1.46 | % | $ | 10,702 | 25.56 | % | ||||||||||||||||||||||||||||||||||||||
| (1) | Net gains/losses includes gain/loss on sale of securities and nonrecurring income and expense. |
Source: S&P Global Market Intelligence and RP® Financial, LC. calculations. The information provided in this table has been obtained from sources we believe are reliable, but we cannot guarantee the accuracy or completeness of such information.
Copyright (c) 2021 by RP® Financial, LC.
| RP® Financial, LC. | PEER GROUP ANALYSIS III.10 |
Colonial reported net income of 0.42% of average assets for the 12 months ended June 30, 2021 lower than the median net income of 0.70% of average assets for the Peer Group. Lower earnings were primarily attributable to the relatively low level of net interest and non-interest income reflective of the Bank’s traditional thrift business model which involved residential mortgage lending for portfolio. While Colonial benefited from a comparatively low level of operating expenses which resulted from its thrift-oriented operating strategy, it was insufficient to offset the higher net interest and non-income generated by the Peer Group.
Colonial’s net interest income ratio was below the Peer Group’s average ratio, because of its comparatively low asset yields in comparison to the Peer Group reflecting the greater investment in relatively low yielding (and low credit risk) residential loans and lower proportion of loans overall. Colonial’s overall yield earned on interest-earning assets, 2.88%,was below the 3.47% median ratio for the Peer Group. Alternatively, the Bank’s cost of funds was relatively higher than the Peer Group (0.83% versus 0.69% for the Peer Group). As a result of lower asset yields and higher funding costs, the Bank’s spreads and ratio of net interest income to average assets were materially lower than the Peer Group median. Specifically, Colonial reported net interest income to average assets equal to 2.23% which was 52 basis points lower than the Peer Group median of 2.75%
The Bank’s business model focused on portfolio mortgage lending, while limiting net interest and non-interest income, also minimizes Colonial’s operating costs. Colonial reported a lower ratio of operating expenses, equal to 1.92% of average assets versus the Peer Group (2.82% of average assets). In connection with the operating expense ratios, Colonial maintained a comparatively lower number of employees relative to its asset size. Assets per full time equivalent employee equaled $10.9 million for the Bank versus a comparable measure of $5.7 million for the Peer Group. On a post-offering basis, the Bank’s operating expenses can be expected to further increase with the addition of the ESOP and certain expenses that result from being a publicly-traded savings institution, with such expenses already impacting the Peer Group’s operating expenses. At the same time, Colonial’s capacity to leverage operating expenses will be enhanced following the increase in capital realized from the infusion of net stock proceeds.
When viewed together, net interest income and operating expenses provide considerable insight into a bank’s earnings strength, since those sources of income and expenses are typically the most prominent components of earnings and are generally more
| RP® Financial, LC. | PEER GROUP ANALYSIS III.11 |
predictable than losses and gains realized from the sale of assets or other non-recurring activities. In this regard, the Bank’s reserve coverage ratio equal to 1.17x was more favorable than the Peer Group’s expense coverage ratio of 1.01x. Importantly, the expense coverage ratio does not capture the impact of non-interest income which is comparatively modest for the Bank as noted below.
Contributions to earnings from non-interest operating income, excluding gains on sale of loans, was lower for the Bank in comparison to the Peer Group, equaling 0.19% and 0.41% of average assets, respectively. Moreover, the Peer Group’s earnings were supported by gains on the sale of loans equal to 0.40% of average assets while Colonial did not have any comparable revenues given its status as a portfolio lender. Taking non-interest operating income into account in comparing the Bank’s and the Peer Group’s earnings, Colonial’s efficiency ratio (operating expenses, net of amortization of intangibles, as a percent of the sum of non-interest operating income and net interest income) of 78.9% was less favorable than the Peer Group’s average efficiency ratio of 70.6%.
Loan loss provisions had a modest, but larger impact on the Peer Group’s earnings, with loan loss provisions established by the Bank and the Peer Group equaling 0.02% and 0.08% of average assets, respectively. The impact of loan loss provisions on the Bank’s and the Peer Group’s earnings, particularly when taking into consideration the prevailing credit market environment for mortgage-based lenders, were indicative of the favorable asset quality position of the Bank and Peer Group.
For the 12 months ended June 30, 2021, the Bank reported no non-operating expense, while the Peer Group reported a minimal 0.04% of average assets of net non-operating gains based on the average. Typically, gains and losses generated from non-operating items are viewed as non-recurring in nature, particularly to the extent such gains and losses result from the sale of investments or other assets are not considered to be part of an institution’s core operations. Extraordinary items were not a factor in either the Bank’s or the Peer Group’s earnings.
The Peer Group reported a median effective tax rate of 23.05%, while Colonial reported an effective tax rate of 15.02%. As indicated in the prospectus, the Bank’s effective marginal tax rate is assumed to equal 25.08% (inclusive of both federal and state corporate taxes) when calculating the after-tax return on conversion proceeds. The average tax rate for the Bank is
| RP® Financial, LC. | PEER GROUP ANALYSIS III.12 |
lower than the marginal rate as a result of income on BOLI and municipal securities which is tax advantaged and not included in taxable income.
Loan Composition
Table 3.4 presents data related to the Bank’s and the Peer Group’s loan portfolio compositions (including any investment in MBS). The Bank’s loan portfolio composition reflected a higher concentration of investment in 1-4 family property secured assets (permanent mortgage loans and MBS) than maintained by the Peer Group (50.21% of assets versus 33.11% for the Peer Group). The Peer Group reported a higher level of investment in MBS. As a reflection of the portfolio lending strategy, Colonial did not report any mortgage servicing activities while the level of such activities among the Peer Group institutions was generally modest.
Diversification into higher risk and higher yielding types of lending was lower for the Bank, as the Peer Group reported total loans other than 1-4 family and MBS of 32.64% of assets on average, versus 9.51% for the Bank. The Bank mortgage lending emphasis is notable as non-mortgage loans totaled less than 1% of assets while commercial and consumer non-mortgage loans equaled 8.7% for the Peer Group. In addition, while Colonial has sought to increase commercial and multi-family mortgage loans, such loans equaled 9.5% for the Bank versus a median level of 18.5% for the Peer Group. The relative concentration and diversification of assets in loans translated into a higher risk weighted assets-to-assets ratio for the Peer Group (64.57%) than the Bank (50.06%).
| RP® Financial, LC. | PEER GROUP ANALYSIS III.13 |
Table 3.4
Loan Portfolio Composition and Related Information
Comparable Institution Analysis
As of June 30, 2021 or the Most Recent Date Available.
| Portfolio Composition as a Percent of Assets | ||||||||||||||||||||||||||||||||||||||||
| MBS | 1-4 Family |
Constr. & Land |
Multi- Family |
Comm RE | Commerc. Business |
Consumer | RWA/ Assets |
Servicing Assets |
||||||||||||||||||||||||||||||||
| (%) | (%) | (%) | (%) | (%) | (%) | (%) | (%) | ($000) | ||||||||||||||||||||||||||||||||
| Colonial FSB |
||||||||||||||||||||||||||||||||||||||||
| June 30, 2021 |
8.26 | % | 41.95 | % | 0.00 | % | 4.68 | % | 4.83 | % | 0.00 | % | 0.62 | % | 50.06 | % | $ | 0 | ||||||||||||||||||||||
| Peer Group |
||||||||||||||||||||||||||||||||||||||||
| Averages |
9.88 | % | 30.21 | % | 3.83 | % | 6.17 | % | 13.95 | % | 5.25 | % | 3.44 | % | 66.52 | % | $ | 2,244 | ||||||||||||||||||||||
| Medians |
6.82 | % | 26.29 | % | 3.36 | % | 4.40 | % | 14.08 | % | 4.12 | % | 0.74 | % | 64.57 | % | $ | 516 | ||||||||||||||||||||||
| Peer Group |
||||||||||||||||||||||||||||||||||||||||
| Chesapeake Bank of Maryland |
MD | 4.82 | % | 26.92 | % | 6.15 | % | 3.58 | % | 19.76 | % | 0.00 | % | 0.11 | % | 57.72 | % | $ | 0 | |||||||||||||||||||||
| Cincinnati Federal |
OH | 3.67 | % | 45.07 | % | 2.43 | % | 19.91 | % | 14.92 | % | 0.20 | % | 0.14 | % | 77.14 | % | $ | 2,716 | |||||||||||||||||||||
| Mid-Southern Savings Bank, F.S.B. |
IN | 16.17 | % | 25.66 | % | 2.34 | % | 3.31 | % | 7.69 | % | 2.89 | % | 0.62 | % | NA | $ | 0 | ||||||||||||||||||||||
| First Federal Bank of Wisconsin |
WI | 8.68 | % | 14.57 | % | 3.09 | % | 10.37 | % | 23.79 | % | 5.01 | % | 0.13 | % | 63.00 | % | $ | 0 | |||||||||||||||||||||
| West View Savings Bank |
PA | 24.08 | % | 20.60 | % | 0.96 | % | 1.01 | % | 1.14 | % | 0.00 | % | 0.01 | % | 57.93 | % | $ | 0 | |||||||||||||||||||||
| Generations Bank |
NY | 0.35 | % | 34.21 | % | 0.00 | % | 0.11 | % | 5.96 | % | 3.51 | % | 30.90 | % | 75.18 | % | $ | 18 | |||||||||||||||||||||
| Huntingdon Valley Bank |
PA | 2.45 | % | 40.23 | % | 5.64 | % | 2.87 | % | 7.34 | % | 18.06 | % | 0.85 | % | 59.53 | % | $ | 3,104 | |||||||||||||||||||||
| Elmira Savings Bank |
NY | 0.73 | % | 47.16 | % | 0.78 | % | 5.79 | % | 10.37 | % | 4.87 | % | 4.56 | % | 59.27 | % | $ | 1,543 | |||||||||||||||||||||
| Envision Bank |
MA | 4.96 | % | 55.22 | % | 3.92 | % | 2.96 | % | 16.64 | % | 3.53 | % | 1.24 | % | 79.02 | % | $ | 15,375 | |||||||||||||||||||||
| Iroquois Federal Savings and Loan Association |
IL | 21.37 | % | 15.60 | % | 3.63 | % | 13.10 | % | 17.83 | % | 12.72 | % | 0.96 | % | NA | $ | 1,013 | ||||||||||||||||||||||
| Home Federal Savings Bank |
MN | 16.91 | % | 18.77 | % | 4.39 | % | 5.22 | % | 28.77 | % | 7.46 | % | 1.69 | % | 70.30 | % | $ | 3,160 | |||||||||||||||||||||
| Prudential Bank |
PA | 14.39 | % | 18.48 | % | 12.68 | % | 5.83 | % | 13.23 | % | 4.71 | % | 0.05 | % | 66.13 | % | $ | 0 | |||||||||||||||||||||
Note: Bank level data.
| Source: | S&P Global Market Intelligence and RP® Financial, LC. calculations. The information provided in this table has been obtained from sources we believe are reliable, but we cannot guarantee the accuracy or completeness of such information. |
Copyright (c) 2021 by RP® Financial, LC.
| RP® Financial, LC. | PEER GROUP ANALYSIS III.14 |
Credit Risk
Based on a comparison of credit quality measures, the Bank’s credit risk exposure was considered to be more favorable to that of the Peer Group. At the same time, the Peer Group’s assert quality is considered very strong and they in general, have a limited history of loan losses. As shown in Table 3.5, the Bank did not have any non-performing assets while the ratios of NPAs/Assets equaled 0.52% based on the median for the Peer Group and was 0.30% of assets adjusted to exclude performing restructured loans. As a result of the lack of NPAs, reserve coverage ratios for the Bank were not meaningful. However, while the ratio of reserves/loans was lower for the Bank in comparison to the Peer Group, based on ratios of 0.98% and 1.20%, respectively, the lower ratio reflects the more limited credit risk exposure for the Bank based on its credit quality and loan chargeoff history, and the low credit risk nature of the loan portfolio.
Interest Rate Risk
Table 3.6 reflects various key ratios highlighting the relative interest rate risk exposure of the Bank versus the Peer Group. In terms of balance sheet ratios, Colonial’s interest rate risk characteristics were considered to be similar to the Peer Group. The Bank’s equity-to-assets ratio was slightly higher than the Peer Group, while the IEA/IBL ratio fell within the range of the Peer Group average and median based on regulatory data as derived from S&P Global Market Intelligence, thereby indicating a similar dependence on the yield-cost spread to sustain the net interest margin for the Bank. The Bank reported a lower level of non-interest earning assets, which provides an indication of the earnings capabilities and interest rate risk of the balance sheet. On a pro forma basis, the infusion of stock proceeds can be expected to provide the Bank with improved balance sheet interest rate risk characteristics, with such ratios likely closer to those maintained by the Peer Group, particularly with respect to the increases that will be realized in the Bank’s equity-to-assets and IEA/IBL ratios.
| RP® Financial, LC. | PEER GROUP ANALYSIS III.15 |
Table 3.5
Credit Risk Measures and Related Information
Comparable Institution Analysis
As of June 30, 2021 or the Most Recent Date Available.
| REO/ Assets |
NPAs & 90+Del/ Assets (1) |
Adj NPAs & 90+Del/ Assets (2) |
NPLs/ Loans (3) |
Rsrves/ Loans HFI |
Rsrves/ NPLs (3) |
Rsrves/ NPAs & 90+Del (1) |
Net Loan Chargeoffs (4) |
NLCs/ Loans |
||||||||||||||||||||||||||||||||
| (%) | (%) | (%) | (%) | (%) | (%) | (%) | ($000) | (%) | ||||||||||||||||||||||||||||||||
| Colonial FSB |
||||||||||||||||||||||||||||||||||||||||
| June 30, 2021 |
0.00 | % | 0.00 | % | 0.00 | % | 0.00 | % | 0.98 | % | NM | NM | $ | 0 | 0.00 | % | ||||||||||||||||||||||||
| Peer Group |
||||||||||||||||||||||||||||||||||||||||
| Averages |
0.04 | % | 0.63 | % | 0.44 | % | 0.87 | % | 1.10 | % | 223.17 | % | 207.00 | % | $ | 120 | 0.05 | % | ||||||||||||||||||||||
| Medians |
0.00 | % | 0.52 | % | 0.30 | % | 0.65 | % | 1.20 | % | 93.84 | % | 93.84 | % | $ | 29 | 0.01 | % | ||||||||||||||||||||||
| Peer Group |
||||||||||||||||||||||||||||||||||||||||
| Chesapeake Bank of Maryland |
MD | 0.00 | % | 0.15 | % | 0.10 | % | 0.25 | % | 1.08 | % | 432.71 | % | 432.71 | % | $ | 0 | 0.00 | % | |||||||||||||||||||||
| Cincinnati Federal |
OH | 0.00 | % | 0.51 | % | 0.10 | % | 0.61 | % | 0.86 | % | 132.57 | % | 132.57 | % | $ | 0 | 0.00 | % | |||||||||||||||||||||
| Mid-Southern Savings Bank, F.S.B. |
IN | 0.04 | % | 0.75 | % | 0.41 | % | 1.56 | % | 1.43 | % | 91.59 | % | 86.71 | % | $ | 0 | 0.00 | % | |||||||||||||||||||||
| First Federal Bank of Wisconsin |
WI | 0.00 | % | 0.24 | % | 0.10 | % | 0.43 | % | 1.21 | % | 280.88 | % | 280.88 | % | $ | 377 | 0.19 | % | |||||||||||||||||||||
| West View Savings Bank |
PA | 0.00 | % | 0.00 | % | 0.00 | % | 0.00 | % | 0.69 | % | NA | NA | $ | 0 | 0.00 | % | |||||||||||||||||||||||
| Generations Bank |
NY | 0.01 | % | 1.80 | % | 1.05 | % | 2.36 | % | 0.68 | % | 28.96 | % | 28.84 | % | $ | 589 | 0.20 | % | |||||||||||||||||||||
| Huntingdon Valley Bank |
PA | 0.00 | % | 0.52 | % | 0.52 | % | 0.69 | % | 0.67 | % | 80.23 | % | 80.23 | % | $ | 555 | 0.14 | % | |||||||||||||||||||||
| Elmira Savings Bank |
NY | 0.00 | % | 0.95 | % | 0.77 | % | 1.29 | % | 1.23 | % | 93.84 | % | 93.84 | % | $ | 200 | 0.04 | % | |||||||||||||||||||||
| Envision Bank |
MA | 0.00 | % | 1.09 | % | 0.86 | % | 1.30 | % | 1.19 | % | 80.52 | % | 80.52 | % | $ | 59 | 0.01 | % | |||||||||||||||||||||
| Iroquois Federal Savings and Loan Association |
IL | 0.03 | % | 0.19 | % | 0.04 | % | 0.22 | % | 1.27 | % | 580.90 | % | 436.15 | % | $ | 465 | 0.09 | % | |||||||||||||||||||||
| Home Federal Savings Bank |
MN | 0.00 | % | 0.18 | % | 0.18 | % | 0.27 | % | 1.53 | % | 558.96 | % | 558.96 | % | -$ | 802 | -0.12 | % | |||||||||||||||||||||
| Prudential Bank |
PA | 0.34 | % | 1.13 | % | 1.13 | % | 1.44 | % | 1.35 | % | 93.70 | % | 65.54 | % | $ | 0 | 0.00 | % | |||||||||||||||||||||
| (1) | NPAs are defined as nonaccrual loans, performing TDRs, and OREO. |
| (2) | Adjusted NPAs are defined as nonaccrual loans and OREO (performing TDRs are excluded). |
| (3) | NPLs are defined as nonaccrual loans and performing TDRs. |
| (4) | Net loan chargeoffs are shown on a last twelve month basis. |
| Source: | S&P Global Market Intelligence and RP® Financial, LC. calculations. The information provided in this table has been obrained from sources we believe are reliable, but we cannot guarantee the accuracy or completeness of such information. |
Copyright (c) 2021 by RP® Financial, LC.
| RP® Financial, LC. | PEER GROUP ANALYSIS III.16 |
Table 3.6
Interest Rate Risk Measures and Net Interest Income Volatility
Comparable Institution Analysis
As of June 30, 2021 or the Most Recent Date Available.
| Balance Sheet Measures | ||||||||||||||||||||||||||||||||||||||||||||||
| Tangible Equity/ Assets |
Avg IEA/ Avg IBL |
Non-Earn. Assets/ Assets |
Quarterly Change in Net Interest Income | |||||||||||||||||||||||||||||||||||||||||||
| 3/31/2021 | 12/31/2020 | 9/30/2020 | 6/30/2020 | 3/31/2020 | 12/31/2019 | |||||||||||||||||||||||||||||||||||||||||
| (%) | (%) | (%) | (change in net interest income is annualized in basis points) | |||||||||||||||||||||||||||||||||||||||||||
| Colonial FSB |
||||||||||||||||||||||||||||||||||||||||||||||
| 6/30/2021 |
14.4 | % | 126.5 | % | 4.6 | % | 6 | 6 | -14 | -16 | -9 | -2 | ||||||||||||||||||||||||||||||||||
| All Public Savings Institutions |
||||||||||||||||||||||||||||||||||||||||||||||
| Average |
11.6 | % | 136.1 | % | 7.1 | % | (5 | ) | 8 | (0 | ) | (14 | ) | (3 | ) | (6 | ) | |||||||||||||||||||||||||||||
| Median |
GA | 10.8 | % | 134.9 | % | 6.7 | % | (5 | ) | 10 | (1 | ) | (12 | ) | (4 | ) | (5 | ) | ||||||||||||||||||||||||||||
| Comparable Group |
||||||||||||||||||||||||||||||||||||||||||||||
| Average |
13.0 | % | 134.1 | % | 7.4 | % | -6 | 4 | -8 | -6 | -2 | -10 | ||||||||||||||||||||||||||||||||||
| Median |
11.2 | % | 131.7 | % | 6.7 | % | -2 | 11 | -7 | -7 | -2 | -11 | ||||||||||||||||||||||||||||||||||
| Comparable Group |
||||||||||||||||||||||||||||||||||||||||||||||
| CBMB |
CBM Bancorp, Inc. | MD | 20.1 | % | 147.9 | % | 6.7 | % | NA | 13 | -24 | -23 | -2 | -14 | ||||||||||||||||||||||||||||||||
| CNNB |
Cincinnati Bancorp, Inc. | OH | 17.1 | % | 124.8 | % | 9.4 | % | NA | -2 | -10 | 1 | 3 | -29 | ||||||||||||||||||||||||||||||||
| MSVB |
Mid-Southern Bancorp, Inc. | IN | 19.7 | % | 138.6 | % | 4.7 | % | NA | 1 | 2 | -27 | -16 | -2 | ||||||||||||||||||||||||||||||||
| FFBW |
FFBW, Inc. | WI | NA | 164.2 | % | 9.5 | % | NA | -3 | -2 | 26 | -18 | -5 | |||||||||||||||||||||||||||||||||
| WVFC |
WVS Financial Corp. | PA | 11.1 | % | NA | NA | -14 | -2 | -10 | -15 | -5 | -16 | ||||||||||||||||||||||||||||||||||
| GBNY |
Generations Bancorp NY, Inc. | NY | 10.8 | % | 101.1 | % | 10.6 | % | 22 | 7 | -1 | 4 | 5 | -17 | ||||||||||||||||||||||||||||||||
| HVBC |
HV Bancorp, Inc. | PA | 7.6 | % | 120.1 | % | -0.7 | % | NA | -65 | -11 | 23 | 5 | NA | ||||||||||||||||||||||||||||||||
| ESBK |
Elmira Savings Bank | NY | 7.9 | % | 107.8 | % | 23.2 | % | 4 | 36 | -30 | -30 | 15 | 8 | ||||||||||||||||||||||||||||||||
| RNDB |
Randolph Bancorp, Inc. | MA | 13.5 | % | 141.0 | % | 7.0 | % | 1 | 18 | -7 | -5 | 3 | -9 | ||||||||||||||||||||||||||||||||
| IROQ |
IF Bancorp, Inc. | (1 | ) | IL | 11.2 | % | 117.7 | % | 5.6 | % | -5 | 11 | -2 | 1 | 11 | -12 | ||||||||||||||||||||||||||||||
| HMNF |
HMN Financial, Inc. | MN | 10.9 | % | 156.0 | % | 2.8 | % | -25 | 11 | -11 | -18 | -4 | -20 | ||||||||||||||||||||||||||||||||
| PBIP |
Prudential Bancorp, Inc. | PA | 11.2 | % | 114.0 | % | 2.8 | % | 10 | 13 | 4 | -7 | -15 | -4 | ||||||||||||||||||||||||||||||||
| PVBC |
Provident Bancorp, Inc. | MA | 14.6 | % | 175.9 | % | 6.7 | % | -40 | 19 | 5 | -13 | -13 | 2 | ||||||||||||||||||||||||||||||||
NA=Change is greater than 100 basis points during the quarter.
| (1) | As of March 31, 2021 or the latest date available. |
Source: S&P Global Market Intelligence and RP® Financial, LC. calculations. The information provided in this table has been obtained from sources we believe are reliable, but we cannot guarantee the accuracy or completeness of such information.
Copyright (c) 2021 by RP® Financial, LC.
| RP® Financial, LC. | PEER GROUP ANALYSIS III.17 |
To analyze interest rate risk associated with the net interest margin, we reviewed quarterly changes in net interest income as a percent of average assets for Colonial and the Peer Group. The relative fluctuations in the Bank’s net interest income to average assets ratio were considered to be modestly higher than the Peer Group and, thus, based on the interest rate environment that prevailed during the period analyzed in Table 3.6, Colonial was viewed as maintaining a higher degree of interest rate risk exposure in the net interest margin. The stability of the Bank’s net interest margin should be enhanced by the infusion of stock proceeds, as the increase in capital will reduce the level of interest rate sensitive liabilities funding Colonial’s assets.
Summary
Based on the above analysis, RP Financial concluded the Peer Group forms a reasonable basis for determining the pro forma market value of the Bank. Such general characteristics as asset size, capital position, interest-earning asset composition, funding composition, core earnings measures, loan composition, credit quality and exposure to interest rate risk all tend to support the reasonability of the Peer Group from a financial standpoint. Those areas where differences exist will be addressed in the form of valuation adjustments to the extent necessary.
| RP® Financial, LC. | VALUATION ANALYSIS IV.1 |
IV. VALUATION ANALYSIS
Introduction
This chapter presents the valuation analysis and methodology prepared pursuant to the regulatory guidelines, and valuation adjustments and assumptions used to determine the estimated pro forma market value of the common stock to be issued in conjunction with the Company’s minority stock offering.
Appraisal Guidelines
The federal regulatory appraisal guidelines required by the OCC, FRB, the FDIC and state banking agencies specify the pro forma market value methodology for estimating the pro forma market value of an institution. Pursuant to this methodology: (1) a peer group of comparable publicly-traded institutions is selected; (2) a financial and operational comparison of the subject company to the peer group is conducted to discern key differences; and (3) a valuation analysis in which the pro forma market value of the subject company is determined based on the market pricing of the peer group as of the date of valuation, incorporating valuation adjustments for key differences. In addition, the pricing characteristics of recent conversions, both at conversion and in the aftermarket, must be considered. Given the unique differences in the pricing characteristics of publicly-traded MHCs relative to fully-converted thrift stocks, we have also reviewed the pricing characteristics of publicly-traded MHCs on a fully-converted basis.
RP Financial Approach to the Valuation
The valuation analysis herein complies with such regulatory approval guidelines. Accordingly, the valuation incorporates a detailed analysis based on the Peer Group, discussed in Chapter III, which constitutes “fundamental analysis” techniques. Additionally, the valuation incorporates a “technical analysis” of recently completed conversions, including closing pricing and aftermarket trading of such offerings. It should be noted that these valuation analyses cannot possibly fully account for all the market forces which impact trading activity and pricing characteristics of a stock on a given day.
The pro forma market value determined herein is a preliminary value for the Company’s to-be-issued stock. Throughout the stock issuance process, RP Financial will: (1) review changes in the Bank’s operations and financial condition; (2) monitor the Bank’s operations and
| RP® Financial, LC. | VALUATION ANALYSIS IV.2 |
financial condition relative to the Peer Group to identify any fundamental changes; (3) monitor the external factors affecting value including, but not limited to, local and national economic conditions, interest rates and the stock market environment, including the market for thrift stocks; and, (4) monitor pending conversion offerings, both regionally and nationally. If material changes should occur prior to the close of the offering, RP Financial will evaluate if updated valuation reports should be prepared reflecting such changes and their related impact on value, if any. RP Financial will also prepare a final valuation update at the closing of the offering to determine if the prepared valuation analysis and resulting range of value continues to be appropriate.
The appraised value determined herein is based on the current market and operating environment for the Bank and for all thrifts. Subsequent changes in the local and national economy, the legislative and regulatory environment, the stock market, interest rates, and other external forces (such as natural disasters or major world events), which may occur from time to time (often with great unpredictability) may materially impact the market value of all thrift stocks, including CFSB Bancorp’s value, the market value of the stocks of public MHC institutions, or CFSB Bancorp’s value alone. To the extent a change in factors impacting the Company’s value can be reasonably anticipated and/or quantified, RP Financial has incorporated the estimated impact into its analysis.
Valuation Analysis
A fundamental analysis discussing similarities and differences relative to the Peer Group was presented in Chapter III. The following sections summarize the key differences between the Bank and the Peer Group and how those differences affect the pro forma valuation. Emphasis is placed on the specific strengths and weaknesses of the Bank relative to the Peer Group in such key areas as financial condition, profitability, growth and viability of earnings, asset growth, primary market area, dividends, liquidity of the shares, marketing of the issue, management, and the effect of government regulations and/or regulatory reform. We have also considered the market for thrift stocks, in particular new issues, to assess the impact on value of CFSB Bancorp coming to market at this time.
| 1. | Financial Condition |
The financial condition of an institution is an important determinant in pro forma market value because investors typically look to such factors as liquidity, capital, asset composition and
| RP® Financial, LC. | VALUATION ANALYSIS IV.3 |
quality, and funding sources in assessing investment attractiveness. The similarities and differences in the Bank’s and the Peer Group’s financial strengths are noted as follows:
| • | Overall A/L Composition. Loans funded by retail deposits were the primary components of both Colonial’s and the Peer Group’s balance sheets. In comparison to the Peer Group, the Bank’s interest-earning asset composition exhibited a lower concentration of loans and a lower level of diversification into high risk-weight loans, both of which have limited the Bank’s asset yields and overall earnings while minimizing its credit risk exposure as well. Colonial’s funding composition was similar to the Peer Group as both funded operations primarily with deposits and the level of borrowings was small for the Peer Group and minimal for the Bank. Overall, as a percent of assets, the Bank maintained a higher level of interest-earning assets and a higher level of interest-bearing liabilities relative to the comparable ratios for the Peer Group, which translated into a lower IEA/IBL ratio for Colonial. After factoring in the impact of the net stock proceeds, the Bank’s IEA/IBL ratio will be comparable to the Peer Group’s IEA/IBL ratio. On balance, RP Financial concluded that the lower level of loans and focus on residential mortgage lending with their lower yield potential was a negative factor in our adjustment for financial condition in relation to the Peer Group. |
| • | Credit Quality. The Bank has not had any non-performing assets over the last several years which is indicative of very strong credit quality. At the same time, the Peer Group operates with very low credit quality and limited NPAs and loan chargeoffs, albeit not at the Bank’s nominal level. Additionally, RP Financial gave consideration to the fact that while the Peer Group had greater credit risk exposure, the level of allowance for loan and lease losses were also higher as a percentage of total loans. Overall, RP Financial concluded that credit quality was a neutral factor in our adjustment for financial condition. |
| • | Balance Sheet Liquidity. The Bank maintained a higher level of cash and investment securities than the Peer Group. At the same time, the substantial majority of the investment securities portfolio which is also larger are classified as held-to-maturity limiting the ability to generate liquidity over the short term. Following the infusion of stock proceeds, the Bank’s cash and investments ratio is expected to increase as a portion of the net proceeds will initially be held in short-term liquid funds. The Bank’s future borrowing capacity was considered to be similar to the Peer Group’s borrowing capacity, as the level of borrowings was modest for both. Overall, RP Financial concluded that balance sheet liquidity was a slight positive factor in our adjustment for financial condition. |
| • | Funding Liabilities. The Bank’s interest-bearing funding composition reflected a slightly higher concentration of deposits and a lower concentration of borrowings relative to the comparable Peer Group median ratios, but were broadly comparable overall. Overall, RP Financial concluded that funding liabilities were a neutral factor in our adjustment for financial condition. |
| • | Equity. The Peer Group currently operates with a lower equity-to-assets ratio than the Bank, even on a pre-conversion basis. Accordingly, following the stock offering, CFSB Bancorp’s pro forma capital position will exceed the Peer Group’s figures by a greater amount. On balance, RP Financial concluded that equity strength was a positive factor in our adjustment for financial condition. |
| RP® Financial, LC. | VALUATION ANALYSIS IV.4 |
On balance, Colonial’s balance sheet strength was considered to be modestly greater than the Peer Group’s balance sheet strength and, thus, a slight upward adjustment was applied for the Bank’s financial condition.
| 2. | Profitability, Growth and Viability of Earnings |
Earnings are a key factor in determining pro forma market value, as the level and risk characteristics of an institution’s earnings stream and prospects to generate future earnings heavily influence the multiple that the investment community will pay for earnings. The major factors considered in the valuation are described below.
| • | Reported Earnings. The Bank’s reported earnings were lower than the Peer Group’s on a ROAA basis (0.42% of average assets versus a median 0.73% of average assets for the Peer Group). As noted in the Peer Group analysis in Section Three, the lower earnings were primarily attributable to the relatively low level of net interest and non-interest income reflective of the Bank’s traditional thrift business model which involved residential mortgage lending for portfolio. While Colonial benefited from a comparatively low level of operating expenses which resulted from its thrift oriented operating strategy, it was insufficient to offset the higher net interest and non-income generated by the Peer Group. Overall, the Bank’s reported earnings were considered to be less favorable than the Peer Group’s reported earnings and, thus, RP Financial concluded that this was a negative factor in our adjustment for profitability, growth and viability of earnings. |
| • | Core Earnings. The Bank did not have any non-operating or otherwise unusual items in its earnings for the most recent twelve month period. Accordingly, reported and core earnings were equivalent. While non-operating items were also limited for the Peer Group, gains on the sale of loans which are considered to entail greater volatility than earnings generated through typical sources of non-interest income were a material component of the Peer Group’s earnings (0.85% of average assets based on the average and 0.13% of average assets based on the median). Overall, in evaluating the Bank’s core earnings in relation to the Peer Group, we considered that Colonial’s core earnings will remain below the Peer Group average and median even after the expected earnings benefit from deployment of the proceeds which will be diminished by expenses associated with the stock benefit plans and operating as a publicly-traded company. Overall, RP Financial considered that reported and core earnings were very similar and thus, RP Financial concluded that this was a negative factor in our adjustment for profitability, growth and viability of earnings. |
| • | Interest Rate Risk. Quarterly changes in the Bank’s and the Peer Group’s net interest income to average assets ratios indicated that a modestly greater degree of volatility was associated with Colonial’s net interest margin. Other measures of interest rate risk, such as IEA/IBL ratios and levels of non-interest earning assets were more favorable for the Bank. On a pro forma basis, the infusion of stock proceeds can be expected to provide the Bank with equity-to-assets and IEA/ILB ratios that are more favorable or comparable to the Peer Group’s ratios, as well as |
| RP® Financial, LC. | VALUATION ANALYSIS IV.5 |
| enhance the stability of the Bank’s net interest margin. Accordingly, on balance, interest rate risk was a neutral factor in our adjustment for profitability, growth and viability of earnings. |
| • | Credit Risk. The impact of future credit losses is considered to be nominal for the Bank and only marginally higher for the Peer Group, primarily reflecting the greater inherent risk in their higher risk-weight loan portfolios which included a higher level of commercial mortgage and non-mortgage loans as well as multi-family and construction loans. Overall, RP Financial concluded that credit risk was a slight positive factor in our adjustment for profitability, growth and viability of earnings for the Bank, the upward assessment was mitigated by the fact that the Peer Group also maintained very strong asset quality and had a limited history of credit-related losses. |
| • | Earnings Growth Potential. Several factors were considered in assessing earnings growth potential. First, the Bank currently maintains lower yields and spread than the Peer Group, which would tend to a continuation of the Bank’s lower net interest margin going forward. Second, the infusion of stock proceeds will provide the Bank with for favorable growth potential through leverage as currently maintained by the Peer Group. At the same time, the Bank has had ample capacity to grow in the recent past and has been unable to achieve meaningful assets growth. Overall, earnings growth potential was considered to be similar to the Peer Group notwithstanding the Bank’s stronger pro forma capital position and thus, earnings growth potential was a neutral factor in our adjustment for profitability, growth and viability of earnings. |
| • | Return on Equity. Currently, the Bank‘s core ROE is lower than the Peer Group’s core ROE. As the result of the increase in equity that will be realized from the infusion of net stock proceeds into the Company’s equity, the Company’s pro forma return equity on a core earnings basis will be lower than the Peer Group’s core ROE. Accordingly, this was a negative factor in the adjustment for profitability, growth and viability of earnings. |
On balance, CFSB Bancorp’s pro forma earnings strength was considered to be less favorable than the Peer Group’s and, thus, a moderate downward adjustment was applied for profitability, growth and viability of earnings.
| 3. | Asset Growth |
Comparative asset growth rates for the Bank and the Peer Group showed a 9.75% annual increase in the Bank’s assets over the most recent 12 month period, versus average and median increases of 7.88% and 6.55% over the most recent 12 month period for the Peer Group. Importantly, the fiscal stimulus in the COVID pandemic environment has resulted in an influx of funds for many financial institutions in excess of loan demand. In this regard, the Bank’s loan portfolio shrank by 3% in the most recent fiscal year while the Peer Group realized growth of less than 1% over the corresponding timeframe. Overall, the Bank’s recent asset growth trends would
| RP® Financial, LC. | VALUATION ANALYSIS IV.6 |
tend to be viewed as comparable relative to the Peer Group’s asset growth trends in terms of supporting future earnings growth. On a pro forma basis, the Bank’s tangible equity-to-assets ratio will be higher than the Peer Group’s tangible equity-to-assets ratio, providing the Bank with greater leverage capacity as maintained by the Peer Group. On balance, no adjustment was applied for asset growth.
| 4. | Primary Market Area |
The general condition of an institution’s market area has an impact on value, as future success is in part dependent upon opportunities for profitable activities in the local market served. Colonial serves the Boston Metropolitan Areas focusing on areas south of Boston in Norfolk County, Massachusetts through the headquarters office and three full-service branches. Within this market, the Bank faces significant competition for loans and deposits from both community-based institutions and larger regional financial institutions, which provide a broader array of services and have significantly larger branch networks. However, the Peer Group companies by virtue of their relatively comparable size relative to Colonial also face numerous and/or large competitors.
Demographic and economic trends and characteristics in the Bank’s primary market area are presented in Exhibit III-3 along with Peer Group comparable data. In this regard, the total population of Norfolk County is slightly higher than the average and median primary market areas of the Peer Group. In addition, the historical and projected population growth rate in Norfolk County is slightly higher than the Peer Group average over the 2015-2021 and 2021-2026 periods. While these demographic trends are slightly more favorable for the Bank, the per capita income level in Norfolk County ($60,544 as of 2021) is well above the average and median of the Peer Group’s markets. As a percentage of the state average, Norfolk County is also above the average and median of the Peer Group. The deposit market share exhibited by the Bank in Norfolk County is below the Peer Group average and median, indicative of the larger market within which the Bank operates, while several of the Peer Group members operate in smaller demographic areas. As shown in Table 4.1, the average unemployment rate for the primary market area counties served by the Peer Group companies was modestly higher than the unemployment rate reflected for Norfolk County. On balance, we concluded that a slight upward adjustment was appropriate for the Bank’s market area.
| RP® Financial, LC. | VALUATION ANALYSIS IV.7 |
Table 4.1
Peer Group Market Area Unemployment Rates
Colonial FSB
| County |
Unemployment Rate June 2021 |
|||||
| Colonial Bancorp, Inc. |
Norfolk, MA | 4.9 | % | |||
| Peer Group Average |
5.4 | % | ||||
| Peer Group |
||||||
| CBM Bancorp, Inc. |
Baltimore, MD | 6.5 | % | |||
| Cincinnati Bancorp, Inc. |
Hamilton, OH | 6.1 | % | |||
| Elmira Savings Bank |
Chemung, NY | 5.6 | % | |||
| FFBW, Inc. |
Waukesha, WI | 3.8 | % | |||
| Generations Bancorp NY, Inc. |
Seneca, NY | 5.1 | % | |||
| HMN Financial, Inc. |
Olmsted, MN | 3.7 | % | |||
| HV Bancorp, Inc. |
Bucks, PA | 5.3 | % | |||
| IF Bancorp, Inc. |
Iroquois, IL | 4.7 | % | |||
| Mid-Southern Bancorp, Inc. |
Washington, IN | 4.0 | % | |||
| Prudential Bancorp, Inc. |
Philadelphia, PA | 9.4 | % | |||
| Randolph Bancorp, Inc. |
Norfolk, MA | 4.9 | % | |||
| WVS Financial Corp. |
Allegheny, PA | 6.0 | % | |||
Source: S&P Global Market Intelligence.
| 5. | Dividends |
At this time the Company has not established a dividend policy. Future declarations of dividends by the Board of Directors will depend upon a number of factors, including investment opportunities, growth objectives, financial condition, profitability, tax considerations, minimum capital requirements, regulatory limitations, stock market characteristics and general economic conditions.
Five out of the twelve Peer Group companies pay regular cash dividends, with implied dividend yields ranging from 0.78% to 4.33`%. The average dividend yield on the stocks of the Peer Group institutions equaled 2.23% as of August 20, 2021, reflecting the yield of the five
| RP® Financial, LC. | VALUATION ANALYSIS IV.8 |
companies which have a regular dividend policy. Comparatively, as of August 20, 2021, the average dividend yield on the stocks of all fully-converted publicly-traded thrifts equaled 2.16%.
Our valuation adjustment for dividends for CFSB Bancorp also considered the regulatory policy with regard to payment of dividends to the MHC. Under current FRB policy, any dividends declared by the Company would be required to be paid to all shareholders. Accordingly, dividends paid by the Company would increase the amount of assets held by the MHC, after adjusting for applicable income taxes, and, thereby, increase the implied dilution incurred by the minority shareholders in a second-step conversion pursuant to the calculation to account for net assets held by the MHC in a second-step offering.
Overall, while the Company has not established a definitive dividend policy prior to its stock offering, the Company’s capacity to pay a dividend comparable to the Peer Group’s average dividend yield is viewed as not as strong based on the Company’s pro forma earnings. Furthermore, dividend payments retained by the MHC would increase the implied dilution to minority shareholders in a second-step offering, whereas the fully converted peer group companies do not have this issue. On balance, we concluded that a slight downward adjustment was warranted for purposes of the Company’s dividend policy.
| 6. | Liquidity of the Shares |
The Peer Group is by definition composed of companies that are traded in the public markets. All ten of the Peer Group members trade on the NASDAQ system. Typically, the number of shares outstanding and market capitalization provides an indication of how much liquidity there will be in a particular stock. The market capitalization of the Peer Group companies ranged from $25.3 million to $109.9 million as of August 20, 2021, with average and median market values of $61.2 million and $48.8 million, respectively. The shares issued and outstanding of the Peer Group companies ranged from 1.7 million to 7.8 million, with average and median shares outstanding of 3.8 million and 4.0 million, respectively. The Company’s stock offering is expected to have a pro forma public market value that will be less than the lower end of the Peer Group’s range of market values and also be less than the lower end of the range of shares outstanding reported for the Peer Group companies.
Similar to the Peer Group companies, the Company’s stock will not be quoted on the NASDAQ following the stock offering. Overall, we anticipate that the Company’s public stock will have slightly more limited liquidity than the Peer Group based on the market value and shares
| RP® Financial, LC. | VALUATION ANALYSIS IV.9 |
outstanding of the public shares. Accordingly, we concluded that a slight downward adjustment was necessary for this factor.
| 7. | Marketing of the Issue |
Three separate markets exist for thrift stocks: (1) the after-market for public companies, both fully-converted stock companies and MHCs, in which trading activity is regular and investment decisions are made based upon financial condition, earnings, capital, ROE, dividends and future prospects; (2) the new issue market in which converting thrifts are evaluated on the basis of the same factors but on a pro forma basis without the benefit of prior operations as a publicly-held company and stock trading history; and (3) the thrift acquisition market. All three of these markets were considered in the valuation of the Company’s to-be-issued stock.
| A. | The Public Market |
The value of publicly-traded thrift stocks is easily measurable, and is tracked by most investment houses and related organizations. Exhibit IV-1 provides pricing and financial data on all publicly-traded thrifts. In general, thrift stock values react to market stimuli such as interest rates, inflation, perceived industry health, projected rates of economic growth, regulatory issues and stock market conditions in general. Exhibit IV-2 displays historical stock market trends for various indices and includes historical stock price index values for thrifts and commercial banks. Exhibit IV-3 displays various stock price indices as of August 20, 2021.
In terms of assessing general stock market conditions, the performance of the overall stock market has generally shown an upward trend in recent quarters. Stocks traded lower at the start of the fourth quarter of 2020, as investors reacted to the September employment report that showed job growth was less than expected. News of President Trump’s improving health propelled stocks higher at the beginning of the second week of October, which was followed by a one-day sell-off caused by a halt in negotiations for a new economic relief package. Stocks rallied higher following the one-day sell-off on revived hopes for a new stimulus deal, as Democratic and White House negotiators resumed negotiations for a coronavirus relief bill. Mixed earnings reports at the start of the third quarter earnings season pressured stocks lower going into mid-October. The sell-off in the broader stock market sharpened during the second half of October, as a surge in coronavirus cases added to worries about the economic outlook in the absence of a stimulus deal. Better-than-expected economic data for third quarter GDP growth and October manufacturing activity contributed to stocks rallying ahead of the election in early-November. The
| RP® Financial, LC. | VALUATION ANALYSIS IV.10 |
stock market rallied continued on Election Day and the following day, as Wall Street reacted to election results that indicated a Biden presidency gridlocked by a Republican-controlled Senate. News of promising results for two Covid-19 vaccines bolstered stock markets gains through the end of November, which included the DJIA closing above 30000 for the first time. Overall, for the month of November, the DJIA increased 12%, marking its best month since January 1987, while the NASDAQ and S&P 500 posted respective gains of 12% and 11%. Signs of progress on a stimulus relief package and the effectiveness rates for the forthcoming Covid-19 vaccines helped to sustain the broader stock market rally through the first week of December, with the NASDAQ and S&P 500 closing at new record highs. Stocks retreated going into mid-December, as negotiations over a coronavirus relief package stalled. As Congress neared a deal on a new coronavirus relief package, all three major U.S. stock indexes closed at record highs going into the second half of December. Stocks paused after closing at new record highs, as Covid-19 concerns overshadowed Congress’s approval of a coronavirus relief package. All three major U.S. stock indexes closed at record highs in the final week of 2020, as the rollout of the coronavirus vaccine and passage of a new stimulus package buoyed investors’ sentiment.
A wave of new Covid-19 infections prompted a sell-off in the broader stock at the at the start of 2021, which was followed by stocks rallying higher on expectations that there would be a big boost in government spending under a Democrat-controlled Senate. Stocks fell in mid-January, as initial jobless claims posted their biggest weekly increase since the Covid-19 pandemic hit in March. After all three major U.S. stock indexes closed at record highs going into the second half of January, all three major U.S. stock indexes suffered their sharpest losses in late-January amid concerns about how effectively the Covid-19 vaccine was being distributed. Robust fourth quarter earnings posted by some large-cap stocks and a decline in initial jobless claims for a third straight week contributed to stocks rallying higher in the first week of February. All three major U.S. stock indexes closed at record highs going into mid-February, as expectations of a new round of stimulus aid, strong corporate earnings and progress with the rollout of the Covid-19 vaccine fueled stock market gains. The DJIA closed at a new record high at the conclusion of the Federal Reserve’s policy meeting on February 24th, as the Federal Reserve signaled that it was committed to keeping east-monetary policies unchanged. Led by a decline in technology shares, stocks retreated at the end of February on inflation concerns and rising Treasury yields. The DJIA surged to several record highs during the first half of March, as investors rotated into cyclical stocks following a stronger-than-expected employment report for February and progress on a new stimulus bill. Comparatively, with long-term Treasury yields
| RP® Financial, LC. | VALUATION ANALYSIS IV.11 |
continuing to rise, the NASDAQ fell into correction territory in the second week of March. After the Federal Reserve pledged to maintain its easy-money policies, the DJIA closed above 33000 for the first time heading into the second half of March. As long-term Treasury yields continued to rise, technology and other high growth stocks experienced further selling pressure heading into the second half of March. Stocks retreated going into late-March and then rallied on signs that the U.S. economy was positioned for a period of rapid growth. For the first quarter overall, the DJIA was up 7.8%, the S&P 500 gained 5.8% and the NASDAQ added 2.8%.
Led by rebound in technology stocks, the S&P 500 closed above 4000 for the first time at the start of the second quarter of 2021. March jobs data, which showed stronger-than-expected job growth, and a rebound in March service sector activity powered the DJIA and S&P 500 to record highs in the second week of April, as investors bet that economic growth would pick up with more people getting Covid-19 vaccines and increased government spending. Some strong first quarter earnings reports pushed the DJIA and S&P 500 to more record highs in mid-April, which was followed by stocks trading lower across all sectors heading into the second half of April. Stocks traded unevenly heading into the last week of April, as investors weighed fresh evidence that a strong economic recovery was underway against rising Covid-19 infection levels in some countries and consideration by the Biden administration to raise capital gain taxes. For the month of April, the DJIA, S&P 500 and NASDAQ posted monthly gains of 2.7%, 5.2% and 5.4% respectively.
Economically sensitive shares led the stock market higher at the start of May, as investors reacted to data showing economic growth was picking up and continuation of a strong earnings season. A lackluster April jobs report sparked a rebound in technology shares and other growth stocks, while the DJIA and S&P 500 closed at record highs on May 7th. Stock market turbulence prevailed heading into mid-May, with the broader stock market selling off after a sharp increase in April consumer prices heightened inflation concerns and then ended the week rallying higher. Economically sensitive shares led the market lower going in the second half of May, as the Federal Reserve signaled an eventual shift away from its easy-money pandemic policies amid evidence of mounting inflation and a robust economic recovery. Two consecutive weeks of initial weekly jobless claims hitting new pandemic lows contributed to stocks rallying in late-May, with the DJIA and S&P 500 recording gains for the month of May versus a slight decline in the NASDAQ and, thereby, snapping a six-month winning streak.
| RP® Financial, LC. | VALUATION ANALYSIS IV.12 |
Stocks closed out the first week of June 2021 edging higher after the May employment report showed the labor market continued its slow recovery. Losses in the financial, industrial and consumer sectors weighed on the broader stock market heading into mid-June, as investors balanced their confidence in the economy reopening against the risks of rising inflation, supply-chain problems and the possibility of higher taxes. Rate-hike worries fueled a sell-off following the Federal Reserve’s mid-June policy meeting, in which the Federal Reserve signaled that they expected to raise interest rates by late-2023, sooner than they had previously anticipated. Stocks rebounded in the second half of June, with the major U.S. stock indexes closing out the second quarter at or near record highs driven by data signaling acceleration in the world economy and optimism over additional fiscal stimulus in the form of a $1 trillion infrastructure plan.
All three major U.S. stock indexes closed at new highs at the start of the third quarter of 2021, as the June jobs report confirmed that the U.S. economy continued to recover at a healthy clip. Concerns about inflation and the rapid spread of the Covid-19 Delta variant contributed to snapping a three-week winning streak for U.S. stocks in mid-July. A string of strong second quarter earnings reports helped stocks rebound to new highs heading into late-July, with all three major U.S. stock indexes finishing with gains for the month of July. A generally positive trend in the broader stock market was sustained through the first week of August, as the July employment report indicated that the economy was continuing to rebound. Passage of an infrastructure bill by the Senate and generally strong second quarter earnings helped to propel the Dow Jones Industrial Average (“DJIA”) and S&P 500 to more record highs in the second week of August. On August 20, 2021, the DJIA closed at 35120.08 or 14.7% higher since the beginning of the year and the NASDAQ closed at 14714.66 or 14.8% higher since the beginning of the year.
The market for thrift stocks has also generally been positive in recent quarters. The positive trend in thrift stocks realized since the market selloff with the emergence of the COVID-19 pandemic continued into the latter half of 2020 with trends reflecting the markets expectations regarding earnings and inflation. Despite better-than-expected third quarter earnings results posted by some big banks at the start of the third quarter earnings season, financial shares traded lower in mid-October. Financial shares rallied going into late-October, as news that weekly initial jobless claims fell by 55,000 pushed the 10-year Treasury yield up to 0.85%. Financial shares sold-off along with the broader stock market during the last week of October, as rising coronavirus cases shook investors’ confidence in the economic recovery.
| RP® Financial, LC. | VALUATION ANALYSIS IV.13 |
Financial shares also participated in the broader stock market rally during the first two trading days of November and on Election Day, but then diverged from the broader stock market rally the day following the election as investors bet that the election results and a potentially long period of vote counting would delay and potentially reduce another round of stimulus. Amid building hopes that drug-makers were on the brink of pushing out vaccines effective enough to fight the coronavirus, economically sensitive stocks, such as bank stocks, were among the strongest performing sectors for the balance of November. After trading lower on last day of November, the positive trend in thrift stocks resumed through the first half of December on signs of a progress in negotiations over a coronavirus relief package. Amid a surge in coronavirus infections and the Federal Reserve leaving its benchmark interest rate near zero, thrift shares edged lower going into final week of 2020 and then rebounded in the last week of 2020 after President Trump signed a Covid-19 relief bill.
Thrift shares traded flat at the start of 2021 and then rallied higher in the second week of January on expectations of additional stimulus after Democrats took control of the Senate. Thrift shares reversed course and trended lower in the second half of January on concerns over the lingering economic impact of the coronavirus and related impact on loan demand and credit quality. A decline in coronavirus cases across the U.S. helped thrift shares to rebound in the first week of February. Expectations of more stimulus, some positive economic reports and rising bond yields contributed to thrift shares trading higher going into late-February. After trading lower in late-February on inflation concerns, thrift shares rallied during the first half of March. The SNL Thrift Index for all publicly-traded thrifts was up 9.1% during the first half of March, as investors rotated into economically shares on signs that the U.S. economy was gaining traction in light of the favorable jobs report for March, the signing of a $1.9 trillion relief package and more people getting vaccinated. Thrift shares pulled back towards the close of the first quarter on concerns about the strength of the economic recovery, the Federal Reserve’s ending of a yearlong reprieve that eased capital requirements for big banks and a large investment fund unwound billions of dollars in holdings.
Strong job growth reflected in the March employment data and an improving economic outlook propelled thrift stocks higher at the start of the second quarter of 2021. Despite favorable first quarter earnings posted by Wall Street’s big banks, financial shares edged lower in mid-April as investors focused on the lack of loan growth and net interest margins coming under further pressure. A pick-up in bank merger activity contributed to financial shares trading higher
| RP® Financial, LC. | VALUATION ANALYSIS IV.14 |
going into the last week of April, which was followed by thrift shares pulling back in the last week of April on signs that inflation was accelerating. Signs that economic growth was accelerating helped to lift thrift shares in early-May. After spiking lower on signs that inflation was heating up, thrift shares powered higher to close out the second week of trading in May as investors saw value in bank stocks that underperformed the broader stock market during 2020 and were trading at relatively low P/E multiples compared to the S&P 500. After financial shares retreated in late-May, as the Federal Reserve’s top supervisory official came under criticism during his semi-annual congressional testimony, bank and thrift stocks traded higher to closeout May and the start of June on news that initial weekly jobless claims hit a new pandemic low for a second consecutive week.
Weaker-than-expected job growth reflected in the May employment report translated into financial shares edging lower to close out the first week of June 2021. With data showing another leap in May consumer prices, concerns of rising inflation pressured financial shares lower in the second week of June. Financial shares retreated further heading into the second half of June, as investors reacted to the Federal Reserve projecting higher interest rates sooner than expected and an unexpected rise in weekly jobless claims. Progress in negotiations towards reaching an agreement on infrastructure legislation boosted financial shares in late-June, which was followed by a sell-off in financial shares going into start of the third quarter on growing concerns about the economic recovery amid the spread of the Delta coronavirus variant.
Financial shares posted gains following Congressional testimony by the Federal Reserve Chairman in mid-July 2021, where he told members of Congress that inflation would moderate and that the central bank planned to maintain its current monetary policies. Following a pullback heading into the second half of July, financial shares traded higher in late-July as the Federal Reserve concluded its policy meeting maintaining its target rate near zero and hinted that it could start tapering bond purchases. Concerns that the pandemic recovery might be faltering pressured financial shares lower at the start of August, which was followed by bank and thrift stocks rebounding on the favorable employment numbers reported for July. Financial shares stabilized during into the latter part of August. On August 20, 2021, the KBW Nasdaq Regional Bank Index closed at 117.3, an increase of 24% since the beginning of the year.
| RP® Financial, LC. | VALUATION ANALYSIS IV.15 |
| B. | The New Issue Market |
In addition to thrift stock market conditions in general, the new issue market for converting thrifts is also an important consideration in determining the Company’s pro forma market value. The new issue market is separate and distinct from the market for seasoned thrift stocks in that the pricing ratios for converting issues are computed on a pro forma basis, specifically: (1) the numerator and denominator are both impacted by the conversion offering amount, unlike existing stock issues in which price change affects only the numerator; and (2) the pro forma pricing ratio incorporates assumptions regarding source and use of proceeds, effective tax rates, stock plan purchases, etc. which impact pro forma financials, whereas pricing for existing issues are based on reported financials. The distinction between pricing of converting and existing issues is perhaps no clearer than in the case of the price/book (“P/B”) ratio in that the P/B ratio of a converting thrift will typically result in a discount to book value whereas in the current market for existing thrifts the P/B ratio often reflects a premium to book value. Therefore, it is appropriate to also consider the market for new issues, both at the time of the conversion and in the aftermarket.
As shown in Table 4.2, there have been four standard conversions, four second step conversion and no mutual holding company offerings completed in the last three months. However, the minority stock offering by Marathon Bancorp of Wisconsin completed in April 2021 was included in the tabular presentation since it is particularly relevant to Colonial’s proposed transaction. Marathon Bancorp’s offering was comparatively smaller at $10 million and closed at a pro forma fully converted P/TB ratio equal to 55.8% and was trading at 6% above its IPO price as of August 20, 2021. In addition, we gave consideration to the three smaller standard conversion offerings involving institutions with total assets of less than $1 billion, which closed at an average P/TB ratio of 59.2%.
| RP® Financial, LC. | VALUATION ANALYSIS IV.16 |
Table 4.2
Pricing Characteristics and After-Market Trends
Conversions Completed in Trailing 12 Months
| Institutional Information | Pre-Conversion Data | Offering Information | Pro Forma Data | Post-IPO Pricing Trends | ||||||||||||||||||||||||||||||||||||||||||||||||||||||||||||||||||||||||||||||||||||
| Financial Info. | Asset Quality | Pricing Ratios(2)(5) | Financial Charac. | Closing Price: | ||||||||||||||||||||||||||||||||||||||||||||||||||||||||||||||||||||||||||||||||||||
| Excluding Foundation | First Trading Day |
After First Month(4) |
||||||||||||||||||||||||||||||||||||||||||||||||||||||||||||||||||||||||||||||||||||||
| Institution |
Conversion Date |
Ticker |
Assets | Equity/ Assets |
NPAs/ Assets |
Res. Cov. |
Gross Proc. |
% Offer |
% of Mid. |
Exp./ Proc. |
P/TB | Core P/E |
P/A | Core ROA |
TE/ A |
Core ROE |
IPO Price |
% Chg |
% Chg |
Thru 8/20/2021 |
% Chg |
|||||||||||||||||||||||||||||||||||||||||||||||||||||||||||||||||||
| ($Mil) | (%) | (%) | (%) | ($Mil.) | (%) | (%) | (%) | (%) | (x) | (%) | (%) | (%) | (%) | ($) | ($) | (%) | ($) | (%) | ($) | (%) | ||||||||||||||||||||||||||||||||||||||||||||||||||||||||||||||||||||
| Standard Conversions |
||||||||||||||||||||||||||||||||||||||||||||||||||||||||||||||||||||||||||||||||||||||||
| TC Bancshares, Inc., GA |
7/21/21 | TCBC-NASDAQ | $ | 364 | 11.14 | % | 0.62 | % | 188 | % | $ | 49.0 | 100 | % | 104 | % | 2.7 | % | 59.5 | % | NM | 12.1 | % | 0.1 | % | 20.3 | % | 0.3 | % | $ | 10.00 | $ | 12.11 | 21.1 | % | $ | 12.89 | 28.9 | % | $ | 12.89 | 28.9 | % | |||||||||||||||||||||||||||||||||||||||||||||
| Blue Foundry Bancorp, NJ* |
7/16/21 | BLFY-NASDAQ | $ | 1,948 | 9.76 | % | 0.66 | % | 130 | % | $ | 277.7 | 100 | % | 132 | % | 1.6 | % | 66.2 | % | NM | 13.0 | % | -0.6 | % | 19.7 | % | -3.2 | % | $ | 10.00 | $ | 12.90 | 29.0 | % | $ | 13.39 | 33.9 | % | $ | 13.50 | 35.0 | % | |||||||||||||||||||||||||||||||||||||||||||||
| Texas Community Bancshares, Inc, TX |
7/16/21 | TCBS-NASDAQ | $ | 317 | 10.03 | % | 0.37 | % | 162 | % | $ | 32.1 | 100 | % | 89 | % | 4.3 | % | 56.2 | % | 99.0 | x | 9.5 | % | 0.1 | % | 16.9 | % | 0.6 | % | $ | 10.00 | $ | 15.08 | 50.8 | % | $ | 15.29 | 52.9 | % | $ | 15.45 | 54.5 | % | ||||||||||||||||||||||||||||||||||||||||||||
| PB Bankshares, Inc., PA* |
7/15/21 | PBBK-NASDAQ | $ | 281 | 7.76 | % | 0.83 | % | 125 | % | $ | 27.8 | 100 | % | 132 | % | 4.9 | % | 61.9 | % | NM | 9.1 | % | 0.0 | % | 14.8 | % | -0.1 | % | $ | 10.00 | $ | 13.08 | 30.8 | % | $ | 12.90 | 29.0 | % | $ | 13.25 | 32.5 | % | |||||||||||||||||||||||||||||||||||||||||||||
| Averages - Standard Conversions: | $ | 727 | 9.67 | % | 0.62 | % | 151 | % | $ | 96.6 | 100 | % | 114 | % | 3.4 | % | 61.0 | % | 99.0 | x | 10.9 | % | -0.1 | % | 17.9 | % | -0.6 | % | $ | 10.00 | $ | 13.29 | 32.9 | % | $ | 13.62 | 36.2 | % | $ | 13.77 | 37.7 | % | ||||||||||||||||||||||||||||||||||||||||||||||
| Medians - Standard Conversions: | $ | 340 | 9.90 | % | 0.64 | % | 146 | % | $ | 40.5 | 100 | % | 118 | % | 3.5 | % | 60.7 | % | 99.0 | x | 10.8 | % | 0.0 | % | 18.3 | % | 0.1 | % | $ | 10.00 | $ | 12.99 | 29.9 | % | $ | 13.14 | 31.4 | % | $ | 13.38 | 33.8 | % | ||||||||||||||||||||||||||||||||||||||||||||||
| Second Step Conversions |
||||||||||||||||||||||||||||||||||||||||||||||||||||||||||||||||||||||||||||||||||||||||
| Magyar Bancorp, Inc., NJ* |
7/15/21 | MGYR-NASDAQ | $ | 759 | 7.84 | % | 1.43 | % | 79 | % | $ | 39.1 | 55 | % | 115 | % | 3.9 | % | 76.9 | % | 19.0 | x | 9.0 | % | 0.5 | % | 11.7 | % | 4.0 | % | $ | 10.00 | $ | 10.94 | 9.4 | % | $ | 10.23 | 2.3 | % | $ | 10.57 | 5.7 | % | ||||||||||||||||||||||||||||||||||||||||||||
| Cullman Bancorp, Inc., AL |
7/15/21 | CULL-NASDAQ | $ | 334 | 16.95 | % | 0.20 | % | 1012 | % | $ | 43.1 | 58 | % | 132 | % | 3.7 | % | 77.4 | % | 22.5 | x | 19.9 | % | 0.9 | % | 25.6 | % | 3.4 | % | $ | 10.00 | $ | 11.40 | 14.0 | % | $ | 11.46 | 14.6 | % | $ | 11.49 | 14.9 | % | ||||||||||||||||||||||||||||||||||||||||||||
| 1895 Bancorp of Wisconsin, Inc., WI |
7/15/21 | BCOW-NASDAQ | $ | 517 | 11.60 | % | 0.24 | % | 217 | % | $ | 35.4 | 55 | % | 115 | % | 5.0 | % | 71.6 | % | 56.4 | x | 11.7 | % | 0.2 | % | 16.4 | % | 1.3 | % | $ | 10.00 | $ | 11.15 | 11.5 | % | $ | 10.74 | 7.3 | % | $ | 10.90 | 9.0 | % | ||||||||||||||||||||||||||||||||||||||||||||
| NorthEast Community Bancorp, Inc., NY* |
7/13/21 | NECB-NASDAQ | $ | 966 | 16.30 | % | 0.58 | % | 143 | % | $ | 97.9 | 60 | % | 96 | % | 2.5 | % | 68.2 | % | 14.9 | x | 15.6 | % | 1.1 | % | 22.9 | % | 4.6 | % | $ | 10.00 | $ | 10.61 | 6.1 | % | $ | 10.06 | 0.6 | % | $ | 10.07 | 0.7 | % | ||||||||||||||||||||||||||||||||||||||||||||
| Averages - Second Step Conversions: | $ | 644 | 13.17 | % | 0.61 | % | 363 | % | $ | 53.9 | 57 | % | 114 | % | 3.8 | % | 73.5 | % | 28.2 | x | 14.0 | % | 0.7 | % | 19.2 | % | 3.3 | % | $ | 10.00 | $ | 11.02 | 10.2 | % | $ | 10.62 | 6.2 | % | $ | 10.76 | 7.6 | % | ||||||||||||||||||||||||||||||||||||||||||||||
| Medians - Second Step Conversions: | $ | 638 | 13.95 | % | 0.41 | % | 180 | % | $ | 41.1 | 57 | % | 115 | % | 3.8 | % | 74.2 | % | 20.8 | x | 13.7 | % | 0.7 | % | 19.7 | % | 3.7 | % | $ | 10.00 | $ | 11.04 | 10.4 | % | $ | 10.48 | 4.8 | % | $ | 10.73 | 7.3 | % | ||||||||||||||||||||||||||||||||||||||||||||||
| Mutual Holding Companies |
||||||||||||||||||||||||||||||||||||||||||||||||||||||||||||||||||||||||||||||||||||||||
| Marathon Bancorp, Inc., WI* |
4/20/21 | MBBC-OTCPink | $ | 174 | 12.39 | % | 0.22 | % | 562 | % | $ | 10.0 | 45 | % | 124 | % | 12.2 | % | 55.8 | % | 35.4 | x | 11.6 | % | 0.4 | % | 16.0 | % | 2.6 | % | $ | 10.00 | $ | 10.10 | 1.00 | % | $ | 10.27 | 2.7 | % | $ | 10.60 | 6.0 | % | ||||||||||||||||||||||||||||||||||||||||||||
|
Averages - MHC Conversions: |
$ | 174 | 12.39 | % | 0.22 | % | 562 | % | $ | 10.0 | 45 | % | 124 | % | 12.2 | % | 55.8 | % | 35.4 | x | 11.6 | % | 0.4 | % | 16.0 | % | 2.6 | % | $ | 10.00 | $ | 10.10 | 1.0 | % | $ | 10.27 | 2.7 | % | $ | 10.60 | 6.0 | % | ||||||||||||||||||||||||||||||||||||||||||||||
| Medians - MHC Conversions: |
$ | 174 | 12.39 | % | 0.22 | % | 562 | % | $ | 10.0 | 45 | % | 124 | % | 12.2 | % | 55.8 | % | 35.4 | x | 11.6 | % | 0.4 | % | 16.0 | % | 2.6 | % | $ | 10.00 | $ | 10.10 | 1.0 | % | $ | 10.27 | 2.7 | % | $ | 10.60 | 6.0 | % | ||||||||||||||||||||||||||||||||||||||||||||||
| Averages - All Conversions: | $ | 629 | 11.53 | % | 0.57 | % | 291 | % | $ | 68.0 | 75 | % | 115 | % | 4.5 | % | 66.0 | % | 41.2 | x | 12.4 | % | 0.3 | % | 18.2 | % | 1.5 | % | $ | 10.00 | $ | 11.93 | 19.3 | % | $ | 11.91 | 19.1 | % | $ | 12.08 | 20.8 | % | ||||||||||||||||||||||||||||||||||||||||||||||
| Medians - All Conversions: | $ | 364 | 11.14 | % | 0.58 | % | 162 | % | $ | 39.1 | 60 | % | 115 | % | 3.9 | % | 66.2 | % | 29.0 | x | 11.7 | % | 0.2 | % | 16.9 | % | 1.3 | % | $ | 10.00 | $ | 11.40 | 14.0 | % | $ | 11.46 | 14.6 | % | $ | 11.49 | 14.9 | % | ||||||||||||||||||||||||||||||||||||||||||||||
| Note: | * - Appraisal performed by RP Financial; BOLD = RP Financial assisted in the business plan preparation, “NT” - Not Traded; “NA” Not - Applicable, Not Available; C/S-Cash/Stock. |
| (1) | As a percent of MHC offering for MHC transactions. |
| (2) | Does not take into account the adoption of SOP 93-6. |
| (3) | Latest price if offering is less than one week old. |
| (4) | Latest price if offering is more than one week but less than one month old. |
| (5) | Mutual holding company pro forma data on full conversion basis. |
| (6) | Simultaneously completed acquisition of another financial institution. |
| (7) | Simultaneously converted to a commercial bank charter. |
| (8) | Former credit union. |
8/20/2021
| RP® Financial, LC. | VALUATION ANALYSIS IV.17 |
| C. | The Acquisition Market |
Also considered in the valuation was the potential impact on CFSB Bancorp’s stock price of recently completed and pending acquisitions of other savings institutions operating in Massachusetts. As shown in Exhibit IV-4, there have been 22 bank and thrift acquisitions completed from the beginning of 2017 through year-to-date 2021, of which 12 involved savings institutions. In addition, there are currently 2 pending acquisitions for Massachusetts financial institutions, including 1 savings institution. To the extent that speculation of a re-mutualization may impact the Company’s valuation, we have largely taken this into account in selecting companies for the Peer Group which operate in markets that have experienced a comparable level of acquisition activity as the Company’s market and, thus, are subject to the same type of acquisition speculation that may influence the Company’s stock. However, since converting thrifts are subject to a three-year regulatory moratorium from being acquired, acquisition speculation in the Company’s stock would tend to be less compared to the stocks of the Peer Group companies. Furthermore, in comparison to the stocks of the fully-converted Peer Group companies, the degree of acquisition speculation in the Company’s stock is also viewed to be relatively more limited since there will be fewer potential acquirers for the Company’s stock as a re-mutualization transaction can only be completed by a mutual institution or an institution in the MHC form of ownership. Additionally, there tends to be less acquisition speculation in the stocks of publicly-traded MHCs in general, given the majority of the shares are held by the MHC rather than public shareholders which own 100% of the shares of the fully-converted Peer Group companies. Accordingly, the Peer Group companies are considered to be subject to a greater degree of acquisition speculation relative to the acquisition speculation that may influence the Company’s trading price.
* * * * * * * * * * *
In determining our valuation adjustment for marketing of the issue, we considered trends in both the overall thrift market, the new issue market including the new issue market for MHC shares and the local acquisition market for thrift stocks. Taking these factors and trends into account, RP Financial concluded that a slight downward adjustment was appropriate in the valuation analysis for purposes of marketing of the issue.
| RP® Financial, LC. | VALUATION ANALYSIS IV.18 |
| 8. | Management |
Colonial’s management team appears to have experience and expertise in all of the key areas of the Bank’s operations. Exhibit IV-5 provides summary resumes of the Bank’s Board of Directors and senior management. The financial characteristics of the Bank suggest that the Board and senior management have been effective in implementing an operating strategy that can be well managed by the Bank’s present organizational structure. The Bank currently does not have any senior management positions that are vacant.
Similarly, the returns, capital positions and other operating measures of the Peer Group companies are indicative of well-managed financial institutions, which have Boards and management teams that have been effective in implementing competitive operating strategies. Therefore, on balance, we concluded no valuation adjustment relative to the Peer Group was appropriate for this factor.
| 9. | Effect of Government Regulation and Regulatory Reform |
As a federally-insured savings institution operating in the MHC form of ownership, CFSB Bancorp and Colonial Bank will be operating in substantially the same regulatory environment as the Peer Group members — all of whom are adequately capitalized institutions and are operating with no apparent restrictions. Exhibit IV-6 reflects the Bank’s pro forma regulatory capital ratios. Accordingly, no adjustment has been applied for the effect of government regulation and regulatory reform.
Summary of Adjustments
Overall, based on the factors discussed above, we concluded that the Company’s pro forma market value should reflect the following valuation adjustments relative to the Peer Group:
| RP® Financial, LC. | VALUATION ANALYSIS IV.19 |
Table 4.3
Valuation Adjustments
| Key Valuation Parameters: |
Valuation Adjustment | |
| Financial Condition | Slight Upward | |
| Profitability, Growth and Viability of Earnings | Moderate Downward | |
| Asset Growth | No Adjustment | |
| Primary Market Area | Slight Upward | |
| Dividends | Slight Downward | |
| Liquidity of the Shares | Slight Downward | |
| Marketing of the Issue | Slight Downward | |
| Management | No Adjustment | |
| Effect of Government Regulations and Regulatory Reform | No Adjustment |
Valuation Approaches: Fully-Converted Basis
In applying the accepted valuation methodology promulgated by the FDIC, the FRB and the Department, i.e., the pro forma market value approach, we considered the three key pricing ratios in valuing the Company’s to-be-issued stock — price/earnings (“P/E”), price/book (“P/B”), and price/assets (“P/A”) approaches — all performed on a pro forma basis including the effects of the stock proceeds. In computing the pro forma impact of the conversion and the related pricing ratios, we have incorporated the valuation parameters disclosed in the Bank’s prospectus for the reinvestment rate, effective tax rate, stock benefit plan assumptions, the Foundation and offering expenses (summarized in Exhibits IV-9 and IV-10). The assumptions utilized in the pro forma analysis in calculating the Company’s full conversion value were consistent with the assumptions utilized for the minority stock offering, except expenses were to include certain stock-related expenses (summarized in Exhibits IV-7 and IV-8).
In our estimate of value, we assessed the relationship of the pro forma pricing ratios relative to the Peer Group, recent conversions and publicly-traded MHCs on a fully-converted basis.
RP Financial’s valuation placed an emphasis on the following:
| • | P/E Approach. The P/E approach is generally the best indicator of long-term value for a stock. Given the similarities between the Company’s and the Peer Group’s earnings composition and overall financial condition, the P/E approach was carefully considered in this valuation. At the same time, recognizing that (1) the earnings multiples will be evaluated on a pro forma fully-converted basis for the Company; and (2) the Peer Group on average has had the opportunity |
| RP® Financial, LC. | VALUATION ANALYSIS IV.20 |
| to realize the benefit of reinvesting net conversion proceeds, we also gave weight to the other valuation approaches. |
| • | P/B Approach. P/B ratios have generally served as a useful benchmark in the valuation of thrift stocks, particularly in the context of an initial public offering, as the earnings approach involves assumptions regarding the use of proceeds. RP Financial considered the P/B approach to be a valuable indicator of pro forma value taking into account the pricing ratios under the P/E and P/A approaches. We have also modified the P/B approach to exclude the impact of intangible assets (i.e., price/tangible book value or “P/TB”), in that the investment community frequently makes this adjustment in its evaluation of this pricing approach. |
| • | P/A Approach. P/A ratios are generally a less reliable indicator of market value, as investors typically assign less weight to assets and attribute greater weight to book value and earnings. Furthermore, this approach as set forth in the regulatory valuation guidelines does not take into account the amount of stock purchases funded by deposit withdrawals, thus understating the pro forma P/A ratio. At the same time, the P/A ratio is an indicator of franchise value, and, in the case of highly capitalized institutions, high P/A ratios may limit the investment community’s willingness to pay market multiples for earnings or book value when ROE is expected to be low. |
The Company will adopt “Employers’ Accounting for Employee Stock Ownership Plans” (“ASC 718-40”), which will cause earnings per share computations to be based on shares issued and outstanding excluding unreleased ESOP shares. For purposes of preparing the pro forma pricing analyses, we have reflected all shares issued in the offering, including all ESOP shares, to capture the full dilutive impact, particularly since the ESOP shares are economically dilutive, receive dividends and can be voted. However, we did consider the impact of ASC 718-40 in the valuation.
Based on the application of the three valuation approaches, taking into consideration the valuation adjustments discussed above, RP Financial concluded that as of August 20, 2021, the pro forma market value of CFSB Bancorp’s full conversion offering equaled $50,000,000 at the midpoint, equal to 5,000,000 shares at $10.00 per share.
Basis of Valuation - Fully-Converted Pricing Ratios
1. Price-to-Earnings (“P/E”). The application of the P/E valuation method requires calculating the Company’s pro forma market value by applying a valuation P/E multiple (fully-converted basis) to the pro forma earnings base. In applying this technique, we considered both reported earnings and a recurring earnings base, that is, earnings adjusted to exclude any one-
| RP® Financial, LC. | VALUATION ANALYSIS IV.21 |
time non-operating items, plus the estimated after-tax earnings benefit of the reinvestment of the net proceeds. For the 12 months ended June 30, 2021, Colonial recorded net income of $1,392,000. Based on the Bank’s audited financial statements, there were no non-operating income or expense items during the most recent 12-month period and thus core earnings were deemed to be equal to reported earnings.
Based on Colonial’s reported and core earnings and incorporating the impact of the pro forma assumptions discussed previously, the Company’s pro forma reported and core P/E multiples (fully-converted basis) at the $50.0 million midpoint value equaled 54.58 times each, which provided for premiums of 371% and 313% relative to the Peer Group’s average reported and core P/E multiples of 11.58 times and 13.21 times, respectively (see Table 4.4). In comparison to the Peer Group’s median reported and core earnings multiples which equaled 10.04 times and 10.05 times, respectively, the Company’s pro forma reported and core P/E multiples (fully-converted basis) at the midpoint value indicated premiums of 443% and 444%, respectively. the Company’s pro forma fully-converted P/E ratios based on reported and core earnings at the minimum and the super maximum equaled 43.10x and 86.37x, respectively.
On an MHC reported basis, the Company’s reported and core P/E multiples at the midpoint value of $50.0 million equaled 41.67 times (see Table 4.5). The Company’s reported and core P/E multiples provided for premiums of 260% and 216% relative to the Peer Group’s average reported and core P/E multiples of 11.58 times and 13.17 times, respectively. In comparison to the Peer Group’s median reported and core earnings multiples which equaled 10.04 times and 10.05 times, respectively, the Company’s pro forma reported and core P/E multiples (MHC basis) at the midpoint value indicated premiums of 315%. The Company’s pro forma MHC P/E ratios based on reported and core earnings at the minimum and the super maximum equaled 34.48x and 58.82x, respectively.
2. Price-to-Book (“P/B”). The application of the P/B valuation method requires calculating the Company’s pro forma market value by applying a valuation P/B ratio, as derived from the Peer Group’s P/B ratio, to CFSB Bancorp’s pro forma book value (fully-converted basis). Based on the $50.0 million midpoint valuation, CFSB Bancorp’s pro forma P/B and P/TB ratios (fully-converted basis) both equaled 55.68%. In comparison to the average P/B and P/TB ratios for the Peer Group of 90.73% and 93.00%, respectively, the Company’s ratios reflected a discount of 38.6% on a P/B basis and a discount of 40.1% on a P/TB basis. In comparison to the Peer
| RP® Financial, LC. | VALUATION ANALYSIS IV.22 |
Table 4.4
CFSB Bancorp Public Market Pricing Versus Peer Group (Fully Converted Basis)
As of August 20, 2021
| Market | ||||||||||||||||||||||||||||||||||||||||||||||||||||||||||||||||||||||||||||||||||||
| Capitalization | Per Share Data | Dividends(4) | Financial Characteristics(6) | |||||||||||||||||||||||||||||||||||||||||||||||||||||||||||||||||||||||||||||||||
| Price/ Share(1) |
Market Value |
Core 12 Month EPS(2) |
Book Value/ Share |
Pricing Ratios(3) | Amount/ Share |
Yield |
Payout Ratio |
Total Assets |
Equity/ Assets |
Tang. Eq./ T. Assets |
NPAs/ Assets |
Reported (5) | Core (5) | |||||||||||||||||||||||||||||||||||||||||||||||||||||||||||||||||||||||
| P/E | P/B | P/A | P/TB | P/ Core |
ROAA | ROAE | ROAA | ROAE | ||||||||||||||||||||||||||||||||||||||||||||||||||||||||||||||||||||||||||||
| ($) | ($Mil) | ($) | ($) | (x) | (%) | (%) | (%) | (x) | ($) | (%) | (%) | ($Mil) | (%) | (%) | (%) | (%) | (%) | (%) | (%) | |||||||||||||||||||||||||||||||||||||||||||||||||||||||||||||||||
| Colonial Bancorp, Inc. |
||||||||||||||||||||||||||||||||||||||||||||||||||||||||||||||||||||||||||||||||||||
| Supermaximum |
$ | 10.00 | $ | 66.13 | $ | 0.12 | $ | 15.66 | 86.37 | 63.86 | 16.80 | 63.86 | 86.37 | $ | 0.00 | 0.00 | % | 0.00 | % | $ | 394 | 26.31 | 26.31 | 0.00 | 0.19 | 0.74 | 0.19 | 0.74 | ||||||||||||||||||||||||||||||||||||||||||||||||||||||||
| Maximum |
$ | 10.00 | 57.50 | 0.15 | 16.73 | 67.96 | 59.77 | 14.88 | 59.77 | 67.96 | $ | 0.00 | 0.00 | % | 0.00 | % | 386 | 24.91 | 24.91 | 0.00 | 0.22 | 0.88 | 0.22 | 0.88 | ||||||||||||||||||||||||||||||||||||||||||||||||||||||||||||
| Midpoint |
$ | 10.00 | 50.00 | 0.18 | 17.96 | 54.58 | 55.68 | 13.16 | 55.68 | 54.58 | $ | 0.00 | 0.00 | % | 0.00 | % | 380 | 23.64 | 23.64 | 0.00 | 0.24 | 1.02 | 0.24 | 1.02 | ||||||||||||||||||||||||||||||||||||||||||||||||||||||||||||
| Minimum |
$ | 10.00 | 42.50 | 0.23 | 19.63 | 43.10 | 50.94 | 11.38 | 50.94 | 43.10 | $ | 0.00 | 0.00 | % | 0.00 | % | 374 | 22.33 | 22.33 | 0.00 | 0.26 | 1.18 | 0.26 | 1.18 | ||||||||||||||||||||||||||||||||||||||||||||||||||||||||||||
| All Publicly-Traded, Fully Converted Savings Institutions |
||||||||||||||||||||||||||||||||||||||||||||||||||||||||||||||||||||||||||||||||||||
| Averages |
$ | 24.78 | $ | 523.83 | $ | 2.21 | $ | 66.56 | 12.36 | 110.06 | % | 13.42 | % | 123.03 | % | 13.12 | $ | 0.46 | 2.18 | % | 48.19 | % | $ | 3,876 | 12.54 | % | 11.47 | % | 0.60 | % | 1.05 | % | 7.85 | % | 1.07 | % | 8.36 | % | ||||||||||||||||||||||||||||||||||||||||||||||
| Medians |
$ | 15.84 | $ | 164.15 | $ | 1.23 | $ | 17.12 | 11.63 | 102.30 | % | 12.52 | % | 109.31 | % | 11.78 | $ | 0.40 | 2.16 | % | 29.89 | % | $ | 1,384 | 11.44 | % | 10.68 | % | 0.44 | % | 0.92 | % | 7.95 | % | 0.96 | % | 7.94 | % | ||||||||||||||||||||||||||||||||||||||||||||||
| State of MA (6) |
||||||||||||||||||||||||||||||||||||||||||||||||||||||||||||||||||||||||||||||||||||
| Averages |
$ | 73.19 | $ | 382.03 | $ | 6.19 | $ | 41.37 | 11.51 | 128.07 | % | 14.78 | % | 132.00 | % | 11.70 | $ | 0.65 | 1.34 | % | 16.19 | % | $ | 2,479 | 12.70 | % | 12.31 | % | 0.69 | % | 1.72 | % | 13.64 | % | 1.64 | % | 12.75 | % | ||||||||||||||||||||||||||||||||||||||||||||||
| Medians |
$ | 16.47 | $ | 229.48 | $ | 1.19 | $ | 12.69 | 11.57 | 108.79 | % | 14.48 | % | 121.45 | % | 11.53 | $ | 0.20 | 1.21 | % | 15.06 | % | $ | 2,477 | 13.53 | % | 13.53 | % | 0.93 | % | 1.42 | % | 9.07 | % | 1.42 | % | 9.10 | % | ||||||||||||||||||||||||||||||||||||||||||||||
| Peer Group |
||||||||||||||||||||||||||||||||||||||||||||||||||||||||||||||||||||||||||||||||||||
| Averages |
$ | 16.41 | $ | 61.18 | $ | 1.61 | $ | 18.10 | 11.58 | 90.73 | % | 12.30 | % | 93.00 | % | 13.21 | $ | 0.29 | 1.86 | % | 35.31 | % | $ | 552 | 14.27 | % | 14.03 | % | 0.54 | % | 0.98 | % | 8.30 | % | 0.99 | % | 8.58 | % | ||||||||||||||||||||||||||||||||||||||||||||||
| Medians |
$ | 15.07 | $ | 48.81 | $ | 1.74 | $ | 17.44 | 10.04 | 90.88 | % | 10.11 | % | 98.14 | % | 10.05 | $ | 0.32 | 1.80 | % | 35.44 | % | $ | 464 | 11.44 | % | 11.19 | % | 0.51 | % | 0.70 | % | 6.13 | % | 0.73 | % | 6.45 | % | ||||||||||||||||||||||||||||||||||||||||||||||
| Peer Group |
||||||||||||||||||||||||||||||||||||||||||||||||||||||||||||||||||||||||||||||||||||
| CBMB |
CBM Bancorp, Inc. | MD | $ | 14.75 | $ | 48.45 | $ | 0.25 | $ | 14.23 | NM | 103.62 | % | 19.38 | % | 103.62 | % | NM | NA | NA | NA | $ | 250 | 20.08 | % | 20.08 | % | 0.15 | % | 0.36 | % | 1.65 | % | 0.36 | % | 1.65 | % | |||||||||||||||||||||||||||||||||||||||||||||||
| CNNB |
Cincinnati Bancorp, Inc. | OH | $ | 14.10 | $ | 41.36 | $ | 1.46 | $ | 14.45 | 9.72 | x | 97.57 | % | 16.56 | % | 97.94 | % | 9.68 | x | NA | NA | NA | $ | 250 | 17.13 | % | 17.08 | % | 0.51 | % | 1.72 | % | 11.34 | % | 1.73 | % | 11.40 | % | |||||||||||||||||||||||||||||||||||||||||||||
| ESBK |
Elmira Savings Bank | NY | $ | 13.86 | $ | 49.17 | $ | 1.38 | $ | 17.57 | 10.04 | x | 78.89 | % | 7.58 | % | 98.33 | % | 10.05 | x | $ | 0.60 | 4.33 | % | 43.48 | % | $ | 649 | 9.62 | % | 7.87 | % | NA | 0.73 | % | 7.91 | % | 0.73 | % | 7.97 | % | |||||||||||||||||||||||||||||||||||||||||||
| FFBW |
FFBW, Inc. | WI | $ | 11.35 | $ | 72.88 | NA | $ | 13.76 | NM | 82.50 | % | 20.67 | % | 82.50 | % | NA | NA | NA | NA | $ | 353 | 27.44 | % | 27.34 | % | 0.24 | % | 0.66 | % | 2.21 | % | NA | NA | ||||||||||||||||||||||||||||||||||||||||||||||||||
| GBNY |
Generations Bancorp NY, Inc. | NY | $ | 10.28 | $ | 25.26 | $ | 0.38 | $ | 17.31 | 14.08 | x | 59.37 | % | 6.65 | % | 61.71 | % | 26.99 | x | NA | NA | NA | $ | 380 | 11.19 | % | 10.82 | % | NA | 0.48 | % | 5.39 | % | 0.24 | % | 2.73 | % | ||||||||||||||||||||||||||||||||||||||||||||||
| HMNF |
HMN Financial, Inc. | MN | $ | 22.99 | $ | 102.54 | $ | 3.08 | $ | 23.24 | 7.46 | x | 98.91 | % | 10.45 | % | 99.67 | % | 7.46 | x | $ | 0.00 | 0.00 | % | NA | $ | 981 | 11.00 | % | 10.93 | % | 0.19 | % | 1.53 | % | 13.83 | % | 1.53 | % | 13.84 | % | |||||||||||||||||||||||||||||||||||||||||||
| HVBC |
HV Bancorp, Inc. | PA | $ | 21.83 | $ | 47.50 | $ | 3.32 | $ | 19.04 | 6.58 | x | 114.63 | % | 8.66 | % | 114.63 | % | 6.58 | x | NA | NA | NA | $ | 549 | 7.55 | % | 7.55 | % | 0.55 | % | 1.13 | % | 18.27 | % | 1.13 | % | 18.27 | % | |||||||||||||||||||||||||||||||||||||||||||||
| IROQ |
IF Bancorp, Inc. | (7) IL | $ | 21.67 | $ | 65.94 | $ | 1.75 | $ | 25.76 | 11.59 | x | 84.11 | % | 8.85 | % | 84.11 | % | 12.35 | x | $ | 0.35 | 1.62 | % | 17.38 | % | $ | 745 | 11.20 | % | 11.20 | % | 0.20 | % | 0.79 | % | 6.87 | % | 0.74 | % | 6.45 | % | ||||||||||||||||||||||||||||||||||||||||||
| MSVB |
Mid-Southern Bancorp, Inc. | IN | $ | 15.39 | $ | 43.90 | $ | 0.42 | $ | 15.50 | NM | 99.27 | % | 17.62 | % | 99.27 | % | NM | $ | 0.12 | 0.78 | % | 26.19 | % | $ | 249 | 19.71 | % | 19.71 | % | 0.74 | % | 0.53 | % | 2.53 | % | 0.53 | % | 2.53 | % | ||||||||||||||||||||||||||||||||||||||||||||
| PBIP |
Prudential Bancorp, Inc. | PA | $ | 14.10 | $ | 109.90 | $ | 0.71 | $ | 16.75 | 17.85 | x | 84.19 | % | 9.77 | % | 88.48 | % | 19.82 | x | $ | 0.28 | 1.99 | % | 35.44 | % | $ | 1,125 | 11.68 | % | 11.17 | % | 1.17 | % | 0.54 | % | 4.86 | % | 0.48 | % | 4.38 | % | ||||||||||||||||||||||||||||||||||||||||||
| RNDB |
Randolph Bancorp, Inc. | MA | $ | 20.32 | $ | 99.02 | $ | 4.17 | $ | 19.17 | 4.94 | x | 106.02 | % | 13.31 | % | 106.05 | % | 4.87 | x | NA | NA | NA | $ | 744 | 13.53 | % | 13.53 | % | 1.09 | % | 2.95 | % | 21.36 | % | 2.99 | % | 21.67 | % | |||||||||||||||||||||||||||||||||||||||||||||
| WVFC |
WVS Financial Corp. | PA | $ | 16.23 | $ | 28.20 | $ | 0.77 | $ | 20.37 | 21.93 | x | 79.67 | % | 8.15 | % | 79.67 | % | 21.13 | x | $ | 0.40 | 2.46 | % | 54.05 | % | $ | 346 | 11.09 | % | 11.09 | % | NA | 0.39 | % | 3.40 | % | 0.41 | % | 3.53 | % | |||||||||||||||||||||||||||||||||||||||||||
| (1) Closing price at date indicated, market value equal to public (minority shares) times current stock price. (2) Core earnings reflect net income less non-recurring items (3) P/E = Price to earnings; P/B = Price to book; P/A = Price to assets; P/TB = Price to tangible book value; and P/Core = Price to core earnings. P/E and P/Core =NM if the ratio is negative or above 35x. (4) Dividend is as of most recent quarterly dividend. Indicated 12 month dividend as a percent of trailing 12 month earnings. (5) ROAA (return on average assets) and ROAE (return on average equity) are indicated ratios based on trailing 12 month earnings and average equity and assets balances. (6) Excludes from averages and medians those companies the subject of actual or rumored acquisition activities or unusual operating characteristics. (7) Current Quarter is June 30, 2021, footnote reflects data as of March 31, 2021 or December 31, 2020.
Source: S&P Global Market Intelligence and RP Financial, LC. calculations. The information provided in this report has been obtained from sources we believe are reliable, but we cannot guarantee the accuracy or completeness of such information. |
| |||||||||||||||||||||||||||||||||||||||||||||||||||||||||||||||||||||||||||||||||||
| RP® Financial, LC. | VALUATION ANALYSIS IV.23 |
Table 4.5
CFSB Bancorp Public Market Pricing Versus Peer Group (MHC Basis)
As of August 20, 2021
| Market | Per Share Data | |||||||||||||||||||||||||||||||||||||||||||||||||||||||||||||||||||||||||||||||||||
| Capitalization | Core 12 Month EPS(2) |
Book Value/ Share |
Dividends(4) | Financial Characteristics(6) | ||||||||||||||||||||||||||||||||||||||||||||||||||||||||||||||||||||||||||||||||
| Price/ Share(1) |
Market Value |
Pricing Ratios(3) | Amount/ Share |
Yield | Payout Ratio |
Total Assets |
Equity/ Assets |
Tang. Eq./ T. Assets |
NPAs/ Assets |
Reported (5) | Core (5) | |||||||||||||||||||||||||||||||||||||||||||||||||||||||||||||||||||||||||
| P/E | P/B | P/A | P/TB | P/ Core |
ROAA | ROAE | ROAA | ROAE | ||||||||||||||||||||||||||||||||||||||||||||||||||||||||||||||||||||||||||||
| ($) | ($Mil) | ($) | ($) | (x) | (%) | (%) | (%) | (x) | ($) | (%) | (%) | ($Mil) | (%) | (%) | (%) | (%) | (%) | (%) | (%) | |||||||||||||||||||||||||||||||||||||||||||||||||||||||||||||||||
| Colonial Bancorp, Inc. |
||||||||||||||||||||||||||||||||||||||||||||||||||||||||||||||||||||||||||||||||||||
| Supermaximum |
$ | 10.00 | $ | 29.76 | $ | 0.16 | $ | 10.84 | 58.82 | 92.25 | 18.28 | 92.25 | 58.82 | $ | 0.00 | 0.00 | % | 0.00 | % | $ | 362 | 19.82 | 19.82 | 0.00 | 0.29 | 1.48 | 0.29 | 1.48 | ||||||||||||||||||||||||||||||||||||||||||||||||||||||||
| Maximum |
$ | 10.00 | 25.88 | 0.19 | 11.91 | 50.00 | 83.96 | 16.04 | 83.96 | 50.00 | $ | 0.00 | 0.00 | % | 0.00 | % | $ | 359 | 19.11 | 19.11 | 0.00 | 0.31 | 1.61 | 0.31 | 1.61 | |||||||||||||||||||||||||||||||||||||||||||||||||||||||||||
| Midpoint |
$ | 10.00 | 22.50 | 0.23 | 13.15 | 41.67 | 76.10 | 14.05 | 76.10 | 41.67 | $ | 0.00 | 0.00 | % | 0.00 | % | $ | 356 | 18.48 | 18.48 | 0.00 | 0.32 | 1.73 | 0.32 | 1.73 | |||||||||||||||||||||||||||||||||||||||||||||||||||||||||||
| Minimum |
$ | 10.00 | 19.13 | 0.28 | 14.81 | 34.48 | 67.52 | 12.04 | 67.52 | 34.48 | $ | 0.00 | 0.00 | % | 0.00 | % | $ | 353 | 17.83 | 17.83 | 0.00 | 0.33 | 1.87 | 0.33 | 1.87 | |||||||||||||||||||||||||||||||||||||||||||||||||||||||||||
| All Publicly-Traded, Fully Converted Savings Institutions |
||||||||||||||||||||||||||||||||||||||||||||||||||||||||||||||||||||||||||||||||||||
| Averages |
$ | 24.78 | $ | 523.83 | $ | 2.21 | $ | 66.56 | 12.36 | 110.06 | % | 13.42 | % | 123.03 | % | 13.12 | $ | 0.46 | 2.18 | % | 48.19 | % | $ | 3,876 | 12.54 | % | 11.47 | % | 0.60 | % | 1.05 | % | 7.85 | % | 1.07 | % | 8.36 | % | ||||||||||||||||||||||||||||||||||||||||||||||
| Medians |
$ | 15.84 | $ | 164.15 | $ | 1.23 | $ | 17.12 | 11.63 | 102.30 | % | 12.52 | % | 109.31 | % | 11.78 | $ | 0.40 | 2.16 | % | 29.89 | % | $ | 1,384 | 11.44 | % | 10.68 | % | 0.44 | % | 0.92 | % | 7.95 | % | 0.96 | % | 7.94 | % | ||||||||||||||||||||||||||||||||||||||||||||||
| State of MA (6) |
||||||||||||||||||||||||||||||||||||||||||||||||||||||||||||||||||||||||||||||||||||
| Averages |
$ | 73.19 | $ | 382.03 | $ | 6.19 | $ | 41.37 | 11.51 | 128.07 | % | 14.78 | % | 132.00 | % | 11.70 | $ | 0.65 | 1.34 | % | 16.19 | % | $ | 2,479 | 12.70 | % | 12.31 | % | 0.69 | % | 1.72 | % | 13.64 | % | 1.64 | % | 12.75 | % | ||||||||||||||||||||||||||||||||||||||||||||||
| Medians |
$ | 16.47 | $ | 229.48 | $ | 1.19 | $ | 12.69 | 11.57 | 108.79 | % | 14.48 | % | 121.45 | % | 11.53 | $ | 0.20 | 1.21 | % | 15.06 | % | $ | 2,477 | 13.53 | % | 13.53 | % | 0.93 | % | 1.42 | % | 9.07 | % | 1.42 | % | 9.10 | % | ||||||||||||||||||||||||||||||||||||||||||||||
| Peer Group |
||||||||||||||||||||||||||||||||||||||||||||||||||||||||||||||||||||||||||||||||||||
| Averages |
$ | 16.41 | $ | 61.18 | $ | 1.61 | $ | 18.10 | 11.58 | 90.73 | % | 12.30 | % | 93.00 | % | 13.21 | $ | 0.29 | 1.86 | % | 35.31 | % | $ | 552 | 14.27 | % | 14.03 | % | 0.54 | % | 0.98 | % | 8.30 | % | 0.99 | % | 8.58 | % | ||||||||||||||||||||||||||||||||||||||||||||||
| Medians |
$ | 15.07 | $ | 48.81 | $ | 1.74 | $ | 17.44 | 10.04 | 90.88 | % | 10.11 | % | 98.14 | % | 10.05 | $ | 0.32 | 1.80 | % | 35.44 | % | $ | 464 | 11.44 | % | 11.19 | % | 0.51 | % | 0.70 | % | 6.13 | % | 0.73 | % | 6.45 | % | ||||||||||||||||||||||||||||||||||||||||||||||
| Peer Group |
||||||||||||||||||||||||||||||||||||||||||||||||||||||||||||||||||||||||||||||||||||
| CBMB |
CBM Bancorp, Inc. | MD | $ | 14.75 | $ | 48.45 | $ | 0.25 | $ | 14.23 | NM | 103.62 | % | 19.38 | % | 103.62 | % | NM | NA | NA | NA | $ | 250 | 20.08 | % | 20.08 | % | 0.15 | % | 0.36 | % | 1.65 | % | 0.36 | % | 1.65 | % | |||||||||||||||||||||||||||||||||||||||||||||||
| CNNB |
Cincinnati Bancorp, Inc. | OH | $ | 14.10 | $ | 41.36 | $ | 1.46 | $ | 14.45 | 9.72 | x | 97.57 | % | 16.56 | % | 97.94 | % | 9.68 | x | NA | NA | NA | $ | 250 | 17.13 | % | 17.08 | % | 0.51 | % | 1.72 | % | 11.34 | % | 1.73 | % | 11.40 | % | |||||||||||||||||||||||||||||||||||||||||||||
| ESBK |
Elmira Savings Bank | NY | $ | 13.86 | $ | 49.17 | $ | 1.38 | $ | 17.57 | 10.04 | x | 78.89 | % | 7.58 | % | 98.33 | % | 10.05 | x | $ | 0.60 | 4.33 | % | 43.48 | % | $ | 649 | 9.62 | % | 7.87 | % | NA | 0.73 | % | 7.91 | % | 0.73 | % | 7.97 | % | |||||||||||||||||||||||||||||||||||||||||||
| FFBW |
FFBW, Inc. | WI | $ | 11.35 | $ | 72.88 | NA | $ | 13.76 | NM | 82.50 | % | 20.67 | % | 82.50 | % | NA | NA | NA | NA | $ | 353 | 27.44 | % | 27.34 | % | 0.24 | % | 0.66 | % | 2.21 | % | NA | NA | ||||||||||||||||||||||||||||||||||||||||||||||||||
| GBNY |
Generations Bancorp NY, Inc. | NY | $ | 10.28 | $ | 25.26 | $ | 0.38 | $ | 17.31 | 14.08 | x | 59.37 | % | 6.65 | % | 61.71 | % | 26.99 | x | NA | NA | NA | $ | 380 | 11.19 | % | 10.82 | % | NA | 0.48 | % | 5.39 | % | 0.24 | % | 2.73 | % | ||||||||||||||||||||||||||||||||||||||||||||||
| HMNF |
HMN Financial, Inc. | MN | $ | 22.99 | $ | 102.54 | $ | 3.08 | $ | 23.24 | 7.46 | x | 98.91 | % | 10.45 | % | 99.67 | % | 7.46 | x | $ | 0.00 | 0.00 | % | NA | $ | 981 | 11.00 | % | 10.93 | % | 0.19 | % | 1.53 | % | 13.83 | % | 1.53 | % | 13.84 | % | |||||||||||||||||||||||||||||||||||||||||||
| HVBC |
HV Bancorp, Inc. | PA | $ | 21.83 | $ | 47.50 | $ | 3.32 | $ | 19.04 | 6.58 | x | 114.63 | % | 8.66 | % | 114.63 | % | 6.58 | x | NA | NA | NA | $ | 549 | 7.55 | % | 7.55 | % | 0.55 | % | 1.13 | % | 18.27 | % | 1.13 | % | 18.27 | % | |||||||||||||||||||||||||||||||||||||||||||||
| IROQ |
IF Bancorp, Inc. | (7) IL | $ | 21.67 | $ | 65.94 | $ | 1.75 | $ | 25.76 | 11.59 | x | 84.11 | % | 8.85 | % | 84.11 | % | 12.35 | x | $ | 0.35 | 1.62 | % | 17.38 | % | $ | 745 | 11.20 | % | 11.20 | % | 0.20 | % | 0.79 | % | 6.87 | % | 0.74 | % | 6.45 | % | ||||||||||||||||||||||||||||||||||||||||||
| MSVB |
Mid-Southern Bancorp, Inc. | IN | $ | 15.39 | $ | 43.90 | $ | 0.42 | $ | 15.50 | NM | 99.27 | % | 17.62 | % | 99.27 | % | NM | $ | 0.12 | 0.78 | % | 26.19 | % | $ | 249 | 19.71 | % | 19.71 | % | 0.74 | % | 0.53 | % | 2.53 | % | 0.53 | % | 2.53 | % | ||||||||||||||||||||||||||||||||||||||||||||
| PBIP |
Prudential Bancorp, Inc. | PA | $ | 14.10 | $ | 109.90 | $ | 0.71 | $ | 16.75 | 17.85 | x | 84.19 | % | 9.77 | % | 88.48 | % | 19.82 | x | $ | 0.28 | 1.99 | % | 35.44 | % | $ | 1,125 | 11.68 | % | 11.17 | % | 1.17 | % | 0.54 | % | 4.86 | % | 0.48 | % | 4.38 | % | ||||||||||||||||||||||||||||||||||||||||||
| RNDB |
Randolph Bancorp, Inc. | MA | $ | 20.32 | $ | 99.02 | $ | 4.17 | $ | 19.17 | 4.94 | x | 106.02 | % | 13.31 | % | 106.05 | % | 4.87 | x | NA | NA | NA | $ | 744 | 13.53 | % | 13.53 | % | 1.09 | % | 2.95 | % | 21.36 | % | 2.99 | % | 21.67 | % | |||||||||||||||||||||||||||||||||||||||||||||
| WVFC |
WVS Financial Corp. | PA | $ | 16.23 | $ | 28.20 | $ | 0.77 | $ | 20.37 | 21.93 | x | 79.67 | % | 8.15 | % | 79.67 | % | 21.13 | x | $ | 0.40 | 2.46 | % | 54.05 | % | $ | 346 | 11.09 | % | 11.09 | % | NA | 0.39 | % | 3.40 | % | 0.41 | % | 3.53 | % | |||||||||||||||||||||||||||||||||||||||||||
| (1) | Closing price at date indicated, market value equal to public (minority shares) times current stock price. |
| (2) | Core earnings reflect net income less non-recurring items |
| (3) | P/E = Price to earnings; P/B = Price to book; P/A = Price to assets; P/TB = Price to tangible book value; and P/Core = Price to core earnings. P/E and P/Core =NM if the ratio is negative or above 35x. |
| (4) | Dividend is as of most recent quarterly dividend. Indicated 12 month dividend as a percent of trailing 12 month earnings. |
| (5) | ROAA (return on average assets) and ROAE (return on average equity) are indicated ratios based on trailing 12 month earnings and average equity and assets balances. |
| (6) | Excludes from averages and medians those companies the subject of actual or rumored acquisition activities or unusual operating characteristics. |
| (7) | Current Quarter is June 30, 2021, footnote reflects data as of March 31, 2021 or December 31, 2020. |
| Source: | S&P Global Market Intelligence and RP Financial, LC. calculations. The information provided in this report has been obtained from sources we believe are reliable, but we cannot guarantee the accuracy or completeness of such information. |
| RP® Financial, LC. | VALUATION ANALYSIS IV.24 |
Group’s median P/B and P/TB ratios of 90.88% and 98.14%, respectively, the Company’s pro forma P/B and P/TB ratios (fully-converted basis) at the midpoint value reflected discounts of 38.7% and 43.3%, respectively. At the top of the super range, the Company’s P/B and P/TB ratios (fully-converted basis) equaled 63.86, respectively. In comparison to the Peer Group’s average P/B and P/TB ratios, the Company’s P/B and P/TB ratios at the top of the super range reflected discounts of 29.6% and 31.3%, respectively. In comparison to the Peer Group’s median P/B and P/TB ratios, the Company’s P/B and P/TB ratios at the top of the super range reflected discounts of 29.7% and 34.9%, respectively. RP Financial considered the discounts under the P/B approach to be reasonable, given the nature of the calculation of the P/B ratio which mathematically results in a ratio discounted to book value. The discounts reflected under the P/B approach were also supported by the premiums reflected in the Company’s P/E multiples.
On an MHC reported basis, the Company’s P/B and P/TB ratios at the $50.0 million midpoint value equaled 76.10%, respectively. In comparison to the average P/B and P/TB ratios indicated for the Peer Group of 90.73% and 93.00%, respectively, CFSB Bancorp’s ratios were discounted by 16.1% on a P/B basis and 18.2% on a P/TB basis. In comparison to the Peer Group’s median P/B and P/TB ratios of 90.18% and 98.14%, respectively, the Company’s pro forma P/B and P/TB ratios (MHC basis) at the midpoint value reflected discounts of 16.3% and 22.5%, respectively. At the top of the super range, the Company’s P/B and P/TB ratios (MHC basis) equaled 92.25%, respectively. In comparison to the Peer Group’s average P/B and P/TB ratios, the Company’s P/B and P/TB ratios at the top of the super range reflected minimal premiums and discounts relative to the Peer Group averages
3. Price-to-Assets (“P/A”). The P/A valuation methodology determines market value by applying a valuation P/A ratio (fully-converted basis) to the Company’s pro forma asset base, conservatively assuming no deposit withdrawals are made to fund stock purchases. In all likelihood there will be deposit withdrawals, which results in understating the pro forma P/A ratio which is computed herein. At the $50.0 million midpoint of the valuation range, CFSB Bancorp’s pro forma P/A ratio (fully-converted basis) equaled 13.16% of pro forma assets. Comparatively, the Peer Group companies exhibited an average P/A ratio of 12.30%, which implies a premium of 6.99% has been applied to the Company’s pro forma P/A ratio. In comparison to the Peer Group’s median P/A ratio of 10.11%, the Company’s pro forma P/A ratio (fully-converted basis) at the midpoint value reflects a premium of 30.17%.
| RP® Financial, LC. | VALUATION ANALYSIS IV.25 |
On an MHC reported basis, CFSB Bancorp’s pro forma P/A ratio at the $50.0 million midpoint value equaled 14.05%. In comparison to the Peer Group’s average P/A ratio of 12.30%, CFSB Bancorp’s P/A ratio (MHC basis) indicated a premium of 14.23%. In comparison to the Peer Group’s median P/A ratio of 10.05%, CFSB Bancorp’s pro forma P/A ratio (MHC basis) at the midpoint value reflects a premium of 38.97%.
Comparison to Publicly-Traded MHCs
As indicated in Chapter III, we believe there are a number of characteristics of MHC shares that make them different from the shares of fully-converted companies. These factors include: (1) lower aftermarket liquidity in the MHC shares since less than 50% of the shares are available for trading; (2) no opportunity for public shareholders to exercise voting control; (3) the potential pro forma impact of second-step conversions on the pricing of MHC institutions; and, (4) the regulatory policies regarding the accounting for net assets held by the MHC in a second-step conversion and, thereby, lessening the attractiveness of paying cash dividends. The above characteristics of MHC shares have provided MHC stocks with different trading characteristics versus fully-converted companies. To account for the unique trading characteristics of MHC shares, RP Financial has placed the financial data and pricing ratios of the publicly-traded MHCs on a fully-converted basis to make them comparable for valuation purposes. Using the per share and pricing information of the publicly-traded MHCs on a fully-converted basis accomplishes a number of objectives. First, such figures eliminate distortions that result when trying to compare institutions that have different public ownership interests outstanding. Secondly, such an analysis provides ratios that are comparable to the pricing information of fully-converted public companies and are directly applicable to determining the pro forma market value range of the 100% ownership interest in CFSB Bancorp as an MHC. This technique is validated by the investment community’s evaluation of MHC pricing, which also incorporates the pro forma impact of a second-step conversion based on the current market price.
To calculate the fully-converted pricing information for MHCs, the reported financial information for the public MHCs incorporates the following assumptions: (1) all shares owned by the MHC are assumed to be sold at the current trading price in a second step-conversion; (2) the gross proceeds from such a sale are adjusted to reflect reasonable offering expenses and standard stock based benefit plan parameters that would be factored into a second-step conversion of an MHC institution; and (3) net proceeds are assumed to be reinvested at market
| RP® Financial, LC. | VALUATION ANALYSIS IV.26 |
rates on a tax effected basis. Book value per share and earnings per share figures for the public MHCs were adjusted by the impact of the assumed second step-conversion, resulting in an estimation of book value per share and earnings per share figures on a fully-converted basis. The top panel of Table 4.6 shows the calculation of per share financial data (fully-converted basis) for each of the ten publicly-traded MHC institutions, excluding those that have announced second step conversions. The bottom panel of Table 4.6 shows the same information for the mutual holding companies traded in the over the counter market since CFSB Bancorp falls at the lower end of market capitalization of the publicly traded group but at the upper end of the market capitalization for the MHC traded in the over the counter market.
Table 4.6 below shows a comparative pricing analysis of the publicly-traded MHCs on a fully-converted basis versus the Company’s Peer Group. In comparison to the Peer Group’s P/TB ratio, the fully converted P/TB ratio of the publicly-traded MHCs reflected a discount of 13.29%. In comparison to the Peer Group’s P/E multiple, the fully converted P/E multiple of the publicly-traded MHCs reflected a premium of 82.30%.
In comparison to the Peer Group’s P/TB ratio, the fully converted P/TB ratio of the MHCs traded over the counter reflected a discount of 36.45%. In comparison to the Peer Group’s P/E multiple, the fully converted P/E multiple of the publicly-traded MHCs reflected a premium of 35.66%. Detailed pricing characteristics of the fully-converted MHCs is shown in Table 4.7.
Table 4.6
Current Market Pricing Information
Publicly-Traded MHCs (Fully-Converted Basis) versus the Peer Group
| Publicly Traded | ||||||||
| MHCs | Peer Group | |||||||
| Pricing Ratios (Averages)(1) |
||||||||
| I. NASDAQ Traded |
||||||||
| Price/earnings (x) |
21.11 | x | 11.58 | x | ||||
| Price/tangible book (%) |
80.64 | % | 93.00 | % | ||||
| Price/assets (%) |
16.39 | % | 12.30 | % | ||||
| II. Traded Over the Counter |
||||||||
| Price/earnings (x) |
15.71 | x | 11.58 | x | ||||
| Price/tangible book (%) |
59.10 | % | 93.00 | % | ||||
| Price/assets (%) |
9.79 | % | 12.30 | % | ||||
| (1) | Based on market prices as of August 20, 2021. |
| RP® Financial, LC. | VALUATION ANALYSIS IV.27 |
Table 4.7
Peer Group of MHC Institutions, Implied Pricing Ratios, Full Conversion Basis
Financial Data as of the Most Recent Quarter or Twelve Month Period Available
Market Pricing as of August 20, 2021
| Key Financial Data(4) | ||||||||||||||||||||||||||||||||||||||||||||||||||||||||||||||
| Per Share Data | Pricing Ratios(4) | Dividends | LTM | |||||||||||||||||||||||||||||||||||||||||||||||||||||||||||
| Stock Price(1) |
Mkt Value(2) |
LTM EPS |
Tang. BV/Sh |
P/E LTM(3) |
Price/ Book |
Price/ TBk |
Price/ Assets |
Ann Div Rate |
Total Assets |
Tang. E/A |
Reported | |||||||||||||||||||||||||||||||||||||||||||||||||||
| Ticker |
Company Name |
City |
State |
Exchange |
ROAA | ROAE | ||||||||||||||||||||||||||||||||||||||||||||||||||||||||
| ($) | ($M) | ($) | ($) | (x) | (%) | (%) | (%) | ($) | ($000) | (%) | (%) | (%) | ||||||||||||||||||||||||||||||||||||||||||||||||||
| Publicly-Traded MHC Peer Group, Full Conversion Basis | ||||||||||||||||||||||||||||||||||||||||||||||||||||||||||||||
| Publicly Traded MHCs, Full Conversion Basis - Averages | $ | 15.65 | $ | 869.43 | $ | 0.52 | $ | 19.06 | 21.11 | 79.66 | 80.64 | 16.39 | $ | 0.60 | $ | 3,675,181 | 20.14 | 0.17 | 1.45 | |||||||||||||||||||||||||||||||||||||||||||
| Publicly Traded MHCs, Full Conversion Basis - Medians | 13.45 | 140.45 | 0.51 | 16.94 | 21.60 | 74.72 | 75.78 | 16.11 | 0.52 | 1,075,483 | 19.04 | 0.59 | 2.45 | |||||||||||||||||||||||||||||||||||||||||||||||||
| OTC MHCs, Full Conversion Basis All | ||||||||||||||||||||||||||||||||||||||||||||||||||||||||||||||
| OTC MHCs, Full Conversion Basis - Averages | $ | 13.51 | $ | 27.53 | $ | 1.29 | $ | 22.36 | 15.71 | 59.10 | 59.69 | 9.79 | $ | 0.15 | $ | 268,462 | 16.59 | 0.71 | 4.31 | |||||||||||||||||||||||||||||||||||||||||||
| OTC MHCs, Full Conversion Basis - Medians | 10.00 | 18.65 | 0.94 | 19.00 | 16.24 | 57.39 | 57.52 | 9.05 | 0.12 | 231,356 | 14.48 | 0.70 | 3.24 | |||||||||||||||||||||||||||||||||||||||||||||||||
| Publicly Traded MHCs, Full Conversion Basis | ||||||||||||||||||||||||||||||||||||||||||||||||||||||||||||||
| 1 |
BSBK | Bogota Financial Corp. | Teaneck | NJ | NASDAQCM | 10.35 | 149.30 | 0.41 | 14.41 | 25.22 | 71.68 | 71.81 | 16.92 | NA | 882,516 | 23.56 | 0.67 | 2.84 | ||||||||||||||||||||||||||||||||||||||||||||
| 2 |
CLBK | Columbia Financial, Inc. | Fair Lawn | NJ | NASDAQGS | 18.44 | 1,982.41 | 0.70 | 17.94 | 26.31 | 98.44 | 102.77 | 19.73 | NA | 10,048,316 | 19.20 | 0.75 | 3.74 | ||||||||||||||||||||||||||||||||||||||||||||
| 3 |
FSEA | First Seacoast Bancorp | Dover | NH | NASDAQCM | 9.80 | 58.96 | 0.30 | 14.60 | 32.73 | 67.13 | 67.13 | 11.65 | NA | 506,106 | 17.35 | 0.36 | 2.05 | ||||||||||||||||||||||||||||||||||||||||||||
| 4 |
GCBC | Greene County Bancorp, Inc. | Catskill | NY | NASDAQCM | 30.00 | 255.40 | 2.70 | 31.38 | 11.12 | 95.61 | 95.61 | 11.02 | 0.52 | 2,317,871 | 11.52 | 0.99 | 8.60 | ||||||||||||||||||||||||||||||||||||||||||||
| 5 |
KFFB | Kentucky First Federal Bancorp | Hazard | KY | NASDAQGM | 7.07 | 58.16 | (1.50 | ) | 9.65 | NM | 72.43 | 73.29 | 16.11 | 0.40 | 361,048 | 21.98 | -3.43 | -15.41 | |||||||||||||||||||||||||||||||||||||||||||
| 6 |
LSBK | Lake Shore Bancorp, Inc. | Dunkirk | NY | NASDAQGM | 14.90 | 85.88 | 0.83 | 22.99 | 17.99 | 64.81 | 64.81 | 11.34 | 0.56 | 756,942 | 17.51 | 0.63 | 3.60 | ||||||||||||||||||||||||||||||||||||||||||||
| 7 |
OFED | Oconee Federal Financial Corp. | Seneca | SC | NASDAQCM | 23.50 | 131.60 | 0.61 | 30.03 | NM | 77.01 | 78.26 | 20.99 | 0.40 | 626,904 | 26.82 | 0.54 | 2.00 | ||||||||||||||||||||||||||||||||||||||||||||
| 8 |
PBFS | Pioneer Bancorp, Inc. | Albany | NY | NASDAQCM | 12.00 | 311.73 | 0.19 | 14.06 | NM | 83.26 | 85.36 | 16.12 | NA | 1,934,192 | 18.88 | 0.25 | 1.31 | ||||||||||||||||||||||||||||||||||||||||||||
| 9 |
RBKB | Rhinebeck Bancorp, Inc. | Poughkeepsie | NY | NASDAQCM | 10.65 | 118.57 | 0.80 | 15.93 | 13.33 | 65.83 | 66.84 | 9.35 | NA | 1,268,450 | 13.99 | 0.70 | 4.94 | ||||||||||||||||||||||||||||||||||||||||||||
| 10 |
TFSL | TFS Financial Corporation | Cleveland | OH | NASDAQGS | 19.75 | 5,542.32 | 0.16 | 19.64 | NM | 100.36 | 100.54 | 30.71 | 1.12 | 18,049,463 | 30.54 | 0.26 | 0.83 | ||||||||||||||||||||||||||||||||||||||||||||
| Announced 2nd Step - Publicly Traded MHCs, Full Conversion Basis | ||||||||||||||||||||||||||||||||||||||||||||||||||||||||||||||
| 1 |
PDLB | PDL Community Bancorp | Bronx | NY | NASDAQGM | 13.58 | 235.31 | 0.76 | 16.28 | 17.95 | 83.42 | 83.42 | 14.19 | NA | 1,657,832 | 17.01 | 0.79 | 4.65 | ||||||||||||||||||||||||||||||||||||||||||||
| OTC MHCs, Full Conversion Basis | ||||||||||||||||||||||||||||||||||||||||||||||||||||||||||||||
| 1 |
FSGB | 1st Federal Savings Bank of SC, Inc. | Walterboro | SC | OTCPK | 14.00 | 14.18 | 0.91 | 20.20 | 15.36 | 69.30 | 69.30 | 10.58 | 0.00 | 134,032 | 15.27 | 0.69 | 4.51 | ||||||||||||||||||||||||||||||||||||||||||||
| 2 |
ABBB | Auburn Bancorp, Inc. | Auburn | ME | OTCPK | 12.30 | 6.19 | 0.76 | 21.65 | 16.24 | 56.81 | 56.81 | 6.05 | NA | 102,294 | 10.65 | 0.37 | 3.50 | ||||||||||||||||||||||||||||||||||||||||||||
| 3 |
BVFL | BV Financial, Inc. | Baltimore | MD | OTCPK | 18.75 | 133.21 | 0.99 | 22.59 | 18.92 | 75.46 | 83.02 | 14.71 | 0.00 | 905,608 | 17.72 | 0.78 | 3.99 | ||||||||||||||||||||||||||||||||||||||||||||
| 4 |
GOVB | Gouverneur Bancorp, Inc. | Gouverneur | NY | OTCPK | 10.00 | 20.31 | 0.51 | 19.00 | 19.73 | 52.63 | 52.63 | 14.11 | 0.24 | 143,965 | 26.81 | 0.72 | 2.67 | ||||||||||||||||||||||||||||||||||||||||||||
| 5 |
GVFF | Greenville Federal Financial Corporation | Greenville | OH | OTCPK | 8.06 | 17.43 | 0.27 | 14.24 | 30.04 | 56.58 | 56.58 | 7.47 | 0.28 | 233,305 | 13.21 | 0.25 | 1.88 | ||||||||||||||||||||||||||||||||||||||||||||
| 6 |
LSFG | Lifestore Financial Group, Inc. | West Jefferson | NC | OTCPK | 42.90 | 44.21 | 5.85 | 59.80 | 7.33 | 71.74 | 71.74 | 10.64 | 0.29 | 415,428 | 14.83 | 1.45 | 9.79 | ||||||||||||||||||||||||||||||||||||||||||||
| 7 |
LPBC | Lincoln Park Bancorp. | Pine Brook | NJ | OTCPK | 7.80 | 13.33 | (0.48 | ) | 13.56 | NM | 57.39 | 57.52 | 4.15 | 0.00 | 321,049 | 7.22 | -0.25 | -3.52 | |||||||||||||||||||||||||||||||||||||||||||
| 8 |
MBBC | Marathon Bancorp, Inc. | Wausau | WI | OTCPK | 10.60 | 10.63 | 0.97 | 32.76 | 10.90 | 32.36 | 32.36 | 4.69 | NA | 226,912 | 14.48 | 0.43 | 2.97 | ||||||||||||||||||||||||||||||||||||||||||||
| 9 |
MFDB | Mutual Federal Bancorp, Inc. | Chicago | IL | OTCPK | 3.90 | 12.84 | NA | 7.60 | NM | 51.34 | 51.34 | 13.25 | 0.00 | 96,922 | 25.80 | NA | NA | ||||||||||||||||||||||||||||||||||||||||||||
| 10 |
SNNF | Seneca Financial Corp. | Baldwinsville | NY | OTCPK | 9.75 | 18.65 | NA | 16.59 | NM | 58.77 | 58.77 | 8.06 | NA | 231,356 | 13.72 | NA | NA | ||||||||||||||||||||||||||||||||||||||||||||
| 11 |
SSBP | SSB Bancorp, Inc. | Pittsburgh | PA | OTCPK | 9.70 | 22.09 | NA | 14.37 | NM | 67.48 | 67.48 | 9.05 | NA | 244,163 | 13.41 | NA | NA | ||||||||||||||||||||||||||||||||||||||||||||
| 12 |
TBBA | TEB Bancorp, Inc | Wauwatosa | WI | OTCPK | 9.37 | 24.59 | 2.12 | 14.82 | 4.42 | 63.22 | 63.22 | 7.85 | NA | 313,120 | 12.42 | 1.78 | 14.30 | ||||||||||||||||||||||||||||||||||||||||||||
| 13 |
WAKE | Wake Forest Bancshares, Inc. | Wake Forest | NC | OTCPK | 18.52 | 20.28 | 1.00 | 33.56 | 18.48 | 55.19 | 55.19 | 16.65 | 0.40 | 121,846 | 30.16 | 0.90 | 2.99 | ||||||||||||||||||||||||||||||||||||||||||||
| (1) | Current stock price of minority stock. |
| (2) | Current stock price of minority stock times total shares (public and MHC) outstanding. |
| (3) | Earnings multiples above 35x or less than 0x deemed to be “not meaningful”. |
| (4) | Ratios are pro forma assuming a second step conversion to full stock form. |
| Source: | S&P Global Market Intelligence and RP Financial, LC. Calculations. The information provided in this report has been obtained from sources we believe are reliable, but we cannot guarantee the accuracy or completeness of such information. |
| RP® Financial, LC. | VALUATION ANALYSIS IV.28 |
In comparison to the publicly-traded MHCs, CFSB Bancorp’s pro forma P/TB ratio (fully-converted basis) of 55.68% at the midpoint of the valuation range reflected a discount of 30.95%. At the top of the super range, CFSB Bancorp’s P/TB ratio (fully-converted basis) of 63.86% reflected a discount of 20.81%. In comparison to the publicly-traded MHCs, CFSB Bancorp’s pro forma P/E multiple (fully-converted basis) of 54.58 times at the midpoint of the valuation range reflected a premium of 159%, which was materially higher at the top of the superrange. Relative to the fully converted P/TB ratios of the MHCs traded in the over the counter market, CFSB Bancorp fully converted value approximated the group at the approximate maximum of the valuation range.
It should be noted that in a comparison of the publicly-traded MHCs to CFSB Bancorp, the publicly-traded MHCs maintain certain inherit characteristics in support of increasing the attractiveness of their stocks relative to CFSB Bancorp’s stock as an MHC that will just be completing an IPO: (1) the seasoned publicly-traded MHCs are viewed as potential candidates to complete a second-step offering; and (2) some of the publicly-traded MHCs have been grandfathered to waive dividend payments to the MHC pursuant to receiving an annual majority vote by the depositors to approve the waiver of dividends.
Comparison to Recent Offerings
As indicated at the beginning of this section, RP Financial’s analysis of recent conversion offering pricing characteristics at closing and in the aftermarket has been limited to a “technical” analysis and, thus, the pricing characteristics of recent conversion offerings cannot be a primary determinate of value. Particular focus was placed on the P/TB approach in this analysis, since the P/E multiples do not reflect the actual impact of reinvestment and the source of the stock proceeds (i.e., external funds vs. deposit withdrawals).
As discussed previously, the one mutual holding company conversion offering that was completed this year had a pro forma fully converted P/TB ratio at closing of 55.8%. In comparison, the Company’s P/TB ratio (fully-converted basis) of 55.68% at the midpoint value and thus, was at parity to Marathon Bancorp’s pro forma fully converted P/TB ratio at closing. At the top of the range, the Company’s fully converted P/TB ratio of 63.86% reflects an implied premium of 14,4% relative to the fully converted P/TB ratio of the most recently completed minority stock issuance by an MHC.
| RP® Financial, LC. | VALUATION ANALYSIS IV.29 |
Valuation Conclusion
Based on the foregoing, it is our opinion that, as of August 20, 2021, the estimated aggregate pro forma market value of the shares to be issued immediately following the conversion, both shares issued publicly as well as to the MHC and the Foundation, equaled $50,000,000 at the midpoint, equal to 5,000,000 shares offered at a per share value of $10.00. Pursuant to conversion guidelines, the 15% offering range indicates a minimum value of $42,500,000 and a maximum value of $57,500,000. Based on the $10.00 per share offering price determined by the Board, this valuation range equates to total shares outstanding of 4,250,000 at the minimum and 5,750,000 at the maximum. In the event the appraised value is subject to an increase, the aggregate pro forma market value may be increased up to a super maximum value of $66,125,000 without a resolicitation. Based on the $10.00 per share offering price, the super maximum value would result in total shares outstanding of 6,612,500.
The Board of Directors has established a public offering range such that the public ownership of the Company will constitute a 43.0% ownership interest, prior to the issuance of shares to the Foundation. Accordingly, the offering to the public of the minority stock will equal $18,275,000 at the minimum, $21,500,000 at the midpoint, $24,725,000 at the maximum and $28,433,750 at the super maximum of the valuation range. Based on the public offering range and inclusive of the shares issued to the Foundation, equal to 2.0% of the shares issued in the conversion, the public ownership of shares will represent 45.0% of the shares issued throughout the valuation range. The pro forma valuation calculations relative to the Peer Group (fully-converted basis) are shown in Table 4.4 and are detailed in Exhibit IV-7 and Exhibit IV-8; the pro forma valuation calculations relative to the Peer Group based on reported financials are shown in Table 4.5 and are detailed in Exhibits IV-9 and IV-10.
EXHIBITS
RP® Financial, LC.
LIST OF EXHIBITS
| Exhibit Number |
Description | |
| I-1 | Map of Branch Office Network | |
| I-2 | Audited Financial Statements | |
| I-3 | Key Operating Ratios | |
| I-4 | Investment Securities | |
| I-5 | Yields and Costs | |
| I-6 | Loan Loss Allowance Activity | |
| I-7 | Interest Rate Risk Analysis | |
| I-8 | Fixed Rate and Adjustable Rate Loans | |
| I-9 | Loan Portfolio Composition | |
| I-10 | Contractual Maturity By Loan Type | |
| I-11 | Non-Performing Assets | |
| I-12 | Deposit Composition | |
| I-13 | CDs >$250,000 in balance by Maturity | |
| I-14 | Borrowings Details | |
| II-1 | Description of Office Facilities | |
| II-2 | Historical Interest Rates | |
| II-3 | Market Area Demographic/Economic Information | |
LIST OF EXHIBITS (continued)
| Exhibit Number |
Description | |
| III-1 | General Characteristics of Publicly-Traded Institutions | |
| III-2 | Peer Group Summary Demographic and Deposit Market Share Data | |
| IV-1 | Thrift Stock Prices: As of August 20, 2021 | |
| IV-2 | Historical Stock Price Indices | |
| IV-3 | Historical Thrift Stock Indices | |
| IV-4 | Market Area Acquisition Activity | |
| IV-5 | Director and Senior Management Summary Resumes | |
| IV-6 | Pro Forma Regulatory Capital Ratios | |
| IV-7 | Pro Forma Analysis Sheet – Fully Converted Basis | |
| IV-8 | Pro Forma Effect of Conversion Proceeds – Fully Converted Basis | |
| IV-9 | Pro Forma Analysis Sheet – MHC Basis | |
| IV-10 | Pro Forma Effect of Conversion Proceeds – MHC Basis | |
| V-1 | Firm Qualifications Statement | |
EXHIBIT I-1
Colonial Federal Savings Bank
Map of Branch Office Network
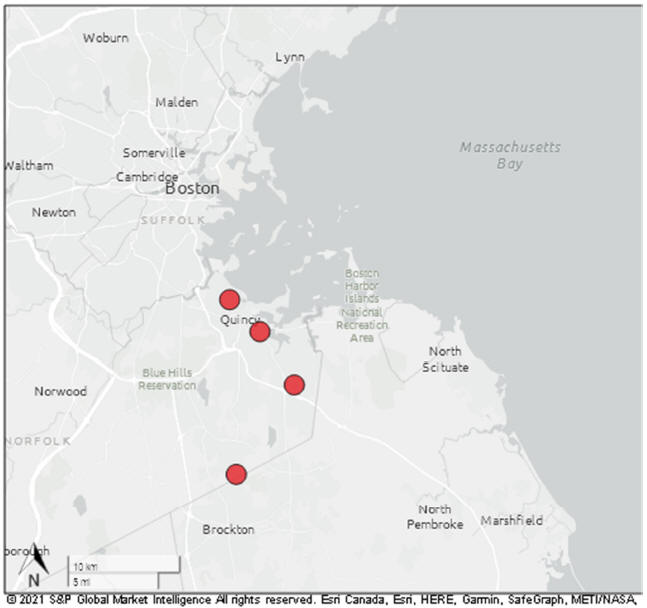
EXHIBIT I-2
Colonial Federal Savings Bank
Audited Financial Statements
(Incorporated by Reference)
EXHIBIT I-3
Colonial Federal Savings Bank
Key Operating Ratios
| At or For the Years Ended June 30, |
||||||||
| 2021 | 2020 | |||||||
| Performance Ratios: |
||||||||
| Return on average assets |
0.42 | % | 0.55 | % | ||||
| Return on average equity |
2.91 | % | 3.72 | % | ||||
| Interest rate spread(1) |
2.13 | % | 2.29 | % | ||||
| Net interest margin(2) |
2.31 | % | 2.53 | % | ||||
| Non-interest expense to average assets |
1.91 | % | 1.99 | % | ||||
| Efficiency ratio(3) |
78.90 | % | 75.30 | % | ||||
| Average interest-earning assets to average interest-bearing liabilities |
128.21 | % | 127.02 | % | ||||
| Average equity to average assets |
14.35 | % | 14.73 | % | ||||
| Capital Ratios: |
||||||||
| Total capital to risk-weighted assets |
29.70 | % | 30.00 | % | ||||
| Tier 1 capital to risk-weighted assets |
28.70 | % | 29.00 | % | ||||
| Common equity tier 1 capital to risk-weighted assets |
28.70 | % | 29.00 | % | ||||
| Tier 1 capital to average assets |
14.40 | % | 14.60 | % | ||||
| Asset Quality Ratios: |
||||||||
| Allowance for loan losses as a percentage of total loans |
0.98 | % | 0.88 | % | ||||
| Allowance for loan losses as a percentage of non-performing loans |
NM | NM | ||||||
| Net (charge-offs) recoveries to average outstanding loans during the year |
— | % | — | % | ||||
| Non-performing loans as a percentage of total loans |
— | % | — | % | ||||
| Non-performing loans as a percentage of total assets |
— | % | — | % | ||||
| Total non-performing assets as a percentage of total assets |
— | % | — | % | ||||
| Other: |
||||||||
| Number of offices |
4 | (4) | 4 | (4) | ||||
| Number of full-time equivalent employees |
31 | 29 | ||||||
| (1) | Represents the difference between the weighted average yield on interest-earning assets and the weighted average cost of interest-bearing liabilities. |
| (2) | Represents net interest income as a percentage of average interest-earning assets. |
| (3) | Represents non-interest expense divided by the sum of net interest income and non-interest income. |
| (4) | Includes one limited service branch office. |
Source: CFSB Bancorp’s Preliminary Offering Prospectus
EXHIBIT I-4
Colonial Federal Savings Bank
Investment Securities
| June 30, 2021 | ||||||||||||||||
| Amortized Cost |
Gross Unrealized Gains |
Gross Unrealized Losses |
Fair Value |
|||||||||||||
| (In Thousands) | ||||||||||||||||
| Securities available for sale |
||||||||||||||||
| Government-sponsored enterprises: |
||||||||||||||||
| Debt obligations |
$ | 1,983 | $ | 12 | $ | — | $ | 1,995 | ||||||||
| Mortgage-backed securities |
260 | 12 | $ | — | 272 | |||||||||||
| Collateralized mortgage obligations |
27 | — | — | 27 | ||||||||||||
|
|
|
|
|
|
|
|
|
|||||||||
| Total securities available for sale |
$ | 2,270 | $ | 24 | $ | — | $ | 2,294 | ||||||||
|
|
|
|
|
|
|
|
|
|||||||||
| Securities held to maturity |
||||||||||||||||
| Government-sponsored enterprises: |
||||||||||||||||
| Debt obligations |
$ | 1,001 | $ | 12 | $ | — | $ | 1,013 | ||||||||
| Mortgage-backed securities |
27,680 | 1,229 | (12 | ) | 28,897 | |||||||||||
| Collateralized mortgage obligations |
17 | 1 | — | 18 | ||||||||||||
| Municipal bonds |
38,360 | 458 | (216 | ) | 38,602 | |||||||||||
| Corporate bonds |
38,056 | 936 | (131 | ) | 38,861 | |||||||||||
|
|
|
|
|
|
|
|
|
|||||||||
| Total securities held to maturity |
$ | 105,114 | $ | 2,636 | $ | (359 | ) | $ | 107,391 | |||||||
|
|
|
|
|
|
|
|
|
|||||||||
| June 30, 2020 | ||||||||||||||||
| Amortized Cost |
Gross Unrealized Gains |
Gross Unrealized Losses |
Fair Value |
|||||||||||||
| (In Thousands) | ||||||||||||||||
| Securities available for sale |
||||||||||||||||
| Government-sponsored enterprises: |
||||||||||||||||
| Mortgage-backed securities |
$ | 344 | $ | 14 | $ | — | $ | 358 | ||||||||
| Collateralized mortgage obligations |
46 | — | (1 | ) | 45 | |||||||||||
| Total securities available for sale |
$ | 390 | $ | 14 | $ | (1 | ) | $ | 403 | |||||||
|
|
|
|
|
|
|
|
|
|||||||||
| Securities held to maturity |
||||||||||||||||
| Government-sponsored enterprises: |
||||||||||||||||
| Debt obligations |
$ | 2,007 | $ | 76 | $ | — | $ | 2,083 | ||||||||
| Mortgage-backed securities |
41,837 | 1,994 | (1 | ) | 43,830 | |||||||||||
| Collateralized mortgage obligations |
32 | 1 | — | 33 | ||||||||||||
| Municipal bonds |
24,900 | 592 | — | 25,492 | ||||||||||||
| Corporate bonds |
23,290 | 1,198 | (10 | ) | 24,478 | |||||||||||
|
|
|
|
|
|
|
|
|
|||||||||
| Total securities held to maturity |
$ | 92,066 | $ | 3,861 | $ | (11 | ) | $ | 95,916 | |||||||
|
|
|
|
|
|
|
|
|
|||||||||
Source: CFSB Bancorp’s audited financial statements.
EXHIBIT I-5
Colonial Federal Savings Bank
Yields and Costs
| For the Years Ended June 30, | ||||||||||||||||||||||||
| 2021 | 2020 | |||||||||||||||||||||||
| Average Outstanding Balance |
Interest | Average Yield/Rate |
Average Outstanding Balance |
Interest | Average Yield/Rate |
|||||||||||||||||||
| (Dollars in thousands) | ||||||||||||||||||||||||
| Interest-earning assets: |
||||||||||||||||||||||||
| Loans |
$ | 180,587 | $ | 7,099 | 3.93 | % | $ | 187,818 | $ | 7,660 | 4.08 | % | ||||||||||||
| Securities |
96,438 | 2,345 | 2.43 | % | 96,836 | 2,539 | 2.62 | % | ||||||||||||||||
| Other |
43,342 | 38 | 0.09 | % | 17,397 | 171 | 0.98 | % | ||||||||||||||||
|
|
|
|
|
|
|
|
|
|||||||||||||||||
| Total interest-earning assets |
320,366 | 9,482 | 2.96 | % | 302,051 | 10,370 | 3.43 | % | ||||||||||||||||
| Non-interest-earning assets |
12,918 | 12,563 | ||||||||||||||||||||||
|
|
|
|
|
|||||||||||||||||||||
| Total assets |
$ | 333,284 | $ | 314,614 | ||||||||||||||||||||
|
|
|
|
|
|||||||||||||||||||||
| Interest-bearing liabilities: |
||||||||||||||||||||||||
| Interest-bearing demand deposits |
$ | 29,324 | 14 | 0.05 | % | $ | 24,365 | 12 | 0.05 | % | ||||||||||||||
| Savings deposits |
64,962 | 66 | 0.10 | % | 59,707 | 61 | 0.10 | % | ||||||||||||||||
| Money market deposits |
33,386 | 120 | 0.36 | % | 30,613 | 122 | 0.40 | % | ||||||||||||||||
| Certificates of deposit |
120,150 | 1,817 | 1.51 | % | 117,530 | 2,373 | 2.02 | % | ||||||||||||||||
|
|
|
|
|
|
|
|
|
|||||||||||||||||
| Total interest-bearing deposits |
247,823 | 2,017 | 0.81 | % | 232,215 | 2,568 | 1.11 | % | ||||||||||||||||
| FHLB advances |
2,060 | 59 | 2.86 | % | 5,574 | 147 | 2.65 | % | ||||||||||||||||
|
|
|
|
|
|
|
|
|
|||||||||||||||||
| Total interest-bearing liabilities |
249,882 | 2,076 | 0.83 | % | 237,789 | 2,716 | 1.14 | % | ||||||||||||||||
|
|
|
|
|
|||||||||||||||||||||
| Non-interest-bearing demand deposits |
32,689 | 27,765 | ||||||||||||||||||||||
|
|
|
|
|
|||||||||||||||||||||
| Other non-interest-bearing liabilities |
2,896 | 2,727 | ||||||||||||||||||||||
|
|
|
|
|
|||||||||||||||||||||
| Total liabilities |
285,467 | 268,281 | ||||||||||||||||||||||
| Retained earnings |
47,817 | 46,323 | ||||||||||||||||||||||
|
|
|
|
|
|||||||||||||||||||||
| Total liabilities and equity |
$ | 333,284 | $ | 314,614 | ||||||||||||||||||||
|
|
|
|
|
|||||||||||||||||||||
| Net interest income |
$ | 7,406 | $ | 7,655 | ||||||||||||||||||||
|
|
|
|
|
|||||||||||||||||||||
| Net interest rate spread(1) |
2.13 | % | 2.29 | % | ||||||||||||||||||||
| Net interest-earning assets(2) |
$ | 70,484 | $ | 64,262 | ||||||||||||||||||||
|
|
|
|
|
|||||||||||||||||||||
| Net interest margin(3) |
2.31 | % | 2.53 | % | ||||||||||||||||||||
| Average interest-earning assets to interest-bearing liabilities |
128.21 | % | 127.02 | % | ||||||||||||||||||||
| (1) | Net interest rate spread represents the difference between the weighted average yield earned on interest-earning assets and the weighted average rate paid on interest-bearing liabilities. |
| (2) | Net interest-earning assets represent total interest-earning assets less total interest-bearing liabilities. |
| (3) | Net interest margin represents net interest income divided by average total interest-earning assets. |
EXHIBIT I-6
Colonial Federal Savings Bank
Loan Loss Allowance Activity
| At or For the Years Ended June 30, |
||||||||
| 2021 | 2020 | |||||||
| (Dollars in thousands) | ||||||||
| Allowance for loan losses at beginning of year |
$ | 1,662 | $ | 1,612 | ||||
| Provision for loan losses |
60 | 50 | ||||||
| Charge-offs: |
||||||||
| Consumer |
— | 1 | ||||||
|
|
|
|
|
|||||
| Total charge-offs |
— | 1 | ||||||
|
|
|
|
|
|||||
| Recoveries: |
||||||||
| Real estate loans: |
||||||||
| One- to four-family residential |
— | 1 | ||||||
| Total recoveries |
— | 1 | ||||||
|
|
|
|
|
|||||
| Net recoveries |
— | 1 | ||||||
|
|
|
|
|
|||||
| Allowance at end of year |
$ | 1,722 | $ | 1,662 | ||||
|
|
|
|
|
|||||
| Allowance to non-performing loans |
NM | NM | ||||||
| Allowance to total loans outstanding at the end of the year |
0.98 | % | 0.88 | % | ||||
| Net (charge-offs) recoveries to average loans outstanding during the year |
— | % | — | % | ||||
Source: CFSB Bancorp’s Preliminary Offering Prospectus
EXHIBIT I-7
Colonial Federal Savings Bank
Interest Rate Risk Analysis
| Change in Interest Rates (basis points) (1) |
Net Interest Income Year 1 Forecast |
Year 1 Change from Level |
||||||
| (Dollars in thousands) | ||||||||
| +400 |
$ | 8,488 | 8.7 | % | ||||
| +300 |
8,383 | 7.4 | % | |||||
| +200 |
8,261 | 5.8 | % | |||||
| +100 |
8,071 | 3.4 | % | |||||
| Level |
7,809 | — | % | |||||
| -100 |
7,250 | (7.2 | )% | |||||
| (1) | Assumes an immediate uniform change in interest rates at all maturities. |
| At June 30, 2021 |
||||||||||||||||||||
| EVE as a Percentage
of Present Value of Assets(3) |
||||||||||||||||||||
| Change in Interest Rates (basis points)(1) |
Estimated EVE(2) |
Estimated (Decrease) in EVE |
(Decrease) | |||||||||||||||||
| Amount | Percent | EVE Ratio(4) |
(basis points) |
|||||||||||||||||
| (Dollars in thousands) | ||||||||||||||||||||
| +400 |
$ | 39,389 | $ | (12,982 | ) | (24.8 | )% | 13.0 | % | (227 | ) | |||||||||
| +300 |
42,845 | (9,526 | ) | (18.2 | )% | 13.7 | % | (156 | ) | |||||||||||
| +200 |
46,425 | (5,946 | ) | (11.4 | )% | 14.4 | % | (88 | ) | |||||||||||
| +100 |
49,931 | (2,440 | ) | (4.7 | )% | 15.0 | % | (28 | ) | |||||||||||
| — |
52,371 | — | — | % | 15.3 | % | — | |||||||||||||
| -100 |
50,786 | (1,585 | ) | (3.0 | )% | 14.6 | % | (70 | ) | |||||||||||
| (1) | Assumes an immediate uniform change in interest rates at all maturities |
| (2) | EVE is the discounted present value of expected cash flows from assets, liabilities and off-balance sheet contracts. |
| (3) | Present value of assets represents the discounted present value of incoming cash flows on interest-earning assets. |
| (4) | EVE Ratio represents EVE divided by the present value of assets. |
Source: CFSB Bancorp’s Preliminary Offering Prospectus
EXHIBIT I-8
Colonial Federal Savings Bank
Fixed Rate and Adjustable Rate Loans
| Due After June 30, 2022 | ||||||||||||
| Fixed | Adjustable | Total | ||||||||||
| (In thousands) | ||||||||||||
| Real estate loans: |
||||||||||||
| One- to four-family residential |
$ | 130,050 | $ | 9,536 | $ | 139,586 | ||||||
| Multi-family |
2,237 | 13,631 | 15,868 | |||||||||
| Second mortgage and home equity lines of credit |
1,046 | 1,408 | 2,454 | |||||||||
| Commercial |
3,298 | 13,068 | 16,366 | |||||||||
| Consumer |
1,993 | — | 1,998 | |||||||||
|
|
|
|
|
|
|
|||||||
| Total loans |
$ | 138,745 | $ | 37,741 | $ | 176,267 | ||||||
|
|
|
|
|
|
|
|||||||
Source: CFSB Bancorp’s Preliminary Offering Prospectus
EXHIBIT I-9
Colonial Federal Savings Bank
Loan Portfolio Composition
| At June 30, | ||||||||||||||||
| 2021 | 2020 | |||||||||||||||
| Amount | Percent | Amount | Percent | |||||||||||||
| (Dollars in thousands) | ||||||||||||||||
| Real estate loans: |
||||||||||||||||
| One- to four-family residential |
$ | 139,687 | 79.15 | % | $ | 147,565 | 78.19 | % | ||||||||
| Multi-family |
15,868 | 8.99 | 18,377 | 9.74 | ||||||||||||
| Second mortgages and home equity lines of credit |
2,454 | 1.39 | 2,726 | 1.44 | ||||||||||||
| Commercial |
16,366 | 9.27 | 18,213 | 9.65 | ||||||||||||
| Consumer |
2,111 | 1.20 | 1,855 | 0.98 | ||||||||||||
|
|
|
|
|
|
|
|
|
|||||||||
| 176,486 | 100.00 | % | 188,736 | 100.00 | % | |||||||||||
|
|
|
|
|
|||||||||||||
| Less: |
||||||||||||||||
| Allowance for losses |
(1,722 | ) | (1,662 | ) | ||||||||||||
| Net deferred loan fees |
(331 | ) | (235 | ) | ||||||||||||
|
|
|
|
|
|||||||||||||
| Total loans |
$ | 174,433 | $ | 186,839 | ||||||||||||
|
|
|
|
|
|||||||||||||
Source: CFSB Bancorp’s Preliminary Offering Prospectus
EXHIBIT I-10
Colonial Federal Savings Bank
Contractual Maturity By Loan Type
| One- to Four- Family Residential Real Estate |
Multi-family | Second Mortgages and Home Equity Lines of Credit |
Commercial Real Estate |
|||||||||||||
| (In thousands) | ||||||||||||||||
| Amounts due in: |
||||||||||||||||
| One year or less |
$ | 90 | $ | — | $ | 12 | $ | — | ||||||||
| More than one to five years |
1,345 | 94 | 39 | 383 | ||||||||||||
| More than five to15 years |
35,086 | 1,673 | 1,149 | 2,430 | ||||||||||||
| More than 15 years |
103,166 | 14,101 | 1,254 | 13,553 | ||||||||||||
|
|
|
|
|
|
|
|
|
|||||||||
| Total |
$ | 139,687 | $ | 15,868 | $ | 2,454 | $ | 16,366 | ||||||||
|
|
|
|
|
|
|
|
|
|||||||||
| Consumer | Total | |||||||
| (In thousands) | ||||||||
| Amounts due in: |
||||||||
| One year or less |
$ | 117 | $ | 219 | ||||
| More than one to five years |
721 | 2,582 | ||||||
| More than five to 15 years |
1,273 | 41,611 | ||||||
| More than 15 years |
— | 132,074 | ||||||
|
|
|
|
|
|||||
| Total |
$ | 2,111 | $ | 176,486 | ||||
|
|
|
|
|
|||||
Source: CFSB Bancorp’s Preliminary Offering Prospectus
EXHIBIT I-11
Colonial Federal Savings Bank
Non-Performing Assets
| At June 30, | ||||||||
| 2021 | 2020 | |||||||
| (Dollars in thousands) | ||||||||
| Non-accrual loans: |
||||||||
| Total non-accrual loans |
$ | — | $ | — | ||||
|
|
|
|
|
|||||
| Accruing loans past due 90 days or more |
— | — | ||||||
| Total accruing loans past due 90 days or more |
— | — | ||||||
|
|
|
|
|
|||||
| Total non-performing loans |
$ | — | $ | — | ||||
|
|
|
|
|
|||||
| Foreclosed assets |
— | — | ||||||
|
|
|
|
|
|||||
| Total non-performing assets |
$ | — | $ | — | ||||
|
|
|
|
|
|||||
| Non-accruing troubled debt restructurings |
$ | — | $ | — | ||||
| Total accruing troubled debt restructured loans |
$ | — | $ | — | ||||
| Total non-performing loans to total loans |
— | % | — | % | ||||
| Total non-accrual loans to total loans |
— | % | — | % | ||||
| Total non-performing assets to total assets |
— | % | — | % | ||||
Source: CFSB Bancorp’s Preliminary Offering Prospectus
EXHIBIT I-12
Colonial Federal Savings Bank
Deposit Composition
| At June 30, | ||||||||||||||||||||||||
| 2021 | 2020 | |||||||||||||||||||||||
| Amount | Percent | Average Rate |
Amount | Percent | Average Rate |
|||||||||||||||||||
| (Dollars in thousands) | ||||||||||||||||||||||||
| Non-interest-bearing demand deposits |
$ | 30,129 | 10.59 | % | — | % | $ | 24,941 | 8.99 | % | — | % | ||||||||||||
| Interest-bearing demand deposits |
32,616 | 11.46 | 0.05 | 29,014 | 10.46 | 0.05 | ||||||||||||||||||
| Savings deposits |
68,998 | 24.24 | 0.10 | 61,654 | 22.22 | 0.10 | ||||||||||||||||||
| Money market deposits |
41,319 | 14.52 | 0.26 | 31,123 | 11.22 | 0.26 | ||||||||||||||||||
| Certificates of deposit |
111,572 | 39.20 | 0.86 | 130,736 | 47.12 | 1.93 | ||||||||||||||||||
|
|
|
|
|
|
|
|
|
|||||||||||||||||
| Total |
$ | 284,634 | 100.00 | % | 0.41 | % | $ | 277,468 | 100.00 | % | 0.98 | % | ||||||||||||
|
|
|
|
|
|
|
|
|
|||||||||||||||||
Source: CFSB Bancorp’s Preliminary Offering Prospectus
EXHIBIT I-13
Colonial Federal Savings Bank
CDs >$100,000 in Balance by Maturity
| At June 30, 2021 |
||||
| (In thousands) | ||||
| Maturity Period: |
||||
| Three months or less |
$ | 2,381 | ||
| Over three through six months |
242 | |||
| Over six through twelve months |
2,019 | |||
| Over twelve months |
6,190 | |||
|
|
|
|||
| Total |
$ | 10,832 | ||
|
|
|
|||
Source: CFSB Bancorp’s Preliminary Offering Prospectus
EXHIBIT I-14
Colonial Federal Savings Bank
Borrowings Detail
Colonial may obtain advances from the Federal Home Loan Bank of Boston upon the security of the Bank’scapital stock in the Federal Home Loan Bank of Boston and certain of the Bank’smortgage loans. Such advances may be made pursuant to several different credit programs, each of which has its own interest rate and range of maturities. The Bank may such advances to provide short-term funding as a supplement to the Bank’s deposits. To the extent such borrowings have different terms to repricing than the Bank’s deposits, they can change its interest rate risk profile. At June 30, 2021, Colonial had $918,000 in advances from the Federal Home Loan Bank of Boston. At June 30, 2021, Colonial had the capacity to borrow an additional $65.0 million in Federal Home Loan Bank of Boston advances.
Additionally, at June 30, 2021 the Bank had a $2.4 million available line of credit with the Federal Home Loan Bank of Boston, none of which was drawn at June 30, 2021.
Source: CFSB Bancorp’s Preliminary Offering Prospectus
EXHIBIT II-1
Colonial Federal Savings Bank
Description of Office Facilities
The Bank conducts operations from the main office in Quincy, Massachusetts and two additional branch offices in Holbrook and Weymouth, Massachusetts. Colonial also maintains a limited branch office located within, and only available to residents of, a senior citizen housing facility in Quincy, Massachusetts. All of the Bank’s branch offices are located in Norfolk County, Massachusetts.
Source: CFSB Bancorp’s Preliminary Offering Prospectus
EXHIBIT II-2
Colonial Federal Savings Bank
Historical Interest Rates
Exhibit II-2
Historical Interest Rates(1)
| Year/Qtr. Ended |
Prime Rate |
90 Day T-Note |
One Year T-Note |
10 Year T-Note |
||||||||||||
| 2008: Quarter 1 |
5.25 | % | 1.38 | % | 1.55 | % | 3.45 | % | ||||||||
| Quarter 2 |
5.00 | % | 1.90 | % | 2.36 | % | 3.99 | % | ||||||||
| Quarter 3 |
5.00 | % | 0.92 | % | 1.78 | % | 3.85 | % | ||||||||
| Quarter 4 |
3.25 | % | 0.11 | % | 0.37 | % | 2.25 | % | ||||||||
| 2009: Quarter 1 |
3.25 | % | 0.21 | % | 0.57 | % | 2.71 | % | ||||||||
| Quarter 2 |
3.25 | % | 0.19 | % | 0.56 | % | 3.53 | % | ||||||||
| Quarter 3 |
3.25 | % | 0.14 | % | 0.40 | % | 3.31 | % | ||||||||
| Quarter 4 |
3.25 | % | 0.06 | % | 0.47 | % | 3.85 | % | ||||||||
| 2010: Quarter 1 |
3.25 | % | 0.16 | % | 0.41 | % | 3.84 | % | ||||||||
| Quarter 2 |
3.25 | % | 0.18 | % | 0.32 | % | 2.97 | % | ||||||||
| Quarter 3 |
3.25 | % | 0.18 | % | 0.32 | % | 2.97 | % | ||||||||
| Quarter 4 |
3.25 | % | 0.12 | % | 0.29 | % | 3.30 | % | ||||||||
| 2011: Quarter 1 |
3.25 | % | 0.09 | % | 0.30 | % | 3.47 | % | ||||||||
| Quarter 2 |
3.25 | % | 0.03 | % | 0.19 | % | 3.18 | % | ||||||||
| Quarter 3 |
3.25 | % | 0.02 | % | 0.13 | % | 1.92 | % | ||||||||
| Quarter 4 |
3.25 | % | 0.02 | % | 0.12 | % | 1.89 | % | ||||||||
| 2012: Quarter 1 |
3.25 | % | 0.07 | % | 0.19 | % | 2.23 | % | ||||||||
| Quarter 2 |
3.25 | % | 0.09 | % | 0.21 | % | 1.67 | % | ||||||||
| Quarter 3 |
3.25 | % | 0.10 | % | 0.17 | % | 1.65 | % | ||||||||
| Quarter 4 |
3.25 | % | 0.05 | % | 0.16 | % | 1.78 | % | ||||||||
| 2013: Quarter 1 |
3.25 | % | 0.07 | % | 0.14 | % | 1.87 | % | ||||||||
| Quarter 2 |
3.25 | % | 0.04 | % | 0.15 | % | 2.52 | % | ||||||||
| Quarter 3 |
3.25 | % | 0.02 | % | 0.10 | % | 2.64 | % | ||||||||
| Quarter 4 |
3.25 | % | 0.07 | % | 0.13 | % | 3.04 | % | ||||||||
| 2014: Quarter 1 |
3.25 | % | 0.05 | % | 0.13 | % | 2.73 | % | ||||||||
| Quarter 2 |
3.25 | % | 0.04 | % | 0.11 | % | 2.53 | % | ||||||||
| Quarter 3 |
3.25 | % | 0.02 | % | 0.13 | % | 2.52 | % | ||||||||
| Quarter 4 |
3.25 | % | 0.04 | % | 0.25 | % | 2.17 | % | ||||||||
| 2015: Quarter 1 |
3.25 | % | 0.03 | % | 0.26 | % | 1.94 | % | ||||||||
| Quarter 2 |
3.25 | % | 0.01 | % | 0.28 | % | 2.35 | % | ||||||||
| Quarter 3 |
3.25 | % | 0.00 | % | 0.33 | % | 2.06 | % | ||||||||
| Quarter 4 |
3.50 | % | 0.16 | % | 0.65 | % | 2.27 | % | ||||||||
| 2016: Quarter 1 |
3.50 | % | 0.21 | % | 0.59 | % | 1.78 | % | ||||||||
| Quarter 2 |
3.50 | % | 0.26 | % | 0.45 | % | 1.49 | % | ||||||||
| Quarter 3 |
3.50 | % | 0.29 | % | 0.59 | % | 1.60 | % | ||||||||
| Quarter 4 |
3.75 | % | 0.51 | % | 0.85 | % | 2.45 | % | ||||||||
| 2017: Quarter 1 |
4.00 | % | 0.76 | % | 1.03 | % | 2.40 | % | ||||||||
| Quarter 2 |
4.25 | % | 1.03 | % | 1.24 | % | 2.31 | % | ||||||||
| Quarter 3 |
4.25 | % | 1.06 | % | 1.31 | % | 2.33 | % | ||||||||
| Quarter 4 |
4.50 | % | 1.39 | % | 1.76 | % | 2.40 | % | ||||||||
| 2018: Quarter 1 |
4.75 | % | 1.73 | % | 2.09 | % | 2.74 | % | ||||||||
| Quarter 2 |
5.00 | % | 1.93 | % | 2.33 | % | 2.85 | % | ||||||||
| Quarter 3 |
5.25 | % | 2.19 | % | 2.59 | % | 3.05 | % | ||||||||
| Quarter 4 |
5.50 | % | 2.45 | % | 2.63 | % | 2.69 | % | ||||||||
| 2019: Quarter 1 |
5.50 | % | 2.40 | % | 2.40 | % | 2.41 | % | ||||||||
| Quarter 2 |
5.00 | % | 2.12 | % | 1.92 | % | 2.00 | % | ||||||||
| Quarter 3 |
4.75 | % | 1.88 | % | 1.75 | % | 1.68 | % | ||||||||
| Quarter 4 |
4.75 | % | 1.55 | % | 1.59 | % | 1.92 | % | ||||||||
| 2020: Quarter 1 |
3.25 | % | 0.11 | % | 0.17 | % | 0.70 | % | ||||||||
| Quarter 2 |
3.25 | % | 0.16 | % | 0.16 | % | 0.66 | % | ||||||||
| Quarter 3 |
3.25 | % | 0.10 | % | 0.12 | % | 0.69 | % | ||||||||
| Quarter 4 |
3.25 | % | 0.09 | % | 0.10 | % | 0.93 | % | ||||||||
| 2021: Quarter 1 |
3.25 | % | 0.05 | % | 0.07 | % | 1.74 | % | ||||||||
| Quarter 2 |
3.25 | % | 0.05 | % | 0.07 | % | 1.45 | % | ||||||||
| As of August 20, 2021 |
3.25 | % | 0.05 | % | 0.06 | % | 1.26 | % | ||||||||
| (1) | End of period data. |
Sources: Federal Reserve and The Wall Street Journal.
EXHIBIT II-3
Colonial Federal Savings Bank
Market Area Demographic/Economic Information
(MI KEY: 1000588; SPCIQ KEY: 4613254)
Ownership: Pending
| PROJECTED | CURRENT | ACTUAL | ||||
| 2026 |
2021 |
2010 | ||||
| Population |
|
|
| |||
| Population (actual) |
6,091 | 5,943 | 5,605 | |||
| Aggregate Change: CAGR (%) |
0.49 | 0.53 | ||||
| Market Weighted Change: CAGR (%) |
0.49 | 0.54 | ||||
| National Change: CAGR (%) |
0.58 | 0.63 | ||||
| Age brackets (actual) |
|
|
| |||
| Population 0-14 (actual) |
974 | 991 | 1,043 | |||
| Population 15-34 (actual) |
1,490 | 1,494 | 1,343 | |||
| Population 35-54 (actual) |
1,534 | 1,551 | 1,699 | |||
| Population 55-69 (actual) |
1,286 | 1,187 | 936 | |||
| Population 70+ (actual) |
807 | 720 | 584 | |||
| Percent of total (%) |
|
|
| |||
| Pop Age 0-14/ Pop (%) |
15.99 | 16.68 | 18.61 | |||
| Pop Age 15-34/ Pop (%) |
24.46 | 25.14 | 23.96 | |||
| Pop Age 35-54/ Pop (%) |
25.18 | 26.10 | 30.31 | |||
| Pop Age 55-69/ Pop (%) |
21.11 | 19.97 | 16.70 | |||
| Pop Age 70+/ Pop (%) |
13.25 | 12.12 | 10.42 | |||
| Households (actual) |
2,362 | 2,299 | 2,155 | |||
| Aggregate Change: CAGR (%) |
0.54 | 0.59 | ||||
| Market Weighted Change: CAGR (%) |
0.54 | 0.59 | ||||
| National Change: CAGR (%) |
0.61 | 0.68 | ||||
| Income |
|
|
| |||
| Per Capita Income ($) |
65,959 | 60,544 | ||||
| National Median Per Capita ($) |
41,788 | 37,689 | ||||
| Aggregate Change: CAGR (%) |
1.72 | |||||
| Market Weighted Change: CAGR (%) |
1.73 | |||||
| National Change: CAGR (%) |
2.09 | |||||
| Median Household Income ($) |
118,393 | 108,468 | ||||
| National Median Household ($) |
73,868 | 67,761 | ||||
| Aggregate Change: CAGR (%) |
1.77 | |||||
| Market Weighted Change: CAGR (%) |
1.77 | |||||
| National Change: CAGR (%) |
1.74 | |||||
| Income brackets (actual) |
|
|
| |||
| HH w Income < $25K (actual) |
240 | 257 | ||||
| HH w Income $25K-$49K (actual) |
259 | 275 | ||||
| HH w Income $50K-$99K (actual) |
515 | 540 | ||||
| HH: Annual Income $100K+ (actual) |
1,347 | 1,227 | ||||
| Percent of total (%) |
|
|
| |||
| HH w Income < $25K/ HH (%) |
10.16 | 11.18 | ||||
| HH w Income $25K-$49K/ HH (%) |
10.97 | 11.96 | ||||
| HH w Income $50K-$99K/ HH (%) |
21.80 | 23.49 | ||||
| Annual Income $100K+/ HH (%) |
57.03 | 53.37 | ||||
Company demographics represent the demographic attributes of the company, aggregated up from the county level for all markets in which the company has a presence (this excludes territories). We use two methodologies to derive these values.
1. Aggregate method uses deposit market share to calculate the overall demographic characteristics of the company. For example, if the focus company has a 50% deposit market share in a county of 100,000 people, then 50,000 people are allocated to the aggregate company population. Aggregate compound annual growth rate (CAGR) represents the change in the aggregate company demographic.
2. Market Weighted demographics represent the weighted average demographic attributes of all of the counties in which the company has a presence. Counties are weighted by percent of total company deposits in each market. For example, if the company has 10% of their total deposits in a county of 100,000 people and 90% of their total deposits in a county of 10,000 people, then the Market Weighted population is 19,000 - the weighted average of the two markets. Market Weighted compound annual growth rate (CAGR) represents the weighted average of the county demographic growth rates.
S&P Global Market Intelligence recommends using a combination of both metrics to gauge the growth rates of a company.
Demographic data is provided by Claritas based primarily on US Census data. For non-census year data, Claritas uses samples and projections to estimate the demographic data. S&P Global Market Intelligence performs calculations on the underlying data provided by Claritas for some of the data presented on this page.
EXHIBIT III-1
Colonial Federal Savings Bank
General Characteristics of Publicly-Traded Institutions
Exhibit III-1
Publicly-Traded Savings Institutions General Characteristics
As of June 30, 2021 or the Most Recent Date Available
| As of August 20, 2021 |
||||||||||||||||||||||||||||||||
| Ticker |
Financial Institution |
Exchange |
Region |
City |
State |
Total Assets |
Offices | Fiscal Mth End |
Conv. Date |
Stock Price |
Market Value |
|||||||||||||||||||||
| ($Mil) | ($) | ($Mil) | ||||||||||||||||||||||||||||||
| All Publicly Traded Savings Institutions |
||||||||||||||||||||||||||||||||
| BCOW |
1895 Bancorp of Wisconsin, Inc. | NASDAQCM | MW | Greenfield | WI | 606 | 6 | Dec | 1/8/19 | 10.90 | 70 | |||||||||||||||||||||
| AFBI |
Affinity Bancshares, Inc. | NASDAQCM | SE | Covington | GA | 787 | 3 | Dec | 4/27/17 | 13.49 | 93 | |||||||||||||||||||||
| AX |
Axos Financial, Inc. | NYSE | WE | Las Vegas | NV | 14,266 | 1 | Jun | 3/14/05 | 48.69 | 2,888 | |||||||||||||||||||||
| BLFY |
Blue Foundry Bancorp | NASDAQGS | MA | Rutherford | NJ | 2,577 | 17 | Dec | 7/15/21 | 13.50 | 385 | |||||||||||||||||||||
| BSBK |
Bogota Financial Corp. | NASDAQCM | MA | Teaneck | NJ | 819 | 8 | Dec | 1/15/20 | 10.35 | 144 | |||||||||||||||||||||
| BYFC |
Broadway Financial Corporation | NASDAQCM | WE | Los Angeles | CA | 1,041 | 4 | Dec | 1/8/96 | 3.07 | 119 | |||||||||||||||||||||
| CFFN |
Capitol Federal Financial, Inc. | NASDAQGS | MW | Topeka | KS | 9,650 | 54 | Sep | 3/31/99 | 11.51 | 1,560 | |||||||||||||||||||||
| CARV |
Carver Bancorp, Inc. | NASDAQCM | MA | New York | NY | 683 | 7 | Mar | 10/24/94 | 16.80 | 58 | |||||||||||||||||||||
| CBMB |
CBM Bancorp, Inc. | NASDAQCM | MA | Baltimore | MD | 250 | 4 | Dec | 9/27/18 | 14.75 | 48 | |||||||||||||||||||||
| CNNB |
Cincinnati Bancorp, Inc. | NASDAQCM | MW | Cincinnati | OH | 250 | 6 | Dec | 10/14/15 | 14.10 | 41 | |||||||||||||||||||||
| CLBK |
Columbia Financial, Inc. | NASDAQGS | MA | Fair Lawn | NJ | 9,067 | 61 | Dec | 4/19/18 | 18.44 | 1,998 | |||||||||||||||||||||
| CULL |
Cullman Bancorp, Inc. | NASDAQCM | SE | Cullman | AL | 376 | 4 | Dec | 10/8/09 | 11.49 | 85 | |||||||||||||||||||||
| ESBK |
Elmira Savings Bank | NASDAQCM | MA | Elmira | NY | 649 | 12 | Dec | 3/1/85 | 13.86 | 49 | |||||||||||||||||||||
| ESSA |
ESSA Bancorp, Inc. | NASDAQGS | MA | Stroudsburg | PA | 1,822 | 22 | Sep | 4/3/07 | 16.58 | 163 | |||||||||||||||||||||
| FFBW |
FFBW, Inc. | NASDAQCM | MW | Brookfield | WI | 353 | 6 | Dec | 10/10/17 | 11.35 | 73 | |||||||||||||||||||||
| FNWB |
First Northwest Bancorp | NASDAQGM | WE | Port Angeles | WA | 1,787 | 14 | Dec | 1/29/15 | 18.75 | 170 | |||||||||||||||||||||
| FSEA |
First Seacoast Bancorp | NASDAQCM | NE | Dover | NH | 478 | 5 | Dec | 7/16/19 | 9.80 | 57 | |||||||||||||||||||||
| FBC |
Flagstar Bancorp, Inc. | NYSE | MW | Troy | MI | 27,065 | 159 | Dec | 4/30/97 | 48.43 | 2,560 | |||||||||||||||||||||
| FSBW |
FS Bancorp, Inc. | NASDAQCM | WE | Mountlake Terrace | WA | 2,223 | 23 | Dec | 7/9/12 | 33.72 | 273 | |||||||||||||||||||||
| GBNY |
Generations Bancorp NY, Inc. | NASDAQCM | MA | Seneca Falls | NY | 380 | 10 | Dec | 7/10/06 | 10.28 | 25 | |||||||||||||||||||||
| GCBC |
Greene County Bancorp, Inc. | NASDAQCM | MA | Catskill | NY | 2,200 | 19 | Jun | 12/30/98 | 30.00 | 255 | |||||||||||||||||||||
| HONE |
HarborOne Bancorp, Inc. | NASDAQGS | NE | Brockton | MA | 4,616 | 30 | Dec | 6/29/16 | 13.77 | 711 | |||||||||||||||||||||
| HIFS |
Hingham Institution for Savings | NASDAQGM | NE | Hingham | MA | 2,974 | 9 | Dec | 12/13/88 | 306.54 | 657 | |||||||||||||||||||||
| HMNF |
HMN Financial, Inc. | NASDAQGM | MW | Rochester | MN | 981 | 14 | Dec | 6/30/94 | 22.99 | 103 | |||||||||||||||||||||
| HFBL |
Home Federal Bancorp, Inc. of Louisiana | NASDAQCM | SW | Shreveport | LA | 566 | 8 | Jun | 1/18/05 | 18.50 | 58 | |||||||||||||||||||||
| HVBC |
HV Bancorp, Inc. | NASDAQCM | MA | Doylestown | PA | 549 | 7 | Dec | 1/11/17 | 21.83 | 47 | |||||||||||||||||||||
| IROQ |
IF Bancorp, Inc. | NASDAQCM | MW | Watseka | IL | 745 | (1) | 8 | Jun | 7/7/11 | 21.67 | 66 | ||||||||||||||||||||
| KRNY |
Kearny Financial Corp. | NASDAQGS | MA | Fairfield | NJ | 7,284 | 48 | Jun | 2/23/05 | 13.05 | 1,018 | |||||||||||||||||||||
| KFFB |
Kentucky First Federal Bancorp | NASDAQGM | MW | Hazard | KY | 333 | (1) | 7 | Jun | 3/2/05 | 7.07 | 58 | ||||||||||||||||||||
| LSBK |
Lake Shore Bancorp, Inc. | NASDAQGM | MA | Dunkirk | NY | 711 | 12 | Dec | 4/3/06 | 14.90 | 84 | |||||||||||||||||||||
| MGYR |
Magyar Bancorp, Inc. | NASDAQGM | MA | New Brunswick | NJ | 842 | 7 | Sep | 1/23/06 | 10.57 | 75 | |||||||||||||||||||||
| EBSB |
Meridian Bancorp, Inc. | NASDAQGS | NE | Peabody | MA | 6,287 | 43 | Dec | 1/22/08 | 20.91 | 1,054 | |||||||||||||||||||||
| MSVB |
Mid-Southern Bancorp, Inc. | NASDAQCM | MW | Salem | IN | 249 | 3 | Dec | 4/8/98 | 15.39 | 44 | |||||||||||||||||||||
| NYCB |
New York Community Bancorp, Inc. | NYSE | MA | Westbury | NY | 57,469 | 237 | Dec | 11/23/93 | 12.31 | 5,725 | |||||||||||||||||||||
| NECB |
Northeast Community Bancorp, Inc. | NASDAQCM | MA | White Plains | NY | 1,077 | 10 | Dec | 7/5/06 | 10.07 | 165 | |||||||||||||||||||||
| NFBK |
Northfield Bancorp, Inc. (Staten Island, NY) | NASDAQGS | MA | Woodbridge | NJ | 5,427 | 38 | Dec | 11/7/07 | 16.48 | 837 | |||||||||||||||||||||
| OFED |
Oconee Federal Financial Corp. | NASDAQCM | SE | Seneca | SC | 544 | 8 | Jun | 1/13/11 | 23.50 | 131 | |||||||||||||||||||||
| PBBK |
PB Bankshares, Inc. | NASDAQCM | MA | Coatesville | PA | 349 | 4 | Dec | 7/14/21 | 13.25 | 37 | |||||||||||||||||||||
| PCSB |
PCSB Financial Corporation | NASDAQCM | MA | Yorktown Heights | NY | 1,875 | 16 | Jun | 4/20/17 | 18.60 | 293 | |||||||||||||||||||||
| PDLB |
PDL Community Bancorp | NASDAQGM | MA | Bronx | NY | 1,548 | 14 | Dec | 9/29/17 | 13.58 | 235 | |||||||||||||||||||||
| PBFS |
Pioneer Bancorp, Inc. | NASDAQCM | MA | Albany | NY | 1,788 | (1) | 23 | Jun | 7/17/19 | 12.00 | 301 | ||||||||||||||||||||
| PVBC |
Provident Bancorp, Inc. | NASDAQCM | NE | Amesbury | MA | 1,585 | 7 | Dec | 7/15/15 | 16.47 | 272 | |||||||||||||||||||||
| PROV |
Provident Financial Holdings, Inc. | NASDAQGS | WE | Riverside | CA | 1,184 | 14 | Jun | 6/27/96 | 17.30 | 130 | |||||||||||||||||||||
| PFS |
Provident Financial Services, Inc. | NYSE | MA | Jersey City | NJ | 13,217 | 100 | Dec | 1/15/03 | 21.89 | 1,672 | |||||||||||||||||||||
| PBIP |
Prudential Bancorp, Inc. | NASDAQGM | MA | Philadelphia | PA | 1,125 | 10 | Sep | 3/29/05 | 14.10 | 110 | |||||||||||||||||||||
| RNDB |
Randolph Bancorp, Inc. | NASDAQGM | NE | Stoughton | MA | 744 | 5 | Dec | 7/1/16 | 20.32 | 99 | |||||||||||||||||||||
| RBKB |
Rhinebeck Bancorp, Inc. | NASDAQCM | MA | Poughkeepsie | NY | 1,210 | 17 | Dec | 1/16/19 | 10.65 | 115 | |||||||||||||||||||||
| RVSB |
Riverview Bancorp, Inc. | NASDAQGS | WE | Vancouver | WA | 1,617 | 16 | Mar | 10/26/93 | 7.39 | 163 | |||||||||||||||||||||
| SVBI |
Severn Bancorp, Inc. | NASDAQCM | MA | Annapolis | MD | 1,144 | 7 | Dec | NA | 12.23 | 157 | |||||||||||||||||||||
| STXB |
Spirit of Texas Bancshares, Inc. | NASDAQGS | SW | Conroe | TX | 3,085 | 37 | Dec | 5/3/18 | 22.39 | 384 | |||||||||||||||||||||
| SBT |
Sterling Bancorp, Inc. (Southfield, MI) | NASDAQCM | MW | Southfield | MI | 3,417 | 28 | Dec | 11/16/17 | 5.17 | 261 | |||||||||||||||||||||
| TCBC |
TC Bancshares, Inc. | NASDAQCM | SE | Thomasville | GA | 406 | 2 | Dec | 7/20/21 | 12.89 | 63 | |||||||||||||||||||||
| TBNK |
Territorial Bancorp Inc. | NASDAQGS | WE | Honolulu | HI | 2,132 | 30 | Dec | 7/13/09 | 25.63 | 231 | |||||||||||||||||||||
| TCBS |
Texas Community Bancshares, Inc. | NASDAQCM | SW | Mineola | TX | 350 | 6 | Dec | 7/14/21 | 15.45 | 50 | |||||||||||||||||||||
| TFSL |
TFS Financial Corporation | NASDAQGS | MW | Cleveland | OH | 14,237 | 37 | Sep | 4/20/07 | 19.75 | 5,470 | |||||||||||||||||||||
| TSBK |
Timberland Bancorp, Inc. | NASDAQGM | WE | Hoquiam | WA | 1,740 | 24 | Sep | 1/12/98 | 28.69 | 240 | |||||||||||||||||||||
| TBK |
Triumph Bancorp, Inc. | NASDAQGS | SW | Dallas | TX | 6,016 | 65 | Dec | 11/6/14 | 80.39 | 1,990 | |||||||||||||||||||||
| TRST |
TrustCo Bank Corp NY | NASDAQGS | MA | Glenville | NY | 6,123 | 147 | Dec | NA | 32.79 | 632 | |||||||||||||||||||||
| WSBF |
Waterstone Financial, Inc. | NASDAQGS | MW | Wauwatosa | WI | 2,202 | 16 | Dec | 10/4/05 | 20.05 | 478 | |||||||||||||||||||||
| WNEB |
Western New England Bancorp, Inc. | NASDAQGS | NE | Westfield | MA | 2,477 | 27 | Dec | 12/27/01 | 8.87 | 214 | |||||||||||||||||||||
| WMPN |
William Penn Bancorporation | NASDAQCM | MA | Bristol | PA | 817 | (1) | 12 | Jun | 4/15/08 | 12.25 | 186 | ||||||||||||||||||||
| WSFS |
WSFS Financial Corporation | NASDAQGS | MA | Wilmington | DE | 15,149 | 94 | Dec | 11/26/86 | 44.70 | 2,125 | |||||||||||||||||||||
| WVFC |
WVS Financial Corp. | NASDAQGM | MA | Pittsburgh | PA | 346 | 6 | Jun | 11/29/93 | 16.23 | 28 | |||||||||||||||||||||
| (1) | Data as of March 31, 2021. |
Source: S&P Global Market Intelligence.
EXHIBIT III-2
Colonial Federal Savings Bank
Peer Group Summary Demographic and Deposit Market Share Data
Exhibit III-2
Colonial Federal Savings Bank
Peer Group Market Area Comparative Analysis
| Per Capita Income | Deposit | |||||||||||||||||||||||||||||||||
| Population (000s) | 2015-2021 | 2021-2026 | 2021 | % State | Market | |||||||||||||||||||||||||||||
| Institution |
County |
2015 | 2021 | 2026 (1) | % Change | % Change | ($) | Average | Share(2) | |||||||||||||||||||||||||
| CBM Bancorp, Inc. |
Baltimore, MD | 830,854 | 827,833 | 838,202 | -0.1 | % | 0.2 | % | 44,121 | 96.9 | % | 0.65 | % | |||||||||||||||||||||
| Cincinnati Bancorp, Inc. |
Hamilton, OH | 806,557 | 820,001 | 828,307 | 0.3 | % | 0.2 | % | 39,101 | 116.8 | % | 0.10 | % | |||||||||||||||||||||
| Elmira Savings Bank |
Chemung, NY | 88,004 | 82,370 | 80,032 | -1.1 | % | -0.6 | % | 31,386 | 74.5 | % | 24.23 | % | |||||||||||||||||||||
| FFBW, Inc. |
Waukesha, WI | 395,838 | 406,583 | 413,751 | 0.4 | % | 0.4 | % | 50,395 | 142.0 | % | 1.07 | % | |||||||||||||||||||||
| Generations Bancorp NY, Inc. |
Seneca, NY | 35,409 | 33,735 | 33,139 | -0.8 | % | -0.4 | % | 32,604 | 77.4 | % | 0.41 | % | |||||||||||||||||||||
| HMN Financial, Inc. |
Olmsted, MN | 151,624 | 160,589 | 167,296 | 1.0 | % | 0.8 | % | 43,936 | 107.2 | % | 5.92 | % | |||||||||||||||||||||
| HV Bancorp, Inc. |
Bucks, PA | 627,549 | 628,796 | 630,606 | 0.0 | % | 0.1 | % | 51,097 | 138.5 | % | 0.41 | % | |||||||||||||||||||||
| IF Bancorp, Inc. |
Iroquois, IL | 28,605 | 26,613 | 25,608 | -1.2 | % | -0.8 | % | 28,928 | 76.6 | % | 22.22 | % | |||||||||||||||||||||
| Mid-Southern Bancorp, Inc. |
Washington, IN | 27,525 | 28,097 | 28,348 | 0.3 | % | 0.2 | % | 27,232 | 85.6 | % | 27.66 | % | |||||||||||||||||||||
| Prudential Bancorp, Inc. |
Philadelphia, PA | 1,562,939 | 1,588,749 | 1,606,225 | 0.3 | % | 0.2 | % | 30,040 | 81.4 | % | 0.08 | % | |||||||||||||||||||||
| Randolph Bancorp, Inc. |
Norfolk, MA | 695,686 | 711,405 | 729,065 | 0.4 | % | 0.5 | % | 60,544 | 123.6 | % | 1.63 | % | |||||||||||||||||||||
| WVS Financial Corp. |
Allegheny, PA | 1,234,342 | 1,212,006 | 1,206,155 | -0.3 | % | -0.1 | % | 43,296 | 117.4 | % | 0.08 | % | |||||||||||||||||||||
|
|
|
|
|
|
|
|
|
|
|
|
|
|
|
|
|
|||||||||||||||||||
| Averages: | 540,411 | 543,898 | 548,895 | -0.1 | % | 0.1 | % | 40,223 | 103.2 | % | 7.04 | % | ||||||||||||||||||||||
| Medians: | 511,694 | 517,690 | 522,179 | 0.2 | % | 0.2 | % | 41,199 | 102.0 | % | 0.86 | % | ||||||||||||||||||||||
| Colonial FSB |
Norfolk, MA | 695,686 | 711,405 | 729,065 | 0.4 | % | 0.5 | % | 60,544 | 123.6 | % | 0.84 | % | |||||||||||||||||||||
| (1) | Projected population. |
| (2) | Total institution deposits in headquarters county as percent of total county deposits as of June 30, 2020. |
Sources: S&P Global Market Intelligence, FDIC.
EXHIBIT IV-1
Colonial Federal Savings Bank
Thrift Stock Prices: As of August 20, 2021
RP® Financial, LC.
Exhibit IV-1A
Weekly Bank and Thrift Market Line - Part One
Prices As of August 20, 2021
| Market Capitalization |
Price Change Data |
Current Per Share Financials | ||||||||||||||||||||||||||||
| Price/ Share(1) |
Shares Outstanding |
Market Capitalization |
52 Week (1) |
% Change From |
LTM EPS (3) |
LTM Core EPS (3) |
BV/ Share |
TBV/ Share (4) |
Assets/ Share | |||||||||||||||||||||
| High |
Low |
Last Wk |
Last Wk |
52 Wks (2) |
MRY (2) | |||||||||||||||||||||||||
| ($) | (000) | ($Mil) | ($) | ($) | ($) | (%) | (%) | (%) | ($) | ($) | ($) | ($) | ($) | |||||||||||||||||
| Financial Institutions, Fully Converted, Not Under Acquisition (734) |
||||||||||||||||||||||||||||||
| Average | 155.76 | 58,189 | 3,063.7 | 163.01 | 104.34 | 155.76 | -0.87 | 47.44 | 23.39 | 16.49 | 11.55 | 162.72 | 124.76 | 1258.77 | ||||||||||||||||
| Median | 26.84 | 5,644 | 136.8 | 29.69 | 17.00 | 26.84 | -0.46 | 41.72 | 20.72 | 2.76 | 2.65 | 24.43 | 21.51 | 251.87 | ||||||||||||||||
| Financial Institutions, Fully Converted, Not Under Acquisition (734) |
||||||||||||||||||||||||||||||
| BCOW |
1895 Bancorp of Wisconsin, Inc. | 10.90 | 6,405 | 69.8 | 12.65 | 5.94 | 10.90 | 1.54 | 82.54 | 44.05 | 0.27 | NA | NA | NA | 94.54 | |||||||||||||||
| ACNB |
ACNB Corporation | 28.23 | 8,721 | 246.2 | 33.74 | 19.00 | 28.23 | -1.77 | 32.29 | 12.92 | 3.44 | 3.50 | 30.54 | 24.95 | 310.56 | |||||||||||||||
| AFBI |
Affinity Bancshares, Inc. | 13.49 | 6,873 | 92.7 | 14.14 | 6.53 | 13.49 | 1.76 | 98.09 | 36.28 | 1.09 | 1.13 | 17.12 | 14.37 | 114.48 | |||||||||||||||
| ALRS |
Alerus Financial Corporation | 27.03 | 17,203 | 465.0 | 34.70 | 17.88 | 27.03 | -8.06 | 29.27 | -1.24 | 3.14 | 3.18 | 20.03 | 16.89 | 183.53 | |||||||||||||||
| ATLO |
Ames National Corporation | 23.53 | 9,123 | 214.7 | 27.90 | 16.53 | 23.53 | -1.96 | 20.73 | -2.04 | 2.49 | 2.47 | 23.03 | 21.36 | 228.60 | |||||||||||||||
| BFC |
Bank First Corporation | 68.99 | 7,666 | 528.9 | 77.00 | 55.90 | 68.99 | -1.97 | 10.61 | 6.43 | 5.90 | 5.71 | 40.50 | 32.69 | 367.73 | |||||||||||||||
| BMRC |
Bank of Marin Bancorp | 36.44 | 16,357 | 596.1 | 42.19 | 27.26 | 36.44 | 0.91 | 13.70 | 6.12 | 2.52 | 2.57 | 26.71 | 24.14 | 187.92 | |||||||||||||||
| BKSC |
Bank of South Carolina Corporation | 19.64 | 5,535 | 108.7 | 25.65 | 15.61 | 19.64 | -12.71 | 20.49 | 22.52 | 1.22 | 1.22 | 9.84 | 9.84 | 105.13 | |||||||||||||||
| BOTJ |
Bank of the James Financial Group, Inc. | 14.39 | 4,741 | 68.2 | 19.68 | 8.60 | 14.39 | 1.91 | 51.59 | 30.60 | 1.47 | 1.47 | 13.05 | 13.05 | 191.61 | |||||||||||||||
| BWB |
Bridgewater Bancshares, Inc. | 15.63 | 28,186 | 440.5 | 18.25 | 8.65 | 15.63 | -2.07 | 62.81 | 25.14 | 1.17 | 1.30 | 10.33 | 10.21 | 112.21 | |||||||||||||||
| BYFC |
Broadway Financial Corporation | 3.07 | 38,751 | 57.1 | 3.95 | 1.41 | 3.07 | -8.08 | 99.35 | 65.95 | -0.15 | 0.03 | 1.96 | 1.55 | 26.86 | |||||||||||||||
| CATC |
Cambridge Bancorp | 84.20 | 6,966 | 586.5 | 89.50 | 47.75 | 84.20 | -2.05 | 53.09 | 20.72 | 7.69 | 8.07 | 60.23 | 52.37 | 617.80 | |||||||||||||||
| CARV |
Carver Bancorp, Inc. | 16.80 | 3,482 | 58.5 | 42.50 | 5.40 | 16.80 | 0.06 | 163.32 | 158.86 | -1.73 | -1.81 | 7.78 | 7.78 | 196.16 | |||||||||||||||
| CBMB |
CBM Bancorp, Inc. | 14.75 | 3,285 | 48.5 | 16.50 | 11.90 | 14.75 | 0.34 | 23.36 | 11.07 | 0.25 | 0.25 | 14.23 | 14.23 | 76.11 | |||||||||||||||
| CVCY |
Central Valley Community Bancorp | 22.51 | 11,984 | 269.8 | 23.83 | 11.51 | 22.51 | -3.60 | 83.91 | 51.18 | 2.12 | 2.12 | 20.36 | 15.93 | 190.30 | |||||||||||||||
| CFBK |
CF Bankshares Inc. | 18.67 | 6,618 | 100.0 | 23.68 | 10.71 | 18.67 | -4.21 | 63.34 | 5.54 | 4.13 | 4.08 | 18.07 | 18.07 | 227.85 | |||||||||||||||
| COFS |
ChoiceOne Financial Services, Inc. | 24.23 | 7,621 | 184.7 | 32.80 | 22.42 | 24.23 | 0.12 | -10.26 | -21.36 | 2.46 | 2.82 | 29.71 | 21.31 | 278.30 | |||||||||||||||
| CNNB |
Cincinnati Bancorp, Inc. | 14.10 | 2,934 | 41.4 | 15.50 | 8.60 | 14.10 | -1.40 | 63.52 | 17.99 | 1.45 | 1.46 | 14.45 | 14.40 | 85.14 | |||||||||||||||
| CZNC |
Citizens & Northern Corporation | 24.96 | 15,845 | 395.5 | 25.69 | 14.92 | 24.96 | -1.11 | 39.91 | 25.81 | 1.60 | 2.04 | 19.06 | 15.54 | 147.62 | |||||||||||||||
| CIVB |
Civista Bancshares, Inc. | 23.02 | 15,139 | 348.5 | 24.26 | 11.25 | 23.02 | -3.32 | 68.64 | 31.32 | 2.39 | 2.53 | 22.83 | 17.50 | 193.19 | |||||||||||||||
| EGBN |
Eagle Bancorp, Inc. | 56.73 | 31,961 | 1,813.1 | 59.25 | 24.81 | 56.73 | -1.56 | 91.27 | 37.36 | 5.35 | 5.49 | 40.87 | NA | 342.94 | |||||||||||||||
| ESBK |
Elmira Savings Bank | 13.86 | 3,548 | 49.2 | 16.00 | 10.30 | 13.86 | -2.22 | 30.75 | 20.52 | 1.38 | 1.38 | 17.57 | 14.10 | 182.85 | |||||||||||||||
| EMCF |
Emclaire Financial Corp | 27.70 | 2,721 | 75.4 | 36.40 | 20.97 | 27.70 | -3.65 | 19.14 | -9.55 | 2.99 | 3.01 | 32.72 | 25.20 | 406.83 | |||||||||||||||
| ESQ |
Esquire Financial Holdings, Inc. | 26.00 | 7,450 | 193.7 | 26.79 | 14.00 | 26.00 | 1.01 | 54.30 | 35.49 | 2.09 | 2.04 | 17.20 | 17.20 | 142.02 | |||||||||||||||
| FMAO |
Farmers & Merchants Bancorp, Inc. | 22.70 | 11,101 | 252.0 | 27.58 | 19.50 | 22.70 | 0.53 | 3.42 | -1.30 | 1.88 | 1.97 | 22.40 | 17.04 | 195.20 | |||||||||||||||
| FMNB |
Farmers National Banc Corp. | 15.63 | 28,325 | 442.7 | 18.26 | 10.05 | 15.63 | -1.45 | 30.36 | 17.78 | 1.84 | 1.91 | 12.95 | 11.23 | 115.09 | |||||||||||||||
| FFBW |
FFBW, Inc. | 11.35 | 6,421 | 72.9 | 11.76 | 7.86 | 11.35 | -3.40 | 39.26 | 13.27 | 0.31 | NA | 13.76 | NA | 54.91 | |||||||||||||||
| FCAP |
First Capital, Inc. | 42.28 | 3,374 | 142.7 | 70.65 | 42.13 | 42.28 | -0.68 | -32.24 | -30.18 | 3.37 | 3.25 | 33.31 | 31.21 | 319.71 | |||||||||||||||
| FCCO |
First Community Corporation | 20.21 | 7,540 | 152.4 | 22.00 | 12.23 | 20.21 | -4.80 | 54.27 | 18.95 | 1.71 | 1.70 | 18.29 | 16.22 | 200.94 | |||||||||||||||
| FXNC |
First National Corporation | 21.25 | 6,219 | 132.1 | 23.87 | 13.25 | 21.25 | -2.30 | 51.89 | 25.74 | 2.20 | 2.30 | 18.22 | 18.22 | 164.76 | |||||||||||||||
| FSFG |
First Savings Financial Group, Inc. | 81.95 | 2,369 | 194.2 | 82.80 | 42.15 | 81.95 | 1.89 | 75.67 | 26.08 | 16.74 | 16.07 | 74.84 | NA | 742.24 | |||||||||||||||
| FUSB |
First US Bancshares, Inc. | 11.41 | 6,217 | 70.9 | 12.50 | 6.22 | 11.41 | -0.59 | 82.56 | 26.56 | 0.49 | 0.53 | 14.28 | 12.96 | 152.30 | |||||||||||||||
| FNCB |
FNCB Bancorp, Inc. | 7.95 | 19,984 | 158.9 | 8.94 | 5.10 | 7.95 | 0.00 | 33.17 | 24.22 | 1.01 | 0.91 | 7.99 | 7.99 | 76.30 | |||||||||||||||
| FRAF |
Franklin Financial Services Corporation | 31.68 | 4,420 | 140.0 | 34.90 | 19.60 | 31.68 | -4.61 | 29.84 | 17.20 | 4.11 | 4.06 | 34.16 | 32.12 | 379.74 | |||||||||||||||
| FSBW |
FS Bancorp, Inc. | 33.72 | 8,094 | 279.5 | 36.85 | 19.00 | 33.72 | -4.91 | 66.52 | 23.07 | 5.09 | 5.14 | 29.01 | 28.21 | 274.59 | |||||||||||||||
| GBNY |
Generations Bancorp NY, Inc. | 10.28 | 2,458 | 25.3 | 11.75 | 7.01 | 10.28 | -1.29 | 40.56 | -1.39 | 0.73 | 0.38 | 17.31 | 16.65 | 154.61 | |||||||||||||||
| GLBZ |
Glen Burnie Bancorp | 12.41 | 2,851 | 35.4 | 13.01 | 9.00 | 12.41 | 1.31 | 37.89 | 12.82 | 0.90 | 0.90 | 12.43 | 12.43 | 151.79 | |||||||||||||||
| HFBL |
Home Federal Bancorp, Inc. of Louisiana | 18.50 | 3,126 | 57.5 | 20.75 | 11.13 | 18.50 | -2.06 | 58.80 | 28.12 | 1.57 | 1.57 | 15.73 | 15.73 | 180.95 | |||||||||||||||
| HVBC |
HV Bancorp, Inc. | 21.83 | 2,176 | 47.5 | 22.25 | 12.17 | 21.83 | -1.15 | 77.34 | 27.14 | 3.32 | 3.32 | 19.04 | 19.04 | 252.11 | |||||||||||||||
| IROQ |
IF Bancorp, Inc. | 21.67 | 3,043 | 65.9 | 23.50 | 15.03 | 21.67 | -5.55 | 31.41 | -1.63 | 1.87 | 1.75 | 25.76 | 25.76 | 244.96 | |||||||||||||||
| LCNB |
LCNB Corp. | 17.49 | 12,500 | 218.6 | 19.99 | 12.51 | 17.49 | -1.19 | 17.38 | 19.06 | 1.59 | 1.63 | 18.99 | 14.15 | 148.53 | |||||||||||||||
| LMST |
Limestone Bancorp, Inc. | 17.25 | 7,469 | 111.6 | 17.34 | 10.18 | 17.25 | 3.42 | 60.62 | 37.34 | 1.64 | 1.67 | 16.30 | 15.20 | 179.25 | |||||||||||||||
| MNSB |
MainStreet Bancshares, Inc. | 24.39 | 7,363 | 179.6 | 24.95 | 11.75 | 24.39 | 3.83 | 74.84 | 44.23 | 3.07 | 3.07 | 20.18 | 20.18 | 231.93 | |||||||||||||||
| MBIN |
Merchants Bancorp | 35.32 | 28,784 | 1,016.6 | 45.67 | 18.67 | 35.32 | -2.83 | 81.97 | 27.83 | 7.34 | 7.36 | 24.21 | 23.59 | 343.30 | |||||||||||||||
| MBCN |
Middlefield Banc Corp. | 23.65 | 6,129 | 145.4 | 26.35 | 17.41 | 23.65 | -0.08 | 35.22 | 5.11 | 2.03 | 2.05 | 23.50 | 20.82 | 221.93 | |||||||||||||||
| MSVB |
Mid-Southern Bancorp, Inc. | 15.39 | 2,853 | 43.9 | 16.59 | 12.30 | 15.39 | -0.39 | 23.52 | 6.80 | 0.42 | 0.42 | 15.50 | 15.50 | 87.34 | |||||||||||||||
| MVBF |
MVB Financial Corp. | 39.74 | 11,813 | 469.4 | 45.94 | 13.62 | 39.74 | -5.65 | 182.24 | 75.22 | 2.89 | -0.02 | 21.12 | 20.54 | 231.50 | |||||||||||||||
| NKSH |
National Bankshares, Inc. | 37.25 | 6,170 | 229.8 | 39.99 | 23.37 | 37.25 | -3.95 | 42.67 | 18.97 | 2.89 | 2.89 | 30.99 | NA | 269.31 | |||||||||||||||
| NCBS |
Nicolet Bankshares, Inc. | 75.50 | 9,757 | 736.6 | 86.25 | 53.23 | 75.50 | 0.49 | 28.47 | 13.79 | 6.98 | 7.40 | 56.70 | 39.09 | 470.17 | |||||||||||||||
| NECB |
Northeast Community Bancorp, Inc. | 10.07 | 16,378 | 164.9 | 12.69 | 6.05 | 10.07 | 0.00 | 54.21 | -2.22 | 0.84 | NA | 9.84 | 9.80 | 65.73 | |||||||||||||||
| OVLY |
Oak Valley Bancorp | 18.46 | 8,142 | 150.3 | 20.55 | 11.04 | 18.46 | 1.93 | 26.27 | 11.07 | 2.04 | 2.05 | 16.60 | 16.15 | 216.71 | |||||||||||||||
| OPOF |
Old Point Financial Corporation | 22.10 | 5,245 | 115.9 | 26.26 | 14.89 | 22.10 | -0.62 | 42.28 | 16.54 | 1.24 | 1.31 | 22.87 | 22.50 | 243.07 | |||||||||||||||
| OPHC |
OptimumBank Holdings, Inc. | 4.85 | 4,372 | 21.2 | 7.27 | 2.30 | 4.85 | -7.97 | 87.26 | 43.92 | 0.20 | 0.20 | 5.37 | 5.37 | 67.27 | |||||||||||||||
| OBT |
Orange County Bancorp, Inc. | 34.02 | 5,638 | 191.8 | 37.00 | 22.00 | 34.02 | 0.00 | 42.94 | 24.84 | NA | NA | 31.39 | 29.79 | 363.97 | |||||||||||||||
| ORRF |
Orrstown Financial Services, Inc. | 23.47 | 11,254 | 264.1 | 25.91 | 12.40 | 23.47 | 0.17 | 61.86 | 41.81 | 3.07 | 3.23 | 23.61 | 21.52 | 258.82 | |||||||||||||||
| PKBK |
Parke Bancorp, Inc. | 19.94 | 11,893 | 237.2 | 22.08 | 11.56 | 19.94 | -4.13 | 58.25 | 27.82 | 2.90 | 2.87 | 18.09 | 18.09 | 176.69 | |||||||||||||||
| PTRS |
Partners Bancorp | 8.83 | 17,727 | 156.6 | 9.56 | 4.97 | 8.83 | 0.16 | 40.44 | 35.90 | 0.31 | 0.29 | 7.67 | 6.99 | 90.77 | |||||||||||||||
| PBHC |
Pathfinder Bancorp, Inc. | 16.25 | 4,483 | 72.8 | 16.55 | 9.51 | 16.25 | -0.18 | 74.17 | 41.55 | 1.44 | 1.31 | 17.37 | 16.59 | 281.00 | |||||||||||||||
| PBBK |
PB Bankshares, Inc. | 13.25 | 2,777 | 36.8 | 13.58 | 12.50 | 13.25 | 2.75 | 32.50 | 32.50 | NA | NA | NA | NA | 125.53 | |||||||||||||||
| PCSB |
PCSB Financial Corporation | 18.60 | 15,771 | 293.3 | 20.75 | 11.65 | 18.60 | -0.43 | 53.97 | 16.69 | 0.84 | 0.84 | 17.41 | 17.01 | 118.89 | |||||||||||||||
| PLBC |
Plumas Bancorp | 32.37 | 5,810 | 188.1 | 33.26 | 18.70 | 32.37 | -0.15 | 56.83 | 37.74 | 3.23 | 3.33 | 20.54 | 20.42 | 218.22 | |||||||||||||||
| PVBC |
Provident Bancorp, Inc. | 16.47 | 16,527 | 229.5 | 18.90 | 7.50 | 16.47 | -2.31 | 113.34 | 37.25 | 0.84 | 0.92 | 12.69 | 12.69 | 95.91 | |||||||||||||||
| RMBI |
Richmond Mutual Bancorporation, Inc. | 15.79 | 12,475 | 197.0 | 15.90 | 10.09 | 15.79 | 0.00 | 40.86 | 15.59 | 0.88 | 0.88 | 14.39 | 14.39 | 95.27 | |||||||||||||||
| SAL |
Salisbury Bancorp, Inc. | 48.77 | 2,822 | 137.6 | 53.00 | 30.32 | 48.77 | -4.56 | 35.47 | 30.86 | 5.62 | 5.53 | 46.02 | 41.01 | 509.17 | |||||||||||||||
| SBFG |
SB Financial Group, Inc. | 17.81 | 7,035 | 125.3 | 20.09 | 12.02 | 17.81 | -2.46 | 36.68 | -2.57 | 2.89 | 2.90 | 20.50 | 17.26 | 186.58 | |||||||||||||||
| SMBK |
SmartFinancial, Inc. | 24.54 | 15,110 | 370.8 | 25.41 | 12.70 | 24.54 | -1.37 | 69.59 | 35.28 | 2.24 | 2.39 | 24.71 | 18.69 | 241.85 | |||||||||||||||
| SFBC |
Sound Financial Bancorp, Inc. | 43.35 | 2,588 | 112.2 | 48.39 | 26.15 | 43.35 | -1.88 | 62.97 | 36.54 | 4.02 | 4.03 | 34.25 | 33.91 | 356.69 | |||||||||||||||
| SBT |
Sterling Bancorp, Inc. (Southfield, MI) | 5.17 | 50,475 | 261.0 | 5.95 | 2.89 | 5.17 | 0.00 | 61.56 | 13.88 | -0.11 | -0.11 | 6.48 | 6.48 | 67.71 | |||||||||||||||
| TCBC |
TC Bancshares, Inc. | 12.89 | 4,898 | 63.1 | 12.94 | 11.80 | 12.89 | 4.97 | 28.90 | 28.90 | NA | NA | NA | NA | 82.93 | |||||||||||||||
| TCBS |
Texas Community Bancshares, Inc. | 15.45 | 3,258 | 50.3 | 20.07 | 14.41 | 15.45 | 1.05 | 54.50 | 54.50 | NA | NA | NA | NA | 107.43 | |||||||||||||||
| TCFC |
The Community Financial Corporation | 36.70 | 5,717 | 209.8 | 39.00 | 20.00 | 36.70 | -4.05 | 62.10 | 38.60 | 3.85 | 3.90 | 35.25 | 33.15 | 383.95 | |||||||||||||||
| FLIC |
The First of Long Island Corporation | 21.32 | 23,706 | 505.4 | 23.98 | 14.12 | 21.32 | -2.83 | 35.62 | 19.44 | 1.84 | 1.84 | 17.58 | 17.57 | 173.41 | |||||||||||||||
| UBCP |
United Bancorp, Inc. | 14.65 | 5,808 | 85.1 | 15.89 | 10.57 | 14.65 | 1.74 | 33.76 | 11.15 | 1.53 | 1.36 | 11.63 | 11.41 | 125.74 | |||||||||||||||||||||||||||||||||||||||||||
| VBFC |
Village Bank and Trust Financial Corp. | 47.00 | 1,467 | 69.0 | 62.10 | 29.50 | 47.00 | -1.69 | 59.32 | 36.67 | 8.53 | 8.90 | 40.21 | 40.21 | 489.24 | |||||||||||||||||||||||||||||||||||||||||||
| VABK |
Virginia National Bankshares Corporation | 38.19 | 5,306 | 202.6 | 40.00 | 23.30 | 38.19 | 2.49 | 51.24 | 40.65 | 2.23 | NA | 29.89 | 26.60 | 348.09 | |||||||||||||||||||||||||||||||||||||||||||
| WMPN |
William Penn Bancorporation | 12.25 | 15,171 | 185.8 | 12.61 | 8.99 | 12.25 | -1.92 | 36.23 | 5.04 | 0.11 | 0.28 | 14.17 | 13.79 | 53.88 | |||||||||||||||||||||||||||||||||||||||||||
| ABTX |
Allegiance Bancshares, Inc. | 37.50 | 20,215 | 758.1 | 43.34 | 21.45 | 37.50 | 1.35 | 50.91 | 9.87 | 3.57 | 3.76 | 39.04 | 27.17 | 321.98 | |||||||||||||||||||||||||||||||||||||||||||
| AMAL |
Amalgamated Financial Corp. | 15.36 | 31,096 | 477.6 | 20.22 | 10.20 | 15.36 | -1.29 | 32.30 | 11.79 | 1.56 | 1.70 | 17.64 | 17.07 | 210.84 | |||||||||||||||||||||||||||||||||||||||||||
| ASRV |
AmeriServ Financial, Inc. | 3.76 | 17,075 | 64.2 | 5.34 | 2.65 | 3.76 | -4.08 | 29.66 | 20.13 | 0.32 | 0.36 | 6.52 | 5.71 | 79.68 | |||||||||||||||||||||||||||||||||||||||||||
| AUBN |
Auburn National Bancorporation, Inc. | 34.40 | 3,543 | 121.9 | 50.48 | 33.00 | 34.40 | 0.57 | -18.06 | -17.49 | 2.33 | 2.39 | 29.91 | 29.91 | 292.51 | |||||||||||||||||||||||||||||||||||||||||||
| BWFG |
Bankwell Financial Group, Inc. | 29.93 | 7,658 | 229.2 | 31.98 | 14.08 | 29.93 | -3.61 | 89.67 | 53.09 | 1.92 | 2.23 | 24.17 | 23.83 | 296.39 | |||||||||||||||||||||||||||||||||||||||||||
| BCBP |
BCB Bancorp, Inc. | 15.15 | 17,003 | 257.6 | 16.15 | 7.73 | 15.15 | -0.79 | 84.98 | 36.86 | 1.73 | 1.36 | 13.63 | 13.31 | 170.28 | |||||||||||||||||||||||||||||||||||||||||||
| CBFV |
CB Financial Services, Inc. | 23.55 | 5,380 | 126.7 | 24.75 | 17.76 | 23.55 | 0.06 | 28.52 | 17.67 | -2.17 | 1.68 | 24.50 | 21.56 | 271.67 | |||||||||||||||||||||||||||||||||||||||||||
| CZWI |
Citizens Community Bancorp, Inc. | 13.91 | 10,683 | 148.6 | 14.81 | 6.68 | 13.91 | -1.35 | 98.71 | 27.73 | 1.57 | 1.66 | 15.33 | 11.95 | 160.49 | |||||||||||||||||||||||||||||||||||||||||||
| CIZN |
Citizens Holding Company | 17.69 | 5,595 | 99.0 | 27.88 | 17.00 | 17.69 | -1.48 | -19.55 | -15.56 | 1.45 | 1.28 | 19.58 | 17.15 | 239.15 | |||||||||||||||||||||||||||||||||||||||||||
| CVLY |
Codorus Valley Bancorp, Inc. | 22.29 | 9,752 | 217.4 | 23.00 | 12.08 | 22.29 | -0.71 | 73.33 | 31.43 | 1.58 | 1.68 | 20.44 | 20.18 | 229.30 | |||||||||||||||||||||||||||||||||||||||||||
| CBAN |
Colony Bankcorp, Inc. | 17.97 | 13,674 | 245.7 | 19.59 | 9.52 | 17.97 | -0.44 | 58.75 | 22.66 | 1.79 | 1.86 | 15.46 | 13.58 | 128.38 | |||||||||||||||||||||||||||||||||||||||||||
| CWBC |
Community West Bancshares | 13.75 | 8,589 | 118.1 | 14.62 | 7.82 | 13.75 | -0.65 | 69.33 | 51.43 | 1.40 | 1.40 | 11.11 | 10.94 | 123.76 | |||||||||||||||||||||||||||||||||||||||||||
| EBMT |
Eagle Bancorp Montana, Inc. | 22.55 | 6,761 | 152.5 | 26.13 | 16.55 | 22.55 | 1.12 | 29.52 | 6.27 | 2.87 | 2.91 | 22.54 | 19.17 | 201.06 | |||||||||||||||||||||||||||||||||||||||||||
| FDBC |
Fidelity D & D Bancorp, Inc. | 52.51 | 5,644 | 296.4 | 70.97 | 44.80 | 52.51 | -1.43 | 14.18 | -18.41 | 4.28 | NA | 34.47 | 32.74 | 345.38 | |||||||||||||||||||||||||||||||||||||||||||
| FRBA |
First Bank | 13.38 | 19,679 | 263.3 | 14.41 | 6.05 | 13.38 | 0.00 | 97.93 | 42.64 | 1.55 | 1.51 | 12.94 | 12.02 | 124.15 | |||||||||||||||||||||||||||||||||||||||||||
| FFWM |
First Foundation Inc. | 24.22 | 44,820 | 1,085.5 | 25.81 | 12.29 | 24.22 | -1.34 | 57.89 | 21.10 | 2.27 | 2.32 | 16.38 | 14.27 | 177.13 | |||||||||||||||||||||||||||||||||||||||||||
| FGBI |
First Guaranty Bancshares, Inc. | 19.15 | 9,741 | 186.5 | 21.29 | 11.54 | 19.15 | -4.30 | 47.42 | 7.77 | 2.32 | 1.25 | 18.61 | 16.73 | 281.80 | |||||||||||||||||||||||||||||||||||||||||||
| FMBH |
First Mid Bancshares, Inc. | 40.73 | 18,083 | 736.5 | 45.00 | 22.24 | 40.73 | -0.42 | 53.29 | 21.00 | 2.42 | 3.05 | 34.08 | 26.36 | 320.22 | |||||||||||||||||||||||||||||||||||||||||||
| FNWB |
First Northwest Bancorp | 18.75 | 9,069 | 170.0 | 19.25 | 9.45 | 18.75 | 0.37 | 54.96 | 20.19 | 1.47 | 1.23 | 18.50 | 18.50 | 197.09 | |||||||||||||||||||||||||||||||||||||||||||
| GFED |
Guaranty Federal Bancshares, Inc. | 24.21 | 4,385 | 106.2 | 26.99 | 13.60 | 24.21 | -0.41 | 73.05 | 38.66 | 1.75 | 1.77 | 21.26 | 20.52 | 273.33 | |||||||||||||||||||||||||||||||||||||||||||
| HIFS |
Hingham Institution for Savings | 306.54 | 2,142 | 656.7 | 325.90 | 180.75 | 306.54 | 1.42 | 60.14 | 41.92 | 31.47 | 23.87 | 153.02 | 153.02 | 1388.05 | |||||||||||||||||||||||||||||||||||||||||||
| HMNF |
HMN Financial, Inc. | 22.99 | 4,460 | 102.5 | 23.53 | 13.06 | 22.99 | -0.13 | 61.79 | 33.66 | 3.08 | 3.08 | 23.24 | 23.07 | 219.94 | |||||||||||||||||||||||||||||||||||||||||||
| ISTR |
Investar Holding Corporation | 22.33 | 10,424 | 232.8 | 23.69 | 12.40 | 22.33 | -1.54 | 61.69 | 35.01 | 1.87 | 1.76 | 24.08 | 19.85 | 256.42 | |||||||||||||||||||||||||||||||||||||||||||
| LARK |
Landmark Bancorp, Inc. | 27.62 | 4,759 | 131.5 | 28.50 | 19.29 | 27.62 | 0.45 | 37.86 | 20.89 | 4.49 | 4.22 | 27.83 | 24.11 | 262.72 | |||||||||||||||||||||||||||||||||||||||||||
| MGYR |
Magyar Bancorp, Inc. | 10.57 | 7,098 | 75.0 | 12.32 | 6.55 | 10.57 | 3.31 | 60.13 | 33.89 | 0.75 | 0.67 | 8.63 | 8.63 | 118.67 | |||||||||||||||||||||||||||||||||||||||||||
| MLVF |
Malvern Bancorp, Inc. | 18.61 | 7,542 | 140.4 | 19.38 | 11.67 | 18.61 | -0.85 | 48.53 | 20.07 | 0.35 | NA | 19.44 | 19.44 | 157.21 | |||||||||||||||||||||||||||||||||||||||||||
| MPB |
Mid Penn Bancorp, Inc. | 26.62 | 11,427 | 304.2 | 29.87 | 17.20 | 26.62 | -0.45 | 28.66 | 21.55 | 3.87 | 3.89 | 29.94 | 24.10 | 302.96 | |||||||||||||||||||||||||||||||||||||||||||
| NBN |
Northeast Bank | 33.67 | 8,150 | 274.4 | 35.28 | 17.21 | 33.67 | -3.50 | 81.31 | 49.51 | 8.55 | 4.15 | 28.51 | 28.26 | 266.78 | |||||||||||||||||||||||||||||||||||||||||||
| NWFL |
Norwood Financial Corp. | 25.31 | 8,189 | 207.3 | 29.68 | 22.85 | 25.31 | -0.37 | -7.63 | -3.29 | 2.66 | 2.71 | 24.38 | 20.77 | 247.35 | |||||||||||||||||||||||||||||||||||||||||||
| OVBC |
Ohio Valley Banc Corp. | 26.84 | 4,787 | 128.5 | 32.70 | 20.11 | 26.84 | 3.23 | 12.30 | 13.73 | 2.80 | 2.80 | 29.12 | 27.58 | 258.38 | |||||||||||||||||||||||||||||||||||||||||||
| OPBK |
OP Bancorp | 10.26 | 15,133 | 155.3 | 12.39 | 5.59 | 10.26 | -1.44 | 66.56 | 33.25 | 1.23 | 1.22 | 10.04 | NA | 105.82 | |||||||||||||||||||||||||||||||||||||||||||
| PNBK |
Patriot National Bancorp, Inc. | 9.24 | 3,947 | 36.5 | 12.37 | 5.50 | 9.24 | -2.01 | 41.07 | -7.04 | 0.11 | 0.68 | 16.69 | 16.23 | 243.98 | |||||||||||||||||||||||||||||||||||||||||||
| PEBK |
Peoples Bancorp of North Carolina, Inc. | 28.19 | 5,789 | 163.2 | 29.69 | 15.21 | 28.19 | -0.64 | 69.92 | 22.45 | 2.62 | 2.47 | 25.11 | 25.11 | 276.30 | |||||||||||||||||||||||||||||||||||||||||||
| FRST |
Primis Financial Corp. | 14.85 | 24,539 | 364.4 | 16.32 | 8.22 | 14.85 | -5.11 | 72.27 | 22.63 | 1.56 | 1.28 | 16.58 | 12.22 | 138.36 | |||||||||||||||||||||||||||||||||||||||||||
| PBIP |
Prudential Bancorp, Inc. | 14.10 | 7,794 | 109.9 | 15.86 | 9.53 | 14.10 | -1.40 | 25.00 | 1.81 | 0.79 | 0.71 | 16.75 | 15.94 | 144.34 | |||||||||||||||||||||||||||||||||||||||||||
| QCRH |
QCR Holdings, Inc. | 49.01 | 15,769 | 772.8 | 50.93 | 25.54 | 49.01 | -2.14 | 61.96 | 23.79 | 4.74 | 4.75 | 40.00 | 34.64 | 368.13 | |||||||||||||||||||||||||||||||||||||||||||
| RNDB |
Randolph Bancorp, Inc. | 20.32 | 4,873 | 99.0 | 24.70 | 10.73 | 20.32 | 0.84 | 83.39 | -7.89 | 4.11 | 4.17 | 19.17 | 19.16 | 152.70 | |||||||||||||||||||||||||||||||||||||||||||
| FRBK |
Republic First Bancorp, Inc. | 3.40 | 58,886 | 200.2 | 4.61 | 1.95 | 3.40 | -7.36 | 43.16 | 19.30 | 0.20 | 0.28 | 4.62 | 4.54 | 91.32 | |||||||||||||||||||||||||||||||||||||||||||
| SFST |
Southern First Bancshares, Inc. | 49.46 | 7,900 | 390.7 | 56.42 | 23.16 | 49.46 | -3.25 | 92.30 | 39.92 | 3.98 | 3.98 | 31.86 | 31.86 | 335.47 | |||||||||||||||||||||||||||||||||||||||||||
| SMBC |
Southern Missouri Bancorp, Inc. | 44.46 | 8,905 | 395.9 | 46.59 | 21.50 | 44.46 | -1.64 | 97.95 | 46.06 | 5.22 | 5.27 | 31.83 | 29.66 | 303.25 | |||||||||||||||||||||||||||||||||||||||||||
| SSBI |
Summit State Bank | 16.12 | 6,072 | 97.9 | 18.25 | 9.80 | 16.12 | -3.18 | 60.24 | 19.58 | 2.16 | 2.15 | 13.01 | 12.11 | 148.49 | |||||||||||||||||||||||||||||||||||||||||||
| FBMS |
The First Bancshares, Inc. | 38.84 | 21,020 | 816.4 | 41.41 | 19.50 | 38.84 | -3.62 | 79.23 | 25.78 | 2.80 | 2.92 | 31.40 | 22.57 | 262.11 | |||||||||||||||||||||||||||||||||||||||||||
| TSBK |
Timberland Bancorp, Inc. | 28.69 | 8,354 | 239.7 | 30.75 | 16.54 | 28.69 | -2.32 | 68.47 | 18.26 | 3.32 | 3.35 | 24.36 | 22.39 | 208.34 | |||||||||||||||||||||||||||||||||||||||||||
| USCB |
U.S. Century Bank | 12.39 | 19,392 | 225.1 | 12.48 | 10.53 | 12.39 | 9.07 | 10.13 | 10.13 | NA | NA | 14.15 | 14.15 | 85.96 | |||||||||||||||||||||||||||||||||||||||||||
| UNB |
Union Bankshares, Inc. | 34.00 | 4,485 | 152.5 | 37.99 | 18.40 | 34.00 | -5.00 | 81.53 | 32.24 | 3.07 | 3.07 | 18.37 | 17.87 | 237.72 | |||||||||||||||||||||||||||||||||||||||||||
| UBOH |
United Bancshares, Inc. | 31.30 | 3,279 | 102.6 | 37.71 | 18.07 | 31.30 | -3.63 | 66.49 | 23.03 | 4.17 | 4.21 | 35.29 | 26.39 | 320.01 | |||||||||||||||||||||||||||||||||||||||||||
| UNTY |
Unity Bancorp, Inc. | 23.40 | 10,370 | 242.6 | 25.50 | 10.56 | 23.40 | 0.17 | 70.68 | 33.33 | 2.83 | 2.79 | 18.12 | 17.90 | 190.30 | |||||||||||||||||||||||||||||||||||||||||||
| VBTX |
Veritex Holdings, Inc. | 34.94 | 49,524 | 1,730.4 | 37.99 | 15.52 | 34.94 | 1.22 | 97.51 | 36.17 | 2.15 | 2.49 | 25.72 | 17.07 | 188.79 | |||||||||||||||||||||||||||||||||||||||||||
| WVFC |
WVS Financial Corp. | 16.23 | 1,742 | 28.2 | 16.79 | 13.02 | 16.23 | -1.05 | 22.57 | 13.28 | 0.74 | 0.77 | 20.37 | 20.37 | 198.69 | |||||||||||||||||||||||||||||||||||||||||||
| SRCE |
1st Source Corporation | 46.51 | 25,006 | 1,163.0 | 51.02 | 28.72 | 46.51 | -1.38 | 35.95 | 15.41 | 4.10 | 4.12 | 36.05 | 32.69 | 308.67 | |||||||||||||||||||||||||||||||||||||||||||
| AMTB |
Amerant Bancorp Inc. | 24.27 | 37,481 | 909.7 | 24.75 | 9.01 | 24.27 | 0.71 | 77.67 | 59.67 | 1.04 | 1.04 | 21.29 | 20.71 | 200.98 | |||||||||||||||||||||||||||||||||||||||||||
| AMNB |
American National Bankshares Inc. | 32.91 | 10,876 | 357.9 | 36.50 | 19.41 | 32.91 | -0.57 | 41.31 | 25.56 | 3.48 | 3.62 | 31.96 | 23.65 | 294.38 | |||||||||||||||||||||||||||||||||||||||||||
| ABCB |
Ameris Bancorp | 48.32 | 69,508 | 3,358.6 | 59.85 | 20.86 | 48.32 | -4.18 | 100.00 | 26.92 | 6.09 | 6.29 | 40.66 | 26.36 | 314.88 | |||||||||||||||||||||||||||||||||||||||||||
| AROW |
Arrow Financial Corporation | 35.33 | 15,575 | 550.3 | 38.26 | 24.51 | 35.33 | -4.90 | 28.86 | 18.12 | 3.22 | 3.21 | 22.67 | 21.20 | 250.15 | |||||||||||||||||||||||||||||||||||||||||||
| AUB |
Atlantic Union Bankshares Corporation | 37.49 | 76,905 | 2,883.2 | 42.45 | 19.61 | 37.49 | -0.48 | 58.19 | 13.81 | 3.17 | NA | 33.12 | 20.48 | 259.92 | |||||||||||||||||||||||||||||||||||||||||||
| BANF |
BancFirst Corporation | 56.89 | 32,785 | 1,865.1 | 77.38 | 39.20 | 56.89 | -2.02 | 27.96 | -3.08 | 4.41 | 4.38 | 34.52 | 29.35 | 335.99 | |||||||||||||||||||||||||||||||||||||||||||
| OZK |
Bank OZK | 41.99 | 129,613 | 5,442.4 | 45.83 | 20.10 | 41.99 | -2.35 | 80.21 | 34.28 | 4.07 | 4.06 | 34.70 | 29.52 | 205.27 | |||||||||||||||||||||||||||||||||||||||||||
| BSVN |
Bank7 Corp. | 22.31 | 9,051 | 201.9 | 24.23 | 8.11 | 22.31 | 3.53 | 117.45 | 57.11 | 2.23 | 2.25 | 12.93 | 12.76 | 125.19 | |||||||||||||||||||||||||||||||||||||||||||
| BFIN |
BankFinancial Corporation | 11.34 | 13,829 | 156.8 | 11.96 | 6.81 | 11.34 | -1.05 | 50.40 | 29.16 | 0.53 | 0.55 | 11.79 | 11.79 | 119.80 | |||||||||||||||||||||||||||||||||||||||||||
| BANR |
Banner Corporation | 55.60 | 34,552 | 1,921.1 | 60.42 | 30.05 | 55.60 | -1.03 | 58.54 | 19.34 | 5.02 | 5.25 | 48.31 | 36.99 | 468.34 | |||||||||||||||||||||||||||||||||||||||||||
| BCML |
BayCom Corp | 17.38 | 10,542 | 183.2 | 19.00 | 9.67 | 17.38 | -2.14 | 53.94 | 14.57 | 1.55 | 1.68 | 23.60 | 19.28 | 221.45 | |||||||||||||||||||||||||||||||||||||||||||
| BLFY |
Blue Foundry Bancorp | 13.50 | 28,523 | 385.1 | 13.55 | 12.32 | 13.50 | 0.82 | 35.00 | 35.00 | NA | NA | 2049.12 | 2049.12 | 90.34 | |||||||||||||||||||||||||||||||||||||||||||
| BOKF |
BOK Financial Corporation | 86.96 | 69,078 | 6,007.1 | 98.95 | 48.41 | 86.96 | -1.10 | 55.09 | 26.99 | 8.90 | 9.06 | 77.20 | 60.50 | 682.62 | |||||||||||||||||||||||||||||||||||||||||||
| BRKL |
Brookline Bancorp, Inc. | 14.68 | 78,155 | 1,147.3 | 17.14 | 8.13 | 14.68 | -1.21 | 51.81 | 21.93 | 1.32 | 1.33 | 12.36 | 10.29 | 108.27 | |||||||||||||||||||||||||||||||||||||||||||
| BFST |
Business First Bancshares, Inc. | 23.40 | 20,516 | 480.1 | 24.95 | 12.12 | 23.40 | -3.31 | 75.41 | 14.93 | 2.56 | 2.40 | 20.78 | 17.24 | 210.76 | |||||||||||||||||||||||||||||||||||||||||||
| CFFI |
C&F Financial Corporation | 53.50 | 3,592 | 192.2 | 54.55 | 28.75 | 53.50 | -0.37 | 65.12 | 44.17 | 8.16 | 8.57 | 56.02 | 48.41 | 603.66 | |||||||||||||||||||||||||||||||||||||||||||
| CALB |
California BanCorp | 17.75 | 8,229 | 146.0 | 19.88 | 10.19 | 17.75 | -1.14 | 33.22 | 14.04 | 1.12 | 1.12 | 17.47 | NA | 227.13 | |||||||||||||||||||||||||||||||||||||||||||
| CAC |
Camden National Corporation | 46.71 | 14,951 | 698.4 | 49.66 | 28.32 | 46.71 | -1.54 | 43.02 | 30.55 | 4.85 | 4.97 | 36.49 | 29.99 | 344.59 | |||||||||||||||||||||||||||||||||||||||||||
| CBNK |
Capital Bancorp, Inc. | 23.79 | 13,784 | 327.9 | 24.98 | 9.02 | 23.79 | 1.10 | 123.38 | 70.78 | 2.65 | 2.64 | 12.87 | 12.87 | 156.11 | |||||||||||||||||||||||||||||||||||||||||||
| CCBG |
Capital City Bank Group, Inc. | 23.09 | 16,874 | 389.6 | 28.98 | 17.55 | 23.09 | -3.27 | 14.59 | -6.06 | 2.08 | 1.52 | 19.90 | 14.37 | 237.73 | |||||||||||||||||||||||||||||||||||||||||||
| CFFN |
Capitol Federal Financial, Inc. | 11.51 | 135,566 | 1,560.4 | 14.38 | 8.75 | 11.51 | 1.50 | 22.32 | -7.92 | 0.55 | 0.54 | 8.91 | 8.82 | 71.18 | |||||||||||||||||||||||||||||||||||||||||||
| CSTR |
Capstar Financial Holdings, Inc. | 20.59 | 22,163 | 456.3 | 23.00 | 9.01 | 20.59 | -0.91 | 97.60 | 39.59 | 1.82 | 2.05 | 16.23 | 14.03 | 144.94 | |||||||||||||||||||||||||||||||||||||||||||
| CARE |
Carter Bankshares, Inc. | 11.85 | 26,467 | 313.6 | 16.28 | 6.30 | 11.85 | -3.42 | 65.27 | 10.54 | -1.51 | 0.23 | 15.08 | 15.08 | 155.69 | |||||||||||||||||||||||||||||||||||||||||||
| CATY |
Cathay General Bancorp | 39.18 | 78,161 | 3,062.3 | 45.19 | 20.59 | 39.18 | -0.68 | 56.91 | 21.71 | 3.49 | 3.54 | 31.37 | 26.55 | 247.55 | |||||||||||||||||||||||||||||||||||||||||||
| CBTX |
CBTX, Inc. | 26.46 | 24,450 | 647.0 | 33.29 | 14.74 | 26.46 | 1.89 | 62.93 | 3.72 | 1.56 | 1.56 | 22.75 | 19.28 | 166.32 | |||||||||||||||||||||||||||||||||||||||||||
| CHMG |
Chemung Financial Corporation | 46.32 | 4,662 | 216.0 | 47.93 | 27.38 | 46.32 | 0.09 | 50.88 | 36.44 | 5.14 | 5.15 | 43.76 | 39.07 | 510.62 | |||||||||||||||||||||||||||||||||||||||||||
| CHCO |
City Holding Company | 78.73 | 15,384 | 1,211.2 | 88.49 | 55.03 | 78.73 | -0.53 | 23.07 | 13.20 | 5.31 | 5.24 | 44.79 | 37.20 | 383.79 | |||||||||||||||||||||||||||||||||||||||||||
| CCNE |
CNB Financial Corporation | 25.11 | 16,818 | 422.3 | 26.85 | 13.95 | 25.11 | 0.16 | 47.62 | 17.94 | 2.41 | 2.99 | 22.04 | 19.42 | 306.13 | |||||||||||||||||||||||||||||||||||||||||||
| CCB |
Coastal Financial Corporation | 29.60 | 12,010 | 355.5 | 33.76 | 11.58 | 29.60 | 0.48 | 110.83 | 40.95 | 1.77 | 1.69 | 12.83 | 12.83 | 167.12 | |||||||||||||||||||||||||||||||||||||||||||
| COLB |
Columbia Banking System, Inc. | 36.52 | 70,902 | 2,589.3 | 50.68 | 22.62 | 36.52 | -1.85 | 30.43 | 1.73 | 2.95 | 3.04 | 32.52 | 21.53 | 254.06 | |||||||||||||||||||||||||||||||||||||||||||
| CBSH |
Commerce Bancshares, Inc. | 69.91 | 116,804 | 8,165.8 | 83.06 | 50.50 | 69.91 | -0.53 | 24.86 | 6.41 | 4.66 | 4.18 | 29.82 | 28.62 | 289.85 | |||||||||||||||||||||||||||||||||||||||||||
| CTBI |
Community Trust Bancorp, Inc. | 41.40 | 17,837 | 738.5 | 47.53 | 27.74 | 41.40 | -1.26 | 28.17 | 11.74 | 4.54 | 4.51 | 38.36 | 34.69 | 308.02 | |||||||||||||||||||||||||||||||||||||||||||
| CNOB |
ConnectOne Bancorp, Inc. | 29.34 | 39,698 | 1,164.7 | 29.75 | 13.72 | 29.34 | 1.24 | 102.07 | 48.26 | 2.89 | 2.91 | 24.25 | 18.76 | 194.22 | |||||||||||||||||||||||||||||||||||||||||||
| CFB |
CrossFirst Bankshares, Inc. | 13.17 | 50,988 | 671.5 | 15.67 | 7.96 | 13.17 | -1.72 | 39.22 | 22.51 | 0.83 | 0.79 | 12.50 | 12.50 | 104.17 |
| CVBF |
CVB Financial Corp. | 20.34 | 135,896 | 2,764.1 | 25.00 | 15.57 | 20.34 | 0.44 | 11.64 | 4.31 | 1.57 | 1.58 | 15.12 | 10.02 | 114.35 | |||||||||||||||||||||||||||||||||||||||||||
| DCOM |
Dime Community Bancshares, Inc. | 33.22 | 40,971 | 1,361.1 | 35.87 | 16.34 | 33.22 | 0.21 | 63.08 | 36.50 | 1.34 | 3.06 | 26.43 | 22.41 | 310.06 | |||||||||||||||||||||||||||||||||||||||||||
| EWBC |
East West Bancorp, Inc. | 71.44 | 141,878 | 10,135.7 | 82.53 | 30.49 | 71.44 | -5.98 | 96.70 | 40.88 | 5.28 | 5.27 | 39.10 | 35.78 | 421.88 | |||||||||||||||||||||||||||||||||||||||||||
| EBC |
Eastern Bankshares, Inc. | 19.54 | 171,986 | 3,360.6 | 23.03 | 11.74 | 19.54 | 0.98 | 95.40 | 19.80 | NA | NA | 18.37 | 16.33 | 99.12 | |||||||||||||||||||||||||||||||||||||||||||
| EBTC |
Enterprise Bancorp, Inc. | 33.23 | 11,895 | 395.3 | 36.78 | 19.81 | 33.23 | -4.51 | 49.95 | 30.06 | 3.47 | 3.50 | 28.24 | 27.77 | 372.25 | |||||||||||||||||||||||||||||||||||||||||||
| EFSC |
Enterprise Financial Services Corp | 45.63 | 38,625 | 1,762.4 | 52.00 | 25.21 | 45.63 | -1.83 | 48.97 | 30.56 | 3.87 | 4.34 | 35.86 | 26.85 | 267.89 | |||||||||||||||||||||||||||||||||||||||||||
| EQBK |
Equity Bancshares, Inc. | 31.74 | 14,363 | 455.9 | 33.78 | 13.91 | 31.74 | 0.57 | 106.78 | 47.01 | -3.12 | 2.56 | 28.76 | 25.51 | 297.18 | |||||||||||||||||||||||||||||||||||||||||||
| ESSA |
ESSA Bancorp, Inc. | 16.58 | 9,861 | 163.1 | 18.23 | 11.05 | 16.58 | 0.48 | 24.19 | 10.53 | 1.60 | 1.57 | 18.85 | 17.49 | 184.79 | |||||||||||||||||||||||||||||||||||||||||||
| FITB |
Fifth Third Bancorp | 37.62 | 690,718 | 25,984.8 | 43.06 | 19.32 | 37.62 | -2.23 | 90.19 | 36.45 | 3.43 | 3.33 | 29.57 | 23.35 | 297.36 | |||||||||||||||||||||||||||||||||||||||||||
| FISI |
Financial Institutions, Inc. | 31.14 | 15,630 | 486.7 | 33.45 | 14.35 | 31.14 | -4.48 | 82.96 | 38.40 | 4.10 | 4.14 | 29.66 | 24.97 | 338.79 | |||||||||||||||||||||||||||||||||||||||||||
| FBNC |
First Bancorp | 41.88 | 28,489 | 1,193.1 | 48.83 | 19.60 | 41.88 | -1.16 | 100.29 | 23.80 | 3.66 | 3.73 | 31.75 | 23.43 | 287.85 | |||||||||||||||||||||||||||||||||||||||||||
| BUSE |
First Busey Corporation | 23.58 | 56,268 | 1,326.8 | 27.61 | 15.07 | 23.58 | -0.46 | 33.83 | 9.42 | 2.30 | 2.58 | 23.89 | 17.08 | 220.65 | |||||||||||||||||||||||||||||||||||||||||||
| FBIZ |
First Business Financial Services, Inc. | 28.51 | 8,534 | 243.3 | 29.40 | 13.66 | 28.51 | -0.87 | 75.45 | 54.86 | 3.28 | 3.28 | 25.70 | 24.36 | 335.80 | |||||||||||||||||||||||||||||||||||||||||||
| FCNC.A |
First Citizens BancShares, Inc. | 847.42 | 9,816 | 8,318.6 | 901.17 | 310.27 | 847.42 | -1.08 | 117.63 | 47.56 | 57.24 | 52.29 | 421.39 | 383.11 | 5620.73 | |||||||||||||||||||||||||||||||||||||||||||
| FCBC |
First Community Bankshares, Inc. | 31.67 | 17,280 | 547.3 | 32.48 | 17.21 | 31.67 | -0.81 | 61.99 | 46.76 | 2.70 | 2.76 | 24.66 | 16.82 | 181.09 | |||||||||||||||||||||||||||||||||||||||||||
| FFBC |
First Financial Bancorp. | 23.38 | 95,702 | 2,237.5 | 26.62 | 11.28 | 23.38 | -0.47 | 65.11 | 33.37 | 1.91 | 2.11 | 23.59 | 13.23 | 167.58 | |||||||||||||||||||||||||||||||||||||||||||
| FFIN |
First Financial Bankshares, Inc. | 48.52 | 141,421 | 6,861.8 | 52.49 | 26.71 | 48.52 | -0.86 | 58.80 | 34.13 | 1.57 | 1.58 | 12.08 | 9.85 | 87.18 | |||||||||||||||||||||||||||||||||||||||||||
| THFF |
First Financial Corporation | 40.56 | 13,048 | 529.2 | 47.00 | 30.02 | 40.56 | -0.93 | 18.29 | 4.40 | 4.36 | 4.40 | 45.08 | 38.43 | 364.29 | |||||||||||||||||||||||||||||||||||||||||||
| FFNW |
First Financial Northwest, Inc. | 16.39 | 9,321 | 152.8 | 16.95 | 8.88 | 16.39 | -0.85 | 76.43 | 43.77 | 1.15 | 1.16 | 16.75 | 16.58 | 153.49 | |||||||||||||||||||||||||||||||||||||||||||
| FHB |
First Hawaiian, Inc. | 27.28 | 129,585 | 3,535.1 | 30.80 | 14.16 | 27.28 | -1.91 | 64.34 | 15.69 | 2.08 | 2.11 | 21.17 | 13.45 | 187.11 | |||||||||||||||||||||||||||||||||||||||||||
| INBK |
First Internet Bancorp | 30.24 | 9,854 | 298.0 | 41.55 | 14.05 | 30.24 | -0.23 | 100.66 | 5.22 | 4.34 | 4.13 | 36.39 | 35.73 | 426.69 | |||||||||||||||||||||||||||||||||||||||||||
| FIBK |
First Interstate BancSystem, Inc. | 45.48 | 62,240 | 1,897.5 | 51.24 | 30.02 | 45.48 | 1.81 | 47.28 | 11.55 | 3.04 | 3.20 | 31.67 | 20.49 | 304.31 | |||||||||||||||||||||||||||||||||||||||||||
| FRME |
First Merchants Corporation | 41.37 | 54,164 | 2,240.8 | 50.65 | 21.51 | 41.37 | -3.57 | 65.35 | 10.59 | 3.44 | 3.49 | 34.68 | 24.05 | 275.52 | |||||||||||||||||||||||||||||||||||||||||||
| FUNC |
First United Corporation | 17.86 | 6,615 | 118.1 | 20.48 | 10.74 | 17.86 | 0.34 | 63.70 | 15.23 | 2.50 | 2.78 | 19.74 | 18.07 | 266.65 | |||||||||||||||||||||||||||||||||||||||||||
| MYFW |
First Western Financial, Inc. | 27.00 | 7,996 | 215.9 | 31.72 | 11.95 | 27.00 | 3.25 | 92.86 | 37.97 | 3.32 | 3.37 | 21.01 | 17.98 | 251.27 | |||||||||||||||||||||||||||||||||||||||||||
| FSBC |
Five Star Bancorp | 24.90 | 17,226 | 428.9 | 28.30 | 23.00 | 24.90 | 0.24 | 31.05 | 31.05 | 3.37 | 3.41 | 12.67 | 12.67 | 135.14 | |||||||||||||||||||||||||||||||||||||||||||
| FFIC |
Flushing Financial Corporation | 22.69 | 30,889 | 700.9 | 25.22 | 10.19 | 22.69 | -0.57 | 96.79 | 36.36 | 1.82 | 1.96 | 21.16 | NA | 264.15 | |||||||||||||||||||||||||||||||||||||||||||
| FULT |
Fulton Financial Corporation | 15.74 | 163,075 | 2,566.8 | 18.41 | 8.89 | 15.74 | -1.44 | 61.93 | 23.74 | 1.49 | 1.57 | 15.34 | 12.05 | 159.93 | |||||||||||||||||||||||||||||||||||||||||||
| GABC |
German American Bancorp, Inc. | 38.06 | 26,546 | 1,010.3 | 51.11 | 26.02 | 38.06 | -1.53 | 31.33 | 15.02 | 2.98 | 3.04 | 24.45 | 19.58 | 201.49 | |||||||||||||||||||||||||||||||||||||||||||
| GBCI |
Glacier Bancorp, Inc. | 53.50 | 95,508 | 5,109.7 | 67.35 | 30.05 | 53.50 | 0.36 | 52.64 | 16.28 | 3.33 | 3.43 | 24.65 | 18.74 | 214.52 | |||||||||||||||||||||||||||||||||||||||||||
| GSBC |
Great Southern Bancorp, Inc. | 53.18 | 13,582 | 722.3 | 60.55 | 34.32 | 53.18 | -0.64 | 40.50 | 8.75 | 5.06 | 5.19 | 46.09 | 45.62 | 410.65 | |||||||||||||||||||||||||||||||||||||||||||
| GNTY |
Guaranty Bancshares, Inc. | 33.51 | 12,058 | 404.1 | 41.28 | 20.98 | 33.51 | -2.30 | 36.07 | 23.08 | 3.40 | 3.44 | 23.86 | 20.98 | 243.24 | |||||||||||||||||||||||||||||||||||||||||||
| HWC |
Hancock Whitney Corporation | 44.95 | 86,851 | 3,903.9 | 50.69 | 17.42 | 44.95 | -1.60 | 124.75 | 32.13 | 4.28 | 4.51 | 41.03 | 30.27 | 404.13 | |||||||||||||||||||||||||||||||||||||||||||
| HAFC |
Hanmi Financial Corporation | 18.82 | 30,453 | 573.1 | 22.29 | 7.48 | 18.82 | -1.10 | 97.07 | 65.96 | 2.26 | 2.22 | 19.64 | 19.23 | 216.03 | |||||||||||||||||||||||||||||||||||||||||||
| HONE |
HarborOne Bancorp, Inc. | 13.77 | 51,663 | 711.4 | 15.49 | 7.59 | 13.77 | -0.72 | 54.03 | 26.80 | 1.19 | 1.19 | 12.66 | 11.34 | 89.36 | |||||||||||||||||||||||||||||||||||||||||||
| HWBK |
Hawthorn Bancshares, Inc. | 22.78 | 6,617 | 150.7 | 25.06 | 16.29 | 22.78 | -0.74 | 26.42 | 8.18 | 3.13 | 3.13 | 20.63 | 20.63 | 258.27 | |||||||||||||||||||||||||||||||||||||||||||
| HBT |
HBT Financial, Inc. | 15.74 | 27,346 | 430.4 | 18.83 | 11.01 | 15.74 | -5.24 | 24.72 | 3.89 | 1.89 | 1.94 | 13.64 | 12.70 | 144.58 | |||||||||||||||||||||||||||||||||||||||||||
| HTLF |
Heartland Financial USA, Inc. | 46.96 | 42,246 | 1,983.9 | 54.04 | 28.37 | 46.96 | -0.68 | 41.57 | 16.32 | 4.82 | 4.99 | 48.50 | 33.97 | 434.86 | |||||||||||||||||||||||||||||||||||||||||||
| HTBK |
Heritage Commerce Corp | 11.37 | 60,207 | 684.5 | 12.65 | 6.13 | 11.37 | 0.09 | 67.08 | 28.18 | 0.72 | 0.76 | 9.69 | 6.65 | 84.26 | |||||||||||||||||||||||||||||||||||||||||||
| HFWA |
Heritage Financial Corporation | 24.88 | 35,950 | 894.4 | 30.86 | 17.39 | 24.88 | -1.43 | 26.29 | 6.37 | 2.72 | 2.73 | 23.77 | 16.76 | 197.65 | |||||||||||||||||||||||||||||||||||||||||||
| HBCP |
Home Bancorp, Inc. | 36.62 | 8,646 | 316.6 | 39.84 | 22.71 | 36.62 | -1.95 | 51.64 | 30.83 | 5.00 | 5.16 | 38.92 | 31.72 | 319.78 | |||||||||||||||||||||||||||||||||||||||||||
| HOMB |
Home Bancshares, Inc. (Conway, AR) | 21.69 | 164,088 | 3,559.1 | 29.76 | 14.42 | 21.69 | -1.68 | 32.42 | 11.34 | 1.95 | 1.90 | 16.39 | 10.31 | 107.43 | |||||||||||||||||||||||||||||||||||||||||||
| HMST |
HomeStreet, Inc. | 40.77 | 20,795 | 847.8 | 52.46 | 24.20 | 40.77 | -0.66 | 44.78 | 20.80 | 5.12 | 5.46 | 34.09 | 32.53 | 344.70 | |||||||||||||||||||||||||||||||||||||||||||
| HTBI |
HomeTrust Bancshares, Inc. | 27.69 | 16,489 | 456.6 | 30.09 | 12.81 | 27.69 | 0.25 | 92.69 | 43.40 | 0.94 | 2.12 | 23.83 | 22.27 | 213.76 | |||||||||||||||||||||||||||||||||||||||||||
| HOPE |
Hope Bancorp, Inc. | 13.89 | 122,898 | 1,707.1 | 16.61 | 7.03 | 13.89 | -0.79 | 66.35 | 27.31 | 1.26 | 1.27 | 16.92 | 13.09 | 142.15 | |||||||||||||||||||||||||||||||||||||||||||
| HBNC |
Horizon Bancorp, Inc. | 18.18 | 43,951 | 799.0 | 20.17 | 9.42 | 18.18 | -0.11 | 65.42 | 14.63 | 1.92 | 1.97 | 16.16 | 12.24 | 139.00 | |||||||||||||||||||||||||||||||||||||||||||
| HBAN |
Huntington Bancshares Incorporated | 14.76 | 1,476,557 | 21,794.0 | 16.91 | 8.52 | 14.76 | -2.57 | 60.43 | 16.86 | 0.97 | 1.21 | 11.96 | 8.16 | 118.64 | |||||||||||||||||||||||||||||||||||||||||||
| INDB |
Independent Bank Corp. | 77.58 | 33,044 | 2,563.6 | 99.85 | 49.25 | 77.58 | 1.90 | 20.35 | 6.22 | 4.51 | 4.67 | 52.72 | 36.78 | 429.55 | |||||||||||||||||||||||||||||||||||||||||||
| IBCP |
Independent Bank Corporation | 20.75 | 21,519 | 446.5 | 24.73 | 12.14 | 20.75 | -2.26 | 43.60 | 12.34 | 3.22 | 3.33 | 18.30 | 16.82 | 207.32 | |||||||||||||||||||||||||||||||||||||||||||
| IBTX |
Independent Bank Group, Inc. | 70.04 | 43,168 | 3,023.5 | 80.71 | 41.09 | 70.04 | -1.82 | 51.93 | 12.03 | 5.48 | 5.73 | 58.89 | 33.98 | 427.34 | |||||||||||||||||||||||||||||||||||||||||||
| IBOC |
International Bancshares Corporation | 41.67 | 63,372 | 2,640.7 | 53.06 | 25.21 | 41.67 | -1.88 | 30.06 | 11.30 | 3.68 | 3.64 | 36.07 | 31.61 | 241.60 | |||||||||||||||||||||||||||||||||||||||||||
| KRNY |
Kearny Financial Corp. | 13.05 | 77,983 | 1,017.7 | 13.77 | 6.91 | 13.05 | 0.85 | 68.60 | 23.58 | 0.77 | 0.80 | 13.21 | NA | 93.40 | |||||||||||||||||||||||||||||||||||||||||||
| LBAI |
Lakeland Bancorp, Inc. | 16.52 | 50,601 | 835.9 | 19.35 | 9.49 | 16.52 | 0.61 | 53.96 | 30.08 | 1.63 | 1.64 | 15.74 | 12.60 | 155.22 | |||||||||||||||||||||||||||||||||||||||||||
| LKFN |
Lakeland Financial Corporation | 66.85 | 25,300 | 1,691.3 | 77.05 | 39.38 | 66.85 | -7.05 | 40.03 | 24.77 | 3.71 | 3.66 | 26.78 | 26.59 | 246.36 | |||||||||||||||||||||||||||||||||||||||||||
| LEVL |
Level One Bancorp, Inc. | 27.29 | 7,644 | 208.6 | 28.77 | 14.72 | 27.29 | -0.69 | 64.70 | 34.90 | 3.63 | 3.66 | 26.48 | 21.45 | 327.92 | |||||||||||||||||||||||||||||||||||||||||||
| LOB |
Live Oak Bancshares, Inc. | 57.50 | 43,308 | 2,460.9 | 72.64 | 19.37 | 57.50 | -3.75 | 193.07 | 21.15 | 3.78 | 3.00 | 15.19 | NA | 190.34 | |||||||||||||||||||||||||||||||||||||||||||
| LBC |
Luther Burbank Corporation | 12.78 | 51,723 | 661.0 | 13.28 | 7.58 | 12.78 | -2.22 | 35.24 | 30.41 | 1.20 | 1.36 | 12.32 | 12.25 | 140.31 | |||||||||||||||||||||||||||||||||||||||||||
| MCBC |
Macatawa Bank Corporation | 8.25 | 34,192 | 282.1 | 10.66 | 6.23 | 8.25 | -1.79 | 12.86 | -1.43 | 0.93 | 0.93 | 7.26 | 7.26 | 86.02 | |||||||||||||||||||||||||||||||||||||||||||
| MBWM |
Mercantile Bank Corporation | 31.70 | 15,893 | 503.8 | 34.47 | 17.09 | 31.70 | -3.12 | 49.60 | 16.67 | 3.51 | 3.62 | 28.23 | 25.03 | 299.34 | |||||||||||||||||||||||||||||||||||||||||||
| MRBK |
Meridian Corporation | 27.27 | 6,049 | 164.9 | 29.18 | 14.12 | 27.27 | -0.80 | 79.41 | 31.11 | 5.97 | 5.83 | 24.77 | 24.06 | 282.54 | |||||||||||||||||||||||||||||||||||||||||||
| CASH |
Meta Financial Group, Inc. | 49.02 | 31,920 | 1,564.7 | 54.65 | 17.74 | 49.02 | -1.59 | 155.71 | 34.08 | 4.27 | 4.36 | 27.42 | 16.63 | 220.92 | |||||||||||||||||||||||||||||||||||||||||||
| MCBS |
MetroCity Bankshares, Inc. | 20.91 | 25,500 | 533.2 | 22.33 | 12.24 | 20.91 | -2.24 | 47.15 | 45.01 | 1.79 | 1.79 | 10.33 | 9.89 | 98.74 | |||||||||||||||||||||||||||||||||||||||||||
| MSBI |
Midland States Bancorp, Inc. | 25.38 | 22,395 | 568.4 | 30.32 | 12.48 | 25.38 | 0.28 | 75.40 | 42.03 | 2.05 | 2.50 | 28.96 | 20.48 | 296.05 | |||||||||||||||||||||||||||||||||||||||||||
| MOFG |
MidWestOne Financial Group, Inc. | 29.56 | 15,875 | 469.3 | 33.68 | 16.59 | 29.56 | -2.31 | 53.72 | 20.65 | 2.24 | 4.07 | 33.22 | 27.90 | 362.15 | |||||||||||||||||||||||||||||||||||||||||||
| NBTB |
NBT Bancorp Inc. | 36.30 | 43,336 | 1,573.1 | 42.79 | 26.10 | 36.30 | -1.57 | 19.02 | 13.08 | 3.41 | 3.56 | 28.19 | 21.50 | 267.10 | |||||||||||||||||||||||||||||||||||||||||||
| NTRS |
Northern Trust Corporation | 114.60 | 208,395 | 23,882.0 | 123.10 | 74.03 | 114.60 | -1.52 | 40.73 | 23.04 | 5.86 | 6.13 | 52.49 | 48.60 | 826.75 | |||||||||||||||||||||||||||||||||||||||||||
| NFBK |
Northfield Bancorp, Inc. (Staten Island, NY) | 16.48 | 50,805 | 837.3 | 17.25 | 8.72 | 16.48 | -1.55 | 71.49 | 33.66 | 1.21 | 1.30 | 14.81 | 14.00 | 106.82 | |||||||||||||||||||||||||||||||||||||||||||
| NRIM |
Northrim BanCorp, Inc. | 39.89 | 6,207 | 247.6 | 48.19 | 23.44 | 39.89 | -6.82 | 58.80 | 17.50 | 6.70 | NA | 38.22 | 35.64 | 395.30 | |||||||||||||||||||||||||||||||||||||||||||
| NWBI |
Northwest Bancshares, Inc. | 13.10 | 126,888 | 1,662.2 | 15.48 | 8.84 | 13.10 | -1.65 | 32.73 | 2.83 | 1.28 | 1.22 | 12.32 | 9.22 | 112.68 | |||||||||||||||||||||||||||||||||||||||||||
| OCFC |
OceanFirst Financial Corp. | 21.17 | 59,454 | 1,258.6 | 25.76 | 13.14 | 21.17 | -2.31 | 33.94 | 13.63 | 1.46 | 1.30 | 24.29 | 15.58 | 193.16 | |||||||||||||||||||||||||||||||||||||||||||
| ONB |
Old National Bancorp | 16.49 | 165,720 | 2,732.7 | 21.28 | 12.02 | 16.49 | -1.14 | 16.29 | -0.42 | 1.81 | 1.97 | 18.05 | 11.55 | 142.87 | |||||||||||||||||||||||||||||||||||||||||||
| OSBC |
Old Second Bancorp, Inc. | 11.80 | 28,708 | 338.8 | 14.45 | 7.19 | 11.80 | -2.07 | 46.77 | 16.83 | 1.31 | 1.32 | 11.01 | 10.29 | 113.23 | |||||||||||||||||||||||||||||||||||||||||||
| OBNK |
Origin Bancorp, Inc. | 40.40 | 23,502 | 949.5 | 46.65 | 19.40 | 40.40 | -2.42 | 72.95 | 45.48 | 3.56 | 3.47 | 29.28 | 28.01 | 309.25 | |||||||||||||||||||||||||||||||||||||||||||
| PPBI |
Pacific Premier Bancorp, Inc. | 39.19 | 94,650 | 3,709.3 | 47.46 | 18.47 | 39.19 | -1.31 | 83.73 | 25.09 | 3.14 | 3.22 | 29.72 | 19.34 | 216.90 | |||||||||||||||||||||||||||||||||||||||||||
| PACW |
PacWest Bancorp | 40.86 | 117,214 | 4,789.3 | 46.75 | 15.62 | 40.86 | -3.24 | 118.27 | 60.87 | 4.16 | 4.24 | 32.17 | 21.95 | 297.47 | |||||||||||||||||||||||||||||||||||||||||||
| PCB |
PCB Bancorp | 19.71 | 14,761 | 290.9 | 21.29 | 8.20 | 19.71 | -4.18 | 107.69 | 94.96 | 1.79 | 1.79 | 16.09 | 16.05 | 139.55 | |||||||||||||||||||||||||||||||||||||||||||
| PGC |
Peapack-Gladstone Financial Corporation | 33.04 | 17,878 | 590.7 | 33.99 | 14.38 | 33.04 | -0.21 | 97.84 | 45.17 | 2.28 | 2.64 | 28.60 | 26.30 | 323.95 | |||||||||||||||||||||||||||||||||||||||||||
| PWOD |
Penns Woods Bancorp, Inc. | 23.67 | 7,065 | 167.2 | 28.19 | 19.50 | 23.67 | -0.67 | 15.18 | -9.00 | 2.19 | 2.03 | 23.63 | 21.12 | 268.20 | |||||||||||||||||||||||||||||||||||||||||||
| PEBO |
Peoples Bancorp Inc. | 31.30 | 19,330 | 605.0 | 36.75 | 18.35 | 31.30 | 0.81 | 48.83 | 15.54 | 2.86 | 3.25 | 29.78 | 18.63 | 262.17 | |||||||||||||||||||||||||||||||||||||||||||
| PFIS |
Peoples Financial Services Corp. | 45.59 | 7,202 | 328.4 | 47.54 | 31.75 | 45.59 | 1.31 | 20.96 | 24.02 | 4.76 | 4.67 | 45.11 | 36.21 | 416.22 | |||||||||||||||||||||||||||||||||||||||||||
| PNFP |
Pinnacle Financial Partners, Inc. | 93.83 | 75,687 | 7,101.7 | 97.73 | 32.80 | 93.83 | -2.12 | 129.58 | 45.70 | 6.14 | 6.28 | 64.19 | 39.77 | 467.88 | |||||||||||||||||||||||||||||||||||||||||||
| BPOP |
Popular, Inc. | 75.21 | 80,671 | 6,067.3 | 83.72 | 34.30 | 75.21 | -2.22 | 100.88 | 33.54 | 9.88 | 9.43 | 71.82 | 63.24 | 900.66 | |||||||||||||||||||||||||||||||||||||||||||
| PFBC |
Preferred Bank | 60.64 | 14,924 | 905.0 | 69.44 | 30.65 | 60.64 | 1.47 | 60.89 | 20.15 | 5.41 | 5.45 | 37.36 | 37.31 | 373.63 | |||||||||||||||||||||||||||||||||||||||||||
| PFC |
Premier Financial Corp. | 29.63 | 37,179 | 1,101.6 | 35.90 | 14.74 | 29.63 | -0.54 | 56.03 | 28.83 | 3.45 | 3.66 | 27.64 | 18.36 | 204.25 | |||||||||||||||||||||||||||||||||||||||||||
| PFHD |
Professional Holding Corp. | 18.85 | 13,419 | 252.9 | 20.66 | 11.52 | 18.85 | -4.80 | 41.73 | 22.16 | 1.24 | 1.34 | 16.55 | 14.63 | 190.85 | |||||||||||||||||||||||||||||||||||||||||||
| PROV |
Provident Financial Holdings, Inc. | 17.30 | 7,541 | 130.0 | 18.48 | 11.40 | 17.30 | 0.00 | 42.98 | 10.12 | 1.00 | 0.75 | 16.88 | 16.88 | 156.95 | |||||||||||||||||||||||||||||||||||||||||||
| RBB |
RBB Bancorp | 25.64 | 19,354 | 496.2 | 25.80 | 10.71 | 25.64 | 1.46 | 94.98 | 66.71 | 2.29 | 2.35 | 22.86 | 18.87 | 201.03 | |||||||||||||||||||||||||||||||||||||||||||
| RRBI |
Red River Bancshares, Inc. | 50.55 | 7,276 | 367.8 | 65.07 | 40.98 | 50.55 | -2.36 | 14.94 | 2.02 | 4.21 | 4.17 | 40.21 | 40.00 | 395.59 |
| RNST |
Renasant Corporation | 34.93 | 56,352 | 1,968.4 | 46.97 | 20.89 | 34.93 | -4.95 | 40.28 | 3.71 | 2.83 | 3.05 | 39.11 | 21.92 | 284.33 | |||||||||||||||||||||||||||||||||||||||||||
| RBCA.A |
Republic Bancorp, Inc. | 50.10 | 20,399 | 913.5 | 50.75 | 27.22 | 50.10 | 0.14 | 63.09 | 38.90 | 3.59 | 3.59 | 41.05 | 40.26 | 303.12 | |||||||||||||||||||||||||||||||||||||||||||
| RVSB |
Riverview Bancorp, Inc. | 7.39 | 22,107 | 163.4 | 7.79 | 3.77 | 7.39 | -0.67 | 70.67 | 40.49 | 0.70 | 0.69 | 7.05 | 5.80 | 73.14 | |||||||||||||||||||||||||||||||||||||||||||
| STBA |
S&T Bancorp, Inc. | 30.01 | 39,344 | 1,180.7 | 35.80 | 16.98 | 30.01 | -1.61 | 45.82 | 20.81 | 2.58 | 2.61 | 30.21 | 20.52 | 241.35 | |||||||||||||||||||||||||||||||||||||||||||
| SASR |
Sandy Spring Bancorp, Inc. | 42.49 | 47,227 | 2,006.7 | 48.22 | 21.11 | 42.49 | -2.41 | 78.91 | 32.00 | 4.90 | 5.03 | 33.02 | 24.58 | 273.69 | |||||||||||||||||||||||||||||||||||||||||||
| SBCF |
Seacoast Banking Corporation of Florida | 31.58 | 55,011 | 1,737.2 | 40.93 | 17.00 | 31.58 | -2.65 | 60.06 | 7.23 | 2.11 | 2.29 | 21.33 | 17.12 | 169.36 | |||||||||||||||||||||||||||||||||||||||||||
| SHBI |
Shore Bancshares, Inc. | 17.29 | 11,753 | 203.2 | 18.10 | 9.46 | 17.29 | -2.76 | 71.87 | 18.42 | 1.27 | 1.33 | 16.91 | 15.29 | 180.40 | |||||||||||||||||||||||||||||||||||||||||||
| BSRR |
Sierra Bancorp | 24.12 | 15,245 | 367.7 | 29.42 | 15.84 | 24.12 | -1.63 | 34.00 | 0.84 | 2.74 | 2.73 | 23.21 | 21.19 | 214.63 | |||||||||||||||||||||||||||||||||||||||||||
| SBNY |
Signature Bank | 245.93 | 59,905 | 14,732.5 | 268.46 | 71.45 | 245.93 | -4.48 | 153.04 | 81.78 | 12.69 | 12.74 | 106.24 | 105.89 | 1617.35 | |||||||||||||||||||||||||||||||||||||||||||
| SFNC |
Simmons First National Corporation | 28.74 | 108,284 | 3,112.1 | 33.43 | 14.84 | 28.74 | -1.27 | 69.26 | 33.12 | 2.40 | 2.23 | 28.03 | 17.16 | 216.31 | |||||||||||||||||||||||||||||||||||||||||||
| SPFI |
South Plains Financial, Inc. | 22.82 | 17,954 | 409.7 | 25.08 | 11.52 | 22.82 | -4.24 | 55.98 | 20.42 | 3.35 | 3.44 | 21.81 | 20.35 | 206.80 | |||||||||||||||||||||||||||||||||||||||||||
| SSB |
South State Corporation | 68.73 | 70,041 | 4,813.9 | 93.26 | 45.00 | 68.73 | -4.17 | 20.24 | -4.94 | 6.00 | 7.91 | 67.60 | 43.07 | 576.46 | |||||||||||||||||||||||||||||||||||||||||||
| SSBK |
Southern States Bancshares, Inc. | 19.60 | 9,013 | 176.7 | 21.01 | 19.10 | 19.60 | 1.55 | 3.16 | 3.16 | 2.07 | NA | NA | NA | 166.43 | |||||||||||||||||||||||||||||||||||||||||||
| SBSI |
Southside Bancshares, Inc. | 37.00 | 32,654 | 1,208.2 | 43.69 | 23.51 | 37.00 | -1.15 | 33.67 | 19.24 | 3.40 | 3.46 | 27.37 | 20.97 | 219.96 | |||||||||||||||||||||||||||||||||||||||||||
| STXB |
Spirit of Texas Bancshares, Inc. | 22.39 | 17,169 | 384.4 | 24.94 | 10.45 | 22.39 | -2.48 | 82.78 | 33.27 | 2.41 | 2.55 | 22.01 | 16.97 | 179.67 | |||||||||||||||||||||||||||||||||||||||||||
| SYBT |
Stock Yards Bancorp, Inc. | 51.63 | 26,588 | 1,372.7 | 56.00 | 32.71 | 51.63 | 0.16 | 21.80 | 27.54 | 2.58 | 3.20 | 24.49 | 19.16 | 228.98 | |||||||||||||||||||||||||||||||||||||||||||
| SMMF |
Summit Financial Group, Inc. | 23.44 | 12,964 | 303.9 | 27.40 | 14.50 | 23.44 | -0.26 | 53.60 | 6.16 | 3.13 | 3.08 | 23.11 | 18.96 | 252.43 | |||||||||||||||||||||||||||||||||||||||||||
| SIVB |
SVB Financial Group | 550.95 | 58,664 | 32,320.7 | 608.84 | 221.55 | 550.95 | -5.29 | 128.89 | 42.06 | 34.99 | 20.07 | 176.10 | 172.44 | 2785.36 | |||||||||||||||||||||||||||||||||||||||||||
| TBNK |
Territorial Bancorp Inc. | 25.63 | 9,004 | 230.8 | 30.04 | 19.23 | 25.63 | 0.35 | 18.66 | 6.66 | 2.05 | 1.86 | 26.67 | 26.67 | 236.79 | |||||||||||||||||||||||||||||||||||||||||||
| TCBI |
Texas Capital Bancshares, Inc. | 64.80 | 50,598 | 3,278.7 | 93.26 | 29.45 | 64.80 | -0.49 | 104.03 | 8.91 | 4.86 | 5.04 | 55.64 | 55.29 | 696.25 | |||||||||||||||||||||||||||||||||||||||||||
| TBBK |
The Bancorp, Inc. | 23.79 | 57,022 | 1,356.6 | 26.70 | 7.95 | 23.79 | -6.08 | 153.62 | 74.29 | 1.74 | 1.75 | 10.77 | 10.73 | 114.88 | |||||||||||||||||||||||||||||||||||||||||||
| BPRN |
The Bank of Princeton | 30.39 | 6,803 | 206.8 | 31.31 | 17.40 | 30.39 | -0.88 | 56.34 | 29.82 | 2.62 | 2.69 | 31.96 | 30.23 | 240.40 | |||||||||||||||||||||||||||||||||||||||||||
| FNLC |
The First Bancorp, Inc. | 29.77 | 10,991 | 327.2 | 32.63 | 19.10 | 29.77 | -1.42 | 40.56 | 17.20 | 2.89 | 2.91 | 21.31 | 18.49 | 222.96 | |||||||||||||||||||||||||||||||||||||||||||
| TOWN |
TowneBank | 30.40 | 71,750 | 2,181.2 | 33.25 | 15.36 | 30.40 | -2.69 | 67.31 | 29.47 | 2.89 | 2.65 | 25.51 | 18.70 | 220.26 | |||||||||||||||||||||||||||||||||||||||||||
| TCBK |
TriCo Bancshares | 39.44 | 29,712 | 1,171.8 | 51.66 | 23.38 | 39.44 | -3.14 | 40.11 | 11.79 | 3.46 | 3.60 | 32.53 | 24.60 | 274.99 | |||||||||||||||||||||||||||||||||||||||||||
| TSC |
TriState Capital Holdings, Inc. | 20.23 | 33,157 | 670.8 | 26.42 | 12.09 | 20.23 | -3.21 | 44.50 | 16.26 | 1.39 | 1.33 | 18.54 | 16.65 | 348.08 | |||||||||||||||||||||||||||||||||||||||||||
| TBK |
Triumph Bancorp, Inc. | 80.39 | 24,751 | 1,989.7 | 97.49 | 26.86 | 80.39 | -1.89 | 188.14 | 65.58 | 4.54 | 4.36 | 29.76 | 18.35 | 243.05 | |||||||||||||||||||||||||||||||||||||||||||
| TRST |
TrustCo Bank Corp NY | 32.79 | 19,265 | 631.7 | 41.47 | 25.25 | 32.79 | -3.05 | 12.29 | -1.68 | 2.92 | 2.92 | 30.03 | 30.00 | 317.81 | |||||||||||||||||||||||||||||||||||||||||||
| TRMK |
Trustmark Corporation | 30.23 | 62,455 | 1,888.0 | 36.31 | 20.08 | 30.23 | -2.10 | 28.09 | 10.69 | 3.25 | 3.28 | 28.35 | 22.13 | 273.77 | |||||||||||||||||||||||||||||||||||||||||||
| UMBF |
UMB Financial Corporation | 90.58 | 48,348 | 4,379.3 | 99.98 | 45.87 | 90.58 | -2.55 | 72.21 | 31.29 | 8.46 | 6.58 | 63.92 | 59.96 | 757.41 | |||||||||||||||||||||||||||||||||||||||||||
| UMPQ |
Umpqua Holdings Corporation | 19.61 | 220,133 | 4,316.8 | 20.44 | 10.03 | 19.61 | -2.49 | 76.83 | 29.52 | 2.27 | 2.28 | 12.54 | NA | 137.58 | |||||||||||||||||||||||||||||||||||||||||||
| UBSI |
United Bankshares, Inc. | 35.86 | 128,811 | 4,619.2 | 42.50 | 20.57 | 35.86 | 0.14 | 35.27 | 10.68 | 3.07 | 3.11 | 34.01 | 19.81 | 211.09 | |||||||||||||||||||||||||||||||||||||||||||
| UCBI |
United Community Banks, Inc. | 29.80 | 86,628 | 2,581.5 | 36.67 | 15.73 | 29.80 | -4.12 | 68.93 | 4.78 | 2.78 | 2.88 | 22.96 | 18.51 | 218.13 | |||||||||||||||||||||||||||||||||||||||||||
| UBFO |
United Security Bancshares | 8.16 | 17,010 | 138.8 | 8.92 | 5.79 | 8.16 | -0.97 | 35.32 | 15.74 | 0.48 | 0.48 | 6.96 | 6.69 | 72.37 | |||||||||||||||||||||||||||||||||||||||||||
| UVSP |
Univest Financial Corporation | 27.24 | 29,413 | 801.2 | 30.14 | 13.92 | 27.24 | -0.66 | 69.19 | 32.36 | 3.32 | 3.39 | 25.16 | 19.22 | 216.11 | |||||||||||||||||||||||||||||||||||||||||||
| VLY |
Valley National Bancorp | 13.10 | 406,601 | 5,326.5 | 14.74 | 6.50 | 13.10 | -0.98 | 75.60 | 34.36 | 1.07 | 1.11 | 11.15 | 7.64 | 101.51 | |||||||||||||||||||||||||||||||||||||||||||
| WAFD |
Washington Federal, Inc. | 33.46 | 67,946 | 2,273.5 | 34.00 | 20.01 | 33.46 | 0.03 | 39.36 | 29.99 | 2.13 | 2.00 | 27.74 | 23.30 | 289.19 | |||||||||||||||||||||||||||||||||||||||||||
| WASH |
Washington Trust Bancorp, Inc. | 52.31 | 17,320 | 906.0 | 56.20 | 30.01 | 52.31 | 0.46 | 55.50 | 16.76 | 4.30 | 4.49 | 31.63 | 27.60 | 337.87 | |||||||||||||||||||||||||||||||||||||||||||
| WSBF |
Waterstone Financial, Inc. | 20.05 | 23,842 | 478.6 | 21.41 | 14.62 | 20.05 | -2.48 | 29.52 | 6.54 | 3.88 | 3.97 | 17.12 | 17.10 | 92.35 | |||||||||||||||||||||||||||||||||||||||||||
| WSBC |
WesBanco, Inc. | 33.99 | 65,404 | 2,223.1 | 39.87 | 19.56 | 33.99 | -0.85 | 54.43 | 13.45 | 3.42 | 3.61 | 39.96 | 22.42 | 259.42 | |||||||||||||||||||||||||||||||||||||||||||
| WTBA |
West Bancorporation, Inc. | 29.28 | 16,555 | 484.7 | 31.98 | 15.50 | 29.28 | -6.21 | 71.53 | 51.71 | 2.50 | 2.49 | 14.89 | 14.89 | 197.45 | |||||||||||||||||||||||||||||||||||||||||||
| WABC |
Westamerica Bancorporation | 56.89 | 26,866 | 1,528.4 | 66.85 | 51.32 | 56.89 | -2.79 | -5.98 | 2.89 | 3.22 | 3.12 | 31.35 | 26.78 | 266.06 | |||||||||||||||||||||||||||||||||||||||||||
| WNEB |
Western New England Bancorp, Inc. | 8.87 | 24,070 | 213.5 | 9.24 | 4.92 | 8.87 | 1.26 | 73.24 | 28.74 | 0.76 | 0.79 | 9.29 | 8.66 | 102.89 | |||||||||||||||||||||||||||||||||||||||||||
| WTFC |
Wintrust Financial Corporation | 72.86 | 57,041 | 4,156.0 | 87.85 | 37.28 | 72.86 | -1.92 | 69.01 | 19.27 | 7.54 | NA | 68.81 | 56.92 | 819.39 | |||||||||||||||||||||||||||||||||||||||||||
| WSFS |
WSFS Financial Corporation | 44.70 | 47,535 | 2,124.8 | 55.18 | 24.59 | 44.70 | -1.91 | 53.77 | -0.40 | 5.58 | 5.73 | 39.63 | 28.08 | 318.69 | |||||||||||||||||||||||||||||||||||||||||||
| ZION |
Zions Bancorporation, National Association | 53.87 | 162,070 | 8,730.7 | 60.65 | 27.55 | 53.87 | -2.78 | 67.66 | 24.01 | 6.65 | 6.23 | 46.80 | 40.54 | 538.09 | |||||||||||||||||||||||||||||||||||||||||||
| ASB |
Associated Banc-Corp | 20.74 | 150,297 | 3,117.2 | 23.95 | 12.04 | 20.74 | -1.43 | 55.01 | 21.64 | 1.80 | 2.11 | 24.99 | 17.35 | 227.23 | |||||||||||||||||||||||||||||||||||||||||||
| AX |
Axos Financial, Inc. | 48.69 | 59,318 | 2,888.2 | 54.36 | 21.27 | 48.69 | -2.58 | 100.70 | 29.74 | 3.56 | 3.81 | 23.62 | 21.66 | 240.49 | |||||||||||||||||||||||||||||||||||||||||||
| BANC |
Banc of California, Inc. | 17.74 | 50,792 | 892.6 | 21.40 | 9.00 | 17.74 | -1.72 | 57.41 | 20.60 | 1.08 | 1.13 | 14.46 | 13.67 | 158.04 | |||||||||||||||||||||||||||||||||||||||||||
| BXS |
BancorpSouth Bank | 28.42 | 108,601 | 3,086.4 | 35.59 | 18.11 | 28.42 | -0.63 | 29.48 | 3.57 | 2.80 | 2.88 | 26.72 | 17.41 | 254.25 | |||||||||||||||||||||||||||||||||||||||||||
| BAC |
Bank of America Corporation | 40.37 | 8,414,904 | 339,709.7 | 43.49 | 22.95 | 40.37 | -3.03 | 60.84 | 33.19 | 2.99 | NA | 29.89 | 21.50 | 360.06 | |||||||||||||||||||||||||||||||||||||||||||
| BOH |
Bank of Hawaii Corporation | 84.99 | 40,478 | 3,440.2 | 99.10 | 48.77 | 84.99 | -0.99 | 52.67 | 10.92 | 5.19 | 5.31 | 34.80 | 34.02 | 560.11 | |||||||||||||||||||||||||||||||||||||||||||
| BKU |
BankUnited, Inc. | 41.02 | 92,821 | 3,807.5 | 50.71 | 20.52 | 41.02 | -2.52 | 84.69 | 17.94 | 3.76 | 3.62 | 33.91 | 33.06 | 384.61 | |||||||||||||||||||||||||||||||||||||||||||
| BHLB |
Berkshire Hills Bancorp, Inc. | 25.75 | 48,114 | 1,238.9 | 28.97 | 8.55 | 25.75 | -4.17 | 175.40 | 50.41 | 1.53 | 1.73 | 23.30 | 22.66 | 255.09 | |||||||||||||||||||||||||||||||||||||||||||
| BY |
Byline Bancorp, Inc. | 25.00 | 37,733 | 943.3 | 25.78 | 10.49 | 25.00 | -1.96 | 93.65 | 61.81 | 1.94 | 2.08 | 21.17 | NA | 173.34 | |||||||||||||||||||||||||||||||||||||||||||
| COF |
Capital One Financial Corporation | 168.22 | 446,114 | 75,045.3 | 177.95 | 63.39 | 168.22 | -5.35 | 161.74 | 70.18 | 25.06 | 25.16 | 130.32 | 97.29 | 949.13 | |||||||||||||||||||||||||||||||||||||||||||
| CPF |
Central Pacific Financial Corp. | 25.59 | 28,219 | 722.1 | 28.81 | 12.80 | 25.59 | -2.40 | 62.17 | 34.61 | 1.97 | 2.06 | 19.59 | 19.59 | 254.39 | |||||||||||||||||||||||||||||||||||||||||||
| C |
Citigroup Inc. | 70.25 | 2,026,785 | 142,381.7 | 80.29 | 40.49 | 70.25 | -3.91 | 41.69 | 13.93 | 9.74 | 9.40 | 90.87 | 77.88 | 1148.55 | |||||||||||||||||||||||||||||||||||||||||||
| CFG |
Citizens Financial Group, Inc. | 42.34 | 426,083 | 18,040.4 | 51.14 | 23.46 | 42.34 | -5.43 | 74.24 | 18.40 | 4.48 | 4.66 | 49.72 | 33.05 | 434.43 | |||||||||||||||||||||||||||||||||||||||||||
| CMA |
Comerica Incorporated | 71.28 | 133,924 | 9,546.1 | 79.86 | 35.76 | 71.28 | -4.90 | 83.57 | 27.60 | 7.76 | 7.70 | 56.28 | 51.43 | 659.74 | |||||||||||||||||||||||||||||||||||||||||||
| CBU |
Community Bank System, Inc. | 74.16 | 53,918 | 3,998.6 | 82.53 | 52.37 | 74.16 | -1.28 | 26.55 | 19.02 | 3.50 | 3.76 | 38.23 | 22.60 | 274.51 | |||||||||||||||||||||||||||||||||||||||||||
| CFR |
Cullen/Frost Bankers, Inc. | 114.06 | 63,650 | 7,259.9 | 125.00 | 61.50 | 114.06 | -2.07 | 62.92 | 30.76 | 6.45 | 6.54 | 66.44 | 56.13 | 733.67 | |||||||||||||||||||||||||||||||||||||||||||
| CUBI |
Customers Bancorp, Inc. | 38.60 | 32,374 | 1,249.6 | 43.86 | 10.41 | 38.60 | -0.36 | 213.06 | 112.32 | 7.12 | 6.83 | 31.94 | 31.82 | 606.51 | |||||||||||||||||||||||||||||||||||||||||||
| FNB |
F.N.B. Corporation | 11.44 | 319,519 | 3,655.3 | 13.83 | 6.37 | 11.44 | -2.39 | 55.86 | 20.42 | 1.06 | 1.18 | 15.43 | 8.20 | 120.20 | |||||||||||||||||||||||||||||||||||||||||||
| FBK |
FB Financial Corporation | 40.38 | 47,363 | 1,912.5 | 49.62 | 23.64 | 40.38 | -1.87 | 52.90 | 16.27 | 2.81 | 3.55 | 28.96 | 23.43 | 251.64 | |||||||||||||||||||||||||||||||||||||||||||
| FBP |
First BanCorp. | 12.56 | 207,260 | 2,603.2 | 13.25 | 4.94 | 12.56 | -2.33 | 125.09 | 36.23 | 0.97 | 1.17 | 10.30 | 9.94 | 103.11 | |||||||||||||||||||||||||||||||||||||||||||
| FCF |
First Commonwealth Financial Corporation | 13.32 | 95,688 | 1,274.6 | 15.69 | 7.14 | 13.32 | -1.62 | 63.24 | 21.76 | 1.19 | 1.27 | 11.50 | 8.25 | 98.26 | |||||||||||||||||||||||||||||||||||||||||||
| FHN |
First Horizon Corporation | 15.83 | 549,333 | 8,695.9 | 19.45 | 8.53 | 15.83 | -2.58 | 66.98 | 24.06 | 2.30 | NA | 14.07 | 10.74 | 160.03 | |||||||||||||||||||||||||||||||||||||||||||
| FRC |
First Republic Bank | 194.60 | 179,060 | 34,845.0 | 204.68 | 100.38 | 194.60 | -2.14 | 72.50 | 32.44 | 6.95 | 6.97 | 62.99 | 61.72 | 902.75 | |||||||||||||||||||||||||||||||||||||||||||
| GWB |
Great Western Bancorp, Inc. | 31.26 | 55,116 | 1,722.9 | 35.18 | 11.80 | 31.26 | -1.85 | 122.97 | 49.57 | 2.94 | 2.87 | 21.07 | 20.97 | 237.14 | |||||||||||||||||||||||||||||||||||||||||||
| HTH |
Hilltop Holdings Inc. | 33.48 | 81,155 | 2,717.1 | 39.60 | 17.80 | 33.48 | 0.87 | 69.35 | 21.70 | 5.66 | NA | 30.44 | 26.93 | 217.67 | |||||||||||||||||||||||||||||||||||||||||||
| JPM |
JPMorgan Chase & Co. | 154.72 | 2,988,155 | 462,327.4 | 167.44 | 91.38 | 154.72 | -3.29 | 58.90 | 21.76 | 14.99 | 14.82 | 84.85 | 68.08 | 1232.95 | |||||||||||||||||||||||||||||||||||||||||||
| KEY |
KeyCorp | 19.91 | 956,370 | 19,041.3 | 23.65 | 11.33 | 19.91 | -3.72 | 66.06 | 21.33 | 2.30 | 2.36 | 16.70 | 13.76 | 189.38 | |||||||||||||||||||||||||||||||||||||||||||
| LC |
LendingClub Corporation | 28.70 | 98,597 | 2,829.7 | 29.72 | 4.32 | 28.70 | -1.68 | 410.68 | 171.78 | NA | NA | 7.73 | 6.10 | 44.32 | |||||||||||||||||||||||||||||||||||||||||||
| MTB |
M&T Bank Corporation | 135.70 | 128,678 | 17,461.6 | 168.27 | 88.48 | 135.70 | -3.03 | 33.47 | 6.60 | 13.01 | 13.10 | 120.22 | 84.46 | 1170.54 | |||||||||||||||||||||||||||||||||||||||||||
| MCB |
Metropolitan Bank Holding Corp. | 77.01 | 8,344 | 642.6 | 77.65 | 25.51 | 77.01 | -0.56 | 156.70 | 112.32 | 5.64 | 5.59 | 42.92 | 41.75 | 693.56 | |||||||||||||||||||||||||||||||||||||||||||
| NBHC |
National Bank Holdings Corporation | 37.00 | 30,801 | 1,139.6 | 43.21 | 24.35 | 37.00 | -0.13 | 31.11 | 12.94 | 3.40 | 3.43 | 27.52 | 23.58 | 231.69 | |||||||||||||||||||||||||||||||||||||||||||
| NYCB |
New York Community Bancorp, Inc. | 12.31 | 465,033 | 5,724.6 | 13.23 | 7.72 | 12.31 | -2.38 | 32.79 | 16.68 | 1.21 | 1.07 | 13.79 | 8.57 | 123.58 | |||||||||||||||||||||||||||||||||||||||||||
| OFG |
OFG Bancorp | 23.41 | 51,662 | 1,209.4 | 25.52 | 11.97 | 23.41 | -2.50 | 82.89 | 26.27 | 2.26 | 2.67 | 20.44 | 17.98 | 202.50 | |||||||||||||||||||||||||||||||||||||||||||
| PB |
Prosperity Bancshares, Inc. | 70.29 | 92,930 | 6,532.1 | 83.02 | 48.80 | 70.29 | 0.04 | 28.69 | 1.34 | 5.73 | 5.84 | 67.90 | 32.40 | 388.46 | |||||||||||||||||||||||||||||||||||||||||||
| PFS |
Provident Financial Services, Inc. | 21.89 | 76,381 | 1,672.0 | 25.70 | 11.76 | 21.89 | -1.62 | 64.96 | 21.88 | 2.11 | 2.10 | 21.55 | 15.58 | 173.04 | |||||||||||||||||||||||||||||||||||||||||||
| RF |
Regions Financial Corporation | 20.03 | 954,539 | 19,119.4 | 23.81 | 10.60 | 20.03 | -2.29 | 80.78 | 24.26 | 2.53 | 2.51 | 17.38 | 11.84 | 163.02 | |||||||||||||||||||||||||||||||||||||||||||
| SFBS |
ServisFirst Bancshares, Inc. | 71.30 | 54,201 | 3,864.5 | 74.49 | 31.93 | 71.30 | -2.38 | 92.49 | 76.97 | 3.61 | 3.60 | 19.79 | 19.54 | 243.67 | |||||||||||||||||||||||||||||||||||||||||||
| SI |
Silvergate Capital Corporation | 100.75 | 26,521 | 2,672.0 | 187.86 | 13.50 | 100.75 | -9.80 | 572.56 | 35.58 | 2.19 | 2.19 | 32.84 | 32.84 | 463.39 | |||||||||||||||||||||||||||||||||||||||||||
| STT |
State Street Corporation | 86.09 | 343,503 | 29,572.2 | 92.63 | 56.63 | 86.09 | -5.18 | 26.73 | 18.29 | 6.28 | 7.09 | 67.51 | 39.68 | 950.58 | |||||||||||||||||||||||||||||||||||||||||||
| SNV |
Synovus Financial Corp. | 42.36 | 146,446 | 6,203.4 | 50.51 | 19.39 | 42.36 | -3.20 | 104.54 | 30.86 | 3.90 | 4.37 | 31.96 | 28.59 | 375.15 | |||||||||||||||||||||||||||||||||||||||||||
| BK |
The Bank of New York Mellon Corporation | 53.32 | 863,174 | 46,024.4 | 55.02 | 32.65 | 53.32 | -1.02 | 48.65 | 25.64 | 3.87 | 3.96 | 47.20 | 23.51 | 540.98 | |||||||||||||||||||||||||||||||||||||||||||
| PNC |
The PNC Financial Services Group, Inc. | 185.82 | 424,993 | 78,972.2 | 203.88 | 101.58 | 185.82 | -2.40 | 75.17 | 24.71 | 13.18 | NA | 120.25 | 93.16 | 1304.05 |
| TFC |
Truist Financial Corporation | 55.58 | 1,334,831 | 74,189.9 | 62.69 | 34.86 | 55.58 | -3.14 | 49.37 | 15.96 | 3.83 | 4.72 | 46.20 | 25.94 | 391.03 | |||||||||||||||
| USB |
U.S. Bancorp | 55.68 | 1,482,623 | 82,552.4 | 62.47 | 34.17 | 55.68 | -4.36 | 56.36 | 19.51 | 4.67 | 4.72 | 31.75 | 24.63 | 376.96 | |||||||||||||||
| WBS |
Webster Financial Corporation | 48.70 | 90,592 | 4,411.8 | 63.81 | 23.67 | 48.70 | -3.66 | 76.19 | 15.54 | 3.57 | NA | 35.15 | 28.99 | 372.59 | |||||||||||||||
| WFC |
Wells Fargo & Company | 47.42 | 4,106,411 | 194,726.0 | 51.41 | 20.76 | 47.42 | -5.86 | 99.66 | 57.12 | 3.76 | 2.75 | 41.49 | 34.94 | 473.89 | |||||||||||||||
| WAL |
Western Alliance Bancorporation | 95.09 | 103,261 | 9,819.1 | 109.84 | 30.34 | 95.09 | -4.80 | 168.92 | 58.62 | 7.36 | 7.24 | 38.70 | 32.84 | 475.19 | |||||||||||||||
| BHB |
Bar Harbor Bankshares | 26.69 | 14,982 | 399.9 | 32.37 | 18.17 | 26.69 | -6.05 | 29.50 | 18.15 | 2.37 | 2.58 | 27.76 | 19.30 | 242.93 | |||||||||||||||
| BRBS |
Blue Ridge Bankshares, Inc. | 17.80 | 18,778 | 334.2 | 18.71 | 8.98 | 17.80 | -0.34 | 88.03 | 49.92 | 3.06 | NA | 14.31 | 12.38 | 147.24 | |||||||||||||||
| EVBN |
Evans Bancorp, Inc. | 38.59 | 5,413 | 208.9 | 40.45 | 21.79 | 38.59 | -2.80 | 67.49 | 40.12 | 3.99 | 3.95 | 32.28 | NA | 399.06 | |||||||||||||||
| PRK |
Park National Corporation | 119.72 | 16,337 | 1,955.8 | 141.96 | 79.96 | 119.72 | -2.49 | 39.55 | 14.01 | 9.62 | 9.67 | 65.44 | 55.17 | 608.93 | |||||||||||||||
| TMP |
Tompkins Financial Corporation | 80.01 | 14,737 | 1,179.1 | 92.80 | 54.32 | 80.01 | -1.16 | 18.71 | 13.33 | 6.50 | 6.57 | 49.01 | 42.55 | 542.06 | |||||||||||||||
| WFCL |
1867 Western Financial Corporation | 8000.00 | NA | NA | 8500.00 | 6250.00 | 8000.00 | 0.00 | 44.01 | 18.52 | 1337.90 | 502.10 | 7681.94 | 7275.04 | NA | |||||||||||||||
| FCOB |
1st Colonial Bancorp, Inc. | 9.65 | 4,832 | 46.6 | 10.01 | 5.35 | 9.65 | -3.02 | 74.19 | 24.36 | 1.38 | NA | 11.47 | 11.47 | 141.78 | |||||||||||||||
| FSMK |
1ST SUMMIT BANCORP of Johnstown, Inc. | 132.50 | 1,095 | 145.5 | 132.50 | 82.00 | 132.50 | 0.00 | 6.85 | 61.59 | NA | NA | NA | NA | 1169.87 | |||||||||||||||
| ABTO |
AB&T Financial Corp. | 0.89 | 31,433 | 28.0 | 0.95 | 0.30 | 0.89 | 27.14 | 140.54 | 36.92 | 0.03 | 0.03 | NA | NA | 6.47 | |||||||||||||||
| ASCN |
Absecon Bancorp | 85.00 | 119 | 10.1 | 90.13 | 68.00 | 85.00 | 6.25 | 14.86 | 13.33 | 7.17 | 7.17 | 141.86 | 141.86 | 1440.18 | |||||||||||||||
| AFBA |
Allied First Bancorp, Inc. | 7.50 | 1,772 | 13.3 | 9.75 | 2.85 | 7.50 | -2.34 | 187.36 | 105.48 | NA | NA | NA | NA | 82.60 | |||||||||||||||
| AMFC |
AMB Financial Corp. | 21.15 | 923 | 19.5 | 21.15 | 10.51 | 21.15 | 0.95 | 69.20 | 32.19 | 4.18 | 4.17 | 25.60 | 25.60 | 294.46 | |||||||||||||||
| AMBK |
American Bank Incorporated | 15.50 | 5,685 | 88.1 | 16.88 | 11.30 | 15.50 | 0.85 | 31.91 | 29.17 | 1.57 | NA | NA | NA | 140.24 | |||||||||||||||
| ANDC |
Andover Bancorp, Inc. | 18.00 | 2,285 | 41.1 | 20.24 | 17.75 | 18.00 | -2.81 | -0.28 | -2.70 | NA | NA | NA | NA | 248.12 | |||||||||||||||
| APLO |
Apollo Bancorp, Inc. | 42.00 | 520 | 21.8 | 43.00 | 37.00 | 42.00 | 1.82 | 2.16 | -2.33 | 3.74 | 3.74 | 43.39 | 43.39 | 344.36 | |||||||||||||||
| AVBH |
Avidbank Holdings, Inc. | 23.10 | 6,236 | 144.1 | 24.00 | 13.20 | 23.10 | -3.75 | 67.15 | 32.00 | 1.87 | 1.77 | 21.26 | 21.26 | 257.24 | |||||||||||||||
| BBBK |
Baker Boyer Bancorp | 68.50 | 1,297 | 87.8 | 74.50 | 62.00 | 68.50 | -2.14 | 2.24 | 0.74 | NA | NA | 46.39 | 46.39 | 597.55 | |||||||||||||||
| BSPA |
Ballston Spa Bancorp, Inc. | 53.10 | 743 | 39.4 | 60.00 | 41.50 | 53.10 | -10.76 | 27.95 | 18.00 | NA | NA | 62.04 | 59.89 | 979.03 | |||||||||||||||
| BAFI |
Bancaffiliated Inc. | 100.00 | 431 | 43.1 | 100.00 | 80.00 | 100.00 | 0.00 | -5.66 | 25.00 | NA | NA | NA | NA | 3168.14 | |||||||||||||||
| BCSO |
Bancorp. of Southern Indiana | 42.00 | 1,354 | 56.9 | 42.00 | 34.10 | 42.00 | 0.00 | -6.67 | 0.00 | 6.30 | NA | NA | NA | 541.80 | |||||||||||||||
| BORT |
Bank of Botetourt | 30.55 | 1,741 | 53.2 | 35.00 | 21.50 | 30.55 | -1.45 | 35.78 | 24.95 | 3.46 | 3.42 | 32.67 | 32.67 | 370.76 | |||||||||||||||
| BHDB |
Bank of Labor Bancshares, Inc. | 35.67 | 374 | 13.4 | 41.50 | 34.00 | 35.67 | 4.91 | -12.47 | -14.05 | NA | NA | NA | NA | 2143.02 | |||||||||||||||
| BSSC |
Bank of Southside Virginia Corporation, The | 244.00 | 545 | 133.0 | 260.00 | 222.00 | 244.00 | 0.00 | 6.09 | 9.91 | NA | NA | NA | NA | 1190.39 | |||||||||||||||
| BKUT |
Bank of Utica | 575.00 | 250 | 143.8 | 600.00 | 545.00 | 575.00 | 2.68 | 0.88 | 0.00 | 205.58 | 51.52 | 1111.41 | 1111.41 | 5765.94 | |||||||||||||||
| BKGM |
BankGuam Holding Company | 12.50 | 9,723 | 121.5 | 12.99 | 8.00 | 12.50 | 0.00 | 53.37 | 31.58 | 1.56 | 1.36 | 16.32 | 16.24 | 301.32 | |||||||||||||||
| CBOB.A |
Bay Community Bancorp | 8.00 | 8,714 | 69.3 | 8.00 | 4.90 | 8.00 | 0.00 | 60.00 | 36.75 | NA | NA | 7.44 | 7.42 | 91.33 | |||||||||||||||
| BMBN |
Benchmark Bankshares, Inc. | 23.50 | 4,524 | 106.3 | 24.00 | 13.61 | 23.50 | -1.84 | 59.32 | 42.42 | 2.45 | 2.45 | 17.77 | 17.77 | 216.29 | |||||||||||||||
| BTOF |
Benton Financial Corporation | 30.00 | 661 | 19.8 | NA | NA | 30.00 | 0.00 | 0.00 | 0.00 | NA | NA | NA | NA | 315.52 | |||||||||||||||
| BEOB |
BEO Bancorp | 36.25 | 1,199 | 43.5 | 44.00 | 29.00 | 36.25 | 0.00 | 9.85 | -16.47 | 4.96 | NA | 36.27 | 35.18 | 602.53 | |||||||||||||||
| BLHK |
blueharbor bank | 13.07 | 2,932 | 38.3 | 14.00 | 8.50 | 13.07 | -0.61 | 50.75 | 27.51 | 1.33 | 1.33 | 12.80 | 12.80 | 132.96 | |||||||||||||||
| BOLB |
BOL Bancshares Inc. | 12.00 | 179 | 2.1 | 20.00 | 11.25 | 12.00 | 0.00 | -20.00 | -40.00 | 5.53 | -1.13 | 34.31 | 34.31 | 494.42 | |||||||||||||||
| BYLB |
Boyle Bancorp, Inc. | 84.50 | 868 | 73.4 | 85.00 | 61.83 | 84.50 | -0.29 | 37.82 | 20.73 | NA | NA | 81.04 | 77.36 | 937.00 | |||||||||||||||
| BRBW |
Brunswick Bancorp | 12.23 | 2,818 | 34.5 | 12.49 | 7.46 | 12.23 | 1.07 | 55.80 | 35.14 | 1.22 | 0.60 | 15.11 | 15.11 | 128.97 | |||||||||||||||
| BHRB |
Burke & Herbert Bank & Trust Company | 2132.00 | 186 | 395.6 | 3325.00 | 1545.00 | 2132.00 | -3.09 | 36.67 | 24.90 | NA | NA | 2104.72 | 2104.72 | 19158.10 | |||||||||||||||
| CABB |
California Business Bank | 0.07 | 132,441 | 9.3 | 0.25 | 0.06 | 0.07 | 0.00 | 32.26 | -19.43 | NA | NA | NA | NA | 0.73 | |||||||||||||||
| CAIB |
California International Bank, N.A. | 0.09 | 170,431 | 15.9 | 0.15 | 0.04 | 0.09 | 0.00 | -5.10 | 158.33 | NA | NA | NA | NA | 0.47 | |||||||||||||||
| CNND |
Canandaigua National Corporation | 271.00 | 1,871 | 509.2 | 310.00 | 151.00 | 271.00 | 3.83 | 37.56 | 44.15 | 24.76 | NA | 165.85 | NA | 2114.16 | |||||||||||||||
| CSKL |
Catskill Hudson Bancorp, Inc. | 26.65 | 703 | 18.7 | 31.25 | 23.25 | 26.65 | -6.85 | 15.87 | 14.62 | 1.61 | 1.13 | NA | NA | 813.19 | |||||||||||||||
| CBHC |
CBC Holding Company | 23.50 | 608 | 14.3 | 26.50 | 21.00 | 23.50 | 0.00 | -6.00 | -6.00 | NA | NA | 37.34 | 34.60 | 366.94 | |||||||||||||||
| CBOF |
CBOA Financial, Inc. | 3.00 | 8,892 | 26.7 | 3.50 | 1.65 | 3.00 | -2.91 | 50.00 | 20.48 | 0.42 | 0.50 | 3.16 | 3.16 | 37.85 | |||||||||||||||
| CCYY |
CCCB Bancorp, Inc. | 9.00 | 1,666 | 15.0 | 9.00 | 5.75 | 9.00 | 6.13 | 36.57 | 34.73 | NA | NA | 10.90 | 10.90 | 121.21 | |||||||||||||||
| CCFN |
CCFNB Bancorp, Inc. | 51.00 | 2,077 | 105.9 | 59.00 | 38.25 | 51.00 | -3.77 | 26.55 | 15.94 | 4.69 | 4.61 | 50.80 | 46.98 | 431.74 | |||||||||||||||
| CCFC |
CCSB Financial Corp. | 17.01 | 746 | 12.7 | 19.50 | 16.13 | 17.01 | 0.00 | 5.46 | 0.35 | NA | NA | NA | NA | 202.08 | |||||||||||||||
| CBCY.B |
Central Bancompany, Inc. | 591.50 | 4,425 | 2,617.4 | 595.00 | 530.00 | 591.50 | 0.25 | 0.25 | 2.87 | 56.79 | 57.26 | 537.04 | 453.72 | 4286.34 | |||||||||||||||
| CBSU |
Central Bank Corporation | 27.50 | 993 | 27.3 | 30.00 | 20.50 | 27.50 | -6.91 | 35.47 | 3.77 | NA | NA | NA | NA | 337.55 | |||||||||||||||
| CFCX |
Centric Financial Corporation | 9.75 | 8,476 | 82.6 | 9.85 | 6.40 | 9.75 | 1.04 | 37.32 | 13.64 | 1.46 | NA | 10.85 | 10.79 | 131.06 | |||||||||||||||
| CYFL |
Century Financial Corporation | 25.24 | 1,820 | 45.9 | 25.24 | 18.00 | 25.24 | 0.96 | 31.12 | 9.98 | 2.94 | 2.91 | 25.74 | 25.74 | 242.14 | |||||||||||||||
| CNBA |
Chester Bancorp, Inc. | 54.00 | 655 | 35.4 | 54.00 | 14.10 | 54.00 | 0.00 | 231.29 | 282.98 | NA | NA | 10.76 | NA | 103.20 | |||||||||||||||
| CCBC |
Chino Commercial Bancorp | 13.05 | 2,677 | 34.9 | 15.55 | 7.88 | 13.05 | -1.88 | 63.30 | 36.77 | 1.15 | 1.15 | 10.61 | 10.61 | 131.99 | |||||||||||||||
| CZBC |
Citizens Bancorp | 16.86 | 5,624 | 94.8 | 18.49 | 13.56 | 16.86 | 0.00 | 16.28 | 8.77 | 1.71 | NA | NA | NA | 187.31 | |||||||||||||||
| CZBT |
Citizens Bancorp of Virginia, Inc. | 28.00 | 2,143 | 60.0 | 29.00 | 23.25 | 28.00 | 4.67 | 16.67 | 19.40 | 2.38 | 2.38 | 27.08 | 27.08 | 245.78 | |||||||||||||||
| CZBS |
Citizens Bancshares Corporation | 10.68 | 1,981 | 20.2 | 15.95 | 8.55 | 10.68 | 0.00 | 6.64 | 6.27 | NA | NA | NA | NA | 303.45 | |||||||||||||||
| CCVS |
Citizens Commerce Bancshares, Inc. | 8.00 | 3,988 | 31.9 | 8.24 | 6.12 | 8.00 | 0.00 | 29.87 | 18.69 | NA | NA | NA | NA | 77.87 | |||||||||||||||
| CIWV |
Citizens Financial Corp. | 18.75 | 1,783 | 32.0 | 19.50 | 12.85 | 18.75 | 0.00 | 31.03 | 29.31 | NA | NA | NA | NA | 193.08 | |||||||||||||||
| CZFS |
Citizens Financial Services, Inc. | 62.00 | 3,952 | 245.0 | 65.00 | 42.57 | 62.00 | 0.00 | 30.19 | 11.82 | 7.68 | 7.36 | 51.73 | 43.65 | 506.92 | |||||||||||||||
| CNBL |
Citizens National Bancshares of Bossier, Inc. | 18.00 | 6,202 | 111.6 | 22.99 | 17.95 | 18.00 | -2.70 | -8.86 | -10.00 | NA | NA | NA | NA | 208.65 | |||||||||||||||
| CZNL |
Citizens National Corporation | 49.00 | 996 | 48.8 | 75.00 | 41.00 | 49.00 | 0.00 | 2.62 | 10.11 | NA | NA | NA | NA | 740.83 | |||||||||||||||
| CNBW |
CNB Corp. | 85.00 | 1,599 | 135.9 | 85.00 | 68.01 | 85.00 | 0.00 | 21.43 | 14.86 | NA | NA | NA | NA | 1016.73 | |||||||||||||||
| CNBZ |
CNB Corporation | 22.04 | 1,211 | 26.7 | 25.00 | 17.20 | 22.04 | -11.84 | 11.59 | 15.51 | 2.40 | NA | 24.54 | 24.54 | 364.74 | |||||||||||||||
| CBFC |
CNB Financial Services, Inc. | 59.00 | 406 | 23.3 | 62.31 | 45.00 | 59.00 | 0.00 | 40.48 | 31.11 | 8.61 | 7.91 | NA | NA | 1246.04 | |||||||||||||||
| CABT |
Coastal Bank & Trust | 7.00 | 1,345 | 9.4 | 7.33 | 5.26 | 7.00 | 1.45 | 7.69 | 12.00 | NA | NA | NA | NA | 129.76 | |||||||||||||||
| CDAB |
Coeur d’Alene Bancorp, Inc. | 11.30 | 1,888 | 21.3 | 12.00 | 8.78 | 11.30 | 0.00 | 25.56 | 18.95 | 0.93 | NA | 11.28 | 11.26 | 124.60 | |||||||||||||||
| CEFC |
Commercial National Financial Corporation | 10.50 | 3,965 | 41.6 | 11.79 | 8.05 | 10.50 | -3.23 | 11.70 | 13.51 | 1.40 | NA | 10.87 | NA | 148.19 | |||||||||||||||
| CNUN |
Community Bancshares, Inc. (McArthur, OH) | 72.00 | 1,308 | 94.2 | 73.00 | 67.50 | 72.00 | 6.29 | 9.09 | 9.09 | 8.12 | 8.23 | 98.20 | 92.48 | 976.28 | |||||||||||||||
| CTYP |
Community Bankers’ Corporation | 9.00 | 2,248 | 20.2 | 9.00 | 6.60 | 9.00 | 5.88 | 28.57 | 27.12 | NA | NA | NA | NA | 158.07 | |||||||||||||||
| CFGW |
Community Financial Group, Inc. (Spokane, WA) | 38.00 | 1,859 | 70.6 | 38.00 | 28.30 | 38.00 | 0.00 | 34.27 | 29.89 | 3.21 | 3.21 | 27.74 | 27.74 | 331.10 | |||||||||||||||
| CFOK |
Community First Bancorporation | 7.25 | 5,495 | 39.8 | 7.45 | 5.06 | 7.25 | -0.68 | 23.93 | 21.44 | 0.39 | NA | 8.80 | NA | 116.22 | |||||||||||||||
| CMHF |
Community Heritage Financial, Inc. | 22.65 | 2,251 | 51.0 | 28.00 | 16.00 | 22.65 | 0.00 | 35.47 | 20.80 | 2.34 | 2.02 | 24.23 | 23.49 | 324.88 | |||||||||||||||
| CIBN |
Community Investors Bancorp, Inc. | 18.64 | 795 | 14.8 | 20.24 | 14.83 | 18.64 | 0.00 | 25.86 | 6.51 | 3.09 | NA | 21.62 | 21.62 | 288.89 | |||||||||||||||
| CBCZ |
Comunibanc Corp. | 32.03 | 829 | 26.5 | 33.00 | 24.50 | 32.03 | 0.00 | 20.87 | 18.63 | 2.61 | 2.60 | 38.69 | 38.69 | 401.97 | |||||||||||||||
| CNBP |
Cornerstone Bancorp Inc. | 63.00 | 994 | 62.6 | 63.00 | 60.00 | 63.00 | 0.00 | 14.55 | 5.00 | 9.13 | NA | 52.76 | 52.76 | 967.05 | |||||||||||||||
| CRSB |
Cornerstone Community Bancorp | 28.20 | 1,458 | 41.1 | 31.65 | 13.75 | 28.20 | 0.71 | 93.15 | 44.99 | 4.75 | 4.73 | 23.22 | 23.22 | 360.69 | |||||||||||||||
| CFIC |
Cornerstone Financial Corporation | 11.00 | 2,172 | 23.9 | 11.00 | 6.80 | 11.00 | 0.00 | 44.35 | 59.42 | NA | NA | NA | NA | 125.61 | |||||||||||||||
| CRZY |
Crazy Woman Creek Bancorp Incorporated | 24.00 | 530 | 12.7 | 25.00 | 15.25 | 24.00 | 0.00 | 60.00 | 25.00 | 3.22 | 3.21 | 27.38 | 27.13 | 296.12 | |||||||||||||||
| CYVF |
Crystal Valley Financial Corporation | 63.12 | 1,442 | 91.0 | 64.00 | 45.00 | 63.12 | -0.60 | 34.30 | 20.73 | 8.06 | 7.78 | 60.09 | NA | 492.46 | |||||||||||||||
| CSBB |
CSB Bancorp, Inc. | 39.25 | 2,734 | 107.3 | 39.25 | 28.55 | 39.25 | 1.82 | 18.94 | 12.14 | 4.04 | 4.05 | 35.11 | 33.38 | 412.88 | |||||||||||||||
| CBMI |
CSB Bancorp Inc. | 195.00 | 118 | 23.1 | 195.00 | 195.00 | 195.00 | 0.00 | -56.67 | 0.00 | 45.74 | 45.59 | 352.94 | 352.94 | 3627.83 | |||||||||||||||
| DWNX |
Delhi Bank Corp. | 18.30 | 3,276 | 59.9 | 19.00 | 17.00 | 18.30 | -3.68 | 7.65 | 5.02 | 0.68 | 0.68 | 10.41 | 10.41 | 112.70 | |||||||||||||||
| DENI |
Denali Bancorporation, Inc. | 11.10 | 2,863 | 31.8 | 13.49 | 9.00 | 11.10 | 0.82 | 16.84 | -14.62 | 1.09 | 1.09 | 11.43 | 11.43 | 132.91 | |||||||||||||||
| DNVB |
Denver Bankshares, Inc. | 245.00 | 76 | 18.6 | 270.00 | 200.00 | 245.00 | 0.00 | -9.26 | 22.50 | NA | NA | NA | NA | 3594.10 | |||||||||||||||
| DMNB |
Diamond Bancshares, Inc. | 75.00 | 143 | 10.7 | 75.00 | 75.00 | 75.00 | 0.00 | -2.15 | 0.00 | NA | NA | 95.86 | NA | 953.23 | |||||||||||||||
| DIMC |
Dimeco, Inc. | 36.00 | 2,468 | 88.8 | 37.40 | 31.55 | 36.00 | -1.37 | 2.86 | 12.50 | 3.83 | NA | 38.07 | 38.07 | 379.02 | |||||||||||||||
| EFIN |
Eastern Michigan Financial Corporation | 31.65 | 1,238 | 39.2 | 31.65 | 25.46 | 31.65 | 1.93 | 19.89 | 15.09 | 3.73 | NA | 35.86 | 35.52 | 405.70 |
| ELMA |
Elmer Bancorp, Inc. | 20.30 | 1,150 | 23.3 | 20.35 | 13.90 | 20.30 | 0.00 | 40.97 | 35.33 | 1.25 | NA | 25.13 | NA | 322.99 | |||||||||||||||
| EBSH |
Empire Bancshares, Inc. | 21.50 | 662 | 14.2 | 22.00 | 18.40 | 21.50 | 0.00 | 7.50 | 13.16 | NA | NA | NA | NA | 225.60 | |||||||||||||||
| EDVR |
Endeavor Bank | 9.28 | 3,372 | 31.3 | 10.25 | 7.20 | 9.28 | 0.00 | 11.81 | 16.15 | 1.05 | 1.05 | 8.86 | 8.86 | 137.54 | |||||||||||||||
| EFSG |
Enterprise Financial Services Group, Inc. | 13.40 | 1,135 | 15.2 | 13.40 | 8.50 | 13.40 | 0.00 | 67.50 | 41.05 | NA | NA | NA | NA | 340.81 | |||||||||||||||
| ERKH |
Eureka Homestead Bancorp, Inc. | 12.99 | 1,085 | 13.8 | 13.97 | 9.25 | 12.99 | -0.08 | 41.97 | 1.48 | NA | NA | 18.41 | 18.41 | 98.55 | |||||||||||||||
| EXSR |
Exchange Bank (Santa Rosa, CA) | 156.00 | 1,714 | 267.4 | 175.00 | 109.75 | 156.00 | 3.65 | 34.48 | 5.41 | 19.67 | NA | 180.24 | 180.24 | 2001.35 | |||||||||||||||
| EXCH |
Exchange Bankshares, Inc. | 40.32 | 634 | 25.6 | 43.75 | 33.00 | 40.32 | 0.00 | 6.11 | 12.00 | NA | NA | NA | NA | 508.20 | |||||||||||||||
| FMOO |
F&M Bancorp | 79.25 | 316 | 25.0 | 84.00 | 66.00 | 79.25 | 0.00 | 20.08 | 20.08 | 9.78 | NA | 76.54 | 76.54 | 814.84 | |||||||||||||||
| FMBN |
Farmers & Merchants Bancshares, Inc. (Burlington, IA) | 35.00 | 268 | 9.3 | 35.00 | 19.75 | 35.00 | 0.00 | 66.67 | 25.00 | 4.44 | NA | 57.87 | 57.87 | 857.07 | |||||||||||||||
| FMFG |
Farmers and Merchants Bancshares, Inc. | 22.50 | 3,023 | 68.0 | 29.99 | 12.75 | 22.50 | 0.00 | 68.54 | 69.17 | 1.61 | 2.37 | 18.00 | 15.66 | 234.00 | |||||||||||||||
| FABP |
Farmers Bancorp (Frankfort IN) | 45.75 | 2,059 | 94.2 | 47.00 | 34.65 | 45.75 | 0.44 | 24.49 | 22.33 | 5.08 | 5.07 | 41.74 | 41.74 | 368.80 | |||||||||||||||
| FBVA |
Farmers Bankshares, Inc. | 18.10 | 3,101 | 56.1 | 20.94 | 12.21 | 18.10 | -4.38 | 43.08 | 35.78 | 2.80 | 2.60 | 21.51 | 18.29 | 190.55 | |||||||||||||||
| FBVI |
FCN Banc Corp. | 46.55 | 1,749 | 81.4 | 49.00 | 43.66 | 46.55 | 0.98 | 17.37 | 17.37 | 5.35 | NA | NA | NA | 413.09 | |||||||||||||||
| FFDF |
FFD Financial Corporation | 74.00 | 983 | 72.7 | 78.00 | 65.12 | 74.00 | 0.43 | 15.64 | 1.37 | 8.97 | 8.97 | 52.07 | 51.52 | 601.16 | |||||||||||||||
| FFWC |
FFW Corporation | 46.00 | 1,141 | 52.5 | 48.00 | 37.00 | 46.00 | -1.08 | 21.85 | 15.72 | 5.67 | 5.60 | 46.40 | 45.34 | 426.26 | |||||||||||||||
| FDLB |
Fidelity Federal Bancorp | 90.00 | 1,938 | 174.4 | 90.00 | 90.00 | 90.00 | 0.00 | -10.00 | -10.00 | NA | NA | 10.20 | NA | 100.83 | |||||||||||||||
| FNWD |
Finward Bancorp | 41.48 | 3,479 | 144.3 | 46.00 | 30.60 | 41.48 | -1.36 | 33.94 | 14.90 | 4.80 | 4.60 | 44.71 | 40.48 | 460.89 | |||||||||||||||
| FBLV |
First Bancorp Inc., Lebanon | 57.00 | 8,291 | 472.6 | NA | NA | 57.00 | 0.00 | 0.00 | 0.00 | 4.26 | NA | 29.18 | 29.04 | 303.42 | |||||||||||||||
| FBPI |
First Bancorp of Indiana, Inc. | 21.00 | 1,738 | 36.5 | 22.50 | 15.10 | 21.00 | -4.98 | 33.33 | 21.74 | 2.00 | NA | 23.49 | 19.91 | 277.23 | |||||||||||||||
| FIBH |
First Bancshares Inc. (Bellevue, OH) | 41.00 | 538 | 22.0 | 44.00 | 32.50 | 41.00 | 0.74 | 21.05 | 9.33 | 5.79 | NA | 44.39 | 44.39 | 577.06 | |||||||||||||||
| FBSI |
First Bancshares, Inc. | 15.00 | 2,591 | 38.9 | 15.90 | 11.25 | 15.00 | 0.00 | 15.38 | 15.30 | 1.69 | 1.67 | NA | NA | 163.37 | |||||||||||||||
| FBOO |
First Bank of Ohio | 610.00 | NA | NA | NA | NA | 610.00 | 0.00 | 0.00 | 0.00 | 70.75 | 70.15 | 1342.56 | 1342.56 | NA | |||||||||||||||
| FCPB |
First Capital Bancshar es, Inc. |
7.50 | 5,084 | 38.1 | 8.50 | 5.25 | 7.50 | 0.00 | 37.61 | 15.38 | 0.17 | NA | 6.65 | 6.65 | 65.47 | |||||||||||||||
| FIZN |
First Citizens Bancshares, Inc. | 73.50 | 3,926 | 279.1 | 73.50 | 50.05 | 73.50 | 0.00 | 38.68 | 33.64 | 6.21 | NA | NA | NA | 540.62 | |||||||||||||||
| FCIT |
First Citrus Bancorporation, Inc. | 28.20 | 2,061 | 58.1 | 35.00 | 17.81 | 28.20 | -5.97 | 44.62 | 23.96 | 3.05 | NA | 21.74 | 21.74 | 304.71 | |||||||||||||||
| CMRB |
First Commerce Bank | 5.45 | 22,745 | 124.0 | 5.80 | 3.36 | 5.45 | -3.54 | 60.29 | 25.87 | NA | NA | NA | NA | 48.50 | |||||||||||||||
| FCCT |
First Community Corporation | 8.10 | 1,651 | 13.4 | 8.10 | 4.52 | 8.10 | 0.00 | 55.77 | 44.64 | 0.60 | 0.60 | 9.88 | 9.88 | 111.10 | |||||||||||||||
| FMFP |
First Community Financial Corporation | 18.60 | 2,824 | 52.5 | 23.70 | 16.13 | 18.60 | -11.43 | 0.54 | -14.48 | 1.57 | NA | 19.71 | 19.71 | 224.73 | |||||||||||||||
| FFMH |
First Farmers and Merchants Corporation | 34.10 | 4,348 | 148.3 | 37.00 | 26.00 | 34.10 | -3.94 | 23.91 | 6.56 | 3.55 | 3.14 | 37.15 | 35.08 | 432.15 | |||||||||||||||
| FGFI |
First Greenwich Financial, Inc. | 12.70 | 2,531 | 32.1 | 13.00 | 10.39 | 12.70 | 0.00 | 14.21 | 20.38 | NA | NA | NA | NA | 180.56 | |||||||||||||||
| FIEB |
First IC Corporation | 7.00 | 9,606 | 67.2 | 7.10 | 4.15 | 7.00 | 0.00 | 60.42 | 36.04 | NA | NA | NA | NA | 91.77 | |||||||||||||||
| FKYS |
First Keystone Corporation | 24.36 | 5,915 | 144.1 | 32.50 | 18.01 | 24.36 | -2.56 | 29.57 | 18.31 | 2.37 | 2.32 | 24.94 | 21.70 | 221.55 | |||||||||||||||
| FMIA |
First Miami Bancorp, Inc. | 1169.95 | 87 | 102.1 | 1200.00 | 900.00 | 1169.95 | 0.00 | 26.89 | 19.38 | NA | NA | 1362.58 | 1362.58 | 10237.12 | |||||||||||||||
| FINN |
First National of Nebraska, Inc. | 13500.00 | 268 | 3,623.5 | 13999.00 | 10000.00 | 13500.00 | 0.00 | 39.16 | 15.48 | 1951.49 | NA | 10925.91 | NA | 95187.12 | |||||||||||||||
| FNFI |
First Niles Financial, Inc. | 11.00 | 1,333 | 14.7 | 12.75 | 9.50 | 11.00 | 0.00 | 0.46 | 6.90 | NA | NA | NA | NA | 82.27 | |||||||||||||||
| FOTB |
First Ottawa Bancshares, Inc. | 85.00 | 853 | 72.5 | 85.00 | 50.10 | 85.00 | 6.25 | 46.55 | 39.34 | 7.68 | NA | NA | NA | NA | |||||||||||||||
| FSRL |
First Reliance Bancshares, Inc. | 10.09 | 8,299 | 83.7 | 10.15 | 5.53 | 10.09 | -0.10 | 82.46 | 30.19 | 1.11 | 1.15 | 8.39 | NA | 100.28 | |||||||||||||||
| FRFC |
First Robinson Financial Corporation | 50.50 | 540 | 27.2 | 55.00 | 47.00 | 50.50 | -3.81 | -0.10 | 0.98 | 4.68 | 4.68 | 59.53 | 59.53 | 787.81 | |||||||||||||||
| FSWA |
First Sound Bank | 5.65 | 3,155 | 17.8 | 5.95 | 4.00 | 5.65 | 9.50 | 33.57 | 17.71 | 0.10 | 0.10 | 4.35 | 4.31 | 52.38 | |||||||||||||||
| FSBH |
First Southern Bank | 9.00 | 2,478 | 22.3 | 9.00 | 5.75 | 9.00 | 0.00 | 50.00 | 21.62 | NA | NA | NA | NA | 97.63 | |||||||||||||||
| FLEW |
Fleetwood Bank Corporation | 69.26 | 307 | 21.3 | 85.00 | 63.75 | 69.26 | -7.65 | -3.81 | -18.52 | 5.58 | 5.58 | NA | NA | 1063.52 | |||||||||||||||
| FBIP |
FNB Bancorp, Inc. | 136.00 | 883 | 120.1 | 139.00 | 111.00 | 136.00 | 0.00 | 20.35 | 11.48 | NA | NA | NA | NA | 1401.70 | |||||||||||||||
| FIDS |
FNB, Inc. | 30.00 | 673 | 20.2 | 33.00 | 23.50 | 30.00 | 0.00 | 11.11 | 0.03 | 3.48 | 3.48 | 36.62 | 36.62 | 424.36 | |||||||||||||||
| FGFH |
Foresight Financial Group, Inc. | 31.77 | 3,665 | 116.4 | 32.90 | 21.65 | 31.77 | -0.56 | 25.57 | 6.33 | 3.02 | NA | NA | NA | 387.98 | |||||||||||||||
| FHLB |
Friendly Hills Bancorp | 10.05 | 2,006 | 20.2 | 11.20 | 7.30 | 10.05 | -1.95 | 37.86 | 21.82 | 0.52 | 0.57 | 10.43 | 10.22 | 111.31 | |||||||||||||||
| FXLG |
FS Bancorp | 55.85 | 2,164 | 120.9 | 57.00 | 49.00 | 55.85 | -0.27 | 5.40 | 11.70 | 7.01 | 6.86 | 45.77 | 44.56 | 494.17 | |||||||||||||||
| GLNV |
Glenville Bank Holding Company, Inc. | 90.00 | 200 | 18.0 | NA | NA | 90.00 | 0.00 | 0.00 | 0.00 | NA | NA | NA | NA | 3246.18 | |||||||||||||||
| GSBX |
Golden State Bancorp | 18.00 | 1,845 | 33.2 | 19.20 | 13.50 | 18.00 | 12.50 | 33.33 | 31.15 | -0.10 | -0.10 | 17.14 | 17.14 | 264.45 | |||||||||||||||
| GVYB |
Golden Valley Bancshares, Inc. | 19.00 | 2,241 | 42.6 | 19.50 | 9.80 | 19.00 | 0.26 | 77.57 | 58.33 | NA | NA | 16.46 | 16.46 | 197.64 | |||||||||||||||
| GABK |
Grand Bank Corp. | 7900.00 | 11 | 89.7 | 7900.00 | 4975.10 | 7900.00 | 5.33 | 49.06 | 41.08 | NA | NA | NA | NA | 39511.67 | |||||||||||||||
| GTPS |
Great American Bancorp, Inc. | 33.40 | 409 | 13.7 | 35.25 | 28.30 | 33.40 | 0.00 | 21.45 | 10.41 | 2.44 | 2.44 | 45.54 | 44.35 | 517.17 | |||||||||||||||
| GUAA |
Guaranty Bancorp, Inc. | 40.01 | NA | NA | 40.01 | 40.01 | 40.01 | 45.17 | 45.17 | 45.17 | NA | NA | 50.05 | 50.05 | NA | |||||||||||||||
| HMLN |
Hamlin Bank and Trust Company | 278.00 | 373 | 102.4 | 296.50 | 252.00 | 278.00 | 0.00 | -0.71 | -2.46 | NA | NA | 244.90 | 244.90 | 1227.52 | |||||||||||||||
| HRBK |
Harbor Bankshares Corporation | 1.90 | 6,512 | 1.9 | 3.95 | 0.65 | 1.90 | 0.00 | 52.00 | 2.70 | NA | NA | NA | NA | 49.57 | |||||||||||||||
| HFBK |
Harford Bank | 28.89 | 1,441 | 41.6 | 34.00 | 20.50 | 28.89 | 2.81 | 34.37 | 35.95 | 3.38 | 3.43 | 33.01 | 33.01 | 360.35 | |||||||||||||||
| HCBN |
HCB Financial Corp. | 28.00 | 1,037 | 29.0 | 29.00 | 20.25 | 28.00 | 0.00 | 31.76 | 28.38 | 2.82 | NA | 34.09 | 34.09 | 416.65 | |||||||||||||||
| HRGG |
Heritage NOLA Bancorp, Inc. | 13.95 | 1,242 | 17.1 | 14.50 | 10.40 | 13.95 | 0.00 | 34.13 | 15.77 | 0.77 | 0.77 | 16.73 | 16.73 | 122.74 | |||||||||||||||
| HFBA |
HFB Financial Corporation | 30.50 | 1,181 | 36.0 | 34.00 | 25.50 | 30.50 | 0.00 | 19.61 | 8.93 | NA | NA | NA | NA | 378.11 | |||||||||||||||
| HBSI |
Highlands Bankshares, Inc. | 37.50 | 1,337 | 50.1 | 38.00 | 33.45 | 37.50 | 0.00 | 4.17 | 9.11 | 2.50 | 2.48 | 42.15 | 40.98 | 355.67 | |||||||||||||||
| HBIA |
Hills Bancorporation | 64.80 | 9,302 | 602.7 | 70.00 | 60.30 | 64.80 | 0.00 | 9.27 | 4.88 | 5.21 | 5.44 | 45.71 | 45.44 | 422.09 | |||||||||||||||
| HCKG |
Hocking Valley BancShares, Inc. | 805.00 | 187 | 150.9 | 825.00 | 605.00 | 805.00 | 0.00 | 3.21 | 1.26 | NA | NA | NA | NA | 1692.06 | |||||||||||||||
| HWIS |
Home Bancorp Wisconsin, Inc. | 15.75 | 1,245 | 19.6 | 16.25 | 8.92 | 15.75 | 0.00 | 76.17 | 10.53 | 1.84 | 1.84 | 14.13 | 14.13 | 146.85 | |||||||||||||||
| HWEN |
Home Financial Bancorp | 10.80 | 1,156 | 12.5 | 11.00 | 9.51 | 10.80 | -0.83 | 10.77 | 9.64 | -0.56 | 0.35 | 7.07 | 7.07 | 64.17 | |||||||||||||||
| HLFN |
Home Loan Financial Corporation | 35.00 | 1,400 | 49.0 | 37.46 | 29.05 | 35.00 | 0.00 | 26.13 | 16.63 | 2.74 | 2.74 | 22.94 | 22.94 | 180.49 | |||||||||||||||
| HONT |
Honat Bancorp, Inc. | 124.00 | 1,449 | 179.7 | 150.00 | 112.00 | 124.00 | 0.00 | 7.83 | 3.51 | 8.03 | 7.87 | 80.58 | 80.58 | 605.74 | |||||||||||||||
| HRRB |
Horizon Bancorp, Inc. (Lake Havasu City, AZ) | 8.50 | 4,132 | 35.1 | 9.49 | 4.63 | 8.50 | 2.29 | 47.83 | 30.97 | 1.20 | NA | 8.61 | 8.61 | 128.89 | |||||||||||||||
| HVLM |
Huron Valley Bancorp, Inc. | 18.20 | 868 | 15.8 | 18.25 | 16.25 | 18.20 | 0.00 | 8.33 | 9.24 | 1.75 | NA | 17.94 | 17.94 | 221.46 | |||||||||||||||
| IBWC |
IBW Financial Corporation | 33.00 | 597 | 19.7 | 36.00 | 28.00 | 33.00 | 0.00 | 5.60 | -5.71 | NA | NA | 80.95 | 80.45 | 964.63 | |||||||||||||||
| IFBH |
IFB Holdings, Inc. | 65.00 | 168 | 10.9 | NA | NA | 65.00 | 0.00 | 0.00 | 0.00 | NA | NA | NA | NA | 496.55 | |||||||||||||||
| IOFB |
Iowa First Bancshares Corp. | 35.00 | 1,116 | 39.1 | 35.50 | 24.50 | 35.00 | -1.41 | 34.62 | 29.34 | 1.96 | NA | NA | NA | 470.74 | |||||||||||||||
| JBTC |
JBT Bancorp Inc. | 26.70 | 2,434 | 65.0 | 28.00 | 20.00 | 26.70 | 0.75 | 29.93 | 21.92 | 2.83 | NA | 26.46 | 26.46 | 328.72 | |||||||||||||||
| JFWV |
Jefferson Security Bank | 109.00 | 276 | 30.1 | 109.00 | 75.00 | 109.00 | 0.00 | 36.25 | 28.24 | 12.03 | 11.97 | 112.61 | 112.61 | 1502.34 | |||||||||||||||
| JTNB |
JTNB Bancorp, Inc. | 17.57 | NA | NA | 20.25 | 11.85 | 17.57 | -0.45 | 52.78 | 34.64 | NA | NA | NA | NA | NA | |||||||||||||||
| JUVF |
Juniata Valley Financial Corp. | 16.55 | 5,000 | 82.8 | 19.90 | 15.70 | 16.55 | -1.93 | -4.06 | -6.50 | 1.27 | 1.19 | 14.75 | 12.90 | 167.16 | |||||||||||||||
| KEFI |
Keweenaw Financial Corporation | 77.25 | 1,159 | 89.6 | 84.00 | 67.01 | 77.25 | 4.25 | 18.85 | 3.00 | 9.19 | 9.29 | 77.65 | NA | 843.84 | |||||||||||||||
| KLIB |
Killbuck Bancshares, Inc. | 156.00 | 551 | 86.0 | 200.00 | 137.00 | 156.00 | -0.01 | -15.68 | -13.33 | NA | NA | NA | NA | 1287.15 | |||||||||||||||
| KSBI |
KS Bancorp, Inc. | 40.07 | 1,108 | 44.4 | 44.00 | 23.00 | 40.07 | -2.91 | 74.22 | 51.21 | 4.92 | NA | 30.92 | 30.92 | 481.74 | |||||||||||||||
| LKSB |
Lakeside Bancshares, Inc. | 11.00 | 2,096 | 23.1 | 12.50 | 10.55 | 11.00 | -2.22 | -15.38 | -12.00 | NA | NA | NA | NA | 170.01 | |||||||||||||||
| LWCL |
Lewis & Clark Bancorp | 34.01 | 1,096 | 37.3 | 34.36 | 19.85 | 34.01 | 0.03 | 70.14 | 29.56 | 2.28 | NA | NA | NA | 387.72 | |||||||||||||||
| LIBC |
Liberty Bancorp (South San Francisco, CA) | 28.00 | 887 | 24.8 | 28.00 | 20.00 | 28.00 | 0.00 | 22.54 | 25.56 | 0.90 | 0.90 | 25.39 | 25.39 | 325.17 | |||||||||||||||
| LBSI |
Liberty Bancshares, Inc. (Ada, OH) | 61.00 | 900 | 54.9 | 66.51 | 51.55 | 61.00 | -7.58 | 16.97 | 18.33 | 5.81 | 5.81 | NA | NA | 490.36 | |||||||||||||||
| LNKB |
LINKBANCORP, Inc. | 17.25 | 4,968 | 85.7 | 19.00 | 10.25 | 17.25 | 1.17 | 56.82 | 53.33 | 0.71 | 0.79 | 8.67 | 8.40 | 84.75 | |||||||||||||||
| MFBP |
M&F Bancorp, Inc. | 7.60 | 2,031 | 15.4 | 8.05 | 3.01 | 7.60 | 1.33 | 123.53 | 94.87 | 1.06 | NA | 12.10 | 12.10 | 176.38 | |||||||||||||||
| MCBK |
Madison County Financial, Inc. | 33.55 | 2,512 | 84.3 | 42.98 | 27.61 | 33.55 | 1.73 | 15.69 | 15.09 | 2.77 | NA | 31.34 | NA | 195.56 | |||||||||||||||
| MSWV |
Main Street Financial Services Corp. | 15.50 | 3,413 | 52.9 | 18.50 | 14.75 | 15.50 | -3.13 | -6.06 | -8.82 | NA | NA | NA | NA | 162.44 | |||||||||||||||
| MLGF |
Malaga Financial Corporation | 24.99 | 7,718 | 192.9 | 26.00 | 19.52 | 24.99 | 3.01 | 19.16 | 6.34 | 2.49 | 2.49 | NA | NA | 180.49 | |||||||||||||||
| MBOF |
Marine Bancorp of Florida, Inc. | 26.88 | 1,366 | 36.7 | 26.88 | 17.50 | 26.88 | 0.00 | 45.38 | 53.60 | 3.92 | NA | NA | NA | 357.36 | |||||||||||||||
| MCHT |
Mauch Chunk Trust Financial Corp. | 12.40 | 3,347 | 41.5 | 13.75 | 11.10 | 12.40 | 0.00 | -8.49 | 3.68 | 1.09 | 0.67 | 12.87 | 12.87 | 160.89 |
| MBKL |
MBT Bancshares, Inc. | 24.30 | 2,044 | 49.7 | 26.00 | 20.85 | 24.30 | 0.00 | 15.99 | 14.89 | 1.99 | 1.98 | 21.41 | 21.41 | 258.58 | |||||||||||||||
| MCHN |
Mchenry Bancorp, Inc. | 0.09 | 232,929 | 19.8 | 0.09 | 0.07 | 0.09 | 0.00 | 0.00 | 19.72 | NA | NA | NA | NA | 1.18 | |||||||||||||||
| MKIN |
MCNB Banks, Inc. | 21.05 | 1,106 | 22.7 | 30.00 | 18.80 | 21.05 | 0.00 | 10.79 | 10.79 | NA | NA | 34.70 | 34.70 | 300.57 | |||||||||||||||
| MCHB |
Mechanics Bank | 30000.00 | 64 | 1,926.5 | 31000.00 | 18325.00 | 30000.00 | -3.23 | 51.90 | 41.18 | 1836.14 | 2144.94 | 38337.68 | 23507.24 | 295005.57 | |||||||||||||||
| MFGI |
Merchants Financial Group, Inc. | 73.00 | 2,636 | 192.4 | 74.99 | 53.55 | 73.00 | 0.90 | 34.56 | 13.62 | 11.45 | NA | 82.94 | 69.16 | 1026.42 | |||||||||||||||
| MDVT |
Middlebury National Corporation | 43.50 | 863 | 37.5 | 46.20 | 34.00 | 43.50 | -1.14 | 15.23 | 11.25 | 5.49 | NA | 49.65 | 49.65 | 604.81 | |||||||||||||||
| MCPH |
Midland Capital Holdings Corp. | 12.00 | 373 | 4.5 | 13.45 | 11.01 | 12.00 | -4.38 | -1.64 | -0.08 | -2.14 | -2.14 | 27.28 | 27.28 | 341.72 | |||||||||||||||
| MIFF |
Mifflinburg Bancorp, Inc. | 30.05 | 1,872 | 56.3 | 38.00 | 28.00 | 30.05 | -6.82 | 3.62 | -14.14 | 3.05 | NA | 29.00 | 29.00 | 289.09 | |||||||||||||||
| MSBC |
Mission Bancorp | 82.65 | 2,156 | 178.2 | 89.25 | 53.10 | 82.65 | 1.59 | 27.15 | 29.91 | NA | NA | 51.39 | 51.33 | 667.05 | |||||||||||||||
| MPCB |
Mountain Pacific Bancorp, Inc. | 7.25 | 6,580 | 47.7 | 13.00 | 6.25 | 7.25 | -6.45 | 16.00 | 16.00 | NA | NA | 6.42 | 6.42 | 81.21 | |||||||||||||||
| MPHX |
MPB BHC, INC. | 17.50 | 3,483 | NA | 19.00 | 9.75 | 17.50 | 0.00 | 70.73 | 52.31 | 1.64 | 1.64 | 11.33 | NA | 113.53 | |||||||||||||||
| NACB |
National Capital Bancorp Inc. | 200.00 | 286 | 57.3 | 200.00 | 140.00 | 200.00 | 8.11 | 21.40 | 22.70 | 14.58 | NA | 189.40 | 189.40 | 2278.63 | |||||||||||||||
| NCXS |
NBC Bancorp, Inc. | 51.00 | 473 | 24.1 | 51.00 | 36.51 | 51.00 | 0.00 | 52.24 | 21.43 | NA | NA | NA | NA | 806.11 | |||||||||||||||
| NEFB |
Neffs Bancorp, Inc. | 586.00 | 160 | 93.6 | 715.00 | 415.00 | 586.00 | 0.00 | 41.89 | 31.69 | NA | NA | NA | NA | 2761.53 | |||||||||||||||
| NWPP |
New Peoples Bankshares, Inc. | 2.15 | 23,922 | 51.4 | 2.33 | 1.55 | 2.15 | -0.92 | 29.52 | 7.50 | 0.26 | 0.26 | 2.55 | 2.55 | 33.34 | |||||||||||||||
| NTBP |
New Tripoli Bancorp, Inc. | 1535.00 | 63 | 97.2 | 1535.00 | 1417.00 | 1535.00 | 0.99 | 8.48 | 8.10 | NA | NA | NA | NA | 8634.41 | |||||||||||||||
| NMBF |
Nmb Financial Corp | 6.00 | NA | NA | 8.00 | 4.45 | 6.00 | -25.00 | 31.87 | 31.87 | NA | NA | NA | NA | NA | |||||||||||||||
| NODB |
North Dallas Bank & Trust Co. | 77.50 | 2,569 | 199.1 | 83.50 | 57.51 | 77.50 | -0.01 | 34.76 | -0.64 | 3.12 | NA | NA | NA | 583.88 | |||||||||||||||
| NRLB |
Northern California Bancorp, Inc. | 3.50 | 3,564 | 12.5 | 3.55 | 1.58 | 3.50 | 11.11 | 82.29 | 121.52 | NA | NA | 4.29 | NA | 57.79 | |||||||||||||||
| NCNB |
Northern California National Bank | 32.10 | NA | NA | 33.98 | 17.30 | 32.10 | 0.00 | 83.43 | 60.50 | NA | NA | NA | NA | NA | |||||||||||||||
| NUBC |
Northumberland Bancorp | 38.50 | 1,328 | 51.1 | 48.00 | 26.90 | 38.50 | 0.52 | 35.09 | 28.98 | 3.53 | 3.37 | 46.11 | 46.11 | 475.19 | |||||||||||||||
| BKOR |
Oak Ridge Financial Services, Inc. | 17.67 | 2,673 | 47.2 | 17.75 | 11.05 | 17.67 | 0.00 | 55.68 | 32.86 | 2.13 | 2.15 | 17.93 | 17.93 | 213.03 | |||||||||||||||
| OAKV |
Oak View National Bank | 8.55 | 2,956 | 25.3 | 9.45 | 5.50 | 8.55 | 0.00 | 48.95 | 16.33 | 0.73 | 0.87 | 9.29 | 9.29 | 106.13 | |||||||||||||||
| OCNB |
Oconomowoc Bancshares, Inc. | 440.00 | 335 | 147.4 | 520.00 | 240.00 | 440.00 | 0.00 | 83.33 | 83.33 | NA | NA | NA | NA | 4321.01 | |||||||||||||||
| ORBN |
Oregon Bancorp, Inc. | 42.00 | 2,414 | 98.3 | 57.00 | 30.06 | 42.00 | -1.18 | 29.27 | -13.85 | NA | NA | 28.22 | 28.22 | 156.00 | |||||||||||||||
| ORPB |
Oregon Pacific Bancorp | 6.99 | 7,042 | 49.2 | 7.35 | 3.90 | 6.99 | -0.14 | 76.96 | 34.42 | 0.96 | 0.96 | 6.57 | 6.57 | 94.24 | |||||||||||||||
| OXBC |
Oxford Bank Corporation | 30.25 | 2,275 | 68.8 | 32.00 | 18.85 | 30.25 | -0.33 | 59.21 | 17.48 | 4.46 | NA | NA | NA | 318.12 | |||||||||||||||
| PFBN |
Pacific Alliance Bank | 9.00 | 3,138 | 28.2 | 9.00 | 6.10 | 9.00 | 0.00 | 25.87 | 40.19 | 0.97 | 0.78 | 13.53 | 13.53 | 111.02 | |||||||||||||||
| PEBN |
Pacific Enterprise Bancorp | 22.49 | 2,996 | 67.4 | 22.50 | 10.50 | 22.49 | 1.31 | 87.42 | 45.10 | 1.74 | 1.74 | 20.37 | NA | 215.95 | |||||||||||||||
| PVBK |
Pacific Valley Bank | 10.60 | 3,994 | 42.3 | 12.50 | 6.20 | 10.60 | 0.00 | 67.72 | 35.03 | 1.05 | 1.05 | 10.38 | 10.38 | 119.49 | |||||||||||||||
| PWBO |
Pacific West Bank | 15.75 | 2,658 | 41.9 | 18.00 | 9.56 | 15.75 | 0.00 | 51.88 | 44.23 | 0.25 | 0.25 | 12.92 | NA | 106.84 | |||||||||||||||
| PGNN |
Paragon Financial Solutions, Inc. | 10.25 | 4,347 | 44.6 | 11.00 | 7.87 | 10.25 | -2.38 | 26.23 | 17.14 | 0.74 | 0.73 | 11.40 | 11.32 | 110.23 | |||||||||||||||
| PBKX |
Partners Bank of California | 10.10 | 4,302 | 43.5 | 16.00 | 8.76 | 10.10 | 0.00 | 9.07 | 1.00 | NA | NA | NA | NA | 100.15 | |||||||||||||||
| IDFB |
Peak Bancorp Inc. | 8.31 | 2,118 | 17.6 | 8.85 | 5.66 | 8.31 | -1.07 | 43.28 | 31.90 | NA | NA | 7.48 | 7.48 | 322.83 | |||||||||||||||
| PEBA |
Penn Bancshares, Inc. | 24.25 | NA | NA | 44.50 | 24.00 | 24.25 | 0.00 | 15.48 | 0.00 | NA | NA | NA | NA | NA | |||||||||||||||
| PPBB |
Peoples Bancorp | 232.00 | NA | NA | 242.00 | 140.00 | 232.00 | -4.13 | 28.90 | 46.10 | NA | NA | NA | NA | NA | |||||||||||||||
| PEBC |
Peoples Bancorp, Inc. | 31.35 | 729 | 22.9 | 35.00 | 24.60 | 31.35 | 0.10 | 20.58 | 21.51 | 2.42 | 2.66 | 41.32 | 36.44 | 426.31 | |||||||||||||||
| PBCO |
People’s Bank of Commerce | 16.50 | 4,803 | 77.5 | 17.00 | 10.25 | 16.50 | -2.08 | 51.38 | 31.47 | 2.37 | NA | 15.63 | NA | 167.81 | |||||||||||||||
| PPLL |
Peoples Ltd. | 71.00 | 701 | 49.7 | 73.75 | 57.62 | 71.00 | 0.35 | 11.27 | 14.52 | 9.07 | NA | NA | NA | 660.20 | |||||||||||||||
| PPAL |
Peoples Trust Company of St. Albans | 69.00 | 573 | 39.5 | 104.95 | 57.50 | 69.00 | 2.40 | 20.00 | -1.43 | NA | NA | NA | NA | 644.64 | |||||||||||||||
| PPSF |
Peoples-Sidney Financial Corporation | 9.60 | 1,175 | 11.3 | 10.00 | 8.30 | 9.60 | 0.00 | 11.63 | 6.67 | NA | NA | NA | NA | 108.45 | |||||||||||||||
| PCLB |
Pinnacle Bancshares, Inc. | 33.85 | 971 | 32.9 | 34.10 | 27.33 | 33.85 | 0.00 | 19.19 | 15.33 | 3.58 | 3.58 | 35.28 | 34.97 | 331.45 | |||||||||||||||
| PBKC |
Pioneer Bankcorp, Inc. | 36.25 | 1,145 | 41.5 | 38.00 | 32.00 | 36.25 | 0.00 | 13.28 | 10.86 | 4.29 | NA | 38.08 | 38.08 | 500.58 | |||||||||||||||
| PNBI |
Pioneer Bankshares, Inc. | 28.55 | 990 | 28.3 | 31.99 | 22.00 | 28.55 | 1.96 | 18.96 | 24.13 | 3.38 | NA | 31.93 | 31.57 | 288.39 | |||||||||||||||
| PONT |
Pontiac Bancorp, Inc. | 467.50 | NA | NA | 467.50 | 450.00 | 467.50 | 0.00 | 8.72 | 3.89 | NA | NA | NA | NA | NA | |||||||||||||||
| PTBS |
Potomac Bancshares, Inc. | 16.60 | 4,134 | 68.6 | 17.00 | 9.66 | 16.60 | -2.35 | 68.02 | 34.85 | 1.40 | NA | 13.76 | 13.76 | 162.56 | |||||||||||||||
| PRMY |
Primary Bank | 19.00 | 4,392 | 83.4 | 20.20 | 14.75 | 19.00 | 0.00 | -2.81 | 15.15 | NA | NA | NA | NA | 144.63 | |||||||||||||||
| QNBC |
QNB Corp. | 36.70 | 3,556 | 130.5 | 39.17 | 26.00 | 36.70 | -0.14 | 28.77 | 14.51 | 4.75 | 3.71 | 38.58 | 38.58 | 443.07 | |||||||||||||||
| QRRY |
Quarry City Savings & Loan Association | 15.03 | 408 | 6.1 | 15.50 | 11.58 | 15.03 | -3.03 | 28.24 | 15.62 | 0.61 | 0.61 | 23.42 | 23.42 | 177.64 | |||||||||||||||
| RBAZ |
RBAZ Bancorp, Inc. | 9.15 | 1,806 | 16.5 | 9.89 | 6.55 | 9.15 | 6.40 | 30.71 | 27.97 | 0.91 | 0.91 | 13.07 | 13.07 | 127.88 | |||||||||||||||
| RWCB |
Redwood Capital Bancorp | 20.06 | 1,958 | 39.3 | 23.67 | 11.81 | 20.06 | -0.74 | 69.71 | 33.73 | 2.73 | 2.73 | 18.82 | 18.82 | 279.08 | |||||||||||||||
| REDW |
Redwood Financial, Inc. | 120.50 | 403 | 48.6 | 143.00 | 115.30 | 120.50 | 0.00 | -19.67 | 0.00 | NA | NA | NA | NA | 1166.34 | |||||||||||||||
| RCBC |
River City Bank | 260.01 | 1,475 | 383.5 | 275.00 | 150.00 | 260.01 | 0.00 | 72.18 | 59.52 | 28.01 | 26.19 | NA | NA | 2277.46 | |||||||||||||||
| RVRF |
River Financial Corporation | 29.00 | 6,543 | 189.7 | 44.99 | 17.55 | 29.00 | 0.00 | 64.77 | 38.10 | 3.43 | 3.52 | 26.32 | 21.53 | 340.25 | |||||||||||||||
| RVCB |
River Valley Community Bancorp | 24.25 | 2,423 | 58.8 | 27.00 | 17.50 | 24.25 | 0.00 | 35.55 | 13.05 | 2.15 | NA | 20.03 | 20.03 | 207.71 | |||||||||||||||
| SBBI |
S.B.C.P. Bancorp, Inc. | 95.00 | 1,082 | 102.8 | 105.00 | 64.25 | 95.00 | 0.00 | 50.79 | 47.86 | 13.14 | NA | 113.31 | 95.97 | 1490.49 | |||||||||||||||
| SVVB |
Savi Financial Corporation, Inc. | 10.62 | 3,439 | 36.5 | 13.00 | 7.11 | 10.62 | 0.00 | 41.60 | 32.75 | 0.67 | NA | 10.63 | NA | 136.40 | |||||||||||||||
| SCYT |
Security Bancorp, Inc. | 66.25 | 371 | 24.6 | 105.00 | 51.50 | 66.25 | 0.38 | 27.40 | 27.40 | 6.65 | NA | NA | NA | 765.99 | |||||||||||||||
| SFDL |
Security Federal Corporation | 31.69 | 3,253 | 103.1 | 37.00 | 21.62 | 31.69 | -0.97 | 37.48 | 23.07 | 3.10 | 2.98 | 35.43 | 35.06 | 368.95 | |||||||||||||||
| SNLC |
Security National Corporation | 125.36 | NA | NA | 175.00 | 105.05 | 125.36 | -2.82 | 20.54 | 4.68 | 7.97 | 7.98 | 88.34 | 87.04 | NA | |||||||||||||||
| SFSA |
Sidney Federal Savings and Loan Association | 6.01 | 132 | 0.8 | 10.00 | 6.01 | 6.01 | 0.00 | -33.22 | -33.22 | NA | NA | 8.90 | 8.90 | 148.48 | |||||||||||||||
| SGBG |
Signature Bank of Georgia | 1.34 | 28,073 | 37.6 | 4.00 | 0.86 | 1.34 | 7.20 | 41.05 | 41.05 | NA | NA | NA | NA | 6.92 | |||||||||||||||
| SLRK |
Solera National Bancorp, Inc. | 11.60 | 4,300 | 49.9 | 13.95 | 9.26 | 11.60 | -2.77 | 22.75 | 5.45 | NA | NA | 12.60 | 12.60 | 123.72 | |||||||||||||||
| SOBS |
Solvay Bank Corp. | 40.13 | 2,300 | 92.3 | 42.20 | 30.28 | 40.13 | -4.45 | 9.95 | 14.66 | NA | NA | NA | NA | 480.67 | |||||||||||||||
| SOME |
Somerset Trust Holding Company | 41.64 | 2,503 | 104.2 | 65.00 | 32.56 | 41.64 | -0.86 | 15.70 | 3.45 | 5.37 | 5.27 | NA | NA | 710.22 | |||||||||||||||
| SEBC |
Southeastern Banking Corporation | 21.80 | 3,151 | 68.7 | 22.00 | 16.56 | 21.80 | 0.00 | 28.61 | 21.11 | 2.28 | 2.27 | 21.47 | 21.47 | 187.95 | |||||||||||||||
| SBNC |
Southern BancShares (N.C.), Inc. | 5100.00 | 80 | 408.4 | 5250.00 | 3349.75 | 5100.00 | -0.97 | 59.42 | 30.78 | 1571.17 | 482.50 | 5340.24 | 5006.22 | 51187.45 | |||||||||||||||
| BCAL |
Southern California Bancorp | 14.25 | 13,509 | 192.5 | 15.25 | 8.35 | 14.25 | 0.00 | 59.22 | 11.76 | 0.29 | 0.86 | 12.85 | 11.26 | 131.62 | |||||||||||||||
| SCBS |
Southern Community Bancshares, Inc. | 13.51 | 485 | 6.6 | 20.00 | 9.08 | 13.51 | 0.00 | 50.11 | 32.45 | NA | NA | NA | NA | 258.14 | |||||||||||||||
| SOMC |
Southern Michigan Bancorp, Inc. | 19.95 | 4,503 | 89.8 | 21.50 | 9.50 | 19.95 | 2.31 | 38.78 | 17.35 | 2.22 | 2.22 | 20.90 | 17.91 | 249.57 | |||||||||||||||
| SOUB |
SouthPoint Bancshares, Inc. | 32.25 | 2,020 | 65.2 | 33.99 | 17.25 | 32.25 | -5.12 | 86.96 | 51.05 | NA | NA | NA | NA | 325.10 | |||||||||||||||
| SFIG.A |
STAR Financial Group, Inc. | 73.00 | 3,437 | 250.9 | 73.10 | 60.75 | 73.00 | 0.00 | 17.67 | 17.74 | NA | NA | NA | NA | 805.22 | |||||||||||||||
| STBK |
Studio Bank | 10.85 | 46,000 | 499.1 | 11.58 | 9.60 | 10.85 | -0.82 | -1.36 | 8.50 | NA | NA | NA | NA | 9.12 | |||||||||||||||
| SMAL |
Summit Bancshares, Inc. | 38.00 | 1,194 | 45.4 | 38.00 | 23.85 | 38.00 | 0.00 | 55.10 | 33.33 | 2.29 | 2.29 | 31.28 | 31.28 | 279.28 | |||||||||||||||
| SBKO |
Summit Bank Group, Inc. | 15.25 | 7,604 | 116.0 | 15.68 | 8.05 | 15.25 | -1.29 | 76.50 | 61.55 | 1.39 | 1.39 | 9.01 | 9.01 | 106.69 | |||||||||||||||
| SRYB |
Surrey Bancorp | 15.00 | 4,171 | 61.3 | 15.50 | 11.00 | 15.00 | 0.00 | 36.12 | 29.09 | 1.35 | 1.19 | 12.20 | NA | 110.73 | |||||||||||||||
| SQCF |
Susquehanna Community Financial, Inc. | 19.00 | 2,866 | 54.5 | 19.95 | 16.70 | 19.00 | -3.31 | 11.44 | 8.57 | 1.91 | 1.91 | NA | NA | 180.19 | |||||||||||||||
| TVLF |
Tennessee Valley Financial Holdings, Inc. | 7.25 | 1,842 | 13.4 | 7.95 | 4.36 | 7.25 | -2.68 | 45.00 | 50.73 | NA | NA | NA | NA | 144.58 | |||||||||||||||
| ADKT |
The Adirondack Trust Company | 1850.00 | 77 | 142.2 | 2000.25 | 1700.00 | 1850.00 | -7.50 | 12.80 | 1.37 | NA | NA | NA | NA | 20080.13 | |||||||||||||||
| BAOB |
The Baraboo Bancorporation, Inc. | 4.10 | 3,330 | 13.7 | 4.14 | 2.51 | 4.10 | 2.50 | 54.72 | 36.67 | NA | NA | NA | NA | 149.68 | |||||||||||||||
| FAHE |
The Fahey Banking Company | 1815.00 | NA | NA | NA | NA | 1815.00 | 0.00 | 0.00 | 0.00 | NA | NA | NA | NA | NA | |||||||||||||||
| FSDK |
The First Citizens National Bank of Upper Sandusky | 98.95 | 321 | 31.7 | 98.95 | 66.00 | 98.95 | 0.00 | 49.92 | 28.51 | 3.59 | 3.54 | 129.20 | 128.57 | 1079.16 | |||||||||||||||
| FIGR |
The First National Bank of Groton | 499.99 | 60 | 30.0 | 500.00 | 375.00 | 499.99 | 0.00 | 0.00 | 11.11 | 35.40 | 35.40 | 487.57 | 487.57 | 3460.07 | |||||||||||||||
| SRNN |
The Southern Banc Company, Inc. | 8.31 | 761 | 6.3 | 10.18 | 6.35 | 8.31 | 0.12 | 39.66 | 17.87 | 0.63 | 0.63 | 15.45 | 15.45 | 147.77 | |||||||||||||||
| TDCB |
Third Century Bancorp | 16.27 | 1,184 | 19.3 | 16.27 | 10.11 | 16.27 | 1.75 | 51.35 | 8.47 | 1.49 | NA | 17.83 | 17.83 | 194.67 | |||||||||||||||
| THVB |
Thomasville Bancshares, Inc. | 67.25 | 6,033 | 405.7 | 74.00 | 46.00 | 67.25 | -1.10 | 44.62 | 31.86 | NA | NA | NA | NA | 208.01 | |||||||||||||||
| TMAK |
Touchmark Bancshares, Inc. | 9.20 | 4,476 | 41.2 | 11.49 | 5.80 | 9.20 | 0.00 | 55.93 | 26.03 | 1.57 | NA | 13.52 | NA | 92.33 | |||||||||||||||
| TSBA |
Touchstone Bankshares Inc. | 11.75 | 3,337 | 39.2 | 12.70 | 8.50 | 11.75 | -2.00 | 34.13 | 25.00 | 1.03 | 1.08 | 15.37 | 15.08 | 168.99 |
| TWCF |
Town and Country Financial Corporation | 26.00 | 2,844 | 74.0 | 26.99 | 18.00 | 26.00 | 0.00 | 31.65 | 26.83 | 3.74 | NA | 28.47 | NA | 308.20 | |||||||||||||||
| TRBK |
Traditions Bancorp, Inc. | 21.33 | 3,137 | 66.9 | 24.74 | 13.20 | 21.33 | -2.16 | 43.64 | 20.17 | 2.96 | 3.32 | 21.70 | 21.70 | 224.98 | |||||||||||||||
| TRCY |
Tri City Bankshares Corporation | 22.40 | 8,905 | 199.5 | 24.75 | 14.80 | 22.40 | 0.67 | 45.17 | 28.00 | 1.63 | NA | 21.38 | 21.38 | 218.81 | |||||||||||||||
| TBBC |
Triad Business Bank | 10.52 | 6,603 | 69.5 | 15.00 | 9.20 | 10.52 | 1.64 | 0.19 | 5.73 | -0.52 | -0.55 | 8.66 | 8.66 | 40.36 | |||||||||||||||
| TYBT |
Trinity Bank, N.A. | 73.50 | 1,087 | 79.9 | 75.00 | 61.31 | 73.50 | 0.00 | 5.00 | 14.84 | 4.62 | 4.62 | 39.47 | 39.47 | 358.54 | |||||||||||||||
| TRUX |
Truxton Corporation | 61.50 | 2,879 | 177.1 | 61.50 | 43.50 | 61.50 | 0.02 | 30.16 | 36.82 | 4.39 | 4.39 | 27.35 | 27.35 | 285.05 | |||||||||||||||
| UNPA |
UNB Corp. | 132.50 | 57 | 7.6 | 175.00 | 112.05 | 132.50 | 0.00 | 12.18 | 6.00 | 8.61 | 6.15 | 252.30 | 252.30 | 2839.10 | |||||||||||||||
| UFCP |
Union Financial Corporation | 5.05 | 2,719 | 13.7 | 5.10 | 3.25 | 5.05 | 0.00 | -49.50 | 18.82 | 0.62 | NA | 6.62 | 6.32 | 113.23 | |||||||||||||||
| UNBK |
United National Bank | 30.01 | 805 | 24.2 | 32.00 | 22.50 | 30.01 | 0.00 | 20.04 | 0.03 | NA | NA | NA | NA | 331.80 | |||||||||||||||
| USMT |
US Metro Bancorp, Inc. | 4.20 | 16,230 | 68.2 | 4.20 | 2.00 | 4.20 | 2.44 | 108.96 | 45.33 | NA | NA | 4.26 | NA | 53.69 | |||||||||||||||
| VERF |
Versailles Financial Corporation | 28.00 | 335 | 9.4 | 28.00 | 21.00 | 28.00 | 0.00 | 29.93 | 16.67 | 0.48 | 0.48 | 34.31 | 34.31 | 192.19 | |||||||||||||||
| WTBF.B |
W.T.B. Financial Corporation | 390.00 | 2,556 | 996.8 | 410.00 | 273.60 | 390.00 | -0.51 | 41.82 | 16.77 | 32.43 | NA | 315.29 | 315.29 | 4022.49 | |||||||||||||||
| WBZB |
Washington Business Bank | 18.30 | 701 | 12.8 | 18.30 | 14.25 | 18.30 | 0.00 | 28.42 | 19.61 | NA | NA | NA | NA | NA | |||||||||||||||
| WCFB |
WCF Bancorp, Inc. | 8.15 | 1,951 | 15.9 | 9.50 | 6.35 | 8.15 | 1.88 | 22.37 | 18.98 | NA | NA | 12.10 | NA | 72.11 | |||||||||||||||
| WSSH |
West Shore Bank Corp. | 28.25 | 1,314 | 37.1 | 33.65 | 20.75 | 28.25 | 0.00 | 17.71 | -5.68 | NA | NA | NA | NA | 450.43 | |||||||||||||||
| WDFN |
Woodlands Financial Services Company | 30.40 | 1,391 | 42.3 | 34.90 |
24.50 | 30.40 | 0.93 | 21.65 | 10.95 | 3.47 | 3.45 | 33.72 | 33.72 | 387.75 | |||||||||||||||
| WOBK |
Woodsboro Bank | 44.50 | NA | NA | 48.00 | 41.26 | 44.50 | -1.11 | -19.09 | 7.85 | NA | NA | NA | NA | NA | |||||||||||||||
| BCTF |
Bancorp 34, Inc. | 12.41 | 2,797 | 32.5 | 12.75 | 9.45 | 12.41 | 0.00 | 21.11 | 7.08 | 1.15 | NA | NA | NA | 174.83 | |||||||||||||||
| BERK |
Berkshire Bancorp Inc. | 11.00 | 14,416 | 158.6 | 11.72 | 8.13 | 11.00 | 1.48 | 28.35 | 10.00 | 0.08 | 0.08 | 11.51 | 11.51 | 49.65 | |||||||||||||||
| CIBH |
CIB Marine Bancshares, Inc. | 29.25 | 1,345 | 39.4 | 29.90 | 14.65 | 29.25 | -2.17 | 89.30 | 85.13 | 4.22 | 4.24 | 54.28 | NA | 560.20 | |||||||||||||||
| CMUV |
CMUV Bancorp | 12.00 | 2,296 | 27.5 | 12.00 | 7.52 | 12.00 | 0.00 | 47.24 | 28.89 | 1.62 | 1.68 | NA | NA | 120.23 | |||||||||||||||
| CHBH |
Croghan Bancshares, Inc. | 64.00 | 2,216 | 141.8 | 69.00 | 43.50 | 64.00 | 1.99 | 41.72 | 23.08 | 6.79 | NA | 62.27 | NA | 492.85 | |||||||||||||||
| EFBI |
Eagle Financial Bancorp, Inc. | 18.55 | 1,416 | 26.3 | 18.60 | 16.01 | 18.55 | -0.27 | 14.86 | 12.70 | 1.39 | 1.39 | NA | NA | 118.22 | |||||||||||||||
| FMBL |
Farmers & Merchants Bank of Long Beach | 8249.99 | 126 | 1,038.7 | 8283.75 | 5995.00 | 8249.99 | 1.18 | 34.15 | 24.53 | 757.13 | 757.13 | 9448.57 | 9448.57 | 84859.47 | |||||||||||||||
| FBTT |
First Bankers Trustshares, Inc. | 31.25 | 3,094 | 96.7 | 32.25 | 24.00 | 31.25 | -0.32 | 20.89 | 12.61 | 2.35 | 2.34 | 34.53 | 33.53 | 382.23 | |||||||||||||||
| FNRN |
First Northern Community Bancorp | 10.85 | 13,601 | 147.6 | 11.75 | 7.38 | 10.85 | -1.90 | 44.39 | 12.80 | 0.98 | 0.97 | 11.21 | 11.21 | 134.89 | |||||||||||||||
| INFT |
Infinity Bank (Santa Ana, CA) | 8.86 | 3,319 | 29.4 | 9.50 | 7.90 | 8.86 | -0.45 | -3.70 | -3.70 | 0.19 | 0.19 | 7.98 | 7.98 | 61.55 | |||||||||||||||
| JFBC |
Jeffersonville Bancorp | 20.50 | 4,235 | 86.8 | 22.00 | 14.15 | 20.50 | 1.99 | 36.76 | 20.24 | 1.30 | NA | 18.12 | 18.12 | 160.65 | |||||||||||||||
| JMSB |
John Marshall Bancorp, Inc. | 18.40 | 12,629 | 232.4 | 18.80 | 10.55 | 18.40 | 2.22 | 68.04 | 28.67 | 1.50 | 1.49 | 14.32 | 14.32 | 163.59 | |||||||||||||||
| LFGP |
Ledyard Financial Group, Inc. | 25.50 | 3,355 | 85.6 | 27.25 | 16.01 | 25.50 | -4.67 | 49.56 | 34.28 | 2.26 | 2.01 | 21.09 | 21.09 | 212.93 | |||||||||||||||
| LOGN |
Logansport Financial Corp. | 47.25 | 607 | 28.7 | 51.99 | 32.88 | 47.25 | -5.50 | 33.10 | 0.53 | 6.57 | 5.58 | 45.82 | 45.82 | 400.67 | |||||||||||||||
| MNBO |
MNB Holdings Corporation | 34.10 | 458 | 15.6 | 47.00 | 34.10 | 34.10 | -1.45 | -28.96 | -20.70 | NA | NA | NA | NA | 485.95 | |||||||||||||||
| MYBF |
Muncy Bank Financial, Inc. | 39.15 | 1,608 | 63.0 | 40.95 | 33.33 | 39.15 | -0.13 | 8.89 | 11.10 | 4.73 | 4.33 | 35.71 | 35.71 | 349.86 | |||||||||||||||
| NIDB |
Northeast Indiana Bancorp, Inc. | 43.25 | 1,203 | 52.0 | 48.00 | 31.25 | 43.25 | -2.81 | 34.11 | 8.13 | 5.78 | NA | 39.78 | 39.67 | 340.77 | |||||||||||||||
| NWYF |
Northway Financial, Inc. | 32.00 | 2,752 | 88.1 | 32.97 | 21.70 | 32.00 | 0.31 | 40.66 | 14.29 | 3.08 | 1.58 | 35.89 | 32.28 | 439.36 | |||||||||||||||
| PBNK |
Pinnacle Bank | 13.40 | 5,349 | 71.7 | 13.94 | 6.95 | 13.40 | 0.00 | 82.31 | 55.45 | 1.17 | NA | 11.60 | NA | 130.10 | |||||||||||||||
| QNTO |
Quaint Oak Bancorp, Inc. | 18.00 | 2,004 | 35.6 | 18.50 | 10.81 | 18.00 | 0.00 | 64.84 | 22.03 | 2.25 | 2.19 | 15.51 | 13.84 | 262.93 | |||||||||||||||
| SUGR |
Sugar Creek Financial Corp. | 13.10 | 788 | 10.3 | 13.95 | 6.60 | 13.10 | 14.81 | 64.78 | 38.62 | NA | NA | NA | NA | 118.76 | |||||||||||||||
| FBPA |
The Farmers Bank of Appomattox | 30.00 | 1,084 | 32.5 | 50.00 | 24.50 | 30.00 | -24.72 | 11.32 | 20.00 | 2.50 | 2.45 | 32.43 | 32.43 | 263.14 | |||||||||||||||
| UNTN |
United Tennessee Bankshares, Inc. | 24.25 | 747 | 18.1 | 25.00 | 17.65 | 24.25 | 0.00 | 38.57 | 24.17 | 1.66 | NA | 31.29 | 31.29 | 336.90 | |||||||||||||||
| UNIB |
University Bancorp, Inc. | 15.40 | 4,770 | 73.5 | 16.45 | 8.45 | 15.40 | -1.97 | 77.01 | 22.61 | NA | NA | NA | NA | 138.07 | |||||||||||||||
| FISB |
1st Capital Bancorp | 13.74 | 5,582 | 76.7 | 14.35 | 8.56 | 13.74 | 1.78 | 51.82 | 16.44 | 1.06 | 1.06 | 13.85 | 13.85 | 170.32 | |||||||||||||||
| ALPI.B |
Alpine Banks of Colorado | 38.05 | 15,437 | 286.5 | 44.00 | 23.67 | 38.05 | -7.76 | 50.79 | 37.12 | 7.56 | 7.54 | 52.57 | 50.25 | 375.21 | |||||||||||||||
| AMBZ |
American Business Bank | 36.85 | 8,800 | 324.3 | 42.50 | 20.55 | 36.85 | -1.52 | 72.49 | 27.35 | 3.91 | 4.09 | 29.84 | 29.83 | 424.13 | |||||||||||||||
| ARBV |
American Riviera Bank | 19.25 | 5,134 | 96.1 | 20.00 | 11.20 | 19.25 | -3.75 | 55.24 | 16.67 | 2.12 | 2.13 | 17.69 | 16.69 | 224.04 | |||||||||||||||
| BOID |
Bank of Idaho Holding Company | 26.75 | 2,577 | 68.9 | 28.75 | 17.82 | 26.75 | -4.46 | 50.28 | 37.82 | 2.29 | 2.33 | 23.30 | 23.30 | 256.50 | |||||||||||||||
| BSFO |
Bank of San Francisco | 26.40 | 2,056 | 54.3 | 27.00 | 19.35 | 26.40 | 0.19 | 34.35 | 20.05 | 3.62 | 3.62 | 24.58 | NA | 319.23 | |||||||||||||||
| BFCC |
BankFirst Capital Corporation | 29.50 | 5,279 | 155.7 | 29.50 | 17.82 | 29.50 | 0.00 | 43.90 | 49.37 | 3.02 | NA | 28.96 | 21.62 | 340.67 | |||||||||||||||
| FHBI |
BayFirst Financial Corp. | 26.00 | 3,920 | 101.9 | 41.00 | 9.33 | 26.00 | -3.53 | 217.07 | 87.95 | 7.40 | 7.40 | 21.25 | NA | 305.67 | |||||||||||||||
| BHWB |
Blackhawk Bancorp, Inc. | 35.99 | 2,843 | 102.3 | 35.99 | 19.30 | 35.99 | 0.00 | 79.95 | 28.54 | 4.18 | 4.18 | 34.97 | 30.81 | 470.22 | |||||||||||||||
| BNCC |
BNCCORP, Inc. | 40.50 | 3,572 | 144.7 | 49.80 | 27.10 | 40.50 | 1.25 | 44.64 | -10.50 | 11.23 | NA | 37.00 | 37.00 | 288.02 | |||||||||||||||
| TYCB |
Calvin B. Taylor Bankshares, Inc. | 35.99 | 2,765 | 99.5 | 42.00 | 31.50 | 35.99 | 0.95 | 9.23 | 2.10 | 2.89 | 2.69 | 35.12 | 35.12 | 303.39 | |||||||||||||||
| CSHX |
Cashmere Valley Bank | 71.31 | 3,877 | 276.5 | 74.82 | 41.71 | 71.31 | -3.43 | 69.79 | 35.54 | 6.99 | 7.03 | 60.53 | 58.01 | 553.92 | |||||||||||||||
| CBBI |
CBB Bancorp, Inc. | 12.60 | 10,280 | 129.5 | 12.60 | 6.03 | 12.60 | 2.86 | 93.85 | 57.50 | 1.77 | 1.88 | 16.66 | NA | 156.90 | |||||||||||||||
| CTUY |
Century Next Financial Corporation | 32.00 | 1,745 | 55.8 | 32.00 | 24.05 | 32.00 | 0.00 | 22.18 | 29.23 | 2.36 | 2.36 | 30.32 | NA | 309.99 | |||||||||||||||
| CPKF |
Chesapeake Financial Shares, Inc. | 29.20 | 4,838 | 140.4 | 30.00 | 19.35 | 29.20 | -2.67 | 43.84 | 35.81 | 3.21 | 3.08 | NA | NA | 267.23 | |||||||||||||||
| CBAF |
CITBA Financial Corporation | 28.10 | 1,826 | 51.3 | 30.50 | 22.45 | 28.10 | -1.16 | 23.52 | 0.18 | 3.02 | 3.02 | 33.36 | 33.36 | 343.67 | |||||||||||||||
| CBTN |
Citizens Bancorp Investment, Inc. | 48.00 | 5,872 | 281.9 | 48.00 | 48.00 | 48.00 | 0.00 | 0.00 | 0.00 | 2.17 | 2.19 | 21.90 | 18.55 | 237.90 | |||||||||||||||
| CNBN |
CNB Bank Shares, Inc. | 23.00 | 5,380 | 123.7 | 23.00 | 16.15 | 23.00 | 0.00 | 42.86 | 27.78 | NA | NA | NA | NA | 294.58 | |||||||||||||||
| CNBB |
CNB Community Bancorp, Inc. | 43.30 | 2,180 | 94.4 | 45.20 | 30.00 | 43.30 | -1.59 | 37.46 | 23.71 | NA | NA | 36.08 | 34.86 | 480.15 | |||||||||||||||
| CCNB |
Coastal Carolina Bancshares, Inc. | 9.45 | 6,112 | 57.8 | 9.50 | 5.25 | 9.45 | -0.53 | 62.37 | 26.00 | 0.86 | NA | 9.19 | 8.66 | 115.90 | |||||||||||||||
| COSO |
CoastalSouth Bancshares, Inc. | 16.70 | 7,994 | 100.3 | 18.50 | 9.72 | 16.70 | -0.95 | 71.99 | 38.02 | 1.25 | NA | 13.74 | 13.07 | 157.87 | |||||||||||||||
| CBWA |
Commencement Bancorp Inc. | 13.56 | 4,191 | 56.8 | 13.90 | 9.66 | 13.56 | -1.02 | 34.26 | 19.37 | NA | NA | 12.71 | 12.41 | 134.04 | |||||||||||||||
| CNAF |
Commercial National Financial Corporation | 19.96 | 2,861 | 57.1 | 21.50 | 15.60 | 19.96 | -2.66 | 12.74 | 20.94 | 1.58 | 1.55 | 22.81 | 22.81 | 157.11 | |||||||||||||||
| CFST |
Communities First Financial Corporation | 45.00 | 3,073 | 138.3 | 45.50 | 23.05 | 45.00 | 0.00 | 78.22 | 45.11 | 5.26 | NA | 25.63 | 25.63 | 321.68 | |||||||||||||||
| CMTV |
Community Bancorp | 19.78 | 5,349 | 105.8 | 22.90 | 12.60 | 19.78 | 0.10 | 54.53 | 33.20 | 2.28 | 2.14 | 14.81 | 12.65 | 173.02 | |||||||||||||||
| CYSM |
Community Bancorp of Santa Maria | 11.20 | 2,162 | 24.2 | 13.24 | 8.30 | 11.20 | -2.01 | 31.30 | 10.24 | NA | NA | NA | NA | 171.74 | |||||||||||||||
| ALBY |
Community Capital Bancshares, Inc. | 13.35 | 1,261 | 16.8 | 15.14 | 10.88 | 13.35 | -1.11 | 24.19 | 18.67 | 1.49 | NA | 15.12 | 15.12 | NA | |||||||||||||||
| CBKM |
Consumers Bancorp, Inc. | 19.21 | 3,028 | 58.2 | 20.05 | 14.76 | 19.21 | -1.49 | 28.93 | -0.83 | 2.98 | NA | 23.08 | 22.73 | 275.36 | |||||||||||||||
| CWBK |
CW Bancorp | 30.00 | 3,518 | 105.5 | 31.24 | 16.50 | 30.00 | -3.97 | 66.67 | 49.25 | 3.71 | NA | 20.86 | 19.99 | 330.36 | |||||||||||||||
| DBIN |
Dacotah Banks, Inc. | 33.00 | 11,241 | 370.9 | 34.00 | 25.00 | 33.00 | 1.38 | 21.10 | 24.53 | 2.61 | 2.61 | 32.63 | 31.62 | 293.34 | |||||||||||||||
| DMKB.A |
Denmark Bancshares, Inc. | 25.00 | 3,149 | 76.4 | 26.90 | 23.10 | 25.00 | 0.81 | 7.30 | 1.01 | NA | NA | 21.32 | 21.32 | 207.83 | |||||||||||||||
| DSBX |
Dogwood State Bank | 15.50 | 12,371 | 107.4 | 15.50 | 14.00 | 15.50 | 0.00 | 3.33 | 10.71 | NA | NA | NA | NA | 60.29 | |||||||||||||||
| EFSI |
Eagle Financial Services, Inc. | 34.50 | 3,447 | 118.9 | 34.95 | 24.99 | 34.50 | 1.47 | 31.43 | 16.95 | 3.44 | 3.35 | 31.25 | 31.25 | 353.63 | |||||||||||||||
| EMYB |
Embassy Bancorp, Inc. | 19.27 | 7,508 | 144.7 | 21.20 | 11.83 | 19.27 | -1.43 | 60.72 | 31.99 | 2.01 | 2.01 | 15.43 | 15.43 | 201.84 | |||||||||||||||
| ENBP |
ENB Financial Corp | 22.02 | 5,570 | 122.7 | 23.75 | 17.55 | 22.02 | -1.03 | 19.87 | 18.39 | 2.63 | 2.50 | 24.41 | 24.41 | 283.45 | |||||||||||||||
| EQFN |
Equitable Financial Corp. | 12.81 | 2,726 | 34.9 | 12.99 | 10.00 | 12.81 | -0.31 | 19.16 | 7.20 | 1.29 | 1.34 | 13.77 | 13.19 | 156.97 | |||||||||||||||
| ESBS |
ES Bancshares, Inc. | 5.01 | 6,648 | 33.3 | 5.13 | 3.92 | 5.01 | -0.40 | 26.20 | 15.17 | 0.43 | 0.43 | 5.52 | 5.44 | 77.72 | |||||||||||||||
| FMBM |
F & M Bank Corp. | 28.50 | 3,210 | 91.5 | 29.70 | 18.65 | 28.50 | -0.87 | 49.45 | 23.86 | 3.49 | 3.24 | 29.80 | 28.81 | 344.26 | |||||||||||||||
| FMCB |
Farmers & Merchants Bancorp | 898.50 | 790 | 709.5 | 925.00 | 700.00 | 898.50 | 0.96 | 25.66 | 18.22 | 79.82 | 77.86 | 555.13 | 536.28 | 6236.42 | |||||||||||||||
| FETM |
Fentura Financial, Inc. | 25.95 | 4,641 | 120.4 | 27.40 | 16.80 | 25.95 | -0.57 | 50.43 | 17.95 | 3.74 | 4.12 | 26.51 | 25.73 | 282.20 | |||||||||||||||
| FNBT |
FineMark Holdings, Inc. | 34.93 | 11,575 | 404.3 | 34.93 | 19.55 | 34.93 | 5.85 | 71.23 | 49.21 | 2.51 | 2.29 | 25.20 | 25.20 | 257.72 | |||||||||||||||
| FFMR |
First Farmers Financial Corporation | 44.00 | 7,050 | 310.2 | 48.00 | 40.00 | 44.00 | 0.00 | 0.00 | 0.66 | 4.29 | 4.26 | 31.30 | 29.97 | 314.01 | |||||||||||||||
| FBAK |
First National Bank Alaska | 233.96 | 3,167 | 740.9 | 244.46 | 182.04 | 233.96 | -0.02 | 15.83 | 25.85 | 17.84 | NA | 182.28 | 182.28 | 1685.58 | |||||||||||||||
| FRSB |
First Resource Bank | 10.90 | 2,925 | 31.9 | 11.25 | 5.97 | 10.90 | 0.37 | 72.11 | 38.73 | 1.29 | 1.29 | 11.42 | 11.42 | 156.44 | |||||||||||||||
| GBFH |
GBank Financial Holdings Inc. | 10.05 | 12,181 | 122.4 | 11.30 | 7.80 | 10.05 | -4.29 | 11.67 | 11.67 | NA | NA | 5.67 | 5.67 | 44.55 | |||||||||||||||
| GNRV |
Grand River Commerce, Inc. | 7.31 | 6,751 | 49.3 | 7.75 | 4.65 | 7.31 | -2.53 | 48.58 | 44.75 | NA | NA | NA | NA | 68.07 | |||||||||||||||
| GRRB |
GrandSouth Bancorporation | 24.35 | 5,141 | 125.2 | 33.99 | 13.05 | 24.35 | 0.21 | 70.40 | 60.09 | 2.27 | 2.26 | 17.20 | 17.05 | 226.33 |
| HARL |
Harleysville Financial Corporation | 25.15 | 3,727 | 93.7 | 27.00 | 20.50 | 25.15 | 1.00 | 14.32 | 16.98 | 2.00 | 2.00 | 21.61 | 21.61 | 242.73 | |||||||||||||||
| HLAN |
Heartland BancCorp | 90.50 | 1,996 | 180.6 | 96.52 | 64.00 | 90.50 | -1.30 | 34.07 | 9.05 | 8.74 | 8.78 | 73.42 | 66.65 | 756.14 | |||||||||||||||
| HCBC |
High Country Bancorp, Inc. | 44.15 | 1,034 | 45.6 | 47.00 | 32.00 | 44.15 | -2.41 | 24.75 | 17.64 | 4.81 | NA | 35.06 | 35.06 | 366.25 | |||||||||||||||
| INBC |
InBankshares, Corp | 10.25 | 7,947 | 81.5 | 12.00 | 7.00 | 10.25 | 0.00 | 28.13 | 28.13 | NA | NA | NA | NA | 89.14 | |||||||||||||||
| IBTN |
InsCorp, Inc. | 17.20 | 2,932 | 50.4 | 17.80 | 12.16 | 17.20 | -2.82 | 32.31 | 16.22 | NA | NA | NA | NA | 225.19 | |||||||||||||||
| IFHI |
Integrated Financial Holdings, Inc. | 28.49 | 2,204 | 62.2 | 28.49 | 17.00 | 28.49 | 0.00 | 65.16 | 28.04 | 5.39 | 5.15 | 38.32 | 29.29 | 199.74 | |||||||||||||||
| ISBA |
Isabella Bank Corporation | 23.05 | 7,948 | 183.2 | 23.90 | 15.73 | 23.05 | -1.07 | 41.76 | 17.78 | 1.68 | 1.67 | 28.10 | 21.96 | 255.57 | |||||||||||||||
| JDVB |
JD Bancshares, Inc. | 26.00 | 1,715 | 89.2 | 26.00 | 21.01 | 26.00 | 0.00 | 7.92 | 5.07 | NA | NA | 58.20 | 55.76 | 795.10 | |||||||||||||||
| KTHN |
Katahdin Bankshares Corp. | 23.25 | 3,288 | 76.4 | 24.73 | 16.83 | 23.25 | -0.21 | 31.36 | 25.74 | 3.24 | NA | 24.01 | 22.30 | 288.36 | |||||||||||||||
| KISB |
Kish Bancorp, Inc. | 38.50 | 2,630 | 101.3 | 40.00 | 25.00 | 38.50 | -3.10 | 54.00 | 35.09 | NA | NA | 28.23 | 26.87 | 440.77 | |||||||||||||||
| LYBC |
Lyons Bancorp Inc. | 40.95 | 3,430 | 140.4 | 54.00 | 33.51 | 40.95 | 2.38 | 17.00 | 2.38 | 3.37 | 3.38 | 28.57 | 28.57 | 460.71 | |||||||||||||||
| MNAT |
Marquette National Corporation | 35.55 | 4,403 | 156.5 | 38.50 | 21.07 | 35.55 | -3.40 | 62.70 | 31.67 | 6.14 | 1.50 | 42.84 | 34.81 | 459.62 | |||||||||||||||
| MNBP |
Mars Bancorp, Inc. | 20.10 | 1,600 | 1.6 | 30.00 | 15.00 | 20.10 | -12.53 | 21.20 | 3.08 | 1.39 | NA | 24.69 | 24.69 | 295.38 | |||||||||||||||
| MNMB |
Merchants & Marine Bancorp, Inc. | 44.00 | 1,330 | 58.5 | 46.00 | 33.80 | 44.00 | 9.32 | 34.15 | 25.32 | 1.52 | 1.48 | 61.66 | NA | 552.20 | |||||||||||||||
| MVLY |
Mission Valley Bancorp | 15.20 | 3,270 | 49.7 | 15.69 | 7.66 | 15.20 | 2.70 | 75.32 | 44.08 | 1.06 | NA | NA | NA | 130.10 | |||||||||||||||
| MBLU |
Morris State Bancshares, Inc. | 73.50 | 2,100 | 154.4 | 80.00 | 56.50 | 73.50 | 0.00 | 28.38 | 21.49 | 9.68 | NA | 65.53 | 59.86 | 634.94 | |||||||||||||||
| MCBI |
Mountain Commerce Bancorp, Inc. | 27.00 | 6,324 | 170.7 | 28.00 | 14.85 | 27.00 | -3.57 | 79.40 | 31.71 | 3.07 | 3.11 | 18.23 | 18.23 | 195.79 | |||||||||||||||
| NASB |
NASB Financial, Inc. | 64.40 | 7,402 | 476.7 | 74.75 | 52.75 | 64.40 | 0.23 | 23.25 | -2.42 | 13.93 | NA | 53.81 | 52.40 | 312.07 | |||||||||||||||
| OSBK |
Oconee Financial Corporation | 41.29 | 896 | 37.0 | 47.00 | 33.00 | 41.29 | 0.00 | 26.08 | 13.90 | 2.78 | 2.82 | 43.43 | NA | 590.92 | |||||||||||||||
| OTTW |
Ottawa Bancorp, Inc. | 14.85 | 2,811 | 41.7 | 15.28 | 9.79 | 14.85 | 0.00 | 50.46 | 1.92 | 1.03 | 1.04 | 16.68 | 16.42 | 117.56 | |||||||||||||||
| PFLC |
Pacific Financial Corporation | 12.30 | 10,429 | 128.3 | 13.35 | 6.90 | 12.30 | -0.89 | 75.71 | 30.99 | 1.50 | 1.50 | 11.32 | NA | 123.77 | |||||||||||||||
| PKKW |
Parkway Acquisition Corp. | 12.25 | 6,006 | 73.6 | 12.75 | 8.40 | 12.25 | 2.08 | 32.43 | 25.00 | 1.20 | 1.25 | 14.47 | 13.59 | 157.66 | |||||||||||||||
| PBNC |
PB Financial Corporation | 35.36 | 2,203 | 77.9 | 36.50 | 27.60 | 35.36 | -1.78 | 27.19 | 10.50 | 3.67 | NA | 27.74 | NA | 284.25 | |||||||||||||||
| PFBX |
Peoples Financial Corporation | 16.00 | 4,879 | 78.1 | 17.87 | 10.05 | 16.00 | 0.95 | 56.10 | 18.52 | 0.32 | 0.51 | 19.72 | 19.72 | 157.37 | |||||||||||||||
| PPBN |
Pinnacle Bankshares Corporation | 23.15 | 2,170 | 50.2 | 27.00 | 19.00 | 23.15 | 0.13 | 20.26 | 0.65 | 2.11 | NA | 27.38 | NA | 429.94 | |||||||||||||||
| PMHG |
Prime Meridian Holding Company | 23.00 | 3,128 | 71.9 | 24.00 | 13.87 | 23.00 | -3.16 | 61.40 | 27.78 | 2.40 | 2.37 | 20.40 | 20.40 | 241.91 | |||||||||||||||
| PBAM |
Private Bancorp of America, Inc. | 24.99 | 5,617 | 140.4 | 25.25 | 12.20 | 24.99 | 0.00 | 106.53 | 35.08 | 2.79 | 2.79 | 20.71 | NA | 246.18 | |||||||||||||||
| PSBP |
PSB Holding Corp. | 27.30 | 1,532 | 41.8 | 27.87 | 20.62 | 27.30 | -2.05 | 21.33 | 21.23 | 3.55 | 3.54 | 33.01 | 33.01 | 372.40 | |||||||||||||||
| PSBQ |
PSB Holdings, Inc. | 24.75 | 4,471 | 110.7 | 26.50 | 17.20 | 24.75 | -2.60 | 32.00 | 20.32 | 2.67 | 3.12 | 24.24 | 23.53 | 280.62 | |||||||||||||||
| SCZC |
Santa Cruz County Bank | 49.00 | 3,872 | 189.7 | 53.50 | 36.00 | 49.00 | 0.41 | 36.11 | 20.96 | 5.28 | 5.44 | 46.15 | 38.79 | 421.27 | |||||||||||||||
| SABK |
South Atlantic Bancshares, Inc. | 14.65 | 7,495 | 109.8 | 15.50 | 8.25 | 14.65 | -0.34 | 71.35 | 19.59 | 1.28 | 1.19 | 13.63 | 12.83 | 152.87 | |||||||||||||||
| STBI |
Sturgis Bancorp, Inc. | 18.65 | 2,128 | 39.7 | 20.00 | 16.01 | 18.65 | -2.36 | 0.54 | 1.08 | 2.78 | 2.64 | 23.40 | 20.63 | 332.14 | |||||||||||||||
| SVBT |
SVB & T Corporation | 95.00 | 550 | 52.3 | 95.00 | 63.00 | 95.00 | 1.06 | 48.44 | 31.94 | 12.43 | NA | 98.57 | 98.57 | 905.54 | |||||||||||||||
| FDVA |
The Freedom Bank of Virginia | 12.66 | 7,306 | 84.0 | 13.25 | 7.16 | 12.66 | 0.00 | 74.62 | 39.12 | 1.38 | 1.36 | 10.81 | 10.81 | 114.58 | |||||||||||||||
| VTYB |
The Victory Bancorp, Inc. | 12.66 | 1,950 | 24.7 | 13.25 | 6.76 | 12.66 | -1.86 | 63.35 | 29.85 | 1.63 | NA | 12.03 | 12.03 | 232.12 | |||||||||||||||
| TCNB |
Town Center Bank | 3.80 | 2,334 | 8.9 | 4.00 | 2.56 | 3.80 | 1.06 | 22.98 | 25.91 | 0.43 | 0.42 | 6.63 | 6.63 | 67.46 | |||||||||||||||
| TYFG |
Tri-County Financial Group, Inc. | 46.50 | 2,483 | 115.5 | 46.75 | 30.00 | 46.50 | 0.19 | 58.97 | 31.91 | NA | NA | 53.52 | 50.14 | 552.76 | |||||||||||||||
| TRVR |
Two Rivers Financial Group, Inc. | 39.50 | 2,165 | 85.5 | 40.00 | 24.15 | 39.50 | 0.46 | 49.06 | 43.38 | 9.38 | NA | 48.73 | 44.67 | 465.27 | |||||||||||||||
| UNIF |
U & I Financial Corp. | 9.60 | 5,579 | 53.6 | 12.00 | 6.70 | 9.60 | 2.13 | 28.00 | 7.87 | 1.31 | 1.31 | 11.25 | NA | 74.76 | |||||||||||||||
| UBNC |
UB Bancorp | 17.50 | 5,952 | 104.2 | 18.00 | 9.30 | 17.50 | -2.78 | 80.41 | 49.06 | NA | NA | 16.05 | 13.80 | 181.41 | |||||||||||||||
| UBAB |
United Bancorporation of Alabama, Inc. | 29.75 | 3,755 | 111.7 | 30.20 | 18.82 | 29.75 | 0.34 | 45.83 | 33.71 | 4.22 | 2.03 | 28.51 | 28.51 | 271.11 | |||||||||||||||
| UWHR |
Uwharrie Capital Corp | 8.60 | 6,964 | 59.9 | 9.50 | 4.56 | 8.60 | -3.70 | 86.64 | 63.81 | 1.67 | 1.47 | 7.31 | 7.31 | 121.37 | |||||||||||||||
| WAYN |
Wayne Savings Bancshares, Inc. | 26.05 | 2,381 | 62.0 | 27.00 | 16.60 | 26.05 | 0.00 | 44.88 | 20.88 | 2.93 | NA | 21.66 | 20.95 | 264.00 | |||||||||||||||
| WBBW |
Westbury Bancorp, Inc. | 28.55 | 2,753 | 78.6 | 29.50 | 19.25 | 28.55 | -0.10 | 47.55 | 18.91 | 3.46 | NA | 31.20 | 31.20 | 328.75 | |||||||||||||||
| WRIV |
White River Bancshares Co | 77.65 | 924 | 71.7 | 80.26 | 47.55 | 77.65 | 0.00 | 61.74 | 25.95 | 6.23 | NA | 79.91 | NA | 877.49 | |||||||||||||||
| MTFC |
Minster Financial Corp. | 66.45 | 1,046 | 69.5 | 66.45 | 62.50 | 66.45 | 0.00 | 16.07 | 6.32 | NA | NA | NA | NA | 609.65 | |||||||||||||||
| Partial Stock Mutual Holding Companies(8) |
||||||||||||||||||||||||||||||
| BSBK |
Bogota Financial Corp. | 10.35 | 13,949 | 144.4 | 11.10 | 7.01 | 10.35 | -0.96 | 42.76 | 16.16 | 0.49 | 0.41 | 10.03 | 10.00 | 58.70 | |||||||||||||||
| CULL |
Cullman Bancorp, Inc. | 11.49 | 7,406 | 85.1 | 15.49 | 7.74 | 11.49 | 0.26 | 16.58 | 48.37 | NA | NA | 8.30 | 8.30 | 50.80 | |||||||||||||||
| FSEA |
First Seacoast Bancorp | 9.80 | 5,805 | 56.9 | 10.00 | 6.21 | 9.80 | 0.31 | 55.19 | 10.37 | 0.35 | 0.26 | 9.97 | 9.97 | 82.39 | |||||||||||||||
| GCBC |
Greene County Bancorp, Inc. | 30.00 | 8,513 | 255.4 | 32.40 | 21.50 | 30.00 | -2.57 | 33.93 | 17.69 | 2.81 | 2.81 | 17.57 | 17.57 | 258.46 | |||||||||||||||
| OFED |
Oconee Federal Financial Corp. | 23.50 | 5,574 | 131.0 | 27.00 | 20.70 | 23.50 | 0.00 | -12.25 | -7.11 | 0.72 | NA | NA | NA | 97.54 | |||||||||||||||
| PBFS |
Pioneer Bancorp, Inc. | 12.00 | 25,074 | 300.9 | 13.34 | 8.02 | 12.00 | 0.00 | 37.30 | 13.53 | 0.25 | 0.18 | 8.80 | 8.45 | 71.33 | |||||||||||||||
| RBKB |
Rhinebeck Bancorp, Inc. | 10.65 | 10,751 | 114.5 | 13.10 | 6.26 | 10.65 | -2.09 | 66.79 | 24.56 | 0.86 | 0.85 | 10.95 | 10.70 | 112.56 | |||||||||||||||
| KFFB |
Kentucky First Federal Bancorp | 7.07 | 8,212 | 58.1 | 8.16 | 5.65 | 7.07 | -0.14 | 9.61 | 11.87 | -1.47 | -0.17 | 6.31 | 6.19 | 40.51 | |||||||||||||||
| LSBK |
Lake Shore Bancorp, Inc. | 14.90 | 5,644 | 84.1 | 16.00 | 10.85 | 14.90 | -0.53 | 26.81 | 14.62 | 0.88 | 0.91 | 15.00 | 15.00 | 125.94 | |||||||||||||||
| PDLB |
PDL Community Bancorp | 13.58 | 17,331 | 235.4 | 14.88 | 8.01 | 13.58 | -1.95 | 54.85 | 29.21 | 0.84 | NA | 9.92 | 9.92 | 89.30 | |||||||||||||||
| CLBK |
Columbia Financial, Inc. | 18.44 | 108,326 | 1,983.8 | 18.81 | 10.27 | 18.44 | 0.60 | 68.40 | 18.51 | 0.79 | 0.85 | 9.61 | 8.82 | 83.70 | |||||||||||||||
| TFSL |
TFS Financial Corporation | 19.75 | 276,940 | 5,469.6 | 22.54 | 14.12 | 19.75 | -1.45 | 32.37 | 12.02 | 0.28 | NA | 6.09 | 6.06 | 51.41 | |||||||||||||||
| FSGB |
1st Federal Savings Bank of SC, Inc. | 14.00 | 1,013 | 14.2 | 17.00 | 11.85 | 14.00 | 0.00 | 0.07 | 3.24 | 0.99 | 0.99 | 10.17 | 10.17 | 122.31 | |||||||||||||||
| ABBB |
Auburn Bancorp, Inc. | 12.30 | 500 | 6.1 | 16.25 | 9.00 | 12.30 | 2.50 | 34.13 | 23.00 | 0.80 | 0.80 | 15.90 | 15.90 | 198.87 | |||||||||||||||
| BVFL |
BV Financial, Inc. | 18.75 | 7,118 | 133.5 | 20.00 | 13.25 | 18.75 | -3.85 | 17.41 | 10.29 | 1.08 | NA | NA | NA | 113.46 | |||||||||||||||
| GOVB |
Gouverneur Bancorp, Inc. | 10.00 | 2,031 | 20.3 | 12.00 | 8.60 | 10.00 | 0.00 | 13.64 | -0.50 | 0.55 | NA | 13.51 | 13.51 | 65.38 | |||||||||||||||
| GVFF |
Greenville Federal Financial Corporation | 8.06 | 2,162 | 17.4 | 9.49 | 5.80 | 8.06 | -5.18 | 34.33 | 18.53 | 0.31 | 0.31 | NA | NA | 103.88 | |||||||||||||||
| LSFG |
Lifestore Financial Group, Inc. | 42.90 | 1,031 | 44.2 | 42.90 | 27.50 | 42.90 | 1.66 | 57.37 | 12.89 | 6.01 | NA | 40.75 | 40.75 | 384.06 | |||||||||||||||
| LPBC |
Lincoln Park Bancorp. | 7.80 | 1,860 | 14.5 | 8.99 | 5.70 | 7.80 | -4.88 | 37.32 | 15.56 | -0.44 | NA | NA | NA | 169.04 | |||||||||||||||
| MBBC |
Marathon Bancorp, Inc. | 10.60 | 2,229 | 23.6 | 10.65 | 10.00 | 10.60 | 0.00 | 6.00 | 6.00 | NA | NA | NA | NA | 96.82 | |||||||||||||||
| MFDB |
Mutual Federal Bancorp, Inc. | 3.90 | 3,292 | 12.8 | 6.50 | 2.00 | 3.90 | 0.00 | 58.53 | 19.27 | NA | NA | NA | NA | 26.88 | |||||||||||||||
| SNNF |
Seneca Financial Corp. | 9.75 | 1,842 | 18.0 | 10.99 | 6.82 | 9.75 | 0.00 | 36.46 | 18.18 | NA | NA | NA | NA | 120.76 | |||||||||||||||
| SSBP |
SSB Bancorp, Inc. | 9.70 | 2,279 | 22.1 | 10.85 | 6.75 | 9.70 | 1.04 | 33.79 | 21.25 | NA | NA | NA | NA | 102.65 | |||||||||||||||
| TBBA |
TEB Bancorp, Inc | 9.37 | 2,624 | 24.6 | 9.99 | 5.20 | 9.37 | -0.85 | 67.32 | 24.93 | 2.16 | 2.16 | 10.83 | 10.83 | 115.32 | |||||||||||||||
| WAKE |
Wake Forest Bancshares, Inc. | 18.52 | 1,097 | 20.3 | 19.95 | 13.91 | 18.52 | -2.53 | 36.18 | 3.35 | 1.07 | NA | NA | NA | 101.94 | |||||||||||||||
| Merger Target |
||||||||||||||||||||||||||||||
| ALTA |
Altabancorp | 41.89 | 18,887 | 791.2 | 47.80 | 18.76 | 41.89 | 0.10 | 110.08 | 50.04 | 2.35 | 2.44 | 19.63 | 18.08 | 187.47 | |||||||||||||||
| ESXB |
Community Bankers Trust Corporation | 11.10 | 22,451 | 249.2 | 12.25 | 4.91 | 11.10 | 0.63 | 116.80 | 64.44 | 0.98 | 1.00 | 8.01 | 8.01 | 78.13 | |||||||||||||||
| CLDB |
Cortland Bancorp | 27.06 | 4,256 | 115.2 | 28.24 | 13.32 | 27.06 | -0.88 | 97.45 | 44.71 | 2.32 | 2.34 | 19.55 | 19.55 | 186.32 | |||||||||||||||
| FVCB |
FVCBankcorp, Inc. | 20.16 | 13,682 | 275.8 | 20.95 | 9.35 | 20.16 | 3.28 | 85.12 | 37.14 | 1.38 | 1.40 | 14.70 | 14.10 | 144.36 | |||||||||||||||
| HBMD |
Howard Bancorp, Inc. | 19.35 | 18,811 | 364.0 | 20.50 | 8.70 | 19.35 | -3.15 | 95.65 | 63.84 | 1.22 | 1.44 | 16.14 | 14.22 | 138.20 | |||||||||||||||
| MFNC |
Mackinac Financial Corporation | 21.20 | 10,550 | 223.7 | 22.19 | 9.03 | 21.20 | 0.76 | 116.33 | 66.14 | 1.32 | 1.41 | 16.30 | 14.06 | 143.97 | |||||||||||||||
| RBNC |
Reliant Bancorp, Inc. | 28.55 | 16,679 | 476.2 | 31.00 | 13.00 | 28.55 | -4.55 | 86.11 | 53.33 | 2.95 | 2.84 | 20.77 | 16.88 | 185.77 | |||||||||||||||
| SVBI |
Severn Bancorp, Inc. | 12.23 | 12,864 | 157.3 | 12.80 | 5.89 | 12.23 | -2.00 | 101.48 | 71.29 | 0.78 | 0.80 | 8.76 | 8.70 | 88.90 | |||||||||||||||
| FCCY |
1st Constitution Bancorp | 21.65 | 10,285 | 222.7 | 22.47 | 11.06 | 21.65 | -0.37 | 65.52 | 36.42 | 2.05 | 2.10 | 19.02 | 15.46 | 173.97 | |||||||||||||||
| BOCH |
Bank of Commerce Holdings | 14.37 | 16,748 | 240.7 | 15.38 | 6.52 | 14.37 | -0.42 | 90.84 | 45.15 | 1.10 | 1.17 | 10.78 | 9.87 | 114.47 | |||||||||||||||
| ICBK |
County Bancorp, Inc. | 35.27 | 6,027 | 212.6 | 36.01 | 17.04 | 35.27 | -1.56 | 79.40 | 59.74 | 2.91 | 3.01 | 27.68 | 27.68 | 251.72 | |||||||||||||||
| PFBI |
Premier Financial Bancorp, Inc. | 18.12 | 14,805 | 268.3 | 19.30 | 10.10 | 18.12 | 0.83 | 55.54 | 36.34 | 1.57 | 1.58 | 16.84 | 13.35 | 140.49 | |||||||||||||||
| RIVE |
Riverview Financial Corporation | 12.50 | 9,362 | 117.0 | 13.50 | 6.50 | 12.50 | -0.34 | 73.61 | 36.61 | 1.09 | NA | 11.15 | 10.97 | 129.75 | |||||||||||||||
| SLCT |
Select Bancorp, Inc. | 16.68 | 17,230 | 287.4 | 17.44 | 6.93 | 16.68 | -1.48 | 116.06 | 76.14 | 1.04 | 1.14 | 12.85 | 10.29 | 108.81 | |||||||||||||||
| ACBI |
Atlantic Capital Bancshares, Inc. | 24.27 | 20,303 | 492.8 | 28.93 | 10.48 | 24.27 | -3.73 | 120.44 | 52.45 | 2.11 | 2.11 | 17.38 | 16.27 | 186.20 | |||||||||||||||
| BMTC |
Bryn Mawr Bank Corporation | 40.28 | 19,878 | 800.7 | 49.83 | 23.96 | 40.28 | -1.37 | 50.47 | 31.66 | 3.35 | 3.56 | 32.44 | 22.48 | 249.45 | |||||||||||||||
| CNBK.A |
Century Bancorp, Inc. | 114.42 | 5,568 | 419.0 | 121.32 | 63.28 | 114.42 | -0.12 | 58.48 | 47.91 | 7.91 | 7.91 | 70.50 | 70.02 | 1304.62 | |||||||||||||||
| FMBI |
First Midwest Bancorp, Inc. | 18.35 | 114,299 | 2,097.4 | 24.28 | 10.38 | 18.35 | -0.97 | 46.04 | 15.26 | 1.31 | 1.74 | 21.67 | 13.55 | 189.20 | |||||||||||||||
| ISBC |
Investors Bancorp, Inc. | 13.74 | 236,958 | 3,255.8 | 15.71 | 6.74 | 13.74 | -4.72 | 79.84 | 30.11 | 1.24 | 1.29 | 11.37 | 10.97 | 113.11 | |||||||||||||||
| MRLN |
Marlin Business Services Corp. | 22.11 | 11,879 | 262.6 | 23.24 | 6.60 | 22.11 | -0.45 | 217.67 | 80.64 | 2.92 | 3.37 | 17.55 | 17.11 | 82.96 | |||||||||||||||
| EBSB |
Meridian Bancorp, Inc. | 20.91 | 50,421 | 1,053.7 | 22.97 | 9.75 | 20.91 | 1.70 | 82.14 | 40.24 | 1.49 | 1.49 | 15.23 | 14.81 | 124.69 | |||||||||||||||
| PMBC |
Pacific Mercantile Bancorp | 8.79 | 23,891 | 197.1 | 9.45 | 3.31 | 8.79 | -1.57 | 134.40 | 71.01 | 0.67 | 0.68 | 6.97 | 6.95 | 64.23 | |||||||||||||||
| PBCT |
People’s United Financial, Inc. | 15.82 | 422,370 | 6,681.9 | 19.62 | 9.74 | 15.82 | -3.30 | 50.52 | 22.35 | 0.71 | 1.37 | 17.55 | 10.94 | 149.96 | |||||||||||||||
| CADE |
Cadence Bancorporation | 20.46 | 124,778 | 2,553.0 | 23.88 | 7.73 | 20.46 | -0.05 | 122.39 | 24.60 | 3.60 | 2.71 | 17.66 | 16.72 | 149.81 | |||||||||||||||
| CIT |
CIT Group Inc. | 52.43 | 99,144 | 5,198.1 | 55.89 | 15.65 | 52.43 | -0.87 | 169.15 | 46.04 | 5.98 | 6.83 | 55.58 | 54.39 | 551.76 | |||||||||||||||
| FBC |
Flagstar Bancorp, Inc. | 48.43 | 52,862 | 2,560.1 | 51.58 | 27.79 | 48.43 | -2.08 | 61.38 | 18.82 | 12.25 | 13.08 | NA | NA | 511.99 | |||||||||||||||
| STL |
Sterling Bancorp | 22.18 | 192,695 | 4,274.0 | 27.22 | 9.83 | 22.18 | -3.48 | 91.70 | 23.36 | 1.81 | 1.94 | 23.80 | 14.62 | 151.24 | |||||||||||||||
| AQFH |
Aquesta Financial Holdings, Inc. | 19.39 | 5,503 | 106.7 | 21.50 | 9.50 | 19.39 | -1.07 | 98.87 | 76.27 | 1.20 | NA | NA | NA | 133.76 | |||||||||||||||
| BSCA |
Bank of Santa Clarita | 14.10 | 3,775 | 53.2 | 14.25 | 7.70 | 14.10 | -0.98 | 82.88 | 38.64 | NA | NA | 11.55 | 11.55 | 110.23 | |||||||||||||||
| CCSB |
Community Savings Bancorp, Inc. | 21.22 | 379 | 8.0 | 21.35 | 10.15 | 21.22 | -0.38 | 97.40 | 63.23 | NA | NA | NA | NA | 157.35 | |||||||||||||||
| FNHM |
FNBH Bancorp, Inc. | 4.06 | 27,772 | 112.8 | 4.06 | 2.15 | 4.06 | 0.25 | 53.21 | 67.77 | 0.24 | NA | 2.39 | 2.39 | 23.29 | |||||||||||||||
| GNBF |
GNB Financial Services, Inc. | 86.50 | 779 | 67.4 | 93.00 | 38.32 | 86.50 | -1.14 | 93.95 | 8.14 | 5.32 | 5.39 | 65.15 | 61.59 | 569.64 | |||||||||||||||
| GPBI |
Golden Pacific Bancorp, Inc. | 2.44 | NA | NA | 3.00 | 1.65 | 2.44 | 0.00 | 47.88 | 47.88 | NA | NA | NA | NA | NA | |||||||||||||||
| PFOH |
Perpetual Federal Savings Bank | 40.30 | 2,470 | 99.5 | 40.50 | 23.66 | 40.30 | -0.12 | 47.84 | 58.10 | 1.90 | NA | 32.04 | 32.04 | 159.85 | |||||||||||||||
| PONB |
Pioneer Bancshares, Inc. | 29.50 | 6,237 | 184.0 | 39.00 | 16.30 | 29.50 | -7.81 | 75.60 | 21.65 | NA | NA | NA | NA | 285.08 | |||||||||||||||
| SVRH |
Sevier County Bancshares, Inc. | 15.36 | 3,966 | 60.9 | NA | NA | 15.36 | 0.00 | 0.00 | 0.00 | NA | NA | 7.52 | 7.52 | 114.06 | |||||||||||||||
| SDGB |
SSNB Inc | 59.50 | 255 | 15.2 | 60.00 | 20.56 | 59.50 | 0.00 | 174.83 | 186.75 | NA | NA | 33.30 | NA | 419.30 | |||||||||||||||
| SNNY |
Sunnyside Bancorp, Inc. | 18.26 | 756 | 13.8 | 19.00 | 9.25 | 18.26 | 0.22 | 101.77 | 47.02 | -1.15 | -0.51 | 13.09 | 13.09 | 126.11 | |||||||||||||||
| WNRP |
West Suburban Bancorp, Inc. | 744.00 | 387 | 288.1 | 825.00 | 323.01 | 744.00 | -0.80 | 103.84 | 67.19 | NA | NA | NA | NA | 7601.64 | |||||||||||||||
| HSBI |
Heritage Southeast Bancorporation Inc. | 25.40 | 7,017 | 178.2 | 25.99 | 10.66 | 25.40 | 0.79 | 82.73 | 88.85 | 1.27 | 1.79 | 20.65 | 15.66 | 235.47 | |||||||||||||||
| PLBN |
Pilot Bancshares, Inc. | 6.02 | 15,380 | 92.6 | 6.05 | 2.68 | 6.02 | 0.00 | 131.54 | 86.96 | NA | NA | NA | NA | 42.65 | |||||||||||||||
| RYFL |
Royal Financial, Inc. | 18.70 | 2,568 | 46.0 | 19.75 | 11.20 | 18.70 | -1.06 | 58.47 | 32.16 | 1.98 | 2.08 | 18.74 | 17.85 | 207.87 | |||||||||||||||
| SBKK |
Suncrest Bank | 16.24 | 12,251 | 199.0 | 16.24 | 8.06 | 16.24 | 2.14 | 98.53 | 58.28 | 1.29 | 1.33 | 14.08 | 10.72 | 111.99 |
| (1) | Average of High/Low or Bid/Ask price per share. |
| (2) | Or since offering price if converted of first listed in the past 52 weeks. Percent change figures are actual year-to-date and are not annualized. |
| (3) | EPS (earnings per share) is based on actual trailing 12 month data and is not shown on a pro forma basis. |
| (4) | Excludes intangibles (such as goodwill, value of core deposits, etc.). |
| (5) | ROA (return on assets) and ROE (return on equity) are indicated ratios based on trailing 12 month common earnings and average common equity and total assets balances. |
| (6) | Annualized based on last regular quarterly cash dividend announcement. |
| (7) | Indicated dividend as a percent of trailing 12 month earnings. |
| (8) | Excluded from averages due to actual or rumored acquisition activities or unusual operating characteristics. |
| (9) | For MHC institutions, market value reflects share price multiplied by public (non-MHC) shares. |
Source: S&P Market Intelligence, LC. and RP® Financial, LC. calculations. The information provided in this table has been obtained from sources we believe are reliable, but we cannot guarantee the accuracy or completeness of such information.
Copyright (c) 2021 by RP® Financial, LC.
RP® Financial, LC.
Exhibit IV-1B
Weekly Bank and Thrift Market Line - Part Two
Prices As of August 20, 2021
| Key Financial Ratios |
Asset Quality Ratios |
Pricing Ratios |
Dividend Data (6) | |||||||||||||||||||||||||||||||
| Equity/ | Tg. Equity/ | Reported Earnings |
Core Earnings |
NPAs/ | Rsvs/ | Price/ | Price/ | Price/ | Price/ | Price/Core | Div/ | Dividend | Payout | |||||||||||||||||||||
| Assets |
Assets |
ROA(5) |
ROE(5) |
ROA(5) |
ROE(5) |
Assets |
NPLs |
Earnings |
Book |
Assets |
Tang Book |
Earnings |
Share |
Yield |
Ratio (7) | |||||||||||||||||||
| (%) | (%) | (%) | (%) | (%) | (%) | (%) | (%) | (x) | (%) | (%) | (%) | (x) | ($) | (%) | (%) | |||||||||||||||||||
| Financial Institutions, Fully Converted, Not Under Acquisition (734) |
||||||||||||||||||||||||||||||||||
| Average | 10.27 | 9.43 | 1.12 | 11.03 | 1.12 | 10.84 | 0.61 | 237.91 | 11.13 | 115.76 | 11.76 | 129.41 | 11.66 | 2.25 | 2.33 | 29.91 | ||||||||||||||||||
| Median | 9.70 | 8.89 | 1.10 | 10.82 | 1.11 | 10.69 | 0.45 | 172.09 | 10.48 | 107.39 | 10.74 | 118.43 | 10.72 | 0.73 | 2.41 | 26.48 | ||||||||||||||||||
| Financial Institutions, Fully Converted, Not Under Acquisition (734) |
||||||||||||||||||||||||||||||||||
| BCOW |
1895 Bancorp of Wisconsin, Inc. | 9.96 | 9.96 | 0.25 | 2.26 | NA | NA | NA | NA | NM | 88.02 | NA | 88.02 | NA | NA | NA | NM | |||||||||||||||||
| ACNB |
ACNB Corporation | 9.83 | 8.18 | 1.16 | 11.55 | 1.18 | 11.75 | 0.40 | 188.02 | 8.21 | 92.43 | 9.09 | 113.15 | 8.07 | 1.00 | 3.54 | 29.65 | |||||||||||||||||
| AFBI |
Affinity Bancshares, Inc. | 14.95 | 12.86 | 0.95 | 8.10 | 0.99 | 8.42 | NA | NA | 12.38 | 78.81 | 11.78 | 93.85 | 11.92 | NA | NA | NM | |||||||||||||||||
| ALRS |
Alerus Financial Corporation | 10.91 | 9.36 | 1.81 | 16.62 | 1.83 | 16.78 | 0.27 | 437.87 | 8.61 | 134.98 | 14.72 | 160.01 | 8.51 | 0.64 | 2.37 | 19.75 | |||||||||||||||||
| ATLO |
Ames National Corporation | 10.08 | 9.41 | 1.15 | 11.03 | 1.14 | 10.93 | 0.65 | 133.02 | 9.45 | 102.16 | 10.29 | 110.15 | 9.53 | 1.04 | 4.42 | 51.41 | |||||||||||||||||
| BFC |
Bank First Corporation | 11.05 | 9.11 | 1.67 | 15.44 | 1.62 | 14.93 | 0.48 | 147.55 | 11.69 | 170.33 | 18.82 | 211.05 | 12.09 | 0.84 | 1.22 | 19.15 | |||||||||||||||||
| BMRC |
Bank of Marin Bancorp | 11.34 | 10.36 | 1.12 | 9.54 | 1.14 | 9.73 | 0.41 | 152.69 | 14.46 | 136.45 | 15.48 | 150.98 | 14.18 | 0.96 | 2.63 | 36.90 | |||||||||||||||||
| BKSC |
Bank of South Carolina Corporation | 9.36 | 9.36 | 1.27 | 12.77 | 1.27 | 12.75 | 0.79 | 93.43 | 16.10 | 199.56 | 18.68 | 199.56 | 16.12 | 0.68 | 3.46 | 63.93 | |||||||||||||||||
| BOTJ |
Bank of the James Financial Group, Inc. | 7.50 | 7.50 | 0.80 | 10.93 | 0.80 | 10.93 | 0.34 | 304.95 | 9.82 | 110.22 | 8.26 | 110.22 | 9.82 | 0.28 | 1.95 | 17.80 | |||||||||||||||||
| BWB |
Bridgewater Bancshares, Inc. | 9.20 | 9.10 | 1.17 | 12.43 | 1.31 | 13.87 | 0.03 | NM | 13.36 | 151.35 | 13.92 | 153.04 | 11.99 | NA | NA | NM | |||||||||||||||||
| BYFC |
Broadway Financial Corporation | 13.78 | 11.30 | -0.64 | -5.92 | 0.10 | 0.96 | NA | NA | NM | 156.76 | 21.21 | 197.90 | NM | 0.00 | 0.00 | NM | |||||||||||||||||
| CATC |
Cambridge Bancorp | 9.75 | 8.59 | 1.33 | 13.46 | 1.39 | 14.12 | 0.13 | 641.20 | 10.95 | 139.81 | 13.63 | 160.78 | 10.43 | 2.44 | 2.90 | 29.91 | |||||||||||||||||
| CARV |
Carver Bancorp, Inc. | 7.57 | 7.57 | -0.86 | -11.89 | -0.90 | -12.42 | 1.84 | 41.72 | NM | 216.04 | 8.87 | 216.04 | NM | 0.00 | 0.00 | NM | |||||||||||||||||
| CBMB |
CBM Bancorp, Inc. | 20.08 | 20.08 | 0.36 | 1.65 | 0.36 | 1.65 | 0.15 | 432.71 | NM | 103.62 | 20.80 | 103.62 | NM | NA | NA | 200.00 | |||||||||||||||||
| CVCY |
Central Valley Community Bancorp | 11.01 | 8.82 | 1.28 | 11.01 | 1.28 | 11.00 | 0.37 | 122.25 | 10.62 | 110.55 | 12.17 | 141.28 | 10.63 | 0.48 | 2.13 | 21.70 | |||||||||||||||||
| CFBK |
CF Bankshares Inc. | 7.95 | 7.95 | 1.93 | 25.46 | 1.91 | 25.18 | 0.21 | 485.43 | 4.52 | 103.30 | 8.21 | 103.30 | 4.57 | 0.12 | 0.64 | 2.91 | |||||||||||||||||
| COFS |
ChoiceOne Financial Services, Inc. | 10.77 | 7.97 | 0.99 | 8.57 | 1.13 | 9.84 | 0.34 | 114.64 | 9.85 | 81.56 | 8.79 | 113.68 | 8.58 | 0.88 | 3.63 | 34.96 | |||||||||||||||||
| CNNB |
Cincinnati Bancorp, Inc. | 17.13 | 17.08 | 1.72 | 11.34 | 1.73 | 11.40 | 0.51 | 132.57 | 9.72 | 97.57 | 16.72 | 97.94 | 9.68 | NA | NA | NM | |||||||||||||||||
| CZNC |
Citizens & Northern Corporation | 13.00 | 10.86 | 1.10 | 8.51 | 1.40 | 10.83 | 1.05 | 53.41 | 15.60 | 130.96 | 17.03 | 160.58 | 12.24 | 1.12 | 4.49 | 68.75 | |||||||||||||||||
| CIVB |
Civista Bancshares, Inc. | 12.05 | 9.51 | 1.28 | 10.94 | 1.35 | 11.56 | 0.19 | 460.57 | 9.63 | 100.82 | 12.15 | 131.51 | 9.11 | 0.56 | 2.43 | 20.50 | |||||||||||||||||
| EGBN |
Eagle Bancorp, Inc. | 11.92 | NA | 1.54 | 13.76 | 1.58 | 14.12 | NA | 154.98 | 10.60 | 138.80 | 16.54 | 156.78 | 10.33 | 1.40 | 2.47 | 19.44 | |||||||||||||||||
| ESBK |
Elmira Savings Bank | 9.62 | 7.87 | 0.73 | 7.91 | 0.73 | 7.97 | NA | 93.84 | 10.04 | 78.89 | 7.58 | 98.33 | 10.05 | 0.60 | 4.33 | 43.48 | |||||||||||||||||
| EMCF |
Emclaire Financial Corp | 8.42 | 6.70 | 0.80 | 9.22 | 0.81 | 9.29 | 0.26 | 345.30 | 9.26 | 84.67 | 6.83 | 109.94 | 9.19 | 1.20 | 4.33 | 40.13 | |||||||||||||||||
| ESQ |
Esquire Financial Holdings, Inc. | 12.73 | 12.73 | 1.74 | 12.90 | 1.70 | 12.58 | NA | 617.22 | 12.44 | 151.18 | 19.24 | 151.18 | 12.75 | NA | NA | NM | |||||||||||||||||
| FMAO |
Farmers & Merchants Bancorp, Inc. | 11.56 | 9.05 | 1.07 | 8.55 | 1.12 | 8.95 | NA | NA | 12.07 | 101.36 | 11.72 | 133.23 | 11.53 | 0.68 | 3.00 | 36.17 | |||||||||||||||||
| FMNB |
Farmers National Banc Corp. | 11.25 | 9.90 | 1.69 | 15.00 | 1.75 | 15.57 | 0.53 | 143.28 | 8.49 | 120.65 | 13.58 | 139.24 | 8.19 | 0.44 | 2.82 | 23.91 | |||||||||||||||||
| FFBW |
FFBW, Inc. | 27.44 | NA | 0.66 | 2.21 | NA | NA | 0.24 | 280.88 | NM | 82.50 | 22.64 | NA | NA | NA | NA | NM | |||||||||||||||||
| FCAP |
First Capital, Inc. | 10.43 | 9.84 | 1.12 | 10.30 | 1.08 | 9.96 | 0.30 | 213.13 | 12.55 | 126.95 | 13.23 | 135.47 | 13.00 | 1.04 | 2.46 | 30.27 | |||||||||||||||||
| FCCO |
First Community Corporation | 9.10 | 8.16 | 0.91 | 9.62 | 0.90 | 9.54 | 0.44 | 193.56 | 11.82 | 110.48 | 10.06 | 124.61 | 11.92 | 0.48 | 2.38 | 28.07 | |||||||||||||||||
| FXNC |
First National Corporation | 8.66 | 8.66 | 1.09 | 12.63 | 1.14 | 13.22 | 0.21 | 259.99 | 9.66 | 116.66 | 10.10 | 116.66 | 9.23 | 0.48 | 2.26 | 26.36 | |||||||||||||||||
| FSFG |
First Savings Financial Group, Inc. | 10.11 | NA | 2.35 | 25.15 | 2.26 | 24.19 | 0.91 | 102.77 | 4.90 | 109.50 | 11.07 | NA | 5.10 | 1.44 | 1.76 | 5.26 | |||||||||||||||||
| FUSB |
First US Bancshares, Inc. | 9.38 | 8.58 | 0.38 | 3.86 | 0.41 | 4.18 | 0.31 | 396.82 | 23.29 | 79.87 | 7.49 | 88.03 | 21.49 | 0.12 | 1.05 | 24.49 | |||||||||||||||||
| FNCB |
FNCB Bancorp, Inc. | 10.53 | 10.53 | 1.39 | 13.29 | 1.24 | 11.93 | 0.88 | 107.97 | 7.87 | 99.50 | 10.48 | 99.50 | 8.76 | 0.30 | 3.77 | 24.75 | |||||||||||||||||
| FRAF |
Franklin Financial Services Corporation | 9.01 | 8.51 | 1.16 | 12.80 | 1.15 | 12.63 | 1.09 | 82.67 | 7.71 | 92.74 | 8.35 | 98.63 | 7.81 | 1.28 | 4.04 | 29.93 | |||||||||||||||||
| FSBW |
FS Bancorp, Inc. | 10.88 | 10.61 | 2.12 | 19.81 | 2.14 | 20.02 | 0.28 | 432.01 | 6.62 | 116.23 | 12.64 | 119.55 | 6.56 | 0.56 | 1.66 | 10.02 | |||||||||||||||||
| GBNY |
Generations Bancorp NY, Inc. | 11.19 | 10.82 | 0.48 | 5.39 | 0.24 | 2.73 | NA | NA | 14.08 | 59.37 | 6.65 | 61.71 | 26.99 | NA | NA | NM | |||||||||||||||||
| GLBZ |
Glen Burnie Bancorp | 8.18 | 8.18 | 0.62 | 7.06 | 0.62 | 7.05 | 0.95 | 70.26 | 13.79 | 99.86 | 8.17 | 99.86 | 13.82 | 0.40 | 3.22 | 33.33 | |||||||||||||||||
| HFBL |
Home Federal Bancorp, Inc. of Louisiana | 9.32 | 9.32 | 0.99 | 10.46 | 0.99 | 10.46 | NA | NA | 11.78 | 117.58 | 10.96 | 117.58 | 11.78 | 0.40 | 2.16 | 22.13 | |||||||||||||||||
| HVBC |
HV Bancorp, Inc. | 7.55 | 7.55 | 1.13 | 18.27 | 1.13 | 18.27 | 0.55 | 74.69 | 6.58 | 114.63 | 8.66 | 114.63 | 6.58 | NA | NA | NM | |||||||||||||||||
| IROQ |
IF Bancorp, Inc. | 11.20 | 11.20 | 0.79 | 6.87 | 0.74 | 6.45 | 0.20 | 499.29 | 11.59 | 84.11 | 9.42 | 84.11 | 12.35 | 0.35 | 1.62 | 17.38 | |||||||||||||||||
| LCNB |
LCNB Corp. | 12.92 | 9.96 | 1.15 | 8.53 | 1.19 | 8.77 | 0.34 | 89.69 | 11.00 | 92.09 | 11.90 | 123.61 | 10.70 | 0.76 | 4.35 | 47.80 | |||||||||||||||||
| LMST |
Limestone Bancorp, Inc. | 9.26 | 8.69 | 0.93 | 10.61 | 0.95 | 10.79 | 0.14 | 658.18 | 10.52 | 105.80 | 9.80 | 113.46 | 10.34 | 0.00 | 0.00 | NM | |||||||||||||||||
| MNSB |
MainStreet Bancshares, Inc. | 10.52 | 10.52 | 1.55 | 15.43 | 1.55 | 15.43 | 0.07 | NM | 7.94 | 120.85 | 10.96 | 120.85 | 7.95 | NA | NA | NM | |||||||||||||||||
| MBIN |
Merchants Bancorp | 10.72 | 10.56 | 2.38 | 26.84 | 2.39 | 26.90 | NA | NA | 4.81 | 145.88 | 10.68 | 149.71 | 4.80 | 0.36 | 1.02 | 4.77 | |||||||||||||||||
| MBCN |
Middlefield Banc Corp. | 10.74 | 9.63 | 0.94 | 8.88 | 0.95 | 8.98 | 1.27 | 139.76 | 11.65 | 100.65 | 10.81 | 113.59 | 11.53 | 0.64 | 2.71 | 31.03 | |||||||||||||||||
| MSVB |
Mid-Southern Bancorp, Inc. | 19.71 | 19.71 | 0.53 | 2.53 | 0.53 | 2.53 | 0.74 | 92.80 | NM | 99.27 | 19.57 | 99.27 | NM | 0.12 | 0.78 | 26.19 | |||||||||||||||||
| MVBF |
MVB Financial Corp. | 9.12 | 8.89 | 1.50 | 15.09 | -0.03 | -0.31 | 0.78 | 146.36 | 13.75 | 188.21 | 17.12 | 193.51 | NM | 0.56 | 1.41 | 18.69 | |||||||||||||||||
| NKSH |
National Bankshares, Inc. | 11.51 | NA | 1.22 | 9.42 | 1.22 | 9.41 | 0.47 | 118.21 | 12.89 | 120.18 | 13.83 | NA | 12.91 | 1.40 | 3.76 | 49.13 | |||||||||||||||||
| NCBS |
Nicolet Bankshares, Inc. | 12.19 | 8.74 | 1.60 | 13.41 | 1.70 | 14.21 | 0.30 | 301.18 | 10.82 | 133.16 | 16.24 | 193.13 | 10.20 | NA | NA | NM | |||||||||||||||||
| NECB |
Northeast Community Bancorp, Inc. | 14.94 | 14.89 | 1.40 | 8.79 | NA | NA | 0.77 | 80.72 | 12.04 | 102.30 | 15.29 | 102.72 | NA | 0.24 | 2.38 | 15.21 | |||||||||||||||||
| OVLY |
Oak Valley Bancorp | 7.74 | 7.55 | 1.08 | 12.98 | 1.09 | 13.07 | 0.02 | NM | 9.05 | 111.23 | 8.61 | 114.32 | 8.98 | 0.29 | 1.57 | 14.22 | |||||||||||||||||
| OPOF |
Old Point Financial Corporation | 9.41 | 9.27 | 0.52 | 5.49 | 0.55 | 5.80 | 0.17 | 433.75 | 17.82 | 96.63 | 9.09 | 98.23 | 16.92 | 0.52 | 2.35 | 39.52 | |||||||||||||||||
| OPHC |
OptimumBank Holdings, Inc. | 9.92 | 9.92 | 0.29 | 4.02 | 0.29 | 4.02 | NA | NA | 24.25 | 90.39 | 6.39 | 90.39 | 24.25 | NA | NA | NM | |||||||||||||||||
| OBT |
Orange County Bancorp, Inc. | 6.87 | 6.54 | NA | NA | NA | NA | NA | NA | NA | 108.36 | 7.44 | 114.18 | NA | 0.80 | 2.35 | NA | |||||||||||||||||
| ORRF |
Orrstown Financial Services, Inc. | 9.13 | 8.39 | 1.21 | 13.95 | 1.27 | 14.67 | 0.37 | 179.57 | 7.64 | 99.40 | 9.08 | 109.04 | 7.27 | 0.76 | 3.24 | 23.45 | |||||||||||||||||
| PKBK |
Parke Bancorp, Inc. | 10.33 | 10.33 | 1.70 | 17.31 | 1.68 | 17.34 | 0.61 | 268.97 | 6.88 | 110.22 | 11.30 | 110.22 | 6.95 | 0.64 | 3.21 | 22.07 | |||||||||||||||||
| PTRS |
Partners Bancorp | 8.54 | 7.85 | 0.41 | 4.67 | 0.39 | 4.43 | 0.82 | 140.23 | 28.68 | 115.24 | 9.77 | 126.29 | 30.49 | 0.10 | 1.13 | 40.58 | |||||||||||||||||
| PBHC |
Pathfinder Bancorp, Inc. | 8.22 | 7.88 | 0.70 | 8.82 | 0.66 | 8.30 | 1.69 | 68.53 | 11.28 | 93.54 | 7.67 | 97.96 | 12.41 | 0.28 | 1.72 | 18.06 | |||||||||||||||||
| PBBK |
PB Bankshares, Inc. | 6.32 | 6.32 | NA | -0.69 | NA | 0.55 | 0.69 | 124.24 | NA | NA | NA | NA | NA | NA | NA | NA | |||||||||||||||||
| PCSB |
PCSB Financial Corporation | 14.64 | 14.36 | 0.68 | 4.55 | 0.68 | 4.54 | NA | NA | 22.14 | 106.84 | 15.65 | 109.33 | 22.19 | 0.24 | 1.29 | 23.81 | |||||||||||||||||
| PLBC |
Plumas Bancorp | 8.42 | 8.38 | 1.47 | 16.93 | 1.52 | 17.47 | 0.65 | 131.24 | 10.02 | 157.59 | 13.27 | 158.53 | 9.71 | 0.56 | 1.73 | 16.72 | |||||||||||||||||
| PVBC |
Provident Bancorp, Inc. | 14.61 | 14.61 | 1.00 | 6.26 | 1.10 | 6.83 | NA | NA | 19.61 | 129.75 | 18.96 | 129.75 | 17.99 | 0.16 | 0.97 | 16.67 | |||||||||||||||||
| RMBI |
Richmond Mutual Bancorporation, Inc. | 15.36 | 15.36 | 0.94 | 5.45 | 0.93 | 5.42 | 0.53 | 182.98 | 17.94 | 109.71 | 16.85 | 109.71 | 18.04 | 0.28 | 1.77 | 86.36 | |||||||||||||||||
| SAL |
Salisbury Bancorp, Inc. | 9.17 | 8.25 | 1.19 | 12.82 | 1.18 | 12.63 | 0.71 | 124.27 | 8.68 | 105.96 | 9.71 | 118.92 | 8.81 | 1.24 | 2.54 | 21.17 | |||||||||||||||||
| SBFG |
SB Financial Group, Inc. | 10.97 | 9.41 | 1.69 | 15.06 | 1.70 | 15.10 | 0.46 | 304.28 | 6.16 | 86.90 | 9.54 | 103.17 | 6.15 | 0.44 | 2.47 | 14.88 | |||||||||||||||||
| SMBK |
SmartFinancial, Inc. | 10.22 | 7.93 | 1.01 | 9.48 | 1.07 | 10.12 | 0.18 | 467.93 | 10.96 | 99.30 | 10.15 | 131.29 | 10.27 | 0.24 | 0.98 | 10.27 | |||||||||||||||||
| SFBC |
Sound Financial Bancorp, Inc. | 9.70 | 9.61 | 1.19 | 12.28 | 1.19 | 12.31 | 0.47 | 165.82 | 10.78 | 126.58 | 12.28 | 127.85 | 10.76 | 0.68 | 1.57 | 18.91 | |||||||||||||||||
| SBT |
Sterling Bancorp, Inc. (Southfield, MI) | 9.57 | 9.57 | -0.16 | -1.82 | -0.16 | -1.80 | 2.71 | 76.34 | NM | 79.79 | 7.64 | 79.79 | NM | 0.00 | 0.00 | NM | |||||||||||||||||
| TCBC |
TC Bancshares, Inc. | 10.12 | 10.12 | NA | 2.94 | NA | 5.05 | NA | NA | NA | NA | NA | NA | NA | NA | NA | NA | |||||||||||||||||
| TCBS |
Texas Community Bancshares, Inc. | 9.03 | 8.87 | NA | 1.91 | NA | 1.91 | 0.46 | 113.22 | NA | NA | NA | NA | NA | NA | NA | NA | |||||||||||||||||
| TCFC |
The Community Financial Corporation | 9.29 | 8.79 | 1.09 | 11.41 | 1.10 | 11.57 | 0.72 | 129.07 | 9.53 | 104.13 | 9.68 | 110.70 | 9.40 | 0.60 | 1.63 | 14.29 | |||||||||||||||||
| FLIC |
The First of Long Island Corporation | 10.14 | 10.13 | 1.06 | 10.82 | 1.06 | 10.84 | 0.02 | NM | 11.59 | 121.25 | 12.29 | 121.31 | 11.57 | 0.76 | 3.56 | 41.30 | |||||||||||||||||
| UBCP |
United Bancorp, Inc. | 9.50 | 9.34 | 1.25 | 13.09 | 1.12 | 11.69 | NA | NA | 9.58 | 126.00 | 11.97 | 128.44 | 10.79 | 0.59 | 4.03 | 44.28 | |||||||||||||||||
| VBFC |
Village Bank and Trust Financial Corp. | 8.22 | 8.22 | 1.76 | 23.73 | 1.83 | 24.77 | 1.12 | 42.54 | 5.51 | 116.88 | 9.60 | 116.88 | 5.28 | NA | NA | NM | |||||||||||||||||
| VABK |
Virginia National Bankshares Corporation | 8.59 | 7.71 | 0.55 | 6.09 | NA | NA | 0.09 | 513.67 | 17.12 | 127.75 | 10.97 | 143.57 | NA | 1.20 | 3.14 | 53.81 | |||||||||||||||||
| WMPN |
William Penn Bancorporation | 26.31 | 25.78 | 0.25 | 1.89 | 0.53 | 3.93 | 0.86 | 52.01 | NM | 86.42 | 22.73 | 88.84 | NM | 0.13 | 1.05 | 263.24 | |||||||||||||||||
| ABTX |
Allegiance Bancshares, Inc. | 12.12 | 8.76 | 1.19 | 9.61 | 1.25 | 10.11 | 0.78 | 100.74 | 10.50 | 96.05 | 11.65 | 138.01 | 9.98 | 0.48 | 1.28 | 12.89 | |||||||||||||||||
| AMAL |
Amalgamated Financial Corp. | 8.36 | 8.11 | 0.77 | 9.15 | 0.84 | 9.99 | 1.08 | 53.83 | 9.85 | 87.08 | 7.28 | 89.99 | 9.02 | 0.32 | 2.08 | 20.51 | |||||||||||||||||
| ASRV |
AmeriServ Financial, Inc. | 8.18 | 7.24 | 0.43 | 5.33 | 0.48 | 5.95 | NA | 315.32 | 11.75 | 57.70 | 4.72 | 65.86 | 10.50 | 0.10 | 2.66 | 31.25 | |||||||||||||||||
| AUBN |
Auburn National Bancorporation, Inc. | 10.23 | 10.23 | 0.86 | 7.74 | 0.88 | 7.95 | 0.06 | 813.22 | 14.76 | 115.03 | 11.77 | 115.03 | 14.37 | 1.04 | 3.02 | 44.42 | |||||||||||||||||
| BWFG |
Bankwell Financial Group, Inc. | 8.41 | 8.30 | 0.68 | 8.41 | 0.79 | 9.79 | 1.84 | 39.86 | 15.59 | 123.85 | 10.41 | 125.59 | 13.45 | 0.72 | 2.41 | 31.25 | |||||||||||||||||
| BCBP |
BCB Bancorp, Inc. | 8.93 | 8.76 | 1.08 | 12.47 | 0.86 | 9.90 | 1.21 | 107.90 | 8.76 | 111.13 | 9.02 | 113.80 | 11.16 | 0.64 | 4.22 | 33.53 | |||||||||||||||||
| CBFV |
CB Financial Services, Inc. | 9.07 | 8.07 | -0.82 | -8.39 | 0.64 | 6.63 | 1.07 | 74.92 | NM | 96.09 | 8.71 | 109.21 | 14.01 | 0.96 | 4.08 | NM | |||||||||||||||||
| CZWI |
Citizens Community Bancorp, Inc. | 9.57 | 7.62 | 1.04 | 10.85 | 1.10 | 11.50 | 1.16 | 85.03 | 8.86 | 90.71 | 8.68 | 116.40 | 8.36 | 0.23 | 1.65 | 14.65 | |||||||||||||||||
| CIZN |
Citizens Holding Company | 8.19 | 7.25 | 0.56 | 6.98 | 0.50 | 6.15 | NA | NA | 12.20 | 90.33 | 7.40 | 103.14 | 13.86 | 0.96 | 5.43 | 66.21 | |||||||||||||||||
| CVLY |
Codorus Valley Bancorp, Inc. | 8.91 | 8.81 | 0.72 | 7.91 | 0.76 | 8.39 | 1.84 | 53.62 | 14.11 | 109.07 | 9.72 | 110.47 | 13.30 | 0.44 | 1.97 | 31.01 | |||||||||||||||||
| CBAN |
Colony Bankcorp, Inc. | 8.37 | 7.42 | 0.95 | 11.84 | 0.99 | 12.33 | 1.25 | 59.57 | 10.04 | 116.20 | 9.72 | 132.35 | 9.64 | 0.41 | 2.28 | 22.77 | |||||||||||||||||
| CWBC |
Community West Bancshares | 8.98 | 8.85 | 1.19 | 13.46 | 1.19 | 13.46 | NA | NA | 9.82 | 123.72 | 11.11 | 125.73 | 9.82 | 0.28 | 2.04 | 17.86 | |||||||||||||||||
| EBMT |
Eagle Bancorp Montana, Inc. | 11.24 | 9.72 | 1.52 | 12.84 | 1.54 | 13.01 | 0.41 | 212.58 | 7.86 | 100.05 | 11.24 | 117.65 | 7.75 | 0.50 | 2.22 | 14.55 | |||||||||||||||||
| FDBC |
Fidelity D & D Bancorp, Inc. | 8.83 | 8.43 | 1.21 | 13.05 | NA | NA | 0.31 | 269.58 | 12.27 | 152.35 | 13.46 | 160.37 | NA | 1.20 | 2.29 | 28.04 | |||||||||||||||||
| FRBA |
First Bank | 10.42 | 9.76 | 1.31 | 12.80 | 1.27 | 12.43 | 0.43 | 225.44 | 8.63 | 103.43 | 10.78 | 111.28 | 8.89 | 0.12 | 0.90 | 7.74 | |||||||||||||||||
| FFWM |
First Foundation Inc. | 9.25 | 8.15 | 1.44 | 14.74 | 1.47 | 15.07 | NA | 114.62 | 10.67 | 147.89 | 13.67 | 169.73 | 10.44 | 0.36 | 1.49 | 14.98 | |||||||||||||||||
| FGBI |
First Guaranty Bancshares, Inc. | 7.81 | 7.19 | 0.90 | 12.07 | 0.49 | 6.55 | 0.51 | 211.45 | 8.25 | 102.90 | 6.88 | 114.46 | 15.33 | 0.64 | 3.34 | 20.69 | |||||||||||||||||
| FMBH |
First Mid Bancshares, Inc. | 10.64 | 8.43 | 0.83 | 7.15 | 1.04 | 9.05 | 0.65 | 179.54 | 16.83 | 119.52 | 12.72 | 154.52 | 13.36 | 0.88 | 2.16 | 42.98 | |||||||||||||||||
| FNWB |
First Northwest Bancorp | 10.55 | 10.55 | 0.84 | 7.33 | 0.70 | 6.12 | 0.20 | 401.32 | 12.76 | 101.37 | 10.70 | 101.37 | 15.25 | 0.24 | 1.28 | 16.33 | |||||||||||||||||
| GFED |
Guaranty Federal Bancshares, Inc. | 7.78 | 7.53 | 0.65 | 8.45 | 0.66 | 8.54 | 0.92 | 102.67 | 13.83 | 113.88 | 8.86 | 117.96 | 13.67 | 0.60 | 2.48 | 34.29 | |||||||||||||||||
| HIFS |
Hingham Institution for Savings | 11.02 | 11.02 | 2.47 | 23.38 | 1.88 | 17.73 | 0.04 | NM | 9.74 | 200.32 | 22.08 | 200.32 | 12.84 | 2.04 | 0.67 | 8.33 | |||||||||||||||||
| HMNF |
HMN Financial, Inc. | 11.00 | 10.93 | 1.53 | 13.83 | 1.53 | 13.84 | 0.19 | 536.82 | 7.46 | 98.91 | 10.88 | 99.67 | 7.46 | 0.00 | 0.00 | NM | |||||||||||||||||
| ISTR |
Investar Holding Corporation | 9.38 | 7.86 | 0.83 | 8.17 | 0.76 | 7.46 | 1.03 | 78.26 | 11.94 | 92.75 | 8.70 | 112.47 | 12.68 | 0.32 | 1.43 | 14.97 | |||||||||||||||||
| LARK |
Landmark Bancorp, Inc. | 10.58 | 9.30 | 1.79 | 17.10 | 1.68 | 16.07 | 1.29 | 61.97 | 6.15 | 99.28 | 10.51 | 114.57 | 6.54 | 0.80 | 2.90 | 17.59 | |||||||||||||||||
| MGYR |
Magyar Bancorp, Inc. | 7.27 | 7.27 | 0.70 | 8.52 | 0.62 | 7.54 | NA | NA | 14.03 | 122.42 | 8.90 | 122.42 | 15.85 | NA | NA | NM | |||||||||||||||||
| MLVF |
Malvern Bancorp, Inc. | 12.50 | 12.50 | 0.21 | 1.78 | NA | NA | 4.37 | 24.73 | NM | 95.73 | 11.96 | 95.73 | NA | 0.00 | 0.00 | NM | |||||||||||||||||
| MPB |
Mid Penn Bancorp, Inc. | 9.87 | 8.10 | 1.09 | 12.94 | 1.10 | 13.03 | 0.25 | 169.50 | 6.88 | 88.91 | 8.77 | 110.47 | 6.84 | 0.80 | 3.01 | 21.19 | |||||||||||||||||
| NBN |
Northeast Bank | 10.69 | 10.60 | 4.53 | 37.44 | 2.20 | 18.16 | NA | NA | 3.94 | 118.09 | 12.62 | 119.14 | 8.12 | 0.04 | 0.12 | 0.47 | |||||||||||||||||
| NWFL |
Norwood Financial Corp. | 9.90 | 8.56 | 1.16 | 11.27 | 1.18 | 11.49 | 0.24 | 389.34 | 9.52 | 103.81 | 10.28 | 121.88 | 9.33 | 1.04 | 4.11 | 38.72 | |||||||||||||||||
| OVBC |
Ohio Valley Banc Corp. | 11.27 | 10.74 | 1.13 | 9.87 | 1.13 | 9.86 | 0.90 | 60.99 | 9.59 | 92.16 | 10.39 | 97.33 | 9.59 | 0.84 | 3.13 | 30.00 | |||||||||||||||||
| OPBK |
OP Bancorp | 9.49 | NA | 1.36 | 13.07 | 1.34 | 12.96 | 0.05 | NM | 8.34 | 102.18 | 9.70 | 105.22 | 8.42 | 0.28 | 2.73 | 22.76 | |||||||||||||||||
| PNBK |
Patriot National Bancorp, Inc. | 6.84 | 6.66 | 0.04 | 0.63 | 0.29 | 4.13 | 3.17 | 35.33 | NM | 55.38 | 3.79 | 56.94 | 13.53 | 0.00 | 0.00 | NM | |||||||||||||||||
| PEBK |
Peoples Bancorp of North Carolina, Inc. | 9.09 | 9.09 | 1.02 | 10.84 | 0.97 | 10.23 | 0.21 | 274.93 | 10.76 | 112.26 | 10.20 | 112.26 | 11.41 | 0.68 | 2.41 | 24.43 | |||||||||||||||||
| FRST |
Primis Financial Corp. | 11.99 | 9.12 | 1.19 | 9.73 | 0.98 | 8.01 | 0.51 | 195.53 | 9.52 | 89.54 | 10.73 | 121.52 | 11.56 | 0.40 | 2.69 | 25.64 | |||||||||||||||||
| PBIP |
Prudential Bancorp, Inc. | 11.68 | 11.17 | 0.54 | 4.86 | 0.48 | 4.38 | 1.17 | 89.71 | 17.85 | 84.19 | 9.83 | 88.48 | 19.82 | 0.28 | 1.99 | 35.44 | |||||||||||||||||
| QCRH |
QCR Holdings, Inc. | 10.86 | 9.55 | 1.32 | 12.70 | 1.32 | 12.72 | 0.18 | 917.37 | 10.34 | 122.54 | 13.31 | 141.48 | 10.32 | 0.24 | 0.49 | 5.06 | |||||||||||||||||
| RNDB |
Randolph Bancorp, Inc. | 13.53 | 13.53 | 2.95 | 21.36 | 2.99 | 21.67 | 1.09 | 80.52 | 4.94 | 106.02 | 14.35 | 106.05 | 4.87 | NA | NA | NM | |||||||||||||||||
| FRBK |
Republic First Bancorp, Inc. | 5.96 | 5.88 | 0.36 | 5.35 | 0.44 | 6.59 | 0.24 | 133.68 | 17.00 | 73.58 | 3.76 | 74.85 | 12.26 | NA | NA | NM | |||||||||||||||||
| SFST |
Southern First Bancshares, Inc. | 9.50 | 9.50 | 1.26 | 13.79 | 1.26 | 13.79 | 0.44 | 368.07 | 12.43 | 155.26 | 14.74 | 155.26 | 12.43 | NA | NA | NM | |||||||||||||||||
| SMBC |
Southern Missouri Bancorp, Inc. | 10.50 | 9.85 | 1.79 | 17.69 | 1.81 | 17.86 | 0.42 | 364.68 | 8.52 | 139.70 | 14.66 | 149.89 | 8.44 | 0.80 | 1.80 | 12.84 | |||||||||||||||||
| SSBI |
Summit State Bank | 8.76 | 8.20 | 1.52 | 17.41 | 1.52 | 17.34 | 0.29 | 437.58 | 7.46 | 123.89 | 10.85 | 133.15 | 7.49 | 0.48 | 2.98 | 22.22 | |||||||||||||||||
| FBMS |
The First Bancshares, Inc. | 11.98 | 8.91 | 1.13 | 9.27 | 1.18 | 9.67 | 0.67 | 96.72 | 13.87 | 123.69 | 14.82 | 172.08 | 13.31 | 0.60 | 1.54 | 19.29 | |||||||||||||||||
| TSBK |
Timberland Bancorp, Inc. | 11.69 | 10.85 | 1.72 | 14.52 | 1.73 | 14.66 | 0.27 | 305.49 | 8.64 | 117.78 | 13.77 | 128.16 | 8.56 | 0.84 | 2.93 | 31.02 | |||||||||||||||||
| USCB |
U.S. Century Bank | 9.98 | 9.98 | 1.06 | 9.77 | 1.05 | 9.65 | 0.55 | 160.68 | NA | 87.54 | 7.55 | 87.54 | NA | NA | NA | NA | |||||||||||||||||
| UNB |
Union Bankshares, Inc. | 7.73 | 7.53 | 1.29 | 17.34 | 1.29 | 17.34 | 0.76 | 105.33 | 11.07 | 185.09 | 14.30 | 190.22 | 11.07 | 1.32 | 3.88 | 42.67 | |||||||||||||||||
| UBOH |
United Bancshares, Inc. | 11.03 | 8.48 | 1.37 | 12.42 | 1.38 | 12.53 | NA | 469.75 | 7.51 | 88.70 | 9.78 | 118.61 | 7.44 | 0.80 | 2.56 | 16.55 | |||||||||||||||||
| UNTY |
Unity Bancorp, Inc. | 9.57 | 9.46 | 1.63 | 17.18 | 1.60 | 16.95 | 0.54 | 214.82 | 8.27 | 129.13 | 12.35 | 130.75 | 8.38 | 0.36 | 1.54 | 11.66 | |||||||||||||||||
| VBTX |
Veritex Holdings, Inc. | 13.61 | 9.47 | 1.20 | 8.82 | 1.39 | 10.19 | 0.91 | 120.13 | 16.25 | 135.87 | 18.50 | 204.69 | 14.06 | 0.80 | 2.29 | 33.02 | |||||||||||||||||
| WVFC |
WVS Financial Corp. | 11.09 | 11.09 | 0.39 | 3.40 | 0.41 | 3.53 | NA | NA | 21.93 | 79.67 | 8.84 | 79.67 | 21.13 | 0.40 | 2.46 | 54.05 | |||||||||||||||||
| SRCE |
1st Source Corporation | 12.25 | 11.28 | 1.41 | 11.28 | 1.42 | 11.86 | 0.77 | 242.69 | 11.34 | 129.02 | 15.15 | 142.27 | 11.28 | 1.24 | 2.67 | 28.78 | |||||||||||||||||
| AMTB |
Amerant Bancorp Inc. | 10.61 | 10.35 | 0.51 | 4.92 | 0.51 | 4.93 | 1.61 | 86.25 | 23.34 | 113.97 | 12.10 | 117.19 | 23.33 | NA | NA | NM | |||||||||||||||||
| AMNB |
American National Bankshares Inc. | 10.86 | 8.27 | 1.27 | 11.25 | 1.32 | 11.71 | 0.09 | 729.74 | 9.46 | 102.96 | 11.18 | 139.14 | 9.08 | 1.08 | 3.28 | 31.03 | |||||||||||||||||
| ABCB |
Ameris Bancorp | 12.96 | 8.80 | 2.07 | 15.92 | 2.14 | 16.45 | 0.60 | 139.58 | 7.93 | 118.83 | 15.40 | 183.31 | 7.68 | 0.60 | 1.24 | 9.85 | |||||||||||||||||
| AROW |
Arrow Financial Corporation | 9.06 | 8.52 | 1.35 | 14.88 | 1.34 | 14.84 | 0.19 | 376.18 | 10.97 | 155.83 | 14.12 | 166.64 | 11.00 | 1.04 | 2.94 | 32.30 | |||||||||||||||||
| AUB |
Atlantic Union Bankshares Corporation | 13.75 | 9.27 | 1.32 | 9.71 | NA | NA | 0.26 | 239.14 | 11.79 | 113.18 | 14.74 | 183.08 | NA | 1.12 | 2.99 | 33.33 | |||||||||||||||||
| BANF |
BancFirst Corporation | 10.27 | 8.87 | 1.46 | 13.66 | 1.45 | 13.55 | 0.67 | 248.51 | 12.90 | 164.82 | 16.93 | 193.80 | 13.00 | 1.36 | 2.39 | 30.84 | |||||||||||||||||
| OZK |
Bank OZK | 16.93 | 14.78 | 1.97 | 12.36 | 1.97 | 12.35 | 0.24 | 449.57 | 10.32 | 121.00 | 20.48 | 142.23 | 10.33 | 1.14 | 2.71 | 27.46 | |||||||||||||||||
| BSVN |
Bank7 Corp. | 10.33 | 10.21 | 2.06 | 18.95 | 2.08 | 19.08 | 1.20 | 90.35 | 10.00 | 172.56 | 17.82 | 174.79 | 9.93 | 0.44 | 1.97 | 19.28 | |||||||||||||||||
| BFIN |
BankFinancial Corporation | 10.05 | 10.05 | 0.49 | 4.51 | 0.50 | 4.67 | 0.16 | 775.68 | 21.40 | 96.20 | 9.66 | 96.20 | 20.66 | 0.40 | 3.53 | 75.47 | |||||||||||||||||
| BANR |
Banner Corporation | 10.32 | 8.09 | 1.16 | 10.78 | 1.22 | 11.27 | 0.22 | 433.80 | 11.08 | 115.09 | 11.87 | 150.31 | 10.59 | 1.64 | 2.95 | 32.67 | |||||||||||||||||
| BCML |
BayCom Corp | 10.82 | 9.02 | 0.78 | 6.92 | 0.84 | 7.48 | 0.38 | 197.70 | 11.21 | 73.63 | 7.97 | 90.13 | 10.38 | NA | NA | NM | |||||||||||||||||
| BLFY |
Blue Foundry Bancorp | 7.95 | 7.95 | NA | -2.52 | NA | NA | NA | 125.07 | NA | 0.66 | 0.05 | 0.66 | NA | NA | NA | NA | |||||||||||||||||
| BOKF |
BOK Financial Corporation | 11.36 | 9.13 | 1.24 | 11.82 | 1.26 | 12.06 | 0.48 | 183.00 | 9.77 | 112.64 | 12.74 | 143.74 | 9.60 | 2.08 | 2.39 | 23.37 | |||||||||||||||||
| BRKL |
Brookline Bancorp, Inc. | 11.49 | 9.75 | 1.18 | 10.95 | 1.19 | 11.04 | 0.58 | 219.07 | 11.12 | 118.74 | 13.64 | 142.68 | 11.03 | 0.48 | 3.27 | 35.61 | |||||||||||||||||
| BFST |
Business First Bancshares, Inc. | 9.97 | 8.41 | 1.28 | 13.09 | 1.20 | 12.25 | 0.41 | 237.10 | 9.14 | 112.60 | 11.22 | 135.69 | 9.77 | 0.48 | 2.05 | 17.19 | |||||||||||||||||
| CFFI |
C&F Financial Corporation | 9.31 | 8.15 | 1.46 | 16.23 | 1.53 | 16.47 | 0.31 | 689.15 | 6.56 | 95.51 | 8.86 | 110.52 | 6.24 | 1.60 | 2.99 | 19.12 | |||||||||||||||||
| CALB |
California BanCorp | 7.69 | NA | 0.48 | 6.74 | 0.48 | 6.77 | 0.07 | NM | 15.84 | 101.59 | 7.81 | NA | 15.79 | NA | NA | NM | |||||||||||||||||
| CAC |
Camden National Corporation | 10.59 | 8.87 | 1.45 | 13.85 | 1.49 | 14.20 | 0.17 | 381.62 | 9.63 | 128.01 | 13.56 | 155.77 | 9.39 | 1.44 | 3.08 | 28.45 | |||||||||||||||||
| CBNK |
Capital Bancorp, Inc. | 8.23 | 8.23 | 1.93 | 23.22 | 1.92 | 23.13 | 0.56 | 276.17 | 8.98 | 184.89 | 15.23 | 184.89 | 9.01 | 0.20 | 0.84 | 1.89 | |||||||||||||||||
| CCBG |
Capital City Bank Group, Inc. | 8.90 | 6.73 | 1.23 | 13.04 | 0.98 | 10.95 | 0.38 | 157.25 | 11.10 | 116.00 | 9.76 | 160.64 | 15.22 | 0.60 | 2.60 | 28.37 | |||||||||||||||||
| CFFN |
Capitol Federal Financial, Inc. | 12.83 | 12.70 | 0.79 | 5.88 | 0.78 | 5.83 | NA | NA | 20.93 | 129.12 | 16.56 | 130.55 | 21.13 | 0.34 | 2.95 | 158.18 | |||||||||||||||||
| CSTR |
Capstar Financial Holdings, Inc. | 11.20 | 9.83 | 1.32 | 11.74 | 1.49 | 13.25 | 0.19 | 386.97 | 11.31 | 126.86 | 14.21 | 146.72 | 10.02 | 0.24 | 1.17 | 12.09 | |||||||||||||||||
| CARE |
Carter Bankshares, Inc. | 9.69 | 9.69 | -0.96 | -9.49 | 0.14 | 1.43 | 3.33 | 94.42 | NM | 78.58 | 7.61 | 78.58 | NM | 0.00 | 0.00 | NM | |||||||||||||||||
| CATY |
Cathay General Bancorp | 12.67 | 10.94 | 1.46 | 11.49 | 1.48 | 11.66 | 0.52 | 138.10 | 11.23 | 124.92 | 15.83 | 147.59 | 11.06 | 1.24 | 3.16 | 35.53 | |||||||||||||||||
| CBTX |
CBTX, Inc. | 13.68 | 11.84 | 0.97 | 7.01 | 0.97 | 7.01 | 1.30 | 70.47 | 16.96 | 116.31 | 15.91 | 137.23 | 16.96 | 0.52 | 1.97 | 29.49 | |||||||||||||||||
| CHMG |
Chemung Financial Corporation | 8.57 | 7.72 | 1.06 | 12.21 | 1.06 | 12.23 | 0.63 | 139.28 | 9.01 | 105.84 | 9.07 | 118.57 | 9.00 | 1.24 | 2.68 | 22.18 | |||||||||||||||||
| CHCO |
City Holding Company | 11.78 | 9.98 | 1.48 | 12.01 | 1.46 | 11.84 | 0.58 | 61.11 | 14.83 | 175.77 | 20.71 | 211.63 | 15.03 | 2.32 | 2.95 | 43.50 | |||||||||||||||||
| CCNE |
CNB Financial Corporation | 8.35 | 7.56 | 0.91 | 10.73 | 1.11 | 13.09 | 0.81 | 89.12 | 10.42 | 113.92 | 8.33 | 129.30 | 8.40 | 0.68 | 2.71 | 28.22 | |||||||||||||||||
| CCB |
Coastal Financial Corporation | 7.68 | 7.68 | 1.17 | 15.31 | 1.11 | 14.61 | 0.03 | NM | 16.72 | 230.65 | 17.71 | 230.65 | 17.51 | NA | NA | NM | |||||||||||||||||
| COLB |
Columbia Banking System, Inc. | 12.95 | 8.97 | 1.25 | 9.06 | 1.29 | 9.34 | 0.18 | 453.92 | 12.38 | 112.29 | 14.54 | 169.64 | 12.01 | 1.12 | 3.07 | 37.97 | |||||||||||||||||
| CBSH |
Commerce Bancshares, Inc. | 10.32 | 9.95 | 1.75 | 16.75 | 1.58 | 15.17 | 0.36 | 142.16 | 15.01 | 234.45 | 24.14 | 244.27 | 16.72 | 1.05 | 1.50 | 22.17 | |||||||||||||||||
| CTBI |
Community Trust Bancorp, Inc. | 12.45 | 11.39 | 1.55 | 12.28 | 1.54 | 12.20 | 1.56 | 52.28 | 9.12 | 107.91 | 13.44 | 119.34 | 9.18 | 1.60 | 3.86 | 34.25 | |||||||||||||||||
| CNOB |
ConnectOne Bancorp, Inc. | 12.52 | 9.97 | 1.54 | 12.61 | 1.55 | 12.70 | 1.16 | 88.18 | 10.15 | 121.00 | 15.14 | 156.38 | 10.08 | 0.44 | 1.50 | 13.84 | |||||||||||||||||
| CFB |
CrossFirst Bankshares, Inc. | 12.00 | 11.99 | 0.78 | 7.01 | 0.74 | 6.66 | NA | NA | 15.87 | 105.33 | 12.64 | 105.35 | 16.70 | NA | NA | NM |
| CVBF |
CVB Financial Corp. | 13.23 | 9.17 | 1.48 | 10.53 | 1.49 | 10.60 | 0.11 | 415.57 | 12.96 | 134.53 | 17.79 | 202.98 | 12.87 | 0.72 | 3.54 | 45.86 | |||||||||||||||||
| DCOM |
Dime Community Bancshares, Inc. | 9.48 | 8.29 | 0.56 | 5.67 | 1.08 | 10.96 | 0.23 | 322.48 | 24.83 | 125.71 | 10.86 | 148.21 | 10.85 | 0.96 | 2.89 | 69.95 | |||||||||||||||||
| EWBC |
East West Bancorp, Inc. | 9.27 | 8.55 | 1.39 | 14.29 | 1.39 | 14.26 | 0.62 | 172.00 | 13.53 | 182.71 | 16.93 | 199.64 | 13.56 | 1.32 | 1.85 | 23.96 | |||||||||||||||||
| EBC |
Eastern Bankshares, Inc. | 20.12 | 18.30 | 0.42 | 2.30 | 0.94 | 5.09 | 0.46 | 135.05 | NA | 106.37 | 21.41 | 119.64 | NA | 0.32 | 1.64 | NA | |||||||||||||||||
| EBTC |
Enterprise Bancorp, Inc. | 7.66 | 7.54 | 1.01 | 12.69 | 1.02 | 12.79 | 0.99 | 121.23 | 9.58 | 117.66 | 9.02 | 119.66 | 9.50 | 0.74 | 2.23 | 21.04 | |||||||||||||||||
| EFSC |
Enterprise Financial Services Corp | 10.81 | 8.32 | 1.22 | 11.27 | 1.37 | 12.62 | 0.42 | 324.97 | 11.79 | 127.24 | 13.75 | 169.93 | 10.51 | 0.76 | 1.67 | 18.86 | |||||||||||||||||
| EQBK |
Equity Bancshares, Inc. | 9.68 | 8.68 | -1.17 | -11.27 | 0.92 | 8.92 | 1.56 | 91.24 | NM | 110.36 | 10.68 | 124.43 | 12.39 | NA | NA | NM | |||||||||||||||||
| ESSA |
ESSA Bancorp, Inc. | 10.93 | 10.23 | 0.85 | 8.29 | 0.84 | 8.15 | 1.20 | 82.19 | 10.36 | 87.96 | 9.62 | 94.80 | 10.55 | 0.48 | 2.90 | 28.75 | |||||||||||||||||
| FITB |
Fifth Third Bancorp | 11.16 | 9.23 | 1.27 | 11.26 | 1.23 | 10.95 | 0.56 | 182.99 | 10.97 | 127.22 | 13.02 | 161.10 | 11.29 | 1.08 | 2.87 | 31.49 | |||||||||||||||||
| FISI |
Financial Institutions, Inc. | 9.20 | 7.91 | 1.33 | 14.38 | 1.34 | 14.52 | NA | NA | 7.60 | 105.00 | 9.35 | 124.71 | 7.52 | 1.08 | 3.47 | 25.85 | |||||||||||||||||
| FBNC |
First Bancorp | 11.03 | 8.38 | 1.41 | 11.78 | 1.44 | 11.99 | 0.51 | 158.52 | 11.44 | 131.92 | 14.55 | 178.73 | 11.24 | 0.80 | 1.91 | 20.77 | |||||||||||||||||
| BUSE |
First Busey Corporation | 10.84 | 8.00 | 1.18 | 9.89 | 1.32 | 11.10 | 0.27 | 315.48 | 10.25 | 98.71 | 10.70 | 138.03 | 9.13 | 0.92 | 3.90 | 39.57 | |||||||||||||||||
| FBIZ |
First Business Financial Services, Inc. | 7.73 | 7.35 | 1.10 | 13.61 | 1.10 | 13.61 | 0.41 | 223.69 | 8.69 | 110.95 | 8.57 | 117.05 | 8.69 | 0.72 | 2.53 | 21.49 | |||||||||||||||||
| FCNC.A |
First Citizens BancShares, Inc. | 8.11 | 7.48 | 1.14 | 13.82 | 1.05 | 12.66 | NA | NA | 14.80 | 201.10 | 15.17 | 221.19 | 16.21 | 1.88 | 0.22 | 3.28 | |||||||||||||||||
| FCBC |
First Community Bankshares, Inc. | 13.66 | 9.74 | 1.57 | 11.27 | 1.61 | 11.54 | 1.07 | 99.05 | 11.73 | 128.41 | 17.54 | 188.26 | 11.46 | 1.08 | 3.41 | 37.78 | |||||||||||||||||
| FFBC |
First Financial Bancorp. | 14.15 | 8.46 | 1.17 | 8.33 | 1.30 | 9.21 | 0.62 | 162.12 | 12.24 | 99.10 | 14.02 | 176.77 | 11.08 | 0.92 | 3.93 | 48.17 | |||||||||||||||||
| FFIN |
First Financial Bankshares, Inc. | 13.95 | 11.68 | 2.03 | 13.64 | 2.04 | 13.71 | 0.24 | 208.45 | 30.90 | 401.50 | 56.02 | 492.39 | 30.75 | 0.60 | 1.24 | 35.67 | |||||||||||||||||
| THFF |
First Financial Corporation | 12.37 | 10.75 | 1.30 | 9.81 | 1.31 | 9.89 | 0.42 | 237.73 | 9.30 | 89.98 | 11.13 | 105.54 | 9.23 | 1.06 | 2.61 | 24.31 | |||||||||||||||||
| FFNW |
First Financial Northwest, Inc. | 11.30 | 11.19 | 0.79 | 7.02 | 0.80 | 7.08 | 0.29 | 408.06 | 14.25 | 97.87 | 11.06 | 98.88 | 14.13 | 0.44 | 2.68 | 37.39 | |||||||||||||||||
| FHB |
First Hawaiian, Inc. | 11.26 | 7.47 | 1.18 | 10.00 | 1.20 | 10.13 | 0.19 | 371.16 | 13.12 | 128.86 | 14.52 | 202.76 | 12.94 | 1.04 | 3.81 | 50.00 | |||||||||||||||||
| INBK |
First Internet Bancorp | 8.53 | 8.39 | 1.01 | 12.99 | 0.96 | 12.36 | 0.27 | 274.70 | 6.97 | 83.09 | 7.09 | 84.64 | 7.32 | 0.24 | 0.79 | 5.53 | |||||||||||||||||
| FIBK |
First Interstate BancSystem, Inc. | 10.41 | 6.99 | 1.07 | 9.59 | 1.12 | 10.08 | 0.18 | 415.64 | 14.96 | 143.62 | 14.95 | 221.99 | 14.23 | 1.64 | 3.61 | 52.96 | |||||||||||||||||
| FRME |
First Merchants Corporation | 12.54 | 9.05 | 1.32 | 10.11 | 1.34 | 10.26 | 0.39 | 343.34 | 12.03 | 119.30 | 14.96 | 172.04 | 11.85 | 1.16 | 2.80 | 31.98 | |||||||||||||||||
| FUNC |
First United Corporation | 7.40 | 6.82 | 1.00 | 13.37 | 1.11 | 14.91 | 1.00 | 157.74 | 7.14 | 90.49 | 6.70 | 98.82 | 6.41 | 0.60 | 3.36 | 22.40 | |||||||||||||||||
| MYFW |
First Western Financial, Inc. | 8.36 | 7.24 | 1.35 | 17.11 | 1.37 | 17.38 | 0.16 | 402.31 | 8.13 | 128.50 | 10.74 | 150.18 | 8.01 | NA | NA | NM | |||||||||||||||||
| FSBC |
Five Star Bancorp | 9.38 | 9.38 | NA | 28.75 | NA | 29.19 | 0.02 | NM | 7.39 | 196.47 | 18.43 | 196.47 | 7.30 | 0.60 | 2.41 | 4.45 | |||||||||||||||||
| FFIC |
Flushing Financial Corporation | 8.03 | NA | 0.72 | 9.16 | 0.77 | 9.85 | 0.37 | 140.24 | 12.47 | 107.23 | 8.61 | 113.58 | 11.59 | 0.84 | 3.70 | 57.69 | |||||||||||||||||
| FULT |
Fulton Financial Corporation | 10.33 | 8.44 | 0.97 | 9.80 | 1.02 | 10.29 | NA | NA | 10.56 | 102.61 | 9.91 | 130.67 | 10.04 | 0.56 | 3.56 | 38.93 | |||||||||||||||||
| GABC |
German American Bancorp, Inc. | 12.13 | 9.96 | 1.56 | 12.75 | 1.59 | 13.00 | 0.34 | 228.62 | 12.77 | 155.68 | 18.89 | 194.41 | 12.53 | 0.84 | 2.21 | 27.52 | |||||||||||||||||
| GBCI |
Glacier Bancorp, Inc. | 11.49 | 8.98 | 1.71 | 13.82 | 1.76 | 14.24 | 0.40 | 186.15 | 16.07 | 217.07 | 24.94 | 285.55 | 15.59 | 1.28 | 2.39 | 41.44 | |||||||||||||||||
| GSBC |
Great Southern Bancorp, Inc. | 11.29 | 11.19 | 1.28 | 11.18 | 1.31 | 11.46 | 0.15 | 822.65 | 10.51 | 115.38 | 13.02 | 116.57 | 10.25 | 1.36 | 2.56 | 26.88 | |||||||||||||||||
| GNTY |
Guaranty Bancshares, Inc. | 9.81 | 8.73 | 1.51 | 15.07 | 1.52 | 15.24 | 0.46 | 240.31 | 9.84 | 140.43 | 13.78 | 159.71 | 9.74 | 0.80 | 2.39 | 22.43 | |||||||||||||||||
| HWC |
Hancock Whitney Corporation | 10.15 | 7.70 | 1.12 | 11.07 | 1.18 | 11.66 | 0.28 | 457.39 | 10.50 | 109.57 | 11.12 | 148.48 | 9.96 | 1.08 | 2.40 | 31.54 | |||||||||||||||||
| HAFC |
Hanmi Financial Corporation | 9.17 | 8.99 | 1.12 | 12.08 | 1.10 | 11.89 | 0.40 | 321.91 | 8.33 | 95.81 | 8.78 | 97.89 | 8.46 | 0.48 | 2.55 | 18.58 | |||||||||||||||||
| HONE |
HarborOne Bancorp, Inc. | 15.28 | 13.91 | 1.42 | 9.07 | 1.42 | 9.10 | 0.93 | 120.31 | 11.57 | 108.79 | 16.62 | 121.45 | 11.53 | 0.20 | 1.45 | 13.45 | |||||||||||||||||
| HWBK |
Hawthorn Bancshares, Inc. | 7.99 | 7.99 | 1.22 | 16.17 | 1.22 | 16.13 | 2.81 | 51.91 | 7.27 | 110.43 | 8.82 | 110.43 | 7.29 | 0.60 | 2.63 | 17.36 | |||||||||||||||||
| HBT |
HBT Financial, Inc. | 9.44 | 8.84 | 1.41 | 14.46 | 1.45 | 14.86 | 0.46 | 258.25 | 8.33 | 115.37 | 10.89 | 123.97 | 8.10 | 0.60 | 3.81 | 31.75 | |||||||||||||||||
| HTLF |
Heartland Financial USA, Inc. | 11.76 | 8.70 | 1.19 | 10.34 | 1.23 | 10.69 | 0.44 | 162.95 | 9.74 | 96.82 | 10.86 | 138.25 | 9.42 | 1.00 | 2.13 | 18.46 | |||||||||||||||||
| HTBK |
Heritage Commerce Corp | 11.50 | 8.18 | 0.90 | 7.40 | 0.95 | 7.82 | 0.11 | 816.42 | 15.79 | 117.32 | 13.49 | 171.08 | 14.94 | 0.52 | 4.57 | 72.22 | |||||||||||||||||
| HFWA |
Heritage Financial Corporation | 12.05 | 8.81 | 1.45 | 12.05 | 1.46 | 12.09 | NA | NA | 9.15 | 104.66 | 12.61 | 148.43 | 9.12 | 0.80 | 3.22 | 29.41 | |||||||||||||||||
| HBCP |
Home Bancorp, Inc. | 12.22 | 10.19 | 1.62 | 13.21 | 1.67 | 13.63 | 0.73 | 139.05 | 7.32 | 94.08 | 11.50 | 115.45 | 7.10 | 0.92 | 2.51 | 18.00 | |||||||||||||||||
| HOMB |
Home Bancshares, Inc. (Conway, AR) | 15.30 | 10.20 | 1.91 | 12.43 | 1.87 | 12.13 | 0.38 | 368.04 | 11.12 | 132.33 | 20.24 | 210.45 | 11.39 | 0.56 | 2.58 | 28.72 | |||||||||||||||||
| HMST |
HomeStreet, Inc. | 9.89 | 9.48 | 1.52 | 15.63 | 1.63 | 16.69 | NA | NA | 7.96 | 119.60 | 11.83 | 125.32 | 7.47 | 1.00 | 2.45 | 17.58 | |||||||||||||||||
| HTBI |
HomeTrust Bancshares, Inc. | 11.25 | 10.59 | 0.42 | 3.88 | 0.96 | 8.77 | 0.48 | 211.12 | 29.46 | 116.18 | 13.07 | 124.32 | 13.05 | 0.32 | 1.16 | 34.04 | |||||||||||||||||
| HOPE |
Hope Bancorp, Inc. | 11.98 | 9.53 | 0.92 | 7.62 | 0.92 | 7.66 | 1.02 | 116.68 | 11.02 | 82.08 | 9.83 | 106.08 | 10.97 | 0.56 | 4.03 | 44.44 | |||||||||||||||||
| HBNC |
Horizon Bancorp, Inc. | 11.63 | 9.06 | 1.43 | 12.32 | 1.47 | 12.66 | 0.39 | 249.30 | 9.47 | 112.48 | 13.08 | 148.52 | 9.21 | 0.52 | 2.86 | 26.04 | |||||||||||||||||
| HBAN |
Huntington Bancshares Incorporated | 11.72 | 8.80 | 0.91 | 8.36 | 1.13 | 10.40 | 0.89 | 145.12 | 15.22 | 123.41 | 12.65 | 180.83 | 12.15 | 0.60 | 4.07 | 61.86 | |||||||||||||||||
| INDB |
Independent Bank Corp. | 12.27 | 8.89 | 1.11 | 8.70 | 1.15 | 9.02 | 0.47 | 152.34 | 17.20 | 147.17 | 18.06 | 210.94 | 16.61 | 1.92 | 2.47 | 41.69 | |||||||||||||||||
| IBCP |
Independent Bank Corporation | 8.88 | 8.21 | 1.67 | 18.77 | 1.73 | 19.42 | 1.01 | 102.94 | 6.44 | 113.36 | 10.06 | 123.37 | 6.23 | 0.84 | 4.05 | 25.78 | |||||||||||||||||
| IBTX |
Independent Bank Group, Inc. | 13.78 | 8.45 | 1.35 | 9.50 | 1.41 | 9.93 | 0.29 | 294.88 | 12.78 | 118.93 | 16.39 | 206.15 | 12.23 | 1.36 | 1.94 | 22.99 | |||||||||||||||||
| IBOC |
International Bancshares Corporation | NA | NA | 1.66 | NA | 1.66 | 10.83 | NA | NA | 11.32 | 115.53 | NA | 131.82 | 11.44 | 1.20 | 2.88 | 46.20 | |||||||||||||||||
| KRNY |
Kearny Financial Corp. | 14.32 | NA | 0.86 | 5.79 | 0.90 | 6.03 | NA | NA | 16.95 | 98.81 | 14.15 | 125.98 | 16.29 | 0.40 | 3.07 | 48.05 | |||||||||||||||||
| LBAI |
Lakeland Bancorp, Inc. | 10.14 | 8.29 | 1.10 | 10.98 | 1.10 | 11.05 | 0.33 | 230.40 | 10.13 | 104.93 | 10.64 | 131.12 | 10.07 | 0.54 | 3.27 | 31.90 | |||||||||||||||||
| LKFN |
Lakeland Financial Corporation | 10.87 | 10.80 | 1.62 | 14.61 | 1.60 | 14.41 | 0.27 | 455.35 | 18.02 | 249.58 | 27.12 | 251.43 | 18.25 | 1.36 | 2.03 | 35.58 | |||||||||||||||||
| LEVL |
Level One Bancorp, Inc. | 8.99 | 7.58 | 1.18 | 13.79 | 1.18 | 13.90 | 0.58 | 159.73 | 7.52 | 103.05 | 8.38 | 127.24 | 7.46 | 0.24 | 0.88 | 6.06 | |||||||||||||||||
| LOB |
Live Oak Bancshares, Inc. | 7.97 | NA | 2.05 | 28.08 | 1.62 | 22.22 | 0.62 | 114.04 | 15.21 | 378.45 | 30.18 | NA | 19.18 | 0.12 | 0.21 | 3.17 | |||||||||||||||||
| LBC |
Luther Burbank Corporation | 8.80 | 8.76 | 0.88 | 10.08 | 1.00 | 11.41 | 0.03 | NM | 10.65 | 103.77 | 9.13 | 104.31 | 9.39 | 0.48 | 3.76 | 24.38 | |||||||||||||||||
| MCBC |
Macatawa Bank Corporation | 8.44 | 8.44 | 1.19 | 13.31 | 1.19 | 13.31 | 0.27 | 299.31 | 8.87 | 113.65 | 9.59 | 113.65 | 8.87 | 0.32 | 3.88 | 34.41 | |||||||||||||||||
| MBWM |
Mercantile Bank Corporation | 9.50 | 8.51 | 1.26 | 13.00 | 1.30 | 13.42 | 0.50 | 152.26 | 9.03 | 112.29 | 10.67 | 126.67 | 8.75 | 1.20 | 3.79 | 33.05 | |||||||||||||||||
| MRBK |
Meridian Corporation | 8.95 | 8.71 | 2.18 | 27.24 | 2.13 | 26.60 | 0.62 | 171.90 | 4.57 | 110.11 | 9.85 | 113.35 | 4.68 | 0.50 | 1.83 | 25.13 | |||||||||||||||||
| CASH |
Meta Financial Group, Inc. | 12.43 | 7.93 | 1.74 | 17.22 | 1.77 | 17.49 | NA | NA | 11.48 | 178.79 | 22.19 | 294.82 | 11.25 | 0.20 | 0.41 | 4.68 | |||||||||||||||||
| MCBS |
MetroCity Bankshares, Inc. | 10.50 | 10.10 | 2.39 | 19.03 | 2.39 | 19.03 | 0.56 | 147.82 | 11.68 | 202.40 | 21.24 | 211.32 | 11.68 | 0.48 | 2.30 | 22.91 | |||||||||||||||||
| MSBI |
Midland States Bancorp, Inc. | 9.78 | 7.12 | 0.70 | 7.47 | 1.01 | 10.79 | 1.16 | 95.73 | 12.38 | 87.63 | 8.57 | 123.92 | 10.16 | 1.12 | 4.41 | 54.02 | |||||||||||||||||
| MOFG |
MidWestOne Financial Group, Inc. | 9.22 | 7.86 | 0.65 | 6.90 | 1.18 | 12.58 | 0.76 | 112.21 | 13.20 | 88.98 | 8.21 | 105.94 | 7.26 | 0.90 | 3.04 | 39.96 | |||||||||||||||||
| NBTB |
NBT Bancorp Inc. | 10.58 | 8.28 | 1.35 | 12.65 | 1.40 | 13.20 | NA | NA | 10.65 | 128.76 | 13.63 | 168.84 | 10.20 | 1.12 | 3.09 | 31.96 | |||||||||||||||||
| NTRS |
Northern Trust Corporation | 6.86 | 6.42 | 0.86 | 11.11 | 0.90 | 11.61 | 0.08 | 119.96 | 19.56 | 218.34 | 13.93 | 235.81 | 18.68 | 2.80 | 2.44 | 47.78 | |||||||||||||||||
| NFBK |
Northfield Bancorp, Inc. (Staten Island, NY) | 13.88 | 13.21 | 1.09 | 7.98 | 1.17 | 8.55 | 0.29 | 251.12 | 13.62 | 111.24 | 15.44 | 117.74 | 12.72 | 0.52 | 3.16 | 39.67 | |||||||||||||||||
| NRIM |
Northrim BanCorp, Inc. | 9.67 | 9.07 | 1.94 | 18.84 | NA | NA | 0.75 | 114.87 | 5.95 | 104.37 | 10.09 | 111.94 | NA | 1.48 | 3.71 | 21.49 | |||||||||||||||||
| NWBI |
Northwest Bancshares, Inc. | 11.02 | 8.48 | 1.16 | 10.49 | 1.11 | 10.00 | 1.58 | 52.09 | 10.23 | 106.36 | 11.72 | 142.12 | 10.71 | 0.80 | 6.11 | 60.94 | |||||||||||||||||
| OCFC |
OceanFirst Financial Corp. | 13.14 | 9.01 | 0.79 | 6.14 | 0.71 | 5.52 | 0.37 | 128.30 | 14.50 | 87.16 | 11.08 | 135.91 | 16.24 | 0.68 | 3.21 | 46.58 | |||||||||||||||||
| ONB |
Old National Bancorp | 12.63 | 8.47 | 1.31 | 10.24 | 1.43 | 11.16 | 0.60 | 76.81 | 9.11 | 91.37 | 11.54 | 142.78 | 8.36 | 0.56 | 3.40 | 30.94 | |||||||||||||||||
| OSBC |
Old Second Bancorp, Inc. | 9.72 | 9.15 | 1.27 | 12.83 | 1.28 | 12.96 | 0.76 | 124.60 | 9.01 | 107.22 | 10.42 | 114.68 | 8.92 | 0.20 | 1.69 | 9.16 | |||||||||||||||||
| OBNK |
Origin Bancorp, Inc. | 9.47 | 9.09 | 1.17 | 12.91 | 1.14 | 12.58 | 0.55 | 220.14 | 11.35 | 137.96 | 13.06 | 144.25 | 11.65 | 0.52 | 1.29 | 12.92 | |||||||||||||||||
| PPBI |
Pacific Premier Bancorp, Inc. | 13.70 | 9.36 | 1.48 | 10.96 | 1.52 | 11.25 | NA | NA | 12.48 | 131.85 | 18.07 | 202.67 | 12.16 | 1.32 | 3.37 | 39.49 | |||||||||||||||||
| PACW |
PacWest Bancorp | 11.03 | 7.80 | 1.60 | 13.71 | 1.64 | 13.98 | 0.25 | 310.18 | 9.82 | 126.99 | 14.01 | 186.16 | 9.63 | 1.00 | 2.45 | 24.04 | |||||||||||||||||
| PCB |
PCB Bancorp | 11.60 | 11.57 | 1.39 | 11.79 | 1.39 | 11.79 | 0.10 | NM | 11.01 | 122.53 | 14.21 | 122.83 | 11.01 | 0.48 | 2.44 | 23.46 | |||||||||||||||||
| PGC |
Peapack-Gladstone Financial Corporation | 9.30 | 8.62 | 0.74 | 8.43 | 0.86 | 9.76 | 0.11 | NM | 14.49 | 115.54 | 10.74 | 125.61 | 12.51 | 0.20 | 0.61 | 8.77 | |||||||||||||||||
| PWOD |
Penns Woods Bancorp, Inc. | 8.80 | 7.95 | 0.83 | 9.48 | 0.77 | 8.73 | 0.77 | 99.68 | 10.81 | 100.19 | 8.82 | 112.06 | 11.68 | 1.28 | 5.41 | 58.45 | |||||||||||||||||
| PEBO |
Peoples Bancorp Inc. | 11.55 | 7.56 | 1.14 | 9.83 | 1.29 | 11.18 | 0.69 | 138.03 | 10.94 | 105.10 | 12.14 | 167.99 | 9.62 | 1.44 | 4.60 | 49.65 | |||||||||||||||||
| PFIS |
Peoples Financial Services Corp. | 10.84 | 8.89 | 1.20 | 10.89 | 1.18 | 10.69 | 0.28 | 323.95 | 9.58 | 101.07 | 10.95 | 125.90 | 9.75 | 1.52 | 3.33 | 31.09 | |||||||||||||||||
| PNFP |
Pinnacle Financial Partners, Inc. | 14.41 | 9.67 | 1.39 | 9.76 | 1.42 | 9.98 | 0.18 | 492.94 | 15.28 | 146.17 | 20.28 | 235.91 | 14.94 | 0.72 | 0.77 | 11.40 | |||||||||||||||||
| BPOP |
Popular, Inc. | 8.00 | 7.12 | 1.25 | 14.81 | 1.19 | 14.14 | 3.03 | 36.88 | 7.61 | 104.73 | 8.35 | 118.92 | 7.97 | 1.80 | 2.39 | 17.21 | |||||||||||||||||
| PFBC |
Preferred Bank | 10.02 | 10.01 | 1.55 | 15.27 | 1.56 | 15.38 | 0.82 | 139.85 | 11.21 | 162.32 | 16.27 | 162.52 | 11.13 | 1.52 | 2.51 | 25.14 | |||||||||||||||||
| PFC |
Premier Financial Corp. | 13.53 | 9.42 | 1.78 | 13.38 | 1.89 | 14.21 | 0.62 | 151.09 | 8.59 | 107.19 | 14.51 | 161.38 | 8.09 | 1.08 | 3.64 | 28.70 | |||||||||||||||||
| PFHD |
Professional Holding Corp. | 8.71 | 7.78 | 0.80 | 8.23 | 0.86 | 8.88 | 0.12 | 344.17 | 15.20 | 113.90 | 9.92 | 128.86 | 14.06 | NA | NA | NM | |||||||||||||||||
| PROV |
Provident Financial Holdings, Inc. | 10.75 | 10.75 | 0.64 | 6.05 | 0.48 | 4.51 | 0.81 | 79.48 | 17.30 | 102.50 | 11.02 | 102.50 | 23.22 | 0.56 | 3.24 | 56.00 | |||||||||||||||||
| RBB |
RBB Bancorp | 11.37 | 9.58 | 1.32 | 10.56 | 1.35 | 10.88 | 0.50 | 162.93 | 11.20 | 112.18 | 12.75 | 135.87 | 10.93 | 0.52 | 2.03 | 20.52 | |||||||||||||||||
| RRBI |
Red River Bancshares, Inc. | 10.18 | 10.13 | 1.17 | 10.85 | 1.16 | 10.75 | 0.18 | 474.17 | 12.01 | 125.72 | 12.79 | 126.38 | 12.11 | 0.28 | 0.55 | 6.18 |
| RNST |
Renasant Corporation | 13.75 | 8.21 | 1.05 | 7.42 | 1.14 | 8.01 | 0.53 | 216.79 | 12.34 | 89.32 | 12.28 | 159.34 | 11.44 | 0.88 | 2.52 | 31.10 | |||||||||||||||||
| RBCA.A |
Republic Bancorp, Inc. | 13.67 | 13.44 | 1.45 | 10.93 | 1.19 | 8.98 | 0.56 | 183.03 | 11.46 | 122.05 | 16.68 | 124.45 | 13.95 | 1.23 | 2.46 | 27.69 | |||||||||||||||||
| RVSB |
Riverview Bancorp, Inc. | 9.71 | 8.14 | 1.06 | 10.31 | 1.04 | 10.13 | 0.14 | 792.34 | 10.56 | 104.88 | 10.18 | 127.31 | 10.75 | 0.20 | 2.71 | 28.57 | |||||||||||||||||
| STBA |
S&T Bancorp, Inc. | 12.52 | 8.86 | 1.10 | 8.73 | 1.11 | 8.83 | 1.35 | 86.37 | 11.63 | 99.33 | 12.43 | 146.22 | 11.50 | 1.12 | 3.73 | 43.41 | |||||||||||||||||
| SASR |
Sandy Spring Bancorp, Inc. | 12.09 | 9.28 | 1.83 | 16.04 | 1.88 | 16.48 | 0.73 | 132.40 | 8.67 | 128.68 | 15.55 | 172.87 | 8.44 | 1.28 | 3.01 | 25.71 | |||||||||||||||||
| SBCF |
Seacoast Banking Corporation of Florida | 12.69 | 10.45 | 1.38 | 10.46 | 1.50 | 11.33 | 0.53 | 219.52 | 14.97 | 148.08 | 18.79 | 184.49 | 13.80 | 0.52 | 1.65 | 12.32 | |||||||||||||||||
| SHBI |
Shore Bancshares, Inc. | 9.37 | 8.55 | 0.80 | 7.73 | 0.83 | 8.09 | 0.49 | 146.70 | 13.61 | 102.27 | 9.58 | 113.08 | 13.01 | 0.48 | 2.78 | 37.80 | |||||||||||||||||
| BSRR |
Sierra Bancorp | 10.93 | 10.08 | 1.32 | 12.25 | 1.32 | 12.23 | 0.58 | 90.98 | 8.80 | 103.91 | 11.36 | 113.81 | 8.82 | 0.88 | 3.65 | 30.66 | |||||||||||||||||
| SBNY |
Signature Bank | 7.06 | 7.05 | 0.94 | 12.37 | 0.94 | 12.41 | 0.47 | 119.58 | 19.38 | 231.49 | 14.77 | 232.25 | 19.31 | 2.24 | 0.91 | 17.65 | |||||||||||||||||
| SFNC |
Simmons First National Corporation | 12.98 | 8.36 | 1.17 | 8.81 | 1.08 | 8.20 | 0.43 | 268.23 | 11.98 | 102.52 | 13.30 | 167.52 | 12.87 | 0.72 | 2.51 | 29.58 | |||||||||||||||||
| SPFI |
South Plains Financial, Inc. | 10.58 | 9.94 | 1.68 | 16.82 | 1.73 | 17.26 | 0.37 | 336.36 | 6.81 | 104.65 | 11.07 | 112.14 | 6.64 | 0.36 | 1.58 | 7.76 | |||||||||||||||||
| SSB |
South State Corporation | 11.78 | 7.84 | 1.11 | 9.20 | 1.46 | 12.13 | 0.26 | 349.64 | 11.46 | 101.68 | 11.98 | 159.58 | 8.69 | 1.96 | 2.85 | 31.67 | |||||||||||||||||
| SSBK |
Southern States Bancshares, Inc. | 9.93 | NA | 1.18 | 11.41 | NA | NA | NA | NA | 9.47 | 104.59 | NA | 120.00 | NA | NA | NA | NM | |||||||||||||||||
| SBSI |
Southside Bancshares, Inc. | 12.45 | 9.82 | 1.57 | 13.02 | 1.60 | 13.27 | 0.21 | 291.87 | 10.88 | 135.17 | 16.83 | 176.48 | 10.68 | 1.32 | 3.57 | 39.71 | |||||||||||||||||
| STXB |
Spirit of Texas Bancshares, Inc. | 12.25 | 9.71 | 1.38 | 11.56 | 1.46 | 12.22 | 0.26 | 213.47 | 9.29 | 101.73 | 12.46 | 131.94 | 8.79 | 0.48 | 2.14 | 19.09 | |||||||||||||||||
| SYBT |
Stock Yards Bancorp, Inc. | 10.69 | 8.57 | 1.26 | 13.00 | 1.59 | 16.35 | 0.22 | 463.24 | 20.01 | 210.83 | 22.55 | 269.48 | 16.12 | 1.12 | 2.17 | 42.25 | |||||||||||||||||
| SMMF |
Summit Financial Group, Inc. | 9.63 | 8.12 | 1.32 | 14.35 | 1.30 | 14.13 | 1.74 | 77.62 | 7.49 | 101.44 | 9.35 | 123.61 | 7.60 | 0.68 | 2.90 | 21.73 | |||||||||||||||||
| SIVB |
SVB Financial Group | 7.32 | 7.21 | 1.80 | 23.34 | 1.11 | 14.77 | 0.05 | 482.93 | 15.75 | 312.86 | 18.66 | 319.51 | 27.45 | 0.00 | 0.00 | NM | |||||||||||||||||
| TBNK |
Territorial Bancorp Inc. | 11.78 | 11.78 | 0.90 | 7.57 | 0.81 | 6.88 | 0.22 | 62.53 | 12.50 | 96.11 | 11.33 | 96.11 | 13.75 | 0.92 | 3.59 | 49.76 | |||||||||||||||||
| TCBI |
Texas Capital Bancshares, Inc. | 8.84 | 8.80 | 0.67 | 8.89 | 0.69 | 9.20 | 0.25 | 255.68 | 13.33 | 116.46 | 9.39 | 117.19 | 12.85 | NA | NA | NM | |||||||||||||||||
| TBBK |
The Bancorp, Inc. | 9.45 | 9.41 | 1.57 | 17.79 | 1.57 | 17.77 | NA | NA | 13.59 | 220.79 | 20.87 | 221.74 | 13.61 | NA | NA | NM | |||||||||||||||||
| BPRN |
The Bank of Princeton | 13.01 | 12.40 | 1.12 | 8.62 | 1.15 | 8.85 | 0.61 | 168.72 | 11.60 | 95.09 | 12.37 | 100.55 | 11.30 | 0.72 | 2.37 | 22.14 | |||||||||||||||||
| FNLC |
The First Bancorp, Inc. | 9.56 | 8.40 | 1.36 | 14.04 | 1.36 | 14.12 | 0.66 | 106.74 | 10.30 | 139.70 | 13.35 | 160.98 | 10.24 | 1.28 | 4.30 | 43.25 | |||||||||||||||||
| TOWN |
TowneBank | 11.83 | 8.98 | 1.57 | 13.17 | 1.46 | 12.31 | 0.16 | 493.61 | 10.52 | 119.17 | 13.99 | 162.53 | 11.46 | 0.80 | 2.63 | 25.61 | |||||||||||||||||
| TCBK |
TriCo Bancshares | 11.83 | 9.21 | 1.34 | 11.14 | 1.39 | 11.59 | 0.49 | 227.12 | 11.40 | 121.23 | 14.34 | 160.34 | 10.96 | 1.00 | 2.54 | 27.17 | |||||||||||||||||
| TSC |
TriState Capital Holdings, Inc. | 6.88 | 6.37 | 0.56 | 7.99 | 0.55 | 7.76 | 0.12 | 291.52 | 14.55 | 109.09 | 5.91 | 121.53 | 15.25 | NA | NA | NM | |||||||||||||||||
| TBK |
Triumph Bancorp, Inc. | 13.17 | 8.83 | 2.00 | 15.90 | 1.92 | 15.28 | 0.42 | 198.87 | 17.71 | 270.08 | 33.81 | 438.04 | 18.44 | NA | NA | NM | |||||||||||||||||
| TRST |
TrustCo Bank Corp NY | 9.45 | 9.44 | 0.96 | 9.95 | 0.96 | 9.95 | 0.53 | 156.14 | 11.21 | 109.18 | 10.32 | 109.28 | 11.21 | 1.36 | 4.16 | 46.60 | |||||||||||||||||
| TRMK |
Trustmark Corporation | 10.41 | 8.31 | 1.26 | 11.82 | 1.27 | 11.94 | 0.37 | 192.65 | 9.30 | 106.65 | 11.10 | 136.63 | 9.21 | 0.92 | 3.04 | 28.31 | |||||||||||||||||
| UMBF |
UMB Financial Corporation | 8.44 | 7.96 | 1.29 | 13.84 | 1.00 | 10.76 | 0.16 | 342.87 | 10.71 | 141.71 | 11.96 | 151.05 | 13.78 | 1.48 | 1.63 | 15.72 | |||||||||||||||||
| UMPQ |
Umpqua Holdings Corporation | 9.13 | NA | 1.69 | 18.96 | 1.69 | 19.03 | 0.11 | 829.42 | 8.64 | 156.40 | 14.29 | 162.27 | 8.60 | 0.84 | 4.28 | 37.00 | |||||||||||||||||
| UBSI |
United Bankshares, Inc. | 16.16 | 10.10 | 1.50 | 9.20 | 1.52 | 9.30 | 0.39 | 245.94 | 11.68 | 105.45 | 17.04 | 180.99 | 11.55 | 1.40 | 3.90 | 45.60 | |||||||||||||||||
| UCBI |
United Community Banks, Inc. | 11.04 | 9.19 | 1.40 | 12.51 | 1.45 | 12.96 | 0.46 | 128.75 | 10.72 | 129.79 | 13.74 | 161.03 | 10.33 | 0.80 | 2.68 | 27.34 | |||||||||||||||||
| UBFO |
United Security Bancshares | 9.61 | 9.28 | 0.73 | 6.99 | 0.74 | 7.03 | 1.33 | 78.79 | 17.00 | 117.27 | 11.28 | 121.89 | 16.89 | 0.44 | 5.39 | 91.67 | |||||||||||||||||
| UVSP |
Univest Financial Corporation | 11.64 | 9.15 | 1.53 | 14.09 | 1.56 | 14.38 | 0.59 | 190.19 | 8.20 | 108.27 | 12.60 | 141.71 | 8.04 | 0.80 | 2.94 | 24.10 | |||||||||||||||||
| VLY |
Valley National Bancorp | 11.48 | 8.31 | 1.08 | 9.62 | 1.12 | 9.97 | 0.70 | 119.44 | 12.24 | 117.48 | 12.95 | 171.43 | 11.80 | 0.44 | 3.36 | 41.12 | |||||||||||||||||
| WAFD |
Washington Federal, Inc. | 11.33 | 9.92 | 0.87 | 7.71 | 0.82 | 7.25 | 0.58 | 166.72 | 15.71 | 120.62 | 12.01 | 143.63 | 16.74 | 0.92 | 2.75 | 42.72 | |||||||||||||||||
| WASH |
Washington Trust Bancorp, Inc. | 9.36 | 8.27 | 1.29 | 14.11 | 1.35 | 14.73 | 0.33 | 220.16 | 12.17 | 165.38 | 15.48 | 189.51 | 11.66 | 2.08 | 3.98 | 48.14 | |||||||||||||||||
| WSBF |
Waterstone Financial, Inc. | 19.61 | 19.58 | 4.25 | 22.45 | 4.35 | 22.98 | 0.36 | 222.35 | 5.17 | 117.09 | 22.96 | 117.26 | 5.05 | 0.80 | 3.99 | 39.18 | |||||||||||||||||
| WSBC |
WesBanco, Inc. | 16.39 | 10.27 | 1.42 | 8.67 | 1.50 | 9.14 | 0.25 | 335.04 | 9.94 | 85.05 | 13.33 | 151.61 | 9.41 | 1.32 | 3.88 | 38.01 | |||||||||||||||||
| WTBA |
West Bancorporation, Inc. | 7.54 | 7.54 | 1.38 | 18.50 | 1.37 | 18.44 | 0.45 | 192.25 | 11.71 | 196.62 | 14.83 | 196.62 | 11.75 | 0.96 | 3.28 | 36.40 | |||||||||||||||||
| WABC |
Westamerica Bancorporation | 11.78 | 10.24 | 1.30 | 11.88 | 1.26 | 11.53 | 0.09 | 378.58 | 17.67 | 181.48 | 21.38 | 212.41 | 18.22 | 1.64 | 2.88 | 50.93 | |||||||||||||||||
| WNEB |
Western New England Bancorp, Inc. | 9.03 | 8.47 | 0.77 | 8.13 | 0.79 | 8.44 | NA | NA | 11.67 | 95.45 | 8.62 | 102.43 | 11.26 | 0.20 | 2.25 | 26.32 | |||||||||||||||||
| WTFC |
Wintrust Financial Corporation | 9.28 | 7.95 | 1.05 | 11.31 | NA | NA | 0.30 | 206.04 | 9.66 | 105.89 | 8.98 | 128.01 | NA | 1.24 | 1.70 | 16.05 | |||||||||||||||||
| WSFS |
WSFS Financial Corporation | 12.42 | 9.13 | 1.92 | 15.01 | 1.97 | 15.40 | 0.26 | 339.35 | 8.01 | 112.78 | 14.02 | 159.18 | 7.80 | 0.52 | 1.16 | 8.96 | |||||||||||||||||
| ZION |
Zions Bancorporation, National Association | 9.21 | 8.14 | 1.39 | 14.53 | 1.30 | 13.66 | 0.73 | 83.99 | 8.10 | 115.11 | 10.07 | 132.87 | 8.64 | 1.52 | 2.82 | 21.05 | |||||||||||||||||
| ASB |
Associated Banc-Corp | 12.03 | 8.92 | 0.86 | 7.29 | 1.00 | 8.44 | 0.62 | 168.62 | 11.52 | 83.00 | 9.36 | 119.53 | 9.84 | 0.80 | 3.86 | 41.11 | |||||||||||||||||
| AX |
Axos Financial, Inc. | 9.82 | 9.08 | 1.52 | 16.52 | 1.63 | 17.69 | NA | NA | 13.68 | 206.16 | 20.25 | 224.77 | 12.78 | NA | NA | NM | |||||||||||||||||
| BANC |
Banc of California, Inc. | 10.33 | 9.88 | 0.91 | 8.21 | 0.94 | 8.48 | 0.75 | 132.37 | 16.43 | 122.69 | 11.36 | 129.73 | 15.76 | 0.24 | 1.35 | 22.22 | |||||||||||||||||
| BXS |
BancorpSouth Bank | 11.12 | 7.73 | 1.22 | 10.64 | 1.25 | 10.93 | 0.31 | 384.92 | 10.15 | 106.35 | 11.25 | 163.29 | 9.86 | 0.80 | 2.81 | 27.50 | |||||||||||||||||
| BAC |
Bank of America Corporation | 9.15 | 6.96 | 0.97 | 10.17 | NA | NA | 0.30 | 156.21 | 13.50 | 135.06 | 11.40 | 187.78 | NA | 0.84 | 2.08 | 25.08 | |||||||||||||||||
| BOH |
Bank of Hawaii Corporation | 6.98 | 6.85 | 1.00 | 15.02 | 1.02 | 15.38 | 0.41 | 197.00 | 16.38 | 244.25 | 15.29 | 249.84 | 15.99 | 2.80 | 3.29 | 52.22 | |||||||||||||||||
| BKU |
BankUnited, Inc. | 8.86 | 8.65 | 1.01 | 11.89 | 0.97 | 11.45 | NA | NA | 10.91 | 120.97 | 10.71 | 124.08 | 11.35 | 0.92 | 2.24 | 24.47 | |||||||||||||||||
| BHLB |
Berkshire Hills Bancorp, Inc. | 9.58 | 9.34 | 0.57 | 6.14 | 0.69 | 7.52 | NA | NA | 18.26 | 110.53 | 10.59 | 113.64 | 14.92 | 0.48 | 1.86 | 42.55 | |||||||||||||||||
| BY |
Byline Bancorp, Inc. | 12.49 | NA | 1.16 | 9.42 | 1.24 | 10.11 | 0.56 | 192.49 | 12.89 | 118.07 | 14.58 | 160.41 | 11.99 | 0.36 | 1.44 | 13.92 | |||||||||||||||||
| COF |
Capital One Financial Corporation | 15.26 | 12.21 | 2.80 | 19.75 | 2.81 | 19.82 | 0.59 | 503.10 | 6.71 | 129.09 | 18.00 | 172.91 | 6.69 | 2.40 | 1.43 | 8.38 | |||||||||||||||||
| CPF |
Central Pacific Financial Corp. | 7.70 | 7.70 | 0.83 | 10.13 | 0.87 | 10.62 | 0.18 | 607.81 | 12.99 | 130.63 | 10.06 | 130.63 | 12.39 | 0.96 | 3.75 | 47.72 | |||||||||||||||||
| C |
Citigroup Inc. | 8.72 | 7.67 | 0.94 | 10.92 | 0.91 | 10.59 | 0.35 | 238.33 | 7.21 | 77.31 | 6.17 | 90.21 | 7.47 | 2.04 | 2.90 | 20.92 | |||||||||||||||||
| CFG |
Citizens Financial Group, Inc. | 12.53 | 9.04 | 1.12 | 8.97 | 1.16 | 9.31 | 0.84 | 126.45 | 9.45 | 85.16 | 9.85 | 128.11 | 9.09 | 1.56 | 3.68 | 34.82 | |||||||||||||||||
| CMA |
Comerica Incorporated | 8.98 | 8.30 | 1.31 | 14.03 | 1.30 | 13.92 | 0.41 | 181.62 | 9.19 | 126.65 | 10.85 | 138.58 | 9.26 | 2.72 | 3.82 | 35.05 | |||||||||||||||||
| CBU |
Community Bank System, Inc. | 13.93 | 8.73 | 1.35 | 9.20 | 1.45 | 9.89 | 0.49 | 71.97 | 21.19 | 194.00 | 27.02 | 328.18 | 19.72 | 1.72 | 2.32 | 48.29 | |||||||||||||||||
| CFR |
Cullen/Frost Bankers, Inc. | 9.37 | 8.07 | 0.99 | 9.91 | 1.00 | 10.04 | NA | NA | 17.68 | 171.69 | 15.59 | 203.22 | 17.45 | 3.00 | 2.63 | 45.12 | |||||||||||||||||
| CUBI |
Customers Bancorp, Inc. | 6.37 | 6.35 | 1.11 | 18.32 | 1.28 | 21.19 | NA | NA | 6.59 | 120.86 | 6.43 | 121.32 | 5.65 | NA | NA | 33.19 | |||||||||||||||||
| FNB |
F.N.B. Corporation | 13.11 | 7.55 | 0.93 | 7.06 | 1.03 | 7.83 | 0.51 | 192.55 | 10.79 | 74.14 | 9.54 | 139.54 | 9.70 | 0.48 | 4.20 | 45.28 | |||||||||||||||||
| FBK |
FB Financial Corporation | 11.51 | 9.52 | 1.25 | 11.01 | 1.54 | 13.57 | 0.69 | 208.15 | 14.37 | 139.42 | 16.05 | 172.36 | 11.38 | 0.44 | 1.09 | 14.95 | |||||||||||||||||
| FBP |
First BanCorp. | 10.32 | 10.01 | 1.14 | 9.43 | 1.37 | 11.36 | 2.92 | 58.90 | 12.95 | 121.99 | 12.40 | 126.31 | 10.72 | 0.28 | 2.23 | 26.80 | |||||||||||||||||
| FCF |
First Commonwealth Financial Corporation | 11.77 | 8.73 | 1.23 | 10.53 | 1.32 | 11.26 | 0.57 | 183.81 | 11.19 | 115.82 | 13.63 | 161.55 | 10.47 | 0.46 | 3.45 | 37.82 | |||||||||||||||||
| FHN |
First Horizon Corporation | 9.74 | 7.82 | 1.57 | 16.09 | NA | NA | 0.60 | 156.48 | 6.88 | 112.52 | 10.01 | 147.45 | NA | 0.60 | 3.79 | 26.09 | |||||||||||||||||
| FRC |
First Republic Bank | 8.21 | 8.08 | 0.88 | 10.83 | 0.89 | 10.87 | 0.09 | 441.42 | 28.00 | 308.96 | 21.56 | 315.32 | 27.91 | 0.88 | 0.45 | 12.09 | |||||||||||||||||
| GWB |
Great Western Bancorp, Inc. | 8.88 | 8.85 | 1.27 | 14.71 | 1.24 | 14.34 | 2.01 | 107.71 | 10.63 | 148.39 | 13.18 | 149.08 | 10.90 | 0.20 | 0.64 | 2.72 | |||||||||||||||||
| HTH |
Hilltop Holdings Inc. | 14.13 | 12.72 | 2.92 | 21.32 | NA | NA | 0.51 | 167.10 | 5.85 | 109.99 | 15.40 | 124.34 | NA | 0.48 | 1.43 | 7.87 | |||||||||||||||||
| JPM |
JPMorgan Chase & Co. | 7.77 | 6.50 | 1.36 | 17.42 | 1.35 | 17.23 | NA | NA | 10.32 | 182.34 | 12.66 | 227.25 | 10.44 | 3.60 | 2.33 | 24.02 | |||||||||||||||||
| KEY |
KeyCorp | 9.91 | 8.47 | 1.37 | 13.36 | 1.39 | 13.58 | 0.49 | 138.17 | 8.58 | 119.19 | 10.67 | 144.74 | 8.44 | 0.74 | 3.72 | 31.90 | |||||||||||||||||
| LC |
LendingClub Corporation | 17.44 | 14.30 | NA | NA | NA | NA | NA | NA | NA | 371.20 | 64.75 | 470.25 | NA | NA | NA | NA | |||||||||||||||||
| MTB |
M&T Bank Corporation | 11.10 | 8.30 | 1.20 | 10.73 | 1.21 | 10.80 | 1.64 | 64.86 | 10.43 | 112.88 | 11.69 | 160.67 | 10.36 | 4.40 | 3.24 | 33.82 | |||||||||||||||||
| MCB |
Metropolitan Bank Holding Corp. | 6.28 | 6.12 | 1.05 | 14.07 | 1.04 | 13.94 | 0.11 | 601.01 | 13.65 | 179.45 | 11.11 | 184.46 | 13.78 | NA | NA | NM | |||||||||||||||||
| NBHC |
National Bank Holdings Corporation | 11.94 | 10.41 | 1.58 | 12.92 | 1.59 | 13.01 | 0.43 | 190.59 | 10.88 | 134.44 | 16.05 | 156.91 | 10.80 | 0.88 | 2.38 | 25.00 | |||||||||||||||||
| NYCB |
New York Community Bancorp, Inc. | 12.03 | 8.16 | 1.08 | 8.86 | 0.96 | 7.91 | 0.10 | 429.79 | 10.17 | 89.27 | 10.05 | 143.59 | 11.52 | 0.68 | 5.52 | 56.20 | |||||||||||||||||
| OFG |
OFG Bancorp | 10.32 | 9.22 | 1.21 | 11.26 | 1.42 | 13.21 | 2.55 | 76.75 | 10.36 | 114.52 | 11.59 | 130.19 | 8.78 | 0.48 | 2.05 | 15.49 | |||||||||||||||||
| PB |
Prosperity Bancshares, Inc. | 17.48 | 9.18 | 1.55 | 8.63 | 1.58 | 8.79 | NA | NA | 12.27 | 103.52 | 18.10 | 216.93 | 12.05 | 1.96 | 2.79 | 34.21 | |||||||||||||||||
| PFS |
Provident Financial Services, Inc. | 12.69 | 9.51 | 1.26 | 9.98 | 1.23 | 9.80 | 0.79 | 79.32 | 10.37 | 101.57 | 12.89 | 140.46 | 10.42 | 0.92 | 4.20 | 43.60 | |||||||||||||||||
| RF |
Regions Financial Corporation | 11.73 | 8.62 | 1.75 | 14.37 | 1.73 | 14.25 | 0.80 | 129.94 | 7.92 | 115.22 | 12.42 | 169.13 | 7.99 | 0.68 | 3.39 | 25.10 | |||||||||||||||||
| SFBS |
ServisFirst Bancshares, Inc. | 8.13 | 8.03 | 1.64 | 19.66 | 1.63 | 19.73 | 0.11 | 821.46 | 19.75 | 360.24 | 29.26 | 364.92 | 19.78 | 0.80 | 1.12 | 21.47 | |||||||||||||||||
| SI |
Silvergate Capital Corporation | 7.08 | 7.08 | 0.84 | 10.48 | 0.84 | 10.48 | 0.07 | 82.47 | NM | 306.79 | 21.73 | 306.79 | NM | NA | NA | NM | |||||||||||||||||
| STT |
State Street Corporation | 7.71 | 4.92 | 0.83 | 9.25 | 0.93 | 10.37 | NA | NM | 13.71 | 127.52 | 9.11 | 216.98 | 12.15 | 2.28 | 2.65 | 42.20 | |||||||||||||||||
| SNV |
Synovus Financial Corp. | 9.53 | 8.71 | 1.14 | 12.00 | 1.27 | 13.36 | 0.53 | 189.44 | 10.86 | 132.54 | 11.45 | 148.17 | 9.70 | 1.32 | 3.12 | 33.85 | |||||||||||||||||
| BK |
The Bank of New York Mellon Corporation | 9.77 | 5.64 | 0.83 | 8.07 | 0.85 | 8.31 | 0.03 | 213.49 | 13.78 | 112.97 | 9.96 | 226.84 | 13.45 | 1.36 | 2.55 | 32.82 | |||||||||||||||||
| PNC |
The PNC Financial Services Group, Inc. | 9.87 | 7.95 | 1.25 | 11.10 | NA | NA | 0.64 | 163.62 | 14.10 | 154.53 | 14.34 | 199.47 | NA | 5.00 | 2.69 | 35.66 |
| TFC |
Truist Financial Corporation | 13.09 | 8.34 | 1.10 | 8.05 | 1.34 | 9.81 | NA | NA | 14.51 | 120.31 | 14.40 | 214.26 | 11.77 | 1.92 | 3.45 | 47.78 | |||||||||||||||||
| USB |
U.S. Bancorp | 9.60 | 7.86 | 1.35 | 13.81 | 1.37 | 14.12 | 0.58 | 188.43 | 11.92 | 175.38 | 14.95 | 226.11 | 11.79 | 1.68 | 3.02 | 35.97 | |||||||||||||||||
| WBS |
Webster Financial Corporation | 9.86 | 8.35 | 1.00 | 10.19 | NA | NA | 0.72 | 128.07 | 13.64 | 138.54 | 13.13 | 168.00 | NA | 1.60 | 3.29 | 44.82 | |||||||||||||||||
| WFC |
Wells Fargo & Company | 9.92 | 8.66 | 0.94 | 9.71 | 0.72 | 7.50 | 0.66 | 118.67 | 12.61 | 114.29 | 10.13 | 135.73 | 17.23 | 0.80 | 1.69 | 13.30 | |||||||||||||||||
| WAL |
Western Alliance Bancorporation | 8.22 | 7.07 | 1.91 | 21.63 | 1.88 | 21.28 | 0.25 | 193.12 | 12.92 | 245.69 | 20.20 | 289.51 | 13.14 | 1.40 | 1.47 | 14.95 | |||||||||||||||||
| BHB |
Bar Harbor Bankshares | 11.42 | 8.22 | 0.95 | 8.69 | 1.03 | 9.45 | NA | NA | 11.26 | 96.16 | 10.98 | 138.32 | 10.35 | 0.96 | 3.60 | 38.82 | |||||||||||||||||
| BRBS |
Blue Ridge Bankshares, Inc. | 9.65 | 8.46 | 1.95 | 27.27 | NA | NA | NA | NA | 5.82 | 124.40 | 12.00 | 143.83 | NA | 0.48 | 2.70 | 13.40 | |||||||||||||||||
| EVBN |
Evans Bancorp, Inc. | 8.13 | NA | 1.04 | 12.97 | 1.03 | 12.82 | 1.32 | 69.81 | 9.67 | 119.57 | 9.72 | NA | 9.78 | 1.20 | 3.11 | 30.08 | |||||||||||||||||
| PRK |
Park National Corporation | 10.75 | 9.22 | 1.65 | 15.19 | 1.66 | 15.28 | 1.19 | 73.20 | 12.44 | 182.94 | 19.67 | 217.01 | 12.38 | 4.12 | 3.44 | 34.10 | |||||||||||||||||
| TMP |
Tompkins Financial Corporation | 9.12 | 8.01 | 1.24 | 13.49 | 1.26 | 13.66 | NA | NA | 12.31 | 163.26 | 14.86 | 188.02 | 12.18 | 2.16 | 2.70 | 33.23 | |||||||||||||||||
| WFCL |
1867 Western Financial Corporation | 16.26 | 15.54 | 3.07 | 18.86 | 1.15 | 7.08 | 0.28 | 592.46 | 5.98 | 104.14 | 16.94 | 109.97 | 15.93 | 106.00 | 1.33 | 6.95 | |||||||||||||||||
| FCOB |
1st Colonial Bancorp, Inc. | 8.09 | 8.09 | 1.08 | 13.16 | NA | NA | NA | NA | 6.99 | 84.13 | 6.81 | 84.13 | NA | NA | NA | NM | |||||||||||||||||
| FSMK |
1ST SUMMIT BANCORP of Johnstown, Inc. | 9.36 | 9.33 | 0.88 | 8.85 | 0.76 | 7.61 | 0.21 | 239.85 | NA | 116.09 | NA | 116.45 | NA | 3.28 | 0.00 | NA | |||||||||||||||||
| ABTO |
AB&T Financial Corp. | 7.17 | 7.17 | 0.60 | 7.63 | 0.61 | 7.72 | 0.54 | 150.23 | 26.18 | NA | NA | NA | 25.86 | 0.01 | 0.57 | NA | |||||||||||||||||
| ASCN |
Absecon Bancorp | 9.85 | 9.85 | 0.53 | 4.95 | 0.53 | 4.95 | 0.18 | 343.67 | 11.85 | 59.92 | 5.90 | 59.92 | 11.85 | 2.00 | 2.35 | 69.73 | |||||||||||||||||
| AFBA |
Allied First Bancorp, Inc. | 10.59 | NA | NA | NA | NA | NA | NA | NA | NA | NA | NA | NA | NA | NA | NA | NA | |||||||||||||||||
| AMFC |
AMB Financial Corp. | 8.99 | 8.99 | 1.53 | 18.02 | 1.53 | 17.97 | 0.32 | 295.29 | 5.06 | 82.62 | 7.43 | 82.62 | 5.07 | 0.00 | 0.00 | NM | |||||||||||||||||
| AMBK |
American Bank Incorporated | NA | NA | 1.34 | NA | NA | NA | NA | NA | 9.87 | NA | NA | NA | NA | 0.48 | 3.10 | 35.67 | |||||||||||||||||
| ANDC |
Andover Bancorp, Inc. | 8.62 | NA | 1.00 | 11.15 | 1.00 | 11.15 | NA | NA | NA | NA | NA | NA | NA | 0.74 | 4.11 | NA | |||||||||||||||||
| APLO |
Apollo Bancorp, Inc. | 12.60 | 12.60 | 1.14 | 8.73 | 1.14 | 8.73 | NA | NA | 11.23 | 96.80 | 12.20 | 96.80 | 11.23 | 2.12 | 5.05 | 56.42 | |||||||||||||||||
| AVBH |
Avidbank Holdings, Inc. | 8.24 | 8.24 | 0.76 | 8.83 | 0.72 | 8.38 | 0.21 | 377.57 | 12.35 | 108.68 | 8.96 | 108.68 | 13.02 | NA | NA | NM | |||||||||||||||||
| BBBK |
Baker Boyer Bancorp | 7.76 | 7.76 | 0.67 | 7.97 | 0.67 | 7.95 | 0.31 | 258.49 | 18.41 | 147.66 | 11.46 | 147.66 | NA | 3.28 | 4.79 | 87.63 | |||||||||||||||||
| BSPA |
Ballston Spa Bancorp, Inc. | 6.34 | 6.14 | 0.75 | 11.39 | NA | NA | NA | NA | 7.89 | 85.59 | 5.42 | 88.66 | NA | 1.32 | 2.49 | 19.61 | |||||||||||||||||
| BAFI |
Bancaffiliated Inc. | 11.23 | 9.07 | 1.09 | 9.01 | 1.09 | 9.01 | 0.21 | 360.87 | NA | NA | NA | NA | NA | NA | NA | NA | |||||||||||||||||
| BCSO |
Bancorp. of Southern Indiana | 9.22 | 8.76 | 1.21 | 13.10 | NA | NA | NA | NA | 6.67 | 86.43 | NA | 91.66 | NA | 1.30 | 3.10 | 24.94 | |||||||||||||||||
| BORT |
Bank of Botetourt | 8.81 | 8.81 | 0.98 | 11.04 | 0.97 | 10.90 | 0.42 | 216.33 | 8.83 | 93.50 | 8.24 | 93.50 | 8.94 | 0.72 | 2.36 | 20.66 | |||||||||||||||||
| BHDB |
Bank of Labor Bancshares, Inc. | 6.20 | 6.20 | 0.69 | 9.49 | NA | NA | 0.33 | 354.58 | NA | NA | NA | NA | NA | 4.00 | 0.00 | NA | |||||||||||||||||
| BSSC |
Bank of Southside Virginia Corporation, The | 22.28 | NA | NA | NA | NA | NA | NA | NA | NA | NA | NA | NA | NA | 0.00 | 0.00 | NA | |||||||||||||||||
| BKUT |
Bank of Utica | 19.28 | 19.28 | 3.90 | 20.49 | 0.98 | 5.13 | 0.21 | 54.42 | 2.80 | 51.74 | 9.97 | 51.74 | 11.16 | 16.50 | 2.87 | 8.03 | |||||||||||||||||
| BKGM |
BankGuam Holding Company | 5.75 | 5.73 | 0.62 | 9.14 | 0.55 | 8.03 | 2.11 | 58.50 | 8.01 | 76.58 | 4.16 | 76.96 | 9.17 | 0.40 | 3.20 | 19.23 | |||||||||||||||||
| CBOB.A |
Bay Community Bancorp | 8.23 | 8.20 | 1.01 | 11.18 | 0.80 | 8.84 | 0.02 | NM | 10.26 | 107.53 | 8.85 | 107.89 | NA | 0.16 | 2.00 | 10.26 | |||||||||||||||||
| BMBN |
Benchmark Bankshares, Inc. | 8.22 | 8.22 | 1.25 | 14.58 | 1.25 | 14.58 | NA | NA | 9.59 | 132.24 | 10.86 | 132.24 | 9.59 | 0.66 | 2.81 | 26.94 | |||||||||||||||||
| BTOF |
Benton Financial Corporation | 13.04 | 13.04 | 1.21 | 8.82 | 1.13 | 8.30 | 0.40 | 237.19 | NA | 71.20 | NA | 71.20 | NA | 0.00 | 0.00 | NA | |||||||||||||||||
| BEOB |
BEO Bancorp | 6.02 | 5.85 | 0.90 | 14.97 | NA | NA | NA | NA | 7.30 | 99.95 | 6.02 | 103.05 | NA | 0.95 | 2.62 | 19.14 | |||||||||||||||||
| BLHK |
blueharbor bank | 9.63 | 9.63 | 1.23 | 11.33 | 1.23 | 11.33 | 0.20 | NM | 9.83 | 102.11 | 9.83 | 102.11 | 9.83 | 0.40 | 3.06 | 7.52 | |||||||||||||||||
| BOLB |
BOL Bancshares Inc. | 8.93 | 8.93 | 1.17 | 13.16 | -0.24 | -2.71 | 5.91 | 70.34 | 2.17 | 34.97 | 2.48 | 34.97 | NM | NA | NA | NM | |||||||||||||||||
| BYLB |
Boyle Bancorp, Inc. | 8.65 | 8.29 | NA | NA | NA | NA | 0.85 | 88.86 | NA | 104.27 | 9.02 | 109.23 | NA | 2.80 | 3.31 | NA | |||||||||||||||||
| BRBW |
Brunswick Bancorp | 11.71 | 11.71 | 1.06 | 8.27 | 0.51 | 4.02 | NA | NA | 10.02 | 80.96 | 9.48 | 80.96 | 20.55 | 0.00 | 0.00 | 20.49 | |||||||||||||||||
| BHRB |
Burke & Herbert Bank & Trust Company | 10.99 | 10.99 | 0.98 | 8.77 | 0.98 | 8.77 | 0.91 | 104.32 | 11.94 | 101.30 | 11.13 | 101.30 | NA | 80.00 | 3.75 | 44.79 | |||||||||||||||||
| CABB |
California Business Bank | 12.01 | 12.00 | -0.20 | -1.65 | -0.20 | -1.65 | 0.06 | NM | NA | NA | NA | NA | NA | NA | NA | NA | |||||||||||||||||
| CAIB |
California International Bank, N.A. | 14.21 | 14.21 | -2.00 | -11.73 | -2.00 | -11.73 | 0.00 | NM | NA | NA | NA | NA | NA | NA | NA | NA | |||||||||||||||||
| CNND |
Canandaigua National Corporation | 7.85 | NA | 1.26 | 15.91 | NA | NA | NA | NA | 10.95 | 163.40 | 12.83 | 176.47 | NA | 8.00 | 2.95 | 30.70 | |||||||||||||||||
| CSKL |
Catskill Hudson Bancorp, Inc. | 4.70 | NA | 0.21 | 4.38 | 0.15 | 3.08 | NA | NA | 16.55 | NA | NA | NA | 23.55 | 0.44 | 1.65 | 27.33 | |||||||||||||||||
| CBHC |
CBC Holding Company | 10.22 | 9.54 | 1.08 | 9.12 | 1.08 | 9.12 | 0.73 | 229.60 | NA | 62.93 | 6.41 | 67.93 | NA | 0.60 | 2.55 | NA | |||||||||||||||||
| CBOF |
CBOA Financial, Inc. | 8.03 | 8.03 | 1.10 | 15.40 | 1.31 | 18.28 | NA | NA | 7.14 | 94.88 | 7.62 | 94.88 | 5.95 | NA | NA | NM | |||||||||||||||||
| CCYY |
CCCB Bancorp, Inc. | 8.99 | 8.99 | NA | NA | NA | NA | 0.62 | 115.08 | NA | 82.57 | 7.43 | 82.57 | NA | 0.18 | 2.00 | NA | |||||||||||||||||
| CCFN |
CCFNB Bancorp, Inc. | 11.76 | 10.98 | 1.17 | 9.37 | 1.15 | 9.21 | 0.48 | 211.80 | 10.87 | 100.38 | 11.81 | 108.55 | 11.06 | 1.64 | 3.22 | 66.52 | |||||||||||||||||
| CCFC |
CCSB Financial Corp. | 7.96 | 7.96 | 0.59 | 6.85 | 0.59 | 6.85 | 0.00 | NM | NA | NA | NA | NA | NA | 0.40 | 2.35 | NA | |||||||||||||||||
| CBCY.B |
Central Bancompany, Inc. | 12.53 | 10.80 | 1.43 | 10.98 | 1.44 | 11.08 | 0.24 | 422.46 | 10.42 | 110.14 | 13.80 | 130.37 | 10.33 | 7.00 | 1.18 | 18.31 | |||||||||||||||||
| CBSU |
Central Bank Corporation | 10.38 | NA | NA | NA | NA | NA | NA | NA | NA | NA | NA | NA | NA | 0.00 | 0.00 | NA | |||||||||||||||||
| CFCX |
Centric Financial Corporation | 8.28 | 8.24 | 1.15 | 14.63 | NA | NA | 0.93 | 106.91 | 6.68 | 89.84 | 7.44 | 90.32 | NA | NA | NA | NM | |||||||||||||||||
| CYFL |
Century Financial Corporation | 10.63 | 10.63 | 1.28 | 11.80 | 1.27 | 11.69 | 0.45 | 172.14 | 8.59 | 98.07 | 10.42 | 98.07 | 8.67 | 0.80 | 3.17 | 26.90 | |||||||||||||||||
| CNBA |
Chester Bancorp, Inc. | 11.35 | NA | NA | NA | NA | NA | NA | NA | NA | 501.72 | 56.95 | NA | NA | 0.80 | 1.48 | NA | |||||||||||||||||
| CCBC |
Chino Commercial Bancorp | 8.04 | 8.04 | 0.95 | 11.72 | 0.95 | 11.72 | NA | NA | 11.40 | 122.97 | 9.89 | 122.97 | 11.40 | NA | NA | NM | |||||||||||||||||
| CZBC |
Citizens Bancorp | 9.50 | 9.50 | 1.01 | 10.46 | 1.01 | 10.46 | NA | NA | 9.86 | NA | NA | NA | NA | 0.36 | 2.14 | 21.05 | |||||||||||||||||
| CZBT |
Citizens Bancorp of Virginia, Inc. | 11.02 | 11.02 | 1.09 | 8.83 | 1.09 | 8.83 | 0.83 | 172.04 | 11.76 | 103.41 | 11.39 | 103.41 | 11.77 | 1.00 | 3.57 | 40.76 | |||||||||||||||||
| CZBS |
Citizens Bancshares Corporation | 8.43 | 8.37 | 1.00 | 10.64 | NA | NA | 0.84 | 62.75 | NA | 40.77 | NA | 41.06 | NA | 0.40 | 3.75 | NA | |||||||||||||||||
| CCVS |
Citizens Commerce Bancshares, Inc. | 9.50 | 9.50 | 0.94 | 9.66 | 0.94 | 9.58 | 0.28 | 637.89 | NA | NA | NA | NA | NA | 0.20 | 2.50 | NA | |||||||||||||||||
| CIWV |
Citizens Financial Corp. | 9.50 | 9.36 | 1.53 | 15.52 | 1.52 | 15.52 | 0.81 | 340.04 | NA | 104.05 | NA | 105.87 | NA | 0.68 | 3.63 | NA | |||||||||||||||||
| CZFS |
Citizens Financial Services, Inc. | 10.20 | 8.75 | 1.59 | 15.71 | 1.52 | 15.06 | 0.90 | 103.83 | 8.07 | 119.85 | 12.23 | 142.03 | 8.42 | 1.84 | 2.97 | 23.85 | |||||||||||||||||
| CNBL |
Citizens National Bancshares of Bossier, Inc. | 9.84 | 9.45 | 1.01 | 9.49 | 0.97 | 9.11 | 0.82 | 114.02 | NA | NA | NA | NA | NA | 0.75 | 4.17 | NA | |||||||||||||||||
| CZNL |
Citizens National Corporation | 10.87 | NA | NA | NA | NA | NA | NA | NA | NA | NA | NA | NA | NA | 0.92 | 1.88 | NA | |||||||||||||||||
| CNBW |
CNB Corp. | 8.24 | 8.24 | 1.01 | 10.82 | 1.00 | 10.66 | 0.09 | 566.64 | NA | NA | NA | NA | NA | 2.75 | 3.24 | NA | |||||||||||||||||
| CNBZ |
CNB Corporation | 6.73 | 6.73 | 0.76 | 9.78 | NA | NA | 0.49 | 139.49 | 9.18 | 89.82 | 6.04 | 89.82 | NA | 0.80 | 3.63 | 37.50 | |||||||||||||||||
| CBFC |
CNB Financial Services, Inc. | 7.38 | 7.38 | 0.75 | 9.19 | 0.68 | 8.43 | 1.13 | 129.33 | 6.85 | 62.52 | NA | 62.52 | 7.46 | 1.20 | 2.03 | 26.48 | |||||||||||||||||
| CABT |
Coastal Bank & Trust | 11.48 | 11.48 | 0.53 | 4.06 | 0.43 | 3.30 | 0.07 | 996.52 | NA | NA | NA | NA | NA | NA | NA | NA | |||||||||||||||||
| CDAB |
Coeur d’Alene Bancorp, Inc. | 11.15 | 11.14 | 0.90 | 8.39 | NA | NA | NA | NA | 12.15 | 100.18 | 11.17 | 100.34 | NA | NA | NA | NM | |||||||||||||||||
| CEFC |
Commercial National Financial Corporation | 7.33 | NA | 0.99 | 13.34 | NA | NA | NA | NA | 7.50 | 96.60 | 7.09 | NA | NA | 0.56 | 5.33 | 40.00 | |||||||||||||||||
| CNUN |
Community Bancshares, Inc. (McArthur, OH) | 10.06 | 9.53 | 0.92 | 8.42 | 0.93 | 8.53 | 0.37 | 144.45 | 8.87 | 73.32 | 7.37 | 77.85 | 8.75 | 0.00 | 0.00 | NM | |||||||||||||||||
| CTYP |
Community Bankers’ Corporation | 6.82 | NA | NA | NA | NA | NA | NA | NA | NA | NA | NA | NA | NA | 0.36 | 4.00 | NA | |||||||||||||||||
| CFGW |
Community Financial Group, Inc. (Spokane, WA) | 8.38 | 8.38 | 1.17 | 13.14 | 1.17 | 13.14 | NA | NA | 11.85 | 136.98 | 11.48 | 136.98 | 11.85 | NA | NA | NM | |||||||||||||||||
| CFOK |
Community First Bancorporation | 8.07 | NA | 0.41 | 4.46 | NA | NA | NA | NA | 18.59 | 82.39 | 6.28 | 85.71 | NA | NA | NA | NM | |||||||||||||||||
| CMHF |
Community Heritage Financial, Inc. | 7.46 | 7.25 | 0.76 | 10.02 | 0.66 | 8.66 | 0.36 | 221.41 | 9.68 | 93.47 | 6.97 | 96.41 | 11.21 | 0.16 | 0.71 | 6.84 | |||||||||||||||||
| CIBN |
Community Investors Bancorp, Inc. | 7.49 | 7.49 | 1.16 | 15.07 | NA | NA | NA | NA | 6.03 | 86.22 | 6.45 | 86.22 | NA | 0.40 | 2.15 | 9.71 | |||||||||||||||||
| CBCZ |
Comunibanc Corp. | 9.63 | 9.63 | 0.68 | 6.80 | 0.68 | 6.75 | 1.28 | 42.46 | 12.25 | 82.79 | 7.97 | 82.79 | 12.34 | 0.82 | 2.56 | 31.36 | |||||||||||||||||
| CNBP |
Cornerstone Bancorp Inc. | 5.46 | 5.46 | 0.99 | 19.09 | NA | NA | NA | NA | 6.90 | 119.41 | 6.51 | 119.41 | NA | 0.00 | 0.00 | NM | |||||||||||||||||
| CRSB |
Cornerstone Community Bancorp | 6.43 | 6.43 | 1.42 | 23.64 | 1.42 | 23.52 | 0.00 | NM | 5.94 | 121.43 | 7.80 | 121.43 | 5.97 | NA | NA | NM | |||||||||||||||||
| CFIC |
Cornerstone Financial Corporation | 6.55 | NA | NA | NA | NA | NA | NA | NA | NA | NA | NA | NA | NA | NA | NA | NA | |||||||||||||||||
| CRZY |
Crazy Woman Creek Bancorp Incorporated | 9.24 | 9.17 | 1.19 | 12.55 | 1.18 | 12.53 | 0.00 | NM | 7.45 | 87.67 | 8.10 | 88.47 | 7.47 | 0.30 | 1.25 | 9.32 | |||||||||||||||||
| CYVF |
Crystal Valley Financial Corporation | 12.20 | NA | 1.72 | 14.22 | 1.66 | 13.72 | NA | NA | 7.83 | 105.04 | 12.82 | 109.45 | 8.12 | 1.52 | 2.41 | 16.00 | |||||||||||||||||
| CSBB |
CSB Bancorp, Inc. | 8.50 | 8.12 | 1.06 | 11.88 | 1.06 | 11.91 | 0.47 | 147.61 | 9.72 | 111.78 | 9.51 | 117.59 | 9.69 | 1.20 | 3.06 | 28.96 | |||||||||||||||||
| CBMI |
CSB Bancorp Inc. | 9.73 | 9.73 | 1.44 | 13.08 | 1.43 | 13.03 | 0.24 | 893.78 | 4.26 | 55.25 | 5.38 | 55.25 | 4.28 | 0.00 | 0.00 | NM | |||||||||||||||||
| DWNX |
Delhi Bank Corp. | 9.24 | 9.24 | 0.63 | 6.53 | 0.63 | 6.53 | NA | NA | 26.91 | 175.79 | 16.24 | 175.79 | 26.91 | 0.38 | 2.06 | 55.29 | |||||||||||||||||
| DENI |
Denali Bancorporation, Inc. | 8.60 | 8.60 | 0.89 | 9.59 | 0.89 | 9.59 | 0.85 | 133.99 | 10.18 | 97.11 | 8.35 | 97.11 | 10.18 | 0.72 | 6.49 | 66.06 | |||||||||||||||||
| DNVB |
Denver Bankshares, Inc. | 8.87 | 8.87 | 0.58 | 6.13 | 0.47 | 5.02 | 0.05 | NM | NA | NA | NA | NA | NA | 12.00 | 4.90 | NA | |||||||||||||||||
| DMNB |
Diamond Bancshares, Inc. | 10.06 | NA | NA | NA | NA | NA | NA | NA | NA | 78.24 | 7.87 | NA | NA | 1.28 | 1.71 | NA | |||||||||||||||||
| DIMC |
Dimeco, Inc. | 10.23 | 10.23 | 1.12 | 10.37 | NA | NA | 2.32 | 50.58 | 9.40 | 94.56 | 9.67 | 94.56 | NA | 1.36 | 3.78 | 35.25 | |||||||||||||||||
| EFIN |
Eastern Michigan Financial Corporation | 8.84 | 8.76 | 0.98 | 10.82 | NA | NA | NA | NA | 8.49 | 88.25 | 7.80 | 89.09 | NA | 1.20 | 3.79 | 28.15 |
| ELMA |
Elmer Bancorp, Inc. | 7.78 | NA | 0.42 | 5.08 | NA | NA | NA | NA | 16.24 | 80.78 | 6.29 | 81.86 | NA | 0.34 | 1.67 | 26.40 | |||||||||||||||||
| EBSH |
Empire Bancshares, Inc. | 11.96 | 11.96 | 0.85 | 6.50 | 0.83 | 6.40 | 0.63 | 112.06 | NA | NA | NA | NA | NA | 0.42 | 1.95 | NA | |||||||||||||||||
| EDVR |
Endeavor Bank | 6.41 | 6.41 | 0.84 | 13.04 | 0.84 | 13.04 | 0.00 | NM | 8.86 | 104.75 | 6.72 | 104.75 | 8.86 | NA | NA | NM | |||||||||||||||||
| EFSG |
Enterprise Financial Services Group, Inc. | 8.18 | NA | 0.92 | 12.34 | 0.92 | 12.34 | 3.66 | 8.41 | NA | NA | NA | NA | NA | 0.21 | 1.57 | NA | |||||||||||||||||
| ERKH |
Eureka Homestead Bancorp, Inc. | 20.46 | 20.46 | 0.10 | 0.46 | NA | NA | NA | NM | NM | 70.55 | 14.43 | 70.55 | NA | NA | NA | NM | |||||||||||||||||
| EXSR |
Exchange Bank (Santa Rosa, CA) | 9.01 | 9.01 | 1.07 | 11.24 | NA | NA | NA | NA | 7.93 | 86.55 | 7.79 | 86.55 | NA | 4.80 | 3.08 | 24.40 | |||||||||||||||||
| EXCH |
Exchange Bankshares, Inc. | 11.64 | 11.64 | 1.12 | 8.61 | 1.11 | 8.54 | 0.70 | 174.24 | NA | NA | NA | NA | NA | 1.04 | 2.58 | NA | |||||||||||||||||
| FMOO |
F&M Bancorp | 9.61 | 9.61 | 1.31 | 13.34 | NA | NA | NA | NA | 8.10 | 103.54 | 9.95 | 103.54 | NA | 1.00 | 1.26 | 15.34 | |||||||||||||||||
| FMBN |
Farmers & Merchants Bancshares, Inc. (Burlington, IA) | 6.75 | 6.75 | 0.55 | 8.08 | NA | NA | NA | NA | 7.88 | 60.48 | 4.08 | 60.48 | NA | 1.00 | 2.86 | 22.52 | |||||||||||||||||
| FMFG |
Farmers and Merchants Bancshares, Inc. | 7.69 | 6.76 | 0.79 | 9.22 | 1.15 | 13.50 | 1.14 | 50.94 | 13.98 | 125.02 | 9.62 | 143.64 | 9.49 | 0.56 | 2.49 | 33.54 | |||||||||||||||||
| FABP |
Farmers Bancorp (Frankfort IN) | 11.32 | 11.32 | 1.50 | 12.66 | 1.50 | 12.63 | NA | NA | 9.01 | 109.62 | 12.41 | 109.62 | 9.02 | 1.28 | 2.80 | 23.43 | |||||||||||||||||
| FBVA |
Farmers Bankshares, Inc. | 11.78 | 10.25 | 1.65 | 14.07 | 1.54 | 13.64 | NA | NA | 6.46 | 84.15 | 9.61 | 98.98 | 6.95 | 0.52 | 2.87 | 17.86 | |||||||||||||||||
| FBVI |
FCN Banc Corp. | 10.23 | 9.52 | 1.35 | 12.89 | NA | NA | NA | NA | 8.70 | NA | NA | NA | NA | 1.44 | 3.09 | 19.44 | |||||||||||||||||
| FFDF |
FFD Financial Corporation | 8.66 | 8.58 | 1.59 | 18.66 | 1.59 | 18.66 | NA | 324.48 | 8.25 | 142.12 | 12.31 | 143.63 | 8.25 | 2.08 | 2.81 | 23.19 | |||||||||||||||||
| FFWC |
FFW Corporation | 10.89 | 10.66 | 1.37 | 12.57 | 1.36 | 12.42 | NA | NA | 8.11 | 99.13 | 10.79 | 101.46 | 8.21 | 1.00 | 2.17 | 35.27 | |||||||||||||||||
| FDLB |
Fidelity Federal Bancorp | 11.33 | NA | NA | NA | NA | NA | NA | NA | NA | NA | NA | NA | NA | 1.00 | 1.11 | NA | |||||||||||||||||
| FNWD |
Finward Bancorp | 9.70 | 8.86 | 1.09 | 10.94 | 1.04 | 10.49 | 0.91 | 103.27 | 8.64 | 92.77 | 9.00 | 102.47 | 9.01 | 1.24 | 2.99 | 25.83 | |||||||||||||||||
| FBLV |
First Bancorp Inc., Lebanon | 9.62 | 9.58 | 1.53 | 15.36 | NA | NA | NA | NA | 13.37 | 195.36 | 18.79 | 196.26 | NA | 1.56 | 0.00 | 18.06 | |||||||||||||||||
| FBPI |
First Bancorp of Indiana, Inc. | 8.47 | 7.27 | 0.74 | 8.72 | NA | NA | NA | NA | 10.52 | 89.39 | 7.58 | 105.49 | NA | 0.62 | 2.95 | 31.06 | |||||||||||||||||
| FIBH |
First Bancshares Inc. (Bellevue, OH) | 7.69 | 7.69 | 1.11 | 13.02 | NA | NA | NA | NA | 7.08 | 92.37 | 7.11 | 92.37 | NA | 1.28 | 3.12 | 21.06 | |||||||||||||||||
| FBSI |
First Bancshares, Inc. | 10.36 | 9.93 | 1.08 | 10.41 | 1.07 | 10.32 | NA | NA | 8.88 | NA | NA | NA | 8.96 | 0.25 | 1.67 | 14.79 | |||||||||||||||||
| FBOO |
First Bank of Ohio | 30.50 | 30.50 | 1.73 | 5.33 | 1.71 | 5.28 | 0.04 | NM | 8.62 | 45.44 | 13.86 | 45.44 | 8.70 | NA | NA | NM | |||||||||||||||||
| FCPB |
First Capital Bancshares, Inc. | 10.15 | 10.15 | 0.33 | 2.65 | NA | NA | NA | NA | NM | 112.83 | 11.45 | 112.83 | NA | 0.00 | 0.00 | NM | |||||||||||||||||
| FIZN |
First Citizens Bancshares, Inc. | 10.85 | 9.88 | 1.20 | 10.87 | NA | NA | NA | NA | 11.84 | NA | NA | NA | NA | 1.40 | 1.90 | 31.40 | |||||||||||||||||
| FCIT |
First Citrus Bancorporation, Inc. | 7.23 | 7.23 | 1.12 | 15.23 | NA | NA | NA | NA | 9.25 | 129.72 | 9.26 | 129.72 | NA | NA | NA | 14.75 | |||||||||||||||||
| CMRB |
First Commerce Bank | 14.39 | 14.39 | 1.18 | 8.21 | 1.18 | 8.21 | 1.64 | 141.57 | NA | NA | NA | NA | NA | NA | NA | NA | |||||||||||||||||
| FCCT |
First Community Corporation | 9.89 | 9.89 | 0.65 | 6.41 | 0.65 | 6.41 | NA | NA | 13.50 | 81.99 | 7.28 | 81.99 | 13.50 | 0.25 | 3.09 | 41.67 | |||||||||||||||||
| FMFP |
First Community Financial Corporation | 8.77 | 8.77 | 0.75 | 8.21 | NA | NA | NA | NA | 11.85 | 94.38 | 8.28 | 94.38 | NA | 0.56 | 3.01 | 44.59 | |||||||||||||||||
| FFMH |
First Farmers and Merchants Corporation | 8.60 | 8.16 | 0.87 | 9.85 | 0.77 | 8.72 | NA | NA | 9.61 | 91.78 | 7.89 | 97.21 | 10.86 | 0.84 | 2.46 | 23.66 | |||||||||||||||||
| FGFI |
First Greenwich Financial, Inc. | 8.01 | NA | NA | NA | NA | NA | NA | NA | NA | NA | NA | NA | NA | NA | NA | NA | |||||||||||||||||
| FIEB |
First IC Corporation | 10.46 | 10.45 | 1.44 | 13.31 | 1.44 | 13.31 | 0.00 | NM | NA | NA | NA | NA | NA | NA | NA | NA | |||||||||||||||||
| FKYS |
First Keystone Corporation | 11.26 | 9.94 | 1.18 | 9.74 | 1.15 | 9.53 | 1.23 | 50.48 | 10.28 | 97.69 | 11.00 | 112.25 | 10.51 | 1.08 | 4.43 | 45.99 | |||||||||||||||||
| FMIA |
First Miami Bancorp, Inc. | 13.31 | 13.31 | -0.16 | -1.19 | 0.70 | 5.25 | NA | NA | NA | 85.86 | 11.43 | 85.86 | NA | 3.00 | 0.26 | NA | |||||||||||||||||
| FINN |
First National of Nebraska, Inc. | NA | NA | 2.11 | NA | NA | NA | NA | NA | 6.92 | 123.56 | NA | 139.31 | NA | 120.00 | 0.00 | 10.76 | |||||||||||||||||
| FNFI |
First Niles Financial, Inc. | 11.58 | 11.58 | 0.26 | 2.13 | 0.12 | 1.03 | 0.38 | 131.99 | NA | 96.66 | NA | 96.66 | NA | 0.24 | 2.18 | NA | |||||||||||||||||
| FOTB |
First Ottawa Bancshares, Inc. | NA | NA | NA | NA | NA | NA | NA | NA | 11.07 | NA | NA | NA | NA | 1.50 | 1.76 | 19.53 | |||||||||||||||||
| FSRL |
First Reliance Bancshares, Inc. | 8.36 | NA | 1.16 | 13.16 | 1.20 | 13.61 | 0.35 | 229.09 | 9.09 | 120.33 | 10.06 | NA | 8.79 | NA | NA | NM | |||||||||||||||||
| FRFC |
First Robinson Financial Corporation | 7.76 | 7.76 | 0.64 | 8.01 | 0.64 | 8.01 | 0.71 | 94.92 | 10.79 | 84.83 | 6.58 | 84.83 | 10.79 | 1.24 | 2.46 | 25.85 | |||||||||||||||||
| FSWA |
First Sound Bank | 8.30 | 8.23 | 0.19 | 2.25 | 0.20 | 2.31 | 1.02 | 88.70 | NM | 129.95 | 10.79 | 131.22 | NM | NA | NA | NM | |||||||||||||||||
| FSBH |
First Southern Bank | 7.97 | 7.97 | 1.41 | 15.25 | 1.41 | 15.25 | 0.91 | 149.26 | NA | NA | NA | NA | NA | NA | NA | NA | |||||||||||||||||
| FLEW |
Fleetwood Bank Corporation | 7.88 | 7.88 | 0.54 | 6.22 | 0.54 | 6.22 | 0.10 | 635.80 | 12.41 | 79.60 | NA | 79.60 | 12.41 | 2.00 | 2.89 | 35.85 | |||||||||||||||||
| FBIP |
FNB Bancorp, Inc. | 7.66 | 7.66 | 0.83 | 8.95 | 0.82 | 8.91 | 0.16 | 262.24 | NA | NA | NA | NA | NA | 3.72 | 2.74 | NA | |||||||||||||||||
| FIDS |
FNB, Inc. | 8.63 | 8.63 | 0.88 | 9.55 | 0.88 | 9.55 | 0.07 | NM | 8.63 | 81.92 | 7.07 | 81.92 | 8.63 | 1.20 | 4.00 | 34.52 | |||||||||||||||||
| FGFH |
Foresight Financial Group, Inc. | NA | NA | 0.81 | NA | NA | NA | NA | NA | 10.51 | 77.26 | NA | 77.44 | NA | 0.44 | 1.38 | 13.23 | |||||||||||||||||
| FHLB |
Friendly Hills Bancorp | 9.37 | 9.20 | 0.47 | 5.11 | 0.53 | 5.67 | 0.00 | NM | 19.33 | 96.37 | 9.03 | 98.35 | 17.50 | NA | NA | NM | |||||||||||||||||
| FXLG |
FS Bancorp | 9.27 | 9.05 | 1.56 | 16.36 | 1.53 | 16.03 | NA | NA | 7.97 | 122.03 | 11.30 | 125.33 | 8.14 | 2.80 | 5.01 | 24.96 | |||||||||||||||||
| GLNV |
Glenville Bank Holding Company, Inc. | 6.39 | NA | NA | NA | NA | NA | 0.16 | 536.49 | NA | 41.07 | NA | 41.35 | NA | 2.00 | 2.22 | NA | |||||||||||||||||
| GSBX |
Golden State Bancorp | 6.48 | 6.48 | -0.04 | -0.58 | -0.04 | -0.58 | NA | NA | NM | 105.01 | 6.81 | 105.01 | NM | NA | NA | NM | |||||||||||||||||
| GVYB |
Golden Valley Bancshares, Inc. | 8.33 | 8.33 | 1.11 | 13.48 | 1.11 | 13.48 | NA | NA | 9.13 | 115.40 | 9.61 | 115.40 | NA | 0.00 | 0.00 | NM | |||||||||||||||||
| GABK |
Grand Bank Corp. | 18.54 | NA | NA | NA | NA | NA | NA | NA | NA | NA | NA | NA | NA | 120.00 | 1.52 | NA | |||||||||||||||||
| GTPS |
Great American Bancorp, Inc. | 8.81 | 8.60 | 0.49 | 5.40 | 0.49 | 5.40 | NA | NA | 13.69 | 73.35 | 6.46 | 75.31 | 13.69 | 0.68 | 2.04 | 27.87 | |||||||||||||||||
| GUAA |
Guaranty Bancorp, Inc. | 7.92 | 7.92 | 0.69 | 7.60 | 0.62 | 6.82 | 0.13 | 724.07 | 10.23 | 79.94 | 6.33 | 79.94 | NA | 0.00 | 0.00 | NM | |||||||||||||||||
| HMLN |
Hamlin Bank and Trust Company | 19.95 | 19.95 | 3.27 | 15.99 | 1.08 | 5.31 | 0.45 | 264.35 | 7.40 | 113.52 | 22.65 | 113.52 | NA | 11.00 | 3.96 | 29.29 | |||||||||||||||||
| HRBK |
Harbor Bankshares Corporation | 2.99 | NA | NA | NA | NA | NA | NA | NA | NA | NA | NA | NA | NA | 0.00 | 0.00 | NA | |||||||||||||||||
| HFBK |
Harford Bank | 9.16 | 9.16 | 0.99 | 10.69 | 1.01 | 10.84 | 1.10 | 89.13 | 8.55 | 87.51 | 8.02 | 87.51 | 8.43 | 0.72 | 2.49 | 20.71 | |||||||||||||||||
| HCBN |
HCB Financial Corp. | 8.41 | 8.41 | 0.75 | 8.44 | NA | NA | NA | NA | 9.93 | 82.13 | 6.91 | 82.13 | NA | 0.76 | 2.71 | 31.56 | |||||||||||||||||
| HRGG |
Heritage NOLA Bancorp, Inc. | 14.66 | 14.66 | 0.69 | 4.44 | 0.69 | 4.44 | NA | NA | 18.12 | 83.40 | 12.23 | 83.40 | 18.12 | NA | NA | NM | |||||||||||||||||
| HFBA |
HFB Financial Corporation | 10.70 | 10.70 | 0.82 | 8.45 | 0.78 | 8.09 | 1.01 | 137.06 | NA | NA | NA | NA | NA | 0.80 | 2.62 | NA | |||||||||||||||||
| HBSI |
Highlands Bankshares, Inc. | 11.85 | 11.56 | 0.75 | 6.02 | 0.74 | 5.96 | NA | NA | 15.00 | 88.98 | 10.54 | 91.52 | 15.15 | 1.68 | 4.48 | 64.80 | |||||||||||||||||
| HBIA |
Hills Bancorporation | 10.83 | 10.78 | 1.27 | 11.81 | 1.33 | 12.32 | 0.42 | 215.80 | 12.44 | 141.77 | 15.36 | 142.60 | 11.92 | 0.94 | 1.45 | 18.04 | |||||||||||||||||
| HCKG |
Hocking Valley BancShares, Inc. | 10.80 | NA | NA | NA | NA | NA | NA | NA | NA | NA | NA | NA | NA | 1.20 | 0.15 | NA | |||||||||||||||||
| HWIS |
Home Bancorp Wisconsin, Inc. | 10.46 | 10.46 | 1.35 | 13.25 | 1.35 | 13.25 | NA | NA | 8.56 | 111.44 | 11.66 | 111.44 | 8.56 | NA | NA | NM | |||||||||||||||||
| HWEN |
Home Financial Bancorp | 11.02 | 11.02 | -0.89 | -7.67 | 0.55 | 4.78 | NA | NA | NM | 152.74 | 16.83 | 152.74 | 30.97 | 0.16 | 1.48 | NM | |||||||||||||||||
| HLFN |
Home Loan Financial Corporation | 12.71 | 12.71 | 1.55 | 12.38 | 1.55 | 12.38 | NA | NA | 12.77 | 152.59 | 19.39 | 152.59 | 12.77 | 1.08 | 3.09 | 66.06 | |||||||||||||||||
| HONT |
Honat Bancorp, Inc. | 13.30 | 13.30 | 1.43 | 10.34 | 1.40 | 10.15 | NA | NA | 15.45 | 153.88 | 20.47 | 153.88 | 15.75 | 1.92 | 1.55 | 23.92 | |||||||||||||||||
| HRRB |
Horizon Bancorp, Inc. (Lake Havasu City, AZ) | 6.68 | 6.68 | 1.01 | 15.03 | NA | NA | 0.49 | 196.40 | 7.08 | 98.69 | 6.60 | 98.69 | NA | NA | NA | NM | |||||||||||||||||
| HVLM |
Huron Valley Bancorp, Inc. | 8.10 | 8.10 | 0.87 | 10.22 | NA | NA | NA | NA | 10.40 | 101.45 | 8.22 | 101.45 | NA | 0.00 | 0.00 | NM | |||||||||||||||||
| IBWC |
IBW Financial Corporation | 8.50 | 8.45 | 1.51 | 19.13 | 1.54 | 19.51 | 1.75 | 55.99 | NA | 40.76 | 3.43 | 41.02 | NA | 0.25 | 0.76 | NA | |||||||||||||||||
| IFBH |
IFB Holdings, Inc. | 19.07 | NA | NA | NA | NA | NA | NA | NA | NA | NA | NA | NA | NA | 0.50 | 0.77 | NA | |||||||||||||||||
| IOFB |
Iowa First Bancshares Corp. | NA | NA | 0.42 | NA | NA | NA | NA | NA | 17.86 | NA | NA | NA | NA | 0.60 | 1.71 | 30.10 | |||||||||||||||||
| JBTC |
JBT Bancorp Inc. | 8.05 | 8.05 | 0.92 | 11.06 | NA | NA | NA | NA | 9.43 | 100.91 | 8.12 | 100.91 | NA | 0.84 | 3.15 | 29.33 | |||||||||||||||||
| JFWV |
Jefferson Security Bank | 7.59 | 7.59 | 0.88 | 10.99 | 0.87 | 10.94 | 1.16 | 58.97 | 9.06 | 96.79 | 7.35 | 96.79 | 9.10 | 2.10 | 1.93 | 17.05 | |||||||||||||||||
| JTNB |
JTNB Bancorp, Inc. | 10.52 | 10.17 | 1.09 | 10.07 | 0.96 | 8.91 | 0.23 | 205.83 | NA | NA | NA | NA | NA | 0.24 | 1.37 | NA | |||||||||||||||||
| JUVF |
Juniata Valley Financial Corp. | 8.82 | 7.80 | 0.80 | 8.39 | 0.75 | 7.89 | 0.26 | 190.26 | 13.03 | 112.21 | 9.90 | 128.31 | 13.86 | 0.88 | 5.32 | 69.29 | |||||||||||||||||
| KEFI |
Keweenaw Financial Corporation | 9.20 | NA | 1.37 | 12.67 | 1.39 | 12.81 | NA | NA | 8.41 | 99.48 | 9.15 | NA | 8.31 | 1.36 | 1.76 | 14.47 | |||||||||||||||||
| KLIB |
Killbuck Bancshares, Inc. | 8.99 | 8.82 | 0.89 | 8.75 | 0.88 | 8.63 | 0.08 | 682.25 | NA | NA | NA | NA | NA | 3.40 | 2.18 | NA | |||||||||||||||||
| KSBI |
KS Bancorp, Inc. | 6.42 | 6.42 | 1.10 | 17.14 | NA | NA | NA | NA | 8.14 | 129.61 | 8.32 | 129.61 | NA | 0.64 | 1.60 | 10.16 | |||||||||||||||||
| LKSB |
Lakeside Bancshares, Inc. | 7.61 | 7.56 | 0.43 | 4.65 | 0.43 | 4.65 | 0.12 | 656.19 | NA | NA | NA | NA | NA | NA | NA | NA | |||||||||||||||||
| LWCL |
Lewis & Clark Bancorp | 8.67 | NA | 0.77 | 7.08 | NA | NA | NA | NA | 14.92 | NA | NA | NA | NA | 0.30 | 0.88 | 13.16 | |||||||||||||||||
| LIBC |
Liberty Bancorp (South San Francisco, CA) | 7.81 | 7.81 | 0.28 | 3.61 | 0.28 | 3.61 | NA | NA | 31.11 | 110.28 | 8.61 | 110.28 | 31.11 | 0.00 | 0.00 | NM | |||||||||||||||||
| LBSI |
Liberty Bancshares, Inc. (Ada, OH) | 12.58 | 12.29 | 1.24 | 9.73 | 1.24 | 9.72 | NA | NA | 10.50 | NA | NA | NA | 10.50 | 1.50 | 2.46 | 24.96 | |||||||||||||||||
| LNKB |
LINKBANCORP, Inc. | 10.23 | 9.94 | 1.00 | 9.69 | 1.10 | 10.69 | NA | 841.84 | 24.20 | 198.93 | 20.35 | 205.43 | 21.96 | NA | NA | NM | |||||||||||||||||
| MFBP |
M&F Bancorp, Inc. | 11.52 | 11.52 | 0.68 | 7.26 | NA | NA | NA | NA | 7.17 | 62.79 | 4.41 | 62.79 | NA | 0.02 | 0.26 | 3.77 | |||||||||||||||||
| MCBK |
Madison County Financial, Inc. | 17.07 | NA | 1.62 | 8.95 | NA | NA | NA | NA | 12.11 | 107.04 | 18.27 | 110.36 | NA | 0.63 | 1.88 | 22.74 | |||||||||||||||||
| MSWV |
Main Street Financial Services Corp. | 8.47 | 8.47 | 0.92 | 10.49 | NA | NA | NA | NA | NA | NA | NA | NA | NA | 0.40 | 2.58 | NA | |||||||||||||||||
| MLGF |
Malaga Financial Corporation | NA | NA | 1.45 | NA | 1.45 | NA | NA | NA | 10.04 | NA | NA | NA | 10.04 | 1.00 | 4.00 | 48.79 | |||||||||||||||||
| MBOF |
Marine Bancorp of Florida, Inc. | 5.86 | NA | 1.00 | 16.34 | NA | NA | NA | NA | 6.86 | NA | NA | NA | NA | NA | NA | NM | |||||||||||||||||
| MCHT |
Mauch Chunk Trust Financial Corp. | 8.00 | 8.00 | 0.72 | 7.81 | 0.44 | 4.78 | 0.04 | NM | 11.38 | 96.34 | 7.71 | 96.34 | 18.56 | 0.32 | 2.58 | 28.44 |
| MBKL |
MBT Bancshares, Inc. | 8.28 | 8.28 | 0.84 | 9.54 | 0.84 | 9.48 | 0.17 | 409.75 | 12.22 | 113.51 | 9.40 | 113.51 | 12.29 | 1.00 | 4.12 | 50.30 | |||||||||||||||||
| MCHN |
Mchenry Bancorp, Inc. | 8.38 | 8.38 | NA | NA | NA | NA | 0.83 | 108.61 | NA | NA | NA | NA | NA | NA | NA | NA | |||||||||||||||||
| MKIN |
MCNB Banks, Inc. | 11.10 | 11.10 | 0.81 | 7.21 | 0.62 | 5.46 | 7.36 | 18.49 | NA | 60.66 | 6.73 | 60.66 | NA | 0.00 | 0.00 | NA | |||||||||||||||||
| MCHB |
Mechanics Bank | 13.00 | 8.39 | 0.64 | 4.85 | 0.74 | 5.67 | 0.26 | 270.37 | 16.34 | 78.25 | 10.17 | 127.62 | 13.99 | 0.00 | 0.00 | 139.91 | |||||||||||||||||
| MFGI |
Merchants Financial Group, Inc. | 8.36 | 7.07 | 1.20 | 14.60 | NA | NA | NA | NA | 6.38 | 88.01 | 7.36 | 105.56 | NA | 1.60 | 2.19 | 13.54 | |||||||||||||||||
| MDVT |
Middlebury National Corporation | 8.21 | 8.21 | 0.98 | 11.49 | NA | NA | NA | NA | 7.92 | 87.62 | 7.19 | 87.62 | NA | 1.12 | 2.57 | 20.04 | |||||||||||||||||
| MCPH |
Midland Capital Holdings Corp. | 7.98 | 7.98 | -0.66 | -7.31 | -0.66 | -7.31 | 0.75 | 34.77 | NM | 43.99 | 3.51 | 43.99 | NM | 0.08 | 0.00 | NM | |||||||||||||||||
| MIFF |
Mifflinburg Bancorp, Inc. | 10.03 | 10.03 | 1.10 | 10.74 | NA | NA | NA | NA | 9.85 | 103.62 | 10.39 | 103.62 | NA | 1.24 | 0.00 | NM | |||||||||||||||||
| MSBC |
Mission Bancorp | 7.68 | 7.67 | 1.37 | 17.46 | NA | NA | NA | NA | 9.91 | 160.83 | 12.35 | 161.01 | NA | NA | NA | NM | |||||||||||||||||
| MPCB |
Mountain Pacific Bancorp, Inc. | 9.26 | 9.26 | 1.00 | 11.85 | NA | NA | NA | NA | NA | 112.84 | 8.66 | 112.84 | NA | NA | NA | NA | |||||||||||||||||
| MPHX |
MPB BHC, INC. | 9.98 | NA | 1.77 | 16.10 | 1.77 | 16.10 | 0.01 | NM | 10.67 | 154.53 | 15.41 | 151.55 | 10.67 | NA | NA | NM | |||||||||||||||||
| NACB |
National Capital Bancorp Inc. | 8.31 | 8.31 | 0.68 | 7.88 | NA | NA | NA | NA | 13.72 | 105.59 | 8.78 | 105.59 | NA | 2.20 | 1.10 | 11.32 | |||||||||||||||||
| NCXS |
NBC Bancorp, Inc. | 8.38 | NA | NA | NA | NA | NA | NA | NA | NA | 69.42 | NA | NA | NA | 1.30 | 2.55 | NA | |||||||||||||||||
| NEFB |
Neffs Bancorp, Inc. | 16.43 | 16.43 | 0.88 | 4.86 | 0.88 | 4.86 | 0.33 | 157.80 | NA | 127.57 | NA | 127.57 | NA | 8.00 | 1.37 | NA | |||||||||||||||||
| NWPP |
New Peoples Bankshares, Inc. | 7.64 | 7.64 | 0.78 | 10.42 | 0.78 | 10.42 | NA | NA | 8.27 | 84.37 | 6.45 | 84.37 | 8.27 | NA | NA | NM | |||||||||||||||||
| NTBP |
New Tripoli Bancorp, Inc. | 11.16 | 11.16 | 1.33 | 11.47 | 1.30 | 11.23 | 0.76 | 134.87 | NA | NA | NA | NA | NA | 40.00 | 2.61 | NA | |||||||||||||||||
| NMBF |
Nmb Financial Corp | 9.54 | 9.49 | 0.81 | 8.83 | 0.81 | 8.83 | 0.69 | 264.06 | NA | NA | NA | NA | NA | NA | NA | NA | |||||||||||||||||
| NODB |
North Dallas Bank & Trust Co. | NA | NA | 0.54 | NA | NA | NA | NA | NA | 24.84 | 117.41 | NA | 117.41 | NA | 1.00 | 1.29 | 41.67 | |||||||||||||||||
| NRLB |
Northern California Bancorp, Inc. | 7.42 | NA | NA | NA | NA | NA | NA | NA | NA | 81.66 | 6.06 | NA | NA | 0.00 | 0.00 | NA | |||||||||||||||||
| NCNB |
Northern California National Bank | 8.52 | 8.52 | 0.94 | 10.32 | 0.61 | 6.67 | 1.13 | 77.99 | NA | 157.28 | NA | 157.28 | NA | 0.00 | 0.00 | NA | |||||||||||||||||
| NUBC |
Northumberland Bancorp | 9.59 | 9.59 | 0.80 | 7.80 | 0.76 | 7.45 | 0.22 | 265.25 | 10.91 | 83.50 | 8.00 | 83.50 | 11.43 | 0.92 | 2.39 | 25.21 | |||||||||||||||||
| BKOR |
Oak Ridge Financial Services, Inc. | 8.41 | 8.41 | 1.02 | 12.68 | 1.03 | 12.79 | NA | NA | 8.30 | 98.57 | 8.29 | 98.57 | 8.22 | 0.28 | 1.58 | 12.21 | |||||||||||||||||
| OAKV |
Oak View National Bank | 8.76 | 8.76 | 0.73 | 8.12 | 0.87 | 9.71 | 0.00 | NM | 11.71 | 91.99 | 8.06 | 91.99 | 9.88 | 0.16 | 0.00 | 5.48 | |||||||||||||||||
| OCNB |
Oconomowoc Bancshares, Inc. | 8.55 | NA | NA | NA | NA | NA | NA | NA | NA | NA | NA | NA | NA | 4.30 | 0.98 | NA | |||||||||||||||||
| ORBN |
Oregon Bancorp, Inc. | 18.07 | 18.07 | 8.46 | 52.52 | 8.46 | 52.52 | NA | NA | 3.20 | 148.83 | 26.90 | 148.83 | NA | 1.04 | 0.00 | 2.82 | |||||||||||||||||
| ORPB |
Oregon Pacific Bancorp | 6.97 | 6.97 | 1.17 | 16.00 | 1.17 | 16.00 | NA | NA | 7.28 | 106.39 | 7.42 | 106.39 | 7.28 | 0.00 | 0.00 | NM | |||||||||||||||||
| OXBC |
Oxford Bank Corporation | 8.30 | NA | 1.39 | 18.59 | NA | NA | NA | NA | 6.78 | 123.39 | NA | 124.69 | NA | 0.00 | 0.00 | NM | |||||||||||||||||
| PFBN |
Pacific Alliance Bank | 12.18 | 12.18 | 0.86 | 7.34 | 0.69 | 5.90 | 0.00 | NM | 9.28 | 66.53 | 8.11 | 66.53 | 11.51 | 0.10 | 1.11 | 10.31 | |||||||||||||||||
| PEBN |
Pacific Enterprise Bancorp | 9.43 | NA | 0.86 | 9.40 | 0.86 | 9.40 | NA | NA | 12.93 | 110.39 | 10.41 | 114.91 | 12.93 | NA | NA | NM | |||||||||||||||||
| PVBK |
Pacific Valley Bank | 8.68 | 8.68 | 0.94 | 10.60 | 0.94 | 10.60 | 0.17 | 615.37 | 10.10 | 102.12 | 8.87 | 102.12 | 10.10 | NA | NA | NM | |||||||||||||||||
| PWBO |
Pacific West Bank | 12.09 | NA | 0.28 | 1.94 | 0.28 | 1.95 | 0.17 | 388.30 | NM | 121.90 | 14.74 | NA | NM | NA | NA | NM | |||||||||||||||||
| PGNN |
Paragon Financial Solutions, Inc. | 10.34 | 10.27 | 0.67 | 6.62 | 0.66 | 6.56 | 0.13 | NM | 13.85 | 89.91 | 9.30 | 90.57 | 13.97 | NA | NA | NM | |||||||||||||||||
| PBKX |
Partners Bank of California | 8.51 | 8.51 | 0.70 | 7.92 | 0.70 | 7.92 | 0.06 | NM | NA | NA | NA | NA | NA | NA | NA | NA | |||||||||||||||||
| IDFB |
Peak Bancorp Inc. | 5.73 | 5.73 | 0.63 | 16.02 | NA | NA | NA | NA | 7.52 | 111.05 | 6.37 | 111.05 | NA | NA | NA | NM | |||||||||||||||||
| PEBA |
Penn Bancshares, Inc. | 8.66 | NA | NA | NA | NA | NA | NA | NA | NA | NA | NA | NA | NA | 0.00 | 0.00 | NA | |||||||||||||||||
| PPBB |
Peoples Bancorp | 8.98 | 8.98 | 0.93 | 8.87 | NA | NA | 0.31 | 441.14 | NA | NA | NA | NA | NA | 0.00 | 0.00 | NA | |||||||||||||||||
| PEBC |
Peoples Bancorp, Inc. | 9.69 | 8.65 | 0.61 | 5.94 | 0.68 | 6.53 | 1.09 | 108.22 | 12.93 | 75.87 | 7.35 | 86.03 | 11.76 | 0.72 | 2.30 | 29.71 | |||||||||||||||||
| PBCO |
People’s Bank of Commerce | 9.31 | NA | 1.55 | 15.95 | NA | NA | NA | NA | 6.96 | 105.57 | 9.83 | 116.21 | NA | 0.00 | 0.00 | NM | |||||||||||||||||
| PPLL |
Peoples Ltd. | NA | NA | 1.48 | NA | NA | NA | NA | NA | 7.83 | NA | NA | NA | NA | 2.28 | 3.21 | 30.10 | |||||||||||||||||
| PPAL |
Peoples Trust Company of St. Albans | 10.08 | 10.08 | 0.73 | 6.99 | 0.73 | 6.99 | 0.63 | 125.62 | NA | NA | NA | NA | NA | 0.95 | 1.38 | NA | |||||||||||||||||
| PPSF |
Peoples-Sidney Financial Corporation | 12.06 | 12.06 | 0.52 | 4.09 | 0.52 | 4.09 | 0.52 | 160.99 | NA | NA | NA | NA | NA | 0.24 | 2.50 | NA | |||||||||||||||||
| PCLB |
Pinnacle Bancshares, Inc. | 10.67 | 10.59 | 1.20 | 10.80 | 1.20 | 10.80 | NA | NA | 9.46 | 95.95 | 10.24 | 96.81 | 9.46 | 0.88 | 2.60 | 22.91 | |||||||||||||||||
| PBKC |
Pioneer Bankcorp, Inc. | 7.61 | 7.61 | 0.95 | 11.70 | NA | NA | NA | NA | 8.45 | 95.19 | 7.24 | 95.19 | NA | 0.60 | 1.66 | 13.99 | |||||||||||||||||
| PNBI |
Pioneer Bankshares, Inc. | 11.07 | 10.96 | 1.25 | 10.27 | NA | NA | NA | NA | 8.45 | 89.40 | 9.90 | 90.43 | NA | 0.96 | 3.36 | 28.11 | |||||||||||||||||
| PONT |
Pontiac Bancorp, Inc. | 15.58 | NA | NA | NA | NA | NA | NA | NA | NA | NA | NA | NA | NA | 7.00 | 1.50 | NA | |||||||||||||||||
| PTBS |
Potomac Bancshares, Inc. | 8.47 | 8.47 | 0.90 | 10.49 | NA | NA | NA | NA | 11.86 | 120.63 | 10.21 | 120.63 | NA | 0.32 | 1.93 | 21.43 | |||||||||||||||||
| PRMY |
Primary Bank | 9.00 | 9.00 | 1.11 | 11.84 | 1.11 | 11.84 | 0.39 | 198.58 | NA | NA | NA | NA | NA | NA | NA | NA | |||||||||||||||||
| QNBC |
QNB Corp. | 8.72 | 8.72 | 1.15 | 13.00 | 0.90 | 10.15 | 0.79 | 89.51 | 7.73 | 95.12 | 8.29 | 95.12 | 9.89 | 1.40 | 3.81 | 29.05 | |||||||||||||||||
| QRRY |
Quarry City Savings & Loan Association | 13.18 | 13.18 | 0.37 | 2.62 | 0.37 | 2.62 | 1.05 | 61.86 | 24.71 | 64.18 | 8.46 | 64.18 | 24.71 | NA | NA | NM | |||||||||||||||||
| RBAZ |
RBAZ Bancorp, Inc. | 10.22 | 10.22 | 0.87 | 9.76 | 0.87 | 9.79 | 0.11 | 514.06 | 10.10 | 70.00 | 7.16 | 70.00 | 10.07 | 0.00 | 0.00 | NM | |||||||||||||||||
| RWCB |
Redwood Capital Bancorp | 6.68 | 6.68 | 1.11 | 15.46 | 1.11 | 15.46 | NA | NA | 7.35 | 106.59 | 7.12 | 106.59 | 7.35 | 0.28 | 1.40 | 10.26 | |||||||||||||||||
| REDW |
Redwood Financial, Inc. | 8.49 | NA | NA | NA | NA | NA | NA | NA | NA | NA | NA | NA | NA | 2.00 | 1.66 | NA | |||||||||||||||||
| RCBC |
River City Bank | 8.62 | 8.62 | 1.25 | 15.20 | 1.17 | 14.20 | 0.00 | NM | 9.28 | 133.72 | NA | 133.72 | 9.93 | 1.26 | 0.48 | 4.44 | |||||||||||||||||
| RVRF |
River Financial Corporation | 7.73 | 6.41 | 1.18 | 13.69 | 1.21 | 14.04 | NA | NA | 8.45 | 110.18 | 8.52 | 134.68 | 8.25 | 0.40 | 1.38 | 11.66 | |||||||||||||||||
| RVCB |
River Valley Community Bancorp | 9.62 | 9.62 | 1.05 | 11.49 | NA | NA | NA | NA | 11.28 | 121.07 | 11.65 | 121.07 | NA | NA | NA | NM | |||||||||||||||||
| SBBI |
S.B.C.P. Bancorp, Inc. | 7.60 | 6.51 | 0.97 | 12.43 | NA | NA | NA | NA | 7.23 | 83.84 | 6.37 | 98.99 | NA | 1.64 | 1.73 | 12.40 | |||||||||||||||||
| SVVB |
Savi Financial Corporation, Inc. | 7.79 | NA | 0.70 | 8.62 | NA | NA | NA | NA | 15.85 | 99.90 | 7.78 | 105.81 | NA | NA | NA | NM | |||||||||||||||||
| SCYT |
Security Bancorp, Inc. | 9.65 | 9.65 | 0.95 | 9.45 | NA | NA | NA | NA | 9.96 | NA | NA | NA | NA | 1.00 | 1.51 | 15.04 | |||||||||||||||||
| SFDL |
Security Federal Corporation | 9.60 | 9.51 | 0.87 | 9.13 | 0.84 | 8.76 | NA | NA | 10.22 | 89.44 | 8.59 | 90.38 | 10.65 | 0.44 | 1.39 | 13.87 | |||||||||||||||||
| SNLC |
Security National Corporation | 11.16 | 11.02 | 1.00 | 9.18 | 1.01 | 9.19 | 0.98 | 128.00 | NA | NA | NA | NA | NA | 1.20 | 0.96 | 15.05 | |||||||||||||||||
| SFSA |
Sidney Federal Savings and Loan Association | 5.99 | 5.99 | -1.62 | -23.10 | -1.62 | -23.10 | 0.15 | 558.62 | NM | 67.53 | 4.05 | 67.53 | NA | NA | NA | NM | |||||||||||||||||
| SGBG |
Signature Bank of Georgia | 10.96 | 10.96 | 1.04 | 9.80 | 1.04 | 9.80 | 2.74 | NM | NA | NA | NA | NA | NA | NA | NA | NA | |||||||||||||||||
| SLRK |
Solera National Bancorp, Inc. | 10.18 | 10.18 | 1.96 | 18.85 | 1.67 | 16.06 | NA | NA | 5.47 | 92.07 | 9.37 | 92.07 | NA | NA | NA | NM | |||||||||||||||||
| SOBS |
Solvay Bank Corp. | 8.76 | 8.76 | 0.76 | 8.14 | 0.75 | 8.02 | 0.45 | 150.65 | NA | NA | NA | NA | NA | 1.48 | 3.69 | NA | |||||||||||||||||
| SOME |
Somerset Trust Holding Company | 7.58 | 7.57 | 0.81 | 10.40 | 0.80 | 10.21 | NA | NA | 7.75 | NA | NA | NA | 7.90 | 1.52 | 3.65 | 28.12 | |||||||||||||||||
| SEBC |
Southeastern Banking Corporation | 11.42 | 11.42 | 1.33 | 11.01 | 1.32 | 10.97 | NA | NA | 9.56 | 101.54 | 11.60 | 101.54 | 9.59 | 0.64 | 2.94 | 27.19 | |||||||||||||||||
| SBNC |
Southern BancShares (N.C.), Inc. | 10.48 | 9.89 | 3.43 | 34.63 | 1.06 | 10.68 | 0.14 | 529.10 | 3.25 | 95.50 | 9.97 | 101.87 | 10.57 | 20.00 | 0.39 | 1.19 | |||||||||||||||||
| BCAL |
Southern California Bancorp | 9.76 | 8.66 | 0.25 | 2.71 | 0.66 | 7.11 | NA | NA | NM | 110.91 | 10.83 | 126.52 | 16.58 | NA | NA | NM | |||||||||||||||||
| SCBS |
Southern Community Bancshares, Inc. | 9.24 | 9.24 | 0.68 | 7.42 | 0.64 | 7.05 | 2.76 | 45.24 | NA | NA | NA | NA | NA | 0.06 | 0.43 | NA | |||||||||||||||||
| SOMC |
Southern Michigan Bancorp, Inc. | 8.50 | 7.37 | 1.01 | 11.10 | 1.01 | 11.13 | NA | NA | 9.01 | 95.48 | 8.12 | 111.41 | 8.98 | 0.48 | 2.41 | 21.22 | |||||||||||||||||
| SOUB |
SouthPoint Bancshares, Inc. | 7.62 | NA | NA | NA | NA | NA | NA | NA | NA | NA | NA | NA | NA | NA | NA | NA | |||||||||||||||||
| SFIG.A |
STAR Financial Group, Inc. | 8.98 | 8.89 | 1.07 | 10.99 | 0.98 | 10.06 | 0.53 | 130.59 | NA | NA | NA | NA | NA | 1.20 | 1.64 | NA | |||||||||||||||||
| STBK |
Studio Bank | 11.57 | 11.57 | 0.73 | 6.12 | 0.73 | 6.12 | 0.00 | NM | NA | NA | NA | NA | NA | NA | NA | NA | |||||||||||||||||
| SMAL |
Summit Bancshares, Inc. | 11.20 | 11.20 | 0.88 | 7.49 | 0.88 | 7.49 | 0.23 | 586.62 | 16.56 | 121.50 | 13.61 | 121.50 | 16.56 | 0.36 | 0.95 | 15.69 | |||||||||||||||||
| SBKO |
Summit Bank Group, Inc. | 8.40 | 8.40 | 1.35 | 16.68 | 1.35 | 16.68 | NA | NA | 10.94 | 169.26 | 14.21 | 169.26 | 10.94 | NA | NA | NM | |||||||||||||||||
| SRYB |
Surrey Bancorp | 11.36 | NA | 1.29 | 11.12 | 1.13 | 9.78 | NA | NA | 11.11 | 122.95 | 13.97 | 120.63 | 12.65 | 0.42 | 2.80 | 46.30 | |||||||||||||||||
| SQCF |
Susquehanna Community Financial, Inc. | 9.77 | 9.77 | 1.17 | 10.60 | 1.18 | 10.62 | 0.11 | 543.38 | 9.95 | 100.82 | NA | 100.82 | 9.93 | 0.88 | 4.63 | 49.21 | |||||||||||||||||
| TVLF |
Tennessee Valley Financial Holdings, Inc. | 6.76 | NA | NA | NA | NA | NA | NA | NA | NA | NA | NA | NA | NA | NA | NA | NA | |||||||||||||||||
| ADKT |
The Adirondack Trust Company | 9.19 | 7.98 | 0.60 | 6.12 | 0.62 | 6.39 | 0.16 | 890.08 | NA | 101.31 | NA | 118.43 | NA | 51.50 | 2.78 | NA | |||||||||||||||||
| BAOB |
The Baraboo Bancorporation, Inc. | 9.81 | 9.81 | 0.70 | 6.88 | 0.70 | 6.88 | 0.77 | 193.87 | NA | NA | NA | NA | NA | 0.08 | 1.95 | NA | |||||||||||||||||
| FAHE |
The Fahey Banking Company | 17.81 | 17.81 | 1.23 | 7.00 | 1.09 | 6.18 | 2.63 | 42.04 | NA | NA | NA | NA | NA | 80.00 | 0.00 | NA | |||||||||||||||||
| FSDK |
The First Citizens National Bank of Upper Sandusky | 11.97 | 11.92 | 0.36 | 2.70 | 0.36 | 2.66 | 0.23 | 323.19 | 27.55 | 76.59 | 9.17 | 76.96 | 27.94 | 2.24 | 2.26 | 62.38 | |||||||||||||||||
| FIGR |
The First National Bank of Groton | 14.09 | 14.09 | 1.04 | 7.38 | 1.04 | 7.38 | 1.61 | 54.89 | 14.12 | 102.55 | 14.45 | 102.55 | 14.12 | 17.30 | 3.46 | 52.97 | |||||||||||||||||
| SRNN |
The Southern Banc Company, Inc. | 11.08 | 11.08 | 0.45 | 3.88 | 0.45 | 3.88 | 1.10 | 66.69 | 13.19 | 53.78 | 5.96 | 53.78 | 13.19 | 0.00 | 0.00 | NM | |||||||||||||||||
| TDCB |
Third Century Bancorp | 9.16 | 9.16 | 0.83 | 8.73 | NA | NA | NA | NA | 10.92 | 91.25 | 8.36 | 91.25 | NA | 0.36 | 2.21 | 22.82 | |||||||||||||||||
| THVB |
Thomasville Bancshares, Inc. | 8.66 | 8.37 | 1.71 | 19.45 | 1.71 | 19.45 | 0.11 | NM | NA | 395.63 | NA | 411.75 | NA | 1.60 | 2.38 | NA | |||||||||||||||||
| TMAK |
Touchmark Bancshares, Inc. | 14.64 | NA | 1.63 | 12.24 | NA | NA | NA | NA | 5.85 | 68.04 | 9.96 | NA | NA | 0.00 | 0.00 | NM | |||||||||||||||||
| TSBA |
Touchstone Bankshares Inc. | 9.11 | 8.95 | 0.64 | 6.92 | 0.67 | 7.23 | NA | NA | 11.41 | 76.45 | 6.95 | 77.90 | 10.92 | 0.28 | 2.38 | 27.18 |
| TWCF |
Town and Country Financial Corporation | 9.24 | NA | 1.20 | 14.02 | NA | NA | NA | NA | 6.95 | 91.32 | 8.44 | NA | NA | 0.40 | 1.54 | 9.89 | |||||||||||||||||
| TRBK |
Traditions Bancorp, Inc. | 9.80 | 9.80 | 1.44 | 14.22 | 1.62 | 15.97 | NA | NA | 7.21 | 98.29 | 9.64 | 98.29 | 6.42 | NA | NA | 13.51 | |||||||||||||||||
| TRCY |
Tri City Bankshares Corporation | 9.77 | 9.77 | 0.80 | 7.67 | NA | NA | NA | NA | 13.74 | 104.77 | 10.24 | 104.77 | NA | 0.52 | 2.32 | 31.90 | |||||||||||||||||
| TBBC |
Triad Business Bank | 16.59 | 16.59 | -1.16 | -5.89 | -1.23 | -6.21 | 0.00 | NM | NM | 121.44 | 20.15 | 121.44 | NM | NA | NA | NM | |||||||||||||||||
| TYBT |
Trinity Bank, N.A. | 11.00 | 11.00 | 1.41 | 13.08 | 1.41 | 13.08 | 0.08 | NM | 15.91 | 186.23 | 20.49 | 186.23 | 15.91 | 1.38 | 1.88 | 29.44 | |||||||||||||||||
| TRUX |
Truxton Corporation | 9.60 | 9.60 | 1.75 | 16.93 | 1.75 | 16.93 | NA | NA | 14.01 | 224.84 | 21.58 | 224.84 | 14.01 | 1.20 | 1.95 | 49.66 | |||||||||||||||||
| UNPA |
UNB Corp. | 8.89 | 8.89 | 0.32 | 3.30 | 0.23 | 2.35 | 0.05 | NM | 15.38 | 52.52 | 4.67 | 52.52 | 21.55 | 2.00 | 1.51 | 29.03 | |||||||||||||||||
| UFCP |
Union Financial Corporation | 7.13 | 6.83 | 0.60 | 9.13 | NA | NA | NA | NA | 8.15 | 76.29 | 5.44 | 79.86 | NA | 0.12 | 2.38 | 19.35 | |||||||||||||||||
| UNBK |
United National Bank | 13.10 | 13.10 | 1.30 | 9.27 | 1.30 | 9.27 | 2.14 | 94.43 | NA | NA | NA | NA | NA | NA | NA | NA | |||||||||||||||||
| USMT |
US Metro Bancorp, Inc. | 7.94 | NA | 1.16 | 14.29 | NA | NA | NA | NA | 7.64 | 98.59 | 7.82 | NA | NA | NA | NA | NM | |||||||||||||||||
| VERF |
Versailles Financial Corporation | 18.76 | 18.76 | 0.30 | 1.49 | 0.30 | 1.49 | 0.00 | NM | NM | 81.62 | 15.32 | 81.62 | NM | 0.50 | 1.79 | 104.17 | |||||||||||||||||
| WTBF.B |
W.T.B. Financial Corporation | 7.84 | 7.84 | 0.86 | 10.34 | NA | NA | NA | NA | 12.03 | 123.70 | 9.70 | 123.70 | NA | 7.40 | 1.90 | 22.82 | |||||||||||||||||
| WBZB |
Washington Business Bank | NA | NA | NA | NA | NA | NA | NA | NA | 8.93 | 104.21 | NA | 104.21 | NA | NA | NA | NM | |||||||||||||||||
| WCFB |
WCF Bancorp, Inc. | 19.15 | NA | 0.19 | 0.96 | NA | NA | NA | NA | NA | 67.34 | 12.90 | NA | NA | 0.20 | 2.45 | NA | |||||||||||||||||
| WSSH |
West Shore Bank Corp. | 7.96 | 7.64 | 0.75 | 8.82 | 0.72 | 8.42 | 1.05 | 82.65 | NA | NA | NA | NA | NA | 0.88 | 3.12 | NA | |||||||||||||||||
| WDFN |
Woodlands Financial Services Company | 8.82 | 8.82 | 1.01 | 10.72 | 1.00 | 10.67 | NA | NA | 8.76 | 90.14 | 7.95 | 90.14 | 8.80 | 1.08 | 3.55 | 30.26 | |||||||||||||||||
| WOBK |
Woodsboro Bank | 7.24 | 7.24 | 0.56 | 7.06 | 0.56 | 7.06 | 0.37 | 369.02 | NA | 70.73 | NA | 70.73 | NA | 0.16 | 0.36 | NA | |||||||||||||||||
| BCTF |
Bancorp 34, Inc. | 9.37 | 9.35 | 0.75 | 7.53 | NA | NA | NA | NA | 10.79 | 83.42 | NA | 83.58 | NA | 0.20 | 1.61 | 21.74 | |||||||||||||||||
| BERK |
Berkshire Bancorp Inc. | 23.18 | 23.18 | 0.17 | 0.73 | 0.17 | 0.70 | NA | NA | NM | 95.60 | 22.16 | 95.60 | NM | 0.00 | 0.00 | NM | |||||||||||||||||
| CIBH |
CIB Marine Bancshares, Inc. | 14.20 | NA | 1.21 | 8.93 | 1.22 | 8.97 | 0.29 | 519.26 | 6.93 | 53.88 | 5.25 | NA | 6.90 | NA | NA | NM | |||||||||||||||||
| CMUV |
CMUV Bancorp | NA | NA | 1.55 | NA | 1.61 | NA | NA | NA | 7.41 | NA | NA | NA | 7.15 | 0.40 | 3.33 | 28.40 | |||||||||||||||||
| CHBH |
Croghan Bancshares, Inc. | 12.67 | NA | 1.45 | 11.34 | NA | NA | NA | NA | 9.43 | 102.78 | 13.02 | 127.38 | NA | 2.16 | 3.38 | 30.78 | |||||||||||||||||
| EFBI |
Eagle Financial Bancorp, Inc. | 17.66 | 17.66 | 1.23 | 6.81 | 1.23 | 6.81 | NA | NA | 13.35 | NA | NA | NA | 13.35 | 0.20 | 1.08 | 17.99 | |||||||||||||||||
| FMBL |
Farmers & Merchants Bank of Long Beach | 11.15 | 11.15 | 0.96 | 8.43 | 0.96 | 8.43 | 0.45 | 155.68 | 10.90 | 87.31 | 9.74 | 87.31 | 10.90 | 108.00 | 1.31 | 12.68 | |||||||||||||||||
| FBTT |
First Bankers Trustshares, Inc. | 9.01 | 8.77 | 0.65 | 6.76 | 0.65 | 6.74 | 1.07 | 105.26 | 13.30 | 90.51 | 8.15 | 93.19 | 13.34 | 0.72 | 2.30 | 30.21 | |||||||||||||||||
| FNRN |
First Northern Community Bancorp | 8.31 | 8.31 | 0.77 | 8.81 | 0.77 | 8.78 | 0.95 | 88.54 | 11.10 | 96.78 | 8.04 | 96.78 | 11.14 | NA | NA | NM | |||||||||||||||||
| INFT |
Infinity Bank (Santa Ana, CA) | 12.94 | 12.94 | 0.31 | 2.39 | 0.31 | 2.39 | 0.50 | 178.56 | NM | 111.02 | 14.37 | 111.02 | NM | NA | NA | NM | |||||||||||||||||
| JFBC |
Jeffersonville Bancorp | 11.28 | 11.28 | 0.88 | 7.43 | NA | NA | NA | NA | 15.77 | 113.15 | 12.76 | 113.15 | NA | 0.60 | 2.93 | 46.15 | |||||||||||||||||
| JMSB |
John Marshall Bancorp, Inc. | 9.45 | 9.45 | 1.08 | 11.04 | 1.08 | 11.00 | 0.02 | NM | 12.27 | 128.54 | 12.15 | 128.54 | 12.32 | NA | NA | NM | |||||||||||||||||
| LFGP |
Ledyard Financial Group, Inc. | 9.90 | 9.90 | 1.08 | 11.09 | 0.96 | 9.86 | NA | NA | 11.28 | 120.91 | 11.98 | 120.91 | 12.70 | 0.80 | 3.14 | 34.51 | |||||||||||||||||
| LOGN |
Logansport Financial Corp. | 11.44 | 11.44 | 1.72 | 14.42 | 1.46 | 12.25 | NA | NA | 7.19 | 103.12 | 11.79 | 103.12 | 8.47 | 1.60 | 3.39 | 54.79 | |||||||||||||||||
| MNBO |
MNB Holdings Corporation | 12.72 | NA | NA | NA | NA | NA | NA | NA | NA | NA | NA | NA | NA | 0.00 | 0.00 | NA | |||||||||||||||||
| MYBF |
Muncy Bank Financial, Inc. | 10.21 | 10.21 | 1.42 | 14.10 | 1.30 | 12.92 | NA | NA | 8.28 | 109.63 | 11.19 | 109.64 | 9.04 | 1.48 | 3.78 | 30.97 | |||||||||||||||||
| NIDB |
Northeast Indiana Bancorp, Inc. | 11.70 | 11.67 | 1.73 | 15.15 | NA | NA | 0.59 | 184.41 | 7.48 | 108.72 | 12.70 | 109.02 | NA | 1.12 | 2.59 | 36.68 | |||||||||||||||||
| NWYF |
Northway Financial, Inc. | 8.17 | 7.41 | 0.74 | 8.88 | 0.38 | 4.55 | NA | NA | 10.39 | 89.16 | 7.28 | 99.13 | 20.30 | 0.70 | 2.19 | 22.73 | |||||||||||||||||
| PBNK |
Pinnacle Bank | 8.90 | NA | 0.97 | 10.86 | NA | NA | NA | NA | 11.45 | 115.56 | 10.29 | 118.21 | NA | NA | NA | NM | |||||||||||||||||
| QNTO |
Quaint Oak Bancorp, Inc. | 6.30 | 5.70 | 0.92 | 16.73 | 0.89 | 15.24 | 0.09 | NM | 8.00 | 116.04 | 6.87 | 130.07 | 8.23 | 0.44 | 2.44 | 17.78 | |||||||||||||||||
| SUGR |
Sugar Creek Financial Corp. | 10.37 | NA | NA | NA | NA | NA | NA | NA | NA | NA | NA | NA | NA | 0.00 | 0.00 | NA | |||||||||||||||||
| FBPA |
The Farmers Bank of Appomattox | 12.32 | 12.32 | 1.02 | 7.72 | 1.00 | 7.54 | 0.73 | 53.80 | 11.98 | 92.52 | 11.40 | 92.52 | 12.26 | 1.00 | 3.33 | 41.13 | |||||||||||||||||
| UNTN |
United Tennessee Bankshares, Inc. | 9.27 | 9.27 | 0.56 | 5.22 | NA | NA | NA | NA | 14.61 | 77.50 | 7.19 | 77.50 | NA | 0.57 | 2.35 | 34.34 | |||||||||||||||||
| UNIB |
University Bancorp, Inc. | 9.45 | 9.32 | 9.12 | 73.45 | 8.50 | 75.59 | 0.18 | 345.13 | NA | 155.41 | NA | 158.46 | NA | 0.30 | 1.95 | NA | |||||||||||||||||
| FISB |
1st Capital Bancorp | 8.13 | 8.13 | 0.75 | 8.15 | 0.75 | 8.15 | NA | NA | 12.96 | 99.22 | 8.07 | 99.22 | 12.96 | NA | NA | NM | |||||||||||||||||
| ALPI.B |
Alpine Banks of Colorado | 6.91 | 6.62 | 1.10 | 15.30 | 1.10 | 15.27 | 0.26 | 301.11 | 5.03 | 72.38 | 4.99 | 75.72 | 5.05 | 0.64 | 1.68 | 6.35 | |||||||||||||||||
| AMBZ |
American Business Bank | 7.04 | 7.03 | 1.00 | 14.40 | 1.05 | 15.06 | 0.01 | NM | 9.43 | 123.48 | 8.69 | 123.51 | 9.01 | NA | NA | NM | |||||||||||||||||
| ARBV |
American Riviera Bank | 7.89 | 7.48 | 1.08 | 12.72 | 1.09 | 12.76 | 0.30 | 274.63 | 9.08 | 108.81 | 8.59 | 115.37 | 9.05 | NA | NA | NM | |||||||||||||||||
| BOID |
Bank of Idaho Holding Company | 9.08 | 9.08 | 0.98 | 10.25 | 1.00 | 10.41 | NA | NA | 11.68 | 114.81 | 10.43 | 114.81 | 11.50 | NA | NA | NM | |||||||||||||||||
| BSFO |
Bank of San Francisco | 7.70 | NA | 1.13 | 15.87 | 1.13 | 15.87 | NA | NA | 7.29 | 107.39 | 8.27 | 112.55 | 7.29 | NA | NA | NM | |||||||||||||||||
| BFCC |
BankFirst Capital Corporation | 8.50 | 6.49 | 0.93 | 11.03 | NA | NA | NA | NA | 9.77 | 101.86 | 8.66 | 136.47 | NA | 0.50 | 1.69 | 16.56 | |||||||||||||||||
| FHBI |
BayFirst Financial Corp. | 7.75 | NA | 2.04 | 45.43 | 2.04 | 45.43 | NA | NA | 3.51 | 122.33 | 8.47 | NA | 3.51 | 0.28 | 1.08 | 3.69 | |||||||||||||||||
| BHWB |
Blackhawk Bancorp, Inc. | 7.44 | 6.61 | 1.17 | 12.67 | 1.17 | 12.67 | 0.76 | 110.24 | 8.61 | 102.92 | 7.65 | 116.81 | 8.60 | 0.44 | 1.22 | 10.53 | |||||||||||||||||
| BNCC |
BNCCORP, Inc. | 12.75 | 12.75 | 3.64 | 30.50 | NA | NA | NA | NA | 3.61 | 109.47 | 13.96 | 109.47 | NA | NA | NA | 71.24 | |||||||||||||||||
| TYCB |
Calvin B. Taylor Bankshares, Inc. | 11.58 | 11.58 | 1.11 | 8.42 | 1.03 | 7.85 | NA | NA | 12.45 | 102.48 | 11.86 | 102.48 | 13.36 | 1.16 | 3.22 | 40.14 | |||||||||||||||||
| CSHX |
Cashmere Valley Bank | 10.93 | 10.52 | 1.41 | 11.98 | 1.41 | 11.97 | 0.80 | 80.68 | 10.20 | 117.81 | 12.87 | 122.92 | 10.14 | 1.60 | 2.24 | 22.17 | |||||||||||||||||
| CBBI |
CBB Bancorp, Inc. | 10.62 | NA | 1.31 | 11.29 | 1.38 | 11.97 | 0.32 | 291.46 | 7.12 | 75.65 | 8.03 | 78.47 | 6.72 | 0.24 | 1.94 | 6.27 | |||||||||||||||||
| CTUY |
Century Next Financial Corporation | 10.46 | NA | 0.79 | 7.48 | 0.79 | 7.48 | NA | NA | 13.58 | 105.54 | 11.04 | NA | 13.58 | 0.27 | 0.83 | 11.32 | |||||||||||||||||
| CPKF |
Chesapeake Financial Shares, Inc. | NA | NA | 1.30 | 13.50 | 1.25 | 12.99 | NA | NA | 9.11 | 115.79 | NA | 115.79 | 9.47 | 0.52 | 1.78 | 16.07 | |||||||||||||||||
| CBAF |
CITBA Financial Corporation | 9.85 | 9.85 | 0.99 | 9.17 | 0.99 | 9.17 | 0.28 | 273.43 | 9.31 | 84.24 | 8.30 | 84.24 | 9.31 | 0.60 | 2.14 | 18.88 | |||||||||||||||||
| CBTN |
Citizens Bancorp Investment, Inc. | 9.21 | 7.91 | 1.13 | 10.22 | 1.14 | 10.35 | NA | NA | 22.17 | 219.13 | 20.18 | 258.81 | 21.90 | NA | NA | NM | |||||||||||||||||
| CNBN |
CNB Bank Shares, Inc. | 9.77 | 8.33 | 1.00 | 9.97 | 1.00 | 9.97 | 1.41 | 49.67 | NA | 93.69 | NA | 115.56 | NA | 0.48 | 2.09 | NA | |||||||||||||||||
| CNBB |
CNB Community Bancorp, Inc. | 7.35 | 7.12 | 1.15 | 15.64 | NA | NA | NA | NA | 8.19 | 120.01 | 8.82 | 124.20 | NA | 1.08 | 2.49 | 24.01 | |||||||||||||||||
| CCNB |
Coastal Carolina Bancshares, Inc. | 7.97 | 7.54 | 0.85 | 9.76 | NA | NA | NA | NA | 10.99 | 102.81 | 8.20 | 109.18 | NA | NA | NA | NM | |||||||||||||||||
| COSO |
CoastalSouth Bancshares, Inc. | 8.70 | 8.32 | 0.90 | 9.88 | NA | NA | 0.30 | 240.01 | 13.36 | 121.54 | 10.58 | 127.74 | NA | NA | NA | NM | |||||||||||||||||
| CBWA |
Commencement Bancorp Inc. | 9.48 | 9.28 | 0.74 | 7.80 | 0.75 | 7.89 | 0.57 | 148.06 | 14.13 | 106.66 | 10.12 | 109.29 | NA | NA | NA | NM | |||||||||||||||||
| CNAF |
Commercial National Financial Corporation | 14.52 | 14.52 | 1.08 | 6.94 | 1.06 | 6.57 | NA | NA | 12.63 | 87.50 | 12.70 | 87.50 | 12.85 | 1.04 | 5.21 | 129.11 | |||||||||||||||||
| CFST |
Communities First Financial Corporation | 7.97 | 7.97 | 1.83 | 23.82 | NA | NA | NA | NA | 8.56 | 175.57 | 13.99 | 175.57 | NA | NA | NA | NM | |||||||||||||||||
| CMTV |
Community Bancorp | 8.72 | 7.57 | 1.35 | 15.80 | 1.26 | 14.80 | 0.65 | 129.12 | 8.68 | 133.56 | 11.45 | 156.41 | 9.26 | 0.88 | 4.45 | 35.96 | |||||||||||||||||
| CYSM |
Community Bancorp of Santa Maria | 7.76 | 7.76 | 0.75 | 9.24 | NA | NA | NA | NA | NA | 84.92 | NA | 84.92 | NA | 0.15 | 1.34 | NA | |||||||||||||||||
| ALBY |
Community Capital Bancshares, Inc. | NA | NA | 0.74 | 10.38 | NA | NA | NA | NA | 8.96 | 88.27 | NA | 88.27 | NA | 0.00 | 0.00 | NM | |||||||||||||||||
| CBKM |
Consumers Bancorp, Inc. | 8.38 | 8.27 | 1.17 | 13.38 | NA | NA | NA | NA | 6.45 | 83.22 | 6.98 | 84.51 | NA | 0.64 | 3.33 | 20.30 | |||||||||||||||||
| CWBK |
CW Bancorp | 6.28 | 6.04 | 1.22 | 19.66 | NA | NA | NA | NA | 8.09 | 143.81 | 9.04 | 150.10 | NA | 0.80 | 2.67 | 21.56 | |||||||||||||||||
| DBIN |
Dacotah Banks, Inc. | 11.10 | 10.79 | 0.93 | 8.27 | 0.93 | 8.27 | NA | NA | 12.64 | 101.13 | 11.22 | 104.35 | 12.64 | 0.64 | 1.94 | 33.33 | |||||||||||||||||
| DMKB.A |
Denmark Bancshares, Inc. | 10.26 | 10.26 | NA | NA | NA | NA | NA | NA | NA | 117.26 | 12.03 | 117.26 | NA | 0.60 | 2.40 | NA | |||||||||||||||||
| DSBX |
Dogwood State Bank | 15.55 | 14.59 | 0.29 | 2.07 | 0.27 | 1.95 | 0.06 | 997.69 | NA | NA | NA | NA | NA | NA | NA | NA | |||||||||||||||||
| EFSI |
Eagle Financial Services, Inc. | 8.83 | 8.83 | 1.05 | 11.27 | 1.02 | 10.98 | 0.56 | 125.90 | 10.03 | 110.38 | 9.74 | 110.38 | 10.29 | 1.12 | 3.25 | 31.40 | |||||||||||||||||
| EMYB |
Embassy Bancorp, Inc. | 7.65 | 7.65 | 1.07 | 13.53 | 1.07 | 13.51 | 0.22 | 333.83 | 9.59 | 124.85 | 9.55 | 124.85 | 9.60 | 0.30 | 1.56 | 14.93 | |||||||||||||||||
| ENBP |
ENB Financial Corp | 8.61 | 8.61 | 1.02 | 11.39 | 0.97 | 10.83 | NA | NA | 8.37 | 90.22 | 7.77 | 90.22 | 8.80 | 0.68 | 3.09 | 25.10 | |||||||||||||||||
| EQFN |
Equitable Financial Corp. | 9.24 | 8.88 | 0.93 | 9.86 | 0.97 | 10.22 | 0.59 | 204.29 | 9.93 | 93.02 | 8.59 | 97.11 | 9.58 | NA | NA | NM | |||||||||||||||||
| ESBS |
ES Bancshares, Inc. | 7.11 | 7.00 | 0.58 | 8.56 | 0.58 | 8.56 | NA | NA | 11.65 | 90.70 | 6.45 | 92.15 | 11.65 | NA | NA | NM | |||||||||||||||||
| FMBM |
F & M Bank Corp. | 9.07 | 8.80 | 1.19 | 12.53 | 1.10 | 11.64 | 1.06 | 74.30 | 8.17 | 95.62 | 8.31 | 98.94 | 8.79 | 1.04 | 3.65 | 29.80 | |||||||||||||||||
| FMCB |
Farmers & Merchants Bancorp | 8.90 | 8.63 | 1.40 | 14.91 | 1.36 | 14.55 | 0.19 | 718.38 | 11.26 | 161.85 | 14.41 | 167.54 | 11.54 | 15.00 | 1.67 | 18.79 | |||||||||||||||||
| FETM |
Fentura Financial, Inc. | 9.39 | 9.14 | 1.36 | 14.85 | 1.50 | 16.36 | NA | NA | 6.94 | 97.87 | 9.19 | 100.85 | 6.30 | 0.32 | 1.23 | 8.42 | |||||||||||||||||
| FNBT |
FineMark Holdings, Inc. | 9.09 | 9.09 | 0.83 | 10.68 | 0.76 | 9.74 | NA | NA | 13.92 | 138.62 | 12.59 | 138.62 | 15.26 | NA | NA | NM | |||||||||||||||||
| FFMR |
First Farmers Financial Corporation | 10.01 | 9.62 | 1.48 | 14.24 | 1.47 | 14.13 | NA | NA | 10.26 | 140.60 | 14.07 | 146.80 | 10.34 | 1.36 | 3.09 | 30.77 | |||||||||||||||||
| FBAK |
First National Bank Alaska | 10.81 | 10.81 | 1.19 | 9.71 | NA | NA | 0.52 | 90.07 | 13.11 | 128.35 | 13.88 | 128.35 | NA | 12.80 | 5.47 | 71.75 | |||||||||||||||||
| FRSB |
First Resource Bank | 7.30 | 7.30 | 0.93 | 12.41 | 0.93 | 12.41 | NA | NA | 8.44 | 95.43 | 6.96 | 95.43 | 8.44 | NA | NA | NM | |||||||||||||||||
| GBFH |
GBank Financial Holdings Inc. | 12.74 | 12.74 | NA | NA | NA | NA | 0.22 | 489.55 | NA | 177.15 | 22.57 | 177.15 | NA | NA | NA | NA | |||||||||||||||||
| GNRV |
Grand River Commerce, Inc. | 9.08 | NA | 1.02 | 10.66 | NA | NA | 0.00 | NM | NA | 116.49 | NA | NA | NA | NA | NA | NA | |||||||||||||||||
| GRRB |
GrandSouth Bancorporation | 7.69 | 7.63 | 1.17 | 14.84 | 1.17 | 14.77 | 0.31 | 749.86 | 10.73 | 141.58 | 10.74 | 142.77 | 10.76 | 0.40 | 1.64 | 16.74 |
| HARL |
Harleysville Financial Corporation | 8.94 | 8.94 | 0.86 | 9.49 | 0.86 | 9.49 | NA | NA | 12.58 | 116.39 | 10.40 | 116.39 | 12.58 | 1.12 | 4.45 | 55.50 | |||||||||||||||||
| HLAN |
Heartland BancCorp | 9.71 | 8.89 | 1.16 | 12.62 | 1.16 | 12.58 | 0.23 | 400.55 | 10.35 | 123.27 | 11.97 | 135.78 | 10.31 | 2.51 | 2.77 | 28.04 | |||||||||||||||||
| HCBC |
High Country Bancorp, Inc. | 9.69 | 9.69 | 1.46 | 14.26 | NA | NA | 0.46 | 178.93 | 9.19 | 125.94 | 12.20 | 125.94 | NA | 1.00 | 2.27 | 41.62 | |||||||||||||||||
| INBC |
InBankshares, Corp | NA | NA | NA | NA | NA | NA | NA | NA | NA | 105.38 | NA | NA | NA | NA | NA | NA | |||||||||||||||||
| IBTN |
InsCorp, Inc. | 8.19 | 8.04 | 0.61 | 7.36 | NA | NA | NA | NA | 13.23 | NA | NA | NA | NA | 0.24 | 1.40 | 9.23 | |||||||||||||||||
| IFHI |
Integrated Financial Holdings, Inc. | 19.08 | 15.25 | 2.93 | 14.80 | 2.79 | 14.15 | NA | NA | 5.29 | 74.35 | 14.25 | 97.27 | 5.54 | NA | NA | NM | |||||||||||||||||
| ISBA |
Isabella Bank Corporation | 10.88 | 8.71 | 0.69 | 6.14 | 0.68 | 6.09 | 1.50 | 31.08 | 13.72 | 82.03 | 8.92 | 104.98 | 13.83 | 1.08 | 4.69 | 64.29 | |||||||||||||||||
| JDVB |
JD Bancshares, Inc. | 7.32 | 7.03 | 0.69 | 8.85 | 0.65 | 8.27 | NA | NA | 10.48 | 89.35 | 6.54 | 93.26 | NA | 0.90 | 3.46 | 38.02 | |||||||||||||||||
| KTHN |
Katahdin Bankshares Corp. | 8.44 | 7.88 | 1.13 | 14.06 | NA | NA | NA | NA | 7.18 | 96.82 | 8.17 | 104.25 | NA | 0.50 | 2.15 | 15.03 | |||||||||||||||||
| KISB |
Kish Bancorp, Inc. | 6.40 | 6.11 | 0.88 | 13.86 | 0.80 | 12.66 | NA | NA | 10.13 | 136.39 | 8.72 | 143.27 | NA | 1.16 | 3.01 | 29.47 | |||||||||||||||||
| LYBC |
Lyons Bancorp Inc. | 6.06 | 6.06 | 0.76 | 11.61 | 0.76 | 11.84 | NA | NA | 12.15 | 143.32 | 8.26 | 143.32 | 12.11 | 1.24 | 3.03 | 39.76 | |||||||||||||||||
| MNAT |
Marquette National Corporation | 9.32 | 7.71 | 1.45 | 14.98 | 0.35 | 3.64 | NA | NA | 5.79 | 82.99 | 7.73 | 102.13 | 23.69 | 1.08 | 3.04 | 17.43 | |||||||||||||||||
| MNBP |
Mars Bancorp, Inc. | 8.36 | 8.36 | 0.48 | 5.62 | NA | NA | NA | NA | 14.48 | 81.42 | 6.80 | 81.42 | NA | 0.64 | 3.18 | 45.03 | |||||||||||||||||
| MNMB |
Merchants & Marine Bancorp, Inc. | 11.17 | NA | 0.30 | 2.49 | 0.29 | 2.42 | NA | NA | 28.95 | 71.36 | 7.97 | 76.97 | 29.82 | 1.20 | 2.73 | 75.66 | |||||||||||||||||
| MVLY |
Mission Valley Bancorp | 9.80 | 9.80 | 0.75 | 8.86 | NA | NA | NA | NA | 14.34 | 123.00 | NA | 123.00 | NA | 0.00 | 0.00 | NM | |||||||||||||||||
| MBLU |
Morris State Bancshares, Inc. | 10.32 | 9.51 | 1.66 | 16.12 | NA | NA | NA | NA | 7.59 | 112.17 | 11.58 | 122.79 | NA | 1.52 | 2.07 | 15.39 | |||||||||||||||||
| MCBI |
Mountain Commerce Bancorp, Inc. | 9.31 | 9.31 | 1.68 | 18.51 | 1.70 | 18.74 | NA | NA | 8.79 | 148.09 | 13.79 | 148.09 | 8.68 | 0.54 | 2.00 | 12.70 | |||||||||||||||||
| NASB |
NASB Financial, Inc. | 17.24 | 16.87 | 4.17 | 27.99 | NA | NA | NA | NA | 4.62 | 119.68 | 20.64 | 122.89 | NA | 3.00 | 4.66 | 18.66 | |||||||||||||||||
| OSBK |
Oconee Financial Corporation | 7.35 | NA | 0.50 | 6.59 | 0.51 | 6.68 | NA | NA | 14.85 | 95.08 | 6.99 | NA | 14.64 | 0.65 | 1.57 | 23.38 | |||||||||||||||||
| OTTW |
Ottawa Bancorp, Inc. | 14.76 | 14.56 | 0.94 | 6.05 | 0.95 | 6.11 | NA | NA | 14.42 | 89.04 | 13.14 | 90.45 | 14.27 | 0.40 | 2.69 | 61.17 | |||||||||||||||||
| PFLC |
Pacific Financial Corporation | 9.14 | NA | 1.32 | 13.78 | 1.32 | 13.78 | 0.28 | 270.42 | 8.20 | 108.70 | 9.94 | 126.30 | 8.20 | 0.52 | 4.23 | 31.33 | |||||||||||||||||
| PKKW |
Parkway Acquisition Corp. | 9.19 | 8.68 | 0.84 | 8.56 | 0.87 | 8.89 | 0.52 | 108.47 | 10.21 | 84.65 | 7.78 | 90.13 | 9.83 | 0.28 | 2.29 | 22.50 | |||||||||||||||||
| PBNC |
PB Financial Corporation | 9.74 | NA | 1.39 | 14.17 | NA | NA | NA | NA | 9.63 | 127.47 | 12.42 | NA | NA | 1.04 | 2.94 | 26.16 | |||||||||||||||||
| PFBX |
Peoples Financial Corporation | 12.53 | 12.53 | 0.22 | 1.59 | 0.35 | 2.57 | NA | NA | NM | 81.16 | 10.17 | 81.16 | 31.29 | 0.10 | 0.63 | 31.25 | |||||||||||||||||
| PPBN |
Pinnacle Bankshares Corporation | 6.37 | NA | 0.53 | 7.54 | NA | NA | 0.33 | 140.13 | 10.97 | 84.55 | 5.38 | NA | NA | 0.56 | 2.42 | 26.54 | |||||||||||||||||
| PMHG |
Prime Meridian Holding Company | 8.43 | 8.43 | 1.13 | 12.52 | 1.12 | 12.38 | 0.00 | NM | 9.58 | 112.73 | 9.50 | 112.73 | 9.69 | 0.14 | 0.61 | 5.83 | |||||||||||||||||
| PBAM |
Private Bancorp of America, Inc. | 8.41 | NA | 1.21 | 14.56 | 1.21 | 14.56 | NA | NA | 8.96 | 120.67 | 10.15 | NA | 8.96 | NA | NA | NM | |||||||||||||||||
| PSBP |
PSB Holding Corp. | 8.86 | 8.86 | 0.98 | 11.24 | 0.98 | 11.20 | NA | NA | 7.69 | 82.70 | 7.33 | 82.70 | 7.72 | 0.18 | 0.66 | 5.07 | |||||||||||||||||
| PSBQ |
PSB Holdings, Inc. | 8.61 | 8.38 | 1.04 | 11.49 | 1.21 | 13.40 | 1.07 | 103.06 | 9.27 | 102.11 | 8.79 | 105.19 | 7.94 | 0.46 | 1.86 | 16.48 | |||||||||||||||||
| SCZC |
Santa Cruz County Bank | 10.95 | 9.37 | 1.39 | 12.11 | 1.43 | 12.47 | 0.01 | NM | 9.28 | 106.19 | 11.63 | 126.32 | 9.01 | 0.50 | 1.02 | 7.10 | |||||||||||||||||
| SABK |
South Atlantic Bancshares, Inc. | 8.97 | 8.49 | 0.99 | 10.01 | 0.93 | 9.33 | NA | NA | 11.45 | 107.45 | 9.64 | 114.22 | 12.28 | NA | NA | NM | |||||||||||||||||
| STBI |
Sturgis Bancorp, Inc. | 7.04 | 6.26 | 0.90 | 12.55 | 0.86 | 11.92 | NA | NA | 6.71 | 79.71 | 5.62 | 90.42 | 7.06 | 0.64 | 3.43 | 23.02 | |||||||||||||||||
| SVBT |
SVB & T Corporation | 10.91 | 10.91 | 1.39 | 13.55 | NA | NA | NA | NA | 7.64 | 96.38 | 10.49 | 96.38 | NA | 1.08 | 1.14 | 6.44 | |||||||||||||||||
| FDVA |
The Freedom Bank of Virginia | 9.44 | 9.44 | 1.30 | 13.81 | 1.29 | 13.62 | 0.11 | 655.86 | 9.17 | 117.08 | 11.05 | 117.08 | 9.31 | NA | NA | NM | |||||||||||||||||
| VTYB |
The Victory Bancorp, Inc. | 5.18 | 5.18 | 0.75 | 14.81 | NA | NA | NA | NA | 7.77 | 105.21 | 5.45 | 105.21 | NA | 0.20 | 1.58 | 6.13 | |||||||||||||||||
| TCNB |
Town Center Bank | 9.83 | 9.83 | 0.66 | 6.75 | 0.65 | 6.64 | 1.59 | 46.07 | 8.81 | 57.28 | 5.63 | 57.28 | 8.95 | NA | NA | NM | |||||||||||||||||
| TYFG |
Tri-County Financial Group, Inc. | 9.68 | 9.12 | 1.43 | 15.14 | 1.45 | 15.37 | NA | NA | 6.05 | 86.88 | 8.41 | 92.74 | NA | 0.60 | 1.29 | 9.75 | |||||||||||||||||
| TRVR |
Two Rivers Financial Group, Inc. | 10.49 | 9.70 | 2.09 | 20.85 | NA | NA | NA | NA | 4.21 | 81.06 | 8.50 | 88.42 | NA | 0.66 | 1.67 | 7.04 | |||||||||||||||||
| UNIF |
U & I Financial Corp. | 15.04 | NA | 1.85 | 12.38 | 1.85 | 12.38 | NA | NA | 7.33 | 85.33 | 12.84 | 89.48 | 7.33 | 0.00 | 0.00 | NM | |||||||||||||||||
| UBNC |
UB Bancorp | 8.85 | 7.71 | 0.85 | 9.26 | NA | NA | NA | NA | 12.15 | 109.03 | 9.65 | 126.77 | NA | 0.21 | 1.20 | 14.24 | |||||||||||||||||
| UBAB |
United Bancorporation of Alabama, Inc. | 10.52 | 10.52 | 1.66 | 16.19 | 0.80 | 7.75 | NA | NA | 7.05 | 104.35 | 10.98 | 104.35 | 14.69 | 0.24 | 0.81 | 6.40 | |||||||||||||||||
| UWHR |
Uwharrie Capital Corp | 7.28 | 7.28 | 1.52 | 21.46 | 1.34 | 23.26 | 0.83 | 59.33 | 5.15 | 117.66 | 7.18 | 117.66 | 5.87 | NA | NA | NM | |||||||||||||||||
| WAYN |
Wayne Savings Bancshares, Inc. | 8.27 | 8.02 | 1.27 | 14.36 | NA | NA | NA | NA | 8.89 | 120.25 | 9.95 | 124.35 | NA | 0.84 | 3.22 | 27.99 | |||||||||||||||||
| WBBW |
Westbury Bancorp, Inc. | 9.46 | 9.46 | 1.02 | 11.33 | NA | NA | NA | NA | 8.25 | 91.51 | 8.65 | 91.51 | NA | NA | NA | NM | |||||||||||||||||
| WRIV |
White River Bancshares Co | 9.55 | NA | 0.79 | 8.16 | NA | NA | 0.00 | NM | 12.46 | 97.18 | 9.28 | NA | NA | 0.50 | 0.64 | 8.03 | |||||||||||||||||
| MTFC |
Minster Financial Corp. | 9.13 | NA | NA | NA | NA | NA | NA | NA | NA | NA | NA | NA | NA | 2.20 | 3.31 | NA | |||||||||||||||||
| Partial Stock Mutual Holding Companies(8) |
||||||||||||||||||||||||||||||||||
| BSBK |
Bogota Financial Corp. |
17.66 |
17.62 |
0.83 |
4.84 |
0.69 |
4.04 |
NA |
NA |
21.12 |
103.24 |
18.23 |
103.51 |
25.36 |
NA |
NA |
NM | |||||||||||||||||
| CULL |
Cullman Bancorp, Inc. |
15.36 |
15.36 |
1.03 |
6.12 |
NA |
NA |
0.13 |
NM |
NA |
138.38 |
21.26 |
138.38 |
NA |
0.12 |
1.07 |
NA | |||||||||||||||||
| First Seacoast Bancorp |
12.54 |
12.54 |
0.44 |
3.44 |
0.32 |
2.55 |
0.00 |
NM |
28.00 |
98.34 |
12.33 |
98.34 |
NM |
NA |
NA |
NM | ||||||||||||||||||
| GCBC |
Greene County Bancorp, Inc. |
6.80 |
6.80 |
1.23 |
17.41 |
1.23 |
17.41 |
NA |
NA |
10.68 |
170.74 |
11.61 |
170.74 |
10.68 |
0.52 |
1.73 |
17.44 | |||||||||||||||||
| OFED |
Oconee Federal Financial Corp. |
NA |
NA |
0.78 |
NA |
NA |
NA |
NA |
NA |
32.64 |
150.09 |
NA |
154.94 |
NA |
0.40 |
1.70 |
55.56 | |||||||||||||||||
| PBFS |
Pioneer Bancorp, Inc. |
12.79 |
12.33 |
0.39 |
2.70 |
0.27 |
1.92 |
1.07 |
121.33 |
NM |
136.32 |
17.43 |
142.05 |
NM |
NA |
NA |
NM | |||||||||||||||||
| RBKB |
Rhinebeck Bancorp, Inc. |
10.07 |
9.87 |
0.82 |
8.00 |
0.81 |
7.94 |
0.56 |
151.70 |
12.38 |
97.30 |
9.80 |
99.52 |
12.48 |
NA |
NA |
NM | |||||||||||||||||
| KFFB |
Kentucky First Federal Bancorp |
15.60 |
15.36 |
-3.71 |
-22.65 |
-0.44 |
-2.67 |
NA |
NA |
NM |
112.09 |
17.49 |
114.17 |
NM |
0.40 |
5.66 |
NM | |||||||||||||||||
| LSBK |
Lake Shore Bancorp, Inc. |
12.16 |
12.16 |
0.75 |
5.99 |
0.77 |
6.16 |
0.42 |
225.85 |
16.93 |
99.34 |
12.08 |
99.34 |
16.46 |
0.56 |
3.76 |
60.23 | |||||||||||||||||
| PDLB |
PDL Community Bancorp |
11.11 |
11.11 |
1.04 |
8.59 |
NA |
NA |
NA |
101.94 |
16.17 |
136.90 |
15.20 |
136.90 |
NA |
NA |
NA |
NM | |||||||||||||||||
| CLBK |
Columbia Financial, Inc. |
11.39 |
10.56 |
0.94 |
8.21 |
1.00 |
8.79 |
NA |
NA |
23.34 |
191.90 |
21.86 |
209.08 |
21.81 |
NA |
NA |
NM | |||||||||||||||||
| TFSL |
TFS Financial Corporation |
12.01 |
11.95 |
0.53 |
4.60 |
NA |
NA |
1.01 |
46.17 |
NM |
324.17 |
38.93 |
326.02 |
NA |
1.12 |
5.67 |
400.00 | |||||||||||||||||
| FSGB |
1st Federal Savings Bank of SC, Inc. |
8.31 |
8.31 |
0.88 |
10.10 |
0.88 |
10.10 |
0.20 |
736.51 |
14.08 |
137.68 |
11.45 |
137.68 |
14.08 |
0.00 |
0.00 |
NM | |||||||||||||||||
| ABBB |
Auburn Bancorp, Inc. |
8.05 |
8.05 |
0.46 |
5.14 |
0.46 |
5.14 |
1.66 |
51.79 |
15.31 |
77.36 |
6.23 |
77.36 |
15.31 |
NA |
NA |
NM | |||||||||||||||||
| BVFL |
BV Financial, Inc. |
9.72 |
NA |
1.18 |
10.55 |
NA |
NA |
NA |
NA |
17.36 |
NA |
NA |
NA |
NA |
0.00 |
0.00 |
NM | |||||||||||||||||
| GOVB |
Gouverneur Bancorp, Inc. |
20.67 |
20.67 |
0.86 |
4.06 |
NA |
NA |
NA |
NA |
18.18 |
74.00 |
15.29 |
74.00 |
NA |
0.24 |
2.40 |
65.45 | |||||||||||||||||
| GVFF |
Greenville Federal Financial Corporation |
9.86 |
9.86 |
0.31 |
2.95 |
0.31 |
2.95 |
NA |
NA |
26.00 |
79.30 |
NA |
79.30 |
26.00 |
0.28 |
3.47 |
90.32 | |||||||||||||||||
| LSFG |
Lifestore Financial Group, Inc. |
10.61 |
10.61 |
1.76 |
16.35 |
NA |
NA |
0.65 |
148.06 |
7.14 |
105.28 |
11.17 |
105.28 |
NA |
0.29 |
0.68 |
4.83 | |||||||||||||||||
| LPBC |
Lincoln Park Bancorp. |
5.28 |
5.26 |
-0.25 |
-4.60 |
NA |
NA |
NA |
NA |
NM |
NA |
NA |
NA |
NA |
0.00 |
0.00 |
NM | |||||||||||||||||
| MBBC |
Marathon Bancorp, Inc. |
10.11 |
10.11 |
NA |
NA |
NA |
NA |
0.26 |
382.49 |
NA |
NA |
NA |
NA |
NA |
NA |
NA |
NA | |||||||||||||||||
| MFDB |
Mutual Federal Bancorp, Inc. |
18.72 |
NA |
NA |
NA |
NA |
NA |
NA |
NA |
NA |
NA |
NA |
NA |
NA |
0.00 |
0.00 |
NA | |||||||||||||||||
| SNNF |
Seneca Financial Corp. |
NA |
NA |
NA |
NA |
NA |
NA |
NA |
NA |
NA |
NA |
NA |
NA |
NA |
NA |
NA |
NA | |||||||||||||||||
| SSBP |
SSB Bancorp, Inc. |
9.63 |
NA |
NA |
NA |
NA |
NA |
NA |
NA |
NA |
99.49 |
NA |
99.49 |
NA |
NA |
NA |
NA | |||||||||||||||||
| TBBA |
TEB Bancorp, Inc |
9.39 |
9.39 |
1.87 |
21.97 |
1.87 |
21.97 |
0.45 |
145.61 |
4.34 |
86.51 |
8.12 |
86.51 |
4.34 |
NA |
NA |
NM | |||||||||||||||||
| WAKE |
Wake Forest Bancshares, Inc. |
NA |
NA |
1.08 |
NA |
NA |
NA |
NA |
NA |
17.31 |
NA |
NA |
NA |
NA |
0.40 |
2.16 |
36.45 | |||||||||||||||||
| Current Merger Target (9) |
||||||||||||||||||||||||||||||||||
| ALTA |
Altabancorp |
10.47 |
9.72 |
1.34 |
12.25 |
1.39 |
12.73 |
0.10 |
NM |
17.83 |
213.40 |
22.34 |
231.66 |
17.15 |
0.68 |
1.62 |
26.38 | |||||||||||||||||
| ESXB |
Community Bankers Trust Corporation |
10.25 |
10.25 |
1.32 |
12.88 |
1.35 |
13.11 |
0.46 |
144.66 |
11.33 |
138.66 |
14.21 |
138.66 |
11.13 |
0.28 |
2.52 |
25.51 | |||||||||||||||||
| CLDB |
Cortland Bancorp |
10.49 |
10.49 |
1.21 |
12.17 |
1.22 |
12.25 |
0.88 |
86.14 |
11.66 |
138.39 |
14.52 |
138.39 |
11.58 |
0.60 |
2.22 |
27.16 | |||||||||||||||||
| FVCB |
FVCBankcorp, Inc. |
10.16 |
9.79 |
1.06 |
10.29 |
1.08 |
10.40 |
0.41 |
345.33 |
14.61 |
137.10 |
13.93 |
142.94 |
14.45 |
NA |
NA |
NM | |||||||||||||||||
| HBMD |
Howard Bancorp, Inc. |
11.67 |
10.42 |
0.89 |
7.70 |
1.05 |
9.07 |
0.65 |
112.76 |
15.86 |
119.92 |
13.99 |
136.09 |
13.47 |
NA |
NA |
NM | |||||||||||||||||
| MFNC |
Mackinac Financial Corporation |
11.32 |
9.92 |
0.91 |
8.19 |
0.97 |
8.76 |
0.80 |
52.26 |
16.06 |
130.10 |
14.73 |
150.81 |
15.02 |
0.56 |
2.64 |
42.42 | |||||||||||||||||
| RBNC |
Reliant Bancorp, Inc. |
11.18 |
9.28 |
1.62 |
15.29 |
1.55 |
14.70 |
NA |
NA |
9.68 |
137.46 |
15.36 |
169.12 |
10.07 |
0.48 |
1.68 |
15.59 | |||||||||||||||||
| SVBI |
Severn Bancorp, Inc. |
9.85 |
9.79 |
1.02 |
9.15 |
1.04 |
9.39 |
0.71 |
111.38 |
15.68 |
139.62 |
13.75 |
140.58 |
15.28 |
0.20 |
1.64 |
23.08 | |||||||||||||||||
| FCCY |
1st Constitution Bancorp |
10.94 |
9.07 |
1.16 |
11.32 |
1.19 |
11.61 |
0.97 |
97.55 |
10.56 |
113.80 |
12.44 |
140.05 |
10.29 |
0.40 |
1.85 |
18.54 | |||||||||||||||||
| BOCH |
Bank of Commerce Holdings |
9.50 |
8.77 |
1.03 |
10.50 |
1.10 |
11.14 |
0.40 |
222.46 |
13.06 |
133.30 |
12.66 |
145.55 |
12.30 |
0.24 |
1.67 |
26.36 | |||||||||||||||||
| ICBK |
County Bancorp, Inc. |
11.52 |
11.52 |
1.25 |
10.88 |
1.29 |
11.23 |
2.55 |
30.40 |
12.12 |
127.43 |
14.09 |
127.44 |
11.74 |
0.40 |
1.13 |
13.75 | |||||||||||||||||
| PFBI |
Premier Financial Bancorp, Inc. |
11.98 |
9.74 |
1.19 |
9.14 |
1.20 |
9.20 |
1.17 |
107.63 |
11.54 |
107.63 |
12.89 |
135.75 |
11.47 |
0.60 |
3.31 |
101.91 | |||||||||||||||||
| RIVE |
Riverview Financial Corporation |
8.59 |
8.47 |
0.75 |
10.29 |
NA |
NA |
0.98 |
93.10 |
11.47 |
112.13 |
9.63 |
113.94 |
NA |
0.00 |
0.00 |
NM | |||||||||||||||||
| SLCT |
Select Bancorp, Inc. |
11.81 |
9.69 |
1.03 |
8.50 |
1.13 |
9.33 |
0.67 |
116.71 |
16.04 |
129.76 |
15.33 |
162.04 |
14.63 |
NA |
NA |
NM | |||||||||||||||||
| ACBI |
Atlantic Capital Bancshares, Inc. |
9.34 |
8.80 |
1.28 |
12.80 |
1.28 |
12.80 |
0.45 |
152.47 |
11.50 |
139.63 |
13.04 |
149.16 |
11.50 |
NA |
NA |
NM | |||||||||||||||||
| BMTC |
Bryn Mawr Bank Corporation |
12.99 |
9.37 |
1.33 |
10.80 |
1.41 |
11.50 |
0.33 |
240.35 |
12.02 |
124.18 |
16.14 |
179.17 |
11.31 |
1.12 |
2.78 |
32.54 | |||||||||||||||||
| CNBK.A |
Century Bancorp, Inc. |
5.40 |
5.37 |
0.65 |
11.85 |
0.65 |
11.84 |
0.05 |
NM |
14.47 |
162.29 |
8.77 |
163.42 |
14.47 |
0.72 |
0.63 |
8.85 | |||||||||||||||||
| FMBI |
First Midwest Bancorp, Inc. |
12.50 |
8.59 |
0.78 |
6.17 |
1.01 |
7.97 |
0.70 |
171.32 |
14.01 |
84.70 |
9.79 |
135.39 |
10.55 |
0.56 |
3.05 |
42.75 | |||||||||||||||||
| ISBC |
Investors Bancorp, Inc. |
10.50 |
10.17 |
1.10 |
10.72 |
1.14 |
11.13 |
0.35 |
310.77 |
11.08 |
120.90 |
12.69 |
125.26 |
10.67 |
0.56 |
4.08 |
43.55 | |||||||||||||||||
| MRLN |
Marlin Business Services Corp. |
21.42 |
20.99 |
3.40 |
18.25 |
3.93 |
21.05 |
NA |
209.39 |
7.57 |
125.97 |
26.98 |
129.25 |
6.55 |
0.56 |
2.53 |
19.18 | |||||||||||||||||
| EBSB |
Meridian Bancorp, Inc. |
12.74 |
12.44 |
1.16 |
9.81 |
1.16 |
9.80 |
0.19 |
537.81 |
14.03 |
137.30 |
17.50 |
141.14 |
14.06 |
0.40 |
1.91 |
24.16 | |||||||||||||||||
| PMBC |
Pacific Mercantile Bancorp |
10.85 |
10.82 |
1.00 |
10.12 |
1.01 |
10.25 |
1.92 |
58.86 |
13.12 |
126.16 |
13.69 |
126.47 |
12.96 |
NA |
NA |
NM | |||||||||||||||||
| PBCT |
People's United Financial, Inc. |
12.23 |
8.14 |
0.50 |
4.07 |
0.95 |
7.70 |
0.68 |
82.54 |
22.28 |
90.16 |
10.73 |
144.61 |
11.55 |
0.73 |
4.61 |
102.11 | |||||||||||||||||
| CADE |
Cadence Bancorporation |
11.78 |
11.23 |
2.47 |
21.99 |
1.86 |
16.53 |
NA |
NA |
5.68 |
115.88 |
13.65 |
122.38 |
7.54 |
0.60 |
2.93 |
49.31 | |||||||||||||||||
| CIT |
CIT Group Inc. |
11.03 |
10.84 |
1.09 |
10.78 |
1.21 |
11.99 |
NA |
NA |
8.77 |
94.33 |
9.59 |
96.39 |
7.67 |
1.40 |
2.67 |
23.41 | |||||||||||||||||
| FBC |
Flagstar Bancorp, Inc. |
9.23 |
8.72 |
2.32 |
29.40 |
2.47 |
NA |
0.44 |
177.19 |
3.95 |
108.36 |
NA |
115.98 |
3.70 |
0.24 |
0.50 |
1.88 | |||||||||||||||||
| STL |
Sterling Bancorp |
16.21 |
10.79 |
1.20 |
7.79 |
1.28 |
8.33 |
0.68 |
159.03 |
12.25 |
93.19 |
14.74 |
151.73 |
11.44 |
0.28 |
1.26 |
15.47 | |||||||||||||||||
| AQFH |
Aquesta Financial Holdings, Inc. |
8.43 |
NA |
0.99 |
11.92 |
NA |
NA |
0.15 |
534.34 |
16.16 |
NA |
NA |
NA |
NA |
0.14 |
0.72 |
21.67 | |||||||||||||||||
| BSCA |
Bank of Santa Clarita |
10.30 |
10.30 |
0.90 |
8.68 |
0.90 |
8.68 |
0.35 |
177.38 |
NA |
122.10 |
12.58 |
122.10 |
NA |
NA |
NA |
NA | |||||||||||||||||
| CCSB |
Community Savings Bancorp, Inc. |
12.83 |
12.76 |
0.40 |
2.83 |
0.39 |
2.74 |
1.33 |
35.35 |
NA |
NA |
NA |
NA |
NA |
NA |
NA |
NA | |||||||||||||||||
| FNHM |
FNBH Bancorp, Inc. |
10.26 |
10.26 |
1.11 |
10.11 |
NA |
NA |
NA |
NA |
16.92 |
169.87 |
17.43 |
169.87 |
NA |
0.00 |
0.00 |
NM | |||||||||||||||||
| GNBF |
GNB Financial Services, Inc. |
11.44 |
10.88 |
0.98 |
8.46 |
0.99 |
8.57 |
NA |
NA |
16.26 |
132.78 |
15.18 |
140.44 |
16.06 |
1.24 |
1.43 |
27.44 | |||||||||||||||||
| GPBI |
Golden Pacific Bancorp, Inc. |
10.88 |
10.79 |
NA |
NA |
NA |
NA |
1.23 |
71.63 |
NA |
NA |
NA |
NA |
NA |
NA |
NA |
NA | |||||||||||||||||
| PFOH |
Perpetual Federal Savings Bank |
20.05 |
20.05 |
1.20 |
5.99 |
NA |
NA |
NA |
NA |
21.21 |
125.76 |
25.21 |
125.76 |
NA |
1.00 |
2.48 |
78.95 | |||||||||||||||||
| PONB |
Pioneer Bancshares, Inc. |
9.10 |
8.96 |
0.73 |
8.07 |
0.49 |
5.42 |
0.29 |
220.09 |
NA |
NA |
NA |
NA |
NA |
NA |
NA |
NA | |||||||||||||||||
| SVRH |
Sevier County Bancshares, Inc. |
6.90 |
6.90 |
NA |
NA |
NA |
NA |
NA |
NA |
NA |
204.26 |
14.10 |
204.26 |
NA |
NA |
NA |
NA | |||||||||||||||||
| SDGB |
SSNB Inc |
8.69 |
NA |
NA |
NA |
NA |
NA |
NA |
NA |
NA |
178.68 |
15.53 |
NA |
NA |
0.28 |
0.47 |
NA | |||||||||||||||||
| SNNY |
Sunnyside Bancorp, Inc. |
10.90 |
10.90 |
-0.90 |
-7.73 |
-0.39 |
-3.38 |
NA |
50.62 |
NM |
139.48 |
15.21 |
139.48 |
NM |
NA |
NA |
NM | |||||||||||||||||
| WNRP |
West Suburban Bancorp, Inc. |
8.12 |
NA |
NA |
NA |
NA |
NA |
1.16 |
64.96 |
NA |
123.12 |
NA |
NA |
NA |
24.00 |
3.23 |
NA | |||||||||||||||||
| HSBI |
Heritage Southeast Bancorporation Inc. |
9.02 |
6.99 |
0.57 |
6.31 |
0.81 |
8.87 |
NA |
NA |
20.00 |
123.03 |
11.10 |
162.24 |
14.18 |
0.00 |
0.00 |
NM | |||||||||||||||||
| PLBN |
Pilot Bancshares, Inc. |
8.14 |
8.14 |
1.36 |
16.41 |
1.33 |
16.02 |
0.30 |
225.08 |
NA |
NA |
NA |
NA |
NA |
0.00 |
0.00 |
NA | |||||||||||||||||
| RYFL |
Royal Financial, Inc. |
9.01 |
8.62 |
1.01 |
11.07 |
1.06 |
11.62 |
NA |
NA |
9.44 |
99.79 |
9.00 |
104.79 |
9.00 |
NA |
NA |
NM | |||||||||||||||||
| SBKK |
Suncrest Bank |
12.57 |
9.87 |
1.23 |
9.64 |
1.27 |
9.93 |
0.36 |
171.69 |
12.59 |
115.31 |
14.50 |
151.52 |
12.22 |
NA |
NA |
19.38 |
| (1) | Average of High/Low or Bid/Ask price per share. |
| (2) | Or since offering price if converted of first listed in the past 52 weeks. Percent change figures are actual year-to-date and are not annualized. |
| (3) | EPS (earnings per share) is based on actual trailing 12 month data and is not shown on a pro forma basis. |
| (4) | Exludes intangibles (such as goodwill, value of core deposits, etc.). |
| (5) | ROA (return on assets) and ROE (return on equity) are indicated ratios based on trailing 12 month common earnings and average common equity and total assets balances. |
| (6) | Annualized based on last regular quarterly cash dividend announcement. |
| (7) | Indicated dividend as a percent of trailing 12 month earnings. |
| (8) | For MHC institutions, market value reflects share price multiplied by public (non-MHC) shares. |
| (9) | Excluded from averages due to actual or rumored acquisition activities or unusual operating characteristics. |
Source: S&P Market Intelligence, LC. and RP® Financial, LC. calculations. The information provided in this table has been obtained from sources we believe are reliable, but we cannot guarantee the accuracy or completeness of such information.
Copyright (c) 2021 by RP® Financial, LC.
EXHIBIT IV-2
Colonial Federal Savings Bank
Historical Stock Price Indices
Exhibit IV-2
Historical Stock Price Indices(1)
| SNL | SNL | |||||||||||||||||||||||
| NASDAQ | Thrift | Bank | ||||||||||||||||||||||
| Year/Qtr. Ended |
DJIA | S&P 500 | Composite | Index | Index | |||||||||||||||||||
| 2013: |
Quarter 1 | 14578.5 | 1569.2 | 3267.5 | 602.3 | 318.9 | ||||||||||||||||||
| Quarter 2 | 14909.6 | 1606.3 | 3404.3 | 625.3 | 346.7 | |||||||||||||||||||
| Quarter 3 | 15129.7 | 1681.6 | 3771.5 | 650.8 | 354.4 | |||||||||||||||||||
| Quarter 4 | 16576.7 | 1848.4 | 4176.6 | 706.5 | 394.4 | |||||||||||||||||||
| 2014: |
Quarter 1 | 16457.7 | 1872.3 | 4199.0 | 718.9 | 410.8 | ||||||||||||||||||
| Quarter 2 | 16826.6 | 1960.2 | 4408.2 | 723.9 | 405.2 | |||||||||||||||||||
| Quarter 3 | 17042.9 | 1972.3 | 4493.4 | 697.7 | 411.0 | |||||||||||||||||||
| Quarter 4 | 17823.1 | 2058.9 | 4736.1 | 738.7 | 432.8 | |||||||||||||||||||
| 2015: |
Quarter 1 | 17776.1 | 2067.9 | 4900.9 | 749.3 | 418.8 | ||||||||||||||||||
| Quarter 2 | 17619.5 | 2063.1 | 4986.9 | 795.7 | 448.4 | |||||||||||||||||||
| Quarter 3 | 16284.7 | 1920.0 | 4620.2 | 811.7 | 409.4 | |||||||||||||||||||
| Quarter 4 | 17425.0 | 2043.9 | 5007.4 | 809.1 | 431.5 | |||||||||||||||||||
| 2016: |
Quarter 1 | 17685.1 | 2059.7 | 4869.9 | 788.1 | 381.4 | ||||||||||||||||||
| Quarter 2 | 17930.0 | 2098.9 | 4842.7 | 780.9 | 385.6 | |||||||||||||||||||
| Quarter 3 | 18308.2 | 2168.3 | 5312.0 | 827.2 | 413.7 | |||||||||||||||||||
| Quarter 4 | 19762.6 | 2238.8 | 5383.1 | 966.7 | 532.7 | |||||||||||||||||||
| 2017: |
Quarter 1 | 20663.2 | 2362.7 | 5911.7 | 918.9 | 535.8 | ||||||||||||||||||
| Quarter 2 | 21349.6 | 2423.4 | 6140.4 | 897.1 | 552.4 | |||||||||||||||||||
| Quarter 3 | 22405.1 | 2519.4 | 6496.0 | 939.3 | 573.2 | |||||||||||||||||||
| Quarter 4 | 24719.2 | 2673..6 | 6903.4 | 937.6 | 617.7 | |||||||||||||||||||
| 2018: |
Quarter 1 | 24103.1 | 2640.9 | 7063.5 | 941.5 | 606.8 | ||||||||||||||||||
| Quarter 2 | 24271.4 | 2718.4 | 7510.3 | 961.2 | 597.8 | |||||||||||||||||||
| Quarter 3 | 26458.3 | 2914.0 | 8046.4 | 905.6 | 597.8 | |||||||||||||||||||
| Quarter 4 | 23327.5 | 2506.9 | 6635.3 | 772.0 | 502.9 | |||||||||||||||||||
| 2019: |
Quarter 1 | 25928.7 | 2834.4 | 7729.3 | 837.8 | 543.8 | ||||||||||||||||||
| Quarter 2 | 26600.0 | 2941.8 | 8006.2 | 845.3 | 573.0 | |||||||||||||||||||
| Quarter 3 | 26916.8 | 2976.7 | 7999.3 | 890.5 | 584.5 | |||||||||||||||||||
| Quarter 4 | 28538.4 | 3230.8 | 8972.6 | 920.7 | 663.9 | |||||||||||||||||||
| 2020: |
Quarter 1 | 21917.2 | 2584.6 | 7700.1 | 632.8 | 392.9 | ||||||||||||||||||
| Quarter 2 | 25812.9 | 3100.3 | 10058.8 | 658.5 | 430.8 | |||||||||||||||||||
| Quarter 3 | 27781.7 | 3363.0 | 11167.5 | 605.8 | 417.8 | |||||||||||||||||||
| Quarter 4 | 30606.5 | 3756.1 | 12888.3 | 816.7 | 558.8 | |||||||||||||||||||
| 2021: |
Quarter 1 | 32981.6 | 3972.9 | 13246.9 | 961.6 | 690.9 | ||||||||||||||||||
| Quarter 2 | 34502.5 | 4297.5 | 14504.0 | N/A | N/A | |||||||||||||||||||
| August 20, 2021 | 35120.1 | 4441.7 | 14714.7 | N/A | N/A | |||||||||||||||||||
| (1) | End of period data. |
Sources: S&P Global Market Intelligence.
EXHIBIT IV-3
Colonial Federal Savings Bank
Historical Thrift Stock Indices

Index Summary (Change (%))
Industry Banking
Geography All
| Change (%) | ||||||||||||||||||||||||||||||||||||
| Index Name |
Current Value | As Of | 1 Day | 1 Week | MTD | QTD | YTD | 1 Year | 3 Years | |||||||||||||||||||||||||||
| SNL Banking Indexes |
||||||||||||||||||||||||||||||||||||
| SNL U.S. Bank and Thrift |
727.19 | 6/1/2021 | 1.04 | 3.01 | 1.04 | 10.55 | 36.49 | 73.16 | 23.55 | |||||||||||||||||||||||||||
| SNL U.S. Bank |
757.94 | 6/1/2021 | 1.04 | 2.98 | 1.04 | 10.66 | 35.62 | 72.14 | 23.07 | |||||||||||||||||||||||||||
| SNL U.S. Thrift |
1,005.51 | 6/1/2021 | 0.94 | 4.82 | 0.94 | 4.56 | 23.11 | 53.45 | 2.82 | |||||||||||||||||||||||||||
| SNL TARP Participants |
183.13 | 6/1/2021 | 1.67 | 3.70 | 1.67 | 16.65 | 36.01 | 149.21 | 58.17 | |||||||||||||||||||||||||||
| KBW Nasdaq Bank Index |
134.82 | 6/1/2021 | 0.89 | 2.95 | 0.89 | 12.22 | 37.70 | 77.73 | 25.42 | |||||||||||||||||||||||||||
| KBW Nasdaq Regional Bank Index |
129.29 | 6/1/2021 | 0.95 | 4.05 | 0.95 | 6.06 | 36.68 | 77.88 | 9.04 | |||||||||||||||||||||||||||
| S&P 500 Bank |
431.28 | 6/1/2021 | 0.97 | 2.62 | 0.97 | 11.23 | 36.43 | 72.52 | 29.17 | |||||||||||||||||||||||||||
| NASDAQ Bank |
4,841.41 | 6/1/2021 | 0.88 | 4.12 | 0.88 | 6.78 | 36.50 | 79.29 | 12.86 | |||||||||||||||||||||||||||
| S&P 500 Commercial Banks |
616.15 | 6/1/2021 | 0.97 | 2.62 | 0.97 | 11.23 | 36.43 | 72.52 | 29.17 | |||||||||||||||||||||||||||
| S&P 500 Diversified Banks |
731.09 | 6/1/2021 | 1.13 | 2.53 | 1.13 | 11.38 | 36.66 | 69.89 | 30.17 | |||||||||||||||||||||||||||
| S&P 500 Regional Banks |
154.87 | 6/1/2021 | 0.44 | 2.89 | 0.44 | 10.76 | 35.66 | 81.68 | 24.56 | |||||||||||||||||||||||||||
| MSCI Europe Banks (USD) |
47.42 | 6/1/2021 | 0.85 | 1.51 | 0.85 | 12.68 | 29.05 | 65.65 | (15.30 | ) | ||||||||||||||||||||||||||
| EURO STOXX Banks |
99.59 | 6/1/2021 | 1.61 | 2.40 | 1.61 | 13.08 | 35.00 | 68.88 | (12.20 | ) | ||||||||||||||||||||||||||
| STOXX Europe 600 Banks |
140.69 | 6/1/2021 | 0.74 | 1.57 | 0.74 | 9.14 | 30.02 | 53.56 | (14.99 | ) | ||||||||||||||||||||||||||
| STOXX Eastern Europe 300 Banks |
65.18 | 6/1/2021 | 0.42 | 2.82 | 0.42 | 12.87 | 16.65 | 34.96 | (4.43 | ) | ||||||||||||||||||||||||||
| SNL European Bank |
98.84 | 5/26/2021 | (0.92 | ) | (2.40 | ) | (0.89 | ) | 114.34 | 147.50 | 210.02 | 84.39 | ||||||||||||||||||||||||
| SNL European Savings Bank & Mutuals |
98.89 | 5/26/2021 | (0.83 | ) | (2.19 | ) | (0.81 | ) | 12.49 | 27.47 | 47.35 | 3.05 | ||||||||||||||||||||||||
| SNL Asia-Pacific Bank |
108.07 | 6/1/2021 | (0.22 | ) | 0.75 | (0.22 | ) | 2.87 | 8.60 | 30.50 | 1.40 | |||||||||||||||||||||||||
| SNL Asia-Pacific ex-Japan Bank |
92.27 | 6/1/2021 | (0.33 | ) | 1.09 | (0.33 | ) | 3.57 | 8.22 | 33.05 | (2.42 | ) | ||||||||||||||||||||||||
| CSI 300 Banks |
7,103.62 | 6/1/2021 | (0.91 | ) | (1.01 | ) | (0.91 | ) | 2.13 | 14.21 | 25.02 | 24.25 | ||||||||||||||||||||||||
| CSI China Mainland Banks |
7,103.47 | 6/1/2021 | (0.83 | ) | (1.12 | ) | (0.83 | ) | 0.92 | 11.81 | 21.67 | 20.30 | ||||||||||||||||||||||||
| TPX Bank Index |
149.60 | 6/2/2021 | 1.18 | 0.68 | 1.94 | 0.77 | 25.31 | 24.63 | (17.08 | ) | ||||||||||||||||||||||||||
| KRX Banks Index |
228.18 | 6/1/2021 | (0.41 | ) | 0.50 | (0.41 | ) | 16.61 | 23.26 | 28.40 | (27.14 | ) | ||||||||||||||||||||||||
| SET Banking Index |
362.47 | 6/1/2021 | 1.86 | 1.53 | 1.86 | (9.72 | ) | 7.46 | 20.60 | (30.00 | ) | |||||||||||||||||||||||||
| SNL Latin America Bank |
104.40 | 6/1/2021 | NA | NA | NA | NA | NA | NA | NA | |||||||||||||||||||||||||||
| SNL Asset Size Indexes |
||||||||||||||||||||||||||||||||||||
| SNL U.S. Bank $250M-$500M |
567.12 | 6/1/2021 | 1.31 | 2.61 | 1.31 | 8.89 | 14.34 | 44.44 | 19.97 | |||||||||||||||||||||||||||
| SNL U.S. Thrift < $250M |
103.56 | 6/1/2021 | 0.00 | 0.60 | 0.00 | (93.58 | ) | (93.22 | ) | (92.08 | ) | (92.33 | ) | |||||||||||||||||||||||
| SNL U.S. Thrift $250M-$500M |
6,193.66 | 6/1/2021 | 0.02 | 1.68 | 0.02 | (0.07 | ) | 12.15 | 23.10 | (5.38 | ) | |||||||||||||||||||||||||
| SNL U.S. Bank < $500M |
1,291.99 | 6/1/2021 | 1.31 | 2.61 | 1.31 | 6.04 | 32.77 | 75.13 | 40.58 | |||||||||||||||||||||||||||
| SNL U.S. Thrift < $500M |
2,148.59 | 6/1/2021 | (0.83 | ) | 1.01 | (0.83 | ) | 2.84 | 10.99 | 24.09 | (3.31 | ) | ||||||||||||||||||||||||
| SNL U.S. Bank $500M-$1B |
1,366.41 | 6/1/2021 | 0.94 | 1.68 | 0.94 | 5.51 | 21.92 | 45.93 | 14.80 | |||||||||||||||||||||||||||
| SNL U.S. Thrift $500M-$1B |
4,089.07 | 6/1/2021 | 0.68 | 2.07 | 0.68 | 1.99 | 15.12 | 42.19 | 9.49 | |||||||||||||||||||||||||||
| SNL U.S. Bank $1B-$5B |
1,354.22 | 6/1/2021 | 0.82 | 3.65 | 0.82 | 6.63 | 30.34 | 64.22 | 1.91 | |||||||||||||||||||||||||||
| SNL U.S. Thrift $1B-$5B |
2,927.73 | 6/1/2021 | 0.69 | 4.07 | 0.69 | 5.50 | 26.24 | 59.63 | (22.38 | ) | ||||||||||||||||||||||||||
| SNL U.S. Bank $5B-$10B |
1,748.31 | 6/1/2021 | 1.22 | 4.89 | 1.22 | 2.70 | 33.97 | 75.94 | 16.88 | |||||||||||||||||||||||||||
| SNL U.S. Thrift $5B-$10B |
101.90 | 6/1/2021 | (0.03 | ) | 3.90 | (0.03 | ) | (90.10 | ) | (89.42 | ) | (87.06 | ) | (91.45 | ) | |||||||||||||||||||||
| SNL U.S. Bank > $10B |
614.53 | 6/1/2021 | 1.04 | 2.92 | 1.04 | 11.33 | 36.40 | 72.94 | 15.24 | |||||||||||||||||||||||||||
| SNL U.S. Thrift > $10B |
180.29 | 6/1/2021 | 1.49 | 5.58 | 1.49 | 4.24 | 24.63 | 55.69 | 18.71 | |||||||||||||||||||||||||||
| SNL Market Cap Indexes |
||||||||||||||||||||||||||||||||||||
| SNL Micro Cap U.S. Bank |
636.03 | 6/1/2021 | 0.33 | 1.31 | 0.33 | 5.47 | 20.25 | 34.86 | (14.08 | ) | ||||||||||||||||||||||||||
| SNL Micro Cap U.S. Thrift |
1,250.71 | 6/1/2021 | 0.42 | 2.47 | 0.42 | 3.07 | 18.37 | 46.46 | 2.52 | |||||||||||||||||||||||||||
| SNL Micro Cap U.S. Bank & Thrift |
746.05 | 6/1/2021 | 0.35 | 1.47 | 0.35 | 5.07 | 19.42 | 35.71 | (12.67 | ) | ||||||||||||||||||||||||||
| SNL Small Cap U.S. Bank |
803.84 | 6/1/2021 | 0.80 | 3.67 | 0.80 | 6.13 | 33.30 | 68.47 | 7.53 | |||||||||||||||||||||||||||
| SNL Small Cap U.S. Thrift |
759.34 | 6/1/2021 | (0.33 | ) | 2.67 | (0.33 | ) | 3.78 | 22.18 | 63.49 | (8.78 | ) | ||||||||||||||||||||||||
| SNL Small Cap U.S. Bank & Thrift |
822.61 | 6/1/2021 | 0.71 | 3.58 | 0.71 | 5.96 | 32.45 | 68.36 | 7.16 | |||||||||||||||||||||||||||
| SNL Mid Cap U.S. Bank |
485.31 | 6/1/2021 | 0.90 | 4.17 | 0.90 | 4.80 | 33.24 | 74.86 | 3.63 | |||||||||||||||||||||||||||
| SNL Mid Cap U.S. Thrift |
337.73 | 6/1/2021 | 1.17 | 5.23 | 1.17 | 5.52 | 24.55 | 47.95 | (15.32 | ) | ||||||||||||||||||||||||||
| SNL Mid Cap U.S. Bank & Thrift |
475.72 | 6/1/2021 | 0.92 | 4.26 | 0.92 | 4.86 | 32.12 | 71.57 | 2.29 | |||||||||||||||||||||||||||
| SNL Large Cap U.S. Bank |
488.70 | 6/1/2021 | 1.05 | 2.82 | 1.05 | 11.49 | 37.18 | 73.37 | 27.97 | |||||||||||||||||||||||||||
| SNL Large Cap U.S. Thrift |
121.29 | 6/1/2021 | 1.28 | 5.40 | 1.28 | 2.98 | 19.95 | 8.68 | 1.34 | |||||||||||||||||||||||||||
| SNL Large Cap U.S. Bank & Thrift |
492.79 | 6/1/2021 | 1.05 | 2.84 | 1.05 | 11.44 | 37.16 | 73.43 | 28.43 | |||||||||||||||||||||||||||
| SNL Micro Cap European Bank |
6.17 | 6/1/2021 | NA | NA | NA | NA | NA | NA | NA | |||||||||||||||||||||||||||
| SNL Small Cap European Bank |
10.04 | 6/1/2021 | 0.06 | (0.03 | ) | 0.06 | 4.89 | 14.06 | 25.52 | (49.99 | ) | |||||||||||||||||||||||||
| SNL Mid Cap European Bank |
27.12 | 6/1/2021 | 0.63 | 0.76 | 0.63 | 5.01 | 14.27 | 31.02 | (11.77 | ) | ||||||||||||||||||||||||||
| SNL Large Cap European Bank |
88.32 | 6/1/2021 | 1.38 | 1.72 | 1.38 | 8.38 | 25.81 | 55.70 | (0.52 | ) | ||||||||||||||||||||||||||
| SNL Micro Cap Asia-Pacific Bank |
19.46 | 6/1/2021 | 0.25 | 3.53 | 0.25 | 4.91 | 10.64 | 31.59 | (30.52 | ) | ||||||||||||||||||||||||||
| SNL Small Cap Asia-Pacific Bank |
22.41 | 6/1/2021 | 0.08 | 0.97 | 0.08 | 0.58 | 4.33 | 18.90 | (35.61 | ) | ||||||||||||||||||||||||||
| SNL Mid Cap Asia-Pacific Bank |
32.87 | 6/1/2021 | 0.06 | 1.47 | 0.06 | 1.00 | 7.34 | 31.46 | (32.40 | ) | ||||||||||||||||||||||||||
| SNL Large Cap Asia-Pacific Bank |
122.99 | 6/1/2021 | (0.22 | ) | 0.70 | (0.22 | ) | 2.92 | 8.72 | 39.37 | 1.94 | |||||||||||||||||||||||||
| SNL Micro Cap Latin America Bank |
46.75 | 6/1/2021 | NA | NA | NA | NA | NA | NA | NA | |||||||||||||||||||||||||||
| SNL Small Cap Latin America Bank |
74.33 | 6/1/2021 | NA | NA | NA | NA | NA | NA | NA | |||||||||||||||||||||||||||
| SNL Mid Cap Latin America Bank |
74.85 | 6/1/2021 | NA | NA | NA | NA | NA | NA | NA | |||||||||||||||||||||||||||
| SNL Large Cap Latin America Bank |
86.57 | 6/1/2021 | NA | NA | NA | NA | NA | NA | NA | |||||||||||||||||||||||||||
| SNL Geographic Indexes |
||||||||||||||||||||||||||||||||||||
| SNL Mid-Atlantic U.S. Bank |
769.72 | 6/1/2021 | 1.05 | 2.72 | 1.05 | 9.45 | 30.31 | 65.28 | 33.16 | |||||||||||||||||||||||||||
| SNL Mid-Atlantic U.S. Thrift |
3,391.98 | 6/1/2021 | 0.72 | 4.41 | 0.72 | 2.76 | 18.92 | 40.73 | (2.99 | ) | ||||||||||||||||||||||||||
| SNL Midwest U.S. Bank |
787.18 | 6/1/2021 | 0.58 | 2.80 | 0.58 | 8.78 | 33.03 | 69.73 | 14.00 | |||||||||||||||||||||||||||
| SNL Midwest U.S. Thrift |
3,682.32 | 6/1/2021 | 1.27 | 5.38 | 1.27 | 5.39 | 18.65 | 43.23 | 11.04 | |||||||||||||||||||||||||||
| SNL New England U.S. Bank |
684.51 | 6/1/2021 | 0.98 | 3.70 | 0.98 | 8.22 | 31.75 | 65.28 | (1.11 | ) | ||||||||||||||||||||||||||
| SNL New England U.S. Thrift |
4,124.48 | 6/1/2021 | 0.35 | 4.58 | 0.35 | 11.73 | 37.35 | 87.63 | 29.38 | |||||||||||||||||||||||||||
| SNL Southeast U.S. Bank |
546.56 | 6/1/2021 | 1.24 | 2.99 | 1.24 | 11.52 | 41.84 | 82.14 | 36.83 | |||||||||||||||||||||||||||
| SNL Southeast U.S. Thrift |
660.54 | 6/1/2021 | 0.81 | 1.13 | 0.81 | 10.36 | 46.95 | 79.47 | 27.54 | |||||||||||||||||||||||||||
| SNL Southwest U.S. Bank |
1,380.21 | 6/1/2021 | 1.07 | 4.40 | 1.07 | 6.45 | 31.78 | 76.05 | 2.64 | |||||||||||||||||||||||||||
| SNL Southwest U.S. Thrift |
94.93 | 6/1/2021 | 0.63 | 3.92 | 0.63 | (92.73 | ) | (90.70 | ) | (83.33 | ) | (91.26 | ) | |||||||||||||||||||||||
| SNL Western U.S. Bank |
1,521.64 | 6/1/2021 | 1.07 | 3.04 | 1.07 | 15.84 | 48.52 | 81.93 | 1.97 | |||||||||||||||||||||||||||
| SNL Western U.S. Thrift |
212.21 | 6/1/2021 | 1.64 | 6.06 | 1.64 | 3.15 | 26.12 | 90.37 | 9.60 | |||||||||||||||||||||||||||
| SNL Western European Bank |
41.42 | 6/1/2021 | 1.50 | 1.53 | 1.50 | 8.36 | 25.88 | 55.33 | (0.06 | ) | ||||||||||||||||||||||||||
| SNL Eastern European Bank |
174.50 | 6/1/2021 | NA | NA | NA | NA | NA | NA | NA | |||||||||||||||||||||||||||
| SNL France & Benelux Bank |
56.05 | 6/1/2021 | 1.54 | 2.18 | 1.54 | 6.48 | 31.23 | 56.02 | (5.43 | ) | ||||||||||||||||||||||||||
| SNL German, Swiss, Austrian Bank |
37.88 | 6/1/2021 | 1.37 | 1.44 | 1.37 | 5.92 | 12.68 | 30.31 | 2.49 | |||||||||||||||||||||||||||
| SNL Nordic Bank |
117.81 | 6/1/2021 | 1.28 | (0.61 | ) | 1.28 | 2.42 | 20.41 | 37.99 | 7.96 | ||||||||||||||||||||||||||
| SNL Mediterranean/Southern European Bank |
19.44 | 6/1/2021 | 1.51 | 2.24 | 1.51 | 11.72 | 28.44 | 64.31 | (14.29 | ) | ||||||||||||||||||||||||||
| SNL North Asia Bank |
115.90 | 6/1/2021 | (0.43 | ) | 0.52 | (0.43 | ) | 4.64 | 15.96 | 29.17 | 16.36 | |||||||||||||||||||||||||
| SNL China Bank |
88.74 | 6/1/2021 | (0.72 | ) | (0.77 | ) | (0.72 | ) | (0.05 | ) | 11.56 | 14.32 | 6.23 | |||||||||||||||||||||||
| SNL Japan Bank |
43.77 | 6/1/2021 | 0.66 | (1.79 | ) | 0.66 | (2.27 | ) | 21.50 | 20.65 | (20.88 | ) | ||||||||||||||||||||||||
| SNL Southeast Asia Bank |
164.14 | 6/1/2021 | 0.52 | 3.22 | 0.52 | 3.10 | 1.69 | 34.68 | (0.14 | ) | ||||||||||||||||||||||||||
| SNL South Asia Bank |
183.42 | 6/1/2021 | (0.51 | ) | 1.98 | (0.51 | ) | 7.58 | 13.60 | 195.43 | 74.01 | |||||||||||||||||||||||||
| SNL Australia & NZ Bank |
116.63 | 6/1/2021 | (0.74 | ) | (0.41 | ) | (0.74 | ) | 6.89 | 21.89 | 51.67 | 17.13 | ||||||||||||||||||||||||
| SNL Central America Bank |
122.51 | 6/1/2021 | (1.71 | ) | 1.82 | (1.71 | ) | 14.63 | 13.42 | 83.15 | 1.53 | |||||||||||||||||||||||||
| SNL Mexico Bank |
129.50 | 6/1/2021 | (1.74 | ) | 1.81 | (1.74 | ) | 14.82 | 13.67 | 75.75 | 1.89 | |||||||||||||||||||||||||
| SNL Caribbean Bank |
73.80 | 6/1/2021 | 1.43 | 2.75 | 1.43 | 1.44 | (1.41 | ) | (2.67 | ) | (36.91 | ) | ||||||||||||||||||||||||
| SNL Southern Cone Bank |
112.69 | 6/1/2021 | 1.02 | 9.96 | 1.02 | (9.49 | ) | 8.63 | 27.60 | (36.36 | ) | |||||||||||||||||||||||||
| SNL Andean Bank |
134.52 | 6/1/2021 | NA | NA | NA | NA | NA | NA | NA | |||||||||||||||||||||||||||
| SNL Brazil Bank |
56.58 | 6/1/2021 | 4.17 | 9.07 | 4.17 | 29.47 | 8.51 | 60.75 | (2.07 | ) | ||||||||||||||||||||||||||
| SNL Stock Exchange Indexes |
||||||||||||||||||||||||||||||||||||
| SNL U.S. Bank NYSE |
664.81 | 6/1/2021 | 1.08 | 2.77 | 1.08 | 11.50 | 36.73 | 72.28 | 26.30 | |||||||||||||||||||||||||||
| SNL U.S. Thrift NYSE |
140.00 | 6/1/2021 | 1.81 | 5.20 | 1.81 | 1.71 | 21.60 | 52.68 | 3.18 | |||||||||||||||||||||||||||
| SNL U.S. Bank NYSE American |
854.56 | 6/1/2021 | 0.95 | 4.48 | 0.95 | (2.11 | ) | 19.27 | 52.79 | (5.58 | ) | |||||||||||||||||||||||||
| SNL U.S. Bank NASDAQ |
1,091.68 | 6/1/2021 | 0.86 | 3.87 | 0.86 | 6.89 | 35.27 | 77.08 | 5.32 | |||||||||||||||||||||||||||
| SNL U.S. Thrift NASDAQ |
2,982.01 | 6/1/2021 | 0.53 | 4.64 | 0.53 | 5.85 | 23.72 | 53.78 | (0.72 | ) | ||||||||||||||||||||||||||
| SNL U.S. Bank Pink |
508.27 | 6/1/2021 | 0.11 | 0.43 | 0.11 | 6.25 | 19.46 | 31.89 | 8.95 | |||||||||||||||||||||||||||
| SNL U.S. Thrift Pink |
443.36 | 6/1/2021 | 0.30 | (0.01 | ) | 0.30 | 4.66 | 12.84 | 50.14 | 28.04 | ||||||||||||||||||||||||||
| SNL Bank TSX |
1,427.69 | 6/1/2021 | 0.82 | 1.66 | 0.82 | 8.78 | 23.49 | 49.16 | 21.96 | |||||||||||||||||||||||||||
| SNL OTHER Indexes |
||||||||||||||||||||||||||||||||||||
| SNL U.S. Thrift MHCs |
6,978.08 | 6/1/2021 | 0.41 | 5.63 | 0.41 | 7.34 | 22.43 | 39.76 | 20.84 | |||||||||||||||||||||||||||
| SNL Pink Asset Size Indexes |
||||||||||||||||||||||||||||||||||||
| SNL U.S. Bank Pink < $100M |
289.68 | 6/1/2021 | (0.29 | ) | (0.29 | ) | (0.29 | ) | 0.22 | 60.19 | 38.04 | 18.89 | ||||||||||||||||||||||||
| SNL U.S. Bank Pink $100M-$500M |
573.50 | 6/1/2021 | 0.08 | 0.27 | 0.08 | 4.88 | 17.43 | 25.91 | 14.80 | |||||||||||||||||||||||||||
| SNL U.S. Bank Pink > $500M |
440.06 | 6/1/2021 | 0.12 | 0.45 | 0.12 | 6.50 | 19.72 | 32.72 | 7.18 | |||||||||||||||||||||||||||
| Broad Market Indexes |
||||||||||||||||||||||||||||||||||||
| DJIA |
34,575.31 | 6/1/2021 | 0.13 | 0.77 | 0.13 | 4.83 | 12.97 | 35.72 | 40.35 | |||||||||||||||||||||||||||
| S&P 500 |
4,202.04 | 6/1/2021 | (0.05 | ) | 0.33 | (0.05 | ) | 5.77 | 11.87 | 37.51 | 53.66 | |||||||||||||||||||||||||
| S&P 400 Mid Cap |
2,744.72 | 6/1/2021 | 0.63 | 2.30 | 0.63 | 5.19 | 18.99 | 53.85 | 40.16 | |||||||||||||||||||||||||||
| S&P 600 Small Cap |
1,393.44 | 6/1/2021 | 1.57 | 4.44 | 1.57 | 5.62 | 24.53 | 71.82 | 37.21 | |||||||||||||||||||||||||||
| S&P 500 Financials |
634.27 | 6/1/2021 | 0.66 | 2.23 | 0.66 | 12.12 | 29.33 | 61.80 | 39.33 | |||||||||||||||||||||||||||
| SNL U.S. Financial Institutions |
1,345.14 | 6/1/2021 | 0.58 | 2.28 | 0.58 | 10.89 | 28.75 | 61.12 | 35.73 |
| MSCI US IMI Financials |
2,275.23 | 6/1/2021 | 0.67 | 2.43 | 0.67 | 11.17 | 28.74 | 62.18 | 34.69 | |||||||||||||||||||||||||||
| NASDAQ |
13,736.48 | 6/1/2021 | (0.09 | ) | 0.58 | (0.09 | ) | 3.70 | 6.58 | 43.81 | 81.84 | |||||||||||||||||||||||||
| NASDAQ Finl |
6,227.86 | 6/1/2021 | 0.15 | 2.20 | 0.15 | 7.42 | 20.74 | 44.18 | 30.55 | |||||||||||||||||||||||||||
| NYSE |
16,643.32 | 6/1/2021 | 0.53 | 1.54 | 0.53 | 6.68 | 14.59 | 39.86 | 31.87 | |||||||||||||||||||||||||||
| Russell 1000 |
2,363.89 | 6/1/2021 | (0.03 | ) | 0.48 | (0.03 | ) | 5.62 | 11.46 | 39.78 | 55.75 | |||||||||||||||||||||||||
| Russell 2000 |
2,294.74 | 6/1/2021 | 1.14 | 4.03 | 1.14 | 3.34 | 16.20 | 63.28 | 39.25 | |||||||||||||||||||||||||||
| Russell 3000 |
2,512.80 | 6/1/2021 | 0.05 | 0.71 | 0.05 | 5.46 | 11.76 | 41.13 | 54.44 | |||||||||||||||||||||||||||
| S&P TSX Composite |
19,976.01 | 6/1/2021 | 1.24 | 2.11 | 1.24 | 6.82 | 14.59 | 31.11 | 24.51 | |||||||||||||||||||||||||||
| EURO STOXX |
451.71 | 6/1/2021 | 0.76 | 0.96 | 0.76 | 4.54 | 13.62 | 32.60 | 17.30 | |||||||||||||||||||||||||||
| STOXX Europe 600 |
450.10 | 6/1/2021 | 0.75 | 1.10 | 0.75 | 4.77 | 12.80 | 27.08 | 16.33 | |||||||||||||||||||||||||||
| Amsterdam Exchange Index |
715.94 | 6/1/2021 | 0.93 | 0.52 | 0.93 | 2.30 | 14.62 | 32.69 | 28.03 | |||||||||||||||||||||||||||
| Athex Composite |
894.13 | 6/1/2021 | (0.08 | ) | 3.00 | (0.08 | ) | 3.36 | 10.52 | 35.81 | 15.11 | |||||||||||||||||||||||||
| Austrian Traded Index |
3,490.04 | 6/1/2021 | 1.70 | 1.38 | 1.70 | 10.45 | 25.52 | 56.34 | 3.96 | |||||||||||||||||||||||||||
| BEL20 |
4,098.62 | 6/1/2021 | 0.94 | 0.77 | 0.94 | 5.11 | 13.18 | 25.42 | 7.60 | |||||||||||||||||||||||||||
| CAC 40 |
6,489.40 | 6/1/2021 | 0.66 | 1.55 | 0.66 | 6.96 | 16.90 | 36.25 | 18.73 | |||||||||||||||||||||||||||
| DAX (Kursindex) |
6,590.28 | 6/1/2021 | 0.95 | 0.67 | 0.95 | 1.80 | 11.04 | 29.75 | 12.46 | |||||||||||||||||||||||||||
| FTSE 100 (GBP) |
7,080.46 | 6/1/2021 | 0.82 | 0.72 | 0.82 | 5.46 | 9.60 | 14.82 | (8.07 | ) | ||||||||||||||||||||||||||
| BELEX15 |
781.64 | 6/1/2021 | 1.70 | 0.31 | 1.70 | 3.61 | 4.41 | 16.31 | 5.48 | |||||||||||||||||||||||||||
| Portuguese Stock Index-20 |
5,216.79 | 6/1/2021 | 0.71 | 0.11 | 0.71 | 5.83 | 6.50 | 17.87 | (5.45 | ) | ||||||||||||||||||||||||||
| OMX Riga All Share |
1,189.78 | 6/1/2021 | 0.99 | 0.52 | 0.99 | 7.11 | 4.70 | 16.08 | 13.94 | |||||||||||||||||||||||||||
| OMX Vilnius All Share |
936.34 | 6/1/2021 | (0.20 | ) | 1.91 | (0.20 | ) | 10.30 | 14.66 | 29.73 | 31.35 | |||||||||||||||||||||||||
| RTS Index |
1,614.21 | 6/1/2021 | 1.04 | 2.12 | 1.04 | 9.28 | 16.34 | 29.38 | 38.02 | |||||||||||||||||||||||||||
| PFTS Index |
531.17 | 6/1/2021 | 0.48 | 0.48 | 0.48 | 2.72 | 6.29 | 6.20 | 17.55 | |||||||||||||||||||||||||||
| Slovak Share Index |
370.76 | 6/1/2021 | 0.00 | (0.20 | ) | 0.00 | 2.04 | 7.43 | 3.10 | 12.17 | ||||||||||||||||||||||||||
| Bucharest Exchange Trading |
11,431.12 | 5/31/2021 | 0.09 | (2.55 | ) | 0.79 | 2.16 | 16.58 | 31.37 | 41.47 | ||||||||||||||||||||||||||
| Malta Stock Exchange Index |
3,911.07 | 6/1/2021 | (1.04 | ) | (2.48 | ) | (1.04 | ) | 3.21 | (5.33 | ) | (1.36 | ) | (9.02 | ) | |||||||||||||||||||||
| Cyprus General Index |
63.72 | 6/1/2021 | 0.50 | 0.55 | 0.50 | 5.58 | 12.54 | 32.72 | (9.53 | ) | ||||||||||||||||||||||||||
| CSI 300 Index |
5,341.68 | 6/1/2021 | 0.19 | 0.44 | 0.19 | 5.81 | 2.50 | 34.51 | 41.67 | |||||||||||||||||||||||||||
| Tokyo Price Index |
1,942.33 | 6/2/2021 | 0.84 | 1.13 | 1.01 | (0.60 | ) | 7.63 | 22.34 | 11.04 | ||||||||||||||||||||||||||
| Hang Seng Index |
29,468.00 | 6/1/2021 | 1.08 | 1.93 | 1.08 | 3.84 | 8.21 | 24.17 | (3.36 | ) | ||||||||||||||||||||||||||
| Hang Seng China Enterprises Index |
10,990.75 | 6/1/2021 | 0.93 | 1.84 | 0.93 | 0.17 | 2.35 | 11.76 | (8.56 | ) | ||||||||||||||||||||||||||
| ASX100 |
5,975.38 | 6/2/2021 | 1.06 | 1.78 | 0.82 | 6.61 | 10.09 | 24.39 | 21.62 | |||||||||||||||||||||||||||
| BSE India Sensex 30 Index |
51,934.88 | 6/1/2021 | 0.00 | 2.56 | 0.00 | 4.90 | 8.76 | 55.94 | 47.43 | |||||||||||||||||||||||||||
| Korea Composite Stock Price Index |
3,221.87 | 6/1/2021 | 0.56 | 1.59 | 0.56 | 5.24 | 12.12 | 56.02 | 32.10 | |||||||||||||||||||||||||||
| Taiwan Stock Exchange Index |
17,181.47 | 6/2/2021 | 0.11 | 3.23 | 0.66 | 4.57 | 16.62 | 54.40 | 56.92 | |||||||||||||||||||||||||||
| Jakarta Stock Exchange Composite Index |
5,947.46 | 5/31/2021 | 1.69 | 3.19 | (0.80 | ) | (0.64 | ) | (0.53 | ) | 25.11 | (0.60 | ) | |||||||||||||||||||||||
| SET Index |
1,618.59 | 6/1/2021 | 1.57 | 3.19 | 1.57 | 1.98 | 11.68 | 19.69 | (5.89 | ) | ||||||||||||||||||||||||||
| SET100 |
2,231.56 | 6/1/2021 | 1.91 | 3.39 | 1.91 | 1.27 | 9.55 | 12.20 | (11.07 | ) | ||||||||||||||||||||||||||
| SET50 Index |
981.19 | 6/1/2021 | 1.93 | 3.49 | 1.93 | 1.02 | 7.77 | 8.85 | (13.14 | ) | ||||||||||||||||||||||||||
| Philippines Exchange Composite Index |
6,627.43 | 6/1/2021 | (0.02 | ) | 6.95 | (0.02 | ) | 2.86 | (7.18 | ) | 11.76 | (13.14 | ) | |||||||||||||||||||||||
| Sri Lanka CSE All Share |
7,451.97 | 6/2/2021 | 0.04 | 2.39 | 0.53 | 4.64 | 10.00 | 55.55 | 16.42 | |||||||||||||||||||||||||||
| Pakistan KSE 100 |
48,191.26 | 6/1/2021 | 0.62 | 4.08 | 0.62 | 8.08 | 10.14 | 41.65 | 12.30 | |||||||||||||||||||||||||||
| Vietnam Hanoi HNX index |
318.47 | 6/1/2021 | 0.19 | 5.59 | 0.19 | 11.09 | 56.79 | 179.03 | 175.11 | |||||||||||||||||||||||||||
| IBEX 35 |
9,189.70 | 6/1/2021 | 0.45 | (0.21 | ) | 0.45 | 7.11 | 13.82 | 27.26 | (4.60 | ) | |||||||||||||||||||||||||
| ISEQ Overall |
8,285.67 | 6/1/2021 | 0.65 | 1.08 | 0.65 | 2.49 | 12.33 | 38.24 | 15.36 | |||||||||||||||||||||||||||
| KRX 100 |
6,748.19 | 6/1/2021 | 0.57 | 1.31 | 0.57 | 2.50 | 8.42 | 52.25 | 34.77 | |||||||||||||||||||||||||||
| Luxembourg LuxX |
1,624.11 | 6/1/2021 | 0.57 | 5.85 | 0.57 | 6.61 | 20.70 | 61.47 | (2.19 | ) | ||||||||||||||||||||||||||
| FTSE MIB |
25,321.82 | 6/1/2021 | 0.60 | 1.72 | 0.60 | 2.73 | 13.89 | 36.70 | 14.53 | |||||||||||||||||||||||||||
| MSCI AC World (USD) |
713.76 | 6/1/2021 | 0.32 | 0.92 | 0.32 | 6.01 | 10.44 | 38.81 | 39.20 | |||||||||||||||||||||||||||
| MSCI EAFE |
2,349.35 | 6/1/2021 | 0.66 | 0.76 | 0.66 | 6.39 | 9.40 | 34.46 | 17.92 | |||||||||||||||||||||||||||
| MSCI Europe |
2,075.62 | 6/1/2021 | 0.91 | 1.03 | 0.91 | 8.96 | 12.79 | 38.89 | 19.82 | |||||||||||||||||||||||||||
| MSCI World |
2,982.02 | 6/1/2021 | 0.21 | 0.56 | 0.21 | 6.06 | 10.85 | 37.81 | 41.38 | |||||||||||||||||||||||||||
| Nikkei 225 |
28,814.34 | 6/1/2021 | (0.16 | ) | 0.91 | (0.16 | ) | (1.25 | ) | 4.99 | 30.60 | 29.96 | ||||||||||||||||||||||||
| NZX 50 |
5,177.69 | 6/1/2021 | 1.14 | 0.98 | 1.14 | (0.92 | ) | (5.63 | ) | 12.03 | 32.49 | |||||||||||||||||||||||||
| Oslo Stock Exchange OBX |
995.87 | 6/1/2021 | 1.60 | 3.16 | 1.60 | 5.77 | 15.95 | 38.88 | 23.36 | |||||||||||||||||||||||||||
| OMX Copenhagen 20 |
1,586.23 | 6/1/2021 | 0.56 | (0.21 | ) | 0.56 | 7.78 | 8.26 | 28.55 | 60.07 | ||||||||||||||||||||||||||
| OMX Helsinki 25 |
5,220.24 | 6/1/2021 | 1.21 | 0.85 | 1.21 | 5.87 | 13.83 | 30.53 | 21.80 | |||||||||||||||||||||||||||
| OMX Stockholm 30 |
2,264.53 | 6/1/2021 | 1.01 | 0.95 | 1.01 | 3.27 | 20.79 | 37.30 | 44.28 | |||||||||||||||||||||||||||
| S&P ASX 200 |
7,217.82 | 6/2/2021 | 1.05 | 1.77 | 0.78 | 6.29 | 9.58 | 23.70 | 20.49 | |||||||||||||||||||||||||||
| Straits Times Index |
3,187.23 | 6/1/2021 | 0.73 | 1.31 | 0.73 | 0.69 | 12.08 | 24.95 | (7.01 | ) | ||||||||||||||||||||||||||
| Swiss Market Index |
11,434.88 | 6/1/2021 | 0.63 | 1.14 | 0.63 | 3.51 | 6.83 | 16.31 | 32.68 | |||||||||||||||||||||||||||
| Warsaw Stock Exchange WIG |
66,278.91 | 6/1/2021 | (0.01 | ) | 3.47 | (0.01 | ) | 14.11 | 16.23 | 36.24 | 14.49 | |||||||||||||||||||||||||
| Budapest Stock Exchange Index |
46,699.74 | 6/1/2021 | 0.71 | 2.04 | 0.71 | 5.35 | 10.91 | 30.17 | 29.89 | |||||||||||||||||||||||||||
| SOFIX Index |
529.62 | 6/1/2021 | 0.38 | (0.54 | ) | 0.38 | 5.44 | 18.34 | 14.87 | (16.97 | ) |
| ISE National 100 |
1,432.04 | 6/1/2021 | 0.81 | 2.27 | 0.81 | 2.90 | (3.03 | ) | 33.50 | 44.40 | ||||||||||||||||||||||||||
| PX Index |
1,173.71 | 6/1/2021 | 0.95 | 0.46 | 0.95 | 7.63 | 14.27 | 29.32 | 8.57 | |||||||||||||||||||||||||||
| CROBEX |
1,944.66 | 6/1/2021 | 0.61 | 0.48 | 0.61 | 3.87 | 11.81 | 18.83 | 5.32 | |||||||||||||||||||||||||||
| Israel TA-35 |
1,687.65 | 6/1/2021 | (0.56 | ) | (0.29 | ) | (0.56 | ) | 5.17 | 12.58 | 18.01 | 11.62 | ||||||||||||||||||||||||
| Utd Arab Emirates DFM Index |
2,839.14 | 6/2/2021 | 0.07 | 0.49 | 1.49 | 11.33 | 13.35 | 43.07 | (4.22 | ) | ||||||||||||||||||||||||||
| Jordan General |
2,048.26 | 6/1/2021 | (0.23 | ) | 3.99 | (0.23 | ) | 15.57 | 23.60 | 22.08 | (2.28 | ) | ||||||||||||||||||||||||
| SAT All Share Index |
10,597.42 | 6/1/2021 | 0.44 | 1.43 | 0.44 | 6.96 | 21.96 | 45.39 | 29.85 | |||||||||||||||||||||||||||
| Kuwait KSX 15 |
6,220.20 | 6/1/2021 | 0.15 | (0.81 | ) | 0.15 | 7.69 | 12.16 | 24.24 | 31.35 | ||||||||||||||||||||||||||
| Bahrain All Share |
1,522.21 | 6/2/2021 | 0.20 | (1.09 | ) | (0.35 | ) | 4.40 | 2.18 | 19.89 | 20.26 | |||||||||||||||||||||||||
| Egypt EGX 30 |
10,240.20 | 6/1/2021 | (0.67 | ) | (2.77 | ) | (0.67 | ) | (3.11 | ) | (5.58 | ) | 0.13 | (37.62 | ) | |||||||||||||||||||||
| Qatar QE Index |
10,804.70 | 6/2/2021 | 0.25 | 1.66 | 0.53 | 3.88 | 3.53 | 19.16 | 21.67 | |||||||||||||||||||||||||||
| Oman MSM 30 Index |
3,893.92 | 6/1/2021 | 1.07 | 1.46 | 1.07 | 4.99 | 6.43 | 10.16 | (15.47 | ) | ||||||||||||||||||||||||||
| TUNINDEX |
7,400.39 | 6/1/2021 | 0.08 | 0.04 | 0.08 | 4.39 | 7.49 | 13.52 | (3.23 | ) | ||||||||||||||||||||||||||
| Bermuda Royal Gazette/BSX |
2,553.64 | 6/1/2021 | 0.00 | (3.66 | ) | 0.00 | (1.76 | ) | 25.68 | 43.22 | (5.27 | ) | ||||||||||||||||||||||||
| JSE All Share Index |
452,665.61 | 6/1/2021 | 0.27 | (0.18 | ) | 0.27 | 4.58 | 4.42 | 8.47 | 37.55 | ||||||||||||||||||||||||||
| Malawi All Share Index |
33,676.89 | 6/1/2021 | 0.00 | 0.22 | 0.00 | 3.42 | 3.96 | 18.16 | 11.98 | |||||||||||||||||||||||||||
| Mauritius SEMDEX |
1,717.54 | 6/1/2021 | 0.23 | (1.71 | ) | 0.23 | 7.33 | 4.20 | 5.48 | (23.58 | ) | |||||||||||||||||||||||||
| TTSE Composite Index |
1,379.90 | 6/1/2021 | 0.12 | 0.90 | 0.12 | 2.71 | 4.29 | 7.00 | 11.07 | |||||||||||||||||||||||||||
| Venezuela IBC General |
5,185.49 | 6/1/2021 | (1.46 | ) | (8.61 | ) | (1.46 | ) | 82.74 | (99.61 | ) | (98.43 | ) | (85.92 | ) | |||||||||||||||||||||
| Zambia LUSE All Share |
4,246.55 | 5/31/2021 | 2.20 | 0.67 | 3.34 | 5.61 | 8.54 | 5.52 | (23.48 | ) | ||||||||||||||||||||||||||
| NAMIBIA FTSE/JSE OVERALL |
1,468.39 | 6/1/2021 | 1.72 | 5.34 | 1.72 | 9.72 | 19.16 | 46.45 | 9.14 | |||||||||||||||||||||||||||
| Estonia OMXT |
1,621.53 | 6/1/2021 | 0.13 | 0.16 | 0.13 | 8.02 | 20.67 | 36.40 | 29.57 | |||||||||||||||||||||||||||
| Palestine General |
299.14 | 6/1/2021 | 0.95 | 4.29 | 0.95 | 12.11 | 12.07 | 10.45 | (0.30 | ) | ||||||||||||||||||||||||||
| DSE Broad Index |
5,993.33 | 6/1/2021 | 0.04 | 1.84 | 0.04 | 13.55 | 10.95 | 49.85 | 12.15 | |||||||||||||||||||||||||||
| Nigeria Emerging NSE - All Share |
38,414.37 | 6/1/2021 | (0.06 | ) | 0.41 | (0.06 | ) | (1.62 | ) | (4.61 | ) | 51.74 | 4.34 | |||||||||||||||||||||||
| Uganda All Share Index |
1,442.02 | 6/1/2021 | (0.68 | ) | 0.21 | (0.68 | ) | 6.41 | 10.09 | 6.79 | (29.82 | ) | ||||||||||||||||||||||||
| BVL General Sector Index |
20,973.85 | 6/1/2021 | (0.32 | ) | 3.64 | (0.32 | ) | (1.86 | ) | 0.73 | 33.22 | (0.21 | ) | |||||||||||||||||||||||
| IBrX |
55,155.54 | 6/1/2021 | 1.24 | 4.34 | 1.24 | 10.28 | 9.48 | 47.36 | 73.31 | |||||||||||||||||||||||||||
| IPSA |
4,396.10 | 6/1/2021 | 0.91 | 7.46 | 0.91 | (10.25 | ) | 5.24 | 19.27 | (19.65 | ) | |||||||||||||||||||||||||
| INMEX |
3,150.54 | 6/1/2021 | (0.19 | ) | 4.03 | (0.19 | ) | 7.94 | 17.35 | 45.34 | 16.67 | |||||||||||||||||||||||||
| FTSE/JSE Africa All Share |
68,922.86 | 6/1/2021 | 1.41 | 4.31 | 1.41 | 3.67 | 16.01 | 35.33 | 20.32 | |||||||||||||||||||||||||||
| MASI Index |
12,165.07 | 6/1/2021 | 0.42 | 0.59 | 0.42 | 5.93 | 7.78 | 22.40 | (0.67 | ) |
EXHIBIT IV-4
Colonial Federal Savings Bank
Market Area Acquisition Activity
Exhibit IV-4
Massachusetts Bank and Thrift Acquisitions 2017-Present
| Target Financials at Announcement | Deal Terms and Pricing at Announcement | |||||||||||||||||||||||||||||||||||||||||||||||||||||||||||||||||||||||||
| Announce |
Complete Date |
Buyer Name | Target Name | Total Assets ($000) |
E/A (%) |
TE/A (%) |
ROAA (%) |
ROAE (%) |
NPAs/ Assets (%) |
Rsrvs/ NPLs (%) |
Deal Value ($M) |
Value/ Share ($) |
P/B (%) |
P/TB (%) |
P/E (x) |
P/A (%) |
Prem/ Cdeps (%) |
|||||||||||||||||||||||||||||||||||||||||||||||||||||||||
| 04/22/2021 |
Pending | |
Independent Bank Corp. |
|
MA | Meridian Bancorp, Inc. |
MA | 6,503,925 | 12.13 | 11.84 | 1.17 | 10.12 | 0.07 | NM | 1150.6 | 21.882 | 145.39 | 149.55 | 14.49 | 17.69 | 8.71 | |||||||||||||||||||||||||||||||||||||||||||||||||||||
| 04/07/2021 |
Pending | |
Eastern Bankshares Inc. |
|
MA | Century Bancorp, Inc. |
MA | 6,358,834 | 5.83 | 5.78 | 0.70 | 11.96 | 0.10 | 572.54 | 641.9 | 115.280 | 173.29 | 174.57 | 15.21 | 10.09 | 5.49 | |||||||||||||||||||||||||||||||||||||||||||||||||||||
| 01/04/2021 |
07/01/2021 | |
SVB Financial Group |
|
CA | Boston Private Financial Holdings, Inc. |
MA | 9,431,305 | 8.97 | 8.34 | 0.46 | 4.98 | 0.52 | 172.47 | 942.6 | 10.943 | 106.37 | 115.30 | 21.46 | 9.99 | 2.20 | |||||||||||||||||||||||||||||||||||||||||||||||||||||
| 02/18/2020 |
02/01/2021 | |
LendingClub Corp. |
|
CA | Radius Bancorp, Inc. |
MA | 1,390,254 | 8.90 | 8.78 | 0.47 | 5.09 | 0.92 | 64.83 | 188.3 | NA | 176.41 | 179.49 | 35.39 | 13.54 | 9.37 | |||||||||||||||||||||||||||||||||||||||||||||||||||||
| 12/18/2019 |
06/01/2020 | |
Cambridge Financial Group Inc. |
|
MA | Melrose Bancorp, Inc. |
MA | 340,813 | 11.93 | 11.93 | 0.38 | 2.93 | NA | NA | 57.6 | 25.000 | 141.82 | 141.82 | 44.64 | 16.91 | 9.97 | |||||||||||||||||||||||||||||||||||||||||||||||||||||
| 12/05/2019 |
06/01/2020 | |
Cambridge Bancorp |
|
MA | Wellesley Bancorp, Inc. |
MA | 985,867 | 7.28 | 7.28 | 0.70 | 9.48 | NA | NA | 121.0 | 44.289 | 158.53 | 158.53 | 17.44 | 12.28 | 8.10 | |||||||||||||||||||||||||||||||||||||||||||||||||||||
| 12/04/2019 |
10/01/2020 | |
Bridgewater Financial MHC |
|
MA | Mansfield Co-operative Bank |
MA | 527,235 | 10.66 | 10.66 | 0.60 | 5.77 | 0.35 | 378.22 | NA | NA | NA | NA | NA | NA | NA | |||||||||||||||||||||||||||||||||||||||||||||||||||||
| 06/18/2019 |
01/01/2020 | |
Fidelity MHC |
|
MA | Family Federal Savings, F.A. |
MA | 97,894 | 11.76 | 11.76 | 0.05 | 0.47 | 1.36 | 32.11 | NA | NA | NA | NA | NA | NA | NA | |||||||||||||||||||||||||||||||||||||||||||||||||||||
| 04/09/2019 |
10/01/2019 | |
North Shore Bancorp |
|
MA | Beverly Financial, MHC |
MA | 486,825 | 8.53 | 8.53 | 0.72 | 8.40 | 0.30 | 294.09 | NA | NA | NA | NA | NA | NA | NA | |||||||||||||||||||||||||||||||||||||||||||||||||||||
| 02/27/2019 |
10/21/2019 | |
Hometown Financial Group MHC |
|
MA | Millbury Savings Bank |
MA | 228,126 | 12.46 | 12.46 | 0.81 | 6.72 | 0.76 | 99.48 | NA | NA | NA | NA | NA | NA | NA | |||||||||||||||||||||||||||||||||||||||||||||||||||||
| 02/06/2019 |
05/17/2019 | |
Hometown Financial Group MHC |
|
MA | Abington Bank |
MA | 314,124 | 10.55 | 9.92 | 0.47 | 4.45 | 1.31 | 37.00 | NA | NA | NA | NA | NA | NA | NA | |||||||||||||||||||||||||||||||||||||||||||||||||||||
| 11/27/2018 |
04/01/2019 | |
People’s United Financial Inc. |
|
CT | BSB Bancorp, Inc. |
MA | 2,971,807 | 6.66 | 6.66 | 0.74 | 11.00 | 0.19 | 322.35 | 317.2 | 32.420 | 159.75 | 159.75 | 14.87 | 10.67 | 7.27 | |||||||||||||||||||||||||||||||||||||||||||||||||||||
| 11/06/2018 |
04/30/2019 | |
North Easton Savings Bank |
|
MA | Mutual Bank | MA | 517,988 | 8.99 | 8.99 | 0.59 | 6.65 | 0.31 | 232.63 | NA | NA | NA | NA | NA | NA | NA | |||||||||||||||||||||||||||||||||||||||||||||||||||||
| 09/20/2018 |
04/01/2019 | |
Independent Bank Corp. |
|
MA | Blue Hills Bancorp, Inc. |
MA | 2,741,162 | 14.60 | 14.31 | 0.70 | 4.54 | 0.52 | 189.63 | 725.4 | 25.872 | 173.71 | 177.91 | 34.96 | 26.46 | 19.21 | |||||||||||||||||||||||||||||||||||||||||||||||||||||
| 08/14/2018 |
04/01/2019 | |
Equitable Bancorp MHC |
|
MA | South Shore Mutual Holding Company |
MA | 522,836 | 9.15 | 8.87 | 0.29 | 3.07 | 1.12 | 117.09 | NA | NA | NA | NA | NA | NA | NA | |||||||||||||||||||||||||||||||||||||||||||||||||||||
| 07/25/2018 |
01/31/2019 | |
Hometown Financial Group MHC |
|
MA | Pilgrim Bancshares, Inc. |
MA | 265,562 | 12.93 | 12.93 | 0.52 | 4.04 | 1.34 | 35.71 | 53.8 | 23.000 | 151.43 | 151.43 | 35.38 | 20.26 | 14.91 | |||||||||||||||||||||||||||||||||||||||||||||||||||||
| 05/29/2018 |
11/14/2018 | |
Independent Bank Corp. |
|
MA | MNB Bancorp |
MA | 365,356 | 8.19 | 8.19 | 0.55 | 6.19 | 0.44 | 258.96 | 54.3 | NA | 203.72 | 203.72 | 41.35 | 14.87 | 13.10 | |||||||||||||||||||||||||||||||||||||||||||||||||||||
| 04/30/2018 |
08/20/2018 | |
Salem Five Bancorp |
|
MA | Sage Bank | MA | 141,727 | 7.22 | 7.22 | -1.25 | -15.66 | 1.48 | 36.17 | 9.3 | 6.300 | 112.97 | 112.97 | NA | 6.59 | 1.64 | |||||||||||||||||||||||||||||||||||||||||||||||||||||
| 09/21/2017 |
03/01/2018 | |
Brookline Bancorp Inc. |
|
MA | First Commons Bank, National Association |
MA | 323,797 | 10.83 | 10.83 | 0.74 | 7.45 | 0.00 | NA | 55.5 | 16.700 | 158.31 | 158.31 | 22.06 | 17.15 | 11.47 | |||||||||||||||||||||||||||||||||||||||||||||||||||||
| 09/19/2017 |
04/01/2018 | |
Fidelity MHC |
|
MA | Colonial Co-operative Bank |
MA | 69,027 | 8.12 | 8.12 | 0.11 | 1.40 | 6.44 | 8.31 | NA | NA | NA | NA | NA | NA | NA | |||||||||||||||||||||||||||||||||||||||||||||||||||||
| 07/18/2017 |
10/31/2017 | |
South Shore Bancorp MHC |
|
MA | Braintree Bancorp MHC |
MA | 258,583 | 8.09 | 8.09 | 0.20 | 2.54 | 1.69 | 35.95 | NA | NA | NA | NA | NA | NA | NA | |||||||||||||||||||||||||||||||||||||||||||||||||||||
| 06/26/2017 |
12/29/2017 | |
Meridian Bancorp Inc. |
|
MA | Meetinghouse Bancorp, Inc. |
MA | 117,764 | 9.29 | 9.29 | 0.06 | 0.62 | NA | NA | 17.2 | NA | 157.21 | 157.21 | NM | 14.60 | 10.32 | |||||||||||||||||||||||||||||||||||||||||||||||||||||
| 05/22/2017 |
10/13/2017 | |
Berkshire Hills Bancorp Inc. |
|
MA | Commerce Bancshares Corp. |
MA | 2,219,402 | 7.33 | 6.85 | 0.75 | 8.80 | 1.14 | 63.29 | 209.2 | 33.062 | 128.63 | 138.27 | 14.59 | 9.43 | 2.99 | |||||||||||||||||||||||||||||||||||||||||||||||||||||
| 05/17/2017 |
10/01/2017 | |
Abington Bank |
|
MA | Avon Co-operative Bank |
MA | 90,491 | 10.15 | 10.15 | 0.22 | 2.10 | 0.00 | NA | NA | NA | NA | NA | NA | NA | NA | |||||||||||||||||||||||||||||||||||||||||||||||||||||
|
|
|
|
|
|
|
|
|
|
|
|
|
|
|
|
|
|
|
|
|
|
|
|
|
|
|
|
|
|||||||||||||||||||||||||||||||||||||||||||||||
| Average: | 1,552,946 | 9.61 | 9.49 | 0.45 | 4.71 | 0.97 | 163.93 | 153.40 | 155.63 | 25.99 | 14.32 | 8.91 | ||||||||||||||||||||||||||||||||||||||||||||||||||||||||||||||
| Median: | 426,091 | 9.07 | 8.93 | 0.54 | 5.04 | 0.52 | 108.29 | 157.76 | 157.76 | 21.76 | 14.07 | 9.04 | ||||||||||||||||||||||||||||||||||||||||||||||||||||||||||||||
Source: S&P Global Market Intelligence.
EXHIBIT IV-5
Colonial Federal Savings Bank
Director and Senior Management Resumes
EXHIBIT IV-5
Colonial Federal Savings Bank
Director and Senior Management Resumes
| Directors |
Position |
Age | Director Since | Current Term to Expire | ||||
| James M. O’Leary, Jr. |
Chairman of the Board |
65 | 2014 | 2024 | ||||
| Michael E. McFarland |
President and Chief Executive Officer |
67 | 1994 | 2022 | ||||
| Paul N. Baharian |
Director |
75 | 2000 | 2023 | ||||
| Robert Guarnieri |
Director |
74 | 1989 | 2023 | ||||
| Edward J. Keohane |
Director |
77 | 1980 | 2022 | ||||
| Stephen D. Marini |
Director |
75 | 1997 | 2024 | ||||
| Tracy L. Wilson |
Director |
51 | 2018 | 2022 |
The business experience for the past five years of each of the Bank’s directors is set forth below. The biographies also contain information regarding the person’s experience, qualifications, attributes or skills that caused the board of directors to determine that the person should serve as a director. Unless otherwise indicated, directors have held their positions for the past five years.
Paul N. Baharian has over 40 years of experience in congregate elderly housing serving as the Executive Director of 1000 Southern Artery in Quincy, Massachusetts. Mr. Baharian currently serves on the Board of Directors of 1000 Southern Artery. He retired in 2010. Mr. Baharian also has both commercial and residential banking experience with the South Shore National Bank prior to joining 1000 Southern Artery. Mr. Baharian has extensive experience in management, customer service and employee relations. Mr. Baharian has been involved in many civic and community projects over the years.
Robert Guarnieri is the retired President and Chief Executive Officer of Colonial Federal Savings Bank. Mr. Guarnieri has been associated with Colonial Federal Savings Bank since 1975 and has served as Controller, Treasurer before being elected as the President and Chief Executive Officer and a director in 1989. He also served as Chairman for five years. Mr. Guarnieri formerly worked at the firm of KPMG. He was a certified public accountant for many years. Mr. Guarnieri has a strong banking and accounting background and an excellent track record in sales, customer assessment, risk management and team building. Over the years he has served on numerous boards in the congregate housing industry and various charitable endeavors.
Edward Keohane is the past Chairman of Colonial Federal Savings Bank. Mr. Keohane is the retired president of Keohane Funeral Service in Quincy, Massachusetts. Mr. Keohane is associated with Keohane Funeral Service in an advisory and mentoring role. Mr. Keohane has extensive experience in the service industry and in employee recruitment, retention and professional development. Mr. Keohane has been involved in the business community serving both nationally and locally. Mr. Keohane is a former president and director of National Selected Morticians. He is also one of the founders of the Quincy Chamber of Commerce and served as its first president. He brings a wealth of business knowledge, community and civic involvement to the bank.
Stephen D. Marini has over 40 years of experience as a certified public accountant and an auditor. He is a retired vice president of the firm of Gerald T. Reilly & Co. CPAs. Mr. Marini serves as Chairman of the Audit Committee. Mr. Marini also served on the Board of the former Braintree Savings Bank. Mr. Marini has significant experience building relationships with clients and development of employees. Mr. Marini had served as a director of the South Shore Chamber of Commerce for many years and has been involved in many non-profit and charitable endeavors.
Michael E. McFarland is the President and Chief Executive Officer of Colonial Federal Savings Bank. He has served in this position for nine years. Mr. McFarland’s position as President and Chief Officer fosters clear accountability, effective decision making, a clear and direct channel of communication from senior management to the full board of directors, and alignment on corporate strategy. Mr. McFarland has served as an elected member of both the Quincy City Council and the Quincy School Committee. He currently serves as the Vice Chairman of the Norfolk County Agricultural
High School Board of Trustees in Walpole, Massachusetts. Mr. McFarland has been involved in many community and civic endeavors including past board member of both the Quincy and South Shore Chambers of Commerce. He is a member of the Quincy Retirement Board and also serves on the Quincy Affordable Housing Trust. Mr. McFarland serves on the Board of Trustees of 1000 Southern Artery in Quincy.
James O’Leary is the Chairman of the Board of Colonial Federal Savings Bank. He was elected Chairman in 2018. Mr. O’Leary is the President of Milton E. T. Lawrence Company, a group insurance provider. Mr. O’Leary has extensive experience in insurance, employee benefit plans and risk management. He brings a wealth of local contacts, sales experience, extensive insights into customers and the local real estate market. Mr. O’Leary is a member of the BID Milton Board of Advisors. He is actively involved in a variety of civic and educational institutions.
Tracy L. Wilson is a life-long resident of Quincy, Massachusetts. Ms. Wilson is an attorney and president of the Law Offices of Tracy Wilson, P.C., with offices located in Quincy and Canton, Massachusetts. Ms. Wilson is a former Norfolk County Assistant District Attorney. Ms. Wilson brings considerable legal perspective to both policy and employment matters. She is active in the local legal community specializing in probate/estates, guardianships, civil litigation, divorce/family law and mediation/conciliation. Ms. Wilson has raised thousands of dollars for Children’s Hospital-Boston running with the Miles for Miracles Team in the Boston Marathon. She remains active in the community, participates in various local charity and civic organizations, and is a long-time sponsor and supporter of local youth sports and the arts.
Executive Officers Who Are Not Directors
The following sets forth information regarding the Bank’s executive officers who are not directors. Age information is as of June 30, 2021. The executive officers of CFSB Bancorp, Inc. and Colonial Federal Savings Bank are elected annually.
Susan Shea, age 63, has been employed at Colonial Federal Savings Bank since 1978 and is currently the Bank’s Treasurer and Chief Operating Officer, positions she has held since 2013. Ms. Shea serves as a member of the Loan Committee, Asset Review Committee, Asset/Liability Committee, Compliance Committee and IT Steering Committee.
Kemal A. Denizkurt, age 55, is the Vice President of Financial Markets. He joined Colonial Federal Savings Bank in 2000 to manage interest rate risk and the investment portfolio. Mr. Denizkurt serves as Chairman of the Asset Liability Committee and the Compliance Committee and oversees both compliance and internal audit programs for Colonial Federal Savings Bank. He is a long-serving member of the Loan Committee, conducts internal loan review, and provides oversight of the commercial real estate participation loan portfolio including credit underwriting and monitoring. Prior to joining Colonial Federal Savings Bank, Mr. Denizkurt was a national bank examiner for the Office of Thrift Supervision, conducting safety and soundness examinations for a ten-year period. Mr. Denizkurt is a long-time member of the Zoning Board of Appeals in Weymouth, Massachusetts and currently serves as Vice Chairman.
William R. Esselstyn, age 52, is Vice President of Information Systems for Colonial Federal Savings Bank, a position he has held since 1999. He also serves as the Information Security Officer and is the Assistant Secretary of the Bank. He is a member of the Compliance Committee and IT Steering Committee and is responsible for E-Banking services. Mr. Esselstyn began his employment at Colonial Federal Savings Bank in 1987. He is active in the local Quincy and Braintree communities, and currently serves on the board and as treasurer of the Wollaston Church of the Nazarene.
Mary Kuropatkin, age 52, is the Vice President of Retail Banking for Colonial Federal Savings Bank. She has served in this position and also as Colonial Federal Savings Bank’s BSA Officer since 1999. Ms. Kuropatkin began her employment with Colonial Federal in 1985. Ms. Kuropatkin serves as a member of the ALCO Committee, Compliance Committee and IT Steering Committee.
Angela M. Blanchard, age 54, is the Vice President-Retail Lending and CRA Officer of Colonial Federal Savings Bank, positions she has held since 2012. She joined Colonial Federal in 1996. Ms. Blanchard serves a as member of the Loan Committee, the Asset Review Committee, the ALCO Committee and the Compliance Committee. Prior to joining Colonial Federal Savings Bank, Ms. Blanchard was an Assistant Vice President – Asset Manager/Commercial Loan Workout Officer for Shawmut Bank N.A.
Source: CFSB Bancorp’s Preliminary Offering Prospectus
EXHIBIT IV-6
Colonial Federal Savings Bank
Pro Forma Regulatory Capital Ratios
EXHIBIT IV-6
Colonial Federal Savings Bank
Pro Forma Regulatory Capital Ratios
Institution: Colonial FSB
| Actual, As of | Pro Forma at June 30, 2021 | |||||||||||||||||||||||||||||||||||||||
| June 30, 2021 | Minimum | Midpoint | Maximum | Maximum As Adjusted | ||||||||||||||||||||||||||||||||||||
| 18,275,000 | 21,500,000 | 24,725,000 | 28,433,750 | |||||||||||||||||||||||||||||||||||||
| Amount | Percent of Assets |
Amount | Percent of Assets |
Amount | Percent of Assets |
Amount | Percent of Assets |
Amount | Percent of Assets |
|||||||||||||||||||||||||||||||
| (Dollars in Thousands) | ||||||||||||||||||||||||||||||||||||||||
| Capital and Retained Earnings Under GAAP BANK LEVEL |
$ | 48,646 | 14.36 | % | $ | 54,510 | 15.74 | % | $ | 55,699 | 16.01 | % | $ | 56,889 | 16.28 | % | $ | 58,256 | 16.59 | % | ||||||||||||||||||||
|
|
|
|
|
|
|
|
|
|
|
|
|
|
|
|
|
|
|
|
|
|||||||||||||||||||||
| Tier 1 Capital (Leverage) |
$ | 48,628 | 14.40 | % | $ | 54,492 | 15.78 | % | $ | 55,681 | 16.06 | % | $ | 56,871 | 16.33 | % | $ | 58,238 | 16.64 | % | ||||||||||||||||||||
| Requirement |
16,888 | 5.00 | % | 17,265 | 5.00 | % | 17,339 | 5.00 | % | 17,413 | 5.00 | % | 17,499 | 5.00 | % | |||||||||||||||||||||||||
|
|
|
|
|
|
|
|
|
|
|
|
|
|
|
|
|
|
|
|
|
|||||||||||||||||||||
| Excess |
$ | 31,740 | 9.40 | % | $ | 37,227 | 10.78 | % | $ | 38,342 | 11.06 | % | $ | 39,458 | 11.33 | % | $ | 40,739 | 11.64 | % | ||||||||||||||||||||
|
|
|
|
|
|
|
|
|
|
|
|
|
|
|
|
|
|
|
|
|
|||||||||||||||||||||
| Tier I Risk Based |
$ | 48,628 | 28.67 | % | $ | 54,492 | 31.84 | % | $ | 55,681 | 32.48 | % | $ | 56,871 | 33.12 | % | $ | 58,238 | 33.85 | % | ||||||||||||||||||||
| Requirement |
13,569 | 8.00 | % | 13,690 | 8.00 | % | 13,713 | 8.00 | % | 13,737 | 8.00 | % | 13,764 | 8.00 | % | |||||||||||||||||||||||||
|
|
|
|
|
|
|
|
|
|
|
|
|
|
|
|
|
|
|
|
|
|||||||||||||||||||||
| Excess |
$ | 35,059 | 20.67 | % | $ | 40,802 | 23.84 | % | $ | 41,968 | 24.48 | % | $ | 43,134 | 25.12 | % | $ | 44,474 | 25.85 | % | ||||||||||||||||||||
| Total Risk-Based |
$ | 50,350 | 29.68 | % | $ | 56,214 | 32.85 | % | $ | 57,403 | 33.49 | % | $ | 58,593 | 34.12 | % | $ | 59,960 | 34.85 | % | ||||||||||||||||||||
| Risk-Based Requirement |
16,962 | 10.00 | % | 17,112 | 10.00 | % | 17,142 | 10.00 | % | 17,171 | 10.00 | % | 17,206 | 10.00 | % | |||||||||||||||||||||||||
|
|
|
|
|
|
|
|
|
|
|
|
|
|
|
|
|
|
|
|
|
|||||||||||||||||||||
| Excess |
$ | 33,389 | 19.68 | % | $ | 39,102 | 22.85 | % | $ | 40,261 | 23.49 | % | $ | 41,422 | 24.12 | % | $ | 42,754 | 24.85 | % | ||||||||||||||||||||
|
|
|
|
|
|
|
|
|
|
|
|
|
|
|
|
|
|
|
|
|
|||||||||||||||||||||
| Common Eq. Tier 1 RB Capital |
$ | 48,628 | 28.67 | % | $ | 54,492 | 31.84 | % | $ | 55,681 | 32.48 | % | $ | 56,871 | 33.12 | % | $ | 58,238 | 33.85 | % | ||||||||||||||||||||
| Requirement |
11,025 | 6.50 | % | 11,123 | 6.50 | % | 11,142 | 6.50 | % | 11,161 | 6.50 | % | 11,184 | 6.50 | % | |||||||||||||||||||||||||
|
|
|
|
|
|
|
|
|
|
|
|
|
|
|
|
|
|
|
|
|
|||||||||||||||||||||
| Excess |
$ | 37,603 | 22.17 | % | $ | 43,369 | 25.34 | % | $ | 44,539 | 25.98 | % | $ | 45,710 | 26.62 | % | $ | 47,054 | 27.35 | % | ||||||||||||||||||||
|
|
|
|
|
|
|
|
|
|
|
|
|
|
|
|
|
|
|
|
|
|||||||||||||||||||||
| Reconciliation of capital infused into Colonial FSB |
|
|||||||||||||||||||||||||||||||||||||||
| Net proceeds infused into Colonial FSB |
|
$ | 8,437 | $ | 10,030 | $ | 11,623 | $ | 13,454 | |||||||||||||||||||||||||||||||
| Proceeds to MHC |
|
($ | 100 | ) | ($ | 100 | ) | ($ | 100 | ) | ($ | 100 | ) | |||||||||||||||||||||||||||
| Less: Cash Contribution to Foundation |
|
(250 | ) | (250 | ) | (250 | ) | (250 | ) | |||||||||||||||||||||||||||||||
| Plus: Tax Benefit of contribution to Foundation |
|
276 | 314 | 351 | 394 | |||||||||||||||||||||||||||||||||||
| Less: ESOP |
|
(1,666 | ) | (1,960 | ) | (2,254 | ) | (2,592 | ) | |||||||||||||||||||||||||||||||
| Less: Stock Plan |
|
(833 | ) | (980 | ) | (1,127 | ) | (1,296 | ) | |||||||||||||||||||||||||||||||
|
|
|
|
|
|
|
|
|
|||||||||||||||||||||||||||||||||
| Pro Forma Increase in Tier 1 and RBC |
|
$ | 5,864 | $ | 7,053 | $ | 8,244 | $ | 9,610 | |||||||||||||||||||||||||||||||
Source: CFSB Bancorp’s Preliminary Offering Prospectus
EXHIBIT IV-7
Colonial Federal Savings Bank
Pro Forma Analysis Sheet – Fully Converted Basis
EXHIBIT IV-7
PRO FORMA ANALYSIS SHEET
CFSB Bancorp, Inc.
Prices as of August 20, 2021
| Subject at | Thrift Peer Group | All Public Thrifts | ||||||||||||||||||||||||
| Valuation Pricing Multiples |
Symbol | Midpoint | Mean | Median | Mean | Median | ||||||||||||||||||||
| Price-earnings multiple |
= | P/E | 54.58 | x | 11.58 | x | 10.04 | x | 12.36 | x | 11.63 | x | ||||||||||||||
| Price-core earnings multiple |
= | P/CE | 54.58 | x | 13.21 | x | 10.05 | x | 13.12 | x | 11.78 | x | ||||||||||||||
| Price-book ratio |
= | P/B | 55.66 | % | 90.73 | % | 90.88 | % | 110.06 | % | 102.30 | % | ||||||||||||||
| Price-tangible book ratio |
= | P/TB | 55.66 | % | 93.00 | % | 98.14 | % | 123.03 | % | 109.31 | % | ||||||||||||||
| Price-assets ratio |
= | P/A | 13.16 | % | 12.30 | % | 10.11 | % | 13.42 | % | 12.52 | % | ||||||||||||||
| Valuation Parameters |
% of Offering |
% of Offering + Foundation |
||||||||||||||
| Pre-Conversion Earnings (Y) |
$ | 1,392,000 | (12 Mths 6/21) | ESOP Stock as % of Offering (E) | 8.1633 | % | 8.0000 | % | ||||||||
| Pre-Conversion Core Earnings |
$ | 1,392,000 | (12 Mths 6/21) | Cost of ESOP Borrowings (S) | 0.00 | % | ||||||||||
| Pre-Conversion Book Value (B) |
$ | 48,545,000 | (6/21) | ESOP Amortization (T) | 25.00 | years | ||||||||||
| Intangibles |
$ | 0 | (6/21) | SBP Stock as % of Offering (M) | 4.0816 | % | 4.0000 | % | ||||||||
|
|
|
|||||||||||||||
| Pre-Conv. Tang. Book Value (B) |
$ | 48,545,000 | (6/21) | Stock Programs Vesting (N) | 5.00 | years | ||||||||||
| Pre-Conversion Assets (A) |
$ | 338,659,000 | (6/21) | Fixed Expenses | $ | 1,200,000 | ||||||||||
| Reinv. Rate: (5 Yr Treas)@6/30/21 |
0.87 | % | Subscr/Dir Comm Exp (Mdpnt) | $ | 584,550 | 1.35 | % | |||||||||
|
|
|
|||||||||||||||
| Tax rate (TAX) |
25.08 | % | Total Expenses (Midpoint) | $ | 1,784,550 | |||||||||||
| A-T Reinvestment Rate(R) |
0.65 | % | Syndicate Expenses (Mdpnt) | $ | 0 | 0.00 | % | |||||||||
| Est. Conversion Expenses (1)(X) |
3.57 | % | Syndicate Amount | $ | 0 | |||||||||||
| Insider Purchases ($) |
$ | 1,700,000 | Percent Sold (PCT) | 100.00 | % | |||||||||||
| Price/Share |
$ | 10.00 | MHC Assets | $ | 100,000 | |||||||||||
| Foundation Cash Contrib. (FC) |
$ | 250,000 | Options as % of Offering (O1) | 10.2041 | % | 10.00 | % | |||||||||
| Found. Stk Contrib (% of Total Shrs (FS) |
0.0000 | % | Estimated Option Value (O2) | 34.50 | % | |||||||||||
| Foundation Tax Benefit (Z) |
$ | 313,500 | Option Vesting Period (O3) | 5.00 | years | |||||||||||
| Foundation Amount (Mdpt.) |
$ | 1,000,000 | % of Options taxable (O4) | 25.00 | % | |||||||||||
| Calculation of Pro Forma Value After Conversion | ||||||||||
| 1. V= |
P/E * (Y) |
V= | $ | 50,000,000 | ||||||
| 1 - P/E * PCT * ((1-X-E-M-FC-FS)*R - (1-TAX)*E/T - (1-TAX)*M/N)-(1-(TAX*O4))*(O1*O2)/O3) |
||||||||||
|
1. V= |
P/E * (Y) |
V= | $ | 50,000,000 |
| 1 - P/Core E * PCT * ((1-X-E-M-FC-FS)*R - (1-TAX)*E/T - (1-TAX)*M/N)-(1-(TAX*O4))*(O1*O2)/O3) |
||||||||||
|
2. V= |
P/B * (B+Z) |
V= | $ | 50,000,000 |
| 1 - P/B * PCT * (1-X-E-M-FC-FS) |
||||||||||
|
2. V= |
P/TB * (TB+Z) |
V= | $ | 50,000,000 |
| 1 - P/TB * PCT * (1-X-E-M-FC-FS) |
||||||||||
|
3. V= |
P/A * (A+Z+PA) |
V= | $ | 50,000,000 |
| 1 - P/A * PCT * (1-X-E-M-FC-FS) |
||||||||||
| Valuation Conclusion |
Shares Issued to MHC |
Shares Sold to Public |
Foundation Shares |
Total Shares Issued |
Price Per Share |
Market Value of Stock Sold in Offering |
Market Value of Stock Issued in Reorganization |
|||||||||||||||||||||
| Supermaximum |
0 | 6,480,250 | 132,250 | 6,612,500 | $ | 10.00 | $ | 64,802,500 | $ | 66,125,000 | ||||||||||||||||||
| Maximum |
0 | 5,635,000 | 115,000 | 5,750,000 | 10.00 | 56,350,000 | $ | 57,500,000 | ||||||||||||||||||||
| Midpoint |
0 | 4,900,000 | 100,000 | 5,000,000 | 10.00 | 49,000,000 | $ | 50,000,000 | ||||||||||||||||||||
| Minimum |
0 | 4,165,000 | 85,000 | 4,250,000 | 10.00 | 41,650,000 | $ | 42,500,000 | ||||||||||||||||||||
| Valuation Conclusion |
Shares Issued to MHC |
Shares Sold to Public |
Foundation Shares |
Total Shares Issued |
||||||||||||||||||||||||
| Supermaximum |
0.000 | % | 98.000 | % | 2.000 | % | 100.000 | % | ||||||||||||||||||||
| Maximum |
0.000 | % | 98.000 | % | 2.000 | % | 100.000 | % | ||||||||||||||||||||
| Midpoint |
0.000 | % | 98.000 | % | 2.000 | % | 100.000 | % | ||||||||||||||||||||
| Minimum |
0.000 | % | 98.000 | % | 2.000 | % | 100.000 | % | ||||||||||||||||||||
| (1) | Estimated offering expenses at midpoint of the offering. |
EXHIBIT IV-8
Colonial Federal Savings Bank
Pro Forma Effect of Conversion Proceeds – Fully Converted Basis
Exhibit IV-8
PRO FORMA EFFECT OF CONVERSION PROCEEDS
CFSB Bancorp, Inc.
At the Minimum of the Range
| 1. | Market Value of Shares Sold In Offering: |
$ | 41,650,000 | |||
| Market Value of Shares Issued to Foundation: |
850,000 | |||||
|
|
|
|||||
| Total Market Value of Company: |
$ | 42,500,000 | ||||
| 2. | Offering Proceeds of Shares Sold In Offering |
$ | 41,650,000 | |||
| Less: Estimated Offering Expenses |
1,693,425 | |||||
|
|
|
|||||
| Net Conversion Proceeds |
$ | 39,956,575 | ||||
| 3. | Estimated Additional Equity and Income from Offering Proceeds |
|||||
| Net Conversion Proceeds |
$ | 39,956,575 | ||||
| Less: Cash Contribution to Foundation |
(250,000 | ) | ||||
| Less: Non-Cash ESOP Stock Purchases (1) |
(3,400,000 | ) | ||||
| Less: Non-Cash SBP Stock Purchases (2) |
(1,700,000 | ) | ||||
|
|
|
|||||
| Net Conversion Proceeds Reinvested |
$ | 34,606,575 | ||||
| Estimated After-Tax Reinvestment Rate |
0.65 | % | ||||
|
|
|
|||||
| Earnings from Reinvestment of Proceeds |
$ | 225,567 | ||||
| Less: Estimated cost of ESOP borrowings(1) |
0 | |||||
| Less: Amortization of ESOP borrowings(1) |
(101,891 | ) | ||||
| Less: Stock Programs Vesting (2) |
(254,728 | ) | ||||
| Less: Option Plan Vesting (3) |
(274,863 | ) | ||||
|
|
|
|||||
| Net Earnings Increase |
($ | 405,915 | ) | |||
| 4. | Pro Forma Earnings | Before Conversion |
Net Earnings Increase |
After Conversion |
||||||||||||||
| 12 Months ended June 30, 2021 (reported) |
|
$ | 1,392,000 | ($ | 405,915 | ) | $ | 986,085 | ||||||||||
| 12 Months ended June 30, 2021 (core) | $ | 1,392,000 | ($ | 405,915 | ) | $ | 986,085 | |||||||||||
| 5. | Pro Forma Net Worth | Before Conversion |
Net Equity Proceeds |
Tax Benefit of Foundation |
After Conversion |
|||||||||||||
| June 30, 2021 | $ | 48,545,000 | $ | 34,606,575 | $ | 275,880 | $ | 83,427,455 | ||||||||||
| June 30, 2021 (Tangible) | $ | 48,545,000 | $ | 34,606,575 | $ | 275,880 | $ | 83,427,455 | ||||||||||
| 6. | Pro Forma Assets | Before Conversion |
Net Cash Proceeds |
Tax Benefit of Foundation |
After Conversion |
|||||||||||||
| June 30, 2021 | $ | 338,659,000 | $ | 34,606,575 | $ | 275,880 | $ | 373,541,455 | ||||||||||
| (1) | ESOP stock (8% of offering) amortized over 25 years, amortization expense is tax effected at 25.08%. |
| (2) | Stock programs (4% of offering) amortized over 5 years, amortization expense is tax effected at 25.08%. |
| (3) | Option valuation based on Black-Scholes model, 5 year vesting, and assuming 25% taxable. |
Exhibit IV-8
PRO FORMA EFFECT OF CONVERSION PROCEEDS
CFSB Bancorp, Inc.
At the Midpoint of the Range
| 1. | Market Value of Shares Sold In Offering: |
$ | 49,000,000 | |||
| Market Value of Shares Issued to Foundation: |
1,000,000 | |||||
|
|
|
|||||
| Total Market Value of Company: |
$ | 50,000,000 | ||||
| 2. | Offering Proceeds of Shares Sold In Offering |
$ | 49,000,000 | |||
| Less: Estimated Offering Expenses |
1,784,550 | |||||
|
|
|
|||||
| Net Conversion Proceeds |
$ | 47,215,450 | ||||
| 3. | Estimated Additional Equity and Income from Offering Proceeds |
|||||
| Net Conversion Proceeds |
$ | 47,215,450 | ||||
| Less: Cash Contribution to Foundation |
(250,000 | ) | ||||
| Less: Non-Cash ESOP Stock Purchases (1) |
(4,000,000 | ) | ||||
| Less: Non-Cash SBP Stock Purchases (2) |
(2,000,000 | ) | ||||
|
|
|
|||||
| Net Conversion Proceeds Reinvested |
$ | 40,965,450 | ||||
| Estimated After-Tax Reinvestment Rate |
0.65 | % | ||||
|
|
|
|||||
| Earnings from Reinvestment of Proceeds |
$ | 267,014 | ||||
| Less: Estimated cost of ESOP borrowings(1) |
0 | |||||
| Less: Amortization of ESOP borrowings(1) |
(119,872 | ) | ||||
| Less: Stock Programs Vesting (2) |
(299,680 | ) | ||||
| Less: Option Plan Vesting (3) |
(323,369 | ) | ||||
|
|
|
|||||
| Net Earnings Increase |
($ | 475,906 | ) | |||
| 4. | Pro Forma Earnings | Before Conversion |
Net Earnings Increase |
After Conversion |
||||||||||||||
| 12 Months ended June 30, 2021 (reported) |
|
$ | 1,392,000 | ($ | 475,906 | ) | $ | 916,094 | ||||||||||
| 12 Months ended June 30, 2021 (core) | $ | 1,392,000 | ($ | 475,906 | ) | $ | 916,094 | |||||||||||
| 5. | Pro Forma Net Worth | Before Conversion |
Net Capital Proceeds |
Tax Benefit of Foundation |
After Conversion |
|||||||||||||
| June 30, 2021 | $ | 48,545,000 | $ | 40,965,450 | $ | 313,500 | $ | 89,823,950 | ||||||||||
| June 30, 2021 (Tangible) | $ | 48,545,000 | $ | 40,965,450 | $ | 313,500 | $ | 89,823,950 | ||||||||||
| 6. | Pro Forma Assets | Before Conversion |
Net Cash Proceeds |
Tax Benefit of Foundation |
After Conversion |
|||||||||||||
| June 30, 2021 | $ | 338,659,000 | $ | 40,965,450 | $ | 313,500 | $ | 379,937,950 | ||||||||||
| (1) | ESOP stock (8% of offering) amortized over 25 years, amortization expense is tax effected at 25.08%. |
| (2) | Stock programs (4% of offering) amortized over 5 years, amortization expense is tax effected at 25.08%. |
| (3) | Option valuation based on Black-Scholes model, 5 year vesting, and assuming 25% taxable. |
Exhibit IV-8
PRO FORMA EFFECT OF CONVERSION PROCEEDS
CFSB Bancorp, Inc.
At the Maximum of the Range
| 1. |
Market Value of Shares Sold In Offering: | $ | 56,350,000 | |||
| Market Value of Shares Issued to Foundation: | 1,150,000 | |||||
|
|
|
|||||
| Total Market Value of Company: |
$ | 57,500,000 | ||||
| 2. |
Offering Proceeds of Shares Sold In Offering | $ | 56,350,000 | |||
| Less: Estimated Offering Expenses |
1,875,675 | |||||
|
|
|
|||||
| Net Conversion Proceeds | $ | 54,474,325 | ||||
| 3. |
Estimated Additional Equity and Income from Offering Proceeds | |||||
| Net Conversion Proceeds | $ | 54,474,325 | ||||
| Less: Cash Contribution to Foundation |
(250,000 | ) | ||||
| Less: Non-Cash ESOP Stock Purchases (1) |
(4,600,000 | ) | ||||
| Less: Non-Cash SBP Stock Purchases (2) |
(2,300,000 | ) | ||||
|
|
|
|||||
| Net Conversion Proceeds Reinvested | $ | 47,324,325 | ||||
| Estimated After-Tax Reinvestment Rate | 0.65 | % | ||||
|
|
|
|||||
| Earnings from Reinvestment of Proceeds |
$ | 308,462 | ||||
| Less: Estimated cost of ESOP borrowings(1) |
0 | |||||
| Less: Amortization of ESOP borrowings(1) |
(137,853 | ) | ||||
| Less: Stock Programs Vesting (2) |
(344,632 | ) | ||||
| Less: Option Plan Vesting (3) |
(371,874 | ) | ||||
|
|
|
|||||
| Net Earnings Increase | ($ | 545,897 | ) | |||
| 4. | Pro Forma Earnings | Before Conversion |
Net Earnings Increase |
After Conversion |
||||||||||||||
| 12 Months ended June 30, 2021 (reported) |
|
$ | 1,392,000 | ($ | 545,897 | ) | $ | 846,103 | ||||||||||
| 12 Months ended June 30, 2021 (core) | $ | 1,392,000 | ($ | 545,897 | ) | $ | 846,103 | |||||||||||
| 5. | Pro Forma Net Worth | Before Conversion |
Net Capital Proceeds |
Tax Benefit of Foundation |
After Conversion |
|||||||||||||
| June 30, 2021 |
$ | 48,545,000 | $ | 47,324,325 | $ | 351,120 | $ | 96,220,445 | ||||||||||
| June 30, 2021 (Tangible) |
$ | 48,545,000 | $ | 47,324,325 | $ | 351,120 | $ | 96,220,445 | ||||||||||
| 6. | Pro Forma Assets | Before Conversion |
Net Cash Proceeds |
Tax Benefit of Foundation |
After Conversion |
|||||||||||||
| June 30, 2021 |
$ | 338,659,000 | $ | 47,324,325 | $ | 351,120 | $ | 386,334,445 | ||||||||||
| (1) | ESOP stock (8% of offering) amortized over 25 years, amortization expense is tax effected at 25.08%. |
| (2) | Stock programs (4% of offering) amortized over 5 years, amortization expense is tax effected at 25.08%. |
| (3) | Option valuation based on Black-Scholes model, 5 year vesting, and assuming 25% taxable. |
Exhibit IV-8
PRO FORMA EFFECT OF CONVERSION PROCEEDS
CFSB Bancorp, Inc.
At the Supermaximum Value
| 1. | Market Value of Shares Sold In Offering: | $ | 64,802,500 | |||
| Market Value of Shares Issued to Foundation: | 1,322,500 | |||||
|
|
|
|||||
| Total Market Value of Company: |
$ | 66,125,000 | ||||
| 2. | Offering Proceeds of Shares Sold In Offering | $ | 64,802,500 | |||
| Less: Estimated Offering Expenses |
1,980,469 | |||||
|
|
|
|||||
| Net Conversion Proceeds | $ | 62,822,031 | ||||
| 3. | Estimated Additional Equity and Income from Offering Proceeds | |||||
| Net Conversion Proceeds | $ | 62,822,031 | ||||
| Less: Cash Contribution to Foundation |
(250,000 | ) | ||||
| Less: Non-Cash ESOP Stock Purchases (1) |
(5,289,994 | ) | ||||
| Less: Non-Cash MRP Stock Purchases (2) |
(2,644,992 | ) | ||||
|
|
|
|||||
| Net Conversion Proceeds Reinvested | $ | 54,637,045 | ||||
| Estimated After-Tax Reinvestment Rate | 0.65 | % | ||||
|
|
|
|||||
| Earnings from Reinvestment of Proceeds |
$ | 356,126 | ||||
| Less: Estimated cost of ESOP borrowings(1) |
0 | |||||
| Less: Amortization of ESOP borrowings(1) |
(158,531 | ) | ||||
| Less: Stock Programs Vesting (2) |
(396,327 | ) | ||||
| Less: Option Plan Vesting (3) |
(427,655 | ) | ||||
|
|
|
|||||
| Net Earnings Increase | ($ | 626,386 | ) | |||
| 4. | Pro Forma Earnings | Before Conversion |
Net Earnings Increase |
After Conversion |
||||||||||||||
| 12 Months ended June 30, 2021 (reported) |
|
$ | 1,392,000 | ($ | 626,386 | ) | $ | 765,614 | ||||||||||
| 12 Months ended June 30, 2021 (core) |
$ | 1,392,000 | ($ | 626,386 | ) | $ | 765,614 | |||||||||||
| 5. | Pro Forma Net Worth | Before Conversion |
Net Capital Proceeds |
Tax Benefit of Foundation |
After Conversion |
|||||||||||||
| June 30, 2021 |
$ | 48,545,000 | $ | 54,637,045 | $ | 394,383 | $ | 103,576,428 | ||||||||||
| June 30, 2021 (Tangible) |
$ | 48,545,000 | $ | 54,637,045 | $ | 394,383 | $ | 103,576,428 | ||||||||||
| 6. | Pro Forma Assets | Before Conversion |
Net Cash Proceeds |
Tax Benefit of Foundation |
After Conversion |
|||||||||||||
| June 30, 2021 |
$ | 338,659,000 | $ | 54,637,045 | $ | 394,383 | $ | 393,690,428 | ||||||||||
| (1) | ESOP stock (8% of offering) amortized over 25 years, amortization expense is tax effected at 25.08%. |
| (2) | Stock programs (4% of offering) amortized over 5 years, amortization expense is tax effected at 25.08%. |
| (3) | Option valuation based on Black-Scholes model, 5 year vesting, and assuming 25% taxable. |
EXHIBIT IV-9
Colonial Federal Savings Bank
Pro Forma Analysis Sheet – MHC Basis
EXHIBIT IV-9
PRO FORMA ANALYSIS SHEET
CFSB Bancorp, Inc.
Prices as of August 20, 2021
| Subject at | Thrift Peer Group | All Public Thrifts | ||||||||||||||||||||||||
| Valuation Pricing Multiples |
Symbol | Midpoint | Mean | Median | Mean | Median | ||||||||||||||||||||
| Price-earnings multiple |
= | P/E | 43.96 | x | 11.58 | x | 10.04 | x | 12.36 | x | 11.63 | x | ||||||||||||||
| Price-core earnings multiple |
= | P/CE | 43.96 | x | 13.21 | x | 10.05 | x | 13.12 | x | 11.78 | x | ||||||||||||||
| Price-book ratio |
= | P/B | 76.07 | % | 90.73 | % | 90.88 | % | 110.06 | % | 102.30 | % | ||||||||||||||
| Price-tangible book ratio |
= | P/TB | 76.07 | % | 93.00 | % | 98.14 | % | 123.03 | % | 109.31 | % | ||||||||||||||
| Price-assets ratio |
= | P/A | 14.06 | % | 12.30 | % | 10.11 | % | 13.42 | % | 12.52 | % | ||||||||||||||
| Valuation Parameters (2) |
As a % of Offering + Foundation |
|||||||||||||||
| Pre-Conversion Earnings (Y) |
$ | 1,391,348 | (12 Mths 6/21) | ESOP Stock Purchases (E) | 9.116 | % | 8.71 | % | ||||||||
| Pre-Conversion Core Earnings |
$ | 1,391,348 | (12 Mths 6/21) | Cost of ESOP Borrowings (S) | 0.00 | % | ||||||||||
| Pre-Conversion Book Value (B) |
$ | 48,545,000 | ESOP Amortization (T) | 25.00 | years | |||||||||||
| Pre-Conv. Tang. Book Value (B) |
$ | 48,545,000 | Stock Programs Amount (M) | 4.558 | % | 4.36 | % | |||||||||
| Pre-Conversion Assets (A) |
$ | 338,559,000 | Stock Programs Vesting (N) | 5.00 | years | |||||||||||
| Reinvestment Rate: |
0.87 | % | Fixed Expenses | $ | 1,200,000 | |||||||||||
| Tax rate (TAX) |
25.08 | % | Variable Expenses | 1.35 | % | |||||||||||
| A-T Reinvestment Rate(R) |
0.65 | % | Percent Sold (PCT) | 45.0000 | % | |||||||||||
| Est. Conversion Expenses (1)(X) |
6.40 | % | MHC Assets | $ | 100,000 | |||||||||||
| Insider Purchases |
$ | 1,700,000 | Options as % of Offering (O1) | 11.40 | % | 10.89 | % | |||||||||
| Price/Share |
$ | 10.00 | Estimated Option Value (O2) | 34.50 | % | |||||||||||
| Foundation Cash Contrib. (FC) |
$ | 250,000 | Option Vesting Period (O3) | 5.00 | years | |||||||||||
| Foundation Stock Contrib. (FS) |
2.00 | % | % of Options taxable (O4) | 25.00 | % | |||||||||||
| Foundation Tax Benefit (Z) |
$ | 313,500 | ||||||||||||||
| Calculation of Pro Forma Value After Conversion |
||||||||||
| 1.V= |
P/E * (Y) |
V= | $ | 50,000,000 | ||||||
| 1 - P/E * PCT * ((1-X-E-M-C-D)*R - (1-TAX)*E/T - (1-TAX)*M/N) | ||||||||||
| 1.V= |
P/E * (Y) |
V= | $ | 50,000,000 | ||||||
| 1 - P/Core E * PCT * ((1-X-E-M-FC-FS)*R - (1-TAX)*E/T - (1-TAX)*M/N) - (1-(TAX*O4))*(O1*O2)/O3) | ||||||||||
| 2.V= |
P/B * B | V= | $ | 50,000,000 | ||||||
| 1 - P/B * PCT * (1-X-E-M-FC-FS) | ||||||||||
| 2.V= |
P/TB * TB | V= | $ | 50,000,000 | ||||||
| 1 - P/B * PCT * (1-X-E-M-FC-FS) | ||||||||||
| 3.V= |
P/A * (A+Z) | V= | $ | 50,000,000 | ||||||
| 1 - P/A * PCT * (1-X-E-M-FC-FS) |
||||||||||
| Mark. Val of Stock Sold in |
||||||||||||||||||||||||||||
| Valuation Conclusion |
Shares Issued to MHC |
Shares Sold to Public |
Foundation Shares |
Total Shares Issued |
Price Per Share |
Offering+Issued to Foundation |
Full Value of Total Shares |
|||||||||||||||||||||
| Supermaximum |
3,636,875 | 2,843,375 | 132,250 | 6,612,500 | $ | 10.00 | $ | 29,756,250 | $ | 66,125,000 | ||||||||||||||||||
| Maximum |
3,162,500 | 2,472,500 | 115,000 | 5,750,000 | 10.00 | 25,875,000 | $ | 57,500,000 | ||||||||||||||||||||
| Midpoint |
2,750,000 | 2,150,000 | 100,000 | 5,000,000 | 10.00 | 22,500,000 | $ | 50,000,000 | ||||||||||||||||||||
| Minimum |
2,337,500 | 1,827,500 | 85,000 | 4,250,000 | 10.00 | 19,125,000 | $ | 42,500,000 | ||||||||||||||||||||
| Valuation Conclusion |
Shares Issued to MHC |
Shares Sold to Public |
Foundation Shares |
Total Shares Issued |
||||||||||||||||||||||||
| Supermaximum |
55.000 | % | 43.000 | % | 2.000 | % | 100.000 | % | ||||||||||||||||||||
| Maximum |
55.000 | % | 43.000 | % | 2.000 | % | 100.000 | % | ||||||||||||||||||||
| Midpoint |
55.000 | % | 43.000 | % | 2.000 | % | 100.000 | % | ||||||||||||||||||||
| Minimum |
55.000 | % | 43.000 | % | 2.000 | % | 100.000 | % | ||||||||||||||||||||
| (1) | Estimated offering expenses at midpoint of the offering. |
| (2) | Reflects reduction in earnings, equity and assets due to $100,000 contributed to the MHC. |
EXHIBIT IV-10
Colonial Federal Savings Bank
Pro Forma Effect of Conversion Proceeds – MHC Basis
Exhibit IV-10
PRO FORMA EFFECT OF CONVERSION PROCEEDS
CFSB Bancorp, Inc.
At the Minimum of the Range
| 1. |
Market Value of Shares Sold In Offering: |
$ | 18,275,000 | |||
| Market Value of Shares Issued to Foundation: |
850,000 | |||||
| Market Value of Shares Issued to MHC: |
23,375,000 | |||||
|
|
|
|||||
| Total Market Value of Company: |
$ | 42,500,000 | ||||
| 2. |
Offering Proceeds of Shares Sold In Offering |
$ | 18,275,000 | |||
| Less: Estimated Offering Expenses |
1,401,272 | |||||
|
|
|
|||||
| Net Conversion Proceeds |
$ | 16,873,729 | ||||
| 3. |
Estimated Additional Equity and Income from Offering Proceeds |
|||||
| Net Conversion Proceeds |
$ | 16,873,729 | ||||
| Less: Cash Contribution to Foundation |
(250,000 | ) | ||||
| Less: Non-Cash ESOP Purchases (1) |
(1,666,000 | ) | ||||
| Less: Non-Cash Stock Plan Purchases (1) |
(833,000 | ) | ||||
|
|
|
|||||
| Net Proceeds Reinvested |
$ | 14,124,729 | ||||
| Estimated net incremental rate of return |
0.65 | % | ||||
|
|
|
|||||
| Earnings Increase |
$ | 92,066 | ||||
| Less: Estimated cost of ESOP borrowings |
0 | |||||
| Less: Amortization of ESOP borrowings(2) |
(49,927 | ) | ||||
| Less: Stock Programs Vesting (3) |
(124,817 | ) | ||||
| Less: Option Plan Vesting (4) |
(134,683 | ) | ||||
|
|
|
|||||
| Net Earnings Increase |
($ | 217,361 | ) | |||
| 4. | Pro Forma Earnings | Before Conversion |
Net Earnings Increase |
After Conversion |
||||||||||||||
| 12 Months ended June 30, 2021 (reported) | $ | 1,391,348 | ($ | 217,361 | ) | $ | 1,173,987 | |||||||||||
| 12 Months ended June 30, 2021 (core) | $ | 1,391,348 | ($ | 217,361 | ) | $ | 1,173,987 | |||||||||||
| 5. | Pro Forma Net Worth | Before Conversion |
Net Cash Proceeds |
Tax Benefit of Foundation |
After Conversion |
|||||||||||||
| June 30, 2021 | $ | 48,545,000 | $ | 14,124,729 | $ | 275,880 | $ | 62,945,609 | ||||||||||
| June 30, 2021 (Tangible) | $ | 48,545,000 | $ | 14,124,729 | $ | 275,880 | $ | 62,945,609 | ||||||||||
| 6. | Pro Forma Assets | Before Conversion |
Net Cash Proceeds |
Tax Benefit of Foundation |
After Conversion |
|||||||||||||
| June 30, 2021 | $ | 338,559,000 | $ | 14,124,729 | $ | 275,880 | $ | 352,959,609 | ||||||||||
| (1) | Includes ESOP purchases equal to 3.92% of all shares issued, and stock program purchases equal to 1.96% of all shares issued. |
| (2) | ESOP stock amortized over 25 years, and amortization expense is tax effected at 25.08%. |
| (3) | Stock programs amortized over 5 years, and amortization expense is tax effected at 25.08%. |
| (4) | Option valuation based on Black-Scholes model, 10 year vesting, and assuming 25% taxable. |
Exhibit IV-10
PRO FORMA EFFECT OF CONVERSION PROCEEDS
CFSB Bancorp, Inc.
At the Valuation Conclusion
| 1. |
Market Value of Shares Sold In Offering: | $ | 21,500,000 | |||
| Market Value of Shares Issued to Foundation: | 1,000,000 | |||||
| Market Value of Shares Issued to MHC: | 27,500,000 | |||||
|
|
|
|||||
| Total Market Value of Company: |
$ | 50,000,000 | ||||
| 2. |
Offering Proceeds of Shares Sold In Offering |
$ | 21,500,000 | |||
| Less: Estimated Offering Expenses |
1,440,840 | |||||
|
|
|
|||||
| Net Conversion Proceeds |
$ | 20,059,160 | ||||
| 3. |
Estimated Additional Equity and Income from Offering Proceeds |
|||||
| Net Conversion Proceeds |
$ | 20,059,160 | ||||
| Less: Cash Contribution to Foundation |
(250,000) | |||||
| Less: Non-Cash ESOP Purchases (1) |
(1,960,000) | |||||
| Less: Non-Cash Stock Plan Purchases (1) |
(980,000) | |||||
|
|
|
|||||
| Net Proceeds Reinvested |
$ | 16,869,160 | ||||
| Estimated net incremental rate of return |
0.65 | % | ||||
|
|
|
|||||
| Earnings Increase |
$ | 109,954 | ||||
| Less: Estimated cost of ESOP borrowings |
0 | |||||
| Less: Amortization of ESOP borrowings(2) |
(58,737) | |||||
| Less: Stock Programs Vesting (3) |
(146,843) | |||||
| Less: Option Plan Vesting (4) |
(158,451) | |||||
|
|
|
|||||
| Net Earnings Increase |
($ | 254,077 | ) | |||
| 4. | Pro Forma Earnings | Before Conversion |
Net Earnings Increase |
After Conversion |
||||||||||||||
| 12 Months ended June 30, 2021 (reported) |
$ | 1,391,348 | ($ | 254,077 | ) | $ | 1,137,271 | |||||||||||
| 12 Months ended June 30, 2021 (core) |
$ | 1,391,348 | ($ | 254,077 | ) | $ | 1,137,271 | |||||||||||
| 5. | Pro Forma Net Worth | Before Conversion |
Net Cash Proceeds |
Tax Benefit of Foundation |
After Conversion |
|||||||||||||
| June 30, 2021 | $ | 48,545,000 | $ | 16,869,160 | $ | 313,500 | $ | 65,727,660 | ||||||||||
| June 30, 2021 (Tangible) | $ | 48,545,000 | $ | 16,869,160 | $ | 313,500 | $ | 65,727,660 | ||||||||||
| 6. | Pro Forma Assets | Before Conversion |
Net Cash Proceeds |
Tax Benefit of Foundation |
After Conversion |
|||||||||||||
| June 30, 2021 | $ | 338,559,000 | $ | 16,869,160 | $ | 313,500 | $ | 355,741,660 | ||||||||||
| (1) | Includes ESOP purchases equal to 3.92% of all shares issued, and stock program purchases equal to 1.96% of all shares issued. |
| (2) | ESOP stock amortized over 25 years, and amortization expense is tax effected at 25.08%. |
| (3) | Stock programs amortized over 5 years, and amortization expense is tax effected at 25.08%. |
| (4) | Option valuation based on Black-Scholes model, 10 year vesting, and assuming 25% taxable. |
Exhibit IV-10
PRO FORMA EFFECT OF CONVERSION PROCEEDS
CFSB Bancorp, Inc.
At the Maximum of the Range
| 1. | Market Value of Shares Sold In Offering: | $ | 24,725,000 | |||
| Market Value of Shares Issued to Foundation: |
1,150,000 | |||||
| Market Value of Shares Issued to MHC: |
31,625,000 | |||||
|
|
|
|||||
| Total Market Value of Company: |
$ | 57,500,000 | ||||
| 2. | Offering Proceeds of Shares Sold In Offering | $ | 24,725,000 | |||
| Less: Estimated Offering Expenses |
1,480,409 | |||||
|
|
|
|||||
| Net Conversion Proceeds |
$ | 23,244,592 | ||||
| 3. | Estimated Additional Equity and Income from Offering Proceeds | |||||
| Net Conversion Proceeds |
$ | 23,244,592 | ||||
| Less: Cash Contribution to Foundation |
(250,000 | ) | ||||
| Less: Non-Cash ESOP Purchases (1) |
(2,254,000 | ) | ||||
| Less: Non-Cash Stock Plan Purchases (1) |
(1,127,000 | ) | ||||
|
|
|
|||||
| Net Proceeds Reinvested |
$ | 19,613,592 | ||||
| Estimated net incremental rate of return |
0.65 | % | ||||
|
|
|
|||||
| Earnings Increase |
$ | 127,842 | ||||
| Less: Estimated cost of ESOP borrowings |
0 | |||||
| Less: Amortization of ESOP borrowings(2) |
(67,548 | ) | ||||
| Less: Stock Programs Vesting (3) |
(168,870 | ) | ||||
| Less: Option Plan Vesting (4) |
(182,218 | ) | ||||
|
|
|
|||||
| Net Earnings Increase |
($ | 290,794 | ) | |||
| 4. | Pro Forma Earnings | Before Conversion |
Net Earnings Increase |
After Conversion |
||||||||||||||
| 12 Months ended June 30, 2021 (reported) |
$ | 1,391,348 | ($ | 290,794 | ) | $ | 1,100,555 | |||||||||||
| 12 Months ended June 30, 2021 (core) |
$ | 1,391,348 | ($ | 290,794 | ) | $ | 1,100,555 | |||||||||||
| 5. | Pro Forma Net Worth | Before Conversion |
Net Cash Proceeds |
Tax Benefit of Foundation |
After Conversion |
|||||||||||||
| June 30, 2021 |
$ | 48,545,000 | $ | 19,613,592 | $ | 351,120 | $ | 68,509,712 | ||||||||||
| June 30, 2021 (Tangible) |
$ | 48,545,000 | $ | 19,613,592 | $ | 351,120 | $ | 68,509,712 | ||||||||||
| 6. | Pro Forma Assets | Before Conversion |
Net Cash Proceeds |
Tax Benefit of Foundation |
After Conversion |
|||||||||||||
| June 30, 2021 |
$ | 338,559,000 | $ | 19,613,592 | $ | 351,120 | $ | 358,523,712 | ||||||||||
| (1) | Includes ESOP purchases equal to 3.92% of all shares issued, and stock program purchases equal to 1.96% of all shares issued. |
| (2) | ESOP stock amortized over 25 years, and amortization expense is tax effected at 25.08%. |
| (3) | Stock programs amortized over 5 years, and amortization expense is tax effected at 25.08%. |
| (4) | Option valuation based on Black-Scholes model, 10 year vesting, and assuming 25% taxable. |
Exhibit IV-10
PRO FORMA EFFECT OF CONVERSION PROCEEDS
CFSB Bancorp, Inc.
At the Supermaximum Value
| 1. | Market Value of Shares Sold In Offering: | $ | 28,433,750 | |||
| Market Value of Shares Issued to Foundation: |
1,322,500 | |||||
| Market Value of Shares Issued to MHC: |
36,368,750 | |||||
|
|
|
|||||
| Total Market Value of Company: |
$ | 66,125,000 | ||||
| 2. | Offering Proceeds of Shares Sold In Offering | $ | 28,433,755 | |||
| Less: Estimated Offering Expenses |
1,525,928 | |||||
|
|
|
|||||
| Net Conversion Proceeds |
$ | 26,907,827 | ||||
| 3. | Estimated Additional Equity and Income from Offering Proceeds | |||||
| Net Conversion Proceeds |
$ | 26,907,827 | ||||
| Less: Cash Contribution to Foundation |
(250,000 | ) | ||||
| Less: Non-Cash ESOP Purchases (1) |
(2,592,100 | ) | ||||
| Less: Non-Cash Stock Plan Purchases (1) |
(1,296,050 | ) | ||||
|
|
|
|||||
| Net Proceeds Reinvested |
$ | 22,769,676 | ||||
| Estimated net incremental rate of return |
0.65 | % | ||||
|
|
|
|||||
| Earnings Increase |
$ | 148,414 | ||||
| Less: Estimated cost of ESOP borrowings |
0 | |||||
| Less: Amortization of ESOP borrowings(2) |
(77,680 | ) | ||||
| Less: Stock Programs Vesting (3) |
(194,200 | ) | ||||
| Less: Option Plan Vesting (4) |
(209,551 | ) | ||||
|
|
|
|||||
| Net Earnings Increase |
($ | 333,017 | ) | |||
| 4. | Pro Forma Earnings | Before Conversion |
Net Earnings Increase |
After Conversion |
||||||||||||||
| 12 Months ended June 30, 2021 (reported) |
$ | 1,391,348 | ($ | 333,017 | ) | $ | 1,058,331 | |||||||||||
| 12 Months ended June 30, 2021 (core) |
$ | 1,391,348 | ($ | 333,017 | ) | $ | 1,058,331 | |||||||||||
| 5. | Pro Forma Net Worth | Before Conversion |
Net Cash Proceeds |
Tax Benefit of Foundation |
After Conversion |
|||||||||||||
| June 30, 2021 |
$ | 48,545,000 | $ | 22,769,676 | $ | 394,383 | $ | 71,709,059 | ||||||||||
| June 30, 2021 (Tangible) |
$ | 48,545,000 | $ | 22,769,676 | $ | 394,383 | $ | 71,709,059 | ||||||||||
| 6. | Pro Forma Assets | Before Conversion |
Net Cash Proceeds |
Tax Benefit of Foundation |
After Conversion |
|||||||||||||
| June 30, 2021 |
$ | 338,559,000 | $ | 22,769,676 | $ | 394,383 | $ | 361,723,059 | ||||||||||
| (1) | Includes ESOP purchases equal to 3.92% of all shares issued, and stock program purchases equal to 1.96% of all shares issued. |
| (2) | ESOP stock amortized over 25 years, and amortization expense is tax effected at 25.08%. |
| (3) | Stock programs amortized over 5 years, and amortization expense is tax effected at 25.08%. |
| (4) | Option valuation based on Black-Scholes model, 10 year vesting, and assuming 25% taxable. |
EXHIBIT V-1
RP® Financial, LC.
Firm Qualifications Statement
FIRM QUALIFICATION STATEMENT
RP® Financial (“RP®) provides financial and management consulting, merger advisory and valuation services to the financial services industry nationwide. We offer a broad array of services, high quality and prompt service, hands-on involvement by principals and senior staff, careful structuring of strategic initiatives and sophisticated valuation and other analyses consistent with industry practices and regulatory requirements. Our staff maintains extensive background in financial and management consulting, valuation and investment banking. Our clients include commercial banks, thrifts, credit unions, mortgage companies, insurance companies and other financial services companies.
STRATEGIC PLANNING SERVICES
RP®’s strategic planning services are designed to provide effective feasible plans with quantifiable results. We analyze strategic options to enhance shareholder value, achieve regulatory approval or realize other objectives. Such services involve conducting situation analyses; establishing mission/vision statements, developing strategic goals and objectives; and identifying strategies to enhance franchise and/or market value, capital management, earnings enhancement, operational matters and organizational issues. Strategic recommendations typically focus on: capital formation and management, asset/liability targets, profitability, return on equity and stock pricing. Our proprietary financial simulation models provide the basis for evaluating the impact of various strategies and assessing their feasibility and compatibility with regulations.
MERGER ADVISORY SERVICES
RP®’s merger advisory services include targeting potential buyers and sellers, assessing acquisition merit, conducting due diligence, negotiating and structuring merger transactions, preparing merger business plans and financial simulations, rendering fairness opinions, preparing mark-to-market analyses, valuing intangible assets and supporting the implementation of post-acquisition strategies. Our merger advisory services involve transactions of financially healthy companies and failed bank deals. RP® is also expert in de novo charters and shelf charters. Through financial simulations, comprehensive data bases, valuation proficiency and regulatory familiarity, RP®’s merger advisory services center on enhancing shareholder returns.
VALUATION SERVICES
RP®’s extensive valuation practice includes bank and thrift mergers, thrift mutual-to-stock conversions, goodwill impairment, insurance company demutualizations, ESOPs, subsidiary companies, merger accounting and other purposes. We are highly experienced in performing appraisals which conform to regulatory guidelines and appraisal standards. RP® is the nation’s leading valuation firm for thrift mutual-to-stock conversions, with appraised values ranging up to $4 billion.
OTHER CONSULTING SERVICES
RP® offers other consulting services including evaluating the impact of regulatory changes (TARP, etc.), branching and diversification strategies, feasibility studies and special research. We assist banks/thrifts in preparing CRA plans and evaluating wealth management activities on a de novo or merger basis. Our other consulting services are facilitated by proprietary valuation and financial simulation models.
KEY PERSONNEL (Years of Relevant Experience & Contact Information)
| Ronald S. Riggins, Managing Director (39) |
(703) 647-6543 |
rriggins@rpfinancial.com | ||
| William E. Pommerening, Managing Director (36) |
(703) 647-6546 |
wpommerening@rpfinancial.com | ||
| James P. Hennessey, Director (34) |
(703) 647-6544 |
jhennessey@rpfinancial.com | ||
| James J. Oren, Director (32) |
(703) 647-6549 |
joren@rpfinancial.com | ||
| Gregory E. Dunn, Director (36) |
(703) 647-6548 |
gdunn@rpfinancial.com |
| 1311-A Dolley Madison Blvd., Suite 2A | Telephone: (703) 528-1700 | |
| McLean, VA 22101 | Fax No.: (703) 528-1788 | |
| www.rpfinancial.com | E-Mail: mail@rpfinancial.com |