Attached files
| file | filename |
|---|---|
| 8-K - 8-K - ASSOCIATED BANC-CORP | asb-20210909.htm |

September 9, 2021 Associated Banc-Corp Strategic Update Exhibit 99.1

1 Forward-Looking Statements Important note regarding forward-looking statements: Statements made in this presentation which are not purely historical are forward-looking statements, as defined in the Private Securities Litigation Reform Act of 1995. This includes any statements regarding management’s plans, objectives, or goals for future operations, products or services, and forecasts of its revenues, earnings, or other measures of performance. Such forward-looking statements may be identified by the use of words such as “believe,” “expect,” “anticipate,” “plan,” “estimate,” “should,” “will,” “intend,” "target,“ “outlook,” “project,” “guidance,” or similar expressions. Forward-looking statements are based on current management expectations and, by their nature, are subject to risks and uncertainties. Actual results may differ materially from those contained in the forward-looking statements. Factors which may cause actual results to differ materially from those contained in such forward-looking statements include those identified in the Company’s most recent Form 10-K and subsequent Form 10-Qs and other SEC filings, and such factors are incorporated herein by reference. Trademarks: All trademarks, service marks, and trade names referenced in this material are official trademarks and the property of their respective owners. Presentation: Within the charts and tables presented, certain segments, columns and rows may not sum to totals shown due to rounding. Non-GAAP Measures: This presentation includes certain non-GAAP financial measures. These non-GAAP measures are provided in addition to, and not as substitutes for, measures of our financial performance determined in accordance with GAAP. Our calculation of these non-GAAP measures may not be comparable to similarly titled measures of other companies due to potential differences between companies in the method of calculation. As a result, the use of these non-GAAP measures has limitations and should not be considered superior to, in isolation from, or as a substitute for, related GAAP measures. Reconciliations of these non-GAAP financial measures to the most directly comparable GAAP financial measures can be found at the end of this presentation.

2 New Leadership, New Priorities We’ve used the last 120 days to formulate a new growth focused and digital forward vision for Associated Digital ForwardGrowth Focused ▪ Serving our customers where and when they need us via online, mobile, and other channels ▪ Proactively listening to our customers to deliver differentiated and responsive solutions in real time that add value and deepen engagement ▪ Capitalizing on the opportunities we see in our markets with investments geared to drive the bottom line ▪ Expanding and diversifying revenue with new commercial and consumer lending verticals Transforming our systems to accelerate growth Driving positive core operating leverage and improving ROATCE

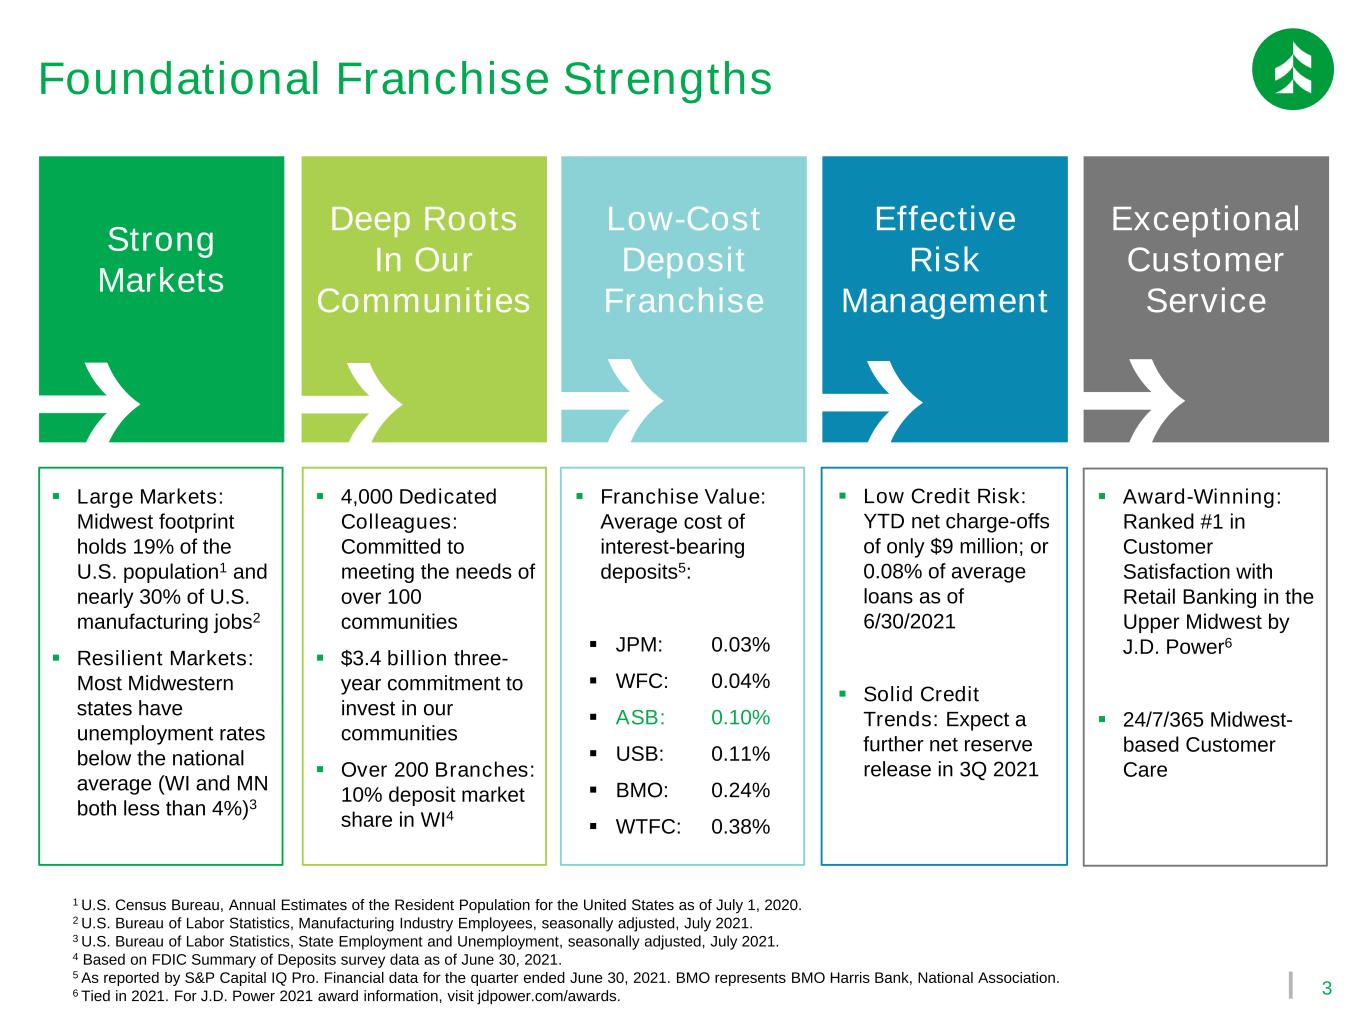
3 Foundational Franchise Strengths Strong Markets Deep Roots In Our Communities Low-Cost Deposit Franchise Effective Risk Management Exceptional Customer Service ▪ Large Markets: Midwest footprint holds 19% of the U.S. population1 and nearly 30% of U.S. manufacturing jobs2 ▪ Resilient Markets: Most Midwestern states have unemployment rates below the national average (WI and MN both less than 4%)3 ▪ 4,000 Dedicated Colleagues: Committed to meeting the needs of over 100 communities ▪ $3.4 billion three- year commitment to invest in our communities ▪ Over 200 Branches: 10% deposit market share in WI4 ▪ Franchise Value: Average cost of interest-bearing deposits5: ▪ JPM: 0.03% ▪ WFC: 0.04% ▪ ASB: 0.10% ▪ USB: 0.11% ▪ BMO: 0.24% ▪ WTFC: 0.38% ▪ Low Credit Risk: YTD net charge-offs of only $9 million; or 0.08% of average loans as of 6/30/2021 ▪ Solid Credit Trends: Expect a further net reserve release in 3Q 2021 ▪ Award-Winning: Ranked #1 in Customer Satisfaction with Retail Banking in the Upper Midwest by J.D. Power6 ▪ 24/7/365 Midwest- based Customer Care 1 U.S. Census Bureau, Annual Estimates of the Resident Population for the United States as of July 1, 2020. 2 U.S. Bureau of Labor Statistics, Manufacturing Industry Employees, seasonally adjusted, July 2021. 3 U.S. Bureau of Labor Statistics, State Employment and Unemployment, seasonally adjusted, July 2021. 4 Based on FDIC Summary of Deposits survey data as of June 30, 2021. 5 As reported by S&P Capital IQ Pro. Financial data for the quarter ended June 30, 2021. BMO represents BMO Harris Bank, National Association. 6 Tied in 2021. For J.D. Power 2021 award information, visit jdpower.com/awards.

4 How We Build on our Strong Foundation Our strategic vision is expected to drive Positive Operating Leverage and improved ROATCE Expanding our Lending Capabilities Growing our Core Businesses Investing in our Digital Transformation ▪ Diversifying our consumer portfolio by growing Auto Finance ▪ Broadening current Asset-Based Lending capabilities ▪ Launching Equipment Finance vertical in our commercial business ▪ Accelerating core Commercial Middle Market lending growth ▪ Enhancing Small Business, Consumer Direct and HELOC lending ▪ Retooling our Mass Affluent strategy Optimizing Capital Proactively ▪ Redirecting $50M of spend over the next five years to digital ▪ Deploying new mobile and online systems in the next six months ▪ Transforming our legacy IT infrastructure to deliver greater differentiation ▪ Optimizing Tangible Common Equity to accelerate ROATCE expansion ▪ Paying a dividend commensurate with performance ▪ Reducing our preferred capital layers

5 What We’ve Done so Far We have advanced our vision with concrete actions to date Expanding our Lending Capabilities Growing our Core Businesses Investing in our Digital Transformation ▪ Hired 40+ colleagues to drive our new Auto Finance initiative ▪ Bolstered existing Asset-Based Lending capability with a new leader ▪ Initiated a new Equipment Finance vertical launching in 1Q 2022 ▪ Hired several experienced Commercial Middle Market team leaders and relationship managers in Milwaukee and Chicago ▪ Deployed new Consumer loan system and added Business bankers ▪ Refocused our Wealth Management strategy under a new leader Optimizing Capital Proactively ▪ Repurchased ~3 million shares ($60mm) of common stock during 3Q ▪ Increased the recent common dividend by 11% ▪ Redeeming $165mm of Preferred Stock in 2021 ▪ Elevated our Digital Delivery strategy under new leadership ▪ Deployed cloud-enabled online systems with top-rated response times ▪ New consumer digital architecture expected to be deployed in 1Q 2022

6 Expanding Asset- Based Lending Launching Equipment Finance Expanding our Lending Capabilities 2021 Progress 2022-23 Outlook ▪ Servicing systems in place ▪ Exploring meaningful opportunities in our Midwest manufacturing client base ▪ Expect hiring to begin in 4Q ▪ Origination and servicing systems in place ▪ Expect to have several specialists in place by year-end ▪ Expect over $150 million in loan balances by the end of 2022 ▪ Targeted portfolio net yields of ~3% ▪ Projecting to grow equipment loans to $300+ million in 2023 ▪ Expect over $150 million in loan balances by the end of 2022 ▪ Targeted portfolio net yields of ~3% ▪ Projecting to grow ABL loans to $300+ million in 2023 Rolling out Auto Finance ▪ Over 550 dealers signed up as of September 1st ▪ Origination and servicing systems in place ▪ Expect to book loans in early 4Q 2021 ▪ Expect over $1 billion in loan balances by the end of 2022 ▪ Targeted portfolio net yields of ~3% ▪ Projecting to grow auto loans to $2+ billion in 2023

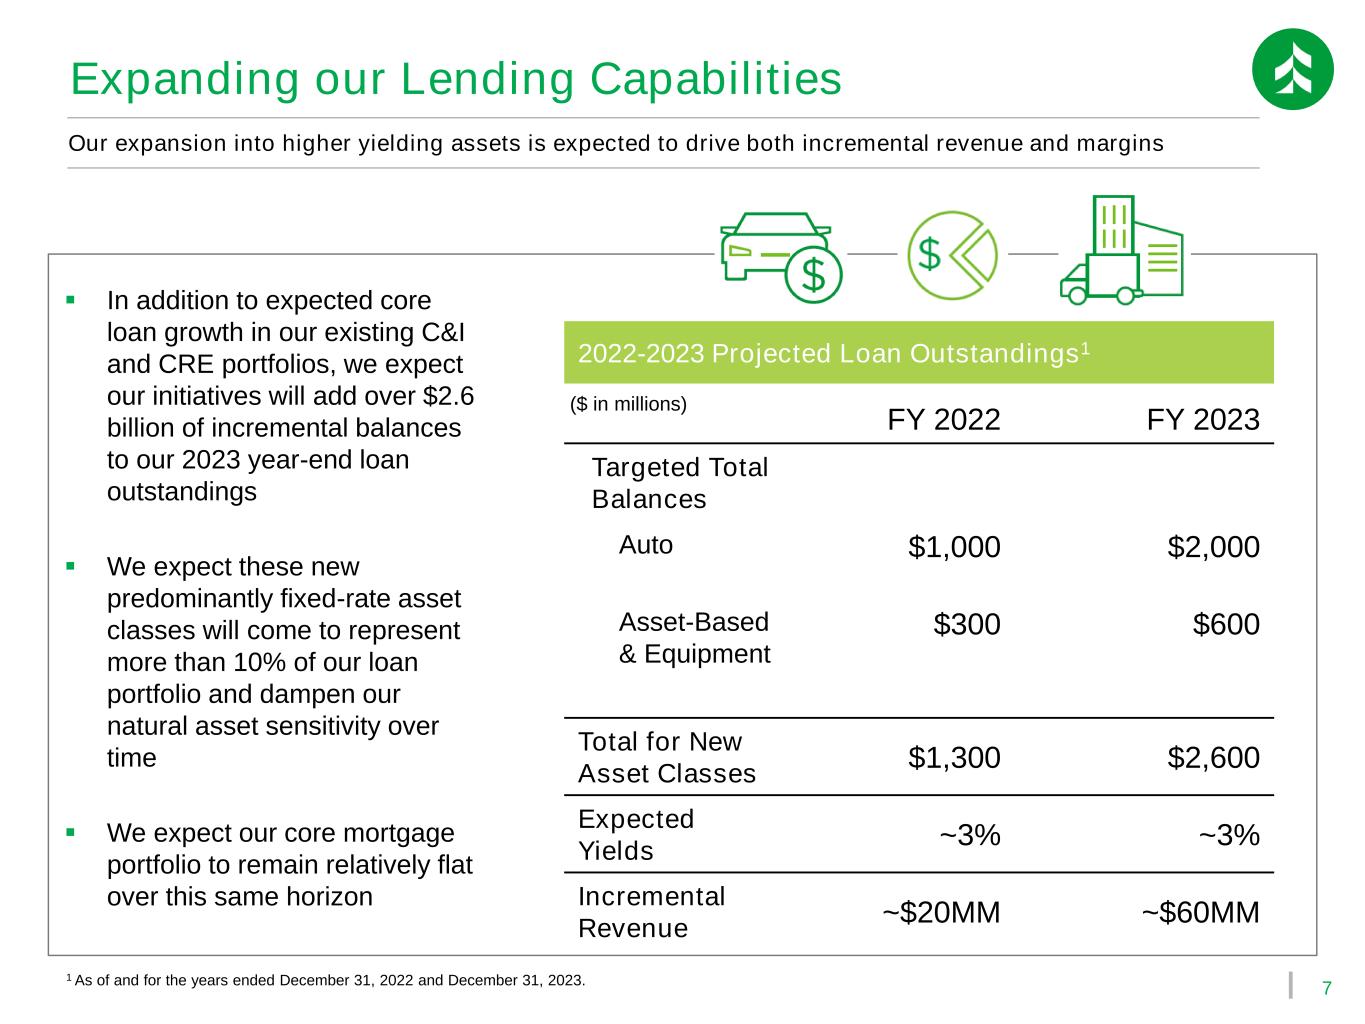
7 Expanding our Lending Capabilities FY 2022 FY 2023 Targeted Total Balances Auto $1,000 $2,000 Asset-Based & Equipment $300 $600 Total for New Asset Classes $1,300 $2,600 Expected Yields ~3% ~3% Incremental Revenue ~$20MM ~$60MM 2022-2023 Projected Loan Outstandings1 ▪ In addition to expected core loan growth in our existing C&I and CRE portfolios, we expect our initiatives will add over $2.6 billion of incremental balances to our 2023 year-end loan outstandings ▪ We expect these new predominantly fixed-rate asset classes will come to represent more than 10% of our loan portfolio and dampen our natural asset sensitivity over time ▪ We expect our core mortgage portfolio to remain relatively flat over this same horizon ($ in millions) Our expansion into higher yielding assets is expected to drive both incremental revenue and margins 1 As of and for the years ended December 31, 2022 and December 31, 2023.

8 Enhancing Small Business and Consumer Direct Lending Retooling Mass Affluent Strategy Accelerating Core Middle Market Growth Growing our Core Businesses 2021 Progress 2022-23 Outlook ▪ Expanding our sales teams ▪ Enhancing small business and consumer unsecured lending to streamline approvals ▪ Retooling our HELOC product to streamline originations and enable end-to-end digital processing ▪ Adding a new affluent consumer division focused on bridging the market between our core retail and Private Banking customers; to attract and deepen high-value households ▪ Targeted net portfolio yields of 4%+ ▪ Projecting incremental growth in the small business and unsecured lending portfolios of $50-100 million per year ▪ Expect to stabilize HELOC balances and grow the portfolio ▪ Developing compelling and differentiated product and pricing offerings ▪ Expect to add approximately $50+ million in incremental loans and deposits per year ▪ Several pending offers outstanding to round out our growing teams in Milwaukee and Chicago with additional hires expected before year-end ▪ Expect to add 10+ commercial relationship managers across the footprint by year-end 2022, with a focus on Milwaukee and Chicago ▪ Projecting incremental loan growth of $100+ million per year

9 Digital Transformation: Already Underway Aligned Internal Capabilities Leveraged our Strong Digital Foundation1 Accelerated our Digital Experience We have begun shifting our investment priorities to ensure Associated has a digital forward focus 1 All metrics for the quarter ended June 30, 2021. 2 Percentage of retail customers. Associated Bank usage as compared to regional bank peers in internal benchmark analysis. ▪ 64% retail digital adoption ▪ 80% digital activation among new-to-bank retail customers ▪ Peer-leading mobile check deposit usage of 33%2 ▪ Centralized leadership under a single executive ▪ Integrated our product, marketing, digital UI/UX and infrastructure teams which will enable ASB- driven innovation ▪ Moved external website to the Cloud in 2021, achieving top rated response times ▪ Moving off our rigid mobile and online banking platforms

10 Near-Term Digital Rollout Expected Timeline Digital Banking Transformation ▪ Complete transformation of our mobile and web experience for 400K+ retail customers ▪ Fully integrated customer insights and personalization Digital Sales Transformation ▪ Streamline and connect new consumer and small business sales and account opening solutions ▪ Integrate onboarding, analytics and digital deepening tools into customer experience 1Q 2022 2Q 2022 Customer-focused journey maps to improve application, onboarding and funding experiences Bank-driven digital experience; taking ownership of our digital destiny

11 Transforming Legacy IT Infrastructure Branch Consolidation Back-Office Facilities Consolidation Transforming Spend: A Shift to Digital The expected ~$10 million of annual run-rate savings from the initiatives highlighted below should fund the incremental costs of our proposed ~$50 million of digital investments over the next five years ▪ Consolidating eight branches in 2021 ▪ Two additional consolidations expected to be completed in 2022 ▪ Transitioning nearly 10% of workforce to be primarily remote and consolidating Green Bay Service Center and HQ locations ▪ Exiting additional office space to align with an increasingly remote workforce ▪ Expected severance and facilities exit costs of ~$4 million (3Q and 4Q 2021) ▪ Expect net savings of ~$5 million per year ▪ Expect facilities and relocation costs of ~$4 million (3Q and 4Q 2021) ▪ Expect net savings of ~$4 million per year 2021 Progress Expense Impacts ▪ Co-locating our primary data center ▪ Moving several applications from on- premises to cloud-based environments ▪ Expect bulk of IT infrastructure transformation to culminate in late 2022 ▪ Expect net savings of ~$1-2 million per year

12 Disciplined Expense Management Noninterest Expense Outlook as of July 2021 $695 - $700 million New Initiatives Costs ~$5 million One-Time Expense: Brick & Mortar Alignment ~$5 million Revised 2021 Expense Outlook1 $705 - $711 million 2021 Noninterest Expense Impact ▪ Before the impact of our new initiatives, we expected total 2021 noninterest expense would be approximately $695 million to $700 million ▪ Our new initiatives are expected to add $9 million to $11 million to our 2021 noninterest expense, with total expenses now expected to come in between $705 million and $711 million ▪ Our new growth and efficiency strategies are intended to drive positive operating leverage and expand pre-tax pre-provision income over the next several quarters Long-term expense target is ~3.5% growth per year 1 Totals may not sum due to rounding.

13 2021 2022 2023 2021 2022 2023 Generating Positive & Increasing Operating Leverage Our revenue strategies are expected to leverage our people and technology while driving efficiency ~8% ~3.5% CAGR CAGR Estimated Net Interest Income + Noninterest Income1 Estimated Noninterest Expense2 Net Interest Income + Noninterest Income Incremental Initiative Revenue Incremental Initiative Expense Noninterest Expense 1 Estimated Net Interest Income plus Noninterest Income in 2021 of approximately $1.045 billion to $1.060 billion. Estimated compound annual growth rate of Net Interest Income plus Noninterest Income from the end of 2021 through 2023. 2 Estimated Noninterest Expense in 2021 of approximately $700 million to $706 million excluding brick and mortar alignment costs. Estimated compound annual growth rate of Noninterest Expense from the end of 2021 through 2023.

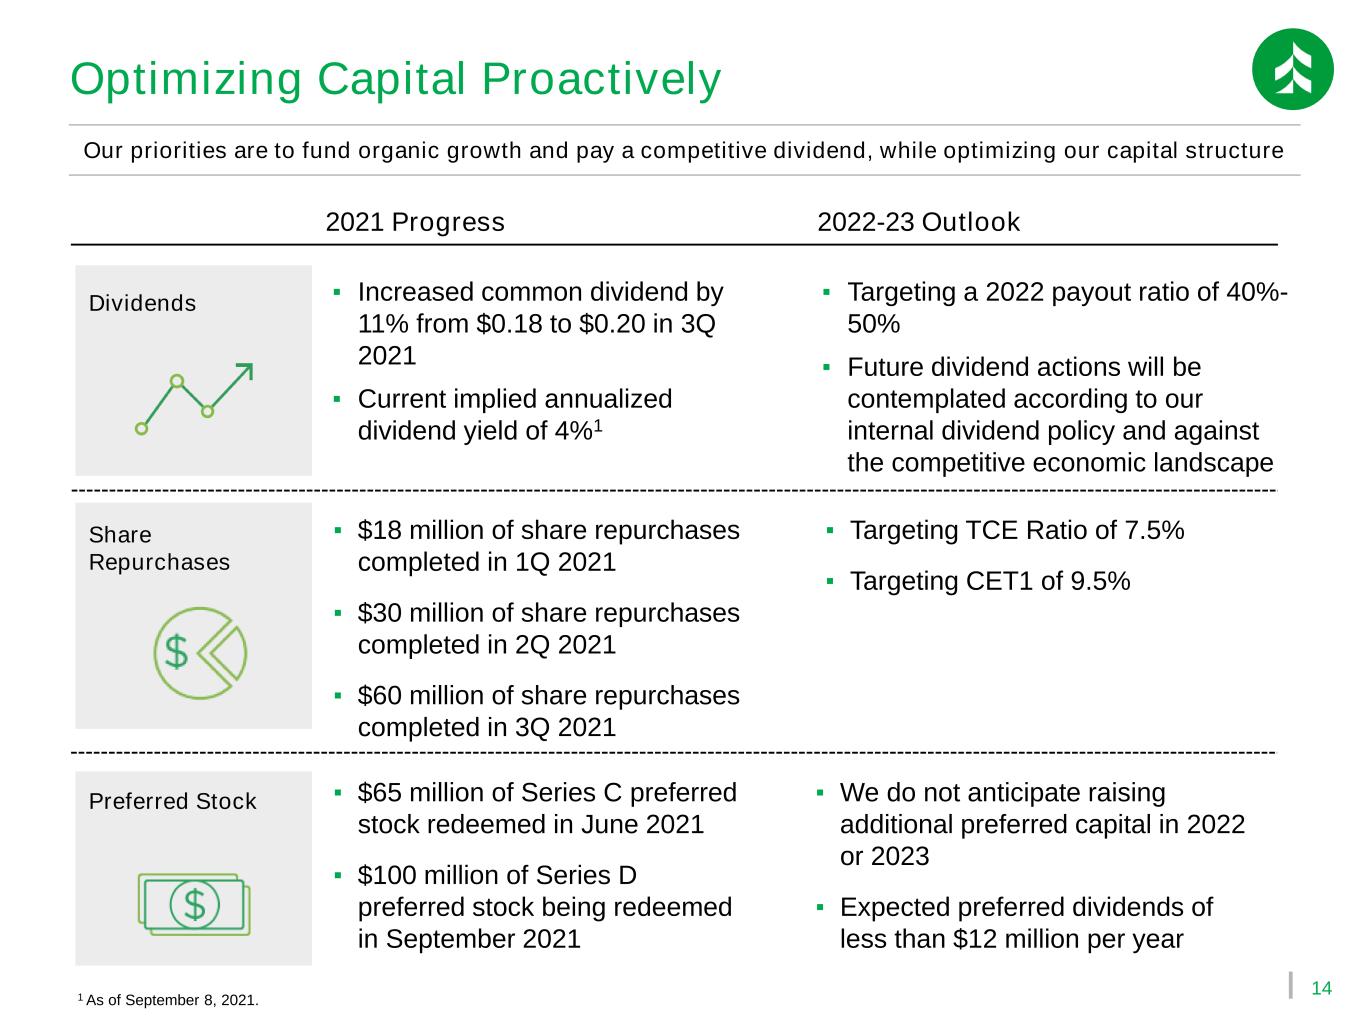
14 Dividends Share Repurchases Preferred Stock Optimizing Capital Proactively ▪ $65 million of Series C preferred stock redeemed in June 2021 ▪ $100 million of Series D preferred stock being redeemed in September 2021 ▪ Increased common dividend by 11% from $0.18 to $0.20 in 3Q 2021 ▪ Current implied annualized dividend yield of 4%1 ▪ We do not anticipate raising additional preferred capital in 2022 or 2023 ▪ Expected preferred dividends of less than $12 million per year ▪ Targeting a 2022 payout ratio of 40%- 50% ▪ Future dividend actions will be contemplated according to our internal dividend policy and against the competitive economic landscape 2021 Progress 2022-23 Outlook ▪ $18 million of share repurchases completed in 1Q 2021 ▪ $30 million of share repurchases completed in 2Q 2021 ▪ $60 million of share repurchases completed in 3Q 2021 ▪ Targeting TCE Ratio of 7.5% ▪ Targeting CET1 of 9.5% Our priorities are to fund organic growth and pay a competitive dividend, while optimizing our capital structure 1 As of September 8, 2021.

15 7.50% TCE Ratio1 Positioning for Improved Financial Performance Our growth focused and digital forward vision is expected to drive higher shareholder returns Expanding our Lending Capabilities Growing our Core Businesses Investing in our Digital Transformation 2.75% Net Interest Margin 55%-60% Efficiency Ratio Higher Returns Mid-Teens ROATCE Proactively Optimizing Capital and Credit Expanding Operating Leverage ASB 3+ Year Operating Targets $50 Million 0.20%-0.35% Net Charge Offs to Average Loans 1 Tangible common equity / tangible assets. This is a non-GAAP financial measure.

16 Growth Focused Higher ReturnsDigital Forward Associated: Capitalizing on our Momentum

Appendix: Updated 2021 Full-Year Outlook

18 Balance Sheet Management ▪ Commercial loan growth, excl. PPP, of 2-4% ▪ Full-year margin of 2.45% to 2.55% ▪ Target investments / total assets ratio of 15% Fee Businesses ▪ Noninterest income of $315 million to $325 million Expense Management ▪ Approximately $695 million to $700 million of noninterest expense in 2021 ▪ Effective tax rate of 19% to 21% Capital & Credit Management ▪ Target TCE Ratio at or above 7.5%; Target CET1 at or above 9.5% ▪ Provision expected to adjust with changes to risk grade, economic conditions, other indications of credit quality, and loan volume Updated 2021 Full-Year Outlook ▪ Lower end of the range ▪ Lower end of the range ▪ Increasing range to 17% to 19% ▪ No change to range ▪ Increasing range to $705 million to $711 million; including initiatives, proposed facilities exit costs, and contemplated severance costs ▪ No change to range ▪ No change in targets ▪ Expect a further net reserve release in 3Q Previous Guidance (7/22/2021) Updated Guidance 1. Net Interest Margin above 2.75% 2. Efficiency Ratio of 55-60% 3. Mid-Teens ROATCE
