Attached files
| file | filename |
|---|---|
| 8-K - 8-K - SmartRent, Inc. | d205285d8k.htm |
Exhibit 99.1 TITLE CAN NOT GO ABOVE THIS LINE SUBTITLE BELOW THIS LINE CONTENT BELOW THIS LINE Opening Doors to a Smarter World Investor Presentation September 2021 CONTENT BELOW THIS LINE NOTES START FROM HERE AND GROW UPExhibit 99.1 TITLE CAN NOT GO ABOVE THIS LINE SUBTITLE BELOW THIS LINE CONTENT BELOW THIS LINE Opening Doors to a Smarter World Investor Presentation September 2021 CONTENT BELOW THIS LINE NOTES START FROM HERE AND GROW UP
Forward Looking Statements This presentation contains forward-looking statements within the meaning of the safe harbor from civil liability provided for such statements by Securities Litigation Reform Act of 1995 (set forth in Section 27A of the Securities Act of 1933, as amended, and Section 21E of the Securities Exchange Act of 1934, as amended). Forward-looking statements address our expected future business and financial performance, and may contain words such as goal, target, future, estimate, expect, anticipate, intend, plan,“ seek, project, may, should, will, the negative form of these expressions or similar expressions. These statements are based on management’s current beliefs, expectations assumptions about future events, conditions and results and on information currently available to us. Although we believe that the expectations reflected in the forward-looking statements reasonable, we cannot guarantee future results, levels of activity, performance, achievements or events and circumstances reflected in the forward-looking statements will occur. Examples of forward-looking statements include, among others, statements regarding the benefits of our strategic acquisitions, changes in the market for our products services, expected financial results, product portfolio enhancements, expansion plans and opportunities and expectations regarding key operational metrics. Forward-looking statements risks and uncertainties that could cause actual results to differ materially from those currently anticipated. Factors that could cause actual results or outcomes to differ materially from expectations include, but are not limited to, our ability to: (1) execute our business strategy, including expansions in existing and into new lines of business; (2) anticipate the uncertainties inherent development of new business lines and business strategies; (3) realize the benefits expected from our business combination; (4) continue to develop new products and innovations constantly evolving customer demands; (5) accelerate adoption of our products and services; (6) acquire or make investments in other businesses, patents, technologies, products or grow the business; (7) develop, design, and sell services that are differentiated from those of competitors; (8) anticipate the impact of the COVID-19 pandemic and its effect on our operations; (9) manage risks associated with product liability, warranty, personal injury, property damage and recall matters; (10) attract, train, and retain officers, employees and directors; enhance future operating and financial results; (12) comply with laws and regulations applicable to our business; (13) stay abreast of modified or new laws and regulations applicable business, including data security and privacy regulations; (14) anticipate the significance and timing of contractual obligations; (15) maintain key strategic relationships with partners, manufacturers and distributors; (16) respond to uncertainties associated with product and service development and market acceptance; (17) successfully defend litigation; (18) upgrade and maintain technology systems; (19) acquire and protect intellectual property; (20) anticipate rapid technological changes; and (20) successfully deploy the proceeds from the business combination. The foregoing list of factors is not exhaustive and new factors may emerge from time to time that could also affect actual performance and results. For more information, please see the included in the registration statement on Form S-4 filed by Fifth Wall Acquisition Corp. I and declared effective by the Securities and Exchange Commission (the “SEC”) on August subsequent filings with the SEC. The forward-looking statements herein speaks only as of the date of this release, and we disclaim any obligation to update forward-looking statements, unless required by applicable law. This press release should be read in conjunction with the information included in press releases, reports and other filings with the SEC. Understanding the information contained in these filings is important in order to fully understand our reported results and our business outlook for future periods. 2Forward Looking Statements This presentation contains forward-looking statements within the meaning of the safe harbor from civil liability provided for such statements by Securities Litigation Reform Act of 1995 (set forth in Section 27A of the Securities Act of 1933, as amended, and Section 21E of the Securities Exchange Act of 1934, as amended). Forward-looking statements address our expected future business and financial performance, and may contain words such as goal, target, future, estimate, expect, anticipate, intend, plan,“ seek, project, may, should, will, the negative form of these expressions or similar expressions. These statements are based on management’s current beliefs, expectations assumptions about future events, conditions and results and on information currently available to us. Although we believe that the expectations reflected in the forward-looking statements reasonable, we cannot guarantee future results, levels of activity, performance, achievements or events and circumstances reflected in the forward-looking statements will occur. Examples of forward-looking statements include, among others, statements regarding the benefits of our strategic acquisitions, changes in the market for our products services, expected financial results, product portfolio enhancements, expansion plans and opportunities and expectations regarding key operational metrics. Forward-looking statements risks and uncertainties that could cause actual results to differ materially from those currently anticipated. Factors that could cause actual results or outcomes to differ materially from expectations include, but are not limited to, our ability to: (1) execute our business strategy, including expansions in existing and into new lines of business; (2) anticipate the uncertainties inherent development of new business lines and business strategies; (3) realize the benefits expected from our business combination; (4) continue to develop new products and innovations constantly evolving customer demands; (5) accelerate adoption of our products and services; (6) acquire or make investments in other businesses, patents, technologies, products or grow the business; (7) develop, design, and sell services that are differentiated from those of competitors; (8) anticipate the impact of the COVID-19 pandemic and its effect on our operations; (9) manage risks associated with product liability, warranty, personal injury, property damage and recall matters; (10) attract, train, and retain officers, employees and directors; enhance future operating and financial results; (12) comply with laws and regulations applicable to our business; (13) stay abreast of modified or new laws and regulations applicable business, including data security and privacy regulations; (14) anticipate the significance and timing of contractual obligations; (15) maintain key strategic relationships with partners, manufacturers and distributors; (16) respond to uncertainties associated with product and service development and market acceptance; (17) successfully defend litigation; (18) upgrade and maintain technology systems; (19) acquire and protect intellectual property; (20) anticipate rapid technological changes; and (20) successfully deploy the proceeds from the business combination. The foregoing list of factors is not exhaustive and new factors may emerge from time to time that could also affect actual performance and results. For more information, please see the included in the registration statement on Form S-4 filed by Fifth Wall Acquisition Corp. I and declared effective by the Securities and Exchange Commission (the “SEC”) on August subsequent filings with the SEC. The forward-looking statements herein speaks only as of the date of this release, and we disclaim any obligation to update forward-looking statements, unless required by applicable law. This press release should be read in conjunction with the information included in press releases, reports and other filings with the SEC. Understanding the information contained in these filings is important in order to fully understand our reported results and our business outlook for future periods. 2
This presentation also contains estimates and other statistical data made by independent parties and by us relating to market size, growth and other data about our industry and our business. This data involves a number of assumptions and limitations, and you are cautioned not to give undue weight to such estimates. Use of Projections This presentation contains our projected financial information. Such projected financial information constitutes forward-looking information and is for illustrative purposes only and should not be relied upon as necessarily being indicative of future results. The assumptions and estimates underlying such projected financial information are inherently uncertain and are subject to a wide variety of significant business, economic, competitive and other risks and uncertainties that could cause actual results to differ materially from those contained in the prospective financial information. In addition, projections, assumptions and estimates of our future performance and the future performance of the markets in which we operate are necessarily subject to a high degree of uncertainty and risk. The inclusion of such information should not be regarded as a representation by any person that the results reflected in such projections will be achieved. Financial Information; non-GAAP Financial Measures The financial information and data contained in this presentation is unaudited and certain items do not conform with United States generally accepted accounting principles (“GAAP”), and therefore may be considered non-GAAP measures. Our management uses these measures to evaluate financial and operating performance. Participants in this presentation should evaluate these measures in light of audited and unaudited GAAP financial statements filed by us with the SEC or that will be presented in our future disclosures. See the Reconciliation of Non-GAAP Metrics section included in this presentation for a reconciliation of these non-GAAP measures to the most directly comparable GAAP financial measures. 3This presentation also contains estimates and other statistical data made by independent parties and by us relating to market size, growth and other data about our industry and our business. This data involves a number of assumptions and limitations, and you are cautioned not to give undue weight to such estimates. Use of Projections This presentation contains our projected financial information. Such projected financial information constitutes forward-looking information and is for illustrative purposes only and should not be relied upon as necessarily being indicative of future results. The assumptions and estimates underlying such projected financial information are inherently uncertain and are subject to a wide variety of significant business, economic, competitive and other risks and uncertainties that could cause actual results to differ materially from those contained in the prospective financial information. In addition, projections, assumptions and estimates of our future performance and the future performance of the markets in which we operate are necessarily subject to a high degree of uncertainty and risk. The inclusion of such information should not be regarded as a representation by any person that the results reflected in such projections will be achieved. Financial Information; non-GAAP Financial Measures The financial information and data contained in this presentation is unaudited and certain items do not conform with United States generally accepted accounting principles (“GAAP”), and therefore may be considered non-GAAP measures. Our management uses these measures to evaluate financial and operating performance. Participants in this presentation should evaluate these measures in light of audited and unaudited GAAP financial statements filed by us with the SEC or that will be presented in our future disclosures. See the Reconciliation of Non-GAAP Metrics section included in this presentation for a reconciliation of these non-GAAP measures to the most directly comparable GAAP financial measures. 3
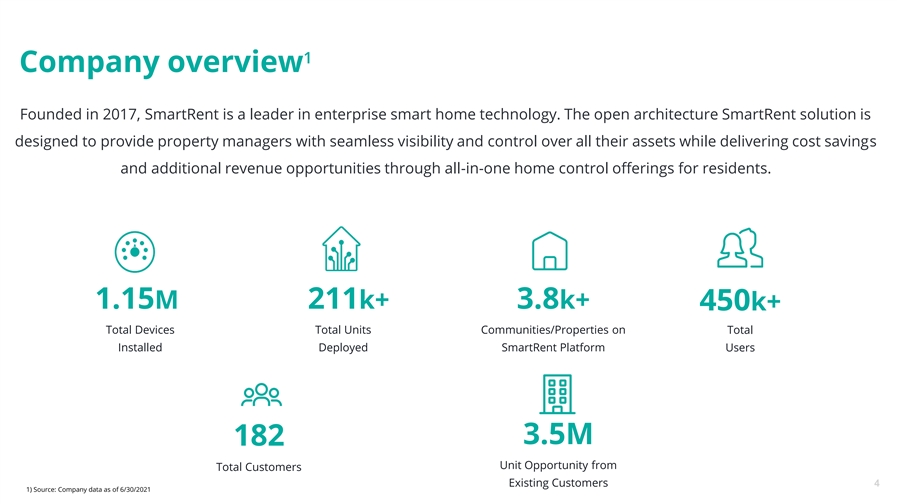
1 Company overview Founded in 2017, SmartRent is a leader in enterprise smart home technology. The open architecture SmartRent solution is designed to provide property managers with seamless visibility and control over all their assets while delivering cost savings and additional revenue opportunities through all-in-one home control offerings for residents. 1.15M 211k+ 3.8k+ 450k+ Total Devices Total Units Communities/Properties on Total Installed Deployed SmartRent Platform Users 3.5M 182 Unit Opportunity from Total Customers Existing Customers 4 1) Source: Company data as of 6/30/20211 Company overview Founded in 2017, SmartRent is a leader in enterprise smart home technology. The open architecture SmartRent solution is designed to provide property managers with seamless visibility and control over all their assets while delivering cost savings and additional revenue opportunities through all-in-one home control offerings for residents. 1.15M 211k+ 3.8k+ 450k+ Total Devices Total Units Communities/Properties on Total Installed Deployed SmartRent Platform Users 3.5M 182 Unit Opportunity from Total Customers Existing Customers 4 1) Source: Company data as of 6/30/2021
Key investment highlights Leading solution provider for owners / operators & residents 1 2 SmartRent is a category leader 3 Highly visible pipeline of demand 4 Large addressable market 5 Significant growth opportunity 6 Seasoned team with deep industry expertise Attractive financial profile 7Key investment highlights Leading solution provider for owners / operators & residents 1 2 SmartRent is a category leader 3 Highly visible pipeline of demand 4 Large addressable market 5 Significant growth opportunity 6 Seasoned team with deep industry expertise Attractive financial profile 7
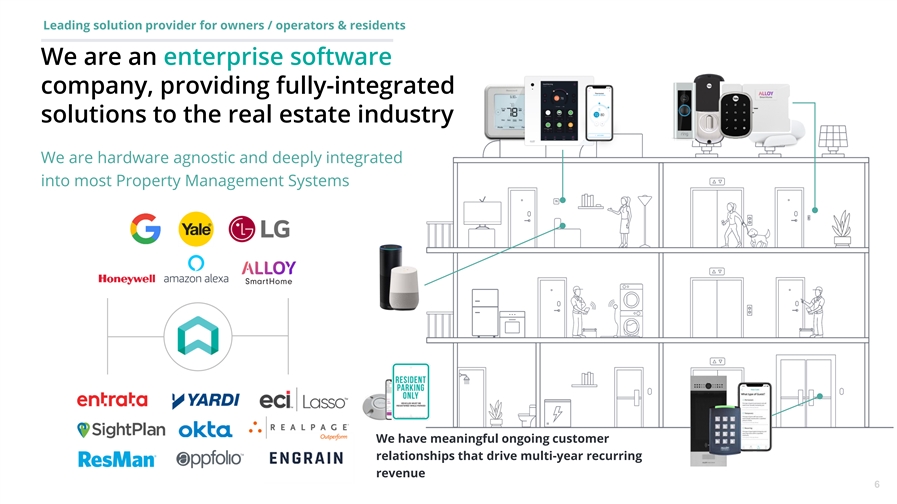
Leading solution provider for owners / operators & residents We are an enterprise software company, providing fully-integrated solutions to the real estate industry We are hardware agnostic and deeply integrated into most Property Management Systems We have meaningful ongoing customer relationships that drive multi-year recurring revenue 6Leading solution provider for owners / operators & residents We are an enterprise software company, providing fully-integrated solutions to the real estate industry We are hardware agnostic and deeply integrated into most Property Management Systems We have meaningful ongoing customer relationships that drive multi-year recurring revenue 6
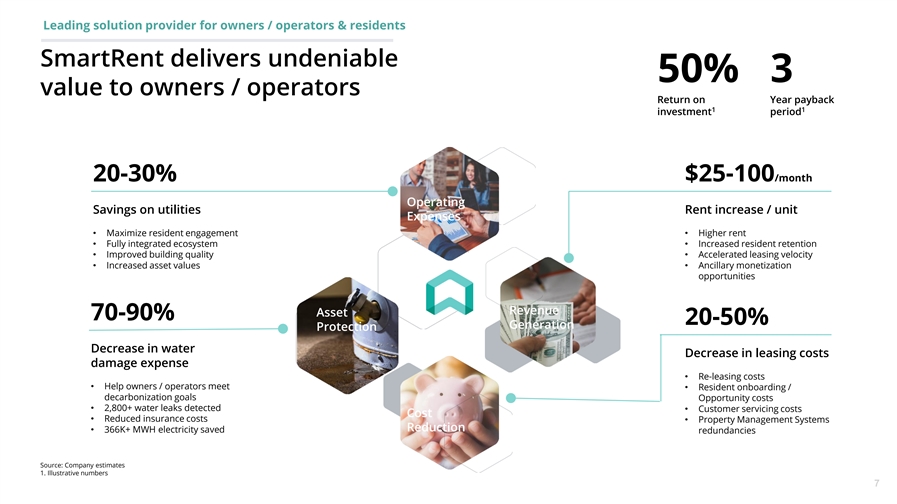
Leading solution provider for owners / operators & residents SmartRent delivers undeniable 50% 3 value to owners / operators Return on Year payback 1 1 investment period 20-30% $25-100/month Operating Savings on utilities Rent increase / unit Expenses • Maximize resident engagement• Higher rent • Fully integrated ecosystem• Increased resident retention • Improved building quality• Accelerated leasing velocity • Increased asset values• Ancillary monetization opportunities Revenue Asset 70-90% 20-50% Generation Protection Decrease in water Decrease in leasing costs damage expense • Re-leasing costs • Help owners / operators meet • Resident onboarding / decarbonization goals Opportunity costs • 2,800+ water leaks detected • Customer servicing costs Cost • Reduced insurance costs • Property Management Systems Reduction • 366K+ MWH electricity saved redundancies Source: Company estimates 1. Illustrative numbers 7Leading solution provider for owners / operators & residents SmartRent delivers undeniable 50% 3 value to owners / operators Return on Year payback 1 1 investment period 20-30% $25-100/month Operating Savings on utilities Rent increase / unit Expenses • Maximize resident engagement• Higher rent • Fully integrated ecosystem• Increased resident retention • Improved building quality• Accelerated leasing velocity • Increased asset values• Ancillary monetization opportunities Revenue Asset 70-90% 20-50% Generation Protection Decrease in water Decrease in leasing costs damage expense • Re-leasing costs • Help owners / operators meet • Resident onboarding / decarbonization goals Opportunity costs • 2,800+ water leaks detected • Customer servicing costs Cost • Reduced insurance costs • Property Management Systems Reduction • 366K+ MWH electricity saved redundancies Source: Company estimates 1. Illustrative numbers 7
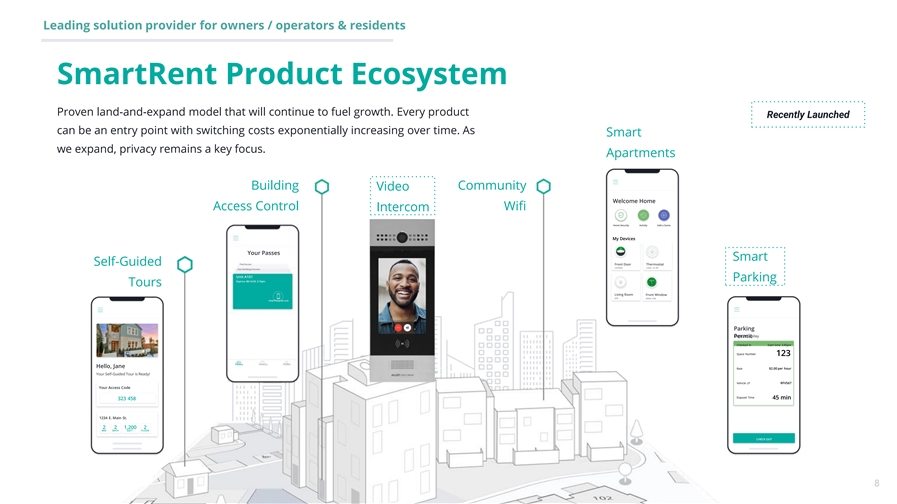
Leading solution provider for owners / operators & residents SmartRent Product Ecosystem Proven land-and-expand model that will continue to fuel growth. Every product Recently Launched can be an entry point with switching costs exponentially increasing over time. As Smart we expand, privacy remains a key focus. Apartments Building Community Video Welcome Home Access Control Wifi Intercom Home Security Activity Add a Scene My Devices Your Passes Smart Pool Access Front Door Thermostat Self-Guided LOCKED COOL 72-78° East Building A Access Unit A101 Parking Expires: 08/14/20 2:15pm Tours Living Room Front Window OFF OPEN 75% Hold Phone by Lock Parking Orchard Valley Permit Checked In Start time 3:45pm Space Number 123 Passes Activity Profile Hello, Jane Front Door Rate $2.00 per hour Locked Your Self-Guided Tour is Ready! Tap to unlock Vehicle LP RFV567 Your Access Code Elapsed Time 323 458 45 min 1234 E. Main St. 2 2 1,200 2 BED BATH SQFT FLOOR CHECK OUT 8Leading solution provider for owners / operators & residents SmartRent Product Ecosystem Proven land-and-expand model that will continue to fuel growth. Every product Recently Launched can be an entry point with switching costs exponentially increasing over time. As Smart we expand, privacy remains a key focus. Apartments Building Community Video Welcome Home Access Control Wifi Intercom Home Security Activity Add a Scene My Devices Your Passes Smart Pool Access Front Door Thermostat Self-Guided LOCKED COOL 72-78° East Building A Access Unit A101 Parking Expires: 08/14/20 2:15pm Tours Living Room Front Window OFF OPEN 75% Hold Phone by Lock Parking Orchard Valley Permit Checked In Start time 3:45pm Space Number 123 Passes Activity Profile Hello, Jane Front Door Rate $2.00 per hour Locked Your Self-Guided Tour is Ready! Tap to unlock Vehicle LP RFV567 Your Access Code Elapsed Time 323 458 45 min 1234 E. Main St. 2 2 1,200 2 BED BATH SQFT FLOOR CHECK OUT 8
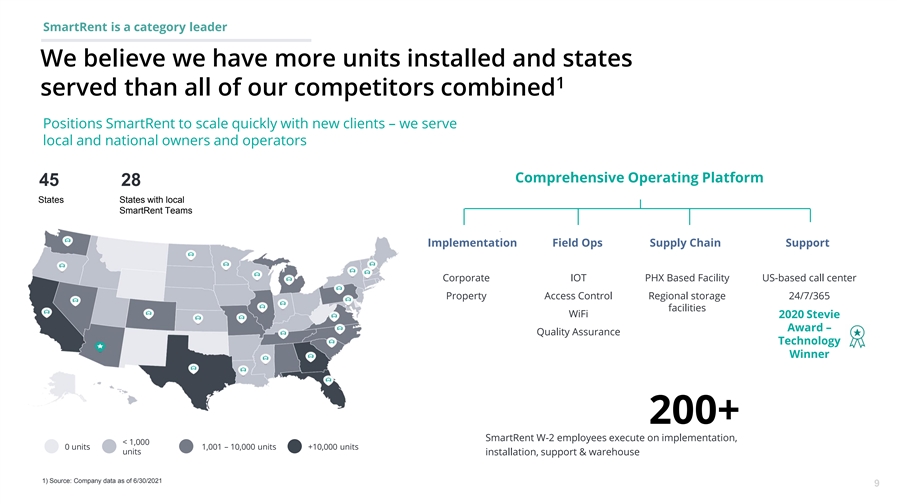
SmartRent is a category leader We believe we have more units installed and states 1 served than all of our competitors combined Positions SmartRent to scale quickly with new clients – we serve local and national owners and operators Comprehensive Operating Platform 45 28 States States with local SmartRent Teams Implementation Field Ops Supply Chain Support Corporate IOT PHX Based Facility US-based call center Property Access Control Regional storage 24/7/365 facilities WiFi 2020 Stevie Award – Quality Assurance Technology Winner 200+ SmartRent W-2 employees execute on implementation, < 1,000 0 units 1,001 – 10,000 units +10,000 units units installation, support & warehouse 1) Source: Company data as of 6/30/2021 9SmartRent is a category leader We believe we have more units installed and states 1 served than all of our competitors combined Positions SmartRent to scale quickly with new clients – we serve local and national owners and operators Comprehensive Operating Platform 45 28 States States with local SmartRent Teams Implementation Field Ops Supply Chain Support Corporate IOT PHX Based Facility US-based call center Property Access Control Regional storage 24/7/365 facilities WiFi 2020 Stevie Award – Quality Assurance Technology Winner 200+ SmartRent W-2 employees execute on implementation, < 1,000 0 units 1,001 – 10,000 units +10,000 units units installation, support & warehouse 1) Source: Company data as of 6/30/2021 9
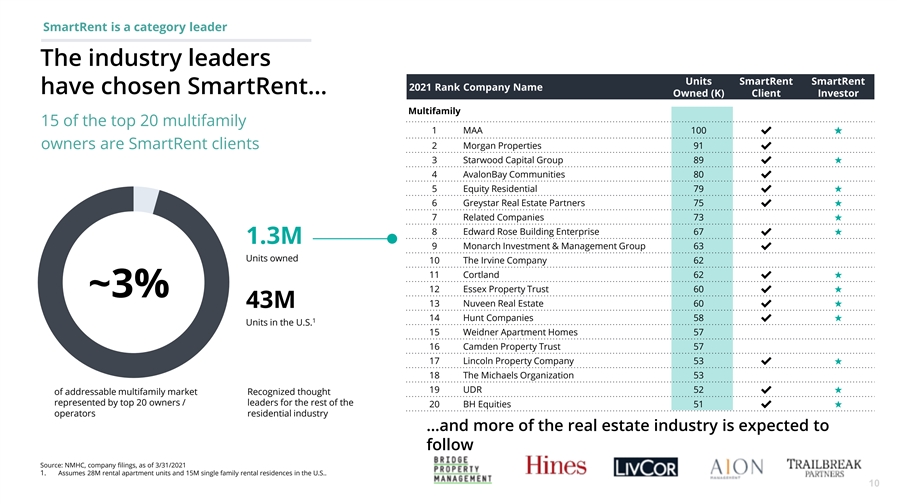
SmartRent is a category leader The industry leaders Units SmartRent SmartRent 2021 Rank Company Name have chosen SmartRent… Owned (K) Client Investor Multifamily 15 of the top 20 multifamily 1 MAA 100✔★ owners are SmartRent clients 2 Morgan Properties 91✔ 3 Starwood Capital Group 89 ✔★ 4 AvalonBay Communities 80✔ 5 Equity Residential 79✔★ 6 Greystar Real Estate Partners 75 ✔★ 7 Related Companies 73★ 8 Edward Rose Building Enterprise 67★ ✔ 1.3M 9 Monarch Investment & Management Group 63 ✔ Units owned 10 The Irvine Company 62 11 Cortland 62★ ✔ 12 Essex Property Trust 60 ✔★ ~3% 13 Nuveen Real Estate 60✔★ 43M 14 Hunt Companies 58★ ✔ 1 Units in the U.S. 15 Weidner Apartment Homes 57 16 Camden Property Trust 57 17 Lincoln Property Company 53 ✔★ 18 The Michaels Organization 53 19 UDR 52★ ✔ of addressable multifamily market Recognized thought represented by top 20 owners / leaders for the rest of the 20 BH Equities 51 ✔★ operators residential industry …and more of the real estate industry is expected to follow Source: NMHC, company filings, as of 3/31/2021 1. Assumes 28M rental apartment units and 15M single family rental residences in the U.S.. 10SmartRent is a category leader The industry leaders Units SmartRent SmartRent 2021 Rank Company Name have chosen SmartRent… Owned (K) Client Investor Multifamily 15 of the top 20 multifamily 1 MAA 100✔★ owners are SmartRent clients 2 Morgan Properties 91✔ 3 Starwood Capital Group 89 ✔★ 4 AvalonBay Communities 80✔ 5 Equity Residential 79✔★ 6 Greystar Real Estate Partners 75 ✔★ 7 Related Companies 73★ 8 Edward Rose Building Enterprise 67★ ✔ 1.3M 9 Monarch Investment & Management Group 63 ✔ Units owned 10 The Irvine Company 62 11 Cortland 62★ ✔ 12 Essex Property Trust 60 ✔★ ~3% 13 Nuveen Real Estate 60✔★ 43M 14 Hunt Companies 58★ ✔ 1 Units in the U.S. 15 Weidner Apartment Homes 57 16 Camden Property Trust 57 17 Lincoln Property Company 53 ✔★ 18 The Michaels Organization 53 19 UDR 52★ ✔ of addressable multifamily market Recognized thought represented by top 20 owners / leaders for the rest of the 20 BH Equities 51 ✔★ operators residential industry …and more of the real estate industry is expected to follow Source: NMHC, company filings, as of 3/31/2021 1. Assumes 28M rental apartment units and 15M single family rental residences in the U.S.. 10
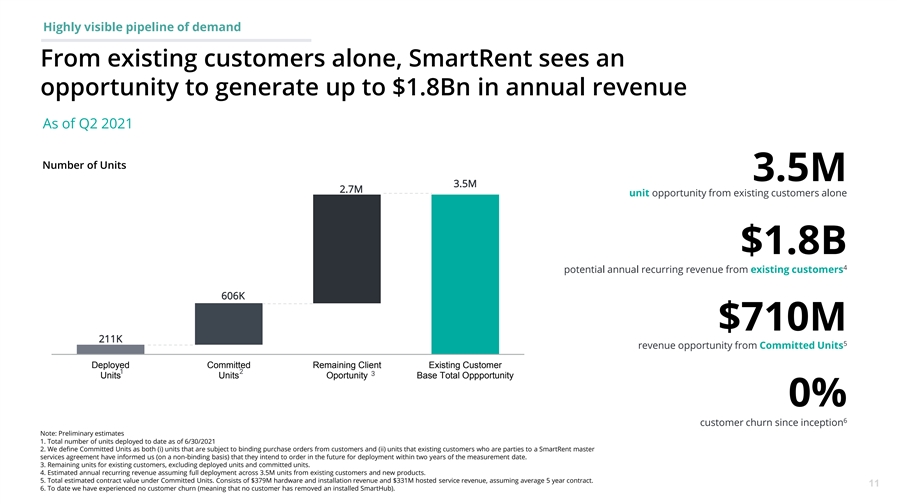
Highly visible pipeline of demand From existing customers alone, SmartRent sees an opportunity to generate up to $1.8Bn in annual revenue As of Q2 2021 Number of Units 3.5M 3.5M 2.7M unit opportunity from existing customers alone $1.8B 4 potential annual recurring revenue from existing customers 606K $710M 211K 5 revenue opportunity from Committed Units Deployed Committed Remaining Client Existing Customer 1 2 3 Units Units Oportunity Base Total Oppportunity 0% 6 customer churn since inception Note: Preliminary estimates 1. Total number of units deployed to date as of 6/30/2021 2. We define Committed Units as both (i) units that are subject to binding purchase orders from customers and (ii) units that existing customers who are parties to a SmartRent master services agreement have informed us (on a non-binding basis) that they intend to order in the future for deployment within two years of the measurement date. 3. Remaining units for existing customers, excluding deployed units and committed units. 4. Estimated annual recurring revenue assuming full deployment across 3.5M units from existing customers and new products. 5. Total estimated contract value under Committed Units. Consists of $379M hardware and installation revenue and $331M hosted service revenue, assuming average 5 year contract. 11 6. To date we have experienced no customer churn (meaning that no customer has removed an installed SmartHub).Highly visible pipeline of demand From existing customers alone, SmartRent sees an opportunity to generate up to $1.8Bn in annual revenue As of Q2 2021 Number of Units 3.5M 3.5M 2.7M unit opportunity from existing customers alone $1.8B 4 potential annual recurring revenue from existing customers 606K $710M 211K 5 revenue opportunity from Committed Units Deployed Committed Remaining Client Existing Customer 1 2 3 Units Units Oportunity Base Total Oppportunity 0% 6 customer churn since inception Note: Preliminary estimates 1. Total number of units deployed to date as of 6/30/2021 2. We define Committed Units as both (i) units that are subject to binding purchase orders from customers and (ii) units that existing customers who are parties to a SmartRent master services agreement have informed us (on a non-binding basis) that they intend to order in the future for deployment within two years of the measurement date. 3. Remaining units for existing customers, excluding deployed units and committed units. 4. Estimated annual recurring revenue assuming full deployment across 3.5M units from existing customers and new products. 5. Total estimated contract value under Committed Units. Consists of $379M hardware and installation revenue and $331M hosted service revenue, assuming average 5 year contract. 11 6. To date we have experienced no customer churn (meaning that no customer has removed an installed SmartHub).
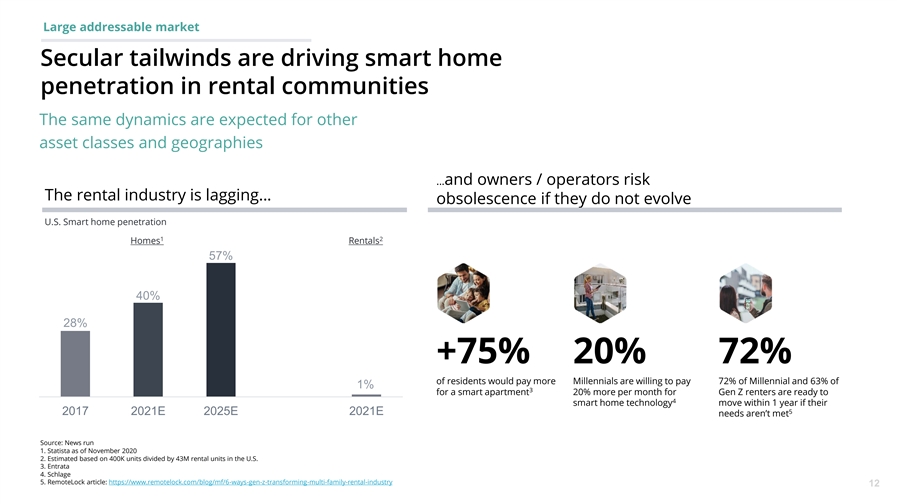
Large addressable market Secular tailwinds are driving smart home penetration in rental communities The same dynamics are expected for other asset classes and geographies …and owners / operators risk The rental industry is lagging… obsolescence if they do not evolve U.S. Smart home penetration 1 2 Homes Rentals 57% 40% 28% +75% 20% 72% of residents would pay more Millennials are willing to pay 72% of Millennial and 63% of 1% 3 for a smart apartment 20% more per month for Gen Z renters are ready to 4 smart home technology move within 1 year if their 5 2017 2021E 2025E 2021E needs aren’t met Source: News run 1. Statista as of November 2020 2. Estimated based on 400K units divided by 43M rental units in the U.S. 3. Entrata 4. Schlage 5. RemoteLock article: https://www.remotelock.com/blog/mf/6-ways-gen-z-transforming-multi-family-rental-industry 12
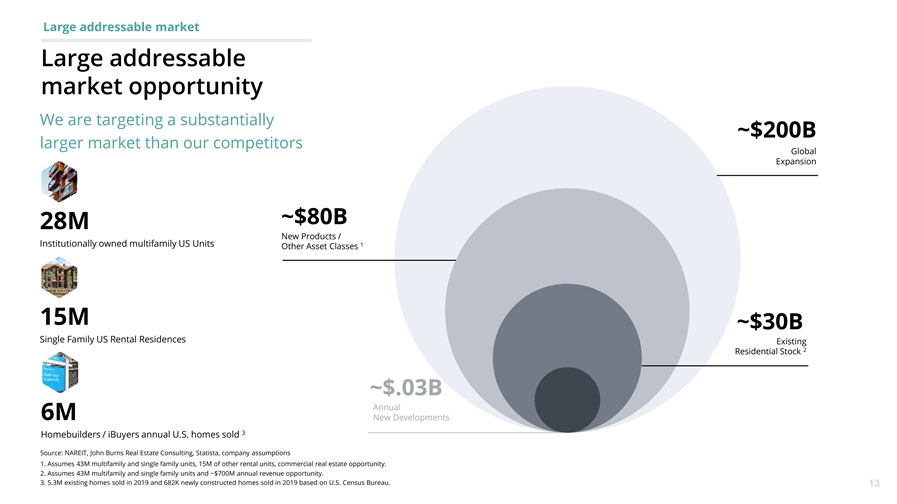
Large addressable market Large addressable market opportunity We are targeting a substantially ~$200B larger market than our competitors Global Expansion ~$80B 28M New Products / Institutionally owned multifamily US Units 1 Other Asset Classes 15M ~$30B Single Family US Rental Residences Existing 2 Residential Stock ~$.03B Annual 6M New Developments 3 Homebuilders / iBuyers annual U.S. homes sold Source: NAREIT, John Burns Real Estate Consulting, Statista, company assumptions 1. Assumes 43M multifamily and single family units, 15M of other rental units, commercial real estate opportunity. 2. Assumes 43M multifamily and single family units and ~$700M annual revenue opportunity. 3. 5.3M existing homes sold in 2019 and 682K newly constructed homes sold in 2019 based on U.S. Census Bureau. 13Large addressable market Large addressable market opportunity We are targeting a substantially ~$200B larger market than our competitors Global Expansion ~$80B 28M New Products / Institutionally owned multifamily US Units 1 Other Asset Classes 15M ~$30B Single Family US Rental Residences Existing 2 Residential Stock ~$.03B Annual 6M New Developments 3 Homebuilders / iBuyers annual U.S. homes sold Source: NAREIT, John Burns Real Estate Consulting, Statista, company assumptions 1. Assumes 43M multifamily and single family units, 15M of other rental units, commercial real estate opportunity. 2. Assumes 43M multifamily and single family units and ~$700M annual revenue opportunity. 3. 5.3M existing homes sold in 2019 and 682K newly constructed homes sold in 2019 based on U.S. Census Bureau. 13
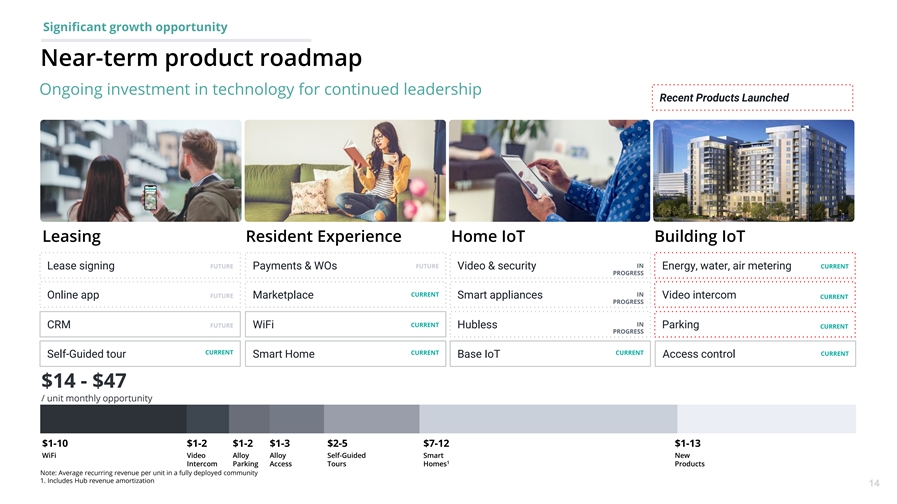
Significant growth opportunity Near-term product roadmap Ongoing investment in technology for continued leadership Recent Products Launched Leasing Resident Experience Home IoT Building IoT FUTURE IN FUTURE CURRENT Lease signing Payments & WOs Video & security Energy, water, air metering PROGRESS CURRENT IN FUTURE Online app Marketplace Smart appliances Video intercom CURRENT PROGRESS CURRENT IN CRM FUTURE WiFi Hubless Parking CURRENT PROGRESS CURRENT CURRENT CURRENT CURRENT Self-Guided tour Smart Home Base IoT Access control $14 - $47 / unit monthly opportunity $1-10 $1-2 $1-2 $1-3 $2-5 $7-12 $1-13 WiFi Video Alloy Alloy Self-Guided Smart New 1 Intercom Parking Access Tours Homes Products Note: Average recurring revenue per unit in a fully deployed community 1. Includes Hub revenue amortization 14Significant growth opportunity Near-term product roadmap Ongoing investment in technology for continued leadership Recent Products Launched Leasing Resident Experience Home IoT Building IoT FUTURE IN FUTURE CURRENT Lease signing Payments & WOs Video & security Energy, water, air metering PROGRESS CURRENT IN FUTURE Online app Marketplace Smart appliances Video intercom CURRENT PROGRESS CURRENT IN CRM FUTURE WiFi Hubless Parking CURRENT PROGRESS CURRENT CURRENT CURRENT CURRENT Self-Guided tour Smart Home Base IoT Access control $14 - $47 / unit monthly opportunity $1-10 $1-2 $1-2 $1-3 $2-5 $7-12 $1-13 WiFi Video Alloy Alloy Self-Guided Smart New 1 Intercom Parking Access Tours Homes Products Note: Average recurring revenue per unit in a fully deployed community 1. Includes Hub revenue amortization 14
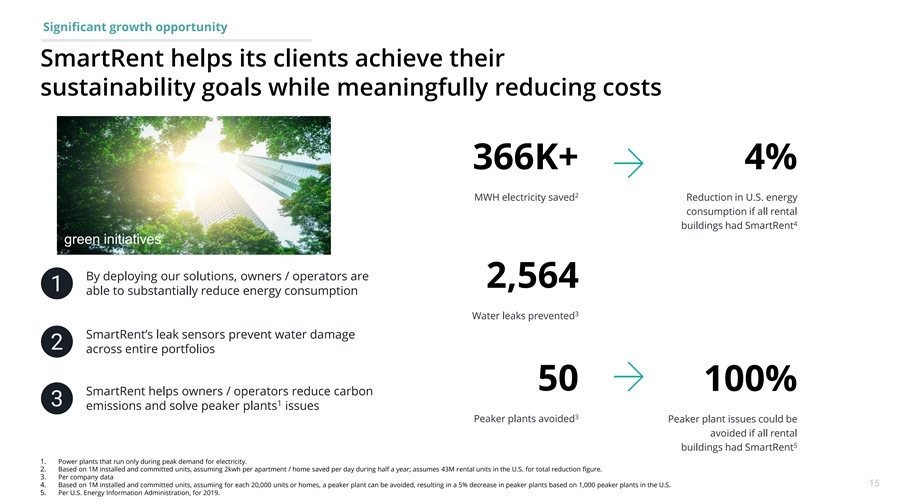
Significant growth opportunity SmartRent helps its clients achieve their sustainability goals while meaningfully reducing costs 366K+ 4% 2 MWH electricity saved Reduction in U.S. energy consumption if all rental 4 buildings had SmartRent green initiatives By deploying our solutions, owners / operators are 2,564 1 able to substantially reduce energy consumption 3 Water leaks prevented SmartRent’s leak sensors prevent water damage 2 across entire portfolios 50 100% SmartRent helps owners / operators reduce carbon 3 1 emissions and solve peaker plants issues 3 Peaker plants avoided Peaker plant issues could be avoided if all rental 5 buildings had SmartRent 1. Power plants that run only during peak demand for electricity. 2. Based on 1M installed and committed units, assuming 2kwh per apartment / home saved per day during half a year; assumes 43M rental units in the U.S. for total reduction figure. 3. Per company data 4. Based on 1M installed and committed units, assuming for each 20,000 units or homes, a peaker plant can be avoided, resulting in a 5% decrease in peaker plants based on 1,000 peaker plants in the U.S. 15 5. Per U.S. Energy Information Administration, for 2019.Significant growth opportunity SmartRent helps its clients achieve their sustainability goals while meaningfully reducing costs 366K+ 4% 2 MWH electricity saved Reduction in U.S. energy consumption if all rental 4 buildings had SmartRent green initiatives By deploying our solutions, owners / operators are 2,564 1 able to substantially reduce energy consumption 3 Water leaks prevented SmartRent’s leak sensors prevent water damage 2 across entire portfolios 50 100% SmartRent helps owners / operators reduce carbon 3 1 emissions and solve peaker plants issues 3 Peaker plants avoided Peaker plant issues could be avoided if all rental 5 buildings had SmartRent 1. Power plants that run only during peak demand for electricity. 2. Based on 1M installed and committed units, assuming 2kwh per apartment / home saved per day during half a year; assumes 43M rental units in the U.S. for total reduction figure. 3. Per company data 4. Based on 1M installed and committed units, assuming for each 20,000 units or homes, a peaker plant can be avoided, resulting in a 5% decrease in peaker plants based on 1,000 peaker plants in the U.S. 15 5. Per U.S. Energy Information Administration, for 2019.
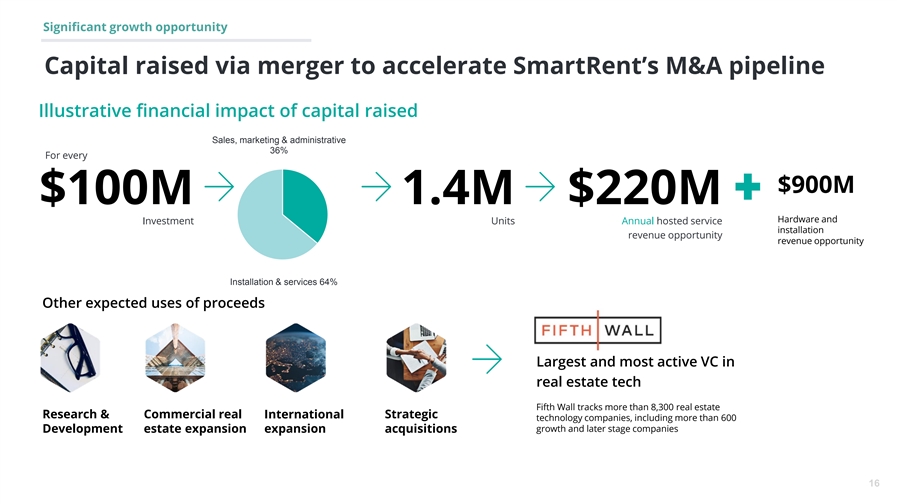
Significant growth opportunity Capital raised via merger to accelerate SmartRent’s M&A pipeline Illustrative financial impact of capital raised Sales, marketing & administrative 36% For every $900M $100M 1.4M $220M Hardware and Investment Units Annual hosted service installation revenue opportunity revenue opportunity Installation & services 64% Other expected uses of proceeds Largest and most active VC in real estate tech Fifth Wall tracks more than 8,300 real estate Research & Commercial real Strategic International technology companies, including more than 600 growth and later stage companies Development estate expansion expansion acquisitions 16Significant growth opportunity Capital raised via merger to accelerate SmartRent’s M&A pipeline Illustrative financial impact of capital raised Sales, marketing & administrative 36% For every $900M $100M 1.4M $220M Hardware and Investment Units Annual hosted service installation revenue opportunity revenue opportunity Installation & services 64% Other expected uses of proceeds Largest and most active VC in real estate tech Fifth Wall tracks more than 8,300 real estate Research & Commercial real Strategic International technology companies, including more than 600 growth and later stage companies Development estate expansion expansion acquisitions 16
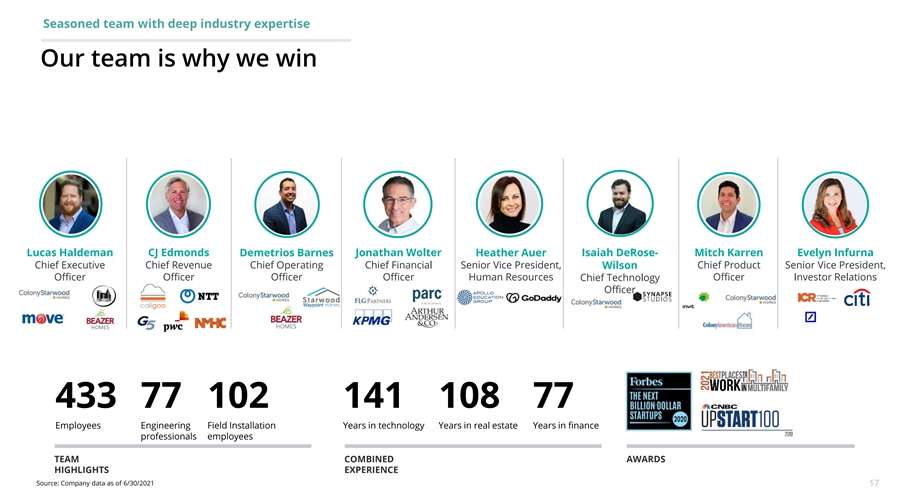
Seasoned team with deep industry expertise Our team is why we win Lucas Haldeman CJ Edmonds Demetrios Barnes Jonathan Wolter Heather Auer Isaiah DeRose- Mitch Karren Evelyn Infurna Chief Executive Chief Revenue Chief Operating Chief Financial Senior Vice President, Wilson Chief Product Senior Vice President, Officer Officer Officer Officer Human Resources Chief Technology Officer Investor Relations Officer 433 77 102 141 108 77 Employees Engineering Field Installation Years in technology Years in real estate Years in finance professionals employees TEAM COMBINED AWARDS HIGHLIGHTS EXPERIENCE Source: Company data as of 6/30/2021 17Seasoned team with deep industry expertise Our team is why we win Lucas Haldeman CJ Edmonds Demetrios Barnes Jonathan Wolter Heather Auer Isaiah DeRose- Mitch Karren Evelyn Infurna Chief Executive Chief Revenue Chief Operating Chief Financial Senior Vice President, Wilson Chief Product Senior Vice President, Officer Officer Officer Officer Human Resources Chief Technology Officer Investor Relations Officer 433 77 102 141 108 77 Employees Engineering Field Installation Years in technology Years in real estate Years in finance professionals employees TEAM COMBINED AWARDS HIGHLIGHTS EXPERIENCE Source: Company data as of 6/30/2021 17
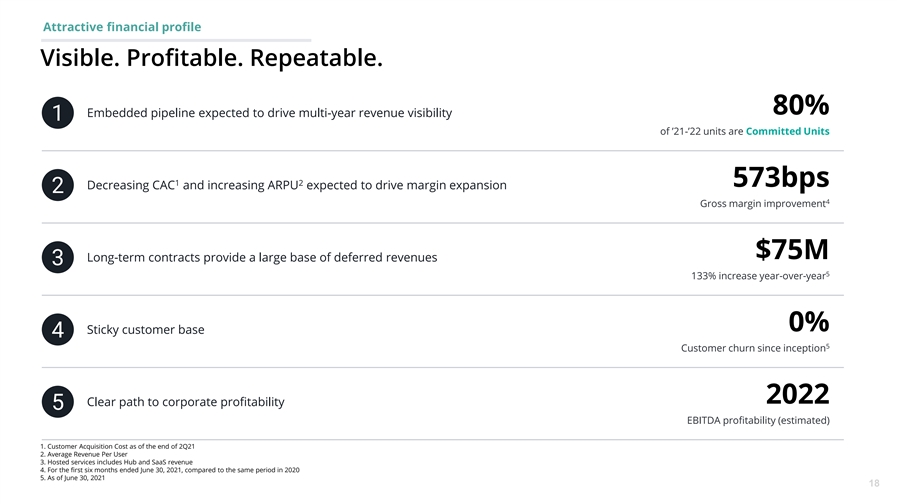
Attractive financial profile Visible. Profitable. Repeatable. 80% Embedded pipeline expected to drive multi-year revenue visibility 1 of ’21-’22 units are Committed Units 1 2 573bps Decreasing CAC and increasing ARPU expected to drive margin expansion 2 4 Gross margin improvement $75M Long-term contracts provide a large base of deferred revenues 3 5 133% increase year-over-year 0% Sticky customer base 4 5 Customer churn since inception 2022 Clear path to corporate profitability 5 EBITDA profitability (estimated) 1. Customer Acquisition Cost as of the end of 2Q21 2. Average Revenue Per User 3. Hosted services includes Hub and SaaS revenue 4. For the first six months ended June 30, 2021, compared to the same period in 2020 5. As of June 30, 2021 18
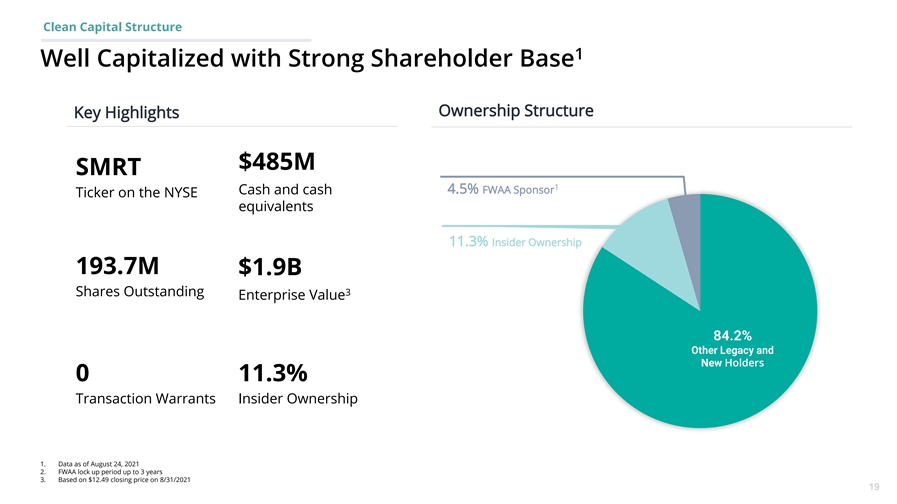
Clean Capital Structure 1 Well Capitalized with Strong Shareholder Base Ownership Structure Key Highlights $485M SMRT 1 Cash and cash 4.5% FWAA Sponsor Ticker on the NYSE equivalents 11.3% Insider Ownership 193.7M $1.9B Shares Outstanding 3 Enterprise Value Holders 0 11.3% Transaction Warrants Insider Ownership 1. Data as of August 24, 2021 2. FWAA lock up period up to 3 years 3. Based on $12.49 closing price on 8/31/2021 19Clean Capital Structure 1 Well Capitalized with Strong Shareholder Base Ownership Structure Key Highlights $485M SMRT 1 Cash and cash 4.5% FWAA Sponsor Ticker on the NYSE equivalents 11.3% Insider Ownership 193.7M $1.9B Shares Outstanding 3 Enterprise Value Holders 0 11.3% Transaction Warrants Insider Ownership 1. Data as of August 24, 2021 2. FWAA lock up period up to 3 years 3. Based on $12.49 closing price on 8/31/2021 19
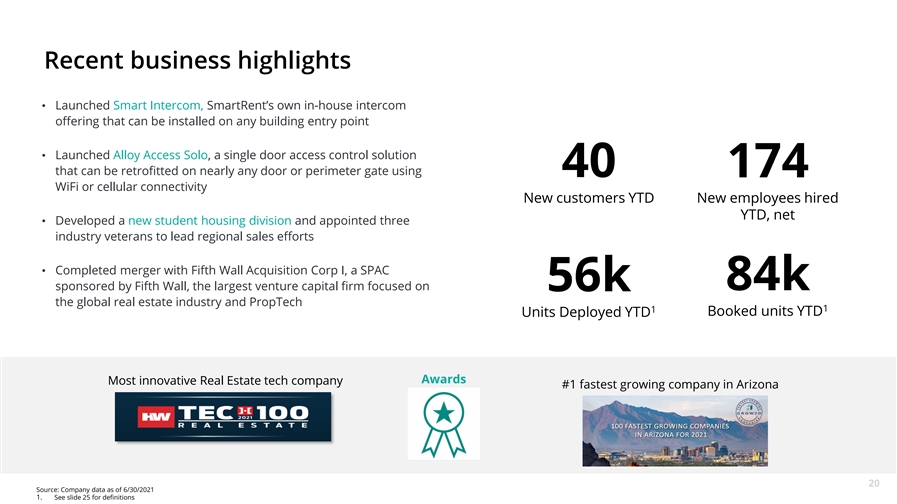
Recent business highlights • Launched Smart Intercom, SmartRent’s own in-house intercom offering that can be installed on any building entry point • Launched Alloy Access Solo, a single door access control solution that can be retrofitted on nearly any door or perimeter gate using 40 174 WiFi or cellular connectivity New customers YTD New employees hired YTD, net • Developed a new student housing division and appointed three industry veterans to lead regional sales efforts • Completed merger with Fifth Wall Acquisition Corp I, a SPAC sponsored by Fifth Wall, the largest venture capital firm focused on 84k 56k the global real estate industry and PropTech 1 1 Booked units YTD Units Deployed YTD Awards Most innovative Real Estate tech company #1 fastest growing company in Arizona 20 Source: Company data as of 6/30/2021 1. See slide 25 for definitionsRecent business highlights • Launched Smart Intercom, SmartRent’s own in-house intercom offering that can be installed on any building entry point • Launched Alloy Access Solo, a single door access control solution that can be retrofitted on nearly any door or perimeter gate using 40 174 WiFi or cellular connectivity New customers YTD New employees hired YTD, net • Developed a new student housing division and appointed three industry veterans to lead regional sales efforts • Completed merger with Fifth Wall Acquisition Corp I, a SPAC sponsored by Fifth Wall, the largest venture capital firm focused on 84k 56k the global real estate industry and PropTech 1 1 Booked units YTD Units Deployed YTD Awards Most innovative Real Estate tech company #1 fastest growing company in Arizona 20 Source: Company data as of 6/30/2021 1. See slide 25 for definitions
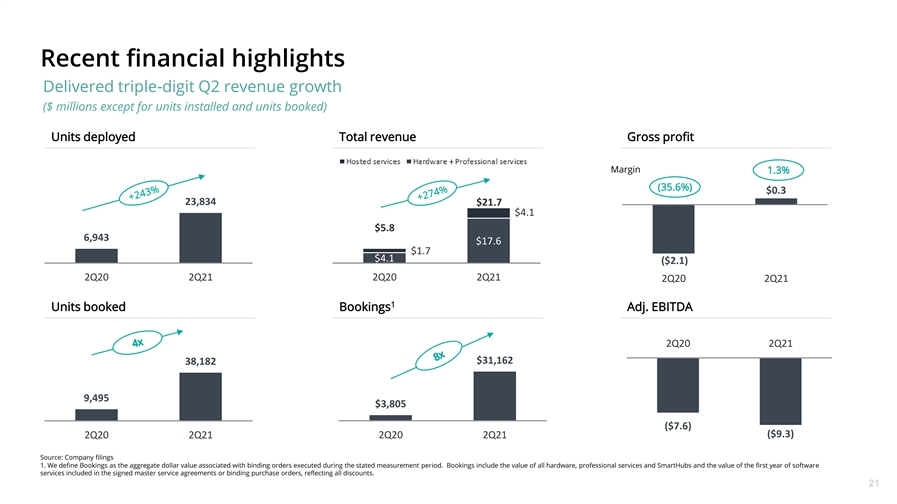
Recent financial highlights Delivered triple-digit Q2 revenue growth ($ millions except for units installed and units booked) Units deployed Total revenue Gross profit Margin 1.3% (35.6%) $0.3 23,834 $21.7 $4.1 $5.8 6,943 $17.6 $1.7 $4.1 ($2.1) 2Q20 2Q21 2Q20 2Q21 2Q20 2Q21 1 Units booked Bookings Adj. EBITDA 2Q20 2Q21 $31,162 38,182 9,495 $3,805 ($7.6) ($9.3) 2Q20 2Q21 2Q20 2Q21 Source: Company filings 1. We define Bookings as the aggregate dollar value associated with binding orders executed during the stated measurement period. Bookings include the value of all hardware, professional services and SmartHubs and the value of the first year of software services included in the signed master service agreements or binding purchase orders, reflecting all discounts. 21Recent financial highlights Delivered triple-digit Q2 revenue growth ($ millions except for units installed and units booked) Units deployed Total revenue Gross profit Margin 1.3% (35.6%) $0.3 23,834 $21.7 $4.1 $5.8 6,943 $17.6 $1.7 $4.1 ($2.1) 2Q20 2Q21 2Q20 2Q21 2Q20 2Q21 1 Units booked Bookings Adj. EBITDA 2Q20 2Q21 $31,162 38,182 9,495 $3,805 ($7.6) ($9.3) 2Q20 2Q21 2Q20 2Q21 Source: Company filings 1. We define Bookings as the aggregate dollar value associated with binding orders executed during the stated measurement period. Bookings include the value of all hardware, professional services and SmartHubs and the value of the first year of software services included in the signed master service agreements or binding purchase orders, reflecting all discounts. 21
TITLE CAN NOT GO ABOVE THIS LINE SUBTITLE BELOW THIS LINE CONTENT BELOW THIS LINE APPENDIX CONTENT BELOW THIS LINE NOTES START FROM HERE AND GROW UPTITLE CAN NOT GO ABOVE THIS LINE SUBTITLE BELOW THIS LINE CONTENT BELOW THIS LINE APPENDIX CONTENT BELOW THIS LINE NOTES START FROM HERE AND GROW UP
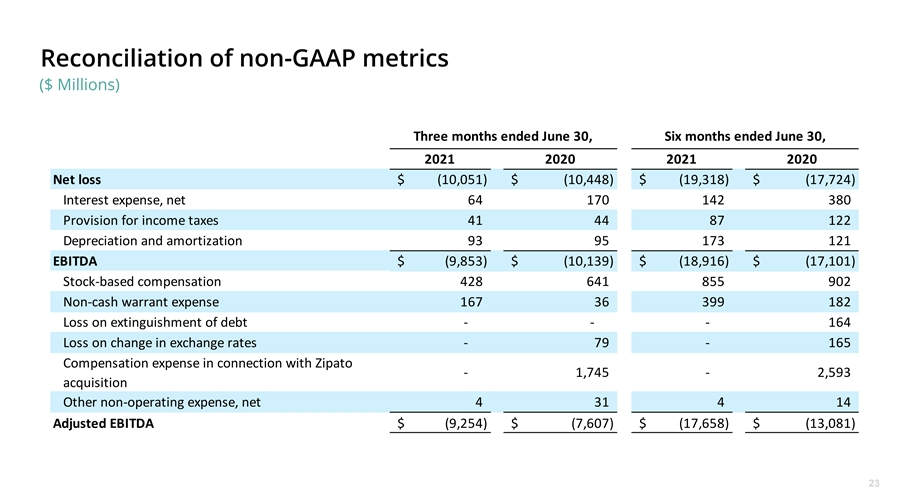
Reconciliation of non-GAAP metrics ($ Millions) Three months ended June 30, Six months ended June 30, 2021 2020 2021 2020 Net loss $ (10,051) $ (10,448) $ (19,318) $ (17,724) Interest expense, net 64 170 142 380 Provision for income taxes 41 44 87 122 Depreciation and amortization 93 95 173 121 EBITDA $ (9,853) $ (10,139) $ (18,916) $ (17,101) Stock-based compensation 428 641 855 902 Non-cash warrant expense 167 36 399 182 Loss on extinguishment of debt - - - 164 Loss on change in exchange rates - 79 - 165 Compensation expense in connection with Zipato - 1 ,745 - 2 ,593 acquisition Other non-operating expense, net 4 31 4 14 Adjusted EBITDA $ (9,254) $ (7,607) $ (17,658) $ (13,081) 23Reconciliation of non-GAAP metrics ($ Millions) Three months ended June 30, Six months ended June 30, 2021 2020 2021 2020 Net loss $ (10,051) $ (10,448) $ (19,318) $ (17,724) Interest expense, net 64 170 142 380 Provision for income taxes 41 44 87 122 Depreciation and amortization 93 95 173 121 EBITDA $ (9,853) $ (10,139) $ (18,916) $ (17,101) Stock-based compensation 428 641 855 902 Non-cash warrant expense 167 36 399 182 Loss on extinguishment of debt - - - 164 Loss on change in exchange rates - 79 - 165 Compensation expense in connection with Zipato - 1 ,745 - 2 ,593 acquisition Other non-operating expense, net 4 31 4 14 Adjusted EBITDA $ (9,254) $ (7,607) $ (17,658) $ (13,081) 23
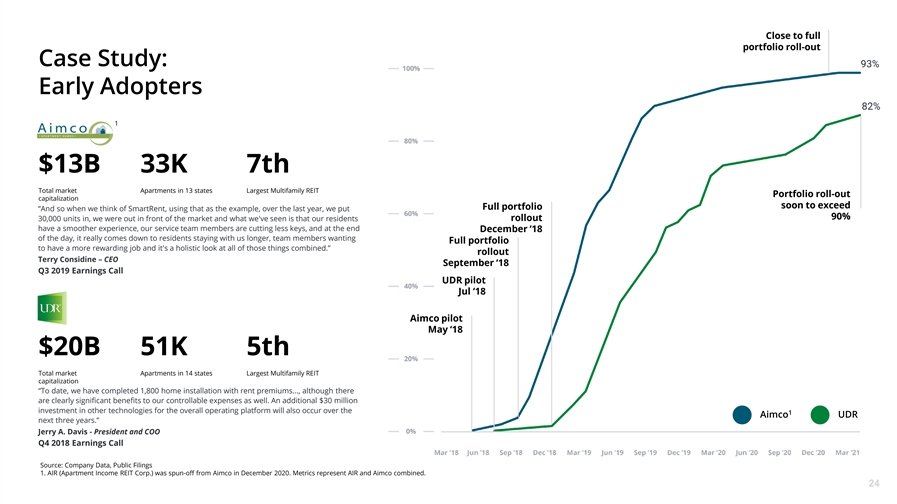
Close to full portfolio roll-out Case Study: 93% Early Adopters 82% 1 $13B 33K 7th Total market Apartments in 13 states Largest Multifamily REIT Portfolio roll-out capitalization soon to exceed Full portfolio “And so when we think of SmartRent, using that as the example, over the last year, we put 90% 30,000 units in, we were out in front of the market and what we've seen is that our residents rollout have a smoother experience, our service team members are cutting less keys, and at the end December ‘18 of the day, it really comes down to residents staying with us longer, team members wanting Full portfolio to have a more rewarding job and it's a holistic look at all of those things combined.” rollout Terry Considine – CEO September ‘18 Q3 2019 Earnings Call UDR pilot Jul ‘18 Aimco pilot May ‘18 $20B 51K 5th Total market Apartments in 14 states Largest Multifamily REIT capitalization “To date, we have completed 1,800 home installation with rent premiums..., although there are clearly significant benefits to our controllable expenses as well. An additional $30 million investment in other technologies for the overall operating platform will also occur over the 1 Aimco UDR next three years.” Jerry A. Davis - President and COO Q4 2018 Earnings Call Source: Company Data, Public Filings 1. AIR (Apartment Income REIT Corp.) was spun-off from Aimco in December 2020. Metrics represent AIR and Aimco combined. 24
Definition of key operating metrics SmartRent regularly monitors a number of operating and financial metrics including the following non-GAAP financial measures which the Company believes are key measures of its growth, to evaluate its operating performance, identify trends affecting its business, formulate business plans, measure its progress and make strategic decisions. The Company’s Key Operating Metrics may not provide accurate predictions of future GAAP financial results. Units Deployed is defined as the aggregate number of the Company’s SmartHubs that have been installed (also including customer self- installations) as of a stated measurement date. The Company uses this operating metric to assess the general health and trajectory of its business growth. New Units Deployed is defined as the aggregate number of SmartHubs that have been installed (also including customer self-installations) during a stated measurement period. The Company uses this operating metric to assess the general health and trajectory of its business growth. Committed Units is defined as the aggregate number of SmartHubs that are subject to binding orders from customers together with units that existing customers who are parties to a SmartRent master services agreement have informed us (on a non-binding basis) that they intend to order in the future for deployment within two years of the measurement date. The Company tracks the number of committed units to assess the general health and trajectory of its business and to assist in its longer-term resource analysis. Units Booked is defined as the aggregate number of SmartHubs associated with binding orders executed during a stated measurement period. The Company utilizes the concept of Units Booked to assist in assessing near-term resource demand and the resulting approximate range of post-delivery revenue that it will earn and record. Units Booked represent binding orders only and accordingly are a subset of Committed Units. Annual Recurring Revenue (“ARR”) is defined as the annualized value of our recurring SaaS revenue earned in the current quarter. 25Definition of key operating metrics SmartRent regularly monitors a number of operating and financial metrics including the following non-GAAP financial measures which the Company believes are key measures of its growth, to evaluate its operating performance, identify trends affecting its business, formulate business plans, measure its progress and make strategic decisions. The Company’s Key Operating Metrics may not provide accurate predictions of future GAAP financial results. Units Deployed is defined as the aggregate number of the Company’s SmartHubs that have been installed (also including customer self- installations) as of a stated measurement date. The Company uses this operating metric to assess the general health and trajectory of its business growth. New Units Deployed is defined as the aggregate number of SmartHubs that have been installed (also including customer self-installations) during a stated measurement period. The Company uses this operating metric to assess the general health and trajectory of its business growth. Committed Units is defined as the aggregate number of SmartHubs that are subject to binding orders from customers together with units that existing customers who are parties to a SmartRent master services agreement have informed us (on a non-binding basis) that they intend to order in the future for deployment within two years of the measurement date. The Company tracks the number of committed units to assess the general health and trajectory of its business and to assist in its longer-term resource analysis. Units Booked is defined as the aggregate number of SmartHubs associated with binding orders executed during a stated measurement period. The Company utilizes the concept of Units Booked to assist in assessing near-term resource demand and the resulting approximate range of post-delivery revenue that it will earn and record. Units Booked represent binding orders only and accordingly are a subset of Committed Units. Annual Recurring Revenue (“ARR”) is defined as the annualized value of our recurring SaaS revenue earned in the current quarter. 25