Attached files
| file | filename |
|---|---|
| 8-K - FORM 8-K - ConnectOne Bancorp, Inc. | f8k_090821.htm |
Exhibit 99.1

CNOB September 2021 Investor Presentation
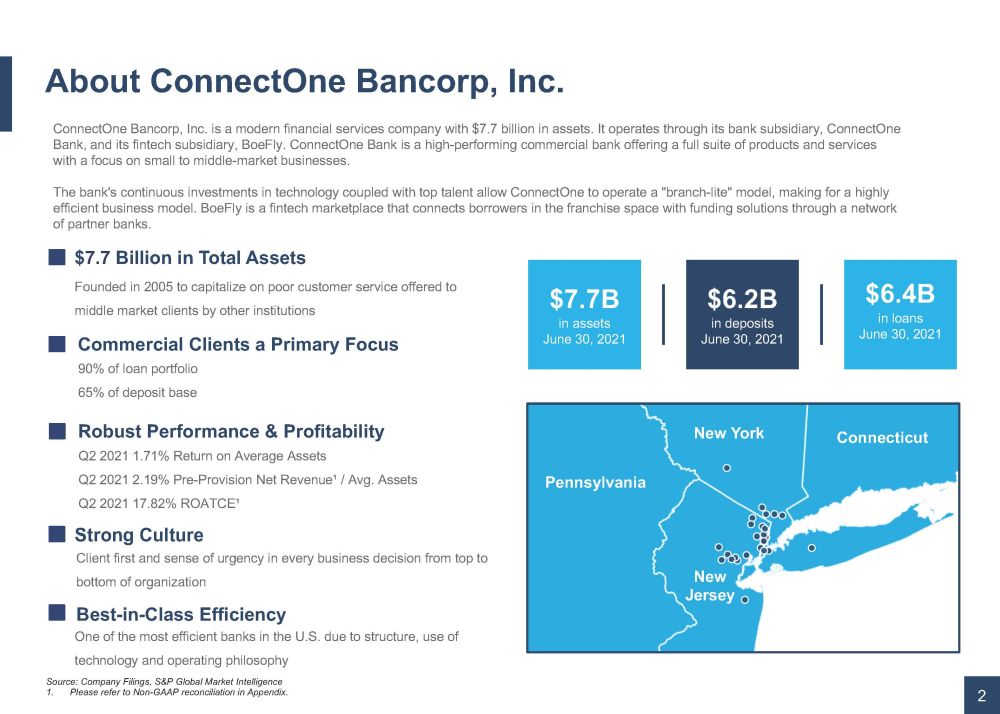
About ConnectOne Bancorp, Inc. Client first and sense of urgency in every business decision from top to bottom of organization Strong Culture Founde d in 2005 to capitalize on poor customer service offered to middle market clients by other institutions $ 7.7 Billion in Total Assets 2 One of the most efficient banks in the U.S. due to structure, use of technology and operating philosophy Best - in - Class Efficiency 90% of loan portfolio 65% of deposit base Commercial Clients a Primary Focus $7.7B in assets June 30, 2021 $6.2B in deposits June 30, 2021 $6.4B in loans June 30, 2021 ConnectOne Bancorp, Inc. is a modern financial services company with $7.7 billion in assets. It operates through its bank sub sid iary, ConnectOne Bank, and its fintech subsidiary, BoeFly. ConnectOne Bank is a high - performing commercial bank offering a full suite of products and services with a focus on small to middle - market businesses. The bank's continuous investments in technology coupled with top talent allow ConnectOne to operate a "branch - lite" model, makin g for a highly efficient business model. BoeFly is a fintech marketplace that connects borrowers in the franchise space with funding solutio ns through a network of partner banks. Q2 2021 1.71% Return on Average Assets Q2 2021 2.19% Pre - Provision Net Revenue¹ / Avg. Assets Q2 2021 17.82% ROATCE¹ Robust Performance & Profitability Pennsylvania Connecticut New York New Jersey Source: Company Filings, S&P Global Market Intelligence 1. Please refer to Non - GAAP reconciliation in Appendix.

High Operating Performance 3 2021 Q2 Financial Highlights 1. PPNR represents pre - tax net income excluding the impact of merger and restructuring charges and provision for loan losses. See appendix for a reconciliation of GAAP and non - GAAP measures. 2. As reported by S&P Global Intelligence 3. Excludes loans secured by taxi medallions 2.19% PPNR 1 as a % of average assets 1.72% Core Return on Assets 2 10.2% T1 Leverage Ratio 3.60% Net Interest Margin 38.0% Efficiency Ratio 0.43% Non - performing Asset Ratio 3 15.2% YoY TBV /Share Growth 17.82% Return on Tangible Common Equity

3.38% 3.45% 3.28% 3.35% 3.46% 3.56% 3.60% 3.40% 3.40% 3.40% 3.35% 3.09% 3.05% 2.99% 2016Y 2017Y 2018Y 2019Y 2020Y 1Q 21 2Q 21 CNOB Peers 4.43% 4.47% 4.68% 5.08% 4.80% 4.59% 4.58% 4.17% 4.29% 4.49% 4.87% 4.47% 4.23% 4.17% 0.84% 0.89% 1.29% 1.62% 1.08% 0.70% 0.61% 2016Y 2017Y 2018Y 2019Y 2020Y 1Q 21 2Q 21 Loans Interest-Earning Assets Cost of Funds 4 Strong Core Net Interest Margin Source: Company Filings, S&P Global Market Intelligence 1. Represents annualized metrics for the quarters ended March 31, 2021 and June 30, 2021, respectively. 2. Net Interest Margin and Interest - Earnings Assets are reflected on a fully taxable equivalent basis. 3. Peers include BHLB, BRKL, CUBI, EBTC, EGBN, FFIC, FLIC, INDB, LBAI, OCFC, PFS, PGC, SASR, UVSP & WASH. Strong Core NIM Well Positioned for Current Rate Environment Yields and Costs Net Interest Margin 3 1 3 1 1 1 2 Yield in

0.73% 0.93% 1.17% 1.22% 0.96% 1.78% 1.71% 0.90% 0.95% 1.07% 1.12% 0.82% 1.20% 1.20% 2016Y 2017Y 2018Y 2019Y 2020Y 1Q 21 2Q 21 CNOB Peers $11.96 $13.01 $14.42 $16.06 $17.49 $18.02 $18.76 2016Y 2017Y 2018Y 2019Y 2020Y 1Q 21 2Q 21 5 Robust Profitability and Capital Generation Source: Company Filings, S&P Global Market Intelligence Note: Please refer to Non - GAAP reconciliation in Appendix. . 1 As reported by S&P Global Market Intelligence, peers include BHLB , BRKL , CUBI , EBTC , EGBN , FFIC , FLIC, INDB , LBAI , OCFC , PFS , PGC , SASR , UVSP , and WASH. Tangible Book Value per Share Growth Return on Average Assets 1
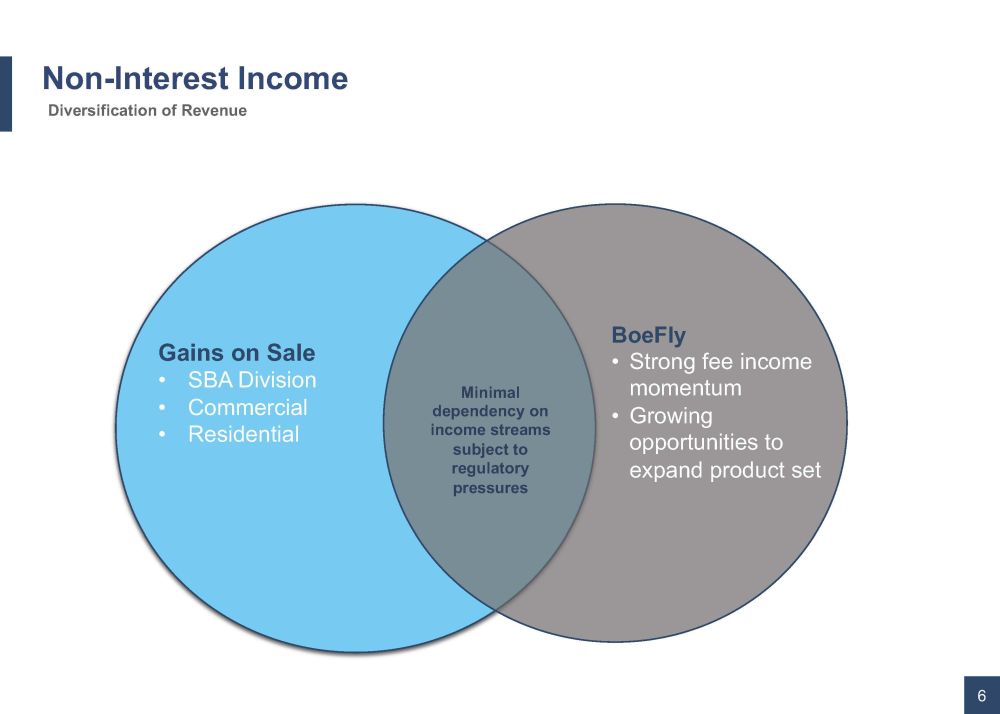
Non - Interest Income 6 Diversification of Revenue Gains on Sale • SBA Division • Commercial • Residential BoeFly • Strong fee income momentum • Growing opportunities to expand product set Minimal dependency on income streams subject to regulatory pressures

Project feasibility Developers background and expertise Strict loan to cost advances Rental fallback Plan and cost review Interest reserve Personal guarantees with reliance on liquidity Bank engineer oversight and inspection Leveraging technology using built software in the construction monitoring process 7 Diversified and Granular Loan Portfolio ($ in millions) Select Loan Portfolio Details as of June 30, 2021 $M % of Total Underwriting Standards $587 $1,915 $1,680 $1,625 10% 31% 28% 26% Segment Source: Company Filings, Regulatory Filings, and Company Designations Note: Numbers may not sum to 100% due to rounding. Total Loans is gross of unearned net origination fees and excludes PPP and loans he ld - for - sale. Principals well known in multifamily space Successful history of strong investments and management track record Loans stressed by: (i) interest rate +200bps and (ii) 10% vacancy Breakeven analysis on interest rate, vacancy and cap rate Current policy has floor of 5% cap rate Leverage proprietary underwriting; do not rely solely on borrower expense estimates Limiting cash out refinancing to a 65% LTV Principals well known in investment real estate industry with history of low vacancy projects Property well positioned for the rental market Breakeven analysis on interest rate, vacancy and cap rate Personal guarantees with reliance on liquidity Strong financial controls and well known accounting firm with satisfactory peer review Low leverage balance sheet with good liquidity ratios Proven profitability / strong profit margin in stable industry Personal guarantees with reliance on liquidity Covenant compliance tracking Other (e.g. 1 - 4 Family and Consumer): Total Loans: $6,095 $288 100% 5% Multifamily Business Loans Non - owner Occupied CRE Construction
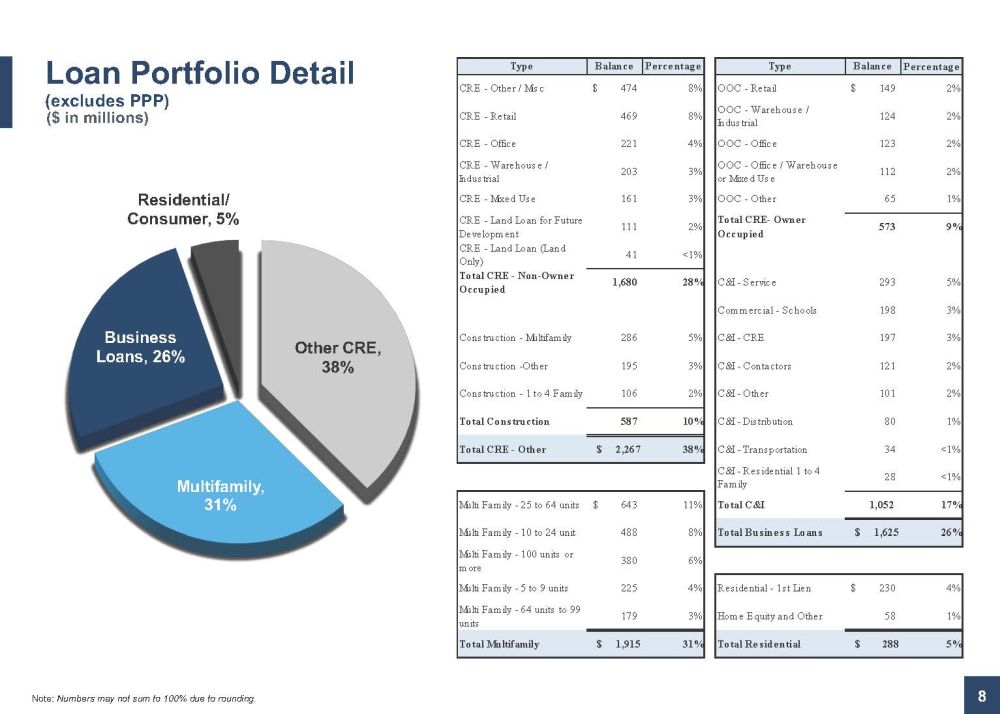
8 Loan Portfolio Detail (excludes PPP) ($ in millions) Note: Numbers may not sum to 100% due to rounding. Other CRE , 38% Multifamily , 31% Business Loans , 26% Residential/ Consumer , 5% Type Balance Percentage Type Balance Percentage CRE - Other / Misc 474$ 8% OOC - Retail 149$ 2% CRE - Retail 469 8% OOC - Warehouse / Industrial 124 2% CRE - Office 221 4% OOC - Office 123 2% CRE - Warehouse / Industrial 203 3% OOC - Office / Warehouse or Mixed Use 112 2% CRE - Mixed Use 161 3% OOC - Other 65 1% CRE - Land Loan for Future Development 111 2% Total CRE- Owner Occupied 573 9% CRE - Land Loan (Land Only) 41 <1% Total CRE - Non-Owner Occupied 1,680 28% C&I - Service 293 5% Commercial - Schools 198 3% Construction - Multifamily 286 5% C&I - CRE 197 3% Construction -Other 195 3% C&I - Contactors 121 2% Construction - 1 to 4 Family 106 2% C&I - Other 101 2% Total Construction 587 10% C&I - Distribution 80 1% Total CRE - Other $ 2,267 38% C&I - Transportation 34 <1% C&I - Residential 1 to 4 Family 28 <1% Multi Family - 25 to 64 units 643$ 11% Total C&I 1,052 17% Multi Family - 10 to 24 unit 488 8% Total Business Loans $ 1,625 26% Multi Family - 100 units or more 380 6% Multi Family - 5 to 9 units 225 4% Residential - 1st Lien 230$ 4% Multi Family - 64 units to 99 units 179 3% Home Equity and Other 58 1% Total Multifamily $ 1,915 31% Total Residential $ 288 5%
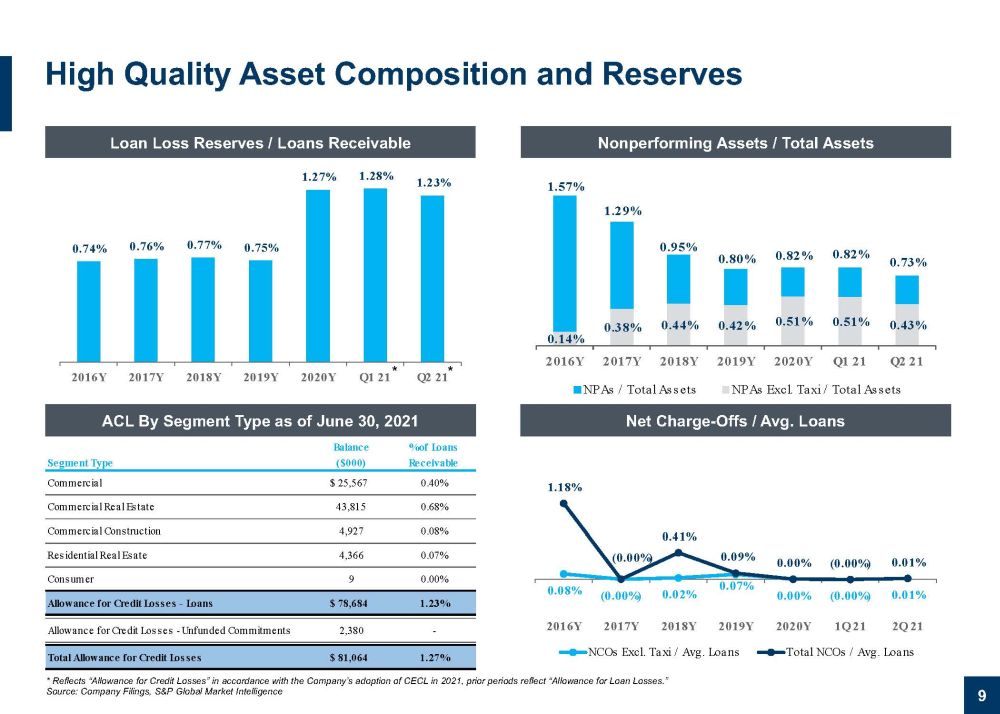
0.74% 0.76% 0.77% 0.75% 1.27% 1.28% 1.23% 2016Y 2017Y 2018Y 2019Y 2020Y Q1 21 Q2 21 9 High Quality Asset Composition and Reserves Nonperforming Assets / Total Assets Net Charge - Offs / Avg. Loans Loan Loss Reserves / Loans Receivable ACL By Segment Type as of June 30, 2021 1.57% 1.29% 0.95% 0.80% 0.82% 0.82% 0.73% 0.14% 0.38% 0.44% 0.42% 0.51% 0.51% 0.43% 2016Y 2017Y 2018Y 2019Y 2020Y Q1 21 Q2 21 NPAs / Total Assets NPAs Excl. Taxi / Total Assets Balance % of Loans Segment Type ($000) Receivable Commercial $ 25,567 0.40% Commercial Real Estate 43,815 0.68% Commercial Construction 4,927 0.08% Residential Real Esate 4,366 0.07% Consumer 9 0.00% Allowance for Credit Losses - Loans $ 78,684 1.23% Allowance for Credit Losses - Unfunded Commitments 2,380 - Total Allowance for Credit Losses $ 81,064 1.27% * Reflects “Allowance for Credit Losses” in accordance with the Company’s adoption of CECL in 2021, prior periods reflect “Al low ance for Loan Losses.” Source: Company Filings, S&P Global Market Intelligence * * 0.08% (0.00%) 0.02% 0.07% 0.00% (0.00%) 0.01% 1.18% (0.00%) 0.41% 0.09% 0.00% (0.00%) 0.01% 2016Y 2017Y 2018Y 2019Y 2020Y 1Q 21 2Q 21 NCOs Excl. Taxi / Avg. Loans Total NCOs / Avg. Loans
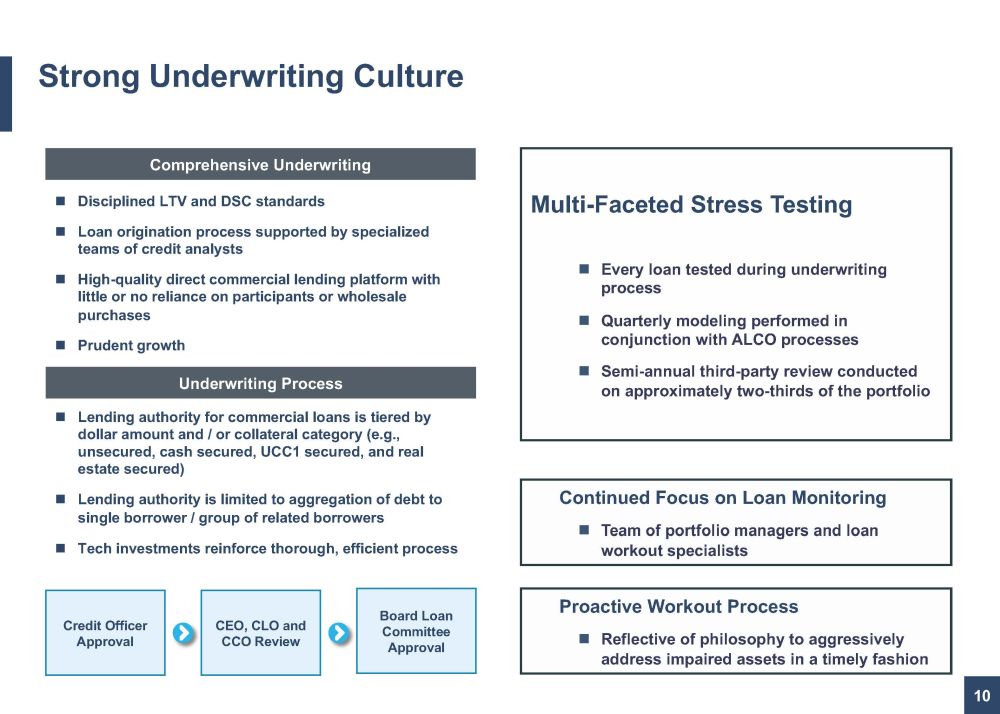
10 Strong Underwriting Culture Disciplined LTV and DSC standards Loan origination process supported by specialized teams of credit analysts High - quality direct commercial lending platform with little or no reliance on participants or wholesale purchases Prudent growth Multi - Faceted Stress Testing Every loan tested during underwriting process Quarterly modeling performed in conjunction with ALCO processes Semi - annual third - party review conducted on approximately two - thirds of the portfolio Continued Focus on Loan Monitoring Team of portfolio managers and loan workout specialists Proactive Workout Process Reflective of philosophy to aggressively address impaired assets in a timely fashion Underwriting Process Lending authority for commercial loans is tiered by dollar amount and / or collateral category (e.g., unsecured, cash secured, UCC1 secured, and real estate secured) Lending authority is limited to aggregation of debt to single borrower / group of related borrowers Tech investments reinforce thorough, efficient process Credit Officer Approval CEO, CLO and CCO Review Board Loan Committee Approval Comprehensive Underwriting

11 ($ in millions) Source: Company Information and Company Designations As of June 30, 2021 loan deferments represent under 2% of total loans, down ~90% from June 30, 2020 We continue to expect loans to migrate off deferment status over the remaining course of 2021 95% of the June 30, 2021 loan deferrals are well secured by collateral The Company was an early and active participant in the Paycheck Protection Program (“PPP”) originating a total of ~$670mm in loans, which as of June 30, 2021, was down to $327mm COVID - 19 CARES Act Deferrals Total Deferrals as of June 30, 2020 Total Deferrals as of June 30, 2021 Commentary Loan Type # $ % of Loans Commercial Real Estate 15 $ 51 0.8% Multifamily 5 32 0.5% 1-4 Family Residential 0 0 0.0% Construction & Development 0 0 0.0% Commercial & Industrial 59 17 0.3% Other 0 0 0.0% Total 79 $ 100 1.6% Loan Type # $ % of Loans Commercial Real Estate 273 $ 525 8.2% Multifamily 58 163 2.6% 1-4 Family Residential 82 43 0.7% Construction & Development 15 74 1.2% Commercial & Industrial 126 123 1.9% Other 21 9 0.2% Total 575 $ 937 14.7%
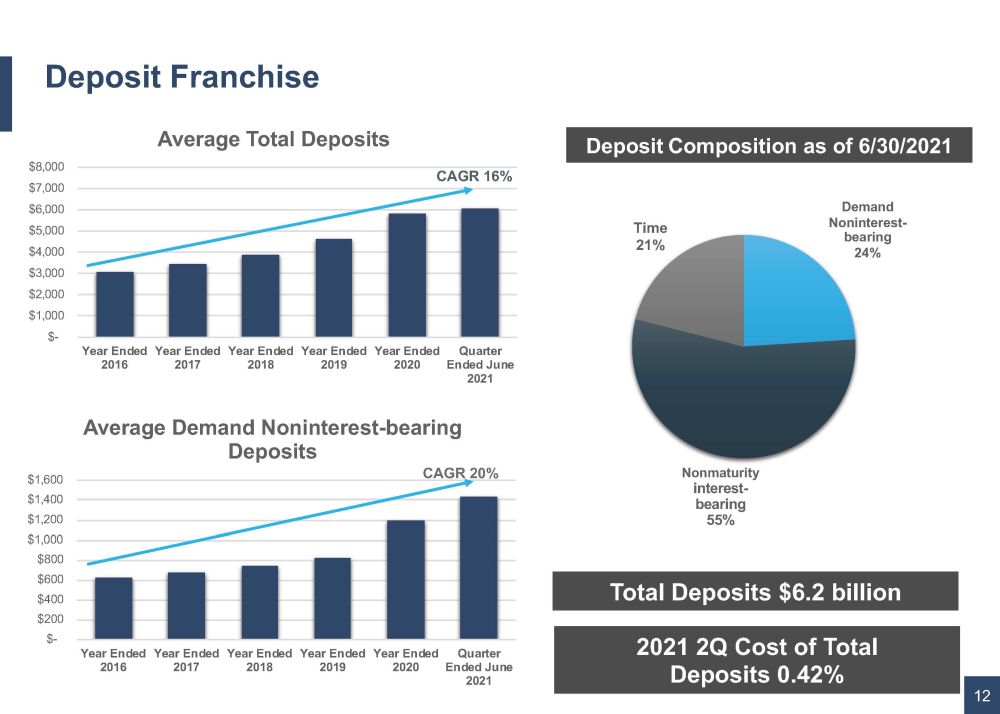
Deposit Franchise 12 Deposit Composition as of 6/30/2021 Total Deposits $6.2 billion 2021 2Q Cost of Total Deposits 0.42% Demand Noninterest - bearing 24% Nonmaturity interest - bearing 55% Time 21% $- $1,000 $2,000 $3,000 $4,000 $5,000 $6,000 $7,000 $8,000 Year Ended 2016 Year Ended 2017 Year Ended 2018 Year Ended 2019 Year Ended 2020 Quarter Ended June 2021 Average Total Deposits CAGR 16% $- $200 $400 $600 $800 $1,000 $1,200 $1,400 $1,600 Year Ended 2016 Year Ended 2017 Year Ended 2018 Year Ended 2019 Year Ended 2020 Quarter Ended June 2021 Average Demand Noninterest - bearing Deposits CAGR 20%
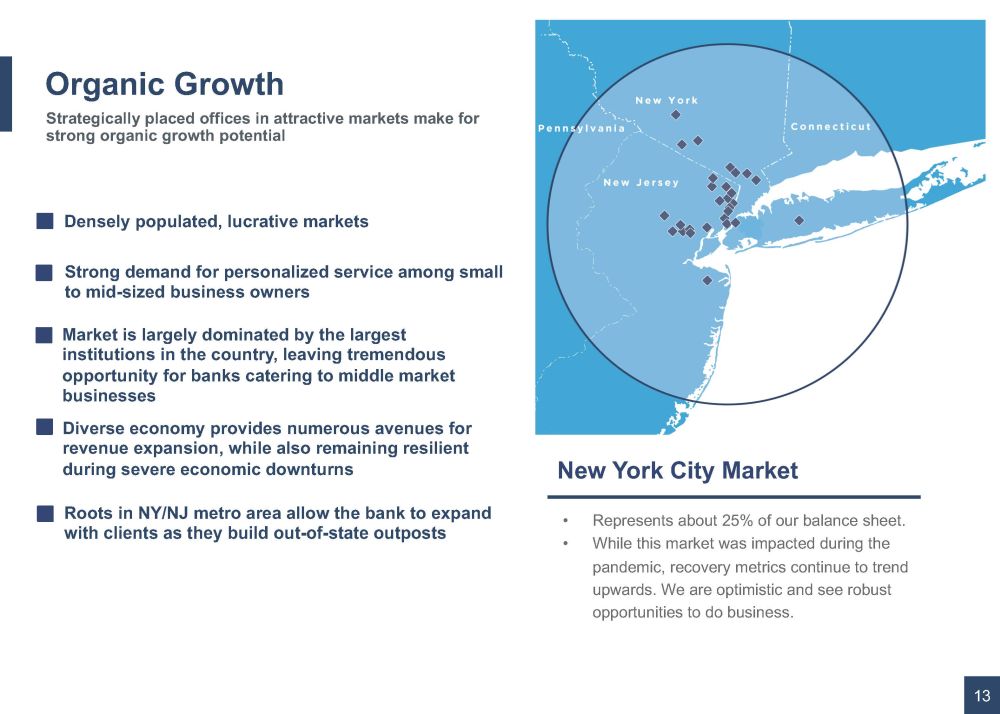
Organic Growth Strategically placed offices in attractive markets make for strong organic growth potential 13 Market is largely dominated by the largest institutions in the country, leaving tremendous opportunity for banks catering to middle market businesses New York City Market Densely populated, lucrative markets Strong demand for personalized service among small to mid - sized business owners • Represents about 25% of our balance sheet. • While this market was impacted during the pandemic, recovery metrics continue to trend upwards. We are optimistic and see robust opportunities to do business. Diverse economy provides numerous avenues for revenue expansion, while also remaining resilient during severe economic downturns Roots in NY/NJ metro area allow the bank to expand with clients as they build out - of - state outposts
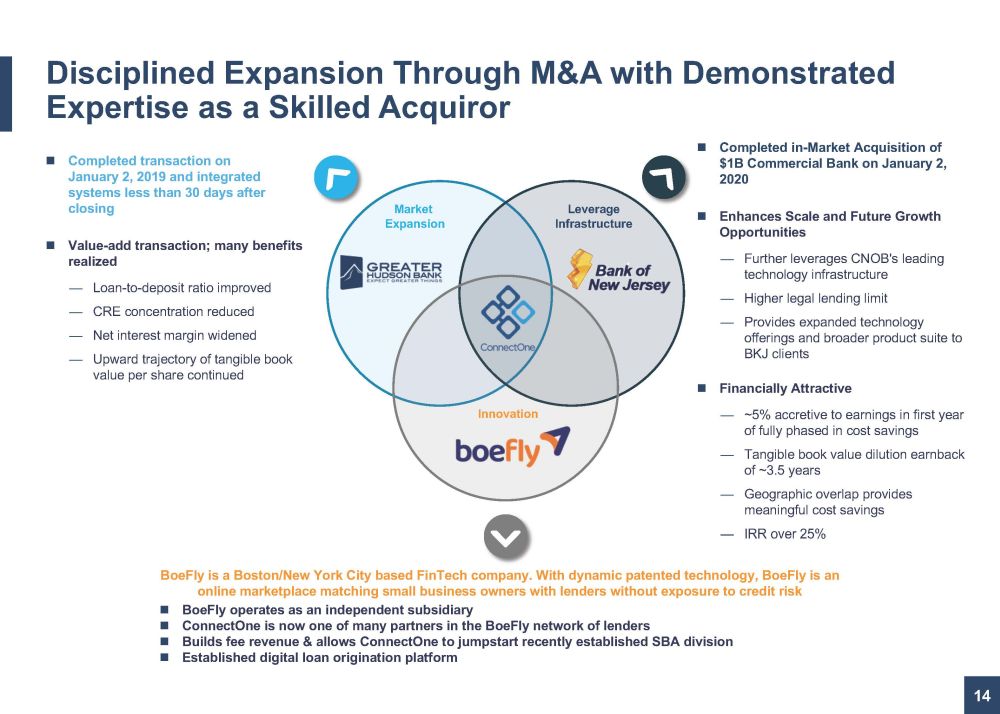
14 Completed transaction on January 2, 2019 and integrated systems less than 30 days after closing Value - add transaction; many benefits realized — Loan - to - deposit ratio improved — CRE concentration reduced — Net interest margin widened — Upward trajectory of tangible book value per share continued Completed in - Market Acquisition of $1B Commercial Bank on January 2, 2020 Enhances Scale and Future Growth Opportunities — Further leverages CNOB's leading technology infrastructure — Higher legal lending limit — Provides expanded technology offerings and broader product suite to BKJ clients Financially Attractive — ~5% accretive to earnings in first year of fully phased in cost savings — Tangible book value dilution earnback of ~3.5 years — Geographic overlap provides meaningful cost savings — IRR over 25% BoeFly is a Boston/New York City based FinTech company. With dynamic patented technology, BoeFly is an online marketplace matching small business owners with lenders without exposure to credit risk BoeFly operates as an independent subsidiary ConnectOne is now one of many partners in the BoeFly network of lenders Builds fee revenue & allows ConnectOne to jumpstart recently established SBA division Established digital loan origination platform Leverage Infrastructure Market Expansion Innovation Disciplined Expansion Through M&A with Demonstrated Expertise as a Skilled Acquiror
15 Active M&A Environment Opportunities in Market Disruption Talent • We’ve experienced increased success in attracting revenue generating talent . • Due to disruption , individuals are seeking out ConnectOne. New Business • The opportunity to pick up clients who have been displaced by transactions creates an opportunity for ConnectOne to accelerate our organic growth . New Markets • New team memebers coupled with new business allows us to expand our reach into new markets .
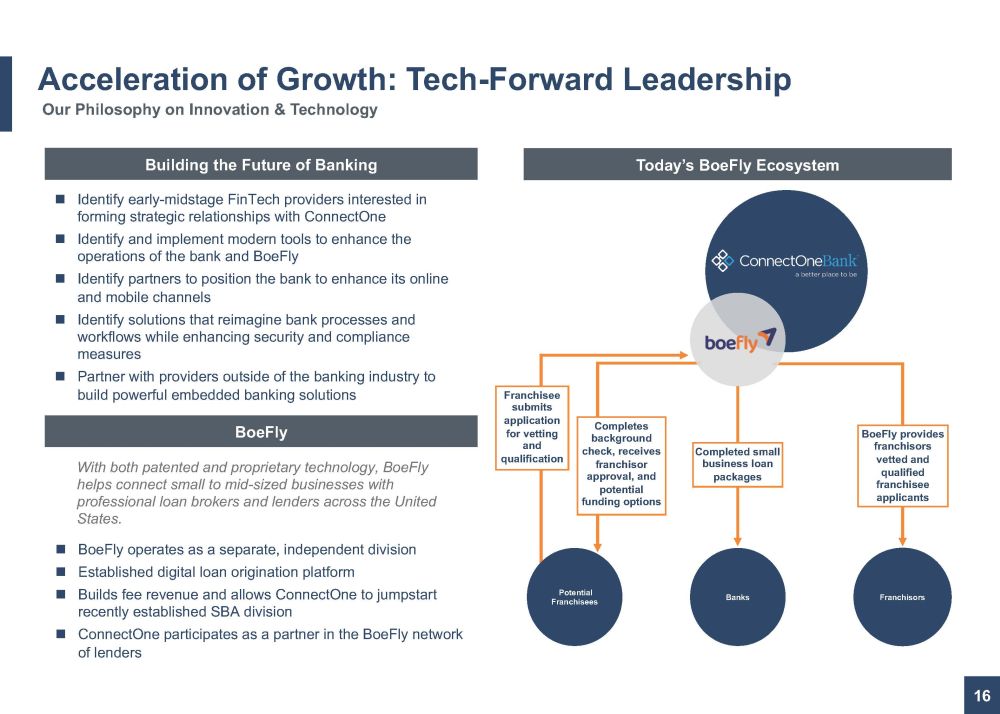
16 Acceleration of Growth: Tech - Forward Leadership Franchisors Banks Potential Franchisees Completed small business loan packages Building the Future of Banking Identify early - midstage FinTech providers interested in forming strategic relationships with ConnectOne Identify and implement modern tools to enhance the operations of the bank and BoeFly Identify partners to position the bank to enhance its online and mobile channels Identify solutions that reimagine bank processes and workflows while enhancing security and compliance measures Partner with providers outside of the banking industry to build powerful embedded banking solutions BoeFly BoeFly operates as a separate, independent division Established digital loan origination platform Builds fee revenue and allows ConnectOne to jumpstart recently established SBA division ConnectOne participates as a partner in the BoeFly network of lenders With both patented and proprietary technology, BoeFly helps connect small to mid - sized businesses with professional loan brokers and lenders across the United States. Our Philosophy on Innovation & Technology Today’s BoeFly Ecosystem BoeFly provides franchisors vetted and qualified franchisee applicants Completes background check, receives franchisor approval, and potential funding options Franchisee submits application for vetting and qualification

41.4% 40.1% 41.4% 41.9% 40.9% 39.1% 59.0% 55.8% 54.8% 54.9% 56.4% 55.5% 1.35% 1.34% 1.32% 1.36% 1.39% 1.38% 2.08% 2.10% 2.10% 2.09% 1.92% 1.88% 2016Y 2017Y 2018Y 2019Y 2020Y YTD 2Q 21 CNOB Efficiency Ratio Peers Efficiency Ratio CNOB Operating NIE / Avg. Assets Peers Operating NIE / Avg. Assets One of the Best Efficiency Ratios in the Industry 17 Best - In - Class Efficiency Historical Operating Performance Historical Operating Performance Locations utilize technology to serve as “business hubs” supporting clients beyond geographic footprint $ 18.1 M Assets Per Employee Efficiency ratio includes investments in infrastructure to propel the franchise past $10B Source: Company Filings, S&P Global Market Intelligence Note: Please refer to Non - GAAP reconciliation in Appendix. 1 CNOB disclosed Operating Efficiency Ratio and Operating NIE / Avg. Assets. 2 Efficiency Ratio and Noninterest Expense / Avg. Assets as reported by S&P Global Market Intelligence. Peers include BHLB, BRK L, CUBI, EBTC, EGBN, FFIC, FLIC, INDB, LBAI, OCFC, PFS, PGC, SASR, UVSP, and WASH. 1 2 3 2 3
Strategy & Vision 18 Consistent Financial Performance - Among Best - in - Class Solid Credit Culture with Disciplined Lending Philosophy Track Record of Superior Organic Growth Financially Prudent Acquiror and Experienced & Efficient Merger Integrator Benefitting from Current Industry Consolidation and Disruption Capital Strength and Flexibility, Enhanced Further Through Preferred Offering Committed to Future State of Banking, Technology and Operational Efficiency CNOB : A Compelling Investment Opportunity
19
Appendix
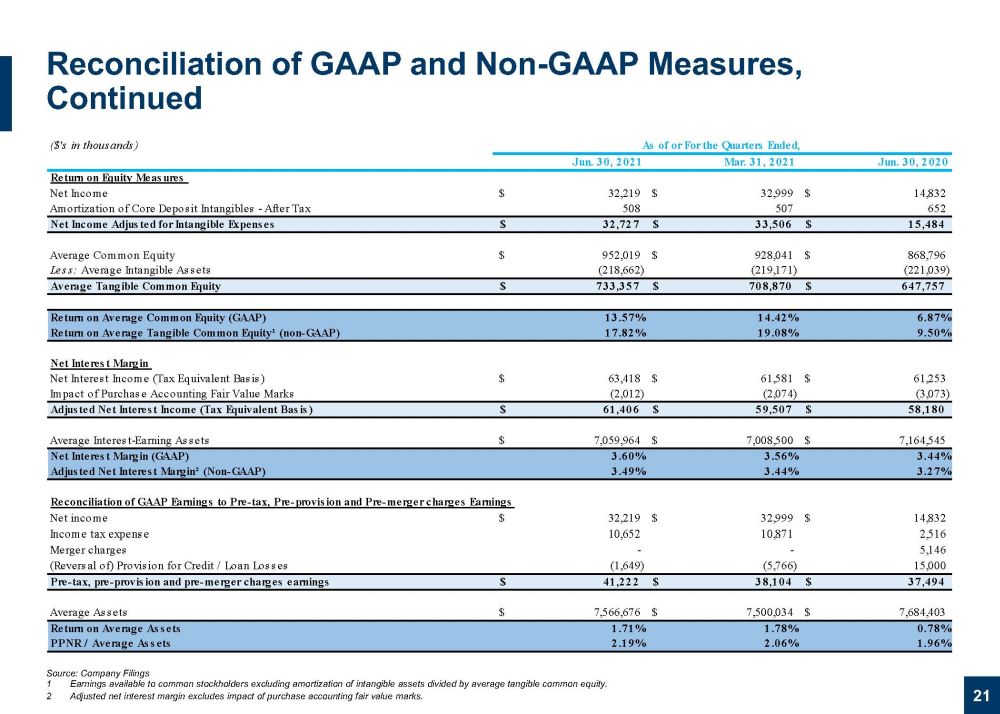
Reconciliation of GAAP and Non - GAAP Measures, Continued 21 Source: Company Filings 1 Earnings available to common stockholders excluding amortization of intangible assets divided by average tangible common equi ty. 2 Adjusted net interest margin excludes impact of purchase accounting fair value marks. ($'s in thousands) As of or For the Quarters Ended, Jun. 30, 2021 Mar. 31, 2021 Jun. 30, 2020 Return on Equity Measures Net Income 32,219$ 32,999$ 14,832$ Amortization of Core Deposit Intangibles - After Tax 508 507 652 Net Income Adjusted for Intangible Expenses 32,727$ 33,506$ 15,484$ Average Common Equity 952,019$ 928,041$ 868,796$ Less: Average Intangible Assets (218,662) (219,171) (221,039) Average Tangible Common Equity 733,357$ 708,870$ 647,757$ Return on Average Common Equity (GAAP) 13.57% 14.42% 6.87% Return on Average Tangible Common Equity¹ (non-GAAP) 17.82% 19.08% 9.50% Net Interest Margin Net Interest Income (Tax Equivalent Basis) 63,418$ 61,581$ 61,253$ Impact of Purchase Accounting Fair Value Marks (2,012) (2,074) (3,073) Adjusted Net Interest Income (Tax Equivalent Basis) 61,406$ 59,507$ 58,180$ Average Interest-Earning Assets 7,059,964$ 7,008,500$ 7,164,545$ Net Interest Margin (GAAP) 3.60% 3.56% 3.44% Adjusted Net Interest Margin² (Non-GAAP) 3.49% 3.44% 3.27% Reconciliation of GAAP Earnings to Pre-tax, Pre-provision and Pre-merger charges Earnings Net income 32,219$ 32,999$ 14,832$ Income tax expense 10,652 10,871 2,516 Merger charges - - 5,146 (Reversal of) Provision for Credit / Loan Losses (1,649) (5,766) 15,000 Pre-tax, pre-provision and pre-merger charges earnings 41,222$ 38,104$ 37,494$ Average Assets 7,566,676$ 7,500,034$ 7,684,403$ Return on Average Assets 1.71% 1.78% 0.78% PPNR / Average Assets 2.19% 2.06% 1.96%
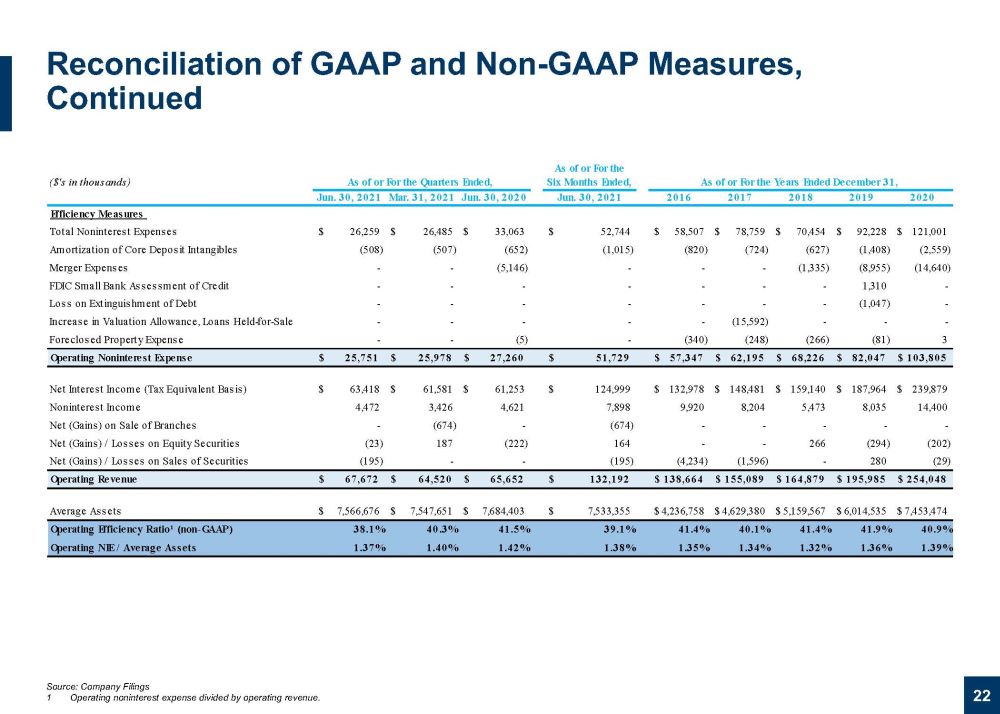
As of or For the ($'s in thousands) As of or For the Quarters Ended, Six Months Ended, As of or For the Years Ended December 31, Jun. 30, 2021 Mar. 31, 2021 Jun. 30, 2020 Jun. 30, 2021 2016 2017 2018 2019 2020 Efficiency Measures Total Noninterest Expenses 26,259$ 26,485$ 33,063$ 52,744$ 58,507$ 78,759$ 70,454$ 92,228$ 121,001$ Amortization of Core Deposit Intangibles (508) (507) (652) (1,015) (820) (724) (627) (1,408) (2,559) Merger Expenses - - (5,146) - - - (1,335) (8,955) (14,640) FDIC Small Bank Assessment of Credit - - - - - - - 1,310 - Loss on Extinguishment of Debt - - - - - - - (1,047) - Increase in Valuation Allowance, Loans Held-for-Sale - - - - - (15,592) - - - Foreclosed Property Expense - - (5) - (340) (248) (266) (81) 3 Operating Noninterest Expense 25,751$ 25,978$ 27,260$ 51,729$ 57,347$ 62,195$ 68,226$ 82,047$ 103,805$ Net Interest Income (Tax Equivalent Basis) 63,418$ 61,581$ 61,253$ 124,999$ 132,978$ 148,481$ 159,140$ 187,964$ 239,879$ Noninterest Income 4,472 3,426 4,621 7,898 9,920 8,204 5,473 8,035 14,400 Net (Gains) on Sale of Branches - (674) - (674) - - - - - Net (Gains) / Losses on Equity Securities (23) 187 (222) 164 - - 266 (294) (202) Net (Gains) / Losses on Sales of Securities (195) - - (195) (4,234) (1,596) - 280 (29) Operating Revenue 67,672$ 64,520$ 65,652$ 132,192$ 138,664$ 155,089$ 164,879$ 195,985$ 254,048$ Average Assets 7,566,676$ 7,547,651$ 7,684,403$ 7,533,355$ 4,236,758$ 4,629,380$ 5,159,567$ 6,014,535$ 7,453,474$ Operating Efficiency Ratio¹ (non-GAAP) 38.1% 40.3% 41.5% 39.1% 41.4% 40.1% 41.4% 41.9% 40.9% Operating NIE / Average Assets 1.37% 1.40% 1.42% 1.38% 1.35% 1.34% 1.32% 1.36% 1.39% Reconciliation of GAAP and Non - GAAP Measures, Continued 22 Source: Company Filings 1 Operating noninterest expense divided by operating revenue.
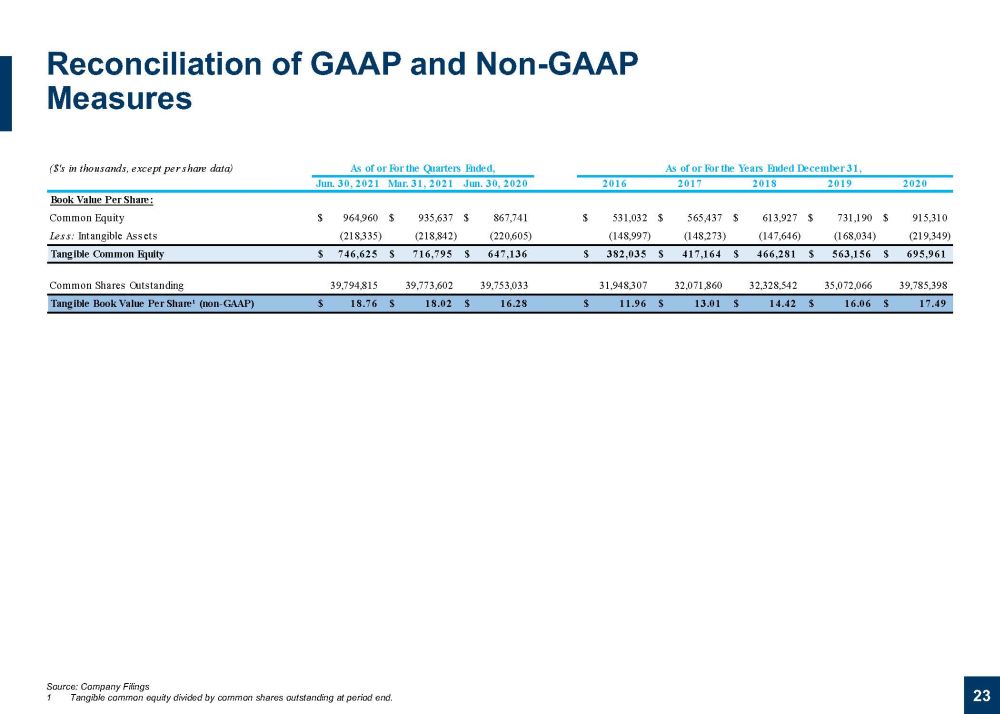
($'s in thousands, except per share data) As of or For the Quarters Ended, As of or For the Years Ended December 31, Jun. 30, 2021 Mar. 31, 2021 Jun. 30, 2020 2016 2017 2018 2019 2020 Book Value Per Share: Common Equity 964,960$ 935,637$ 867,741$ 531,032$ 565,437$ 613,927$ 731,190$ 915,310$ Less: Intangible Assets (218,335) (218,842) (220,605) (148,997) (148,273) (147,646) (168,034) (219,349) Tangible Common Equity 746,625$ 716,795$ 647,136$ 382,035$ 417,164$ 466,281$ 563,156$ 695,961$ Common Shares Outstanding 39,794,815 39,773,602 39,753,033 31,948,307 32,071,860 32,328,542 35,072,066 39,785,398 Tangible Book Value Per Share¹ (non-GAAP) 18.76$ 18.02$ 16.28$ 11.96$ 13.01$ 14.42$ 16.06$ 17.49$ Reconciliation of GAAP and Non - GAAP Measures 23 Source: Company Filings 1 Tangible common equity divided by common shares outstanding at period end.
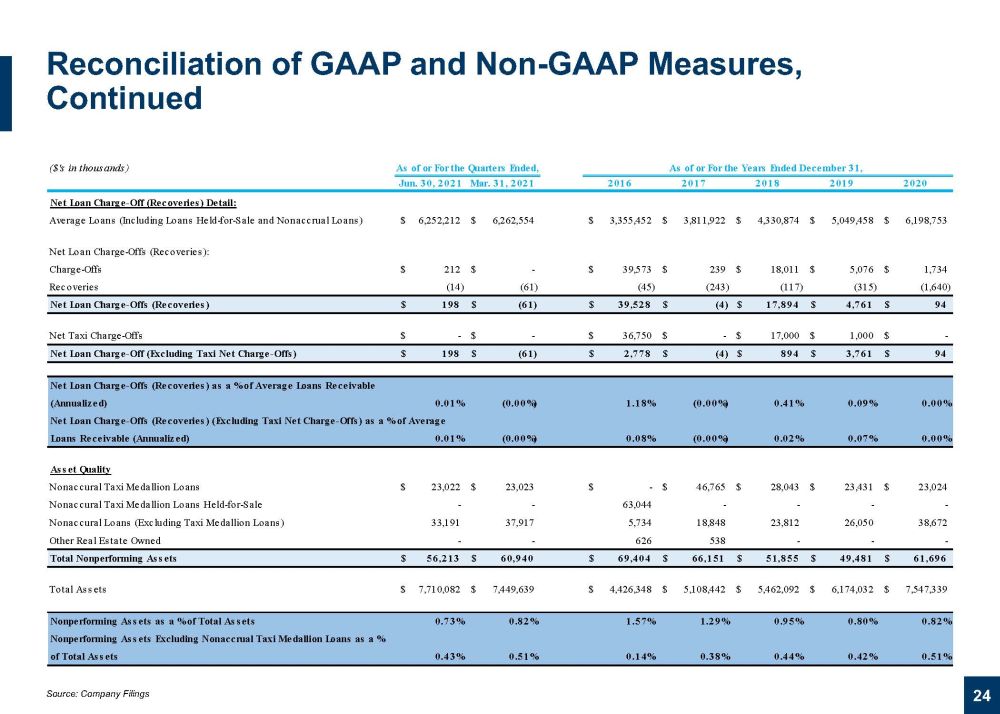
Reconciliation of GAAP and Non - GAAP Measures, Continued 24 Source: Company Filings ($'s in thousands) As of or For the Quarters Ended, As of or For the Years Ended December 31, Jun. 30, 2021 Mar. 31, 2021 2016 2017 2018 2019 2020 Net Loan Charge-Off (Recoveries) Detail: Average Loans (Including Loans Held-for-Sale and Nonaccrual Loans) 6,252,212$ 6,262,554$ 3,355,452$ 3,811,922$ 4,330,874$ 5,049,458$ 6,198,753$ Net Loan Charge-Offs (Recoveries): Charge-Offs 212$ -$ 39,573$ 239$ 18,011$ 5,076$ 1,734$ Recoveries (14) (61) (45) (243) (117) (315) (1,640) Net Loan Charge-Offs (Recoveries) 198$ (61)$ 39,528$ (4)$ 17,894$ 4,761$ 94$ Net Taxi Charge-Offs -$ -$ 36,750$ -$ 17,000$ 1,000$ -$ Net Loan Charge-Off (Excluding Taxi Net Charge-Offs) 198$ (61)$ 2,778$ (4)$ 894$ 3,761$ 94$ Net Loan Charge-Offs (Recoveries) as a % of Average Loans Receivable (Annualized) 0.01% (0.00%) 1.18% (0.00%) 0.41% 0.09% 0.00% Net Loan Charge-Offs (Recoveries) (Excluding Taxi Net Charge-Offs) as a % of Average Loans Receivable (Annualized) 0.01% (0.00%) 0.08% (0.00%) 0.02% 0.07% 0.00% Asset Quality Nonaccural Taxi Medallion Loans 23,022$ 23,023$ -$ 46,765$ 28,043$ 23,431$ 23,024$ Nonaccural Taxi Medallion Loans Held-for-Sale - - 63,044 - - - - Nonaccural Loans (Excluding Taxi Medallion Loans) 33,191 37,917 5,734 18,848 23,812 26,050 38,672 Other Real Estate Owned - - 626 538 - - - Total Nonperforming Assets 56,213$ 60,940$ 69,404$ 66,151$ 51,855$ 49,481$ 61,696$ Total Assets 7,710,082$ 7,449,639$ 4,426,348$ 5,108,442$ 5,462,092$ 6,174,032$ 7,547,339$ Nonperforming Assets as a % of Total Assets 0.73% 0.82% 1.57% 1.29% 0.95% 0.80% 0.82% Nonperforming Assets Excluding Nonaccrual Taxi Medallion Loans as a % of Total Assets 0.43% 0.51% 0.14% 0.38% 0.44% 0.42% 0.51%