Attached files
| file | filename |
|---|---|
| 8-K - CTBI SEPTEMBER 2021 INVESTOR PRESENTATION 8-K - COMMUNITY TRUST BANCORP INC /KY/ | ctbi0921invpres8k.htm |
Exhibit 99.1
Cautionary Statement Information provided herein by CTBI contains “forward-looking” information. CTBI
cautions that any forward-looking statements made are not guarantees of future performance and that actual results may differ materially from those in the forward-looking statements. Please refer to CTBI’s 2020 Annual Report on Form 10-K,
Cautionary Statement Regarding Forward Looking Statements for additional information. 2
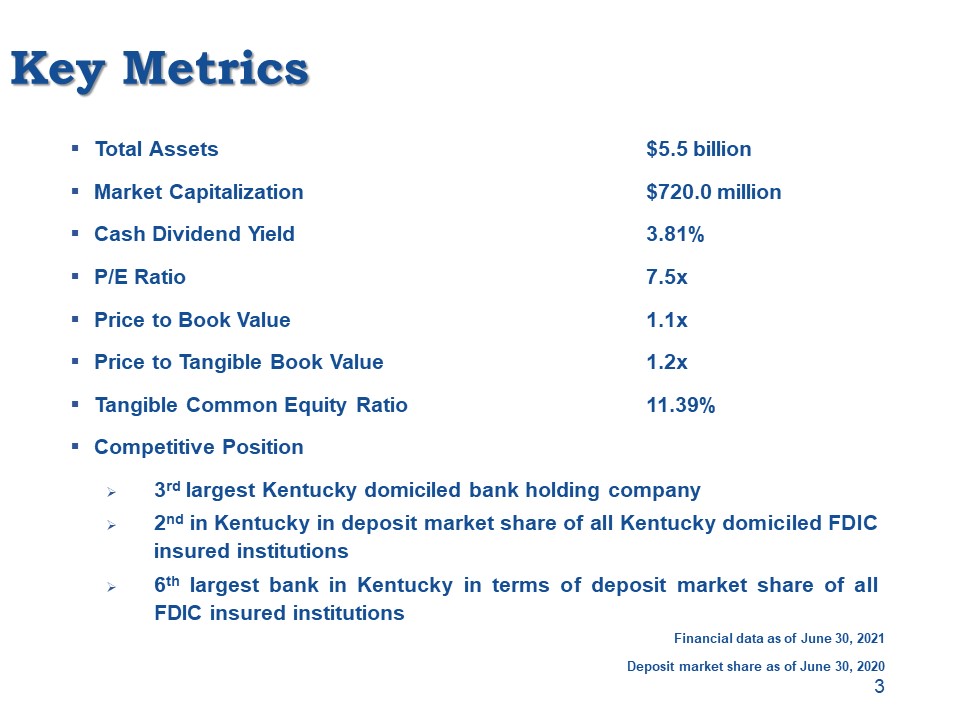
Key Metrics Total Assets $5.5 billionMarket Capitalization $720.0 millionCash Dividend Yield 3.81%P/E
Ratio 7.5xPrice to Book Value 1.1xPrice to Tangible Book Value 1.2xTangible Common Equity Ratio 11.39%Competitive Position3rd largest Kentucky domiciled bank holding company 2nd in Kentucky in deposit market share of all Kentucky domiciled FDIC
insured institutions 6th largest bank in Kentucky in terms of deposit market share of all FDIC insured institutions Financial data as of June 30, 2021Deposit market share as of June 30, 2020 3
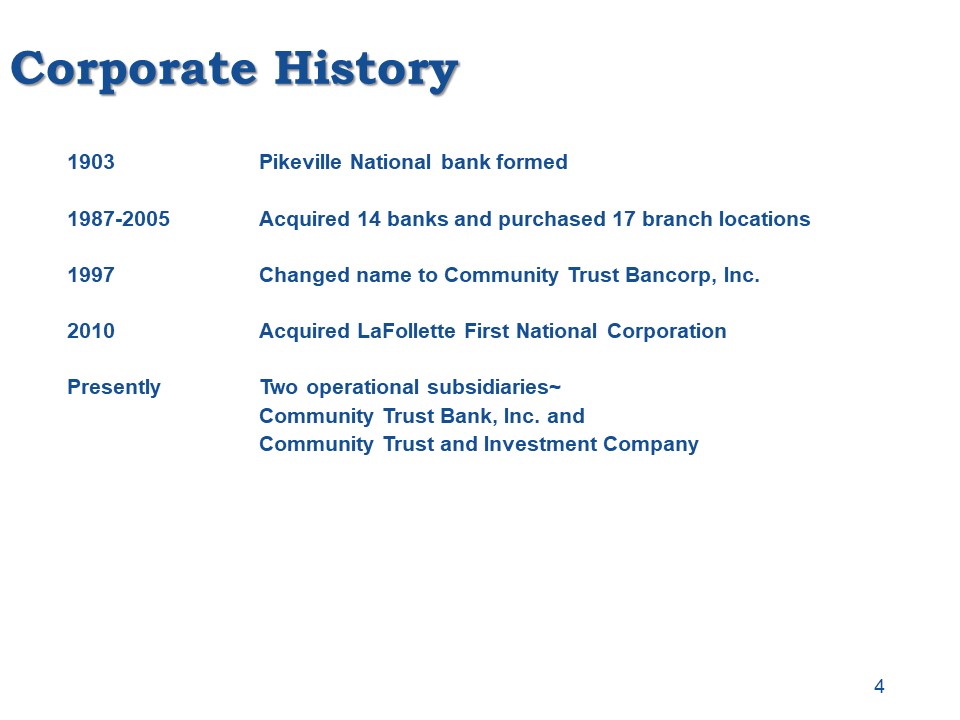
Corporate History 1903 Pikeville National bank formed1987-2005 Acquired 14 banks and purchased 17 branch
locations1997 Changed name to Community Trust Bancorp, Inc.2010 Acquired LaFollette First National CorporationPresently Two operational subsidiaries~ Community Trust Bank, Inc. and Community Trust and Investment Company 4
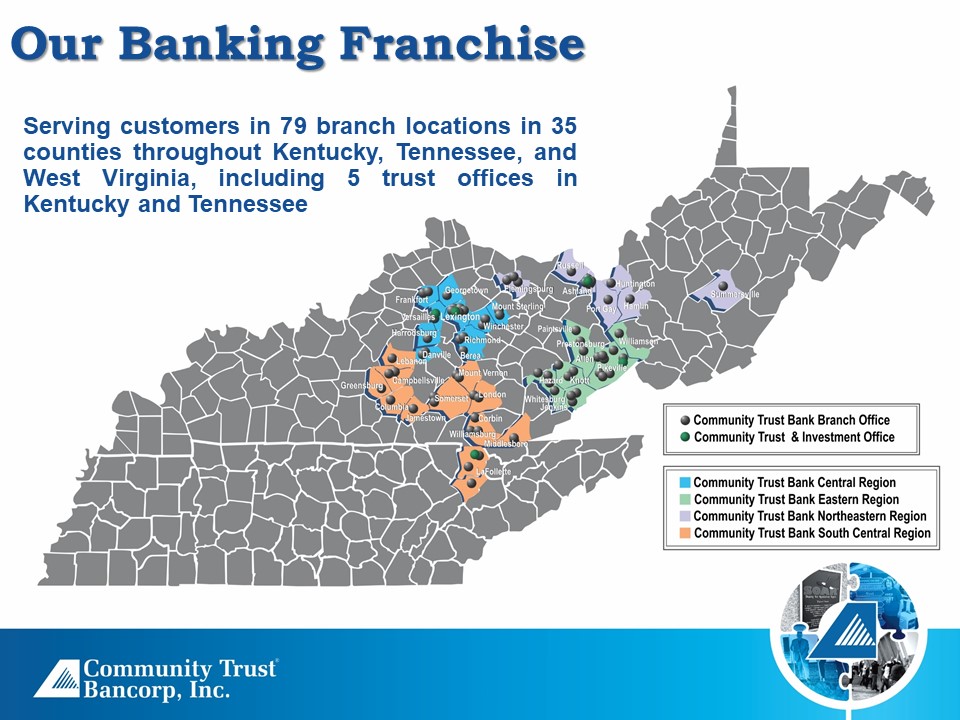
Our Banking Franchise Serving customers in 79 branch locations in 35 counties throughout Kentucky,
Tennessee, and West Virginia, including 5 trust offices in Kentucky and Tennessee
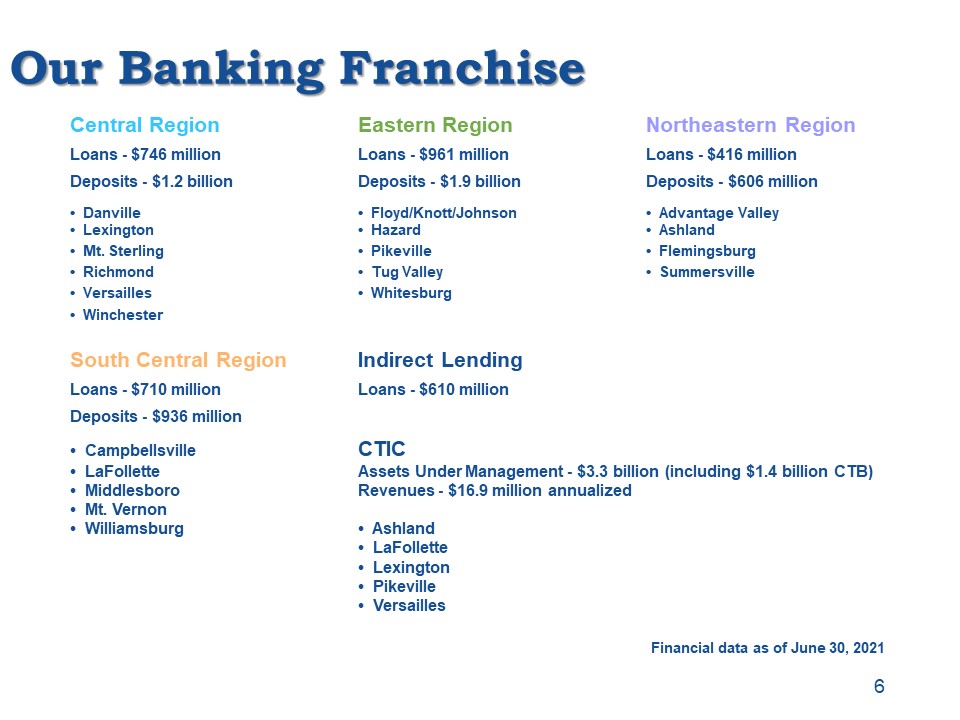
Our Banking Franchise Central Region Eastern Region Northeastern RegionLoans - $746 million Loans - $961
million Loans - $416 millionDeposits - $1.2 billion Deposits - $1.9 billion Deposits - $606 million• Danville • Floyd/Knott/Johnson • Advantage Valley• Lexington • Hazard • Ashland• Mt. Sterling • Pikeville • Flemingsburg• Richmond • Tug Valley
• Summersville• Versailles • Whitesburg• WinchesterSouth Central Region Indirect LendingLoans - $710 million Loans - $610 million Deposits - $936 million• Campbellsville CTIC• LaFollette Assets Under Management - $3.3 billion (including $1.4
billion CTB)• Middlesboro Revenues - $16.9 million annualized• Mt. Vernon • Williamsburg • Ashland • LaFollette • Lexington • Pikeville • Versailles Financial data as of June 30, 2021 6
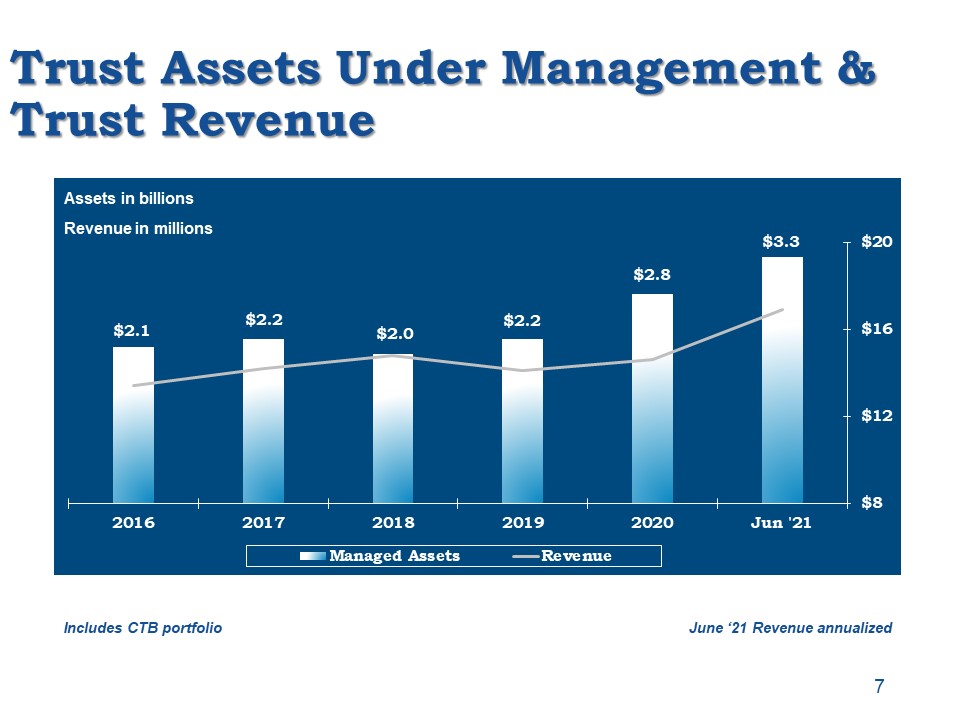
Trust Assets Under Management & Trust Revenue Includes CTB portfolio Assets in billionsRevenue in
millions 7 June ‘21 Revenue annualized
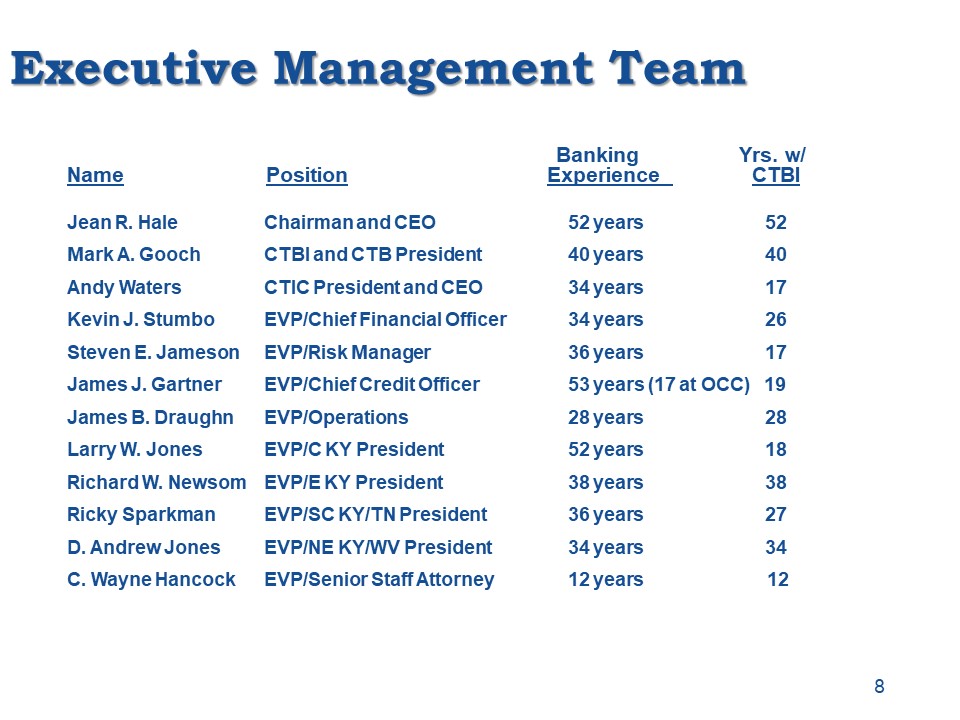
Executive Management Team Banking Yrs. w/Name Position Experience CTBIJean R. Hale Chairman and CEO 52
years 52Mark A. Gooch CTBI and CTB President 40 years 40Andy Waters CTIC President and CEO 34 years 17Kevin J. Stumbo EVP/Chief Financial Officer 34 years 26Steven E. Jameson EVP/Risk Manager 36 years 17James J. Gartner EVP/Chief Credit Officer
53 years (17 at OCC) 19James B. Draughn EVP/Operations 28 years 28Larry W. Jones EVP/C KY President 52 years 18Richard W. Newsom EVP/E KY President 38 years 38Ricky Sparkman EVP/SC KY/TN President 36 years 27D. Andrew Jones EVP/NE KY/WV
President 34 years 34C. Wayne Hancock EVP/Senior Staff Attorney 12 years 12 8
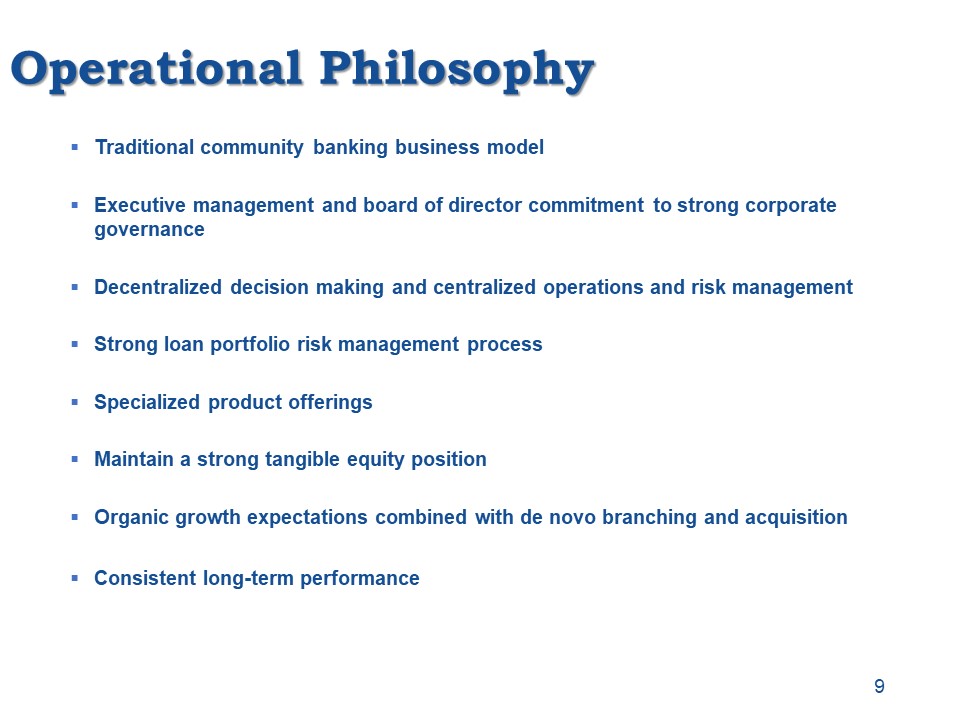
Operational Philosophy Traditional community banking business modelExecutive management and board of
director commitment to strong corporate governanceDecentralized decision making and centralized operations and risk managementStrong loan portfolio risk management processSpecialized product offeringsMaintain a strong tangible equity
positionOrganic growth expectations combined with de novo branching and acquisitionConsistent long-term performance 9
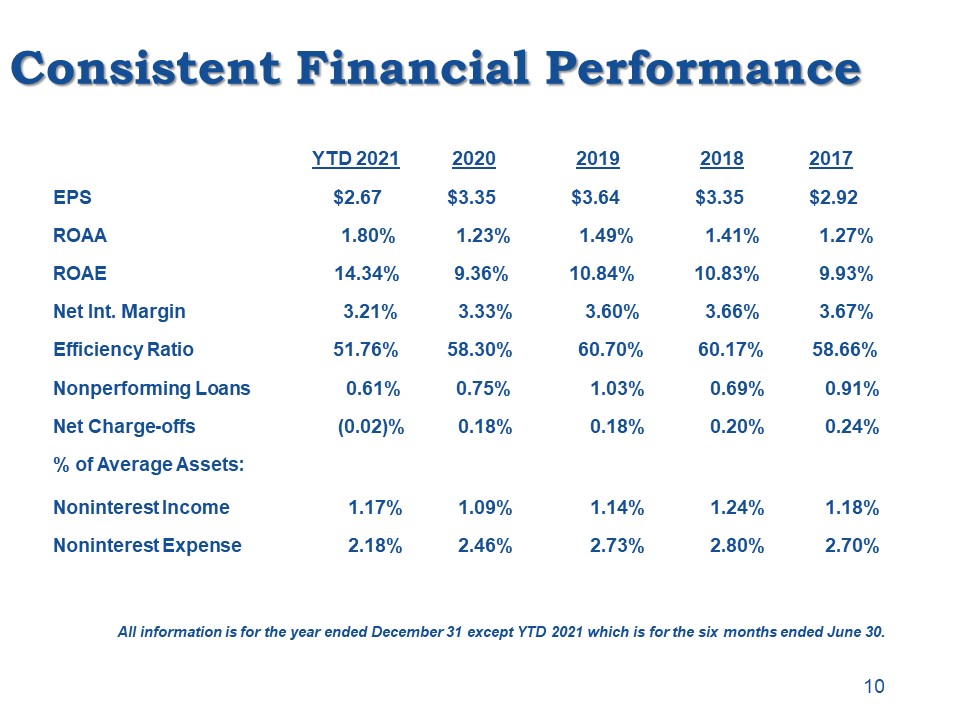
Consistent Financial Performance YTD 2021 2020 2019 2018 2017 EPS $2.67 $3.35 $3.64 $3.35 $2.92ROAA
1.80% 1.23% 1.49% 1.41% 1.27%ROAE 14.34% 9.36% 10.84% 10.83% 9.93%Net Int. Margin 3.21% 3.33% 3.60% 3.66% 3.67%Efficiency Ratio 51.76% 58.30% 60.70% 60.17% 58.66%Nonperforming Loans 0.61% 0.75% 1.03% 0.69% 0.91%Net Charge-offs (0.02)% 0.18%
0.18% 0.20% 0.24%% of Average Assets:Noninterest Income 1.17% 1.09% 1.14% 1.24% 1.18%Noninterest Expense 2.18% 2.46% 2.73% 2.80% 2.70% 10 All information is for the year ended December 31 except YTD 2021 which is for the six months ended June
30.
Earnings Review
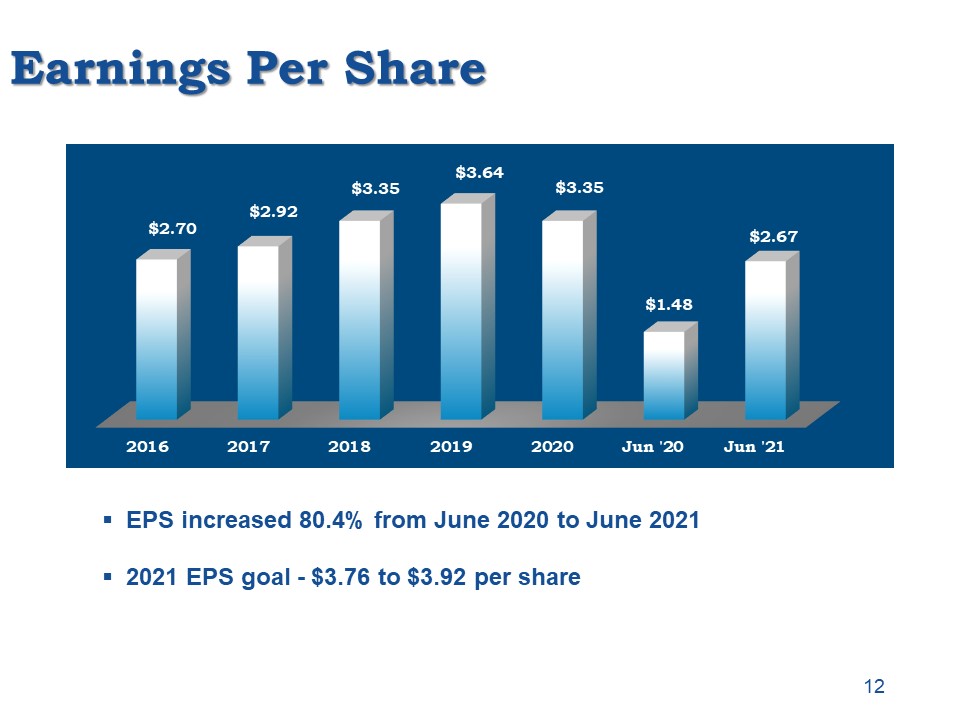
Earnings Per Share EPS increased 80.4% from June 2020 to June 20212021 EPS goal - $3.76 to $3.92 per
share 12
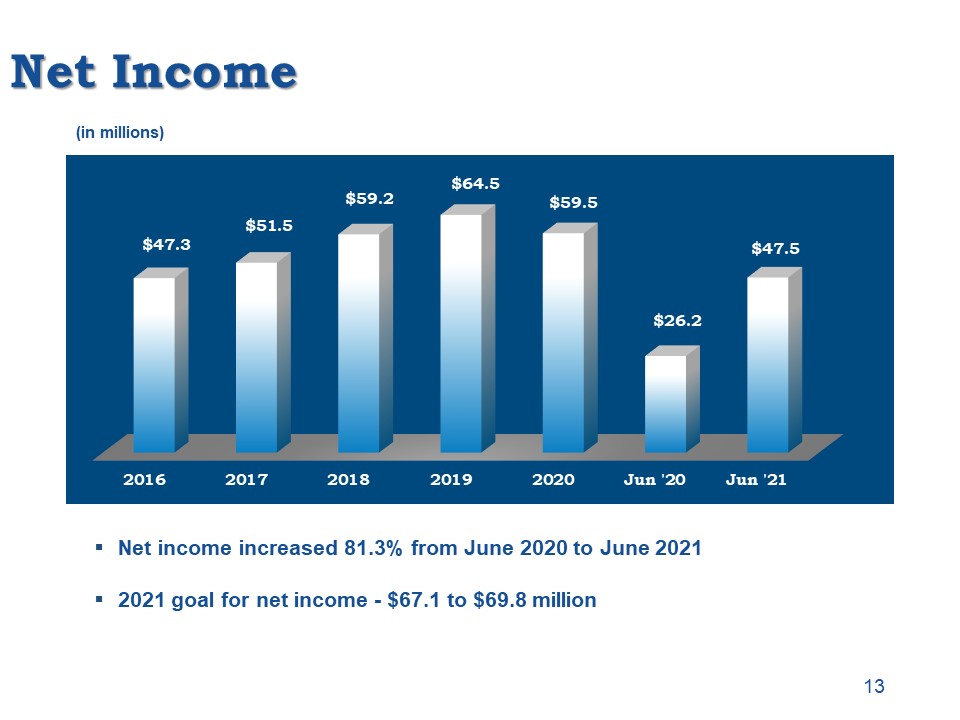
Net Income Net income increased 81.3% from June 2020 to June 20212021 goal for net income - $67.1 to
$69.8 million (in millions) 13
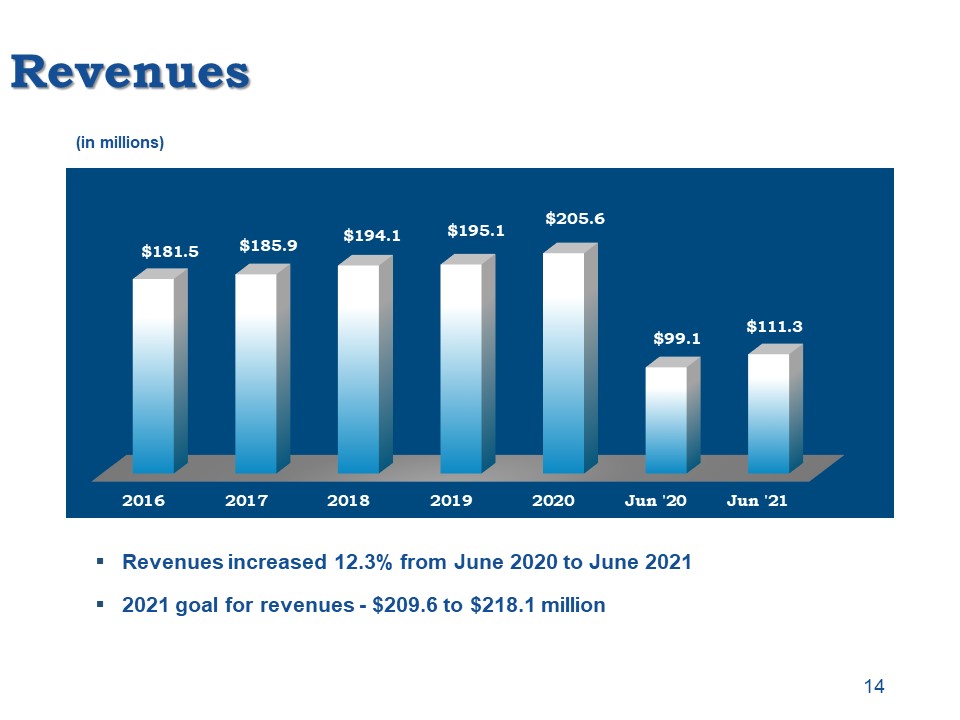
Revenues Revenues increased 12.3% from June 2020 to June 20212021 goal for revenues - $209.6 to $218.1
million (in millions) 14
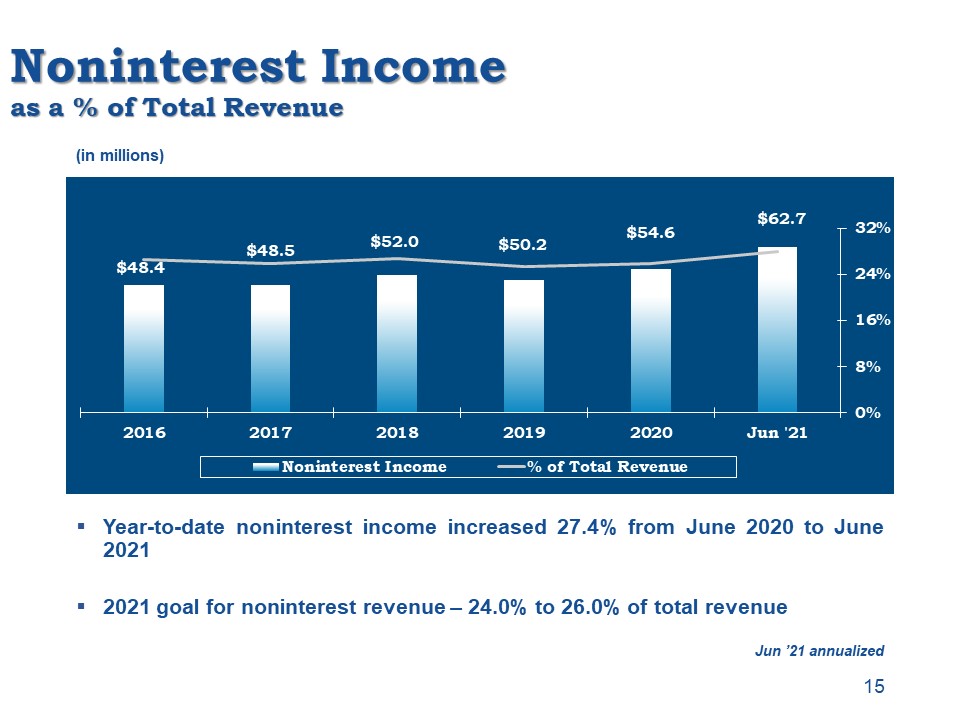
Noninterest Incomeas a % of Total Revenue Year-to-date noninterest income increased 27.4% from June 2020
to June 20212021 goal for noninterest revenue – 24.0% to 26.0% of total revenue (in millions) 15 Jun ’21 annualized
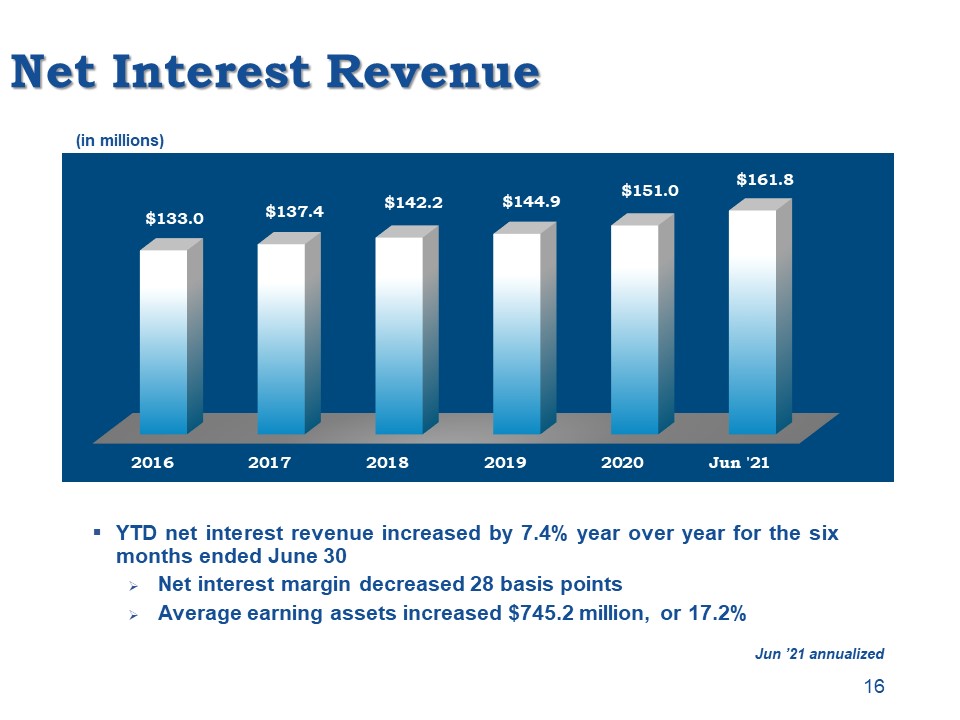
Net Interest Revenue YTD net interest revenue increased by 7.4% year over year for the six months ended
June 30Net interest margin decreased 28 basis pointsAverage earning assets increased $745.2 million, or 17.2% (in millions) 16 Jun ’21 annualized
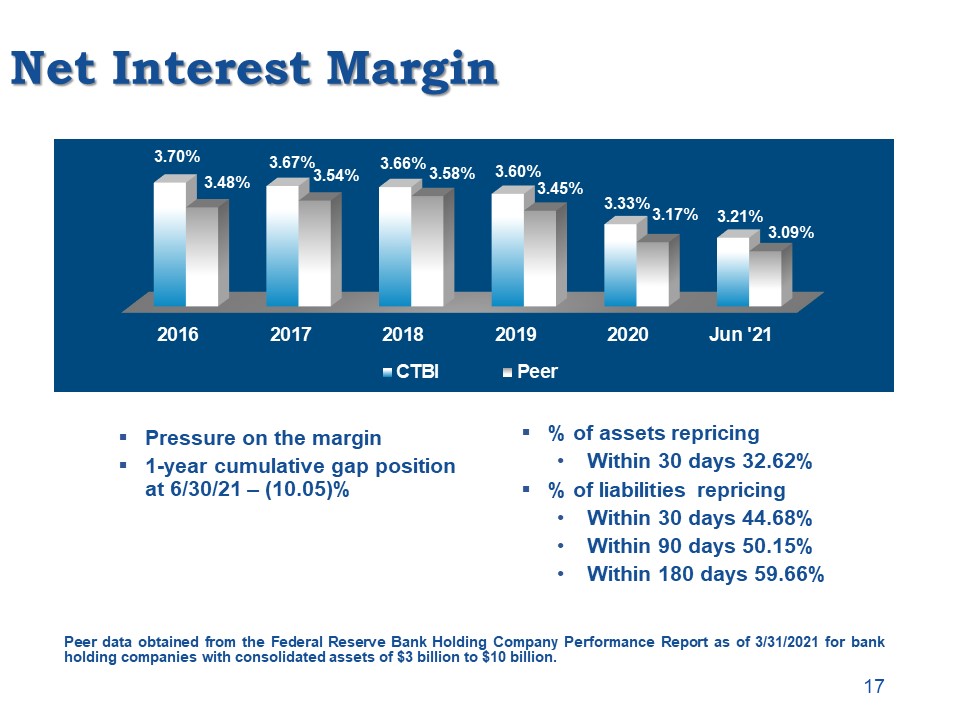
Net Interest Margin Pressure on the margin1-year cumulative gap position at 6/30/21 – (10.05)% Peer
data obtained from the Federal Reserve Bank Holding Company Performance Report as of 3/31/2021 for bank holding companies with consolidated assets of $3 billion to $10 billion. % of assets repricingWithin 30 days 32.62%% of liabilities
repricing Within 30 days 44.68%Within 90 days 50.15%Within 180 days 59.66% 17
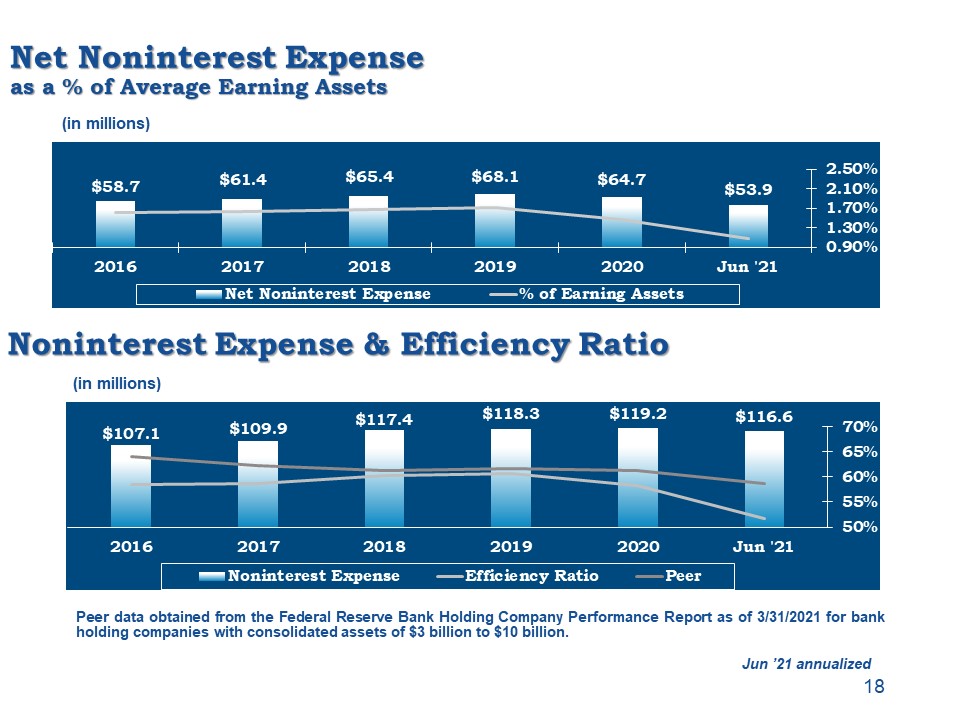
Net Noninterest Expenseas a % of Average Earning Assets Peer data obtained from the Federal Reserve Bank
Holding Company Performance Report as of 3/31/2021 for bank holding companies with consolidated assets of $3 billion to $10 billion. (in millions) 18 Noninterest Expense & Efficiency Ratio (in millions) Jun ’21 annualized
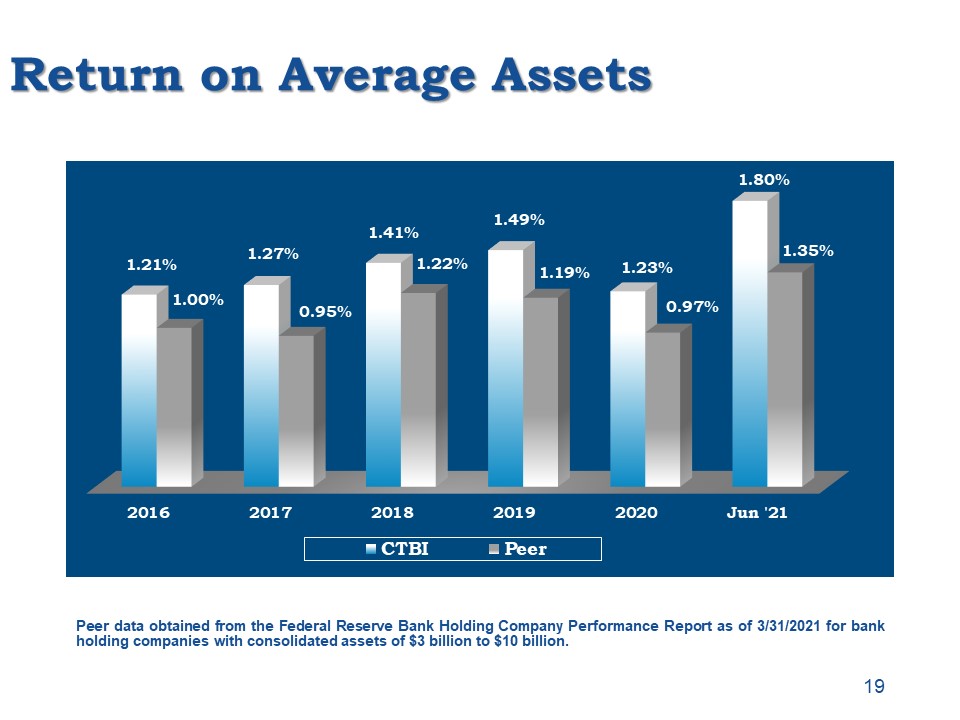
Return on Average Assets Peer data obtained from the Federal Reserve Bank Holding Company Performance
Report as of 3/31/2021 for bank holding companies with consolidated assets of $3 billion to $10 billion. 19
Balance Sheet Review
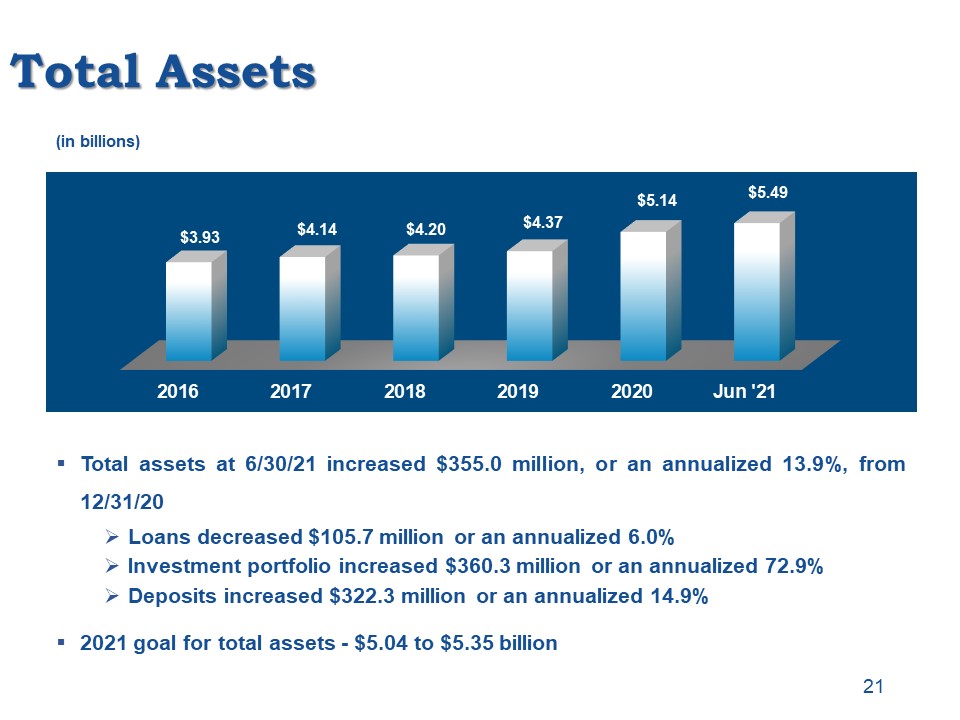
Total Assets Total assets at 6/30/21 increased $355.0 million, or an annualized 13.9%, from
12/31/20Loans decreased $105.7 million or an annualized 6.0%Investment portfolio increased $360.3 million or an annualized 72.9%Deposits increased $322.3 million or an annualized 14.9%2021 goal for total assets - $5.04 to $5.35 billion (in
billions) 21
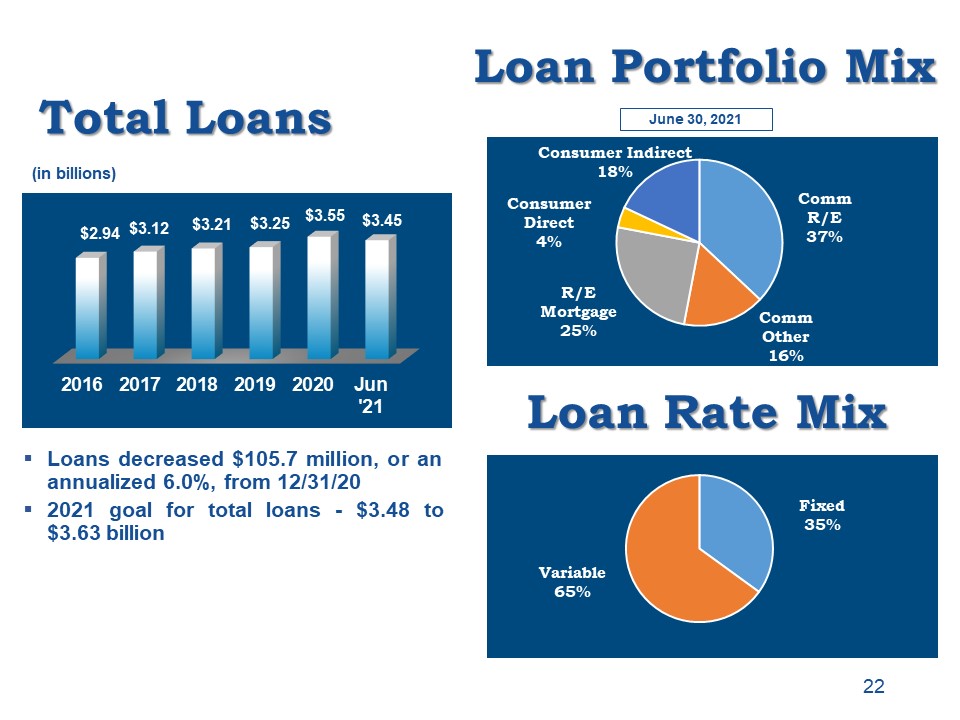
Total Loans Loans decreased $105.7 million, or an annualized 6.0%, from 12/31/202021 goal for total
loans - $3.48 to $3.63 billion (in billions) 22 Loan Portfolio Mix June 30, 2021 Loan Rate Mix
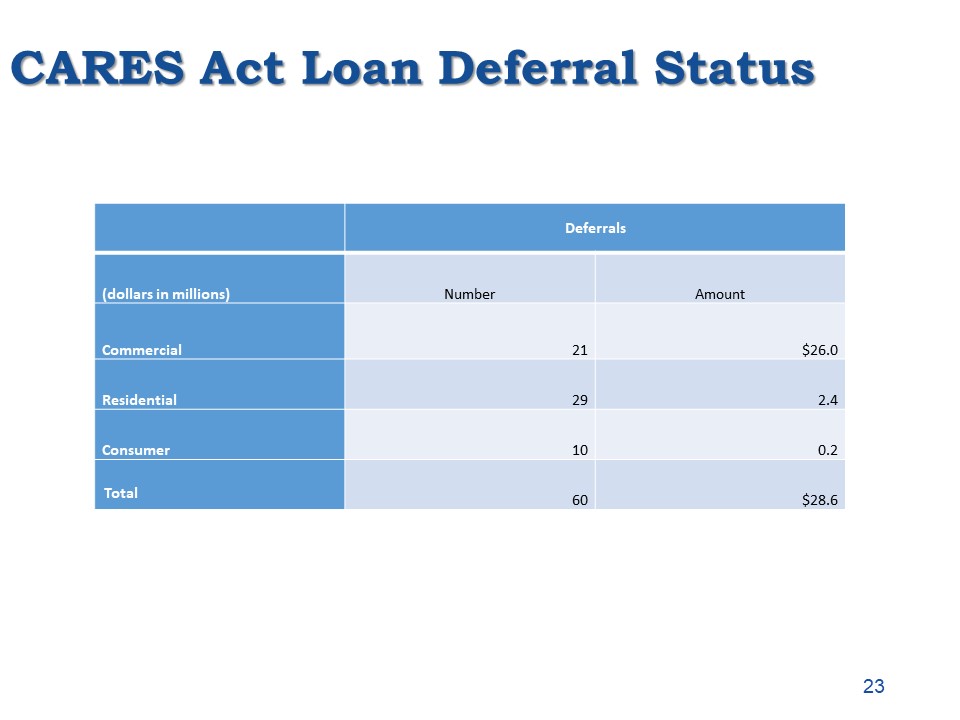
CARES Act Loan Deferral Status 23 Deferrals (dollars in
millions) Number Amount Commercial 21 $26.0 Residential 29 2.4 Consumer 10 0.2 Total 60 $28.6
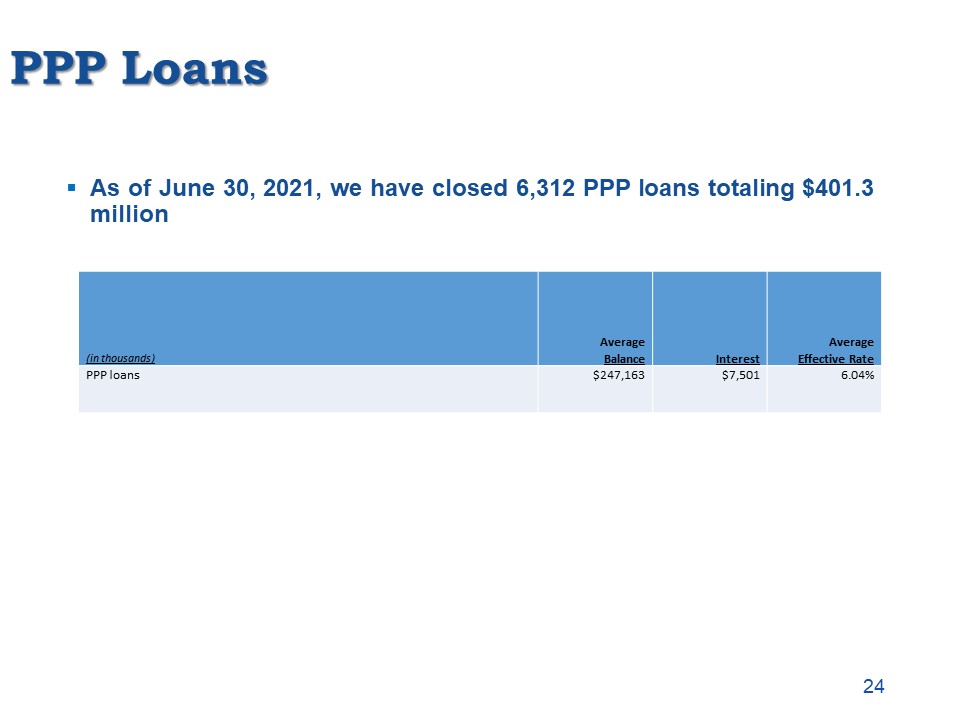
PPP Loans 24 As of June 30, 2021, we have closed 6,312 PPP loans totaling $401.3 million (in
thousands) AverageBalance Interest AverageEffective Rate PPP loans $247,163 $7,501 6.04%
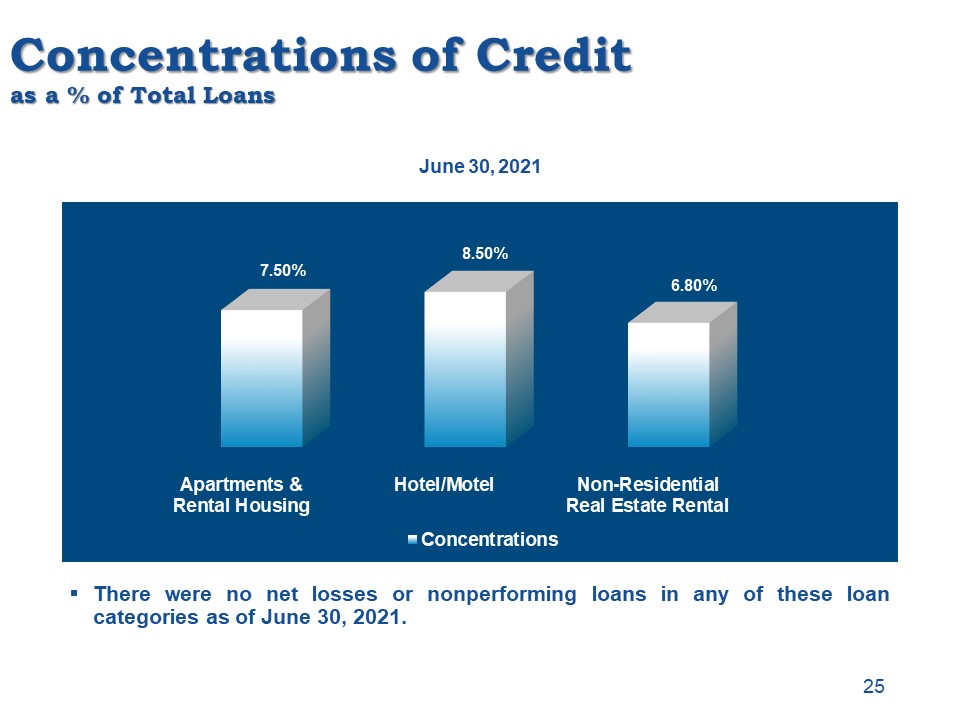
Concentrations of Creditas a % of Total Loans June 30, 2021 25 There were no net losses or
nonperforming loans in any of these loan categories as of June 30, 2021.
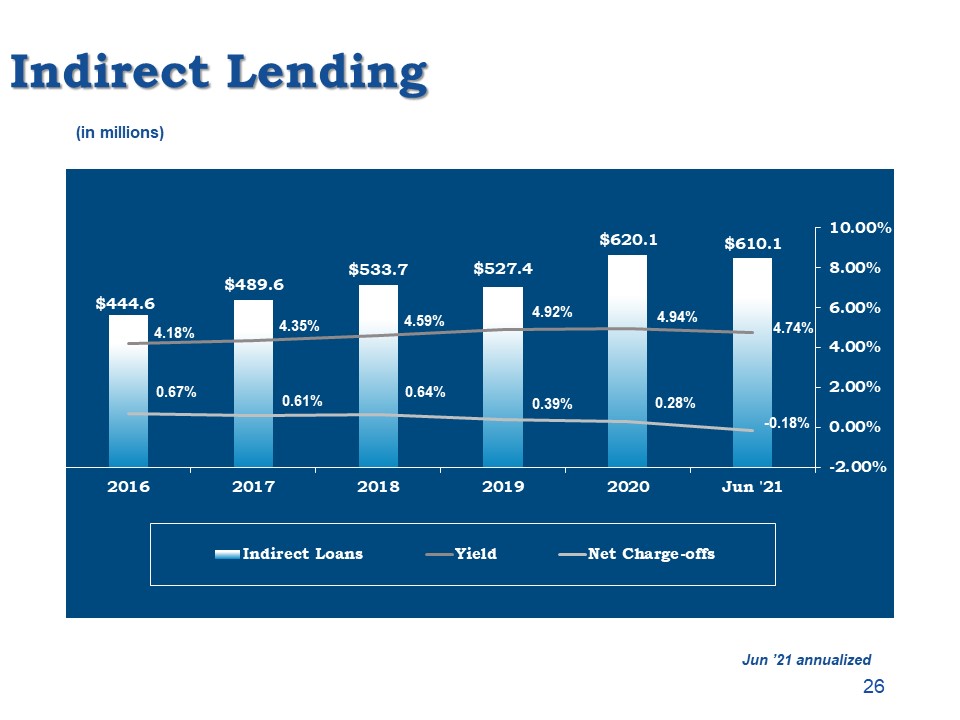
Indirect Lending (in millions) 26 Jun ’21 annualized
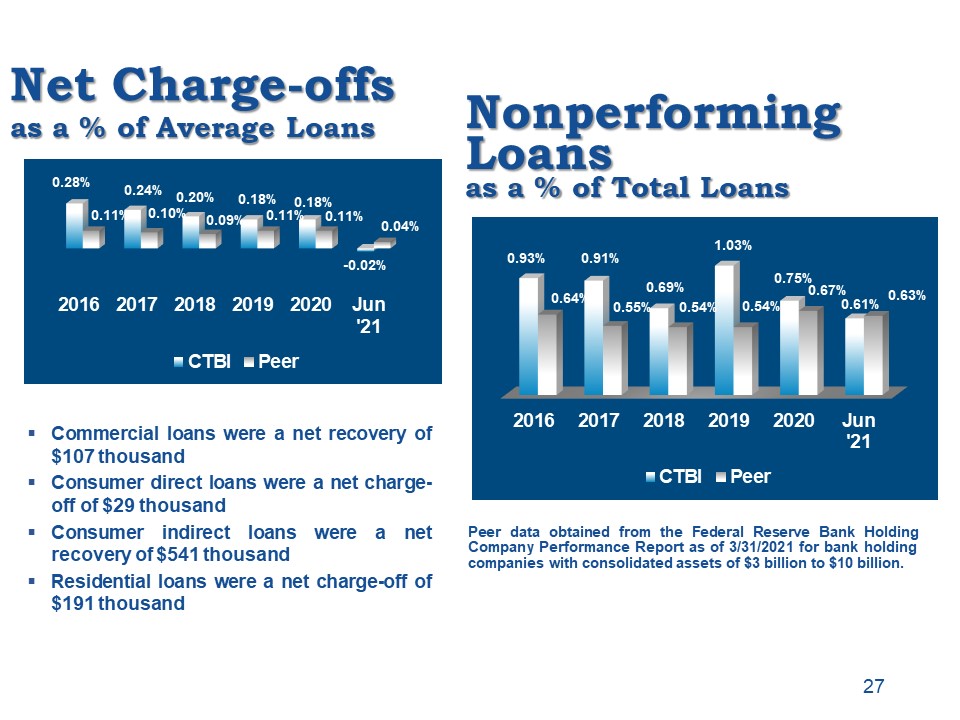
Net Charge-offsas a % of Average Loans Peer data obtained from the Federal Reserve Bank Holding Company
Performance Report as of 3/31/2021 for bank holding companies with consolidated assets of $3 billion to $10 billion. 27 Nonperforming Loansas a % of Total Loans Commercial loans were a net recovery of $107 thousandConsumer direct loans were
a net charge-off of $29 thousandConsumer indirect loans were a net recovery of $541 thousandResidential loans were a net charge-off of $191 thousand
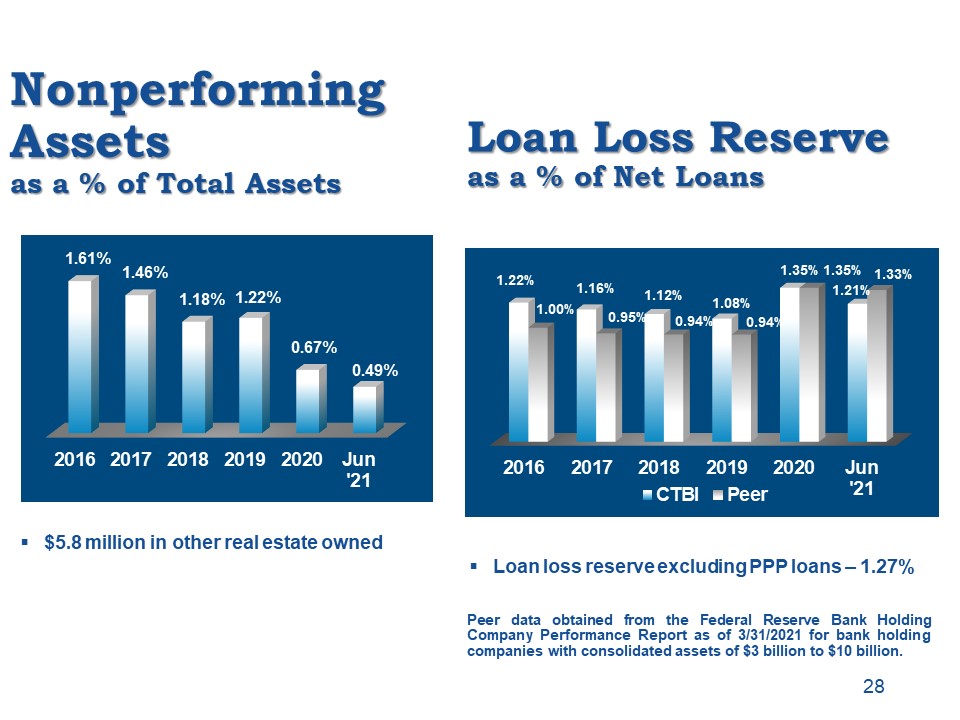
Nonperforming Assetsas a % of Total Assets $5.8 million in other real estate owned 28 Loan Loss
Reserveas a % of Net Loans Peer data obtained from the Federal Reserve Bank Holding Company Performance Report as of 3/31/2021 for bank holding companies with consolidated assets of $3 billion to $10 billion. Loan loss reserve excluding PPP
loans – 1.27%
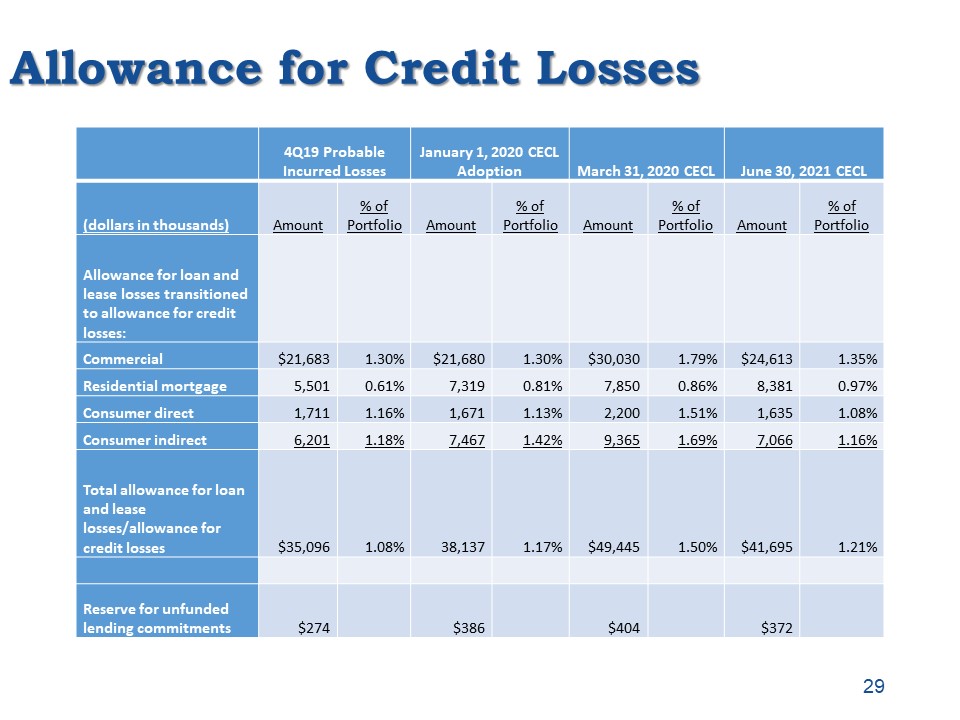
29 Allowance for Credit Losses 4Q19 Probable Incurred Losses January 1, 2020 CECL
Adoption March 31, 2020 CECL June 30, 2021 CECL (dollars in thousands) Amount % of Portfolio Amount % of Portfolio Amount % of Portfolio Amount % of Portfolio Allowance for loan and lease losses transitioned to allowance for
credit losses: Commercial $21,683 1.30% $21,680 1.30% $30,030 1.79% $24,613 1.35% Residential mortgage 5,501 0.61% 7,319 0.81% 7,850 0.86% 8,381 0.97% Consumer
direct 1,711 1.16% 1,671 1.13% 2,200 1.51% 1,635 1.08% Consumer indirect 6,201 1.18% 7,467 1.42% 9,365 1.69% 7,066 1.16% Total allowance for loan and lease losses/allowance for credit
losses $35,096 1.08% 38,137 1.17% $49,445 1.50% $41,695 1.21% Reserve for unfunded lending commitments $274 $386 $404 $372
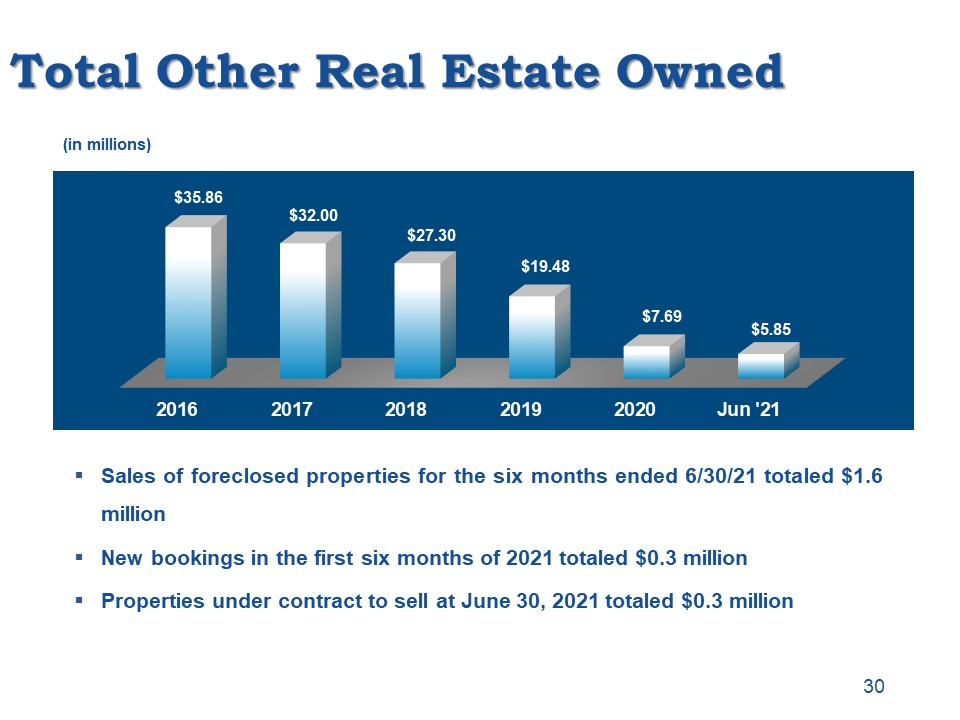
Total Other Real Estate Owned Sales of foreclosed properties for the six months ended 6/30/21 totaled
$1.6 millionNew bookings in the first six months of 2021 totaled $0.3 millionProperties under contract to sell at June 30, 2021 totaled $0.3 million (in millions) 30
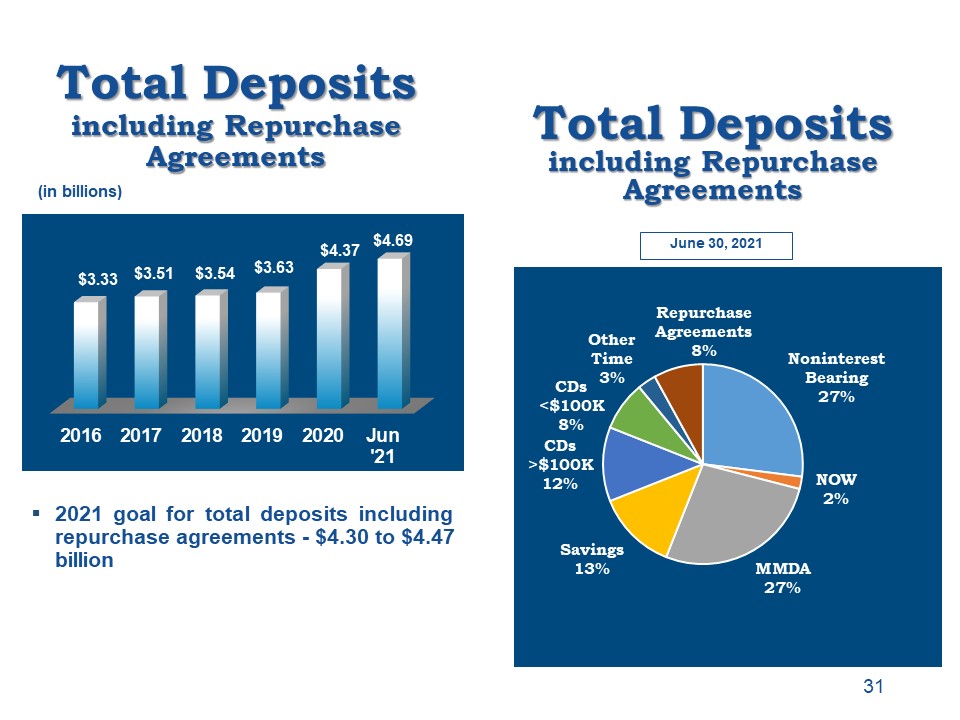
Total Depositsincluding Repurchase Agreements 2021 goal for total deposits including repurchase
agreements - $4.30 to $4.47 billion (in billions) 31 Total Depositsincluding Repurchase Agreements June 30, 2021
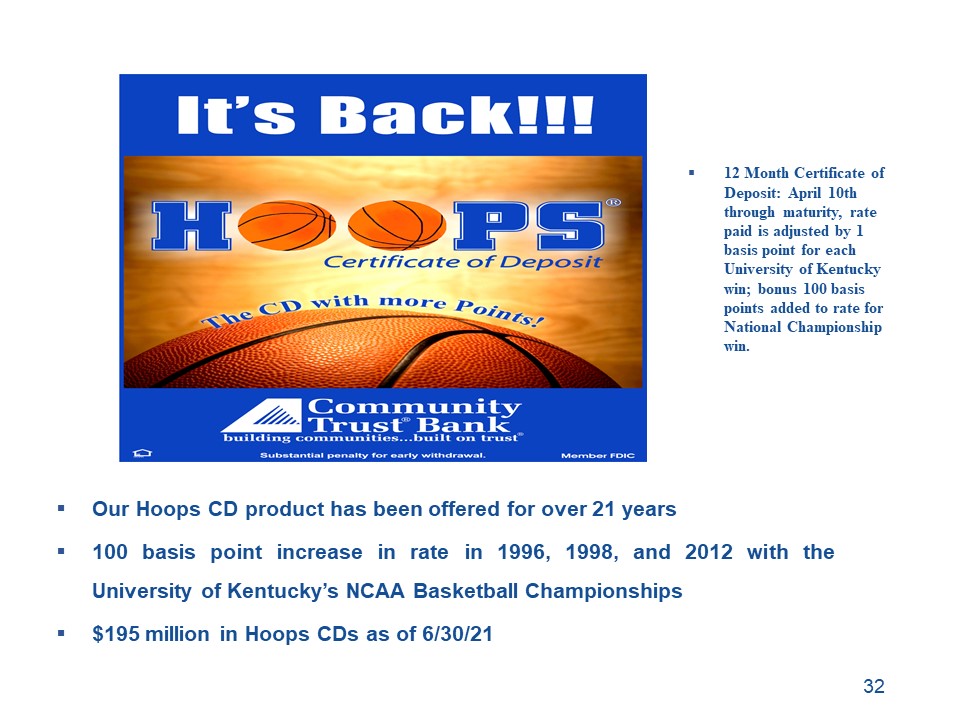
Our Hoops CD product has been offered for over 21 years100 basis point increase in rate in 1996, 1998,
and 2012 with the University of Kentucky’s NCAA Basketball Championships$195 million in Hoops CDs as of 6/30/21 12 Month Certificate of Deposit: April 10th through maturity, rate paid is adjusted by 1 basis point for each University of
Kentucky win; bonus 100 basis points added to rate for National Championship win. 32
Shareholder Value
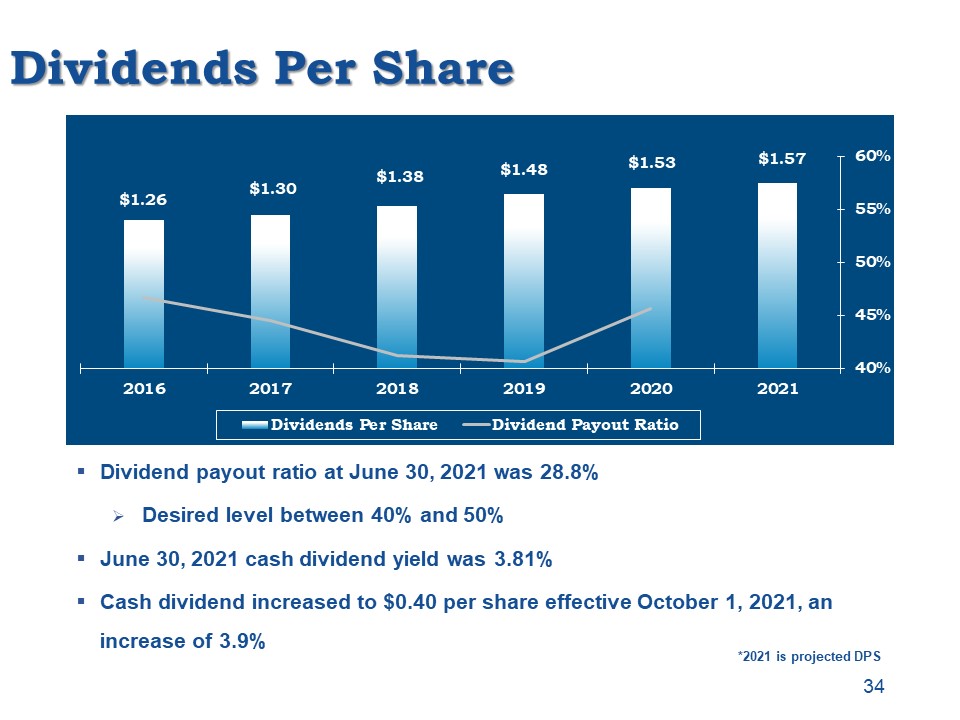
Dividends Per Share Dividend payout ratio at June 30, 2021 was 28.8%Desired level between 40% and
50%June 30, 2021 cash dividend yield was 3.81%Cash dividend increased to $0.40 per share effective October 1, 2021, an increase of 3.9% 34 *2021 is projected DPS
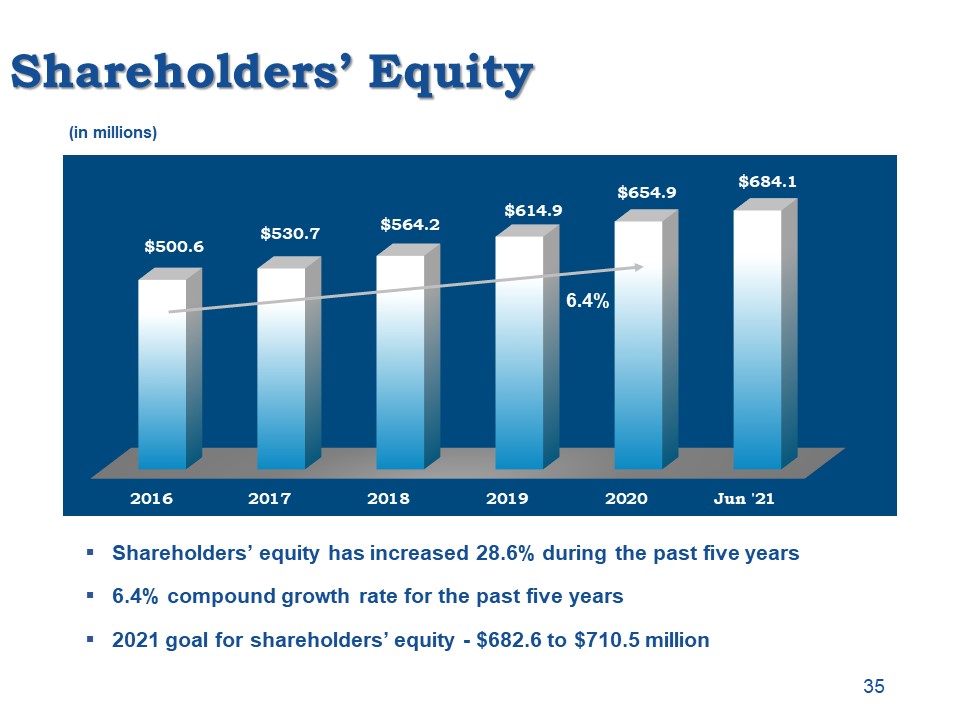
Shareholders’ Equity Shareholders’ equity has increased 28.6% during the past five years6.4% compound
growth rate for the past five years2021 goal for shareholders’ equity - $682.6 to $710.5 million (in millions) 35 6.4%
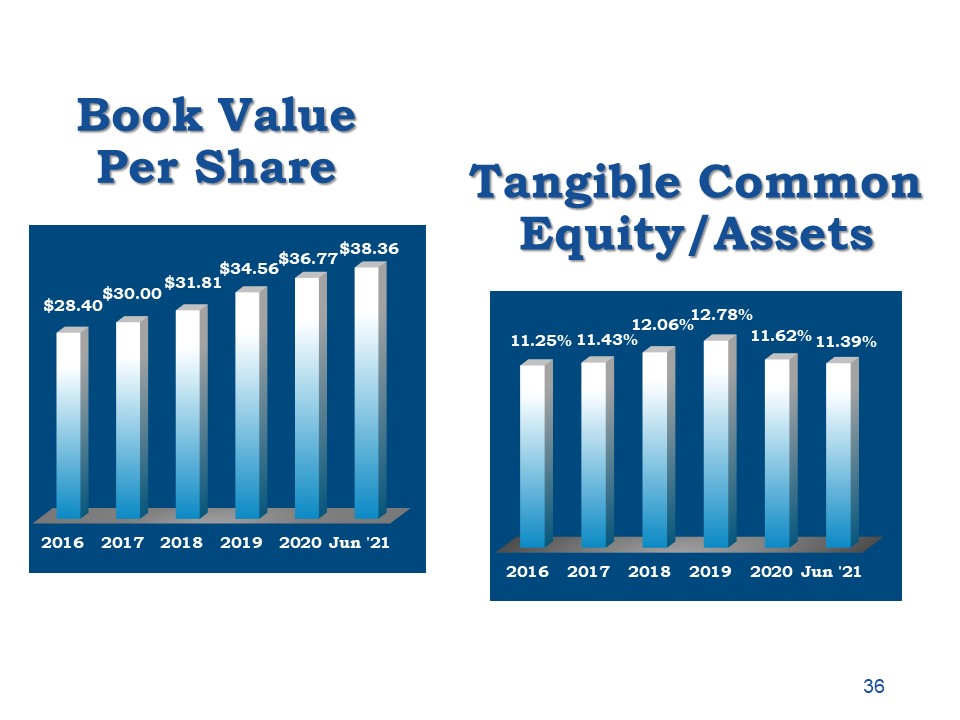
Book Value Per Share Tangible Common Equity/Assets 36
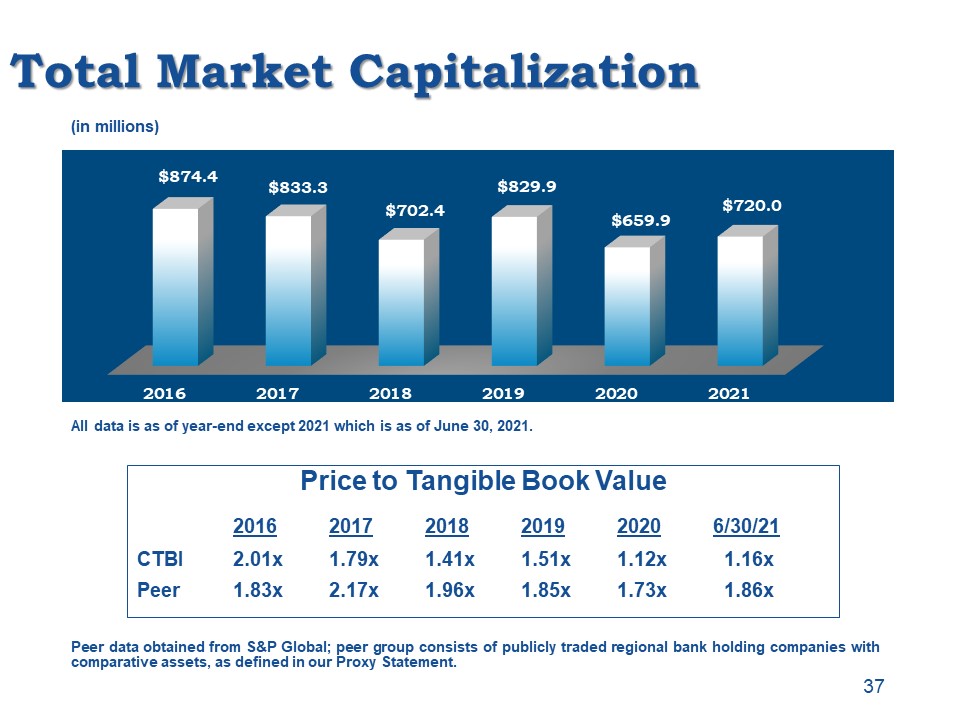
Total Market Capitalization Peer data obtained from S&P Global; peer group consists of publicly
traded regional bank holding companies with comparative assets, as defined in our Proxy Statement. 37 Price to Tangible Book Value 2016 2017 2018 2019 2020 6/30/21CTBI 2.01x 1.79x 1.41x 1.51x 1.12x 1.16xPeer 1.83x 2.17x 1.96x 1.85x 1.73x
1.86x All data is as of year-end except 2021 which is as of June 30, 2021. (in millions)
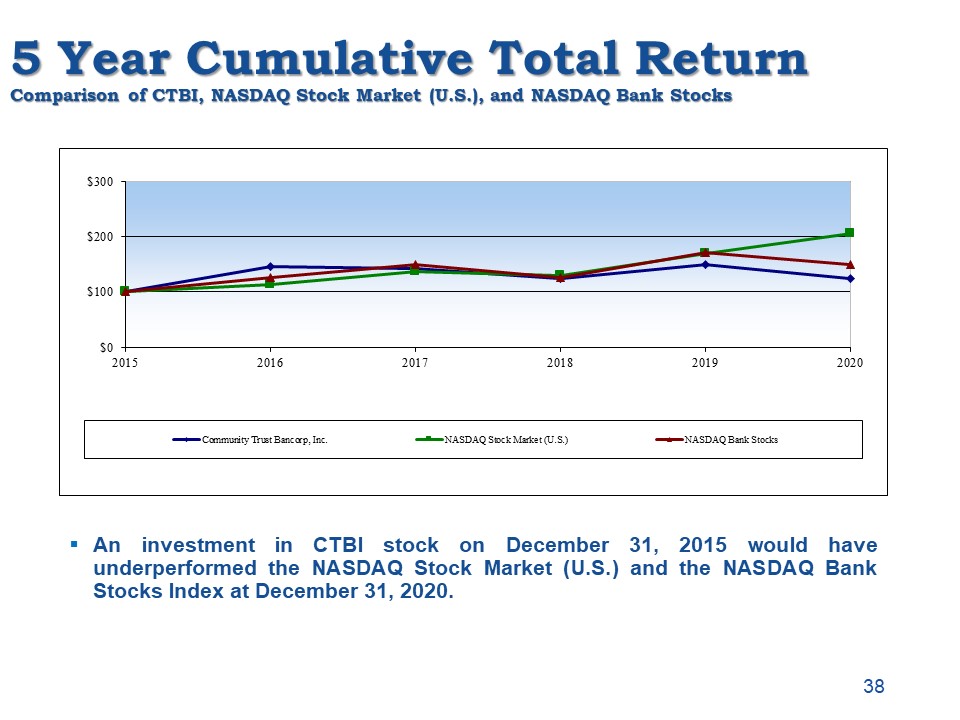
5 Year Cumulative Total ReturnComparison of CTBI, NASDAQ Stock Market (U.S.), and NASDAQ Bank Stocks An
investment in CTBI stock on December 31, 2015 would have underperformed the NASDAQ Stock Market (U.S.) and the NASDAQ Bank Stocks Index at December 31, 2020. 38
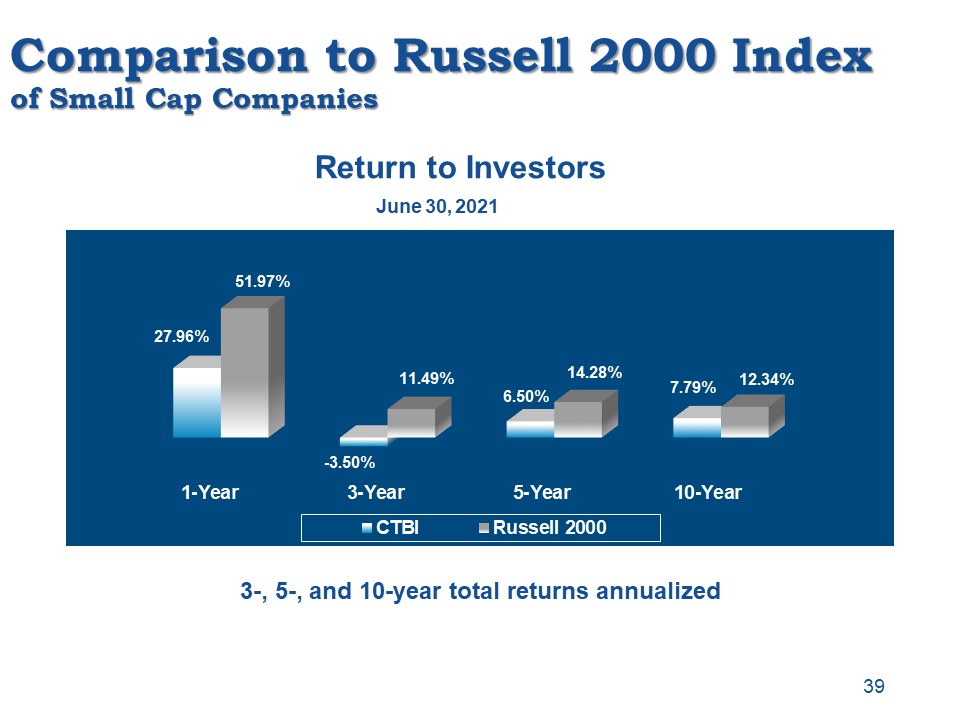
Comparison to Russell 2000 Indexof Small Cap Companies 3-, 5-, and 10-year total returns
annualized Return to Investors 39 June 30, 2021
Core Value Long-Term Investment 12 stock splits and 10 stock dividends41 years of consecutive increases
in cash dividends5-year compound growth rate of cash dividends 4.7%Stock included in the NASDAQ Global Select Market, NASDAQ Dividend Achievers Index, and NASDAQ Bank Stock IndexCTBI shareholders include214 institutional investors (including
CTIC – 10.00%) hold 10.8 million shares (57.2%)341 mutual funds hold 5.6 million shares (31.3%) Data as of June 30, 2021 40
Key Strategic Initiatives
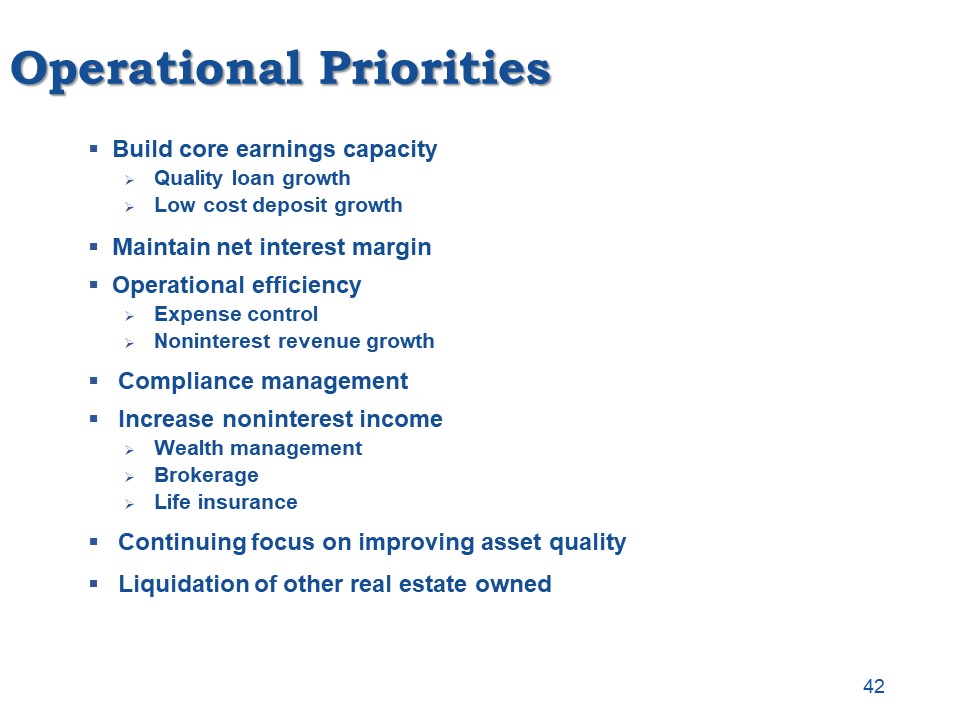
Operational Priorities Build core earnings capacityQuality loan growthLow cost deposit growthMaintain
net interest margin Operational efficiencyExpense controlNoninterest revenue growthCompliance managementIncrease noninterest incomeWealth managementBrokerageLife insuranceContinuing focus on improving asset quality Liquidation of other real
estate owned 42
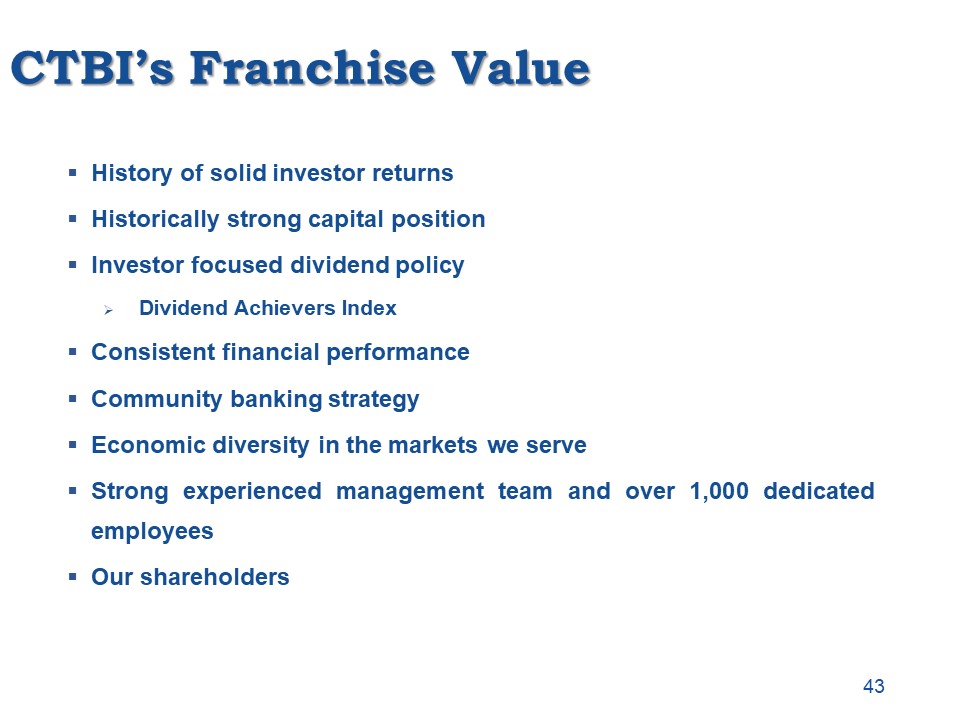
CTBI’s Franchise Value History of solid investor returnsHistorically strong capital positionInvestor
focused dividend policyDividend Achievers IndexConsistent financial performanceCommunity banking strategyEconomic diversity in the markets we serveStrong experienced management team and over 1,000 dedicated employeesOur shareholders 43

44