Attached files
| file | filename |
|---|---|
| 8-K - PAPA JOHN'S INTERNATIONAL, INC. 8-K - PAPA JOHNS INTERNATIONAL INC | a52486997.htm |
| EX-99.2 - EXHIBIT 99.2 - PAPA JOHNS INTERNATIONAL INC | a52486997ex99_2.htm |
Exhibit 99.1

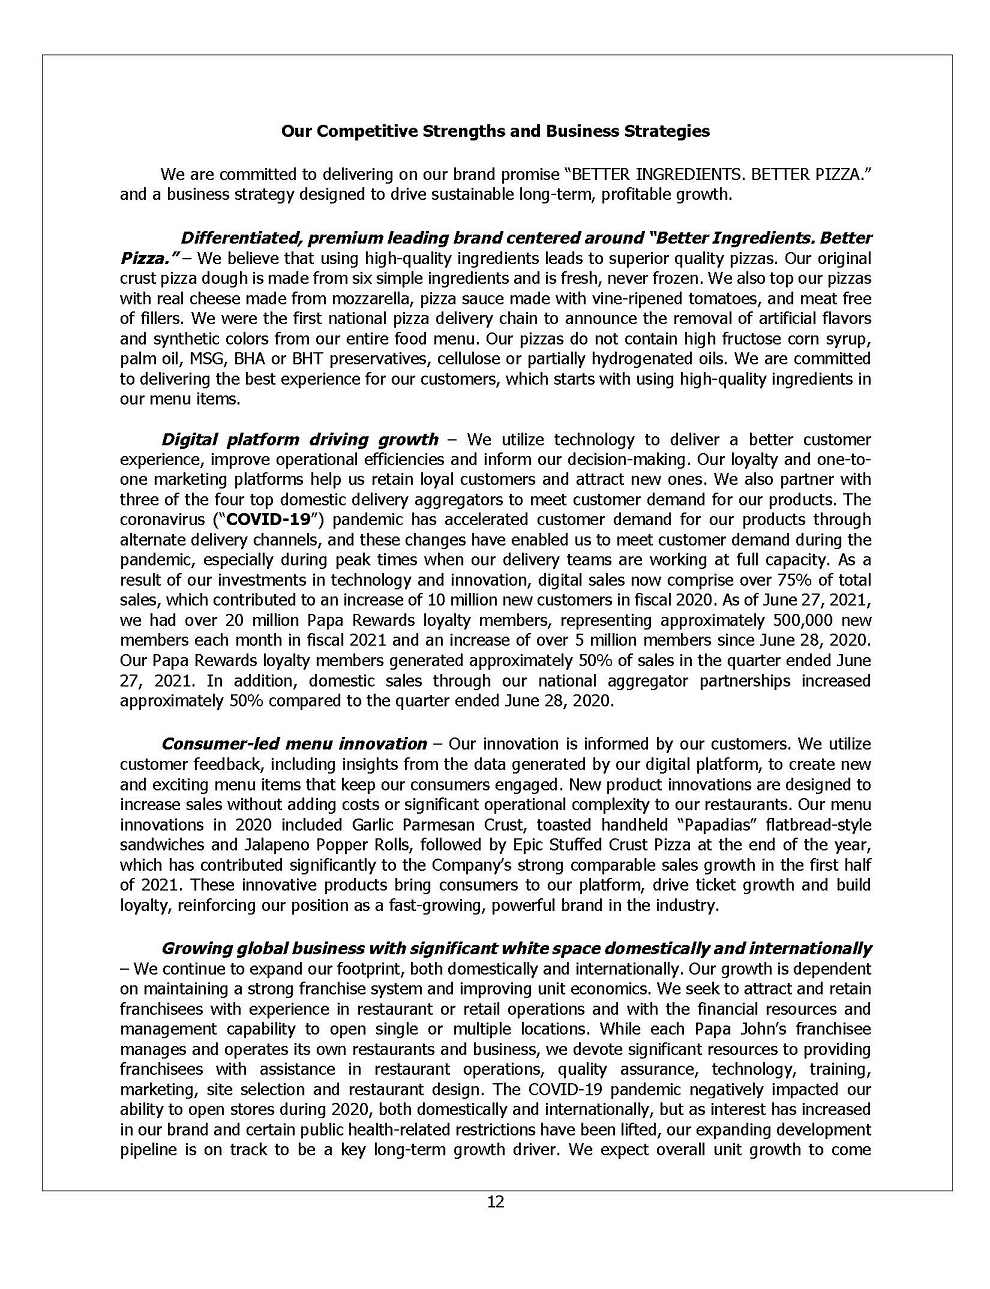
Domestic Company-Owned Restaurants (Approximately 39% of revenue for
the twelve months ended June 27, 2021) — The Domestic Company-owned restaurant segment consists of the operations of all domestic Company-owned restaurants, defined as restaurants located in the contiguous United States (the “U.S.”), and
derives its revenues principally from retail sales of pizza, “Papadias”, which are flatbread-style sandwiches, and side items, including breadsticks, cheesesticks, chicken poppers and wings, dessert items and canned or bottled beverages. Of the
total 3,309 North American restaurants open as of June 27, 2021, 589 units, or approximately 18%, were Company- owned. Domestic Company-owned restaurants generated system-wide sales, revenues and operating income of $746 million, $746 million
and $43 million, respectively, in the twelve months ended June 27, 2021.North America Commissaries (Approximately 37% of revenue for the twelve months ended June 27, 2021) — The North America commissary segment comprises 11 full-service
regional dough production and distribution QC Centers in the U.S., which supply pizza sauce, dough, food products, paper products, smallwares and cleaning supplies twice weekly to each traditional restaurant served. This system enables us to
monitor and control product quality and consistency while lowering food and other costs. We also have one QC Center in Canada, which produces and distributes fresh dough. We evaluate the QC Center system capacity in relation to existing
restaurants’ volumes and planned restaurant growth, and facilities are developed or upgraded as operational or economic conditions warrant. To ensure consistent food quality, each domestic franchisee is required to purchase dough and pizza
sauce from our QC Centers and to purchase all other supplies from our QC Centers or other approved suppliers. The North America commissary segment generated revenues and operating income of $729 million and $37 million, respectively, in the
twelve months ended June 27, 2021.North America Franchising (Approximately 6% of revenue for the twelve months ended June 27, 2021) — The North America franchising segment consists of our franchise sales and support activities and derives its
revenues from the sale of franchise and development rights and the collection of royalties from our franchisees located in the U.S. and Canada. Our North American franchised restaurants, which included 2,720 restaurants as of June 27, 2021,
generated average annual unit sales of approximately $1.0 million in 2020. These sales, while not included in the Company’s revenues, contribute to our royalty revenues, franchisee marketing fund contributions and commissary revenue. The North
America franchising segment generated system-wide sales, revenues and operating income of $2,685 million, $118 million and $111 million, respectively, in the twelve months ended June 27, 2021. Domestic Company-owned
restaurants39% 1 North America commissaries 37% North America franchising 6% Our Business SegmentsRevenue by segment for the twelve months ended June 27, 2021All others 11%International franchising 7% Exhibit 99.1

International Franchising (Approximately 7% of revenue for the
twelve months ended June 27, 2021) — The International franchising segment principally consists of distribution sales to franchised Papa John’s restaurants located in the United Kingdom (the “UK”) and our international franchise sales and
support activities, which derive revenues from sales of franchise and development rights and the collection of royalties from our international franchisees. International franchisees are defined as all franchise operations outside of the U.S.
and Canada. As of June 27, 2021, there were 2,214 international restaurants, all of which are franchised. The Company currently operates one international QC Center, which is in the UK. Other QC Centers outside the U.S. are operated by
franchisees pursuant to license agreements or by other third parties. The international franchising segment generated system-wide sales, revenues and operating income of $1,171 million, $142 million and $33 million, respectively, in the twelve
months ended June 27, 2021.All Others (Approximately 11% of revenue for the twelve months ended June 27, 2021) — We refer to all other business units that do not meet the quantitative thresholds for determining reportable segments, which are
not operating segments, as “all others,” which consists of operations that derive revenues from the sale, principally to Company-owned and franchised restaurants, of printing and promotional items, franchise contributions to marketing funds and
information systems and related services used in restaurant operations, including our point-of-sale system, online and other technology- based ordering platforms.Our Franchise ProgramWe continue to attract qualified and experienced franchisees,
whom we consider to be a vital part of our system’s continued growth. We believe our relationship with our franchisees is fundamental to the performance of our brand and we strive to maintain a collaborative relationship with our franchisees.
Franchisees are approved on the basis of the applicant’s business background, restaurant operating experience and financial resources.North America Development and Franchise Agreements – We enter into development agreements with our franchisees
in North America for the opening of a specified number of restaurants within a defined period of time and specified geographic area. The franchise agreement is generally executed once a franchisee secures a location. Our current standard
franchise agreement requires the franchisee to pay a royalty fee of 5% of sales, and the majority of our existing franchised restaurants have a 5% contractual royalty rate in effect. Incentives offered from time to time, including new store
incentives, will reduce the contractual royalty rate paid. We provided financial assistance for traditional North America franchisees in 2018, 2019 and 2020 in the form of lower royalties, royalty-based service incentives and targeted relief as
well as additional contributions to the Papa John’s Marketing Fund (“PJMF”). Over the past several years, we have offered various development incentive programs for domestic franchisees to accelerate unit openings. Such incentives included the
following for 2020 traditional openings: (1) waiver of all or part of the standard one-time franchise fee; (2) waiver of all or part of the 5% royalty fee for a period of time; (3) credit for new store equipment; and (4) credit to be applied
toward a future food purchase, under certain circumstances. We believe development incentive programs have accelerated unit openings, and we expect to continue to utilize such development incentives. Substantially all existing franchise
agreements have an initial 10-year term with a 10-year renewal option. We have the right to terminate a franchise agreement for a variety of reasons, including a franchisee’s failure to make payments when due or to adhere to our operational
policies and standards. Many state franchise laws limit our ability as a franchisor to terminate or refuse to renew a franchise.International Development and Franchise Agreements – In international markets, we have either a development
agreement or a master franchise agreement with a franchisee for the 2
Our Competitive Strengths and Business StrategiesWe are committed to
delivering on our brand promise “BETTER INGREDIENTS. BETTER PIZZA.” and a business strategy designed to drive sustainable long-term, profitable growth.Differentiated, premium leading brand centered around “Better Ingredients. Better Pizza.” –
We believe that using high-quality ingredients leads to superior quality pizzas. Our original crust pizza dough is made from six simple ingredients and is fresh, never frozen. We also top our pizzas with real cheese made from mozzarella, pizza
sauce made with vine-ripened tomatoes, and meat free of fillers. We were the first national pizza delivery chain to announce the removal of artificial flavors and synthetic colors from our entire food menu. Our pizzas do not contain high
fructose corn syrup, palm oil, MSG, BHA or BHT preservatives, cellulose or partially hydrogenated oils. We are committed to delivering the best experience for our customers, which starts with using high-quality ingredients in our menu
items.Digital platform driving growth – We utilize technology to deliver a better customer experience, improve operational efficiencies and inform our decision-making. Our loyalty and one-to- one marketing platforms help us retain loyal
customers and attract new ones. We also partner with three of the four top domestic delivery aggregators to meet customer demand for our products. The coronavirus (“COVID-19”) pandemic has accelerated customer demand for our products through
alternate delivery channels, and these changes have enabled us to meet customer demand during the pandemic, especially during peak times when our delivery teams are working at full capacity. As a result of our investments in technology and
innovation, digital sales now comprise over 75% of total sales, which contributed to an increase of 10 million new customers in fiscal 2020. As of June 27, 2021, we had over 20 million Papa Rewards loyalty members, representing approximately
500,000 new members each month in fiscal 2021 and an increase of over 5 million members since June 28, 2020. Our Papa Rewards loyalty members generated approximately 50% of sales in the quarter ended June 27, 2021. In addition, domestic sales
through our national aggregator partnerships increased approximately 50% compared to the quarter ended June 28, 2020.Consumer-led menu innovation – Our innovation is informed by our customers. We utilize customer feedback, including insights
from the data generated by our digital platform, to create new and exciting menu items that keep our consumers engaged. New product innovations are designed to increase sales without adding costs or significant operational complexity to our
restaurants. Our menu innovations in 2020 included Garlic Parmesan Crust, toasted handheld “Papadias” flatbread-style sandwiches and Jalapeno Popper Rolls, followed by Epic Stuffed Crust Pizza at the end of the year, which has contributed
significantly to the Company’s strong comparable sales growth in the first half of 2021. These innovative products bring consumers to our platform, drive ticket growth and build loyalty, reinforcing our position as a fast-growing, powerful
brand in the industryGrowing global business with significant white space domestically and internationally– We continue to expand our footprint, both domestically and internationally. Our growth is dependent on maintaining a strong franchise
system and improving unit economics. We seek to attract and retain franchisees with experience in restaurant or retail operations and with the financial resources and management capability to open single or multiple locations. While each Papa
John’s franchisee manages and operates its own restaurants and business, we devote significant resources to providing franchisees with assistance in restaurant operations, quality assurance, technology, training, marketing, site selection and
restaurant design. The COVID-19 pandemic negatively impacted our ability to open stores during 2020, both domestically and internationally, but as interest has increased in our brand and certain public health-related restrictions have been
lifted, our expanding development pipeline is on track to be a key long-term growth driver. We expect overall unit growth to come 3

increasingly from international markets. In addition, we recently
announced an expanded partnership with Drake Food Service International (“DFSI”), our largest franchisee. As part of the agreement, DFSI plans to open over 220 Papa John’s restaurants by 2025, including more than 170 across Latin America, Spain
and Portugal, where DFSI currently operates other restaurant brands in excess of 280 locations. DFSI plans to open 50 new Papa John’s restaurants in the UK over the next four years, where it recently purchased over 60 Papa John’s restaurants in
London, making it the brand’s largest franchisee in the country. Under the terms of this expanded partnership, DFSI is expected to operate more than 560 Papa John’s restaurants in total by 2025.Highly-franchised business model – A large
majority of Papa John’s restaurants are franchised, with 4,934 franchised restaurants of the Company’s total 5,523 restaurants, including all of the Company’s 2,214 international restaurants. We believe a franchised model provides resiliency of
earnings and presents us with an opportunity to enhance growth with less capital investment than a traditional company-operated restaurant model. In addition, Papa John’s franchise owners benefit from our award-winning brand, foodservice
capabilities and the Papa John’s digital and delivery model. We provide our franchisees with marketing and advertising support, high-quality menu items and operating expertise. While international sales represented only 25% of our system-wide
sales during the twelve months ended June 27, 2021, we believe that international markets provide us with an additional avenue for profitable growth.Attractive financial profile with strong free cash flow generation – Since fiscal 2018, we have
meaningfully improved our margin and cash flow profile, driven by increased scale and global growth in same store sales. As a result of continued menu, delivery and digital innovation, two-year comparable sales increased 33% in North America
and 27% internationally from June 30, 2019 to June 27, 2021, resulting in seven consecutive quarters of industry comparable sales out-performance relative to our peers. In addition, we have increased our Adjusted EBITDA margin by approximately
410 basis points in fiscal 2018 to the twelve months ended June 27, 2021 while more than tripling our free cash flow over the same time period. Please see “—Summary Historical and Other Financial Data” for a definition of Adjusted EBITDA, a
reconciliation of Adjusted EBITDA to net income, the most closely comparable financial measure calculated in accordance with GAAP, and a calculation of Adjusted EBITDA margin. Our business model generates strong cash flow with limited capital
expenditure requirements that typically approximate between 2.0% and 3.0% of total revenues, which has enabled us to reduce our net debt to Adjusted EBITDA ratio from nearly 5.6x for fiscal 2018 to 1.8x for the twelve months ended June 27,
2021, after giving pro forma effect to the issuance of the Notes, the entering into of the Amended Credit Agreement and the application of the net proceeds therefrom as described in “Use of Proceeds”. Please see “—Summary Historical and Other
Financial Data” for a description of how we calculate net debt to Adjusted EBITDA, a definition of net debt and a reconciliation of net debt to total debt, the most closely comparable financial measure calculated in accordance with
GAAP.Experienced management team with proven records of building great companies – Our management team is among the most experienced in the Quick Service Restaurant (“QSR”) industry. Our senior management team, led by President and Chief
Executive Officer Robert Lynch, has an average of over 20 years of experience and has worked for some of the top companies within and outside the food industry. Our management team successfully led us through previous challenges, including the
ongoing COVID-19 pandemic, and continues to drive innovation and growth for the Company. Other of our senior operating executives have backgrounds with leading, global companies and we believe that this combination of backgrounds and experience
will enable us to maintain and grow our business in the future. 4

EBITDA, Adjusted EBITDA Margin, free cash flow and net debt.
Management believes that these non-GAAP measures provide management and investors with useful insight into the operating performance of the business. The presentation of these non- GAAP financial measures should be considered in addition to our
GAAP results and these measures are not intended to be a substitute for the financial information prepared and presented in accordance with GAAP. Our non-GAAP measures and the related adjustments may differ from non-GAAP measures used by other
companies and should only be used to evaluate our results of operations in conjunction with our corresponding GAAP results.(2) A reconciliation of Adjusted EBITDA (defined as net income attributable to the Company, including non-controlling
interest, depreciation and amortization, net interest expense, income tax expense, stock-based compensation expense, (gain)/loss on refranchising, strategic corporate reorganization costs and special charges (including legal and advisory fees,
reimagining costs and write-off of branded assets and mark-to-market adjustment on option valuation) to net income attributable to the Company is provided below: For the Twelve MonthsEnded June 27, For the Six MonthsEnded June 27, For
the Six MonthsEnded June 28, Fiscal 2021 2021 2020 2020 2019 2018 ( unaudited) (audited) (in thousands of U.S. Dollars) Net income attributable to the
Company ................. $ 95,012 $ 66,138 $ 29,057 $ 57,932 $ 4,866 $ 2,474 Non-controlling interest ............................................. 3,532 2,736 1,887 2,682 791 1,599 Depreciation and
amortization.................................... 50,387 25,353 24,672 49,705 47,281 46,403 Net interest expense ................................................. 14,594 7,296 7,593 14,891 19,489 24,856 Income tax
expense ................................. 22,609 15,329 7,469 14,748 (611) 2,624 Stock-based compensation expense........... 15,769 8,202 8,742 16,310 15,303 9,936 (Gain)/loss on refranchising
...................... — — — — (4,739) 289 Strategic corporate reorganization costs 13,196 7,211 — 5,985 — — Special charges Legal and advisory
fees.......................... — — — — 8,306 19,475 Reimaging costs and write-off of branded assets ....... — — — — — 5,841 Mark-to-market adjustment on option valuation
........ — — — — 5,914 — Adjusted EBITDA ..................................... $215,099 $132,265 $79,420 $162,253 $96,600 $113,497 Defined as Adjusted EBITDA divided by total revenues.Defined as net cash provided
by operating activities less the purchases of property and equipment and dividends paid to preferred stockholders. A reconciliation of free cash flow to net cash provided by operating activities is provided below: For theTwelve Months Ended
June 27, For the Six Months Ended June 27, For the Six Months Ended June 28, Fiscal 2021 2021 2020 2020 2019 2018 (unaudited) (audited) (in thousands of U.S.
Dollars) Net cash provided by operating activities .......................................... $226,811 $128,030 $87,658 $186,439 $61,749 $92,454 Purchases of property and equipment
..... (43,400) (21,543) (13,795) (35,652) (37,711) (42,028) Dividends paid to preferred stockholders . (13,218) (6,394) (6,825) (13,649) (10,020) — Free cash flow
................................... $170,193 $100,093 $67,038 $137,138 $14,018 $50,426 (5) Defined as total debt less cash and cash equivalents. For June 27, 2021, net debt is presented as adjusted to reflect the issuance
of the Notes, the entering into of the Amended Credit Agreement and the application of the net proceeds therefrom as described in “Use of Proceeds.” A reconciliation of net debt to total debt is provided below: As of June 27,2021 As of
December 27,2020 (unaudited) (audited) (in thousands of U.S. Dollars) Total debt(a) .................................................................................................................. $470,785 $395,840 Cash and
cash equivalents ................................................................................................ 96,213 $130,204 Net debt
........................................................................................................................ $374,572 $265,636 24

For the Twelve Months Ended June 27, For the Six Months Ended June
27, For the Six Months Ended June 28, Fiscal 2021 2021 2020 2020 2019 2018 Domestic Company- owned restaurants .... 13.9% 13.8% 14.4% 14.2% (2.7)% (9.0)% North
America franchised restaurants 17.3% 15.1% 17.2% 18.6% (2.0)% (6.7)% North America restaurants
............... 16.5% 14.8% 16.6% 17.6% (2.2)% (7.3)% International restaurants ............... 21.6% 22.2% 3.8% 12.6% 1.1% (1.6)% Total comparable sales growth
............. 17.8% 16.6% 13.3% 16.3% (1.4)% (6.1)% Results of OperationsSix Months Ended June 27, 2021 Compared to the Six Months Ended June 28, 2020The following table sets forth the various components of our condensed
consolidated statements of operations expressed as a percentage of total revenues, except operating costs which are expressed as a percentage of the associated revenue component. Six Months Ended June 27,
2021 June 28, 2020 ($ in thousands) % of Related Revenues % of Related Revenues Increase (Decrease) Revenues: Domestic Company-owned restaurant sales
.................... $ 393,358 $ 347,946 North America franchise royalties and fees...................... 65,190 43,614 North America commissary revenues
.............................. 371,519 323,041 International revenues .................................................. 72,221 54,152 Other revenues
............................................................ 124,466 101,729 Total revenues 1,026,754 870,482 Costs and expenses: Operating costs (excluding depreciation and
amortization shown separately below): ............................................. Domestic Company-owned restaurant expenses .............. 310,181 78.9% 274,279 78.8% 0.1% North America commissary
expenses.............................. 342,911 92.3% 298,739 92.5% (0.2)% International expenses.................................................. 41,048 56.8% 33,405 61.7% (4.9)% Other expenses
............................................................ 112,053 90.0% 97,302 95.6% (5.6)% General and administrative expenses............................ 103,709 10.1% 96,079 11.0% (0.9)% Depreciation
and amortization ..................................... 25,353 2.5% 24,672 2.8% (0.3)% Total costs and expenses .............................................. 935,255 91.1% 824,476 94.7% (3.6)% Operating
income ......................................................... 91,499 8.9% 46,006 5.3% 3.6% Net interest
expense..................................................... (7,296) (0.7)% (7,594) (0.9)% 0.2% Income before income
taxes.......................................... $ 84,203 8.2% $ 38,412 4.4% 3.8% RevenuesConsolidated revenues increased $156.3 million, or 18.0%, to $1.03 billion, for the six months ended June 27, 2021.Domestic Company-owned
restaurant sales increased $45.4 million, or 13.1%, for the six months ended June 27, 2021 compared to the prior year comparable period. The increase was primarily 58