Attached files
| file | filename |
|---|---|
| EX-99.2 - EXHIBIT 99.2 - Healthcare Trust, Inc. | tm2126719d1_ex99-2.htm |
| 8-K - FORM 8-K - Healthcare Trust, Inc. | tm2126719d1_8k.htm |
Exhibit 99.1
1 Healthcare Trust, Inc. Second Quarter 2021 Investor Webcast Presentation
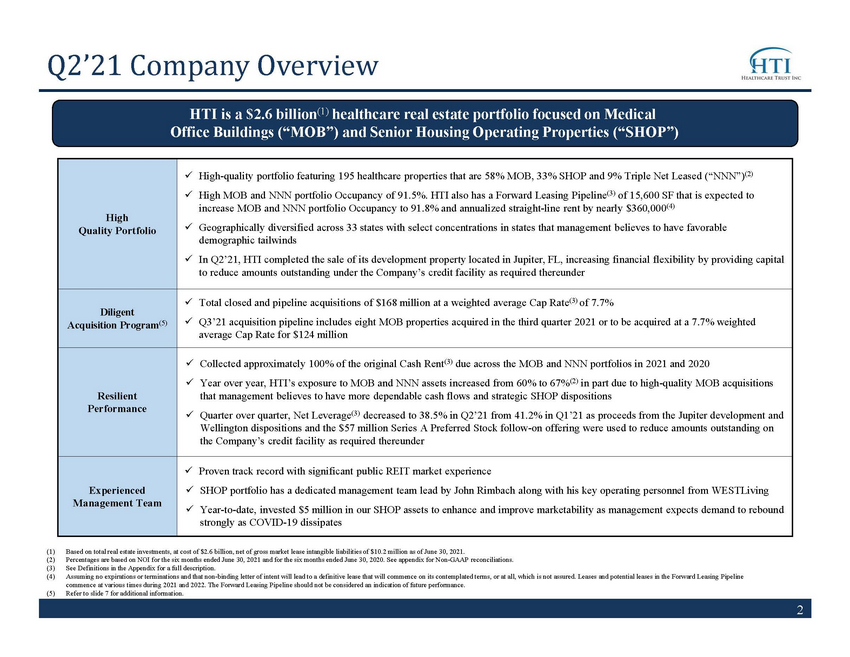
2 Q2’21 Company Overview (1) Based on total real estate investments, at cost of $2.6 billion, net of gross market lease intangible liabilities of $10.2 mi lli on as of June 30, 2021. (2) Percentages are based on NOI for the six months ended June 30, 2021 and for the six months ended June 30, 2020. See appendix for Non - GAAP reconciliations. (3) See Definitions in the Appendix for a full description. (4) Assuming no expirations or terminations and that non - binding letter of intent will lead to a definitive lease that will commence on its contemplated terms, or at all, which is not assured. Leases and potential leases in the Forward Leasing Pipeline commence at various times during 2021 and 2022. The Forward Leasing Pipeline should not be considered an indication of future pe rformance. (5) Refer to slide 7 for additional information. HTI is a $2.6 billion (1) healthcare real estate portfolio focused on Medical Office Buildings (“MOB”) and Senior Housing Operating Properties (“SHOP”) High Quality Portfolio x High - quality portfolio featuring 195 healthcare properties that are 58% MOB, 33% SHOP and 9% Triple Net Leased (“NNN”) (2) x High MOB and NNN portfolio Occupancy of 91.5%. HTI also has a Forward Leasing Pipeline (3) of 15,600 SF that is expected to increase MOB and NNN portfolio Occupancy to 91.8% and annualized straight - line rent by nearly $360,000 (4) x Geographically diversified across 33 states with select concentrations in states that management believes to have favorable demographic tailwinds x In Q2’21, HTI completed the sale of its development property located in Jupiter, FL, increasing financial flexibility by prov idi ng capital to reduce amounts outstanding under the Company’s credit facility as required thereunder Diligent Acquisition Program (5) x Total closed and pipeline acquisitions of $168 million at a weighted average Cap Rate (3) of 7.7% x Q3’21 acquisition pipeline includes eight MOB properties acquired in the third quarter 2021 or to be acquired at a 7.7% weigh ted average Cap Rate for $124 million Resilient Performance x Collected approximately 100% of the original Cash Rent (3) due across the MOB and NNN portfolios in 2021 and 2020 x Year over year, HTI’s exposure to MOB and NNN assets increased from 60% to 67% (2) in part due to high - quality MOB acquisitions that management believes to have more dependable cash flows and strategic SHOP dispositions x Quarter over quarter, Net Leverage (3) decreased to 38.5% in Q2’21 from 41.2% in Q1’21 as proceeds from the Jupiter development and Wellington dispositions and the $57 million Series A Preferred Stock follow - on offering were used to reduce amounts outstanding on the Company’s credit facility as required thereunder Experienced Management Team x Proven track record with significant public REIT market experience x SHOP portfolio has a dedicated management team lead by John Rimbach along with his key operating personnel from WESTLiving x Year - to - date, invested $5 million in our SHOP assets to enhance and improve marketability as management expects demand to reboun d strongly as COVID - 19 dissipates
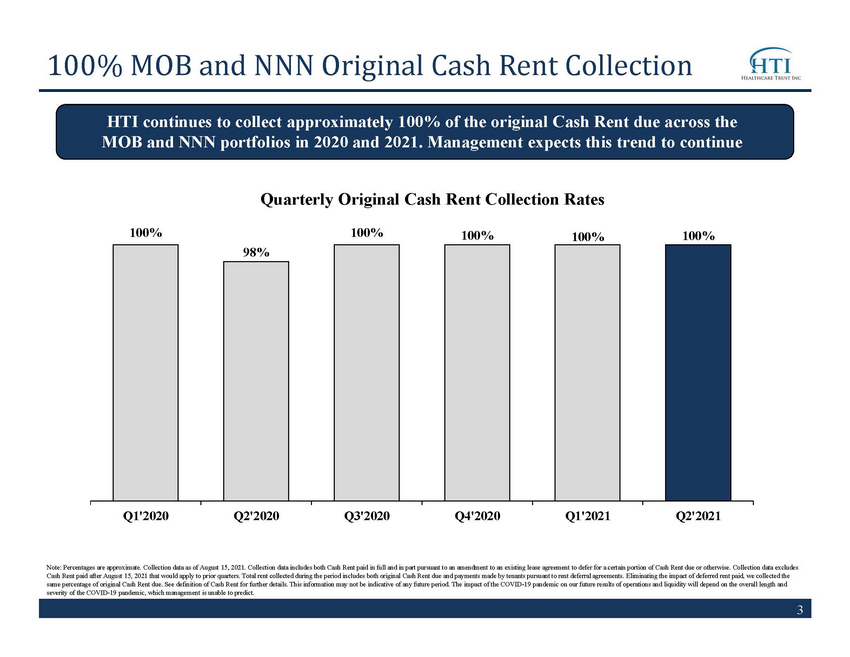
3 100% MOB and NNN Original Cash Rent Collection HTI continues to collect approximately 100% of the original Cash Rent due across the MOB and NNN portfolios in 2020 and 2021. Management expects this trend to continue Note: Percentages are approximate. Collection data as of August 15, 2021. Collection data includes both Cash Rent paid in ful l a nd in part pursuant to an amendment to an existing lease agreement to defer for a certain portion of Cash Rent due or otherwi se. Collection data excludes Cash Rent paid after August 15, 2021 that would apply to prior quarters. Total rent collected during the period includes both or iginal Cash Rent due and payments made by tenants pursuant to rent deferral agreements. Eliminating the impact of deferred rent paid, we collected the same percentage of original Cash Rent due. See definition of Cash Rent for further details. This information may not be indicative of any future period. The impact of t he COVID - 19 pandemic on our future results of operations and liquidity will depend on the overall length and severity of the COVID - 19 pandemic, which management is unable to predict. 100% 100% 100% 100% 98% 100% Q2'2021 Q1'2021 Q4'2020 Q3'2020 Q2'2020 Q1'2020 Quarterly Original Cash Rent Collection Rates
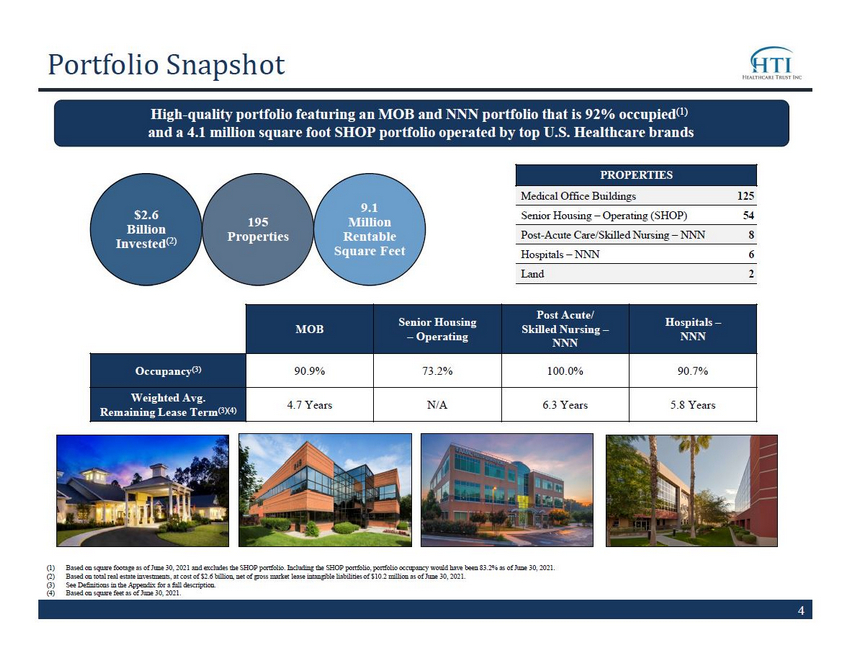
4 (1) Based on square footage as of June 30, 2021 and excludes the SHOP portfolio. Including the SHOP portfolio, portfolio occupanc y w ould have been 83.2% as of June 30, 2021. (2) Based on total real estate investments, at cost of $2.6 billion, net of gross market lease intangible liabilities of $10.2 mi lli on as of June 30, 2021. (3) See Definitions in the Appendix for a full description. (4) Based on square feet as of June 30, 2021. Portfolio Snapshot High - quality portfolio featuring an MOB and NNN portfolio that is 92% occupied (1) and a 4.1 million square foot SHOP portfolio operated by top U.S. Healthcare brands PROPERTIES Medical Office Buildings 125 _ Senior Housing – Operating (SHOP) 54 _ Post - Acute Care/Skilled Nursing – NNN 8 _ Hospitals – NNN 6 _ Land 2 _ MOB Senior Housing – Operating Post Acute/ Skilled Nursing – NNN Hospitals – NNN Occupancy (3) 90.9% 73.2% 100.0% 90.7% Weighted Avg. Remaining Lease Term (3)(4) 4.7 Years N/A 6.3 Years 5.8 Years $2.6 Billion Invested (2) 195 Properties 9.1 Million Rentable Square Feet
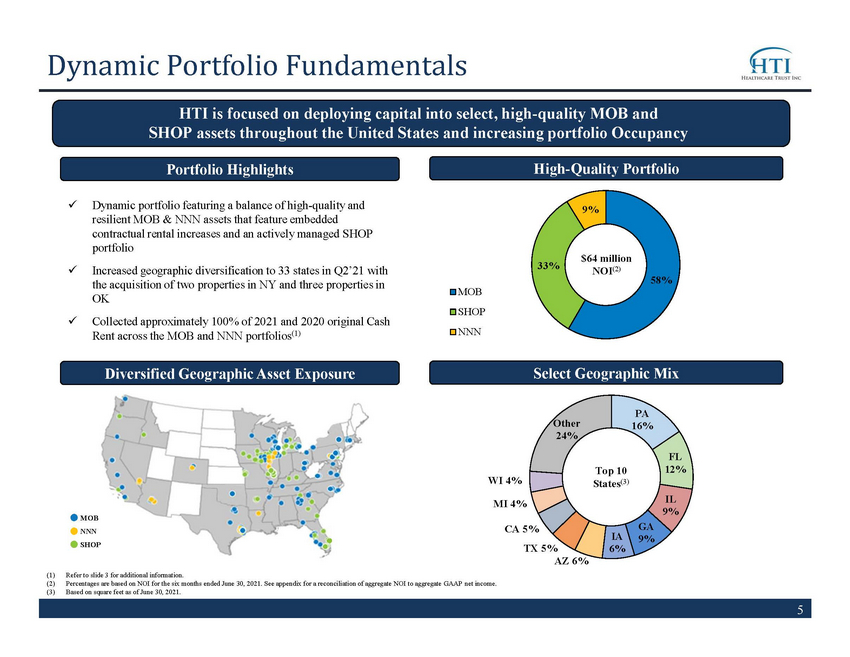
5 58% 33% 9% MOB SHOP NNN PA 16% FL 12% IL 9% GA 9% IA 6% AZ 6% TX 5% CA 5% MI 4% WI 4% Other 24% Dynamic Portfolio Fundamentals HTI is focused on deploying capital into select, high - quality MOB and SHOP assets throughout the United States and increasing portfolio Occupancy Select Geographic Mix (1) Refer to slide 3 for additional information. (2) Percentages are based on NOI for the six months ended June 30, 2021. See appendix for a reconciliation of aggregate NOI to ag gre gate GAAP net income. (3) Based on square feet as of June 30, 2021. $64 million NOI (2) Diversified Geographic Asset Exposure High - Quality Portfolio Top 10 States (3) MOB NNN SHOP x Dynamic portfolio featuring a balance of high - quality and resilient MOB & NNN assets that feature embedded contractual rental increases and an actively managed SHOP portfolio x Increased geographic diversification to 33 states in Q2’21 with the acquisition of two properties in NY and three properties in OK x Collected approximately 100% of 2021 and 2020 original Cash Rent across the MOB and NNN portfolios (1) Portfolio Highlights
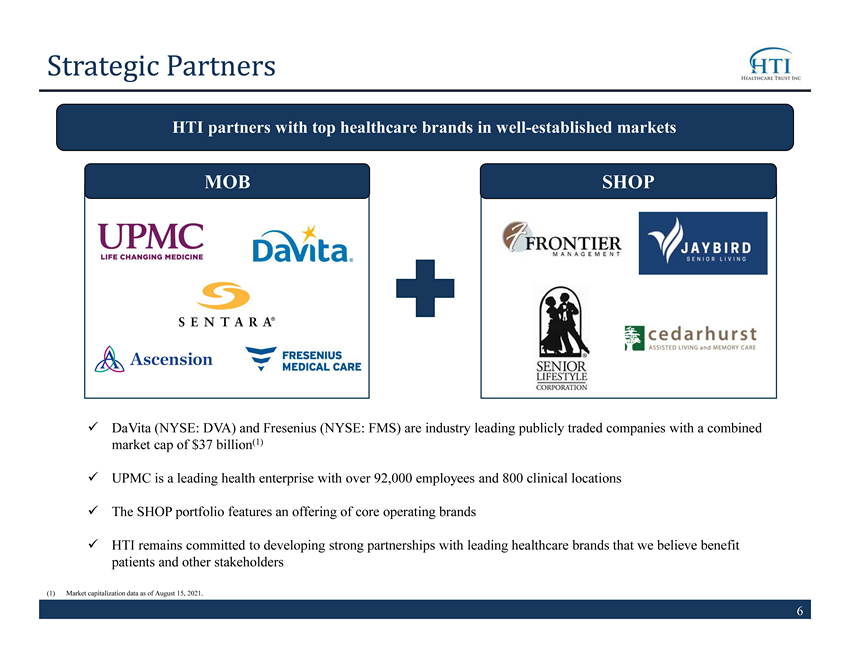
6 x DaVita (NYSE: DVA) and Fresenius (NYSE: FMS) are industry leading publicly traded companies with a combined market cap of $37 billion (1) x UPMC is a leading health enterprise with over 92,000 employees and 800 clinical locations x The SHOP portfolio features an offering of core operating brands x HTI remains committed to developing strong partnerships with leading healthcare brands that we believe benefit patients and other stakeholders Strategic Partners HTI partners with top healthcare brands in well - established markets MOB SHOP (1) Market capitalization data as of August 15, 2021.
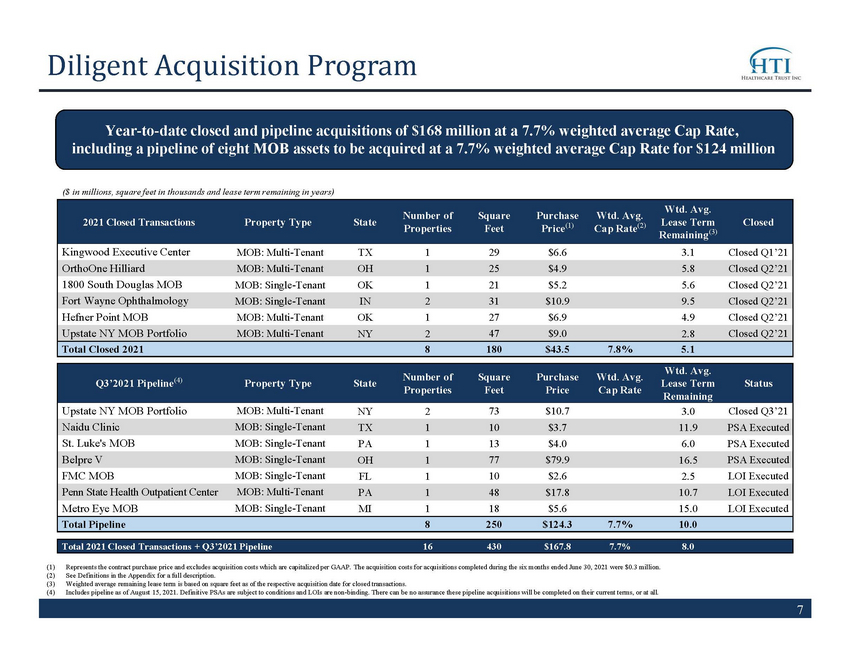
7 Year - to - date closed and pipeline acquisitions of $168 million at a 7.7% weighted average Cap Rate, including a pipeline of eight MOB assets to be acquired at a 7.7% weighted average Cap Rate for $124 million (1) Represents the contract purchase price and excludes acquisition costs which are capitalized per GAAP. The acquisition costs f or acquisitions completed during the six months ended June 30, 2021 were $0.3 million. (2) See Definitions in the Appendix for a full description. (3) Weighted average remaining lease term is based on square feet as of the respective acquisition date for closed transactions. (4) Includes pipeline as of August 15, 2021. Definitive PSAs are subject to conditions and LOIs are non - binding. There can be no ass urance these pipeline acquisitions will be completed on their current terms, or at all. ($ in millions, square feet in thousands and lease term remaining in years) Diligent Acquisition Program 2021 Closed Transactions Property Type State Number of Properties Square Feet Purchase Price (1) Wtd . Avg. Cap Rate (2) Wtd . Avg. Lease Term Remaining (3) Closed Kingwood Executive Center MOB: Multi - Tenant TX 1 29 $6.6 3.1 Closed Q1’21 OrthoOne Hilliard MOB: Multi - Tenant OH 1 25 $4.9 5.8 Closed Q2’21 1800 South Douglas MOB MOB: Single - Tenant OK 1 21 $5.2 5.6 Closed Q2’21 Fort Wayne Ophthalmology MOB: Single - Tenant IN 2 31 $10.9 9.5 Closed Q2’21 Hefner Point MOB MOB: Multi - Tenant OK 1 27 $6.9 4.9 Closed Q2’21 Upstate NY MOB Portfolio MOB: Multi - Tenant NY 2 47 $9.0 2.8 Closed Q2’21 Total Closed 2021 8 180 $43.5 7.8% 5.1 Q3’2021 Pipeline (4) Property Type State Number of Properties Square Feet Purchase Price Wtd . Avg. Cap Rate Wtd . Avg. Lease Term Remaining Status Upstate NY MOB Portfolio MOB: Multi - Tenant NY 2 73 $10.7 3.0 Closed Q3’21 Naidu Clinic MOB: Single - Tenant TX 1 10 $3.7 11.9 PSA Executed St. Luke's MOB MOB: Single - Tenant PA 1 13 $4.0 6.0 PSA Executed Belpre V MOB: Single - Tenant OH 1 77 $79.9 16.5 PSA Executed FMC MOB MOB: Single - Tenant FL 1 10 $2.6 2.5 LOI Executed Penn State Health Outpatient Center MOB: Multi - Tenant PA 1 48 $17.8 10.7 LOI Executed Metro Eye MOB MOB: Single - Tenant MI 1 18 $5.6 15.0 LOI Executed Total Pipeline 8 250 $124.3 7.7% 10.0 Total 2021 Closed Transactions + Q3’ 2021 Pipeline 16 430 $167.8 7.7% 8.0
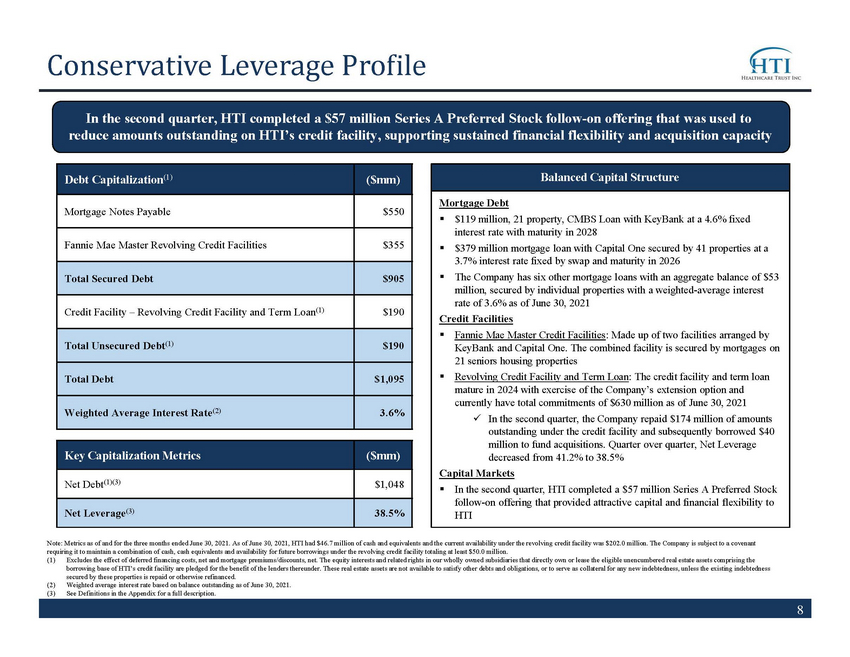
8 Mortgage Debt ▪ $119 million, 21 property, CMBS Loan with KeyBank at a 4.6% fixed interest rate with maturity in 2028 ▪ $379 million mortgage loan with Capital One secured by 41 properties at a 3.7 % interest rate fixed by swap and maturity in 2026 ▪ The Company has six other mortgage loans with an aggregate balance of $ 53 million, secured by individual properties with a weighted - average interest rate of 3.6 % as of June 30, 2021 Credit Facilities ▪ Fannie Mae Master Credit Facilities : Made up of two facilities arranged by KeyBank and Capital One. The combined facility is secured by mortgages on 21 seniors housing properties ▪ Revolving Credit Facility and Term Loan : The credit facility and term loan mature in 2024 with exercise of the Company’s extension option and currently have total commitments of $630 million as of June 30, 2021 x In the second quarter, the Company repaid $174 million of amounts outstanding under the credit facility and subsequently borrowed $40 million to fund acquisitions. Quarter over quarter, Net Leverage decreased from 41.2% to 38.5% Capital Markets ▪ In the second quarter, HTI completed a $57 million Series A Preferred Stock follow - on offering that provided attractive capital and financial flexibility to HTI Debt Capitalization (1) ($mm) Mortgage Notes Payable $550 Fannie Mae Master Revolving Credit Facilities $355 Total Secured Debt $905 Credit Facility – Revolving Credit Facility and Term Loan (1) $190 Total Unsecured Debt (1) $190 Total Debt $1,095 Weighted Average Interest Rate (2) 3.6% Key Capitalization Metrics ($mm) Net Debt (1) (3) $1,048 Net Leverage (3) 38.5% Balanced Capital Structure In the second quarter, HTI completed a $57 million Series A Preferred Stock follow - on offering that was used to reduce amounts outstanding on HTI’s credit facility, supporting sustained financial flexibility and acquisition capacity Note: Metrics as of and for the three months ended June 30, 2021. As of June 30, 2021, HTI had $ 46.7 million of cash and equivalents and the current availability under the revolving credit facility was $ 202.0 million. The Company is subject to a covenant requiring it to maintain a combination of cash, cash equivalents and availability for future borrowings under the revolving c red it facility totaling at least $50.0 million. (1) Excludes the effect of deferred financing costs, net and mortgage premiums/discounts, net. The equity interests and related r igh ts in our wholly owned subsidiaries that directly own or lease the eligible unencumbered real estate assets comprising the borrowing base of HTI’s credit facility are pledged for the benefit of the lenders thereunder. These real estate assets are n ot available to satisfy other debts and obligations, or to serve as collateral for any new indebtedness, unless the existing ind ebt edness secured by these properties is repaid or otherwise refinanced. (2) Weighted average interest rate based on balance outstanding as of June 30, 2021. (3) See Definitions in the Appendix for a full description. Conservative Leverage Profile
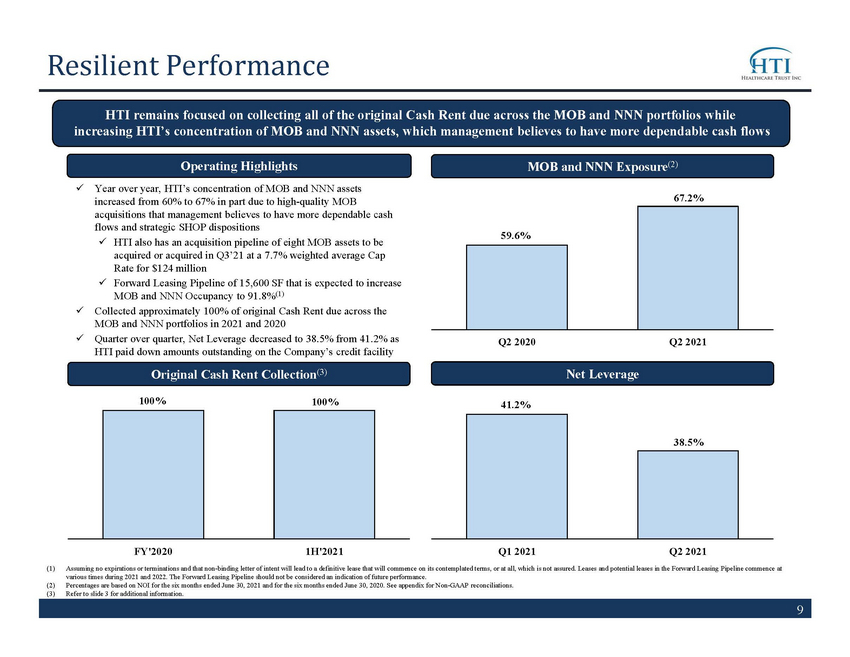
9 Resilient Performance HTI remains focused on collecting all of the original Cash Rent due across the MOB and NNN portfolios while increasing HTI’s concentration of MOB and NNN assets, which management believes to have more dependable cash flows MOB and NNN Exposure (2) Original Cash Rent Collection (3) Net Leverage x Year over year, HTI’s concentration of MOB and NNN assets increased from 60% to 67% in part due to high - quality MOB acquisitions that management believes to have more dependable cash flows and strategic SHOP dispositions x HTI also has an acquisition pipeline of eight MOB assets to be acquired or acquired in Q3’21 at a 7.7% weighted average Cap Rate for $124 million x Forward Leasing Pipeline of 15,600 SF that is expected to increase MOB and NNN Occupancy to 91.8% (1) x Collected approximately 100% of original Cash Rent due across the MOB and NNN portfolios in 2021 and 2020 x Quarter over quarter, Net Leverage decreased to 38.5% from 41.2% as HTI paid down amounts outstanding on the Company’s credit facility Operating Highlights (1) Assuming no expirations or terminations and that non - binding letter of intent will lead to a definitive lease that will commence on its contemplated terms, or at all, which is not assured. Leases and potential leases in the Forward Leasing Pipeline comme nc e at various times during 2021 and 2022. The Forward Leasing Pipeline should not be considered an indication of future performance . (2) Percentages are based on NOI for the six months ended June 30, 2021 and for the six months ended June 30, 2020. See appendix for Non - GAAP reconciliations. (3) Refer to slide 3 for additional information. 41.2% 38.5% Q1 2021 Q2 2021 100% 100% FY'2020 1H'2021 59.6% 67.2% Q2 2020 Q2 2021
10 Company Highlights HTI remains focused on collecting all of the original Cash Rent due across the MOB and NNN portfolios while continuing to acquire high - quality MOB and SHOP properties and maintaining moderate leverage x Collected approximately 100% of the original Cash Rent due from the Company’s MOB and NNN portfolios in 2021 and 2020 (1) x High - Quality Portfolio of 195 healthcare properties comprised of 58% MOB, 33% SHOP and 9% NNN properties (2) x Diligent Acquisition Program (3) of over $168 million closed and pipeline acquisitions at a 7.7% weighted average Cap Rate, including eight properties acquired in Q3’21 or to be acquired at a 7.7% weighted average Cap Rate for $124 million as HTI continues to seek opportunistic accretive acquisitions x Conservative Balance Sheet with Net Leverage of 38.5% as compared to 41.2% in Q1’21 x Resilient Performance with year over year increases in MOB and NNN portfolio exposure (2) and a forward Leasing Pipeline of 15,600 SF that is expected to increase MOB and NNN Occupancy to 91.8% (4) x Experienced Management Team with a proven track record and significant public REIT experience (1) See slide 3 for further details. (2) Percentages based on NOI for the six months ended June 30, 2021. See appendix for Non - GAAP reconciliations. (3) See slide 7 for further details. (4) Assuming no expirations or terminations and that non - binding letter of intent will lead to a definitive lease that will commence on its contemplated terms, or at all, which is not assured. Leases and potential leases in the Forward Leasing Pipeline comme nc e at various times during 2021 and 2022. The Forward Leasing Pipeline should not be considered an indication of future performance .
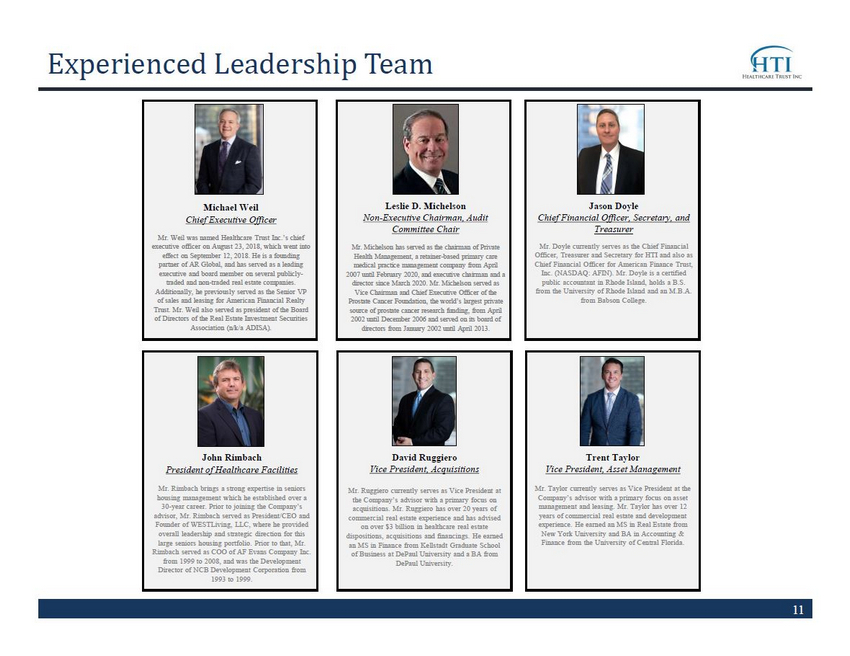
11 Experienced Leadership Team Jason Doyle Chief Financial Officer, Secretary, and Treasurer Mr. Doyle currently serves as the Chief Financial Officer, Treasurer and Secretary for HTI and also as Chief Financial Officer for American Finance Trust, Inc. (NASDAQ: AFIN). Mr. Doyle is a certified public accountant in Rhode Island, holds a B.S. from the University of Rhode Island and an M.B.A. from Babson College. Leslie D. Michelson Non - Executive Chairman, Audit Committee Chair Mr. Michelson has served as the chairman of Private Health Management, a retainer - based primary care medical practice management company from April 2007 until February 2020, and executive chairman and a director since March 2020. Mr. Michelson served as Vice Chairman and Chief Executive Officer of the Prostate Cancer Foundation, the world’s largest private source of prostate cancer research funding, from April 2002 until December 2006 and served on its board of directors from January 2002 until April 2013. David Ruggiero Vice President, Acquisitions Mr. Ruggiero currently serves as Vice President at the Company’s advisor with a primary focus on acquisitions. Mr. Ruggiero has over 20 years of commercial real estate experience and has advised on over $3 billion in healthcare real estate dispositions, acquisitions and financings. He earned an MS in Finance from Kellstadt Graduate School of Business at DePaul University and a BA from DePaul University. Trent Taylor Vice President, Asset Management Mr. Taylor currently serves as Vice President at the Company’s advisor with a primary focus on asset management and leasing. Mr. Taylor has over 12 years of commercial real estate and development experience. He earned an MS in Real Estate from New York University and BA in Accounting & Finance from the University of Central Florida. Michael Weil Chief Executive Officer Mr. Weil was named Healthcare Trust Inc.’s chief executive officer on August 23, 2018, which went into effect on September 12, 2018. He is a founding partner of AR Global, and has served as a leading executive and board member on several publicly - traded and non - traded real estate companies. Additionally, he previously served as the Senior VP of sales and leasing for American Financial Realty Trust. Mr. Weil also served as president of the Board of Directors of the Real Estate Investment Securities Association (n/k/a ADISA). John Rimbach President of Healthcare Facilities Mr. Rimbach brings a strong expertise in seniors housing management which he established over a 30 - year career. Prior to joining the Company’s advisor, Mr. Rimbach served as President/CEO and Founder of WESTLiving , LLC, where he provided overall leadership and strategic direction for this large seniors housing portfolio. Prior to that, Mr. Rimbach served as COO of AF Evans Company Inc. from 1999 to 2008, and was the Development Director of NCB Development Corporation from 1993 to 1999.
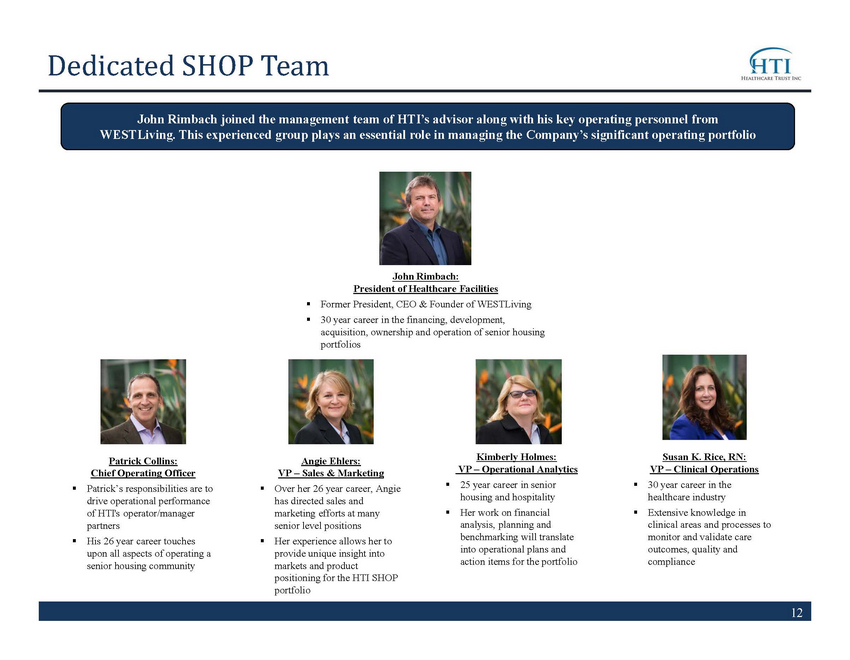
12 Dedicated SHOP Team Kimberly Holmes: VP – Operational Analytics ▪ 25 year career in senior housing and hospitality ▪ Her work on financial analysis, planning and benchmarking will translate into operational plans and action items for the portfolio Susan K. Rice, RN: VP – Clinical Operations ▪ 30 year career in the healthcare industry ▪ Extensive knowledge in clinical areas and processes to monitor and validate care outcomes, quality and compliance Patrick Collins: Chief Operating Officer ▪ Patrick’s responsibilities are to drive operational performance of HTI's operator/manager partners ▪ His 26 year career touches upon all aspects of operating a senior housing community John Rimbach: President of Healthcare Facilities ▪ Former President, CEO & Founder of WESTLiving ▪ 30 year career in the financing, development, acquisition, ownership and operation of senior housing portfolios Angie Ehlers: VP – Sales & Marketing ▪ Over her 26 year career, Angie has directed sales and marketing efforts at many senior level positions ▪ Her experience allows her to provide unique insight into markets and product positioning for the HTI SHOP portfolio John Rimbach joined the management team of HTI’s advisor along with his key operating personnel from WESTLiving . This experienced group plays an essential role in managing the Company’s significant operating portfolio
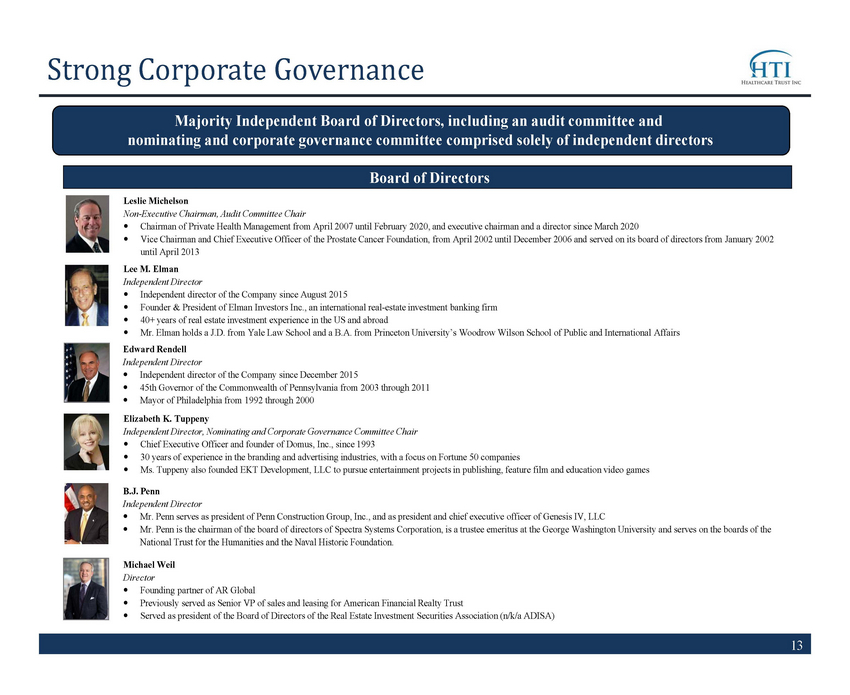
13 Board of Directors Lee M. Elman Independent Director Independent director of the Company since August 2015 Founder & President of Elman Investors Inc., an international real - estate investment banking firm 40+ years of real estate investment experience in the US and abroad Mr. Elman holds a J.D. from Yale Law School and a B.A. from Princeton University’s Woodrow Wilson School of Public and Intern ati onal Affairs Leslie Michelson Non - Executive Chairman, Audit Committee Chair Chairman of Private Health Management from April 2007 until February 2020, and executive chairman and a director since March 202 0 Vice Chairman and Chief Executive Officer of the Prostate Cancer Foundation, from April 2002 until December 2006 and served o n i ts board of directors from January 2002 until April 2013 B.J. Penn Independent Director Mr. Penn serves as president of Penn Construction Group, Inc., and as president and chief executive officer of Genesis IV, LL C Mr. Penn is the chairman of the board of directors of Spectra Systems Corporation, is a trustee emeritus at the George Washin gto n University and serves on the boards of the National Trust for the Humanities and the Naval Historic Foundation. Edward Rendell Independent Director Independent director of the Company since December 2015 45th Governor of the Commonwealth of Pennsylvania from 2003 through 2011 Mayor of Philadelphia from 1992 through 2000 Strong Corporate Governance Elizabeth K. Tuppeny Independent Director, Nominating and Corporate Governance Committee Chair Chief Executive Officer and founder of Domus, Inc., since 1993 30 years of experience in the branding and advertising industries, with a focus on Fortune 50 companies Ms. Tuppeny also founded EKT Development, LLC to pursue entertainment projects in publishing, feature film and education vide o g ames Majority Independent Board of Directors, including an audit committee and nominating and corporate governance committee comprised solely of independent directors Michael Weil Director Founding partner of AR Global Previously served as Senior VP of sales and leasing for American Financial Realty Trust Served as president of the Board of Directors of the Real Estate Investment Securities Association (n/k/a ADISA)

14 Legal Notice
15 Disclaimer References in this presentation to the “Company,” “we,” “us” and “our” refer to Healthcare Trust, Inc. (“ HTI”) and its consolidated subsidiaries. The statements in this presentation that are not historical facts may be forward - looking statements. These forward - looking state ments involve risks and uncertainties that could cause actual results or events to be materially different. Forward - looking statements may include, but are not limited to, statements regarding stockholder liquidity and investment value and returns. The words “anticipates,” “believes,” “expects,” “estimates, ” “ projects,” “plans,” “intends,” “may,” “will,” “would” and similar expressions are intended to identify forward - looking statements, although not all forward - loo king statements contain these identifying words. Actual results may differ materially from those contemplated by such forward - looking statements, including th ose set forth in the section titled Risk Factors of HTI’s Annual Report on Form 10 - K for the year ended December 31, 2020 filed on March 30 , 2021, the Company's Quarterly Reports on Form 10 - Q filed on May 14, 2021 and August 13, 2021 and all other filings with the SEC after that date, as such risks, uncertainties and other important factors may be updated from time to time in HTI’s subsequent reports. Please see pages 16 and 17 for further information. Further, fo rwa rd - looking statements speak only as of the date they are made, and HTI undertakes no obligation to update or revise any forward - looking statement to reflect changed assumptions, the occurrence of unanticipated events or changes to future operating results, unless required to do so by law. This presentation includes estimated projections of future operating results. These projections were not prepared in accordan ce with published guidelines of the SEC or the guidelines established by the American Institute of Certified Public Accountants for preparation and presentation of financial projections. This information is not fact and should not be relied upon as being necessarily indicative of future results; the projections were pr epared in good faith by management and are based on numerous assumptions that may prove to be wrong. Important factors that may affect actual results an d cause the projections to not be achieved include, but are not limited to, risks and uncertainties relating to the company and other factors described in the section titled Risk Factors of HTI’s Annual Report on Form 10 - K for the year ended December 31, 2020 filed on March 30 , 2021, the Company's Quarterly Reports on Form 10 - Q filed on May 14, 2021 and August 13, 2021 and all other filings with the SEC after that date. The projections also reflect assumptions as to certain business decisions that are subject to change. As a result, actual results may differ materially from those contained in the estimates. Accordin gly , there can be no assurance that the estimates will be realized. This presentation includes certain non - GAAP financial measures, including net operating income (“NOI”). NOI is a non - GAAP measur es of our financial performance and should not be considered as alternatives to net income as a measure of financial performance, or any other pe rfo rmance measure derived in accordance with GAAP and they should not be construed as an inference that our future results will be unaffected by unusual o r n on - recurring items. The reconciliations of net income to NOI for the applicable period are set forth on page 20 to this presentation.
16 Forward Looking Statements Certain statements made in this presentation are “forward - looking statements” (as defined in Section 21E of the Exchange Act), w hich reflect the expectations of the Company regarding future events. The forward - looking statements involve a number of risks, uncertainties and other factor s that could cause actual results to differ materially from those contained in the forward - looking statements. Such forward - looking statements include, bu t are not limited to, market and other expectations, objectives, and intentions, as well as any other statements that are not historical facts. Our potential risks and uncertainties are presented in the section titled Risk in the section titled “Item 1A - Risk Factors” disc losed in our Annual Report on Form 10 - K for the year ended December 31, 2020 filed with the SEC on March 30, 2021, the Company's Quarterly Report on Form 10 - Q filed on May 14, 2021 as well as all other filings with the SEC after that date. We disclaim any obligation to update and revise statements contain ed in these materials to reflect changed assumptions, the occurrence of unanticipated events or changes to future operating results over time, unless required by law. The following are some of the risks and uncertainties relating to us, although not all risks and uncertainties, that could cause our actual results to differ materially from those presented in our forward - looking statements: • Our operating results are affected by economic and regulatory changes that have an adverse impact on the real estate market i n g eneral. • Our property portfolio has a high concentration of properties located in Pennsylvania, Iowa and Florida. Our properties may b e a dversely affected by economic cycles and risks inherent to those states. • Our Credit Facility restricts us from paying cash distributions on or repurchasing our common stock until we make an election to do so and are able to meet certain liquidity and leverage conditions, which is not assured, and there can be no assurance we will be able to resume pa ying distributions on our common stock, and at what rate, or continue paying dividends on our 7.375% Series A Cumulative Redeemable Perpetual Preferred St ock at the current rate. • Our Credit Facility restricts our ability to use cash that would otherwise be available to us, and there can be no assurance our available liquidity will be sufficient to meet our capital needs. • We are subject to risks associated with a pandemic, epidemic or outbreak of a contagious disease, such as the ongoing global COV ID - 19 pandemic, including negative impacts on our tenants and operators and their respective businesses. • In the Company's SHOP portfolio during March 2020, due to the COVID - 19 pandemic, occupancy trended lower in the second half of t he month and operating costs began to rise materially, including for services, labor and personal protective equipment and other supplies. At our SHOP facilities, we bear these cost increases. These trends accelerated during the second, third, and fourth quarters of 2020, and continued into th e beginning of 2021 as the surge of new COVID - 19 cases that started in late 2020 crested before leveling off during the second quarter of 2021. There can b e no assurance, however, that future developments in the course of the pandemic will not cause further adverse impacts to the Company’s occup anc y and cost levels, and these trends may continue to impact the Company and have a material adverse effect on the Company’s revenues and income i n o ther quarters.
17 Forward Looking Statements (Continued) • No public market currently exists, or may ever exist, for shares of our common stock and our shares are, and may continue to be, illiquid. • In owning properties we may experience, among other things, unforeseen costs associated with complying with laws and regulati ons and other costs, potential difficulties selling properties and potential damages or losses resulting from climate change. • We focus on acquiring and owning a diversified portfolio of healthcare - related assets located in the United States and are subje ct to risks inherent in concentrating investments in the healthcare industry. • The healthcare industry is heavily regulated, and new laws or regulations, changes to existing laws or regulations, loss of l ice nsure or failure to obtain licensure could result in the inability of tenants to make lease payments to us. • We depend on tenants for our rental revenue and, accordingly, our rental revenue is dependent upon the success and economic v iab ility of our tenants. If a tenant or lease guarantor declares bankruptcy or becomes insolvent, we may be unable to collect balances due under relevant leases. • We assume additional operational risks and are subject to additional regulation and liability because we depend on eligible i nde pendent contractors to manage some of our facilities. • We have substantial indebtedness and may be unable to repay, refinance, restructure or extend our indebtedness as it becomes due . Increases in interest rates could increase the amount of our debt payments. We may incur additional indebtedness in the future. • We depend on the Advisor and Property Manager to provide us with executive officers, key personnel and all services required for us to conduct our operations. • All of our executive officers face conflicts of interest, such as conflicts created by the terms of our agreements with the A dvi sor and compensation payable thereunder, conflicts allocating investment opportunities to us, and conflicts in allocating their time and attention to our mat ters. Conflicts that arise may not be resolved in our favor and could result in actions that are adverse to us. • We have long - term agreements with our Advisor and its affiliates that may be terminated only in limited circumstances and may re quire us to pay a termination fee in some cases. • Estimated Per - Share NAV may not accurately reflect the value of our assets and may not represent what a stockholder may receive on a sale of the shares, what they may receive upon a liquidation of our assets and distribution of the net proceeds or what a third party may pay to acquire us . • The stockholder rights plan adopted by our board of directors, our classified board and other aspects of our corporate struct ure and Maryland law may discourage a third party from acquiring us in a manner that might result in a premium price to our stockholders. • Restrictions on share ownership contained in our charter may inhibit market activity in shares of our stock and restrict our bus iness combination opportunities. • We may fail to continue to qualify as a REIT.
18 Appendix
19 Definitions Cap Rate : Capitalization rate is a rate of return on a real estate investment property based on the expected, annualized straight - lined rental income that the property will generate under its existing lease during its first year of ownership . Capitalization rate is calculated by dividing the annualized straight - lined rental income the property will generate (before debt service and depreciation and after fixed costs and variable costs) and the purchase price of the property . The weighted average capitalization rate is based upon square feet . Cash Rent : Represents total of all contractual rents on a cash basis due from tenants as stipulated in the originally executed lease agreements at inception or any lease amendments thereafter prior to a rent deferral agreement (see slide 3 for further information) . “Original Cash Rent” refers to contractual rents on a cash basis due from tenants as stipulated in their originally executed lease agreement at inception or as amended, prior to any rent deferral agreement . We calculate “Original Cash Rent collections” by comparing the total amount of rent collected during the period to the original Cash Rent due . Total rent collected during the period includes both original Cash Rent due and payments made by tenants pursuant to rent deferral agreements . Eliminating the impact of deferred rent paid, we collected approximately 100 % of original Cash Rent due in the second quarter of 2021 . Leasing Pipeline : Includes ( i ) all leases fully executed by both parties as of August 20 , 2021 , but after June 30 , 2021 and (ii) all leases under negotiation with an executed LOI by both parties as of August 20 , 2021 . This represents one executed new lease totaling approximately 2 , 500 square feet and four LOIs totaling approximately 13 , 100 square feet . No lease terminations or expirations occurred during this period . There can be no assurance that the LOIs will lead to definitive leases or will commence on its current terms, or at all . Leasing pipeline should not be considered an indication of future performance . Lease Term Remaining : Current portfolio calculated from June 30 , 2021 . Weighted based on square feet . Net Debt : For Q 2 ’ 2021 , represents total gross debt of $ 1 . 1 billion per slide 8 less cash and cash equivalents of $ 46 . 7 million as of June 30 , 2021 . For Q 1 ’ 2021 , represents total gross debt of $ 1 . 2 billion less cash and cash equivalents of $ 74 . 1 million as of March 31 , 2021 . NOI : Defined as a non - GAAP financial measure used by us to evaluate the operating performance of our real estate . NOI is equal to revenue from tenants, less property operating and maintenance . NOI excludes all other items of expense and income included in the financial statements in calculating net income (loss) . Net Leverage : For Q 2 ’ 2021 , represents “Net Debt” as defined above as debt less cash and cash equivalents divided by total assets of $ 2 . 2 billion (which includes cash and cash equivalents) plus accumulated depreciation and amortization of $ 544 . 9 million as of June 30 , 2021 . For Q 1 ’ 2021 , represents “Net Debt” as defined above as debt less cash and cash equivalents divided by total assets of $ 2 . 3 billion (which includes cash and cash equivalents) plus accumulated depreciation and amortization of $ 529 . 7 million as of March 31 , 2021 . Occupancy : For NNN and MOB properties, occupancy represents percentage of square footage of which the tenant has taken possession of divided by the respective total rentable square feet as of the date or period end indicated . For SHOP, occupancy represents total units occupied divided by total units available as of the date or period end indicated .
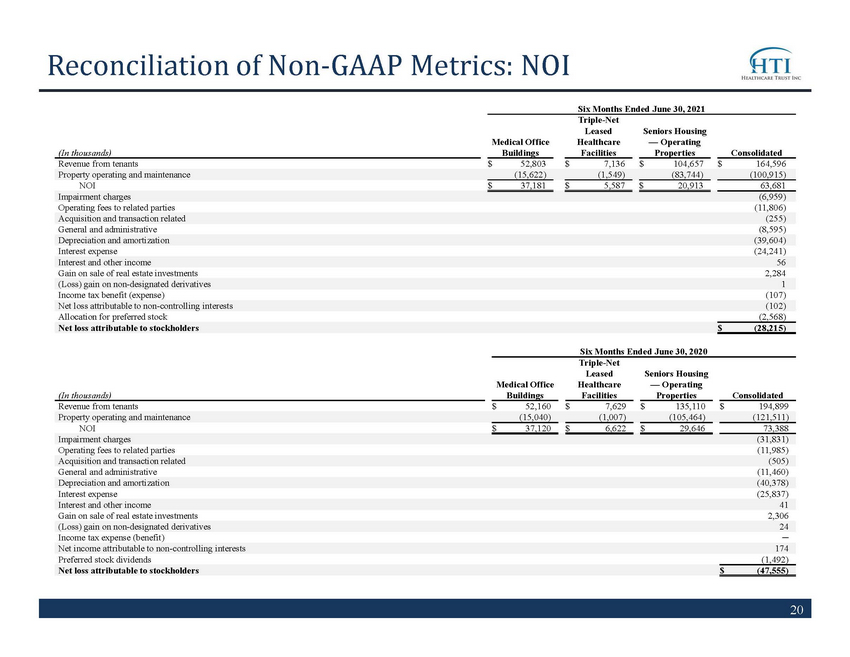
20 Reconciliation of Non - GAAP Metrics: NOI Six Months Ended June 30, 2021 (In thousands) Medical Office Buildings Triple - Net Leased Healthcare Facilities Seniors Housing — Operating Properties Consolidated Revenue from tenants $ 52,803 $ 7,136 $ 104,657 $ 164,596 Property operating and maintenance (15,622) (1,549) (83,744) (100,915) NOI $ 37,181 $ 5,587 $ 20,913 63,681 Impairment charges (6,959) Operating fees to related parties (11,806) Acquisition and transaction related (255) General and administrative (8,595) Depreciation and amortization (39,604) Interest expense (24,241) Interest and other income 56 Gain on sale of real estate investments 2,284 (Loss) gain on non - designated derivatives 1 Income tax benefit (expense) (107) Net loss attributable to non - controlling interests (102) Allocation for preferred stock (2,568) Net loss attributable to stockholders $ (28,215) Six Months Ended June 30, 2020 (In thousands) Medical Office Buildings Triple - Net Leased Healthcare Facilities Seniors Housing — Operating Properties Consolidated Revenue from tenants $ 52,160 $ 7,629 $ 135,110 $ 194,899 Property operating and maintenance (15,040) (1,007) (105,464) (121,511) NOI $ 37,120 $ 6,622 $ 29,646 73,388 Impairment charges (31,831) Operating fees to related parties (11,985) Acquisition and transaction related (505) General and administrative (11,460) Depreciation and amortization (40,378) Interest expense (25,837) Interest and other income 41 Gain on sale of real estate investments 2,306 (Loss) gain on non - designated derivatives 24 Income tax expense (benefit) ─ Net income attributable to non - controlling interests 174 Preferred stock dividends (1,492) Net loss attributable to stockholders $ (47,555)
21 HealthcareTrustInc.com ▪ For account information, including balances and the status of submitted paperwork, please call us at (866) 902 - 0063 ▪ Financial Advisors may view client accounts at www.computershare.com/advisorportal ▪ Shareholders may access their accounts at www.computershare.com/hti