Attached files
| file | filename |
|---|---|
| EX-32.2 - EX-32.2 - F45 Training Holdings Inc. | d211330dex322.htm |
| EX-32.1 - EX-32.1 - F45 Training Holdings Inc. | d211330dex321.htm |
| EX-31.2 - EX-31.2 - F45 Training Holdings Inc. | d211330dex312.htm |
| EX-31.1 - EX-31.1 - F45 Training Holdings Inc. | d211330dex311.htm |
Table of Contents
UNITED STATES
SECURITIES AND EXCHANGE COMMISSION
WASHINGTON, DC 20549
FORM 10-Q
(Mark One)
| ☒ | QUARTERLY REPORT PURSUANT TO SECTION 13 OR 15(d) OF THE SECURITIES EXCHANGE ACT OF 1934 |
For the quarterly period ended June 30, 2021
OR
| ☐ | TRANSITION REPORT PURSUANT TO SECTION 13 OR 15(d) OF THE SECURITIES EXCHANGE ACT OF 1934 |
For the transition period from to
Commission File Number: 001-40590
F45 Training Holdings Inc.
(Exact Name of Registrant as Specified in its Charter)
| Delaware | 38-3978689 | |
| (State or other jurisdiction of incorporation or organization) |
(I.R.S. Employer Identification No.) | |
| 801 Barton Springs Road, 9th Floor Austin, Texas |
78704 | |
| (Address of principal executive offices) | (Zip Code) | |
Registrant’s telephone number, including area code: (737) 787-1955
Securities registered pursuant to Section 12(b) of the Act:
| Title of each class |
Trading Symbol(s) |
Name of each exchange on which registered | ||
| Common Stock, par value $0.00005 per share | FXLV | The New York Stock Exchange |
Indicate by check mark whether the registrant (1) has filed all reports required to be filed by Section 13 or 15(d) of the Securities Exchange Act of 1934 during the preceding 12 months (or for such shorter period that the registrant was required to file such reports), and (2) has been subject to such filing requirements for the past 90 days. Yes ☐ No ☒
Indicate by check mark whether the registrant has submitted electronically every Interactive Data File required to be submitted pursuant to Rule 405 of Regulation S-T (§232.405 of this chapter) during the preceding 12 months (or for such shorter period that the registrant was required to submit such files). Yes ☒ No ☐
Indicate by check mark whether the registrant is a large accelerated filer, an accelerated filer, a non-accelerated filer, smaller reporting company, or an emerging growth company. See the definitions of “large accelerated filer,” “accelerated filer,” “smaller reporting company,” and “emerging growth company” in Rule 12b-2 of the Exchange Act.
| Large accelerated filer | ☐ | Accelerated filer | ☐ | |||
| Non-accelerated filer | ☒ | Smaller reporting company | ☒ | |||
| Emerging growth company | ☒ | |||||
If an emerging growth company, indicate by check mark if the registrant has elected not to use the extended transition period for complying with any new or revised financial accounting standards provided pursuant to Section 13(a) of the Exchange Act. ☐
Indicate by check mark whether the registrant is a shell company (as defined in Rule 12b-2 of the Exchange Act). Yes ☐ No ☒
As of August 30, 2021, the registrant had 90,554,571 shares of common stock, $0.00005 par value per share, outstanding.
Table of Contents
| Page | ||||||
| PART I. |
3 | |||||
| Item 1. |
3 | |||||
| 3 | ||||||
| Condensed Consolidated Statements of Operations and Comprehensive Loss |
4 | |||||
| 5 | ||||||
| 6 | ||||||
| 7 | ||||||
| Item 2. |
Management’s Discussion and Analysis of Financial Condition and Results of Operations |
32 | ||||
| Item 3. |
58 | |||||
| Item 4. |
59 | |||||
| PART II. |
61 | |||||
| Item 1. |
61 | |||||
| Item 1A. |
61 | |||||
| Item 2. |
61 | |||||
| Item 3. |
62 | |||||
| Item 4. |
62 | |||||
| Item 5. |
62 | |||||
| Item 6. |
62 | |||||
| 63 | ||||||
i
Table of Contents
FORWARD-LOOKING STATEMENTS
This Quarterly Report on Form 10-Q contains “forward-looking statements” within the meaning of Section 27A of the Securities Act of 1933, as amended, or the Securities Act, and Section 21E of the Securities Exchange Act of 1934, as amended, or the Exchange Act. Forward-looking statements generally relate to future events or our future financial or operating performance. In some cases, you can identify forward-looking statements because they contain words such as “may,” “will,” “should,” “expects,” “plans,” “anticipates,” “could,” “intends,” “target,” “projects,” “contemplates,” “believes,” “estimates,” “predicts,” “potential,” or “continue” or the negative of these words, variations of these words or other similar terms or expressions that concern our expectations, strategy, plans, or intentions. Such forward-looking statements are subject to certain risks, uncertainties and assumptions relating to factors that could cause actual results to differ materially from those anticipated in such statements, including, without limitation, the following:
| • | our dependence on the operational and financial results of, and our relationships with, our franchisees and the success of their new and existing studios; |
| • | our ability to protect our brand and reputation; |
| • | our ability to identify, recruit and contract with a sufficient number of qualified franchisees; |
| • | our ability to execute our growth strategy, including through development of new studios by new and existing franchisees; |
| • | our ability to manage our growth and the associated strain on our resources; |
| • | our ability to successfully integrate any acquisitions, or realize their anticipated benefits; |
| • | the high level of competition in the health and fitness industry; |
| • | economic, political and other risks associated with our international operations; |
| • | changes to the industry in which we operate; |
| • | our reliance on information systems and our and our franchisees’ ability to properly maintain the confidentiality and integrity of our data; |
| • | the occurrence of cyber incidents or a deficiency in our cybersecurity protocols; |
| • | our and our franchisees’ ability to attract and retain members; |
| • | our and our franchisees’ ability to identify and secure suitable sites for new franchise studios; |
| • | risks related to franchisees generally; |
| • | our ability to obtain third-party licenses for the use of music to supplement our workouts; |
| • | certain health and safety risks to members that arise while at our studios; |
| • | our ability to adequately protect our intellectual property; |
| • | risks associated with the use of social media platforms in our marketing; |
| • | our ability to obtain and retain high-profile strategic partnership arrangements; |
| • | our ability to comply with existing or future franchise laws and regulations; |
| • | our ability to anticipate and satisfy consumer preferences and shifting views of health and fitness; |
| • | our business model being susceptible to litigation; |
| • | the increased expenses associated with being a public company; and |
| • | additional factors discussed in our filings with the Securities and Exchange Commission, or the SEC. |
You should not rely upon forward-looking statements as predictions of future events. We have based the forward-looking statements contained in this Quarterly Report on Form 10-Q [primarily] on our current expectations and projections about future events and trends that we believe may affect our business, results of operations, financial condition and prospects.
The outcome of the events described in these forward-looking statements is subject to risks, uncertainties and other factors described in the section titled “Risk Factors” in our Final Prospectus dated July 14, 2021. Moreover, we operate in a very competitive and rapidly changing environment. New risks and uncertainties emerge from time to time, and it is not possible for us to predict all risks and uncertainties that could have an impact on the forward- looking statements contained in this Quarterly Report on Form 10-Q. We cannot assure you that the results, events, and circumstances reflected in the forward-looking statements will be achieved or occur, and actual results, events or circumstances could differ materially from those described in the forward-looking statements.
The forward-looking statements made in this Quarterly Report on Form 10-Q relate only to events as of the date on which the statements are made. We undertake no obligation to update any forward-looking statements made in this Quarterly Report on Form 10-Q to reflect events or circumstances after the date of this report or to reflect new information or the occurrence of unanticipated events, except as required by law. We may not actually achieve the plans, intentions, or expectations disclosed in our forward-looking statements, and you should not place undue reliance on our forward-looking statements. Our forward-looking statements do not reflect the potential impact of any future acquisitions, mergers, dispositions, joint ventures, or investments we may make.
1
Table of Contents
In addition, statements that “we believe” and similar statements reflect our beliefs and opinions on the relevant subject. These statements are based upon information available to us as of the date of this Quarterly Report on Form 10-Q, and while we believe such information forms a reasonable basis for such statements, such information may be limited or incomplete, and our statements should not be read to indicate that we have conducted an exhaustive inquiry into, or review of, all potentially available relevant information. These statements are inherently uncertain, and investors are cautioned not to unduly rely upon these statements.
2
Table of Contents
CONDENSED CONSOLIDATED BALANCE SHEETS
(in thousands, except share amounts and share data)
(unaudited)
| June 30, 2021 | December 31, 2020 | |||||||
| Assets |
||||||||
| Current assets: |
||||||||
| Cash and cash equivalents |
$ | 16,604 | $ | 28,967 | ||||
| Restricted cash |
1,557 | — | ||||||
| Accounts receivable, net |
12,683 | 9,582 | ||||||
| Due from related parties |
1,855 | 2,406 | ||||||
| Inventories |
6,380 | 4,485 | ||||||
| Deferred costs |
1,776 | 1,616 | ||||||
| Prepaid expenses |
3,795 | 2,891 | ||||||
| Other current assets |
8,456 | 2,452 | ||||||
|
|
|
|
|
|||||
| Total current assets |
53,106 | 52,399 | ||||||
| Property and equipment, net |
895 | 884 | ||||||
| Deferred tax assets, net |
6,940 | 7,096 | ||||||
| Intangible assets, net |
21,852 | 1,758 | ||||||
| Deferred costs, net of current |
11,834 | 11,215 | ||||||
| Other long-term assets |
12,331 | 5,165 | ||||||
|
|
|
|
|
|||||
| Total assets |
$ | 106,958 | $ | 78,517 | ||||
|
|
|
|
|
|||||
| Liabilities, convertible preferred stock and stockholders’ deficit |
||||||||
| Current liabilities: |
||||||||
| Accounts payable and accrued expenses |
$ | 26,317 | $ | 18,657 | ||||
| Deferred revenue |
10,457 | 3,783 | ||||||
| Interest payable |
143 | 250 | ||||||
| Current portion of long-term debt |
6,977 | 5,847 | ||||||
| Income taxes payable |
4,315 | 3,499 | ||||||
|
|
|
|
|
|||||
| Total current liabilities |
48,209 | 32,036 | ||||||
| Deferred revenue, net of current |
7,508 | 10,312 | ||||||
| Long-term derivative liability |
85,243 | 36,640 | ||||||
| Long-term debt, net of current |
248,354 | 236,186 | ||||||
| Other long-term liabilities |
26,464 | 4,890 | ||||||
|
|
|
|
|
|||||
| Total liabilities |
415,778 | 320,064 | ||||||
| Commitments and contingencies (Note 11) |
||||||||
| Convertible preferred stock, $0.0001 par value; 9,854,432 shares issued and outstanding as of June 30, 2021 and December 31, 2020 (Note 12) |
98,544 | 98,544 | ||||||
| Stockholders’ deficit |
||||||||
| Common stock, $0.00005 par value; 29,281,514 shares issued and outstanding as of June 30, 2021 and December 31, 2020 |
1 | 1 | ||||||
| Additional paid-in capital |
11,456 | 11,456 | ||||||
| Accumulated other comprehensive loss |
(886 | ) | (982 | ) | ||||
| Accumulated deficit |
(243,215 | ) | (175,846 | ) | ||||
| Less: Treasury stock |
(174,720 | ) | (174,720 | ) | ||||
|
|
|
|
|
|||||
| Total stockholders’ deficit |
(407,364 | ) | (340,091 | ) | ||||
|
|
|
|
|
|||||
| Total liabilities, convertible preferred stock and stockholders’ deficit |
$ | 106,958 | $ | 78,517 | ||||
|
|
|
|
|
|||||
The accompanying notes are an integral part of these unaudited condensed consolidated financial statements.
3
Table of Contents
CONDENSED CONSOLIDATED STATEMENTS OF OPERATIONS AND COMPREHENSIVE (LOSS) INCOME
(in thousands, except share amounts and share data)
(unaudited)
| Three Months Ended June 30, |
Six Months Ended June 30, |
|||||||||||||||
| 2021 | 2020 | 2021 | 2020 | |||||||||||||
| Revenues: |
||||||||||||||||
| Franchise (Related party: $50 and $137 for the three months ended June 30, 2021 and 2020, respectively, and $100 and $234 for the six months ended June 30, 2021 and 2020, respectively) |
$ | 20,581 | $ | 12,061 | $ | 33,737 | $ | 25,699 | ||||||||
| Equipment and merchandise (Related party: $0 and $112 for the three months ended June 30, 2021 and 2020, respectively, and $0 and $112 for the six months ended June 30, 2021 and 2020, respectively) |
6,251 | 5,397 | 11,286 | 16,601 | ||||||||||||
|
|
|
|
|
|
|
|
|
|||||||||
| Total revenues |
26,832 | 17,458 | 45,023 | 42,300 | ||||||||||||
| Costs and operating expenses: |
||||||||||||||||
| Cost of franchise revenue (Related party $0 and $0 for the three months ended June 30, 2021 and 2020, respectively, and $0 and $12 for the six months ended June 30, 2021 and 2020, respectively) |
1,462 | 1,410 | 2,676 | 4,594 | ||||||||||||
| Cost of equipment and merchandise (Related party: $1,203 and $265 for the three months ended June 30, 2021 and 2020, respectively, and $2,144 and $1,316 for the six months ended June 30, 2021 and 2020, respectively) |
3,739 | 2,832 | 6,920 | 9,163 | ||||||||||||
| Selling, general and administrative expenses |
18,562 | 7,633 | 35,390 | 21,624 | ||||||||||||
|
|
|
|
|
|
|
|
|
|||||||||
| Total costs and operating expenses |
23,763 | 11,875 | 44,986 | 35,381 | ||||||||||||
|
|
|
|
|
|
|
|
|
|||||||||
| Income (losses) from operations |
3,069 | 5,583 | 37 | 6,919 | ||||||||||||
| Loss on derivative liabilities |
23,098 | — | 48,603 | — | ||||||||||||
| Interest expense, net |
8,853 | 421 | 17,268 | 799 | ||||||||||||
| Other expense (income), net |
329 | (2,258 | ) | 620 | (577 | ) | ||||||||||
|
|
|
|
|
|
|
|
|
|||||||||
| (Loss) income before income taxes |
(29,211 | ) | 7,420 | (66,454 | ) | 6,697 | ||||||||||
| Provision for income taxes |
1,313 | 1,552 | 915 | 1,562 | ||||||||||||
|
|
|
|
|
|
|
|
|
|||||||||
| Net (loss) income |
$ | (30,524 | ) | $ | 5,868 | $ | (67,369 | ) | $ | 5,135 | ||||||
|
|
|
|
|
|
|
|
|
|||||||||
| Other comprehensive income (loss) |
||||||||||||||||
| Unrealized gain (loss) on interest rate swap, net of tax |
132 | 123 | 203 | (727 | ) | |||||||||||
| Foreign currency translation adjustment, net of tax |
(75 | ) | (1,845 | ) | (107 | ) | (564 | ) | ||||||||
|
|
|
|
|
|
|
|
|
|||||||||
| Comprehensive (loss) income |
$ | (30,467 | ) | $ | 4,146 | $ | (67,273 | ) | $ | 3,844 | ||||||
|
|
|
|
|
|
|
|
|
|||||||||
| Per share data: |
||||||||||||||||
| Net (loss) income per common share |
||||||||||||||||
| Basic and diluted |
(1.04 | ) | 0.07 | (2.30 | ) | 0.06 | ||||||||||
| Weighted average common shares outstanding | ||||||||||||||||
| Basic and diluted |
29,281,514 | 58,000,000 | 29,281,514 | 58,000,000 | ||||||||||||
The accompanying notes are an integral part of these unaudited condensed consolidated financial statements.
4
Table of Contents
CONDENSED CONSOLIDATED STATEMENTS OF CHANGES IN CONVERTIBLE PREFERRED STOCK AND STOCKHOLDERS’ DEFICIT
(in thousands, except share amounts)
(unaudited)
| Convertible Preferred Stock |
Common Stock | Additional Paid-In Capital |
Treasury Stock |
Accumulated other comprehensive loss |
Accumulated deficit |
Total Stockholders’ Deficit |
||||||||||||||||||||||||||||||
| Shares | Amount | Shares | Amount | |||||||||||||||||||||||||||||||||
| Balance at March 31, 2021 |
9,854,432 | $ | 98,544 | 29,281,514 | $ | 1 | $ | 11,456 | $ | (174,720 | ) | $ | (943 | ) | $ | (212,691 | ) | $ | (376,897 | ) | ||||||||||||||||
| Net loss |
— | — | — | — | — | — | — | (30,524 | ) | (30,524 | ) | |||||||||||||||||||||||||
| Unrealized gain on interest rate swap, net of tax |
— | — | — | — | — | — | 132 | — | 132 | |||||||||||||||||||||||||||
| Cumulative translation adjustment, net of tax |
— | — | — | — | — | — | (75 | ) | — | (75 | ) | |||||||||||||||||||||||||
|
|
|
|
|
|
|
|
|
|
|
|
|
|
|
|
|
|
|
|||||||||||||||||||
| Balances at June 30, 2021 |
9,854,432 | $ | 98,544 | 29,281,514 | $ | 1 | $ | 11,456 | $ | (174,720 | ) | $ | (886 | ) | $ | (243,215 | ) | $ | (407,364 | ) | ||||||||||||||||
|
|
|
|
|
|
|
|
|
|
|
|
|
|
|
|
|
|
|
|||||||||||||||||||
| Convertible Preferred Stock |
Common Stock | Additional Paid- In Capital |
Treasury Stock |
Accumulated other comprehensive loss |
Accumulated deficit |
Total Stockholders’ Deficit |
||||||||||||||||||||||||||||||
| Shares | Amount | Shares | Amount | |||||||||||||||||||||||||||||||||
| Balance at March 31, 2020 |
11,000,000 | $ | 110,000 | 58,000,000 | $ | 3 | $ | — | $ | — | $ | (110 | ) | $ | (151,290 | ) | $ | (151,397 | ) | |||||||||||||||||
| Net income |
— | — | — | — | — | — | — | 5,868 | 5,868 | |||||||||||||||||||||||||||
| Unrealized loss on interest rate swap, net of tax |
— | — | — | — | — | — | 123 | — | 123 | |||||||||||||||||||||||||||
| Cumulative translation adjustment, net of tax |
— | — | — | — | — | — | (1,845 | ) | — | (1,845 | ) | |||||||||||||||||||||||||
|
|
|
|
|
|
|
|
|
|
|
|
|
|
|
|
|
|
|
|||||||||||||||||||
| Balances at June 30, 2020 |
11,000,000 | $ | 110,000 | 58,000,000 | $ | 3 | $ | — | $ | — | $ | (1,832 | ) | $ | (145,422 | ) | $ | (147,251 | ) | |||||||||||||||||
|
|
|
|
|
|
|
|
|
|
|
|
|
|
|
|
|
|
|
|||||||||||||||||||
| Convertible Preferred Stock |
Common Stock | Additional Paid-In Capital |
Treasury Stock |
Accumulated other comprehensive loss |
Accumulated deficit |
Total Stockholders’ Deficit |
||||||||||||||||||||||||||||||
| Shares | Amount | Shares | Amount | |||||||||||||||||||||||||||||||||
| Balances at December 31, 2020 |
9,854,432 | $ | 98,544 | 29,281,514 | $ | 1 | $ | 11,456 | $ | (174,720 | ) | $ | (982 | ) | $ | (175,846 | ) | $ | (340,091 | ) | ||||||||||||||||
| Net loss |
— | — | — | — | — | — | — | (67,369 | ) | (67,369 | ) | |||||||||||||||||||||||||
| Unrealized gain on interest rate swap, net of tax |
— | — | — | — | — | — | 203 | — | 203 | |||||||||||||||||||||||||||
| Cumulative translation adjustment, net of tax |
— | — | — | — | — | — | (107 | ) | — | (107 | ) | |||||||||||||||||||||||||
|
|
|
|
|
|
|
|
|
|
|
|
|
|
|
|
|
|
|
|||||||||||||||||||
| Balances at June 30, 2021 |
9,854,432 | $ | 98,544 | 29,281,514 | $ | 1 | $ | 11,456 | $ | (174,720 | ) | $ | (886 | ) | $ | (243,215 | ) | $ | (407,364 | ) | ||||||||||||||||
|
|
|
|
|
|
|
|
|
|
|
|
|
|
|
|
|
|
|
|||||||||||||||||||
| Convertible Preferred Stock |
Common Stock | Additional Paid- In Capital |
Treasury Stock |
Accumulated other comprehensive loss |
Accumulated deficit |
Total Stockholders’ Deficit |
||||||||||||||||||||||||||||||
| Shares | Amount | Shares | Amount | |||||||||||||||||||||||||||||||||
| Balances at December 31, 2019 |
11,000,000 | $ | 110,000 | 58,000,000 | $ | 3 | $ | — | $ | — | $ | (541 | ) | $ | (150,557 | ) | $ | (151,095 | ) | |||||||||||||||||
| Net income |
— | — | — | — | — | — | — | 5,135 | 5,135 | |||||||||||||||||||||||||||
| Unrealized loss on interest rate swap, net of tax |
— | — | — | — | — | — | (727 | ) | — | (727 | ) | |||||||||||||||||||||||||
| Cumulative translation adjustment, net of tax |
— | — | — | — | — | — | (564 | ) | — | (564 | ) | |||||||||||||||||||||||||
|
|
|
|
|
|
|
|
|
|
|
|
|
|
|
|
|
|
|
|||||||||||||||||||
| Balances at June 30, 2020 |
11,000,000 | $ | 110,000 | 58,000,000 | $ | 3 | $ | — | $ | — | $ | (1,832 | ) | $ | (145,422 | ) | $ | (147,251 | ) | |||||||||||||||||
|
|
|
|
|
|
|
|
|
|
|
|
|
|
|
|
|
|
|
|||||||||||||||||||
The accompanying notes are an integral part of these unaudited condensed consolidated financial statements.
5
Table of Contents
CONDENSED CONSOLIDATED STATEMENTS OF CASH FLOWS
(in thousands)
(unaudited)
| Six Months Ended June 30, |
||||||||
| 2021 | 2020 | |||||||
| Cash flows from operating activities |
||||||||
| Net (loss) income |
$ | (67,369 | ) | $ | 5,135 | |||
| Adjustments to reconcile net (loss) income to net cash used in operating activities: |
||||||||
| Depreciation |
130 | 216 | ||||||
| Amortization of intangible assets |
1,247 | 261 | ||||||
| Amortization of deferred costs |
725 | 685 | ||||||
| Provision for inventories |
149 | — | ||||||
| Accretion of debt discount |
2,983 | — | ||||||
| Loss on derivative liabilities |
48,603 | — | ||||||
| Paid in kind interest accrual |
12,851 | — | ||||||
| Bad debt expense |
3,514 | 1,917 | ||||||
| Gain and loss on disposal of property and equipment |
6 | — | ||||||
| Deferred income taxes |
— | 13 | ||||||
| Unrealized foreign currency transaction gains (losses) |
185 | (556 | ) | |||||
| Changes in operating assets and liabilities: |
||||||||
| Due from related parties |
549 | 163 | ||||||
| Accounts receivable, net |
(6,715 | ) | (2,576 | ) | ||||
| Inventories |
(2,125 | ) | (3,001 | ) | ||||
| Prepaid expenses |
(934 | ) | 172 | |||||
| Other current assets |
(3,722 | ) | (1,989 | ) | ||||
| Deferred costs |
(1,280 | ) | (2,590 | ) | ||||
| Other long-term assets |
(7,234 | ) | (2,499 | ) | ||||
| Accounts payable |
5,351 | (1,410 | ) | |||||
| Deferred revenue |
3,912 | (6,354 | ) | |||||
| Interest payable |
(107 | ) | 171 | |||||
| Income tax payable |
702 | 1,633 | ||||||
| Other long-term liabilities |
1,000 | 68 | ||||||
|
|
|
|
|
|||||
| Net cash used in operating activities |
(7,579 | ) | (10,541 | ) | ||||
|
|
|
|
|
|||||
| Cash flows from investing activities |
||||||||
| Purchases of property and equipment |
(345 | ) | (302 | ) | ||||
| Disposal of property and equipment |
19 | 2 | ||||||
| Purchases of intangible assets |
(576 | ) | (577 | ) | ||||
|
|
|
|
|
|||||
| Net cash used in investing activities |
(902 | ) | (877 | ) | ||||
|
|
|
|
|
|||||
| Cash flows from financing activities |
||||||||
| Borrowings under revolving facility |
— | 8,145 | ||||||
| Repayments under term facility |
— | (1,500 | ) | |||||
| Repayment of 1st Lien Loan |
(2,625 | ) | — | |||||
| Proceeds from Paycheck Protection Program loan |
— | 2,065 | ||||||
| Deferred offering costs |
— | (440 | ) | |||||
|
|
|
|
|
|||||
| Net cash (used in) provided by financing activities |
(2,625 | ) | 8,270 | |||||
|
|
|
|
|
|||||
| Effect of exchange rate changes on cash, cash equivalents, and restricted cash |
300 | (291 | ) | |||||
|
|
|
|
|
|||||
| Net decrease in cash, cash equivalents, and restricted cash |
(10,806 | ) | (3,439 | ) | ||||
| Cash, cash equivalents, and restricted cash at beginning of period |
28,967 | 8,267 | ||||||
|
|
|
|
|
|||||
| Cash, cash equivalents, and restricted cash at end of period |
$ | 18,161 | $ | 4,828 | ||||
|
|
|
|
|
|||||
| Supplemental disclosures of cash flow information |
||||||||
| Income taxes paid |
$ | — | $ | 632 | ||||
| Interest paid |
1,109 | 600 | ||||||
| Supplemental disclosure of noncash financing and investing activities: |
||||||||
| Liability assumed on intellectual property license agreement with FW SPV II LLC (Note 4) |
20,790 | — | ||||||
| Intangible assets included in accounts payable and accrued expenses |
— | 46 | ||||||
| Deferred offering costs included in accounts payable and accrued expenses |
2,248 | 1,531 | ||||||
The accompanying notes are an integral part of these unaudited condensed consolidated financial statements.
6
Table of Contents
NOTES TO THE CONDENSED CONSOLIDATED FINANCIAL STATEMENTS
(unaudited)
Note 1—Nature of the business and basis of presentation
Organization
F45 Training Holdings Inc. (“F45 Training Holdings”, the “Company,” or “F45”) was incorporated in the State of Delaware on March 12, 2019 as a C-Corp. The Company and its subsidiaries are engaged in franchising and licensing the F45 Training brand to fitness facilities in multiple countries across the globe.
Initial Public Offering
The Company’s registration statement on Form S-1 (“IPO Registration Statement”) related to its initial public offering (“IPO”) was declared effective on July 14, 2021, and the Company’s common stock began trading on the New York Stock Exchange on July 15, 2021. On July 15, 2021, the Company completed its IPO of 20,312,500 shares of the Company common stock, $0.00005 par value per share at an offering price of $16.00 per share. The Company sold 18,750,000 shares and certain existing stockholders sold an aggregate of 1,562,500 shares. The Company received aggregate net proceeds of approximately $279.0 million after deducting underwriting discounts and commissions.
Upon completion of the IPO, 9,854,432 shares of the Company’s redeemable convertible preferred stock then outstanding with a carrying value of $98.5 million were automatically converted into an aggregate of 27,368,102 shares of the Company’s common stock and the Company’s outstanding convertible notes were converted into an aggregate of 14,847,066 shares of common stock. Following the completion of the IPO, the Company has one class of authorized and outstanding common stock.
2020 Stock Repurchase Agreements
On October 6, 2020, the Company entered stock repurchase agreements (“Repurchase Agreements”) with 2M Properties Pty Ltd and Robert Deutsch in which the Company purchased a total of 31,900,000 shares of common stock for $174.7 million. In addition, the Company paid a $2.5 million bonus to Mr. Deutsch. As a result of the Repurchase Agreements, these two parties no longer own any common stock in the Company.
Transaction with MWIG LLC (“MWIG”)
On March 15, 2019, MWIG, a special purpose private investment fund vehicle led by FOD Capital LLC, a family office investment fund, and Mark Wahlberg, made a minority preferred investment in the Company. On March 15, 2019, F45 Training Holdings, MWIG and Flyhalf Acquisition Company Pty Ltd, a newly incorporated wholly-owned, indirect subsidiary of F45 Training Holdings, entered into a Share Purchase Agreement with F45 Aus Hold Co Pty Ltd (“F45 Aus Hold Co”) and its existing stockholders pursuant to which F45 Training Holdings became the ultimate parent of F45 Aus Hold Co and its subsidiaries. Upon the consummation of the transaction with MWIG, the existing stockholders and MWIG held 72.5% and 27.5% ownership interests, respectively, in the Company and, its wholly-owned subsidiaries. This ownership percentage assumes the conversion of the MWIG preferred stock at its original issue conversion price and does not reflect the restricted stock units issued to Mark Wahlberg pursuant to the promotional agreement. See Note 12—Convertible Preferred Stock and Stockholders’ Deficit for further discussion.
Pursuant to the Share Purchase Agreement and in return for acquiring 100% of the shares in F45 Aus Hold Co, F45 Training Holdings issued 29,000,000 shares of common stock to the existing stockholders of F45 Aus Hold Co proportionate to their relative ownership of the common stock of F45 Aus Hold Co and its wholly-owned subsidiaries. As a result of this transaction there was no change in control. All references to shares in the financial statements and the notes to the financial statements presented herein, including but not limited to the number of shares and per share amounts, unless otherwise noted, have been adjusted to reflect the effects of the transaction retrospectively as of the earliest period presented in the interim unaudited condensed consolidated financial statements.
7
Table of Contents
Basis of presentation
The accompanying unaudited condensed consolidated financial statements and related notes to the unaudited condensed consolidated financial statements have been prepared in accordance with U.S. generally accepted accounting principles (“GAAP”) for interim financial information and pursuant to the rules and regulations of the Securities and Exchange Commission. In accordance with such rules and regulations, certain information and accompanying note disclosures normally included in financial statements prepared in accordance with GAAP have been condensed or omitted, although the Company believes the disclosures included herein are adequate to make the information presented not misleading. In the opinion of management, the accompanying unaudited condensed consolidated financial statements reflect all normal recurring adjustments which are considered necessary for the fair presentation of the financial position of the Company at June 30, 2021 and the results of operations for the interim periods represented. The operating results for the interim periods presented are not necessarily indicative of the results that may be expected for the year ending December 31, 2021. All intercompany balances and transactions have been eliminated in consolidation.
These interim unaudited condensed consolidated financial statements should be read in conjunction with the audited consolidated financial statements and notes thereto of the Company as of and for the years ended December 31, 2020 and 2019.
Note 2—Summary of significant accounting policies
There were no changes to the significant accounting policies or recent accounting pronouncements that were disclosed in Note 2—Summary of significant accounting policies to the audited consolidated financial statements of the Company as of and for the years ended December 31, 2020 and 2019, other than as discussed below.
Stock split
In July 2021, the Company effected a 2-for-1 forward stock split of its common stock. In connection with the forward stock split, each issued and outstanding share of common stock, automatically and without action on the part of the holders, became two shares of common stock. The par value per share of common stock was adjusted from $0.0001 to $0.00005. All share, per share and related information presented in the consolidated financial statements and accompanying notes have been retroactively adjusted, where applicable, to reflect the impact of the stock split.
Use of estimates
The preparation of interim condensed consolidated financial statements in conformity with GAAP requires management to make estimates and assumptions that affect the reported amounts of assets and liabilities and disclosure of contingent assets and liabilities at the date of the financial statements and the reported amounts of revenues and expenses during the reporting period.
Key estimates and judgments relied upon in preparing these interim condensed consolidated financial statements include revenue recognition, allowance for doubtful accounts, depreciation of long-lived assets, internally developed software, amortization of intangible assets, valuation of inventory, fair value of derivative instruments, fair value of stock-based awards, and accounting for income taxes. The Company bases its estimates on historical experience and various other assumptions that the Company believes to be reasonable. Actual results could differ from these estimates.
Cash, cash equivalents, and restricted cash
Cash and cash equivalents consist of bank deposits. The Company holds cash and cash equivalents at major financial institutions, which often exceed insured limits. Historically, the Company has not experienced any losses due to such bank depository concentration. Restricted cash relates to cash held in escrow as a requirement of one the Company’s office lease agreements.
8
Table of Contents
The following table provides a reconciliation of cash, cash equivalents and restricted cash reported within the condensed consolidated balance sheets that sum to the total of the same such amounts shown in the condensed consolidated statement of cash flows (in thousands):
| As of June 30, | ||||||||
| 2021 | 2020 | |||||||
| Cash and cash equivalents |
$ | 16,604 | $ | 4,828 | ||||
| Restricted cash |
1,557 | — | ||||||
|
|
|
|
|
|||||
| Total cash, cash equivalents, and restricted cash |
$ | 18,161 | $ | 4,828 | ||||
|
|
|
|
|
|||||
Accounts receivable and allowance for doubtful accounts
Accounts receivable is primarily comprised of amounts owed to the Company resulting from fees due from franchisees. The Company evaluates its accounts receivable on an ongoing basis and establishes an allowance for doubtful accounts based on historical collections and specific review of outstanding accounts receivable. Accounts receivable are written off as uncollectible when it is determined that further collection efforts will be unsuccessful.
The change in allowance for doubtful accounts is as follows (in thousands):
| For the Three Months Ended June 30, |
For the Six Months Ended June 30, |
|||||||||||||||
| 2021 | 2020 | 2021 | 2020 | |||||||||||||
| Balance at beginning of period |
$ | 4,753 | $ | 2,623 | $ | 5,746 | $ | 1,069 | ||||||||
| Provisions for bad debts, included in selling, general and administrative |
1,848 | (8 | ) | 3,514 | 1,917 | |||||||||||
| Uncollectible receivables written off |
(1,345 | ) | (420 | ) | (4,004 | ) | (791 | ) | ||||||||
|
|
|
|
|
|
|
|
|
|||||||||
| Balance at end of period |
$ | 5,256 | $ | 2,195 | $ | 5,256 | $ | 2,195 | ||||||||
|
|
|
|
|
|
|
|
|
|||||||||
None of the Company’s related parties accounted for more than 10% of accounts receivable as of June 30, 2021 and December 31, 2020. None of the Company’s customers accounted for more than 10% of the Company’s accounts receivable as of June 30, 2021 and December 31, 2020. None of the Company’s customers accounted for more than 10% of the Company’s revenue for the three and six months ended June 30, 2021 and 2020.
Deferred initial public offering costs
Deferred initial public offering costs, which consist of direct incremental legal and accounting fees relating to the IPO, are capitalized. The deferred offering costs will be offset against IPO proceeds upon the consummation of the offering. In the event the offering is terminated, deferred offering costs will be expensed. As of June 30, 2021 and December 31, 2020, $2.2 million and $0, respectively, of offering costs were deferred in other current assets on the condensed consolidated balance sheets.
Revenue recognition—Change in estimate
During the height of the COVID-19 pandemic in 2020, the Company entered into franchise agreements that included a discount on upfront establishment fees and modified other contract terms as part of a limited-time promotional offer made exclusively to existing franchises (“limited-time promotional deals”). The Company deemed that the limited-time promotional deals did not meet the criteria of a contract at the inception of the agreement under ASC 606-10-25-1 due to the Company’s inability to determine that collectability under the agreements was probable, and as such, did not begin immediately recognizing revenue upon the inception of these franchise agreements. During the three months ended June 30, 2021, the Company assessed the limited-time promotional deals and determined the criteria of a contract under ASC 606-10-25-1 had been met and, as a result, recorded a cumulative catch-up in revenue of $2.2M during the three and six months ended June 30, 2021. The Company noted the assessment of collectability was primarily driven by a review of post-COVID payment and collection history for franchisees who owned multiple studios within the Company’s network, system-wide sales per region, and increases in post re-opening weekly visit volume and store-level gross sales volumes compared to specified periods in which the contracts were initially signed.
9
Table of Contents
The Company’s United States subsidiary, F45 Training, Inc., operates in various states within the United States which require the Company to defer collection of certain fees (“the Deferred States”), including the initial establishment fees, until certain criteria are met as specified by state and local requirements. In Deferred States, the Company concluded that the deferred establishment fees represent variable consideration as receipt was subject to uncertainty due to a lack of experience with contracts requiring deferral of establishment fees and uncertainty on the length of timing between inception of an agreement and the opening of a studio. As a result, establishment fees were excluded from the transaction price upon signing of the franchise agreements within the Deferred States. The Company re-evaluates the transaction price on its Deferred State franchise agreements if there is a significant change in facts and circumstances at the end of each reporting period. During the three months ended June 30, 2021, the Company increased the transaction price of the Deferred State contracts by $1.7 million because of an enhanced history of franchise agreements and collections history on Deferred State franchise agreements, as well as a review of post-COVID payment and collection history for similar franchisees, resulting in the recognition of an additional $1.3 million in revenue during the three months ended June 30, 2021.
Recently issued accounting pronouncements
In February 2016, the FASB established Topic 842, Leases (“Topic 842”), by issuing ASU No. 2016-02, Leases (“ASU 2016-02”). Topic 842 was subsequently amended by ASU No. 2018-01, Land Easement Practical Expedient for Transition to Topic 842; ASU No. 2018-10, Codification Improvements to Topic 842, Leases; ASU No. 2018-11, Targeted Improvements; ASU No. 2018-20, Narrow-Scope Improvements for Lessors; ASU No. 2019-01, Codification Improvements; ASU No. 2019-10, Effective Dates, and ASU No. 2020-20, Amendments to SEC Paragraphs Pursuant to SEC Staff Accounting Bulletin No. 119 and Update to SEC Section on Effective Date Related to Accounting Standards Update No. 2016-02. This guidance is intended to increase transparency and comparability among organizations by recognizing lease assets and lease liabilities on the balance sheet and disclosing key information about leasing arrangements. The new guidance requires lessees to recognize the assets and liabilities on the balance sheet for the rights and obligations created by leases with lease terms of more than 12 months, amends various other aspects of accounting for leases by lessees and lessors, and requires enhanced disclosures. Leases will be classified as finance or operating, with the classification affecting the pattern and classification of expense recognition within the income statement. Topic 842 is effective for the Company for fiscal years beginning after December 15, 2021, and interim periods within fiscal years beginning after December 15, 2022. While the Company is currently evaluating the impact of adopting Topic 842, the Company expects to recognize right-of-use assets and lease liabilities on its consolidated balance sheets upon adoption. The standard is not expected to have a material impact to the consolidated statements of operations and comprehensive loss and statements of cash flows.
In June 2016, the FASB issued ASU No. 2016-13, Financial Instruments-Credit Losses (Topic 326): Measurement of Credit Losses on Financial Instruments (“ASU 2016-13”). Topic 326 was subsequently amended by ASU No. 2018-19, Codification Improvements; ASU No. 2019-04, Codification Improvements; ASU No. 2019-11, Codification Improvements that clarify the scope of the standard in the amendments in ASU 2016-13; ASU No. 2019-05, Targeted Transition Relief; ASU No. 2019-10, Effective Dates; and ASU no. 2020-02, Amendments to SEC Paragraphs Pursuant to SEC Staff Accounting Bulletin No. 119 and Update to SEC section on Effective Date Related to Accounting Standards Update No. 2016-02. The guidance changes how entities will measure credit losses for most financial assets and certain other instruments that are not measured at fair value through net income. The guidance replaces the current ‘incurred loss’ model with an ‘expected loss’ approach. The guidance will be applied as a cumulative-effect adjustment to retained earnings as of the beginning of the first reporting period in which the guidance is effective. ASU 2016-13 is effective for the Company for fiscal years beginning after December 15, 2022, and interim periods within fiscal years beginning after December 15, 2022. Early adoption is permitted. The Company is currently evaluating the impact that the guidance will have on its consolidated financial statements.
10
Table of Contents
Note 3—Property and equipment, net
Property and equipment, net, consists of the following as of June 30, 2021 and December 31, 2020 (in thousands):
| Estimated Useful Life | June 30, 2021 | December 31, 2020 | ||||||||||
| (years) | ||||||||||||
| Vehicles |
5 | $ | 43 | $ | 43 | |||||||
| Furniture and fixtures |
7 | 179 | 179 | |||||||||
| Office and other equipment |
5 | 694 | 720 | |||||||||
| Leasehold improvements |
|
Lesser of lease term or useful life |
|
827 | 675 | |||||||
|
|
|
|
|
|||||||||
| 1,743 | 1,617 | |||||||||||
| Less accumulated depreciation |
(848 | ) | (733 | ) | ||||||||
|
|
|
|
|
|||||||||
| Total property and equipment, net |
$ | 895 | $ | 884 | ||||||||
|
|
|
|
|
|||||||||
Depreciation expense related to property and equipment was less than $0.1 million and $0.1 million for the three months ended June 30, 2021 and 2020, respectively, and $0.1 million and $0.2 million for the six months ended June 30, 2021 and 2020, respectively. Depreciation expense was recorded in selling, general and administrative expenses in the condensed consolidated statements of operations and comprehensive (loss) income.
Note 4—Intangible assets
The following table summarizes the useful lives and carrying values of intangible assets, including internal-use software (in thousands):
| As of June 30, 2021 | As of December 31, 2020 | |||||||||||||||||||||||||||
| Useful Life | Gross Value |
Accumulated Amortization |
Net Value |
Gross Value |
Accumulated Amortization |
Net Value |
||||||||||||||||||||||
| (in years) | ||||||||||||||||||||||||||||
| Internal-use software |
3 | $ | 3,225 | $ | 1,663 | $ | 1,562 | $ | 2,767 | $ | 1,352 | $ | 1,415 | |||||||||||||||
| Trademarks |
n/a | 343 | — | 343 | 343 | — | 343 | |||||||||||||||||||||
| FW Intangible Asset |
5 | $ | 20,790 | $ | 843 | $ | 19,947 | $ | — | $ | — | $ | — | |||||||||||||||
|
|
|
|
|
|
|
|
|
|
|
|
|
|||||||||||||||||
| Total intangible assets, net |
$ | 24,358 | $ | 2,506 | $ | 21,852 | $ | 3,110 | $ | 1,352 | $ | 1,758 | ||||||||||||||||
|
|
|
|
|
|
|
|
|
|
|
|
|
|||||||||||||||||
The amortization expense of intangible assets was $1.1 million and $0.1 million for the three months ended June 30, 2021 and 2020, respectively, and $1.2 million and $0.3 million for the six months ended June 30, 2021 and 2020, respectively, and was recorded in selling, general and administrative expenses in the condensed consolidated statements of operations and comprehensive (loss) income. The weighted average remaining life of internal-use software was 1.9 years and 1.7 years as of June 30, 2021 and December 31, 2020, respectively. The weighted average remaining life of FW Intangible Assets was 4.8 years as of June 30, 2021.
In April 2021, the Company entered into an intellectual property license agreement with FW SPV II LLC (“FW SPV”), a Delaware limited liability company, regarding certain intellectual property previously owned by Flywheel Sports, Inc. (“Flywheel IP”). The license agreement is for a period of five years at a rate of $5 million per year. The Company recorded $20.8 million of intangible assets when the license agreement became effective in April 2021 based on the present value of the annual payments throughout the term of the license agreement. The amortization expense of the intangible assets related to the license agreement was $0.8 million for the three and six months ended June 30, 2021. Also, on March 31, 2021, the Company entered into an asset purchase agreement with FW SPV, whereby the Company can acquire the rights to the Flywheel IP upon the occurrence of certain circumstances for $25.0 million. See Note 16-Subsequent Events for further discussion.
11
Table of Contents
As of June 30, 2021, the expected amortization of intangible assets for future periods, excluding those assets not yet placed in service as of June 30, 2021, is as follows (in thousands):
| Future Amortization |
||||
| Remainder of 2021 |
$ | 2,502 | ||
| 2022 |
4,875 | |||
| 2023 |
4,525 | |||
| 2024 |
4,213 | |||
| 2025 |
4,158 | |||
| Thereafter |
1,236 | |||
|
|
|
|||
| Total |
$ | 21,509 | ||
|
|
|
|||
Note 5—Deferred revenue
Deferred revenue results from establishment fees paid by franchisees at the outset of the contract term and the value of material rights related to discounted renewal options as well as equipment fees paid by franchisees prior to the transfer of the equipment. The following table reflects the change in deferred revenue during the six months ended June 30, 2021 and 2020 (in thousands):
| Deferred Revenue |
||||
| Balance at December 31, 2019 |
$ | 23,941 | ||
| Revenue Recognized |
(7,154 | ) | ||
| Increase |
6,398 | |||
|
|
|
|||
| Balance at March 31, 2020 |
$ | 23,185 | ||
| Revenue Recognized |
(12,960 | ) | ||
| Increase |
6,915 | |||
|
|
|
|||
| Balance at June 30, 2020 |
$ | 17,140 | ||
|
|
|
|||
| Deferred Revenue |
||||
| Balance at December 31, 2020 |
$ | 14,095 | ||
| Revenue Recognized |
(7,016 | ) | ||
| Increase |
10,571 | |||
|
|
|
|||
| Balance at March 31, 2021 |
$ | 17,650 | ||
|
|
|
|||
| Revenue Recognized |
$ | (4,507 | ) | |
| Increase |
$ | 4,822 | ||
|
|
|
|||
| Balance at June 30, 2021 |
$ | 17,965 | ||
|
|
|
|||
Deferred revenue expected to be recognized within one year from the balance sheet date is classified as current, and the remaining balance is classified as noncurrent. Transaction price allocated to remaining performance obligations represents contracted franchise and equipment revenue that has not yet been recognized, which includes deferred revenue recognized as revenue in future periods. Total contract revenues from franchisees yet to be recognized as revenue was $201.1 million as of June 30, 2021, of which the Company expects to recognize approximately 23% of the revenue over the next 12 months and the remainder thereafter.
12
Table of Contents
Note 6—Debt
The following table provides a summary of the Company’s outstanding long-term debt, as of June 30, 2021 and December 31, 2020 (in thousands):
| June 30, 2021 |
December 31, 2020 |
|||||||
| Revolving Facility |
$ | 7,000 | $ | 7,000 | ||||
| First Lien Term Loan |
31,035 | 33,688 | ||||||
| Second Lien Term Loan |
137,443 | 128,882 | ||||||
| Convertible Note |
106,276 | 101,985 | ||||||
| PPP Loan |
2,063 | 2,063 | ||||||
|
|
|
|
|
|||||
| Total debt, excluding deferred financing costs and discounts |
283,817 | 273,618 | ||||||
| Unamortized financing costs |
(4,746 | ) | (5,078 | ) | ||||
| Unamortized debt discount |
(23,740 | ) | (26,507 | ) | ||||
|
|
|
|
|
|||||
| Total debt |
$ | 255,331 | $ | 242,033 | ||||
|
|
|
|
|
|||||
Subordinated Convertible Debt Agreement
On October 6, 2020, the Company entered into a subordinated convertible debt agreement (the “Convertible Notes”), whereby the Company issued $100 million of Convertible Notes to certain holders maturing on September 30, 2025. The Convertible Notes have an annual interest rate of 8.28%, which accrues as paid-in-kind through the duration of the contract. Repayment of principal and accrued interest may be made in cash or shares of the Company upon the occurrence of certain qualifying events or at the end of the contract term (“PIK Interest”). Interest is accrued over the term of the debt and is payable upon repayment at maturity or earlier upon the occurrence of certain events. The outstanding balance of the Convertible Notes, including PIK Interest, as of June 30, 2021 and December 31, 2020 was $106.3 million and $102.0 million, respectively.
Voluntary Conversion—At their option, for each $100 in original issue price, the holders may elect to convert all or any portion of their outstanding Convertible Notes to common stock at $100 over $100 million times the number of shares of common stock equal to 20% of the equity value of the Company, provided that the aggregate number of shares of common stock into which all outstanding notes are converted do not exceed 20% of the shares of common stock of the Company.
Mandatory Conversion Offering Proceeds—Upon a public offering resulting in $150 million gross proceeds to the Company, outstanding Convertible Notes shall automatically convert into common stock equal to (a) the greater of (1) 20% of the equity value of the Issuer (on a fully diluted basis) (2) 1.5 multiplied by the aggregate original Issue price, divided by (b) the initial offering price to the public; provided that such number of shares shall not be less than 20% of the fully diluted shares of common stock prior to the issuance of any primary shares in the public offering.
Mandatory Conversion Public Float—Outstanding Convertible Notes automatically convert upon a public float of $150 million measured during the first 30 days of trading equal to (a) the greater of (1) 20% of the equity value of the Company (on a fully diluted basis) based on the average sale price over the previous 30 consecutive days of trading and (2) 1.5 multiplied by the aggregate original issue price, divided by (b) the average sale price over the previous 30 consecutive days of trading; provided that such number of shares of common stock shall not be less than 20% of the fully diluted shares of common stock.
13
Table of Contents
Payment due on Liquidation - The terms of the Convertible Notes state that in a liquidation event, the Convertible Notes are immediately due and payable in cash equal to the greater of (a) 20% of the equity value of the Company and (b) 1.5 multiplied by the original issue price of the notes.
Payment due default – The terms of the Convertible Notes state that upon an event of default, the Convertible Notes Principal and unpaid accrued interest becomes immediately due and payable at 1.5x the original issue price.
Prepayment Option - The Company has the option to prepay the Convertible Notes after the fourth anniversary of the effective date in whole, subject to prior notice and a prepayment premium equal to 50% of the original issue price.
As a part of the subordinated convertible debt agreement the Company identified embedded derivatives that require bifurcation under ASC 815, Derivatives and Hedging, relating to the contingent conversion option, payment of liquidation, default payment and prepayment options. See Note 7—Derivative Instruments for further discussion on the Company’s accounting for these embedded derivatives.
Subordinated Second Lien Term Loan
On October 6, 2020, the Company entered into a Subordinated Credit Agreement with certain lenders which committed the lenders to provide $125 million of financing to the Company in exchange for a note payable. This agreement matures over a five-year period that carries a Paid-In Kind (“PIK”) Interest rate of 13.00%. PIK Interest is accrued over the term of the Subordinated Credit Agreement. The outstanding balance of the note, including PIK Interest, payable as of June 30, 2021 and December 31, 2020 was $133.0 million and $124.2 million, respectively, net of unamortized debt issuance costs of $4.5 million and $4.7 million, respectively. The Subordinated Credit Agreement has a maturity date of October 5, 2025.
The Company is required to make prepayments in circumstances where it has (i) excess cash flow; (ii) certain prepayment events occur; or (ii) if an event of default were to occur as further described below.
Commencing with the fiscal year ending December 31, 2021, the Company shall prepay, or cause to be prepaid, an aggregate principal amount of the obligations equal to 50% of Excess Cash Flow (the “ECF Percentage”), if any, for the fiscal year covered by such financial statements; provided, that the ECF Percentage shall be reduced to 25% when the Secured Leverage Ratio as of the last date of the applicable fiscal year is less than or equal to 3.08 to 1.00 and shall be reduced to 0% when the Secured Leverage Ratio as of the last date of the applicable fiscal year is less than or equal to 2.08 to 1.00; provided, that no payments shall be required prior to payment in full of the First Lien Term Loan obligations.
In the event and on each occasion that any net proceeds are received by the Company in respect of any prepayment event (any disposition (including pursuant to a sale and leaseback Transaction) of any property or asset of, other than dispositions described in the Subordinated Credit Agreement; or (b) any casualty or other insured damage to, or any taking under power of eminent domain or by condemnation or similar proceeding of, any property or asset of the Company resulting in aggregate net proceeds greater than $500,000; or (c) the incurrence by the Company of any indebtedness, other than indebtedness permitted under the Subordinated Credit Agreement, the Company must within three business days after such net proceeds are received, prepay the obligations under the Subordinated Credit Agreement in an aggregate amount equal to 100% of such net proceeds.
If an event of default were to occur, in addition to the obligations becoming due, the Company is responsible for paying a make-whole premium defined as the amount equal to the discounted value of the remaining scheduled payments with respect the outstanding obligations under the Subordinated Credit Agreement. The Subordinated Credit Agreement contains cross-default provisions; whereby; if an event of default were to occur under the Subordinated Credit Agreement that were not cured within the applicable grace period; it would trigger an event of default under the First Lien Credit Agreement.
14
Table of Contents
The Agreement contains the following put and call options:
| 1. | Prepayment at the option of the Company. |
| 2. | Prepayment at the option of the Company following a Qualified Public Offering. |
| 3. | Prepayment required by Excess Cash Flow. |
| 4. | Prepayment required by a Prepayment Event. |
| 5. | Prepayment required by an Event of Default. |
In accordance with ASC 815, Derivatives and Hedging, the Company assessed the prepayment event and the event of default as embedded derivatives requiring bifurcation, however, as the fair value of these features was not material upon issuance, the Company has not allocated any of the proceeds of the debt to the embedded derivatives. As of June 30, 2021 and December 31, 2020, the fair value of the embedded derivatives was not material to the condensed consolidated financial statements.
In connection with issuing the note the Company paid the lenders approximately $3.8 million in fees. Similarly, the Company paid third parties fees of approximately $1.0 million associated with issuing the note. The Company determined that all fees paid to the lenders and third parties would result in a reduction of the initial carrying amount of the note. The Company is amortizing the debt discount and debt issuance costs into interest expense utilizing the effective interest method.
Beginning with the first fiscal quarter ending after the first anniversary of the agreement effective date and as of the last day of each fiscal quarter thereafter, the Company must not permit the Total Leverage Ratio, for any period of four consecutive fiscal quarters ending on the last day of such fiscal quarter, to exceed 8.00 to 1.00; provided, that for purposes of determining the Total Leverage Ratio with respect to any fiscal quarter in which studios that have been closed by government mandate due to COVID-19, EBITDA shall be adjusted by a percentage equal to (1) the excess (if any) of (x) the number of studios that were closed by government mandate due to COVID-19 during such fiscal quarter over (y) the number of studios that were closed by government mandate due to COVID-19 as of the Effective Date, divided by (2) the total number of studios during such fiscal quarter.
On July 19, 2021, the Company repaid in full all outstanding indebtedness and terminated all commitments and obligations under the Subordinated Credit Agreement. The Company used proceeds from its IPO to repay $150.5 million under the terms of the Subordinated Credit Agreement, inclusive of a prepayment penalty of $3.8 million as a result of the repayment of indebtedness or termination of the Subordinated Credit Agreement. In connection with the repayment of outstanding indebtedness, the Company was automatically and permanently released from all security interests and encumbrances under the Subordinated Credit Agreement.
First Lien Loan
The Company entered into a senior Secured Credit Agreement, dated as of September 18, 2019 (the “Secured Credit Agreement”), with JPMorgan Chase Bank, N.A., as Administrative Agent, Australian Security Trustee, Lender, Swingline Lender and Issuing Bank, consisting of a $20.0 million revolving credit facility (the “Revolving Facility”) and a $30.0 million term loan facility (the “Term Facility”). Initial borrowings of $30.0 million from the Term Facility and $11.9 million of the availability under the Revolving Facility were used to repay, in full, amounts due to common stockholders as a result of the MWIG transaction. See Note 12—Convertible Preferred Stock and Stockholders’ Deficit for further discussion. The remaining availability under the Revolving Facility may be drawn and used for general corporate purposes. The obligations under the Secured Credit Agreement are guaranteed by certain operating subsidiaries of the Company and secured by a majority of the Company’s assets. The Revolving Facility may be prepaid and terminated by the Company at any time without premium or penalty (subject to customary LIBOR breakage fees).
15
Table of Contents
The Term Facility bears interest at floating rate of LIBOR plus 1.5 percent. The outstanding balance of the Revolving Facility as of June 30, 2021 and December 31, 2020 was $7.0 million. There was no undrawn remaining availability. The Term Facility principal and interest payments are due quarterly in accordance with an amortization schedule with a maturity date of September 18, 2022.
The weighted-average interest rate on the Company’s outstanding debt during the year ended June 30, 2021 was 15.45%.
The terms of the Secured Credit Agreement require that the Company not permit the fixed charge coverage ratio, as defined within the Secured Credit Agreement, for any period of four consecutive fiscal quarters to be less than 1.25 to 1.00. The Company is also required to maintain a total leverage ratio, as defined within the second amendment to the Secured Credit Agreement, for any period of four consecutive fiscal quarters of less than 7.00 to 1.00. The Company is also required to maintain a Senior Secured Leverage Ratio, as defined within the second amendment to the Secured Credit Agreement, for any period of four consecutive fiscal quarters of less than 2.00 to 1.00. The Secured Credit Agreement also contains other customary non-financial covenants.
On October 25, 2019, the Company entered into an interest rate swap contract (the “Swap Agreement”) with JP Morgan Chase Bank N.A. to fix the interest rate on the Term Facility over the life of the loan. The notional amount of the swap covers the entire $30.0 million borrowings outstanding under the Term Facility. Under the terms of the Swap Agreement, the Term Facility, which formerly accrued interest at a rate of LIBOR plus 1.50%, started effectively accruing interest on the effective date (October 30, 2019) at a fixed rate of 1.74% on an annualized basis.
On June 23, 2020, the Company amended the Secured Credit Agreement to allow it to enter into a definitive agreement with a special purpose acquisition corporation. On October 6, 2020, the Company amended the agreement a second time. Through the second amendment, the Company agreed to convert $8,000,000 of the amount outstanding on the Revolving Facility to be part of the Term Facility. In addition to converting a portion of the Revolving Facility to the Term Facility, the Company agreed to repay $5,000,000 of the principal amount of the Revolving Facility outstanding.
In connection with the second amendment to the Secured Credit Agreement, the Company modified the existing covenants under the Secured Credit Agreement. The total leverage ratio was modified such that the Company is required to maintain a total leverage ratio, for any period of four consecutive fiscal quarters, of less than 7.00 to 1.00. Prior to the second amendment to the Secured Credit Agreement, the Company was required to maintain a total leverage ratio, for any period of four consecutive fiscal quarters, of less than 2.00 to 1.00. Additionally, the second amendment to the Secured Credit Agreement introduced a new covenant, a senior secured leverage ratio, which requires the Company to maintain a senior secured leverage ratio, for any period of four consecutive fiscal quarters, of less than 2.00 to 1.00. As of June 30, 2021 and December 31, 2020, the Company was in compliance with its covenants.
The interest rate of both the Term Facility and the Revolving facility were amended to 4.00% and 3.00% for Eurodollar loans and letters of credit, and ABR Loans, respectively. The outstanding balance of the Term Facility as of June 30, 2021 and December 31, 2020 was $30.8 million and $33.3 million, respectively, net of unamortized debt issuance costs of $0.2 million and $0.4 million, respectively.
The Company considered if this amendment resulted in the terms of the amended debt being substantially different than those of the original Term Facility and Revolving Facility. As the change in cash flows between the amended and original agreement were less than 10%, the Company determined that there was not a substantial difference between the amended and original agreement. As such, the Company concluded that the amendments resulted in a modification of the debt rather than a debt extinguishment. As the amendments resulted in a modification of the Debt, the Company has capitalized all new lender fees paid and recognize these fees as part of interest expense over the life of the modified debt in accordance with the interest method. Similarly, all unamortized debt issuance costs from the original agreement will continue to be deferred. Conversely, new fees paid to third parties as a result of the modification have been expensed as incurred.
16
Table of Contents
On July 19, 2021, the Company repaid in full all outstanding indebtedness and terminated all commitments and obligations under the Term Facility and Revolving Facility. The Company used proceeds from its IPO to repay the Term Facility and Revolving Facility in the amount of $31.1 million and $7.0 million, respectively.
Interest expense recorded on the debt facilities was $8.7 million and $0.4 million for the three months ended June 30, 2021 and June 30, 2020, respectively, and $17.1 million and $0.8 million for the six months ended June 30, 2021 and June 30, 2020, respectively.
On April 10, 2020, the Company received loan proceeds of approximately $2.1 million under the Paycheck Protection Program (“PPP”). The PPP, established as part of the Coronavirus Aid, Relief and Economic Security Act (“CARES Act”), provides for loans to qualifying businesses to help sustain its employee payroll costs, rent, and utilities due to the impact of the recent COVID-19 pandemic. Loans obtained through the PPP are eligible to be forgiven as long as the proceeds are used for qualifying purposes, which include the payment of payroll costs, interest on covered mortgage obligations, rent obligations and utility payments. The receipt of these funds, and the forgiveness of the loan is dependent on the Company having initially qualified for the loan and qualifying for the forgiveness of such loan based on its adherence to the forgiveness criteria. In June 2020, Congress passed the Payroll Protection Program Flexibility Act that made several significant changes to PPP loan provisions, including providing greater flexibility for loan forgiveness. While the Company believes that it qualifies for full forgiveness of the loan, the Company will withdraw its forgiveness application and repay the loan in full in the event the Company consummates the offering.
The Company is using the proceeds from the PPP loan to fund payroll costs in accordance with the relevant terms and conditions of the CARES Act. The Company is following the government guidelines and tracking costs to ensure full forgiveness of the loan. To the extent it is not forgiven, the Company would be required to repay that portion at an interest rate of 1% over a period of 1.5 years, beginning November 2020 with a final installment in April 2025. Any amounts forgiven when the Company is legally released as the primary obligor under the loan will be recognized as a gain from the extinguishment of the loan in the consolidated statements of operations and comprehensive (loss) income. As of June 30, 2021 and December 31, 2020, long-term portion of the loan was $1.6 million and $1.9 million, respectively.
The following table presents contractually scheduled maturities of our consolidated debt obligations outstanding at June 30, 2021 for the next five years (in thousands).
| Remainder of 2021 |
$ | 3,198 | ||
| 2022 |
35,560 | |||
| 2023 |
571 | |||
| 2024 |
576 | |||
| 2025 |
243,912 | |||
|
|
|
|||
| Total principal payments |
283,817 | |||
| Deferred financing costs, net of accumulated amortization |
(4,746 | ) | ||
| Discount on debt |
(23,740 | ) | ||
|
|
|
|||
| Net carrying value |
$ | 255,331 | ||
|
|
|
17
Table of Contents
Note 7–Derivative Instruments
Interest Rate Swap
The Company is subject to interest rate volatility with regard to existing debt. From time to time, the Company enters into swap agreements to manage exposure to interest rate fluctuations.
To hedge the variability in cash flows due to changes in benchmark interest rates, the Company entered into an interest rate swap agreement related to debt issuances. The swap agreement is designated as a cash flow hedge. The derivative’s gain or loss is recorded in OCI and is subsequently reclassified to interest expense over the life of the related debt.
During 2019, the Company entered into an interest rate swap agreement with an aggregate notional amount of $30.0 million related to the $30.0 million 3-year variable-rate term loan due September 18, 2022. Refer to Note 6–Debt, for details of the components of our long-term debt. As of June 30, 2021 and December 31, 2020, the interest rate swap liability was $0.5 million and $0.7 million, respectively.
The following table presents the categories of the Company’s derivative instruments on a gross basis, as reflected in the Company’s condensed consolidated balance sheets. Balances presented below have been classified and presented within the caption other long-term liabilities (in thousands):
| As of June 30, 2021 | As of December 31, 2020 | |||||||||||||||
| Derivative Liabilities | Derivative Liabilities | |||||||||||||||
| Current | Long-Term | Current | Long-Term | |||||||||||||
| Fair Value of Derivatives: |
||||||||||||||||
| Interest Rate Swap | $ | — | $ | (457 | ) | $ | — | $ | (660 | ) | ||||||
|
|
|
|
|
|
|
|
|
|||||||||
| Total Fair Value |
$ | — | $ | (457 | ) | $ | — | $ | (660 | ) | ||||||
|
|
|
|
|
|
|
|
|
|||||||||
The Company recognized an unrealized gain of $0.1 million and $0.1 million on this instrument in the three months ended June 30, 2021 and 2020, respectively, and an unrealized gain of $0.2 million and unrealized loss of $0.7 million on this instrument in the six months ended June 30, 2021 and 2020, respectively. The unrealized gains and losses have been presented within OCI in the condensed consolidated statement of operations and comprehensive (loss) income.
On July 21, 2021, in connection with the repayment in full of all outstanding obligations under the Subordinated Credit Agreement, the Company terminated the interest rate swap. The Company paid $0.5 million to terminate the interest rate swap.
As discussed in Note 6—Debt, in October 2020 the Company entered into a subordinated convertible debt agreement (the “Convertible Notes”) whereby the Company issued $100 million of Convertible Notes to certain holders maturing on September 30, 2025. These notes can be converted into common shares of the Company at the holders’ option. The Company has analyzed the conversion and redemption features of the agreement and determined that certain of the embedded features should be bifurcated and classified as derivatives. The Company has bifurcated the following embedded derivatives: (i) Liquidity Event Conversion Option; (ii) Liquidity Event Redemption Option; and (iii) Qualified Public Offering (“QPO”) Redemption Option.
The $27.8 million initial fair value of the embedded derivatives for the Convertible Notes has been recorded as a debt discount along with a corresponding liability on the Company’s consolidated balance sheets. The initial debt discount is not subsequently re-valued and is being amortized using the effective interest method over the life of the Convertible Notes. The derivative liabilities are classified in the condensed consolidated balance sheets as non-current as the Company is not required to net cash settle within 12 months of the balance sheet date and are marked-to-market at each reporting period with changes in fair value recorded within “Loss on derivative liabilities” in the condensed consolidated statements of operations and comprehensive (loss) income.
The Company fair values the embedded derivatives using the Bond plus Black-Scholes option pricing model because it believes that this technique is reflective of all significant assumption types, and ranges of assumption inputs, that market participants would likely consider in transactions involving compound embedded derivatives.
18
Table of Contents
The following table sets forth the inputs to the Bond plus Black-Scholes option pricing model that were used to value the embedded conversion and redemption features derivatives:
| As of June 30, 2021 | ||||||||||||||
| Risk-free rate | Volatility | Term (years) | Dividend yield | |||||||||||
| Liquidity event |
0.05%-0.72% | 39.2 | % | 2.50 | — | |||||||||
| QPO event |
0.05%-0.72% | 16.5 | % | 0.04 | — | |||||||||
| As of December 31, 2020 | ||||||||||||||
| Risk-free rate | Volatility | Term (years) | Dividend yield | |||||||||||
| Liquidity event |
0.10%-0.34% | 37.4 | % | 3.00 | — | |||||||||
| QPO event |
0.10%-0.34% | 34.8 | % | 0.75 | — | |||||||||
The following table summarizes the derivative liabilities included in the consolidated balance sheets at June 30, 2021 and December 31, 2020 (in thousands):
| Fair Value of Embedded Derivative Liabilities (Level 3 Inputs): |
||||
| Balance at January 1, 2020 |
$ | — | ||
| Initial measurement on October 6, 2020 |
(27,822 | ) | ||
| Change in fair value |
(8,818 | ) | ||
|
|
|
|||
| Balance at December 31, 2020 |
(36,640 | ) | ||
| Change in fair value |
(25,505 | ) | ||
|
|
|
|||
| Balance at March 31, 2021 |
(62,145 | ) | ||
| Change in fair value |
(23,098 | ) | ||
|
|
|
|||
| Balance at June 30, 2021 |
$ | (85,243 | ) | |
|
|
|
Upon completion of the Company’s IPO, the embedded derivative liability balance was settled upon the conversion of the Convertible Notes into 14,847,066 shares of common stock.
Note 8 – Fair Value
The following table presents the Company’s liabilities accounted for at fair value on a recurring basis as of June 30, 2021 and December 31, 2020 (in thousands). None of the Company’s assets are currently accounted for at fair value on a recurring basis.
| As of June 30, 2021 | ||||||||||||||||
| Level 1 | Level 2 | Level 3 | Total | |||||||||||||
| Liabilities |
||||||||||||||||
| Interest rate swap |
$ | — | $ | (457 | ) | $ | — | $ | (457 | ) | ||||||
| Derivative liability |
— | — | (85,243 | ) | (85,243 | ) | ||||||||||
|
|
|
|
|
|
|
|
|
|||||||||
| Total Liabilities |
$ | — | $ | (457 | ) | $ | (85,243 | ) | $ | (85,700 | ) | |||||
|
|
|
|
|
|
|
|
|
|||||||||
19
Table of Contents
| As of December 31, 2020 | ||||||||||||||||
| Level 1 | Level 2 | Level 3 | Total | |||||||||||||
| Liabilities |
||||||||||||||||
| Interest rate swap |
$ | — | $ | (660 | ) | $ | — | $ | (660 | ) | ||||||
| Derivative liability |
— | (36,640 | ) | (36,640 | ) | |||||||||||
|
|
|
|
|
|
|
|
|
|||||||||
| Total Liabilities |
$ | — | $ | (660 | ) | $ | (36,640 | ) | $ | (37,300 | ) | |||||
|
|
|
|
|
|
|
|
|
|||||||||
The inputs for determining fair value of the interest rate swap are classified as Level 2 inputs. Level 2 fair value is based on estimates using standard pricing models. These standard pricing models use inputs which are derived from or corroborated by observable market data such as interest rate yield curves, index forward curves, discount curves, and volatility surfaces.
Credit risk relates to the risk of loss resulting from the non-performance or non-payment by the Company’s counterparties in connection with contractual obligation. Risk around counterparty performance and credit could ultimately impact the amount and timing of cash flows. The Company believes it has appropriately addressed any credit risk due to the financial standing of the counterparties with which it trades. The maximum exposure to credit risk is represented by the carrying amount of each financial asset in the balance sheet.
The inputs for determining fair value of the embedded conversion and redemption features of the Company’s convertible notes are classified as Level 3 inputs, refer to Note 7—Derivative Instruments for further discussion related to the accounting for these instruments.
Note 9—Income taxes
For interim reporting periods, the Company’s provision for income taxes is calculated using its annualized estimated effective tax rate for the year. This rate is based on its estimated full-year income and the related income tax expense for each jurisdiction in which the Company operates. Changes in the geographical mix, permanent differences or the estimated level of annual pre-tax income can affect the effective tax rate. This rate is adjusted for the effects of discrete items occurring in the period.
Provision for income taxes
The provision for income taxes was $1.3 million for the three months ended June 30, 2021, compared with the provision for income taxes of $1.6 million for the three months ended June 30, 2020. The provision for income taxes was $0.9 million for the six months ended June 30, 2021, compared with the provision for income taxes of $1.6 million for the six months ended June 30, 2020. The effective tax rate for the six months ended June 30, 2021 of (1.36)% differed from the U.S. statutory tax rate of 21% primarily due to state taxes, the foreign tax rate differential and by current period losses incurred by F45 Holdings Inc. not benefited due to its full valuation allowance. The effective tax rate for the six months ended June 30, 2020 of 25.40% differed from the U.S. statutory tax rate of 21% primarily due to state taxes, foreign jurisdiction earnings taxes at different rates, and interest and penalties for uncertain tax positions.
Note 10—Related party transactions
As discussed in Note 1—Description of the business and basis of presentation, due to the repurchase of the Company’s shares from two primary directors that occurred in October 6, 2020, the Company no longer considers these two directors as related parties from October 6, 2020 onward.
Group Training is owned by certain existing stockholders that are executive officers and directors of the Company, through which, they operate one F45 studio in the United States. As of June 30, 2021 and December 31, 2020, the Company had receivables related to fees under this management service agreement of $0.4 million and $0.4 million, respectively. These amounts are included in due from related parties on the condensed consolidated balance sheets. The Company recognized less than $0.1 million of franchise revenue related to fees under this management service agreement during the three and six months ended June 30, 2021 and 2020.
20
Table of Contents
During the three months ended June 30, 2021 and 2020, the Company also recognized less than $0.1 million franchise revenue and no franchise revenue, respectively, from studios owned by Group Training. During the six months ended June 30, 2021 and 2020, the Company also recognized less than $0.1 million franchise revenue and $0.1 million franchise revenue, respectively, from studios owned by Group Training. With respect to these transactions, the Company has presented the revenue recognized during these periods in franchise revenue and the related expenses in selling, general and administrative expenses in the condensed consolidated statements of operations and comprehensive (loss) income.
During the three months ended June 30, 2021 and 2020, the Company recognized less than $0.1 million and $0.2 million, respectively, of franchise revenue and of equipment and merchandise revenue from studios owned by Messrs. Wahlberg and Raymond. During the six months ended June 30, 2021 and 2020, the Company recognized less than $0.1 million and $0.2 million. respectively, of franchise revenue and of equipment and merchandise revenue from studios owned by Messrs. Wahlberg and Raymond. As of June 30, 2021 and December 31, 2020, the Company had less than $0.1 million and no outstanding receivables, respectively. With respect to these transactions, the Company has presented the revenue recognized during these periods in franchise revenue and equipment and merchandise revenue and the related expenses in selling, general and administrative expenses in the consolidated statements of operations and comprehensive (loss) income.
During the three months ended June 30, 2021 and 2020, the Company recognized less than $0.1 million from studios owned by an entity in which an existing stockholder that is an executive officer and director of the Company holds a 10% ownership interest. During the six months ended June 30, 2021 and 2020, the Company recognized less than $0.1 million and no franchise revenue, respectively, from these studios. As of June 30, 2021 and December 31, 2020, the Company had $0.2 million and no outstanding receivables from these studios, respectively. With respect to these transactions, the Company has presented the revenue recognized during these periods in franchise revenue and equipment and merchandise revenue and the related expenses in selling, general and administrative expenses in the condensed consolidated statements of operations and comprehensive (loss) income.
The Company incurred expenses totaling approximately $1.2 million and $0.1 million, respectively, during the three months ended June 30, 2021 and 2020, and $2.1 million and $1.3 million, respectively, during the six months ended June 30, 2021 and 2020, in connection with certain shipping and logistic services from a third-party vendor that is owned by an immediate family member of an executive officer of the Company. As of June 30, 2021 and 2020, the Company had approximately $0.3 million and $0.5 million of outstanding payables to the third-party vendor. The Company has presented the expenses incurred during these periods in cost of equipment and merchandise revenue in the condensed consolidated statements of operations and comprehensive (loss) income.
During the three and six months ended June 30, 2021, the Company recognized franchise revenue and equipment and merchandise revenue totaling less than $0.1 million from three studios owned by employees. The Company had five studio owned by employees for the six months ended June 30, 2020. As of June 30, 2021 and December 31, 2020, the Company had no receivables outstanding related to this revenue.
21
Table of Contents
Transaction with LIIT LLC
On June 23, 2020, the Company entered into an Asset Transfer and Licensing Agreement with LIIT LLC (“LIIT”) an entity wholly-owned by Adam Gilchrist (F45’s Co-Founder and Chief Executive Officer). Pursuant to this agreement, F45 will sell to LIIT certain at-home exercise equipment packages (including the intellectual property rights thereto) for $1.0 million payable on or before December 31, 2020. LIIT assumes all outstanding rights and obligations related to these exercise equipment packages from F45. In addition, pursuant to this agreement, LIIT will receive access to F45’s library of programming related to existing and future fitness content for the duration of the license period of 10 years. In exchange for this license, LIIT will pay F45 an annual license fee equal to the greater of (a) $1.0 million and (b) 6% of the annual gross revenue of LIIT, less any payments made by LIIT to third parties in connection with the sale of such exercise equipment packages. This agreement will expire on July 1, 2030, unless otherwise terminated upon mutual agreement of F45 and LIIT. Upon termination or expiration of this agreement, LIIT must: (i) immediately cease all use and application of the licensed intellectual property; (ii) promptly return to F45, or otherwise dispose of as F45 may instruct, all documents, databases, lists and materials (whether hard copy or electronic form) including any advertising and promotion material, labels, tags, packaging material, advertising and promotional matter and all other material relating to the licensed intellectual property in the possession or control of LIIT; and (iii) immediately cease to hold itself out as having any rights in relation to the licensed intellectual property from the date of termination.
The Company recognized $0.5 million revenue and no cost of sales in conjunction with the transaction with LIIT LLC during the three and six months ended June 30, 2021. The outstanding receivable balance as of June 30, 2021 was $1.0 million.
Related party franchise arrangements were transacted at arm’s length pricing with standard contractual terms.
Note 11—Commitments and contingencies
Litigation
Where appropriate, the Company establishes accruals in accordance with FASB guidance over loss contingencies (ASC 450). As of June 30, 2021, the Company had established a litigation accrual of $3.9 million in accounts payable and accrued expenses for claims brought against the Company in the ordinary course of business. Our accruals for loss contingencies are reviewed quarterly and adjusted as additional information becomes available. The Company discloses the amount accrued if the Company believes it is material or if the Company believes such disclosure is necessary for our financial statements to not be misleading. If a loss is not both probable and reasonably estimable, or if an exposure to loss exists in excess of the amount previously accrued, the Company assesses whether there is at least a reasonable possibility that a loss, or additional loss, may have been incurred, and the Company adjusts the accruals and disclosures accordingly. The Company does not presently believe that the ultimate resolution of the foregoing matters will have a material adverse effect on the Company’s results of operations, financial condition, or cash flows. The outcome of litigation and other legal and regulatory matters is inherently uncertain, however, and it is possible that one or more of the legal matters currently pending or threatened could have a material adverse effect on our liquidity, consolidated financial position, and/or results of operations.
22
Table of Contents
Lease commitments
The Company leases eight office buildings in the United States and other international locations. Future minimum lease payments, which include non-cancelable operating leases at June 30, 2021, are as follows (in thousands):
| Operating Leases | ||||
| Remainder of 2021 |
$ | 752 | ||
| 2022 |
2,249 | |||
| 2023 |
2,185 | |||
| 2024 |
2,053 | |||
| 2025 |
2,001 | |||
| Thereafter |
6,850 | |||
|
|
|
|||
| Total Minimum Lease Payments |
$ | 16,090 | ||
|
|
|
|||
Rent expense for all operating leases was approximately $0.4 million and $0.1 million for the three months ended June 30, 2021 and 2020, respectively, and $0.6 million and $0.3 million for the six months ended June 30, 2021 and 2020, respectively. The Company has presented rent expense during these periods in selling, general and administrative expenses in the condensed consolidated statement of operations and comprehensive (loss) income.
As of June 30, 2021, the Company had an outstanding guarantee of $2.9 million in aggregate total for lease payments over 10 years for a franchisee’s studio lease in the state of California.
On December 21, 2020, the Company entered into a lease agreement with CIM Urban REIT Properties IX, L.P. to lease an office building in Austin, Texas. The lease term expires on the last day of the 96th lease month from the Rent Commencement Date, as defined in the lease agreement. In the event that the Company does not achieve earnings before interest, taxes, depreciation and amortization (“EBITDA”) of $20.0 million for the period from January 1, 2021 through June 30, 2021, the Company shall post an additional conditional deposit of $1.0 million on or before September 30, 2021 (“First Conditional Deposit”) as additional security for the Company’s obligations under the lease. The Company did not achieve the required EBITDA for the period from January 1, 2021 through June 30, 2021. In the event that the Company does not achieve EBITDA of $53.0 million for the period from January 1, 2021 through December 31, 2021, the Company shall deposit an additional deposit of $1.0 million on or before April 30, 2022 (“Second Conditional Deposit”). The Company is not obligated to deposit the Second Conditional Deposit, regardless of the Company’s EBITDA for the year ended December 31, 2021, in the event that the Company deposits the First Conditional Deposit. As of June 30, 2021, no deposit has been made by the Company.
2020 Promotional Agreements
On October 15, 2020, the Company entered into promotional agreement with ABG-Shark, LLC. Pursuant to this agreement, Greg Norman will provide certain promotional services to the Company in exchange for annual compensation. In addition, should the Company become publicly traded, ABC-Shark would be entitled to receive additional performance-based cash compensation based on the Company’s enterprise value. On the same date, Malibu Crew, Inc., a subsidiary of the Company, also entered into a promotional agreement with Greg Norman, whereby, he will provide certain promotional and marketing services to the Company in exchange for equity compensation equal to 15% of the fair market value of Malibu Crew. As of June 30, 2021, no definitive partnership agreement has been reached with Malibu Crew. Both of these promotional agreements expire on October 14, 2025. It is not currently possible to determine the amounts of additional performance-based cash compensation and equity compensation that the Company will ultimately be required to pay under these two agreements as they are subject to many variables.
On November 24, 2020, the Company entered into a promotional agreement with DB Ventures Limited (“DB Ventures”). Pursuant to this agreement, DB Ventures will provide certain promotional services to the Company in exchange for annual compensation. In addition, for the use of certain image rights over the contractual term, DB Ventures is entitled to a $10 million cash payment if the Company is not publicly traded within 12 months from the execution of this agreement. If the Company were to become publicly traded within 12 months from the execution of this agreement, DB Ventures is entitled to receive the greater of 1% of the Company’s issued and outstanding common stock or $5 million on the six- and 12-month anniversaries of the Company becoming publicly traded. This agreement will expire on December 5, 2025. The Company will recognize expenses related to promotional activities and image rights under this agreement ratably over the five-year contractual term. As part of the agreement, the Company is obligated to create two F45 studios for DB Ventures who will then have the option to take ownership of the studios upon termination of the agreement for no additional service or consideration. As of June 30, 2021, these studio and related lease agreements had yet to commence. For the three and six months ended June 30, 2021, the Company recorded $0.5 million and $1.0 million, respectively, in expense related to this agreement.
23
Table of Contents
2021 Promotional Agreement
On April 12, 2021, the Company entered into a promotional agreement with Magic Johnson Entertainment (“MJE”). Pursuant to this agreement, MJE will provide certain promotional services to the Company in exchange for compensation. MJE is entitled to semi-annual compensation of $1.0 million, beginning within 30 days of the date of the promotional agreement through June 30, 2023. If the Company were to become publicly traded prior to the payment dates of the semi-annual compensation, MJE is entitled to either cash or common stock at the IPO price at MJE’s option. Any semi-annual compensation that remain unpaid as of January 1, 2022 will begin to accrue interest at an annual rate of 10% compounded quarterly. In addition, should the Company become publicly traded prior to the expiration of the agreement, the Company shall grant MJE upon each occurrence of a Vesting Event, as defined in the agreement, a number of shares of common stock equal to the result of $5.00 million divided by the Average Trading Price, as defined in the agreement. The agreement between the Company and MJE terminates on January 23, 2026. For the three and six months ended June 30, 2021, the Company recorded less than $0.1 million in expense related to this agreement.
On June 25, 2021, the Company entered into promotional agreement with Craw Daddy Productions. Pursuant to this agreement, effective July 1, 2021, Cindy Crawford will provide certain promotional services to the Company in exchange for annual compensation. On the same date, Avalon House, a subsidiary of the Company, also entered into a promotional agreement with Cindy Crawford, whereby, she will provide certain promotional and marketing services to the Company in exchange for equity compensation equal to 10% of the fair market value of Avalon House. Both of these promotional agreements expire on June 30, 2026. It is not currently possible to determine the amounts of additional performance-based cash compensation and equity compensation that the Company will ultimately be required to pay under these two agreements as they are subject to many variables.
Note 12—Convertible Preferred Stock and Stockholders’ Deficit
Issuance of convertible preferred stock and common stock
In connection with the transaction with MWIG described in Note 1—Nature of the business and basis of presentation, on July 14, 2021, the Company amended its articles of incorporation and authorized 108,000,000 shares of common stock with a par value of $0.00005, and 11,000,000 shares of preferred stock, all with par values of $0.0001. As of June 30, 2021 and December 31, 2020, the Company had 29,281,514 shares of common stock and 9,854,432 shares of convertible preferred stock issued and outstanding.
As part of the transaction with MWIG and in return for Flyhalf Acquisition Company Pty Ltd acquiring 100% of the shares in F45 Aus Hold Co, the Company issued 58,000,000 shares of its common stock to F45 Aus Hold Co’s existing stockholders. In addition, Flyhalf Acquisition Company Pty Ltd made a payment to F45 Aus Hold Co’s existing stockholders of $100 million.
The payment of $100 million was funded by MWIG, subscribing for 10,000,000 shares of preferred stock at $10 per share in the Company. This amount was ultimately paid to F45 Aus Hold Co’s existing stockholders pro rata in proportion to their interests in F45 Aus Hold Co. Further, Flyhalf Acquisition Company Pty Ltd issued $50.0 million secured promissory notes to F45 Aus Hold Co’s existing stockholders pro rata in proportion to their interests in F45 Aus Hold Co (the “Sellers Notes”). The $100.0 million payment, $50.0 million Sellers Notes and related interest thereon have been recorded as a dividend in the consolidated statements of changes in convertible preferred stock and stockholders’ deficit during the year ended December 31, 2019. In addition to the initial issue of 10,000,000 shares of Preferred Stock, MWIG was granted an option to acquire an additional 1,000,000 shares of Preferred Stock for $10 per share under the Share Purchase Agreement. The $10.0 million in funds raised by the issue of the additional Preferred Stock were used in full to partially settle the outstanding Sellers Notes.
24
Table of Contents
On December 30, 2020, MWIG converted 1,145,568 shares of preferred stock of the Company into 3,181,514 shares of common stock of the Company and sold those shares of common stock to affiliates of L1 Capital Fund, an Australian based global fund manager. Immediately after the closing of the IPO, all outstanding shares of convertible preferred stock converted into 27,368,102 shares of common stock.
The rights and features of the Company’s preferred stock are as follows:
Dividends
The Company shall not declare, pay or set aside any dividends on shares of any other class or series of capital stock of the Company (other than stock dividends) unless the holders of the preferred stock then outstanding shall first receive, or simultaneously receive, a dividend on each outstanding share of preferred stock in an amount at least equal to the product of (1) the dividend payable on each share of such class or series determined, if applicable, as if all shares of such class or series had been converted into common stock and (2) the number of shares of common stock issuable upon conversion of a share of preferred stock.
Liquidation
Upon the occurrence of a deemed liquidation event, as defined in the Company’s Amended and Restated Certificate of Incorporation, the holders of preferred stock shall be entitled to receive, before any distribution or payment to the holders of common stock, an amount equal to the greater of (1) preferred stock issue price per share for such preferred stock, as adjusted to reflect any combination or subdivision, stock dividend or other similar recapitalization, plus declared but unpaid dividends, if any, on such shares, and (2) the amount per share of common stock to which the holder would be entitled had all outstanding Preferred Stock shares been converted to common stock immediately before the distribution. After the distributions or payments to the holders of preferred stock have been paid in full, the entire remaining assets and funds, if any, will be distributed ratably among the holders of common stock in proportion to the number of shares of common stock held by them.
Conversion
The holder of each share of preferred stock has the option to convert the share at any time, into the number of fully paid and non-assessable shares of common stock that results from dividing the preferred stock issue price for the preferred stock share by the preferred stock conversion price that is in effect at the time of conversion. In addition, on (i) the consummation of Qualified Public Offering (as defined in the Company’s Amended and Restated Certificate of Incorporation) or (ii) with the consent of the holders of a majority of the outstanding shares of preferred stock, each share of preferred stock will be automatically converted. The preferred stock conversion price should initially be equal to the preferred stock issue price but subject to special adjustment upon either a Qualified Public Offering, a deemed liquidation event or a fair market value determination (each a “Conversion Price Adjustment Event”). Upon the occurrence of a Conversion Price Adjustment Event, the conversion price will be adjusted based on a formula, as defined in the Company’s Amended and Restated Certificate of Incorporation, which results in reductions to the preferred stock conversion price and additional value to the holder based on higher enterprise value; provided that in no event shall the preferred stock conversion price exceed $10.00 or be less than $7.2014 (subject to appropriate adjustment in the event of any combination or subdivision, stock dividend or other similar recapitalization).
25
Table of Contents
Voting rights
The holders of preferred, on an as-converted basis, and common stock vote together as a single class, except with respect to certain matters specified in the Company’s Amended and Restated Certificate of Incorporation that require the separate approval of the holders of preferred stock.
The Company classifies the preferred stock in temporary equity in accordance with ASC 480-10-S99 because the preferred stock is redeemable for cash or other assets of the Company upon a Deemed Liquidation Event (as defined in the Company’s Amended and Restated Certificate of Incorporation) that are not solely within the control of the Company. The net carrying amount of the preferred stock is not currently accreted to a redemption value because the preferred stock is not currently redeemable or probable of becoming redeemable in the future.
Note 13—Stock-based compensation
Issuance of restricted stock units
In connection with the transaction with MWIG described in Note 1—Nature of the business and basis of presentation, on March 15, 2019, the Company entered into a promotional agreement with Mark Wahlberg (“Mr. Wahlberg”), a member of the Company’s Board of Directors and an investor in MWIG, pursuant to which Mr. Wahlberg agreed to provide promotional services to the Company. In exchange for the agreed upon services provided in the promotional agreement, the Company issued 2,738,648 restricted stock units to Mr. Wahlberg.
The restricted stock units vest based on the Company attaining certain valuation thresholds upon a vesting event, defined as: (i) a deemed liquidation event or change in control; (ii) the closing of a financing transaction including the sale, issuance or redemption of the Company’s (or one of its subsidiaries) equity securities, and any initial public offering; or (iii) at any time that the Company’s common stock is publicly traded, with the Company’s equity value exceeding the following thresholds:
| Company Equity Value Threshold |
Potential Restricted Stock Units Vested |
|||
| $1.0 billion |
912,882 | |||
| $1.5 billion |
912,882 | |||
| $2.0 billion |
912,884 | |||
The Company determined that the restricted stock units are equity classified awards that contain both performance (deemed liquidation event, closing of a financing transaction or the public trading of the Company’s common stock) and market conditions (achievement of prescribed Company equity values) in order for the units to vest. As the achievement of the performance condition is not probable until one of the vesting events has occurs, no stock-based compensation expense was recognized during the three and six months ended June 30, 2021 and 2020 related to these awards.
Upon achievement of a performance condition and the Company reaching a prescribed company equity value threshold, the Company will recognize the grant date fair value of all vested restricted stock units immediately as stock- based compensation cost. In the event that a performance condition were achieved and the Company did not reach a prescribed company equity value threshold, none of these restricted stock units will have vested, however, the grant date fair value of these units will be recognized as compensation expense as of the date of the achievement of the performance condition as long as Mr. Wahlberg renders the requisite service under the terms of the promotional agreement.
26
Table of Contents
The weighted-average grant date fair value of the restricted stock units was $0.38 as of the grant date. There were no restricted stock units that vested or were cancelled or forfeited during the three and six months ended June 30, 2021 and 2020. In addition, there were no restricted stock units granted during the three and six months ended June 30, 2021 and 2020. As of June 30, 2021, there was approximately $1.0 million of unrecognized stock-based compensation expense related to the unvested restricted stock units. There was no stock compensation expense recorded for the three and six months ended June 30, 2021 and 2020. The Company determined the fair value of the restricted stock units using a Monte-Carlo simulation in a risk-neutral framework considering both an initial public offering and a Company sale scenario with an implied equity value based upon the $10 preferred stock price. The other significant assumptions used in the analysis were as follows:
| Scenario: |
IPO | Sale | ||||||
| Probability |
50.0 | % | 50.0 | % | ||||
| Term (years) |
0.75 | 3.50 | ||||||
| Remaining Term of the RSUs (years) |
5.00 | 3.50 | ||||||
| Dividend Yield |
— | % | — | % | ||||
| Risk-free rate |
2.4 | % | 2.4 | % | ||||
| Volatility |
35.0 | % | 35.0 | % | ||||
Note 14—Basic and diluted net loss per share
The computation of net loss per share and weighted average shares of the Company’s common stock outstanding for the periods presented are as follows (in thousands, except share and per share data):
| Three Months Ended June 30, |
Six Months Ended June 30, |
|||||||||||||||
| 2021 | 2020 | 2021 | 2020 | |||||||||||||
| Numerator: |
||||||||||||||||
| Net (loss) income |
$ | (30,524 | ) | $ | 5,868 | $ | (67,369 | ) | $ | 5,135 | ||||||
| Net (loss) income allocated to participating preferred shares |
$ | — | $ | 1,614 | $ | — | $ | 1,412 | ||||||||
|
|
|
|
|
|
|
|
|
|||||||||
| Net (loss) income attributable to common stockholders—basic and diluted |
$ | (30,524 | ) | $ | 4,254 | $ | (67,369 | ) | $ | 3,723 | ||||||
|
|
|
|
|
|
|
|
|
|||||||||
| Denominator: |
||||||||||||||||
| Weighted average common shares outstanding—basic and diluted |
29,281,514 | 58,000,000 | 29,281,514 | 58,000,000 | ||||||||||||
| Net (loss) income per common share: |
||||||||||||||||
| Basic and diluted |
$ | (1.04 | ) | $ | 0.07 | $ | (2.30 | ) | $ | 0.06 | ||||||
| Anti-dilutive securities excluded from diluted loss per common share: |
||||||||||||||||
| Convertible preferred stock |
9,854,432 | — | 9,854,432 | — | ||||||||||||
| Restricted stock units |
2,738,648 | — | 2,738,648 | — | ||||||||||||
| Convertible notes |
5,856,302 | — | 5,856,302 | — | ||||||||||||
|
|
|
|
|
|
|
|
|
|||||||||
| Total |
18,449,382 | — | 18,449,382 | — | ||||||||||||
|
|
|
|
|
|
|
|
|
|||||||||
For the three and six months ended June 30, 2020, the restricted stock units of 2,738,648 have no impact to the diluted net income per share as the performance condition as specified in Note 13-Stock-based compensation has not been met as of June 30, 2021.
27
Table of Contents
Note 15—Segment and geographic area information
The Company’s operating segments align with how the Company manages its business interacts with its franchisees on a geographic basis. F45 is organized by geographic region based on the Company’s strategy to become a globally recognized brand. F45 has three reportable segments: United States, Australia and Rest of World. The Company refers to “Australia” as the operations in Australia, New Zealand and the immediately surrounding island nations. The Company refers to “Rest of World” as the operations in locations other than the United States and Australia. The Company’s Chief Operating Decision Maker (“CODM”) group is comprised of two executive officers, Messrs. Adam Gilchrist and Chris Payne. Segment information is presented in the same manner that the Company’s CODM reviews the operating results in assessing performance and allocating resources. The CODM reviews revenue and gross profit for each of the reportable segments. Gross profit is defined as revenue less cost of revenue incurred by the segment.
The Company does not allocate assets at the reportable segment level as these are managed on an entity wide group basis.
The following is key financial information by reportable segment which is used by management in evaluating performance and allocating resources:
| For the Three Months Ended June 30, 2021 |
For the Three Months Ended June 30, 2020 |
|||||||||||||||||||||||
| Revenue | Cost of revenue | Gross profit | Revenue | Cost of revenue | Gross profit | |||||||||||||||||||
| United States: | ||||||||||||||||||||||||
| Franchise |
$ | 11,741 | $ | 1,308 | $ | 10,433 | $ | 7,461 | $ | 1,158 | $ | 6,303 | ||||||||||||
| Equipment and merchandise |
4,523 | 2,437 | 2,086 | 1,383 | 678 | 705 | ||||||||||||||||||
|
|
|
|
|
|
|
|
|
|
|
|
|
|||||||||||||
| $ | 16,264 | $ | 3,745 | $ | 12,519 | $ | 8,844 | $ | 1,836 | $ | 7,008 | |||||||||||||
|
|
|
|
|
|
|
|
|
|
|
|
|
|||||||||||||
| Australia: | ||||||||||||||||||||||||
| Franchise |
$ | 4,420 | $ | 94 | $ | 4,326 | $ | 2,089 | $ | 173 | $ | 1,916 | ||||||||||||
| Equipment and merchandise |
689 | 514 | 175 | 960 | 902 | 58 | ||||||||||||||||||
|
|
|
|
|
|
|
|
|
|
|
|
|
|||||||||||||
| $ | 5,109 | $ | 608 | $ | 4,501 | $ | 3,049 | $ | 1,075 | $ | 1,974 | |||||||||||||
|
|
|
|
|
|
|
|
|
|
|
|
|
|||||||||||||
| Rest of World: | ||||||||||||||||||||||||
| Franchise |
$ | 4,420 | $ | 60 | $ | 4,360 | $ | 2,511 | $ | 79 | $ | 2,432 | ||||||||||||
| Equipment and merchandise |
1,039 | 788 | 251 | 3,054 | 1,252 | 1,802 | ||||||||||||||||||
|
|
|
|
|
|
|
|
|
|
|
|
|
|||||||||||||
| $ | 5,459 | $ | 848 | $ | 4,611 | $ | 5,565 | $ | 1,331 | $ | 4,234 | |||||||||||||
|
|
|
|
|
|
|
|
|
|
|
|
|
|||||||||||||
| Consolidated: | ||||||||||||||||||||||||
| Franchise |
$ | 20,581 | $ | 1,462 | $ | 19,119 | $ | 12,061 | $ | 1,410 | $ | 10,651 | ||||||||||||
| Equipment and merchandise |
6,251 | 3,739 | 2,512 | 5,397 | 2,832 | 2,565 | ||||||||||||||||||
|
|
|
|
|
|
|
|
|
|
|
|
|
|||||||||||||
| $ | 26,832 | $ | 5,201 | $ | 21,631 | $ | 17,458 | $ | 4,242 | $ | 13,216 | |||||||||||||
|
|
|
|
|
|
|
|
|
|
|
|
|
|||||||||||||
28
Table of Contents
| For the Six Months Ended June 30, 2021 |
For the Six Months Ended June 30, 2020 |
|||||||||||||||||||||||
| Revenue | Cost of revenue | Gross profit | Revenue | Cost of revenue | Gross profit | |||||||||||||||||||
| United States: | ||||||||||||||||||||||||
| Franchise |
$ | 18,756 | $ | 2,330 | $ | 16,426 | $ | 15,709 | $ | 4,089 | $ | 11,620 | ||||||||||||
| Equipment and merchandise |
7,004 | 3,915 | 3,089 | 7,462 | 3,704 | 3,758 | ||||||||||||||||||
|
|
|
|
|
|
|
|
|
|
|
|
|
|||||||||||||
| $ | 25,760 | $ | 6,245 | $ | 19,515 | $ | 23,171 | $ | 7,793 | $ | 15,378 | |||||||||||||
|
|
|
|
|
|
|
|
|
|
|
|
|
|||||||||||||
| Australia: | ||||||||||||||||||||||||
| Franchise |
$ | 7,709 | $ | 272 | $ | 7,437 | $ | 4,840 | $ | 332 | $ | 4,508 | ||||||||||||
| Equipment and merchandise |
1,528 | 1,321 | 207 | 2,478 | 2,184 | 294 | ||||||||||||||||||
|
|
|
|
|
|
|
|
|
|
|
|
|
|||||||||||||
| $ | 9,237 | $ | 1,593 | $ | 7,644 | $ | 7,318 | $ | 2,516 | $ | 4,802 | |||||||||||||
|
|
|
|
|
|
|
|
|
|
|
|
|
|||||||||||||
| Rest of World: | ||||||||||||||||||||||||
| Franchise |
$ | 7,272 | $ | 74 | $ | 7,198 | $ | 5,150 | $ | 173 | $ | 4,977 | ||||||||||||
| Equipment and merchandise |
2,754 | 1,684 | 1,070 | 6,661 | 3,275 | 3,386 | ||||||||||||||||||
|
|
|
|
|
|
|
|
|
|
|
|
|
|||||||||||||
| $ | 10,026 | $ | 1,758 | $ | 8,268 | $ | 11,811 | $ | 3,448 | $ | 8,363 | |||||||||||||
|
|
|
|
|
|
|
|
|
|
|
|
|
|||||||||||||
| Consolidated: | ||||||||||||||||||||||||
| Franchise |
$ | 33,737 | $ | 2,676 | $ | 31,061 | $ | 25,699 | $ | 4,594 | $ | 21,105 | ||||||||||||
| Equipment and merchandise |
11,286 | 6,920 | 4,366 | 16,601 | 9,163 | 7,438 | ||||||||||||||||||
|
|
|
|
|
|
|
|
|
|
|
|
|
|||||||||||||
| $ | 45,023 | $ | 9,596 | $ | 35,427 | $ | 42,300 | $ | 13,757 | $ | 28,543 | |||||||||||||
|
|
|
|
|
|
|
|
|
|
|
|
|
|||||||||||||
Selling, general and administrative expenses, other expenses, and taxes are not allocated to individual segments as these are managed on an entity wide group basis. The reconciliation between reportable segment gross profit to condensed consolidated net loss is as follows (in thousands):
| For the Three Months Ended June 30, |
||||||||
| 2021 | 2020 | |||||||
| Segment gross profit |
$ | 21,631 | $ | 13,216 | ||||
| Selling, general and administrative expenses |
18,562 | 7,633 | ||||||
| Loss on derivative liabilities |
23,098 | — | ||||||
| Interest expense, net |
8,853 | 421 | ||||||
| Other expense (income), net |
329 | (2,258 | ) | |||||
| Provision for income taxes |
1,313 | 1,552 | ||||||
|
|
|
|
|
|||||
| Net (loss) income |
$ | (30,524 | ) | $ | 5,868 | |||
|
|
|
|
|
|||||
| For the Six Months Ended June 30, |
||||||||
| 2021 | 2020 | |||||||
| Segment gross profit |
$ | 35,427 | $ | 28,543 | ||||
| Selling, general and administrative expenses |
35,390 | 21,624 | ||||||
| Loss on derivative liabilities |
48,603 | — | ||||||
| Interest expense, net |
17,268 | 799 | ||||||
| Other expense (income), net |
620 | (577 | ) | |||||
| Provision for income taxes |
915 | 1,562 | ||||||
|
|
|
|
|
|||||
| Net (loss) income |
$ | (67,369 | ) | $ | 5,135 | |||
|
|
|
|
|
|||||
For the three and six months ended June 30, 2021 and June 30, 2020 , respectively, the Company’s long-lived asset additions were not significant.
29
Table of Contents
Note 16—Subsequent events
IPO
On July 15, 2021, the Company closed its IPO and received net proceeds from the offering of $279.0 million, after deducting underwriting discounts and commissions. The Company used the proceeds from the offering to (i) repay $188.6 million of indebtedness under the Term Facility, Revolving Facility, and Subordinated Term Facility, (ii) pay $25.0 million for the acquisition of Flywheel indoor cycling studio business, (iii) $2.4 million in cash bonuses to certain employees, (iv) and $2.5 million for expenses incurred with the IPO. The remainder of the net proceeds will be utilized for working capital and continuing operations. In addition, at the time of the IPO closing, all outstanding shares of convertible preferred stock and outstanding convertible notes were converted into an aggregate of 27,368,102 and 14,847,066 shares of common stock, respectively.
After the Company’s IPO closing, 90,554,571 shares of common stock were outstanding which excludes (i) 5,000,000 shares that became available for future issuance under the F45 Training Holdings Inc. 2021 Equity Incentive Plan, or the 2021 Plan (which includes 3,590,900 shares of the Company’s common stock issuable upon the settlement of restricted stock units, or RSUs, and 263,684 shares of the Company’s common stock issuable upon the exercise of stock options granted in connection with the IPO under the 2021 Plan to certain of the Company’s employees (including certain executive officers), with the stock options to have an exercise price per share equal to $16.00 per share) and (ii) 2,738,648 RSUs, which were issued to Mr. Wahlberg pursuant to a promotional services agreement that we entered into in connection with the MWIG investment, whose RSUs will vest in connection with offering, but not settle until 2022.
Flywheel Acquisition
Upon closing of the IPO on July 15, 2021, the Company acquired certain assets of the Flywheel indoor cycling studio business for $25.0 million, effectively transferring control of the assets to the Company and terminating the license agreement entered into in April 2021. At the closing date, the Company derecognized the unamortized intangible assets and remaining present value liability, and the acquired assets will be recognized as an asset acquisition.
Settlement of Interest Rate Swap
On July 21, 2021, the Company settled its interest rate swap agreement for $0.5 million as part of the repayment of existing debt.
Payment under MJE Promotional Agreement
Pursuant to terms of MJE promotional agreement, in lieu of equity compensation that MJE was entitled to receive as a result of the IPO, the Company and MJE agreed to a cash payment of $4.0 million, which the Company paid on July 27, 2021.
Amendment of Secured Credit Agreement
On August 13, 2021, the Company entered into an amended and restated credit agreement (“Credit Agreement”) which amends and restates the Secured Credit Agreement dated September 18, 2019. The Credit Agreement provides for a $90 million five-year senior secured revolving facility (“Facility”). The Credit Agreement also provides that, under certain circumstances, the Company may increase the aggregate principal amount of revolving commitments by an aggregate amount of up to $35 million. The proceeds from the Facility will be used for general corporate purposes. Amounts outstanding under the Credit Agreement accrue interest at a rate equal to either, at the Company’s election, the LIBO rate plus a margin of 2.50% to 3.50% per annum, or base rate plus a margin of 1.50% to 2.50%, in each case depending on the Company’s total leverage ratio.
30
Table of Contents
Exercise of Greenshoe
On August 13, 2021, the underwriters in the Company’s IPO exercised their greenshoe option to purchase an additional 307,889 shares of the Company’s common stock from the Company and an additional 1,231,555 shares of the Company’s common stock from a selling stockholder at $16.00 per share. The Company received $4.6 million in net proceeds from the purchase of the additional 307,889 shares after deducting underwriting discounts and commissions and will utilize the net proceeds for continuing operations.
31
Table of Contents
Item 2. Management’s Discussion and Analysis of Financial Condition and Results of Operations
You should read the following discussion and analysis of our financial condition and results of operations in conjunction with the “Selected Historical Consolidated Financial and Other Data” section of our prospectus, our audited consolidated financial statements and the related notes, and the unaudited condensed consolidated financial statements appearing elsewhere in our prospectus. In addition to historical information, this discussion and analysis contains forward-looking statements that involve risks, uncertainties and assumptions. Our actual results may differ materially from those anticipated in these forward-looking statements as a result of certain factors, including, but not limited to, those set forth in the “Risk factors” section and elsewhere in our prospectus.
Overview
We are F45 Training, one of the fastest growing fitness franchisors in the United States based on number of franchises sold in the United States, focused on creating a leading global fitness training and lifestyle brand. We offer consumers functional 45-minute workouts that are effective, fun, and community-driven. Our workouts combine elements of high-intensity interval, circuit, and functional training to offer consumers what we believe is the world’s best functional training workout. We deliver our workouts through our digitally-connected global network of studios, and we have built a differentiated, technology-enabled platform that allows us to create and distribute workouts to our global franchisee base. Our platform enables the rapid scalability of our model and helps to promote the success of our franchisees. We offer our members a continuously evolving fitness program in which virtually no two workouts are ever the same. Our vast and growing library of functional training content allows us to vary workout programs to keep consumers engaged with fresh content, stay at the forefront of consumer trends and drive maximum individual results, while helping our members achieve their fitness goals.
Impact of the COVID-19 Pandemic
The COVID-19 pandemic and related shelter-in-place restrictions and other containment efforts have had and continue to have a significant impact on the gym and fitness industry generally, as well as our business, financial condition and results of operations. Following the outbreak of the pandemic and at its initial peak, nearly all of our studios temporarily closed pursuant to local, state and federal mandates and guidelines.
As businesses have been allowed to re-open in certain jurisdictions pursuant to local and state mandates, we have worked closely with our franchisees in helping to re-open their studios subject to certain indoor capacity or other restrictions, including company-implemented health and safety policies. We have also been providing additional operating guidance to our franchisees by assisting with modifications to studio layouts and workouts to accommodate proper social distancing.
As of June 30, 2021, we had approximately 1,415 Open Studios, which represents approximately 91% of our Total Studios. The remaining 9% of our Total Studios are generally located in regions that continue to face restrictions, which we expect to be relaxed over time. The following chart illustrates the number of Open Studios as a percentage of Total Studios at the end of each month for the 15 months ending June 30, 2021.
32
Table of Contents
Open Studios as a Percentage of Total Studios for the 18 Months Ending June 30, 2021
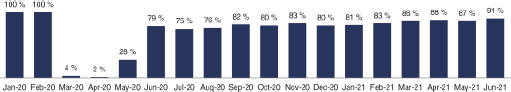
We have found that, on average, studios that have re-opened following temporary closure quickly return close to pre-pandemic levels on a weekly revenue basis, and eventually exceed pre-pandemic levels on the same basis. As of June 30, 2021, the median weekly revenue of the 618 studios that have been re-opened the longest since temporary closure exceeded pre-pandemic levels.
There have been frequent changes and variation in local and state regulation of the health club industry, and many local and state jurisdictions have returned to shelter in place restrictions after allowing for health club re-openings. While we are optimistic about our ability to continue to effectively manage through the COVID-19 pandemic, we are unable to predict the duration or future impact of the pandemic on our business, financial condition and results of operations.
Our Segments
We operate and manage our business based on geographic regions and our strategy to become a leading global fitness and lifestyle brand. We have three reportable segments: United States (which for segment reporting purposes includes our operations in the United States and our 17 studios in Central and South America), Australia and Rest of World. We refer to “Australia” as our operations in Australia, New Zealand and the immediately surrounding island nations. We refer to “Rest of World” or “ROW” as our operations in locations other than the United States and Australia. We evaluate the performance of our segments and allocate resources to them based on revenue and gross profit. Revenue and gross profit for all operating segments include only transactions with external customers and do not include intersegment transactions. The tables on the following pages summarize the financial information for our segments for the years ended December 31, 2020 and 2019 and the three months ended June 30, 2021 and 2020. In all other sections of this filing when we present geographic data, we are presenting such data for the named region on a stand-alone basis.
Our Franchise Model
We operate a nearly 100% franchise model. We believe our franchise model is attractive due to its potential for asset-light growth, strong profitability and robust cash flow generation, and has helped to facilitate our rapid growth and strong financial performance prior to the COVID-19 pandemic. Despite challenges posed by the COVID-19 pandemic, we grew our footprint and experienced minimal permanent closures during 2020, which we believe underscores the resilience of our business model. Between Q2 2021 and Q2 2020, our Total Franchises Sold increased by 36% and our Total Studios increased by 22%. For the three months ended June 30, 2021, as compared with the same period in 2020, our revenue increased by 54% as our network recovers from the COVID-19 pandemic.
Notwithstanding the ongoing challenges presented by the COVID-19 pandemic, we believe we are well positioned to continue to successfully manage through the pandemic and drive growth in the future.
Our opportunities to drive the long-term growth of our business include:
| • | expanding our studio footprint in the United States; |
| • | expanding our studio footprint throughout Rest of World; |
| • | growing same store sales and transitioning to a franchise fee based on the greater of a fixed monthly franchise fee or percentage of gross monthly studio revenue model; |
| • | expanding into new channels; |
| • | developing new workout programs to access new target demographics; and |
| • | driving increased member spend through ancillary product offerings. |
33
Table of Contents
Key Factors Affecting Our Business
Our financial condition and results of operation have been, and will continue to be, affected by a number of important factors, including new franchises sold, new studio openings and number of visits. Many of these factors have been, and will continue to be, impacted by the COVID-19 pandemic.
New Franchises Sold
New Franchises Sold refers to the number of franchises sold during any specific period. We classify Total Franchises Sold, as of any specified date, as the total number of signed franchise agreements in place as of such date that have not been terminated. Each new franchise is included in the number of franchises sold from the date on which we enter into a signed franchise agreement related to each such new franchise. Total Franchises Sold includes franchise arrangements in all stages of development after signing a franchise agreement, and includes franchises with open studios. Franchises are removed from Total Franchises Sold upon termination of the franchise agreement.
Our long-term growth will depend in part on our continued ability to sell new franchises. We are still in the early stages of growth and expansion, particularly in the United States and ROW, and we believe we can significantly grow our franchisee base. If we cannot sell new franchises as quickly as we would like in these geographies, our operating results may be adversely affected.
| Three Months Ended June 30, 2021 | Three Months Ended June 30, 2020 | Year Ended December 31, 2020 | ||||||||||||||||||||||||||||||||||||||||||||||
| U.S. | Australia | ROW | Total | U.S. | Australia | ROW | Total | U.S. | Australia | ROW | Total | |||||||||||||||||||||||||||||||||||||
| Total Franchises Sold, beginning of period |
941 | 676 | 630 | 2,247 | 826 | 653 | 480 | 1,959 | 814 | 643 | 435 | 1,892 | ||||||||||||||||||||||||||||||||||||
| New Franchises Sold, net(a) |
438 | 109 | 7 | 554 | 20 | 14 | 66 | 100 | 117 | 36 | 199 | 352 | ||||||||||||||||||||||||||||||||||||
| Total Franchises Sold, end of period |
1,379 | 785 | 637 | 2,801 | 846 | 667 | 546 | 2,059 | 931 | 679 | 634 | 2,244 | ||||||||||||||||||||||||||||||||||||
| (a) | New Franchises Sold are shown net of franchises that were signed but subsequently terminated prior to studio opening. |
During the year ended December 31, 2019, we sold a net average of 52 new franchises per month. During the 18 months ended June 30, 2021, we sold a net average of 51 new franchises per month, supported by recent multi-unit club deals. Of the 909 net franchises sold during the 18 months ending June 30, 2021, 258 were sold as part of a limited time offer made by F45 exclusively to existing franchisees to stimulate sales in response to the COVID-19 pandemic. The offer provided for a reduced dollar establishment fee and no franchise fee payments until the earlier of the studio opening and January 1, 2022, as well as deferred equipment purchasing until November 2021.
Initial Studio Openings and Total Studios
Initial Studio Openings refers to the number of studios that were determined to be first opened during such period. We classify an Initial Studio Opening to occur in the first month in which the studio first generates monthly revenue of at least $4,500. We classify Total Studios, as of any specified date, as the total cumulative Initial Studio Openings as of that date less cumulative permanent studio closures as of that date. Neither Initial Studio Openings nor Total Studios are adjusted downward for studios that were temporarily closed due to the COVID-19 pandemic or otherwise.
34
Table of Contents
Our long-term growth will depend in part on our continued ability to open new studios. We believe that we will experience continued expansion of new studio openings in the United States and ROW. However, if delays or difficulties are encountered and new studio openings do not occur as quickly as we would like, our operating results may be adversely affected.
| Three Months Ended June 30, 2021 | Three Months Ended June 30, 2020 | Year Ended December 31, 2020 | ||||||||||||||||||||||||||||||||||||||||||||||
| U.S. | Australia | ROW | Total | U.S. | Australia | ROW | Total | U.S. | Australia | ROW | Total | |||||||||||||||||||||||||||||||||||||
| Total Studios, beginning of period |
518 | 617 | 352 | 1,487 | 376 | 593 | 273 | 1,242 | 320 | 581 | 239 | 1,140 | ||||||||||||||||||||||||||||||||||||
| Initial Studio Openings, net |
38 | 11 | 19 | 68 | 20 | 2 | 11 | 33 | 166 | 35 | 96 | 297 | ||||||||||||||||||||||||||||||||||||
| Total Studios, end of period |
556 | 628 | 371 | 1,555 | 396 | 595 | 284 | 1,275 | 486 | 616 | 335 | 1,437 | ||||||||||||||||||||||||||||||||||||
System-Wide Sales
We define System-wide Sales as all payments made to our studios and includes payment for classes, apparel and other sales for a given period. We track System-wide Sales as an indication of the strength of our franchisee network.
Total System-wide Sales declined by 13% in 2020 as a result of widespread temporary studio closures. We generally experienced sequential improvement between April 2020 (which represented a trough month in terms of Open Studios, Membership, and System-wide Sales) and year-end. In the United States, our System-wide Sales increased by 14% in 2020, which compares favorably versus the broader U.S. health club industry, which is estimated to have experienced a 58% decline in revenue according to IHRSA.
Our System-wide Sales have quickly recovered. As of June 2021, our monthly System-wide Sales were approximately $35 million, which compares to our pre-pandemic monthly peak of $36 million, which was last achieved in February 2020.
| Monthly System-wide Sales for the 18 Months Ended June 30, 2021 ($ in millions) | ||||||||||||||||||||||||||||||||||||||||||||||||||||||||||||||||||||||||
| JAN | FEB | MAR | APR | MAY | JUNE | JULY | AUG | SEP | OCT | NOV | DEC | JAN | FEB | MAR | APR | MAY | JUN | |||||||||||||||||||||||||||||||||||||||||||||||||||||||
| United States |
$ | 10 | $ | 10 | $ | 8 | $ | 3 | $ | 4 | $ | 5 | $ | 6 | $ | 7 | $ | 7 | $ | 9 | $ | 9 | $ | 8 | $ | 10 | $ | 9 | $ | 12 | $ | 12 | $ | 14 | $ | 15 | ||||||||||||||||||||||||||||||||||||
| Australia |
19 | 19 | 16 | 4 | 5 | 11 | 13 | 14 | 14 | 16 | 17 | 17 | 18 | 16 | 18 | 17 | 17 | 15 | ||||||||||||||||||||||||||||||||||||||||||||||||||||||
| ROW |
8 | 7 | 5 | 1 | 1 | 2 | 3 | 5 | 5 | 6 | 5 | 4 | 4 | 3 | 5 | 4 | 4 | 5 | ||||||||||||||||||||||||||||||||||||||||||||||||||||||
| Total |
$ | 36 | $ | 36 | $ | 29 | $ | 9 | $ | 10 | $ | 18 | $ | 23 | $ | 25 | $ | 26 | $ | 30 | $ | 31 | $ | 29 | $ | 31 | $ | 29 | $ | 35 | $ | 33 | $ | 35 | $ | 35 | ||||||||||||||||||||||||||||||||||||
Key Non-GAAP Financial and Operating Metrics
We use a variety of non-GAAP information, including EBITDA, Adjusted EBITDA, Adjusted EBITDA margin and same store sales.
| Three Months Ended June 30, |
Six Months Ended June 30, |
|||||||||||||||
| 2021 | 2020 | 2021 | 2020 | |||||||||||||
| Other Data: | (dollars in thousands) | |||||||||||||||
| EBITDA |
(18,908 | ) | 8,449 | (47,084 | ) | 8,658 | ||||||||||
| Adjusted EBITDA |
10,676 | 10,026 | 15,946 | 12,640 | ||||||||||||
| Adjusted EBITDA margin (1) |
39.8 | % | 57.4 | % | 35.4 | % | 29.9 | % | ||||||||
| Same store sales growth (2) |
126.0 | % | (65.0 | )% | 19.5 | % | (32.1 | )% | ||||||||
| (1) | Management believes that EBITDA, Adjusted EBITDA and Adjusted EBITDA margin are useful to investors as they eliminate certain items identified as affecting the period-over-period comparability of our operating results. EBITDA, Adjusted EBITDA and Adjusted EBITDA margin eliminate, among other items, non-cash depreciation and amortization expense that results from our capital investments and intangible assets, as well as income taxes, which may not be comparable with other companies based on our tax structure. |
35
Table of Contents
Other companies may define Adjusted EBITDA and Adjusted EBITDA margin differently, and as a result our measures of Adjusted EBITDA and Adjusted EBITDA margin may not be directly comparable to those of other companies. Although we use EBITDA, Adjusted EBITDA and Adjusted EBITDA margin as financial measures to assess the performance of our business, such use is limited because these measures do not include certain material costs necessary to operate our business. EBITDA, Adjusted EBITDA and Adjusted EBITDA margin should be considered in addition to, and not as a substitute for, net income in accordance with GAAP as a measure of performance. Our presentation of EBITDA, Adjusted EBITDA and Adjusted EBITDA margin should not be construed as an indication that our future results will be unaffected by unusual or nonrecurring items. EBITDA, Adjusted EBITDA and Adjusted EBITDA margin have limitations as analytical tools, and you should not consider them in isolation or as a substitute for analysis of our results as reported under GAAP.
Some of these limitations are:
| • | they do not reflect every cash expenditure, future requirements for capital expenditures or contractual commitments; |
| • | although depreciation and amortization are non-cash charges, the assets being depreciated and amortized will often have to be replaced or require improvements in the future, and EBITDA, Adjusted EBITDA and Adjusted EBITDA margin do not reflect any cash requirement for such replacements or improvements; and |
| • | they are not adjusted for all non-cash income or expense items that are reflected in our statements of cash flows |
Because of these limitations, EBITDA, Adjusted EBITDA and Adjusted EBITDA margin are not intended as alternatives to net income or as indicators of our operating performance and should not be considered as measures of discretionary cash available to us to invest in the growth of our business or as measures of cash that will be available to us to meet our obligations. We compensate for these limitations by using EBITDA, Adjusted EBITDA and Adjusted EBITDA margin along with other comparative tools, together with GAAP measurements, to assist in the evaluation of operating performance. Our GAAP-based measures can be found in our consolidated financial statements and related notes included elsewhere in this filing.
36
Table of Contents
The following table reconciles net income to EBITDA and Adjusted EBITDA:
| Three Months Ended June 30, |
Six Months Ended June 30, |
|||||||||||||||
| 2021 | 2020 | 2021 | 2020 | |||||||||||||
| (dollars in thousands, except per share amounts) | ||||||||||||||||
| Net (loss) income |
(30,524 | ) | 5,868 | (67,369 | ) | 5,135 | ||||||||||
| Net interest expense |
8,853 | 421 | 17,268 | 799 | ||||||||||||
| Provision for income taxes |
1,313 | 1,552 | 915 | 1,562 | ||||||||||||
| Depreciation and amortization |
1,173 | 249 | 1,377 | 477 | ||||||||||||
| Amortization of deferred costs |
277 | 359 | 725 | 685 | ||||||||||||
|
|
|
|
|
|
|
|
|
|||||||||
| EBITDA |
(18,908 | ) | 8,449 | (47,084 | ) | 8,658 | ||||||||||
|
|
|
|
|
|
|
|
|
|||||||||
| Sales tax reserve (a) |
147 | 12 | 247 | 515 | ||||||||||||
| Transaction fees (b) |
1,749 | 1,214 | 3,331 | 2,656 | ||||||||||||
| Loss (gain) on derivative liability (c) |
23,098 | — | 48,603 | — | ||||||||||||
| Certain legal costs and settlements (d) |
886 | 351 | 3,423 | 781 | ||||||||||||
| Forgiveness of loans to directors (e) |
— | — | — | — | ||||||||||||
| Recruitment (f) |
53 | — | 53 | — | ||||||||||||
| Inventory write-off (g) |
— | — | — | — | ||||||||||||
| COVID concessions (h) |
1,851 | — | 4,333 | — | ||||||||||||
| Relocation (i) |
183 | — | 252 | 30 | ||||||||||||
| Development costs (j) |
1,617 | — | 2,788 | — | ||||||||||||
|
|
|
|
|
|
|
|
|
|||||||||
| Adjusted EBITDA |
10,676 | 10,026 | 15,946 | 12,640 | ||||||||||||
|
|
|
|
|
|
|
|
|
|||||||||
| (a) | Represents the impact of one-time sales tax liability arising from a change in timing of enforceability of certain contractual terms in arrangements with franchisees. |
| (b) | Represents transaction costs incurred as a part of a reorganization and the issuance of preferred shares, including legal, tax, accounting and other professional services. |
| (c) | Represents loss on derivative liabilities associated with convertible note. |
| (d) | Represents legal costs related to litigation activities and legal settlements. |
| (e) | Represents the one-time forgiveness of loans to our directors. |
| (f) | Represents one-time recruitment expense of department leaders. |
| (g) | Represents inventory written off. |
| (h) | Represents concessions made to studios impacted by COVID, including one time COVID-19 related write-offs. |
| (i) | Represents costs incurred as a part of the relocation of our corporate headquarters. |
| (j) | Represents one-time non-recurring costs incurred with launch of new brand. |
| (2) | “Same store sales” means, for any reporting period, studio-level revenue generated by a comparable base of franchise studios, which we define as Total Studios that have been operating for more than 16 months. As of June 30, 2021 and December 31, 2020, there were 1,083 and 940 studios, respectively in our comparable base of franchise studios. |
EBITDA, Adjusted EBITDA and Adjusted EBITDA margin
EBITDA is defined as net income before interest, taxes, depreciation and amortization. We define Adjusted EBITDA as net income before interest, taxes, depreciation and amortization and adjusted to exclude the impact of sales tax liability, transaction expenses, certain legal costs and settlements, forgiveness of loans to directors and relocation costs as well as certain other items identified as affecting comparability, when applicable. Adjusted EBITDA margin means Adjusted EBITDA divided by total revenue.
EBITDA, Adjusted EBITDA and Adjusted EBITDA margin have been included in this filing because they are important metrics used by management as one of the means by which it assesses our financial performance. EBITDA, Adjusted EBITDA and Adjusted EBITDA margin are also frequently used by analysts, investors and other interested parties to evaluate companies in our industry. These measures, when used in conjunction with related GAAP financial measures, provide investors with an additional financial analytical framework that may be useful in assessing our company and its results of operations.
37
Table of Contents
The non-GAAP information in this filing should be read in conjunction with our audited annual financial statements and the related notes included elsewhere in our prospectus. For a reconciliation to the most directly comparable GAAP measures, and a discussion of material risks and limitations of these measures, see “Prospectus Summary—Summary Historical Combined and Consolidated Financial and Other Data” within our prospectus filed in July 2021.
38
Table of Contents
Same Store Sales
Same store sales means, for any reporting period, studio-level revenue generated by a comparable base of franchise studios, which we define as Total Studios that have been operating for more than 16 months. As of June 30, 2021 and June 30, 2020, there were 1,083 and 940 studios, respectively in our comparable base of franchise studios. As of December 31, 2020 and 2019, there were 940 and 705 studios, respectively, in our comparable base of franchise studios. As of December 31, 2019 and 2018, there were 704 and 428 franchises, respectively, in our comparable base of franchise studios. We view same store sales as a helpful measure to assess performance of our franchise studios.
Several factors impact our same store sales in any given period, including the following:
| • | the number of studios that have been in operation for more than 16 months; |
| • | the mix of recurring membership and workout pack revenue per studio; |
| • | growth in total memberships and workout pack visits per studio; |
| • | consumer recognition of our brand and our ability to respond to changing consumer preferences; |
| • | our and our franchisees’ ability to operate studios effectively and efficiently to meet consumer expectations; |
| • | marketing and promotional efforts; |
| • | local competition; |
| • | trade area dynamics; |
| • | opening of new studios in the vicinity of existing locations; and |
| • | overall economic trends, particularly those related to consumer spending. |
Same store sales of our international studios are calculated on a constant currency basis on a studio level, meaning that we translate the current year’s same store sales of our international studios at the same exchange rates used in the prior year. We view same store sales as a helpful measure to assess performance of our franchise studios. .
Components of Our Results of Operations
Revenue
We generate revenue from the following sources:
| • | Franchise Revenue: Consists primarily of upfront establishment fees, monthly franchise fees, and other franchise-related fees, including fees related to marketing and other recurring fixed fees paid by franchisees on a monthly basis for various services we provide, such as the use of intranet, email and the studio’s website. Franchise agreements generally consist of an obligation to grant exclusive rights over a defined territory and may include options to renew the agreement, generally for two additional five year terms, as well as the license for certain trademarks and systems to operate that studio. |
Monthly franchise fees generally become payable six to nine months after we and a franchisee execute a franchise agreement, irrespective of whether the franchise has opened their studio. Historically, monthly franchise fees were structured as fixed payments of $1,000-$3,000 per month per studio. In July 2019, we transitioned our model in the United States for new franchisees to a franchise fee based on the greater of a fixed monthly franchise fee or a percentage of gross monthly studio revenue, which we believe will help to further align our interests with those of our franchisees while also providing us with the opportunity to increase franchise revenue. In select markets outside of the United States, and for renewals of existing franchisees in the United States, we are in the process of developing a strategy for transitioning to a similar model.
39
Table of Contents
| • | Equipment and Merchandise: Consists of fees paid to us in exchange for (i) World Packs for new F45 Training studios, which are comprehensive opening packs containing the standardized set of F45-branded fitness equipment and related technology required to operate an F45 Training studio and (ii) subsequent additional and/or replacement equipment and merchandise sales to franchisees including technology, apparel and other fitness-related products. Typically, a portion of the World Pack fee is required to be paid upon the execution of a franchise agreement, with the balance due upon the earlier of: (i) the date the franchisee orders the World Pack; or (ii) eight months from the effective date of the franchise agreement. The franchise agreement mandates all franchisees to order and update new equipment on an annual basis. |
Expenses
We primarily incur the following expenses directly related to our cost of revenues:
| • | Cost of Franchise Revenue: Consists of direct costs associated with franchise sales, lead generation and the provision of marketing services to our franchisees. Our cost of franchise revenue changes primarily based on the number of Total Franchises Sold and Total Studios. |
| • | Cost of Equipment and Merchandise Revenue: Primarily includes the direct costs associated with World Pack equipment as well as additional and replacement equipment and merchandise sales to new and existing franchisees. World Pack costs consist of the cost of the components included in opening packs sold to franchisees, including: (i) gym equipment; (ii) our tech pack (e.g., TVs, F45TV adapters / dongles, heart monitors); and (iii) uniforms and merchandise. Our cost of equipment and merchandise changes primarily based on the World Pack equipment sales, which is driven by the number of franchises sold. |
| • | Selling, General, and Administrative Expenses: Consists of costs associated with wages and salaries and ongoing administrative and franchisee support functions related to our existing franchisees. These costs primarily consist of brand marketing, fitness programming development and testing, technology costs related to development and maintenance of our technology-enabled centralized delivery platform, marketing and promotional activities for the F45 Training brand and legal and accounting expenses. |
| • | Forgiveness of Loans to Directors: As described in “Note 2—Summary of Significant Accounting Policies” to the consolidated financial statements included elsewhere in this filing, in connection with the MWIG Transaction that closed on March 15, 2019, we forgave loans that were previously extended to certain of our existing stockholders who are executive officers and directors. |
| • | Other Expense, Net: Our other expense, net primarily relates to realized and unrealized gains and losses on foreign currency transactions. . |
(Benefit) Provision for Income Taxes
Our effective income tax rate differed from the U.S. statutory tax rate of 21% primarily due to the effect of certain nondeductible expenses, permanent differences, foreign jurisdiction earnings taxed at different rates, reserves for uncertain tax positions and a valuation allowance against certain domestic deferred tax assets that are not more likely than not to be realized.
40
Table of Contents
Recent Transactions
On March 15, 2019, MWIG acquired a minority investment in us. Such investment was effectuated through the following transactions:
| • | on March 12, 2019, F45 Training Holdings was incorporated in the State of Delaware as an ultimate holding company; |
| • | on March 15, 2019, MWIG invested $100 million in F45 Training Holdings in exchange for 10,000,000 shares of convertible preferred stock; and |
| • | immediately following such investment by MWIG, our predecessor’s stockholders, Adam Gilchrist, our Co-Founder and President and Chief Executive Officer, Robert Deutsch, our Co-Founder and former Executive Chairman of our Board of Directors, and 2M Properties Pty Ltd, or 2M Properties, sold all of their existing capital stock in our predecessor, F45 Aus to Flyhalf Acquisition Company Pty Ltd, or Flyhalf Acquisition, an indirect wholly-owned subsidiary of F45 Training Holdings, for an aggregate of (a) $100 million in cash, (b) $50 million in secured promissory notes from Flyhalf Acquisition, or the Initial Stockholder Notes, and (c) 29,000,000 shares of our common stock. In connection with the issuance of the Initial Stockholder Notes, we entered into a guaranty with each of Messrs. Gilchrist and Deutsch and 2M Properties pursuant to which we guaranteed the obligations of Flyhalf Acquisition under their respective Initial Stockholder Notes. |
On April 26, 2019, MWIG invested an additional $10 million in us for an additional 1,000,000 shares of convertible preferred stock. Immediately after giving effect to such investment, we became owned, on an as-converted basis (assuming the conversion of our convertible preferred stock into 15,274,808 shares of common stock and assuming all RSUs issued to Mark Wahlberg fully vest (see “Certain Relationships and Related Transactions—Promotional Agreement” for more details regarding the RSUs held by Mr. Wahlberg)) 28.59% by Mr. Gilchrist, 28.59% by Mr. Deutsch, 6.35% by 2M Properties, 33.47% by MWIG and 3.00% by Mr. Wahlberg. For additional details regarding the MWIG Transaction, see “Certain Relationships and Related Party Transactions—MWIG Transaction.”
We contributed the proceeds from the additional MWIG investment to Flyhalf Acquisition, which in turn used such funds to prepay an aggregate of $9,533,333 in outstanding principal balance under the Initial Stockholder Notes and to repay $466,667 of accrued interest.
We entered into a senior Secured Credit Agreement, dated as of September 18, 2019, or the Secured Credit Agreement, with JPMorgan Chase Bank, N.A., as Administrative Agent, Australian Security Trustee, Lender, Swingline Lender and Issuing Bank, consisting of a $20.0 million revolving credit facility, or the Revolving Facility, and a $30.0 million term loan facility, or the Term Facility. Initial borrowings of $30.0 million from the Term Facility and $11.9 million of the availability under the Revolving Facility were used to repay in full amounts due to common stockholders as a result of the MWIG Transaction. See “Note 12—Convertible Preferred Stock and Stockholders’ Equity” to the consolidated financial statements included elsewhere in this filing, for further discussion. The remaining availability under the Revolving Facility may be drawn and used for general corporate purposes. The obligations under the Secured Credit Agreement are guaranteed by certain of our operating subsidiaries and secured by a majority of our assets. The original maturity date of the Credit Facility was September 18, 2022. The Revolving Facility may be prepaid and terminated by us at any time without premium or penalty (subject to customary LIBOR breakage fees). On October 6, 2020, we executed a second amendment to the Secured Credit Agreement with JPMorgan Chase Bank, N.A. At the time of execution, Term A Loans outstanding was $35.0 million and Revolving Loan outstanding was $7.0 million.
The Term Facility bears interest in quarterly installments at 3.75% of the principal amount until September 30, 2021. Starting December 31, 2021 until the maturity date, the Term Facility bears quarterly interest at 5.00% of the principal amount. The Term Facility principal and interest payments are due quarterly in accordance with an amortization schedule with a maturity date of September 18, 2022.
41
Table of Contents
The Revolving Facility bears interest at our option at a floating rate of LIBOR plus 1.5 percent or an alternate base rate plus 0.5 percent. We have currently elected to bear interest at LIBOR plus 1.5 percent. We are required to pay to the lenders a quarterly commitment fee of 0.25% per annum on the daily unused amount of the Revolving Facility and fees relating to the issuance of letters of credit. The outstanding balance and remaining availability of the Revolving Facility as of June 30, 2021 was $7.0 million and $0, respectively.
The terms of the Secured Credit Agreement require that we not permit the Fixed Charge Coverage Ratio, as defined in the Secured Credit Agreement, for any period of four consecutive fiscal quarters to be less than 1.25 to 1.00. We are also required to maintain a Total Leverage Ratio, as defined in the Secured Credit Agreement, for any period of four consecutive fiscal quarters of less than 2.00 to 1.00. The Secured Credit Agreement also contains other customary covenants. As of June 30, 2021, we were in compliance with our financial covenants.
The Secured Credit Agreement permits the payment of dividends to stockholders and share repurchases by us of up to 15% of the equity interests held by our stockholders.
On October 25, 2019, we entered into an interest rate swap agreement, or the Swap Agreement, with JP Morgan Chase Bank N.A. to fix the interest rate on the Term Facility over the life of the loan. The notional amount of the swap covers the entire $30 million in borrowings outstanding under the Term Facility. Under the terms of the Swap Agreement, the Term Facility, which formerly accrued interest at a rate of LIBOR plus 1.50% will accrue interest starting on the effective date (October 30, 2019) at a fixed rate of 1.741% on an annualized basis. Our objective in executing the Swap Agreement was to hedge against periodic fluctuations in cash flow due to changes in the LIBOR rates.
On June 23, 2020, the Company amended the Secured Credit Agreement to allow it to enter into a definitive agreement with a special purpose acquisition corporation. On October 6, 2020, the Company amended the agreement a second time. Through the second amendment, the Company agreed to convert $8.0 million of the amount outstanding on the Revolving Facility to be part of the Term Facility. In addition to converting a portion of the Revolving Facility to the Term Facility, the Company agreed to repay $5.0 million of the principal amount of the Revolving Facility outstanding.
In connection with the second amendment to the Secured Credit Agreement, the Company modified the existing covenants under the Secured Credit Agreement. The total leverage ratio was modified such that the Company is required to maintain a total leverage ratio, for any period of four consecutive fiscal quarters, of less than 7.00 to 1.00. Prior to the second amendment to the Secured Credit Agreement, the Company was required to maintain a total leverage ratio, for any period of four consecutive fiscal quarters, of less than 2.00 to 1.00. Additionally, the second amendment to the Secured Credit Agreement introduced a new covenant, a senior secured leverage ratio, which requires the Company to maintain a senior secured leverage ratio, for any period of four consecutive fiscal quarters, of less than 2.00 to 1.00.
The interest rate of both Secured Credit Agreement and the Revolving facility were amended to 4.00% and 3.00% for Eurodollar loans and letters of credit, and ABR Loans, respectively.
On June 24, 2020, we entered into a definitive agreement under which Crescent Acquisition Corp would acquire us for an enterprise value of $845 million. On October 5, 2020, we and Crescent Acquisition Corp jointly terminated the agreement because, at that time, a significant number of our studios remained temporarily closed or were closing temporarily again, and there was not yet a clear path for the re-opening of all of our studios and a return to pre-COVID-19 business levels in October 2020.
On October 6, 2020, we entered into agreements with KLIM pursuant to which KLIM invested $225 million into F45 in a mix of a second lien term loan and convertible note. These agreements included a subordinated credit agreement consisting of a $125.0 million term loan facility and subordinated convertible credit agreement pursuant to which we issued $100.0 million of convertible notes. The term loan carries PIK interest of 13.0% with a five year maturity. The convertible notes carry PIK interest of 0.35% and a minimum return on invested capital of 1.5x, maturing in five years and converts at the election of KLIM based on a conversion equity value of $500 million in the event of an initial public offering by us. The convertible notes will convert into an aggregate of 14,847,066 shares of our common stock upon the completion of the Company’s IPO.
42
Table of Contents
On December 30, 2020, we, GIL SPE, LLC, or GIL, owned by Mr. Gilchrist, and MWIG entered into a Stock Purchase Agreement with the L1 Capital Funds pursuant to which each of GIL and MWIG sold a portion of their shares to the L1 Capital Funds.
In April 2021, the Company entered into an intellectual property license agreement with FW SPV II LLC (“FW SPV”), a Delaware limited liability company, regarding certain intellectual property previously owned by Flywheel Sports, Inc. (“Flywheel IP”). The license agreement is for a period of five years at a rate of $5 million per year. Also, on March 31, 2021, the Company entered into an asset purchase agreement with FW SPV, whereby the Company can acquire the rights to the Flywheel IP upon the occurrence of certain circumstances for $25.0 million.
Results of Operations
The following tables summarize key components of our results of operations for the periods indicated:
| Three Months Ended June 30, |
Six Months Ended June 30, |
|||||||||||||||
| 2021 | 2020 | 2021 | 2020 | |||||||||||||
| (dollars in thousands) | ||||||||||||||||
| Revenues: |
||||||||||||||||
| Franchise (Related party: $50 and $137 for the three months ended June 30, 2021 and 2020, respectively, and $100 and $234 for the six months ended June 30, 2021 and 2020, respectively) |
$ | 20,581 | $ | 12,061 | $ | 33,737 | $ | 25,699 | ||||||||
| Equipment and merchandise (Related party: $0 and $112 for the three months ended June 30, 2021 and 2020, respectively, and $0 and $112 for the six months ended June 30, 2021 and 2020, respectively) |
6,251 | 5,397 | 11,286 | 16,601 | ||||||||||||
|
|
|
|
|
|
|
|
|
|||||||||
| Total revenues |
26,832 | 17,458 | 45,023 | 42,300 | ||||||||||||
| Costs and operating expenses: |
||||||||||||||||
| Cost of franchise revenue (Related party $0 and $0 for the three months ended June 30, 2021 and 2020, respectively, and $0 and $12 for the six months ended June 30, 2021 and 2020, respectively) |
1,462 | 1,410 | 2,676 | 4,594 | ||||||||||||
| Cost of equipment and merchandise (Related party: $1,203 and $265 for the three months ended June 30, 2021 and 2020, respectively, and $2,144 and $1,316 for the six months ended June 30, 2021 and 2020, respectively) |
3,739 | 2,832 | 6,920 | 9,163 | ||||||||||||
| Selling, general and administrative expenses |
18,562 | 7,633 | 35,390 | 21,624 | ||||||||||||
| Forgiveness of loans to directors |
— | — | — | — | ||||||||||||
|
|
|
|
|
|
|
|
|
|||||||||
| Total costs and operating expenses |
23,763 | 11,875 | 44,986 | 35,381 | ||||||||||||
|
|
|
|
|
|
|
|
|
|||||||||
| Income (losses) from operations |
3,069 | 5,583 | 37 | 6,919 | ||||||||||||
| Loss on derivative liabilities |
23,098 | — | 48,603 | — | ||||||||||||
| Interest expense, net |
8,853 | 421 | 17,268 | 799 | ||||||||||||
| Other expense (income), net |
329 | (2,258 | ) | 620 | (577 | ) | ||||||||||
|
|
|
|
|
|
|
|
|
|||||||||
| (Loss) income before income taxes |
(29,211 | ) | 7,420 | (66,454 | ) | 6,697 | ||||||||||
| Provision for income taxes |
1,313 | 1,552 | 915 | 1,562 | ||||||||||||
|
|
|
|
|
|
|
|
|
|||||||||
| Net (loss) income |
$ | (30,524 | ) | $ | 5,868 | $ | (67,369 | ) | $ | 5,135 | ||||||
|
|
|
|
|
|
|
|
|
|||||||||
43
Table of Contents
Comparison of the three and six months ended June 30, 2021 and 2020
Revenue
Franchise Revenue
| Three Months Ended June 30, |
Change | |||||||||||||||
| 2021 | 2020 | $ | % | |||||||||||||
| (dollars in thousands) | ||||||||||||||||
| Franchise |
||||||||||||||||
| USA |
$ | 11,741 | $ | 7,461 | $ | 4,280 | 57 | % | ||||||||
| Australia |
4,420 | 2,089 | 2,331 | 112 | % | |||||||||||
| ROW |
4,420 | 2,511 | 1,909 | 76 | % | |||||||||||
|
|
|
|
|
|
|
|
|
|||||||||
| Total franchise revenue |
$ | 20,581 | $ | 12,061 | $ | 8,520 | 71 | % | ||||||||
|
|
|
|
|
|
|
|
|
|||||||||
| Six Months Ended June 30, |
Change | |||||||||||||||
| 2021 | 2020 | $ | % | |||||||||||||
| (dollars in thousands) | ||||||||||||||||
| Franchise |
||||||||||||||||
| USA |
$ | 18,756 | $ | 15,709 | $ | 3,047 | 19 | % | ||||||||
| Australia |
7,709 | 4,840 | 2,869 | 59 | % | |||||||||||
| ROW |
7,272 | 5,150 | 2,122 | 41 | % | |||||||||||
|
|
|
|
|
|
|
|
|
|||||||||
| Total franchise revenue |
$ | 33,737 | $ | 25,699 | $ | 8,038 | 31 | % | ||||||||
| Six Months Ended June 30, |
Change | |||||||||||||||
| 2021 | 2020 | Stores | % | |||||||||||||
| (in units) | ||||||||||||||||
| Number of studios open |
||||||||||||||||
| USA |
$ | 556 | $ | 396 | 160 | 40 | % | |||||||||
| Australia |
628 | 595 | 33 | 6 | % | |||||||||||
| ROW |
371 | 284 | 87 | 31 | % | |||||||||||
|
|
|
|
|
|
|
|
|
|||||||||
| Total studios open |
$ | 1,555 | 1,275 | 280 | 22 | % | ||||||||||
|
|
|
|
|
|
|
|
|
|||||||||
The $4.3 million, or 57%, increase in franchise revenue in the United States for the three months ended June 30, 2021 compared to the three months ended June 30, 2020 was primarily attributable to the increase in number of new studio openings in the United States during the period. The number of new studio openings increased by 17 from 23 new studio openings for the three months ended June 30, 2020 to 40 new studio openings for the three months ended June 30, 2021. Due to the increase in number of new studio openings, marketing revenue for the period increased by $0.3 million. Franchise-related fees and other recurring fixed fees remained relatively consistent for the three months period ended June 30, 2021 and June 30, 2020. The increase in number of new studio openings was driven by the reduced impact of COVID-19 pandemic compared to the significant impact at the emergence of the pandemic in the United States during the period ended June 30, 2020.
The $3.0 million, or 19%, increase in franchise revenue in the United States for the six months ended June 30, 2021 compared to the six months ended June 30, 2020 was primarily attributable to the increase in number of new studio openings in the United States during the period. The number of new studio openings decreased by 5 from 79 new studio openings for the six months ended June 30, 2020 to 74 new studio openings for the six months ended June 30, 2021. Due to the decrease in number of new studio openings, marketing revenue for the period decreased by $0.7 million. Franchise-related fees and other recurring fixed fees remained relatively consistent for the six months period ended June 30, 2021 and June 30, 2020. The decline in number of new studio openings was primarily as a result of the COVID-19 pandemic which had less of an overall impact for the six months ended June 30, 2020 compared to the six months ended June 30, 2021.
44
Table of Contents
The $2.3 million, or 112%, increase in franchise revenue in Australia for the three months ended June 30, 2021 compared to the three months ended June 30, 2020 was primarily attributable to increase franchise fees paid by franchisees as a result of an increase in number of open studios. The $2.9 million, or 59%, increase in franchise revenue in Australia for the six months ended June 30, 2021 compared to the six months ended June 30, 2020 was primarily attributable to increase franchise fees paid by franchisees as a result of an increase in number of open studios. Open studios increased from 595 as of June 30, 2020 to 628 as of June 30, 2021, which is a 6% increase compared to the equivalent period in 2020. Our Australia segment continues to see a moderate increase in its franchise revenue as a result of our mature presence in the Australian market.
The $1.9 million, or 76%, increase in franchise revenue in ROW for the three months ended June 30, 2021 compared to the three months ended June 30, 2020 was primarily attributable to the increase in number of studios open for ROW. Open studios increased from 284 as of June 30, 2020 to 371 as of June 30, 2021, which is a 31% increase compared to the equivalent period in 2020. The number of new studio openings for the three months ended June 30, 2021 and 2020 was 21 and 11, respectively.
The $2.1 million, or 41%, increase in franchise revenue in ROW for the six months ended June 30, 2021 compared to the six months ended June 30, 2020 was primarily attributable to the increase in number of studios open for ROW as well as expected revenues for stimulus agreements. Stimulus agreements resulted in a $1.6 million increase in revenues for the six months ended June 30, 2021 compared to the same period in 2020. Due to studio growth, establishment fees, monthly franchise fees, and other franchise-related fees increased by $1.2 million during the period. Such increase was offset by a decrease of $0.6 million in marketing and other recurring fixed fees as a result of an decrease in number of new studio openings for the six months ended June 30, 2021 ‘’as compared to the same period in 2020. The number of new studio openings for the six months ended June 30, 2021 and 2020 was 40 and 45, respectively.
Equipment and Merchandise Revenue
| Three Months Ended June 30, |
Change | |||||||||||||||
| 2021 | 2020 | $ | % | |||||||||||||
| (dollars in thousands) | ||||||||||||||||
| Equipment and merchandise |
||||||||||||||||
| USA |
$ | 4,523 | $ | 1,383 | $ | 3,140 | 227 | % | ||||||||
| Australia |
689 | 960 | (271 | ) | (28 | )% | ||||||||||
| ROW |
1,039 | 3,054 | (2,015 | ) | (66 | )% | ||||||||||
|
|
|
|
|
|
|
|
|
|||||||||
| Total equipment and merchandise |
$ | 6,251 | $ | 5,397 | $ | 854 | 16 | % | ||||||||
|
|
|
|
|
|
|
|
|
|||||||||
45
Table of Contents
| Six Months Ended June 30, |
Change | |||||||||||||||
| 2021 | 2020 | $ | % | |||||||||||||
| (dollars in thousands) | ||||||||||||||||
| Equipment and merchandise |
||||||||||||||||
| USA |
$ | 7,004 | $ | 7,462 | $ | (458 | ) | (6 | )% | |||||||
| Australia |
1,528 | 2,478 | (950 | ) | (38 | )% | ||||||||||
| ROW |
2,754 | 6,661 | (3,907 | ) | (59 | )% | ||||||||||
|
|
|
|
|
|
|
|
|
|||||||||
| Total equipment and merchandise |
$ | 11,286 | $ | 16,601 | $ | (5,315 | ) | (32 | )% | |||||||
|
|
|
|
|
|
|
|
|
|||||||||
The $3.1 million, or 227%, increase in equipment and merchandise revenue in the United States for the three months ended June 30, 2021 compared to the three months ended June 30, 2020. The increase was primarily attributable to the increase of World Pack sales during the second quarter of 2021. World Pack sales increased by $2.8 million as a result of 40 new studio openings during the period, compared to 20 new studio openings during the three months ended June 30, 2020. Top Up sales increased by $0.3 million in the United States as a result of prior period deliveries recognized during the second quarter of 2021.
The $0.5 million, or (6)%, decrease in equipment and merchandise revenue in the United States for the six months ended June 30, 2021 compared to the six months ended June 30, 2020 was primarily attributable to the $0.8 million decrease in Work Pack sales during the second quarter of 2021 driven by a deferral of World Pack deliveries due to the COVID-19 pandemic offset by a $0.3 million increase in Top Up sales in the United States as a result of prior period deliveries recognized during the second quarter of 2021.
The $0.3 million, or 28%, decrease in equipment and merchandise revenue in Australia for the three months ended June 30, 2021 compared to the three months ended June 30, 2020 in Australia was largely attributable to the deferral of World Pack deliveries due to the pandemic during the second quarter of 2021.
The $1.0 million, or 38%, decrease in equipment and merchandise revenue in Australia for the six months ended June 30, 2021 compared to the six months ended June 30, 2020 in Australia was largely attributable to the decrease of new studio sales during and lower merchandise revenue. World Pack sales decreased by $1.0 million from 15 new studio opening during the period, compared to World Pack sales to 14 new studio openings during the six months ended June 30, 2020. The decrease in World Pack sales during the six months ended June 30, 2021 was driven by a reduction in studio openings due to the COVID-19 pandemic.
The $2.0 million, or 66%, decrease in equipment and merchandise revenue for the three months ended June 30, 2021 compared to the three months ended June 30, 2020 in ROW was primarily attributable to the deferral of Work Pack deliveries due to the pandemic during the second quarter of 2021.
The $3.9 million, or 59%, decrease in equipment and merchandise revenue for the six months ended June 30, 2021 compared to the six months ended June 30, 2020 in ROW was primarily attributable to the decrease in World Pack sales during the six months ended June 30, 2021. World Pack sales decreased by $3.8 million from 36 new studio openings during the period, compared to World Pack sales to 45 new studio openings during the six months ended June 31, 2020. The decrease in World Pack sales during the six months ended June 30, 2021 was driven by a reduction in studio openings and deferral of World Pack deliveries due to the COVID-19 pandemic.
46
Table of Contents
Cost of revenue
Cost of franchise revenue
| Three Months Ended June 30, |
Change | |||||||||||||||
| 2021 | 2020 | $ | % | |||||||||||||
| (dollars in thousands) | ||||||||||||||||
| Franchise |
||||||||||||||||
| USA |
$ | 1,308 | $ | 1,158 | $ | 150 | 13 | % | ||||||||
| Australia |
94 | 173 | (79 | ) | (46 | )% | ||||||||||
| ROW |
60 | 79 | (19 | ) | (24 | )% | ||||||||||
|
|
|
|
|
|
|
|
|
|||||||||
| Total cost of franchise revenue |
$ | 1,462 | $ | 1,410 | $ | 52 | 4 | % | ||||||||
|
|
|
|
|
|
|
|
|
|||||||||
| Percentage of franchise revenue |
7 | % | 12 | % | ||||||||||||
| Six Months Ended June 30, |
Change | |||||||||||||||
| 2021 | 2020 | $ | % | |||||||||||||
| (dollars in thousands) | ||||||||||||||||
| Franchise |
||||||||||||||||
| USA |
$ | 2,330 | $ | 4,089 | $ | (1,759 | ) | (43 | )% | |||||||
| Australia |
272 | 332 | (60 | ) | (18 | )% | ||||||||||
| ROW |
74 | 173 | (99 | ) | (57 | )% | ||||||||||
|
|
|
|
|
|
|
|
|
|||||||||
| Total cost of franchise revenue |
$ | 2,676 | $ | 4,594 | $ | (1,918 | ) | (42 | )% | |||||||
|
|
|
|
|
|
|
|
|
|||||||||
| Percentage of franchise revenue |
8 | % | 18 | % | ||||||||||||
The $0.2 million, or 13%, increase in cost of franchise revenue in the United States for the three months ended June 30, 2021 as compared to the same period in 2020 was primarily attributable to $0.1 million increase related to marketing programs was driven by the reduced impact of COVID-19 pandemic compared to the significant impact at the emergence of the pandemic in the United States during the period ended June 30, 2020.
The $1.8 million, or 43%, decrease in cost of franchise revenue in the United States for the six months ended June 30, 2021 as compared to the same period in 2020 was primarily attributable related to marketing programs put on hold during the six months ended June 30, 2021 as a result of the COVID-19 pandemic.
The less than $0.1 million, or 46%, decrease in cost of franchise revenue in Australia during the three months ended June 30, 2021 as compared to the same period in 2020 was attributable to decrease in marketing expenses as most studios were closed due to the COVID-19 pandemic.
The less than $0.1 million, or 18%, decrease in cost of franchise revenue in Australia during the six months ended June 30, 2021 as compared to the same period in 2020 was primarily attributable to decrease in marketing expenses as most studios were closed due to the COVID-19 pandemic.
The less than $0.1 million, or 24%, decrease in cost of franchise revenue in ROW during the three months ended June 30, 2021 as compared to the same period in 2020 was primarily attributable to decrease in marketing expenses as most studios were closed due to the COVID-19 pandemic.
The less than $0.1 million, or 57%, decrease in cost of franchise revenue in ROW during the six months ended June 30, 2021 as compared to the same period in 2020 was primarily attributable to decrease in marketing expenses as most studios were closed due to the COVID-19 pandemic.
47
Table of Contents
Cost of equipment and merchandise
| Three Months Ended June 30, |
Change | |||||||||||||||
| 2021 | 2020 | $ | % | |||||||||||||
| (dollars in thousands) | ||||||||||||||||
| Equipment and merchandise |
||||||||||||||||
| USA |
$ | 2,437 | $ | 678 | $ | 1,759 | 259 | % | ||||||||
| Australia |
514 | 902 | (388 | ) | (43 | )% | ||||||||||
| ROW |
788 | 1,252 | (464 | ) | (37 | )% | ||||||||||
|
|
|
|
|
|
|
|
|
|||||||||
| Total equipment and merchandise cost of revenue |
$ | 3,739 | $ | 2,832 | $ | 907 | 32 | % | ||||||||
|
|
|
|
|
|
|
|
|
|||||||||
| Percentage of equipment and merchandise revenue |
60 | % | 52 | % | ||||||||||||
| Six Months Ended June 30, |
Change | |||||||||||||||
| 2021 | 2020 | $ | % | |||||||||||||
| (dollars in thousands) | ||||||||||||||||
| Equipment and merchandise |
||||||||||||||||
| USA |
$ | 3,915 | $ | 3,704 | $ | 211 | 6 | % | ||||||||
| Australia |
1,321 | 2,184 | (863 | ) | (40 | )% | ||||||||||
| ROW |
1,684 | 3,275 | (1,591 | ) | (49 | )% | ||||||||||
|
|
|
|
|
|
|
|
|
|||||||||
| Total equipment and merchandise cost of revenue |
$ | 6,920 | $ | 9,163 | $ | (2,243 | ) | (24 | )% | |||||||
|
|
|
|
|
|
|
|
|
|||||||||
| Percentage of equipment and merchandise revenue |
61 | % | 55 | % | ||||||||||||
The $1.8 million, or 259%, increase in cost of equipment and merchandise for the United States for the three months ended June 30, 2021 as compared to the same period in 2020 was primarily attributable to an increase of $1.7 million in equipment costs from the increase in new studio openings during the period as a result of the COVID-19 pandemic.
The $0.2 million, or 6%, increase in cost of equipment and merchandise for the United States for the six months ended June 30, 2021 as compared to the same period in 2020 was primarily attributable to an increase of $0.2 million in equipment costs from the increase in new studio openings.
The $0.4 million, or 43%, decrease in cost of equipment and merchandise for Australia for the three months ended June 30, 2021 as compared to the same period in 2020 relates to a decrease in equipment costs from the decrease in equipment deliveries during the period due to the COVID-19 pandemic.
The $0.9 million, or 40%, decrease in cost of equipment and merchandise for Australia for the six months ended June 30, 2021 as compared to the same period in 2020 primarily attributable to a decrease in equipment costs as a result of the decrease in equipment deliveries during the period due to the COVID-19 pandemic.
The $0.5 million, or 37%, decrease in cost of equipment and merchandise for ROW for the three months ended June 30, 2021 as compared to the same period in 2020 is primarily attributable to a decrease in equipment costs from the decrease in equipment costs as a result of the decrease in equipment deliveries during the period due to the COVID-19 pandemic.
The $1.6 million, or 49%, decrease in cost of equipment and merchandise for ROW for the six months ended June 30, 2021 as compared to the same period in 2020 is primarily attributable to a decrease in equipment costs as a result of the decrease in equipment deliveries during the period due to the COVID-19 pandemic.
48
Table of Contents
Selling, general, and administrative expenses
| Three Months Ended June 30, |
Change | |||||||||||||||
| 2021 | 2020 | $ | % | |||||||||||||
| (dollars in thousands) | ||||||||||||||||
| Selling, general and administrative expenses |
18,562 | 7,633 | $ | 10,929 | 143 | % | ||||||||||
| Percentage of revenue |
69 | % | 44 | % | ||||||||||||
| Six Months Ended June 30, |
Change | |||||||||||||||
| 2021 | 2020 | $ | % | |||||||||||||
| (dollars in thousands) | ||||||||||||||||
| Selling, general and administrative expenses |
35,390 | 21,624 | $ | 13,766 | 64 | % | ||||||||||
| Percentage of revenue |
79 | % | 51 | % | ||||||||||||
The $10.9 million, or 143%, increase in selling, general, and administrative expenses during the three months ended June 30, 2021 as compared to the same period in 2020 was primarily attributable to a $3.4 million increase in marketing, $2.0 million increase in salaries, $1.2 million increase in professional service fees from the continued expansion of our business, our ongoing brand awareness campaigns, and overhead incidental to day-to-day operations across our expanding global footprint, and $0.9 million increase in depreciation and amortization. In addition, an increase of $1.8 million to bad debt from terminated studios affected by the ongoing effects of the COVID-19 pandemic.
The $13.8 million, or 64%, increase in selling, general, and administrative expenses during the six months ended June 30, 2021 as compared to the same period in 2020 was primarily attributable to a $5.3 million increase in marketing, $3.0 million increase in professional service fees from the continued expansion of our business, our ongoing brand awareness campaigns, and overhead incidental day-to-day operations across our expanding global footprint, $2.7 million increase in salaries, and $1.0 million increase in depreciation and amortization. In addition an increase of $1.6 million to bad debt from terminated studios affected by the ongoing effects of the COVID-19 pandemic.
Loss on derivative liabilities
| Three Months Ended June 30, |
Change | |||||||||||||||
| 2021 | 2020 | $ | % | |||||||||||||
| (dollars in thousands) | ||||||||||||||||
| Loss on derivative liabilities |
23,098 | — | $ | 23,098 | 100 | % | ||||||||||
| Six Months Ended June 30, |
Change | |||||||||||||||
| 2021 | 2020 | $ | % | |||||||||||||
| (dollars in thousands) | ||||||||||||||||
| Loss on derivative liabilities |
48,603 | — | $ | 48,603 | 100 | % | ||||||||||
On October 6, 2020, we entered into a subordinated convertible debt agreement, or the Convertible Notes, whereby we issued $100 million of Convertible Notes to certain holders maturing on September 30, 2025. The Convertible Notes contain embedded derivatives that required bifurcation and recognition as liabilities on the condensed consolidated balance sheet. The liabilities for these embedded derivatives was measured at fair value as of October 6, 2020, and the subsequent change in the estimated fair value was recorded as a loss during the three and six months ended June 30, 2021.
49
Table of Contents
Interest expense, net
| Three Months Ended June 30, |
Change | |||||||||||||||
| 2021 | 2020 | $ | % | |||||||||||||
| (dollars in thousands) | ||||||||||||||||
| Interest expense, net |
8,853 | 421 | $ | 8,432 | 2003 | % | ||||||||||
| Six Months Ended June 30, |
Change | |||||||||||||||
| 2021 | 2020 | $ | % | |||||||||||||
| (dollars in thousands) | ||||||||||||||||
| Interest expense, net |
17,268 | 799 | $ | 16,469 | 2061 | % | ||||||||||
The increase in interest expense, including the amortization of debt discounts, net for the three and six months ended June 30, 2021 compared to the same periods in 2020 was a result of the new borrowings taken out on October 6, 2020. The borrowings outstanding as of June 30, 2020 were $49.7 million, while total debt (including convertible debt) outstanding as of June 30, 2021 increased to $255.3 million.
Other expense, net
| Three Months Ended June 30, |
Change | |||||||||||||||
| 2021 | 2020 | $ | % | |||||||||||||
| (dollars in thousands) | ||||||||||||||||
| Other expense (income), net |
329 | (2,258 | ) | $ | 2,587 | (115 | )% | |||||||||
| Six Months Ended June 30, |
Change | |||||||||||||||
| 2021 | 2020 | $ | % | |||||||||||||
| (dollars in thousands) | ||||||||||||||||
| Other expense (income), net |
620 | (577 | ) | $ | 1,197 | (207 | )% | |||||||||
The $2.6 million and $1.2 million increase in other (income) expense, net represents realized and unrealized gains and losses on foreign currency transactions for the three and six months ended June 30, 2021, respectively. This increase during the three and six months ended June 30, 2021, was mostly due to the volatility of foreign exchange rates during the three and six months ended June 30, 2021 under the COVID-19 pandemic compared to the strengthening of the U.S. dollar relative to the Australian dollar during the same period in prior year.
Provision for income taxes
| Three Months Ended June 30, |
Change | |||||||||||||||
| 2021 | 2020 | $ | % | |||||||||||||
| (dollars in thousands) | ||||||||||||||||
| Provision for income taxes |
1,313 | 1,552 | $ | (239 | ) | (15 | )% | |||||||||
| Six Months Ended June 30, |
Change | |||||||||||||||
| 2021 | 2020 | $ | % | |||||||||||||
| (dollars in thousands) | ||||||||||||||||
| Provision for income taxes |
915 | 1,562 | $ | (647 | ) | (41 | )% | |||||||||
50
Table of Contents
The decrease in the provision for income taxes was primarily driven by an increase in pretax loss reported by the US and Australia segments in the three months ended June 30, 2021. The decline in loss before income taxes was most significantly driven by the operational challenges experienced due to the COVID-19 pandemic.
Liquidity and Capital Resources
Overview
As of June 30, 2021, we held $16.6 million of cash and cash equivalents, of which $3.1 million was held by our foreign subsidiaries outside of the United States. In the event that we repatriate these funds from our foreign subsidiaries, we would need to accrue and pay applicable United Sates taxes and withholding taxes payable to various countries. As of June 30, 2021, our intent was to permanently reinvest these funds outside of the United States. Accordingly, no deferred taxes have been provided for withholding taxes or other taxes that would result upon repatriation of approximately $53.0 million of undistributed earnings from these foreign subsidiaries as those earnings continue to be permanently reinvested. It is not practicable to estimate income tax liabilities that might be incurred if such earnings were remitted to the United States due to the complexity of the underlying calculation. Although we have no intention to repatriate the undistributed earnings of our foreign subsidiaries for the foreseeable future, if such funds are needed for operations in the United States, to the extent applicable and material, we will revise future filings to address the potential tax implications. Our primary cash needs are for the funding of day-to-day operations, financing capital investments and to address our working capital needs.
We believe that our operating cash flow and cash on hand will be adequate to meet our operating, investing and financing needs for the next 12 months. If necessary, we may borrow funds under the Revolving Facility to finance our liquidity requirements, subject to customary borrowing conditions. The outstanding balance of the Revolving Facility as of June 30, 2021 was $7.0 million. To the extent additional funds are necessary to meet our long-term liquidity needs as we continue to execute our business strategy, we anticipate that they will be obtained through the incurrence of additional indebtedness, additional equity financings or a combination of these potential sources of funds; however, such financing may not be available on favorable terms, or at all. Our ability to meet our operating, investing and financing needs depends to a significant extent on our future financial performance, which will be subject in part to general economic, competitive, financial, regulatory and other factors that are beyond our control, including those described elsewhere in our prospectus under the heading “Risk Factors.” In addition to these general economic and industry factors, the principal factors in determining whether our cash flows will be sufficient to meet our liquidity requirements will be our ability to globally expand our franchisee footprint.
Cash flow
| Six Months Ended June 30, | ||||||||
| 2021 | 2020 | |||||||
| (dollars in thousands) | ||||||||
| Net cash used in operating activities |
$ | (7,579 | ) | $ | (10,541 | ) | ||
| Net cash used in investing activities |
(902 | ) | (877 | ) | ||||
| Net cash (used in) provided by financing activities |
(2,625 | ) | 8,270 | |||||
| Effect of exchange rate changes on cash, cash equivalents, and restricted cash |
$ | 300 | $ | (291 | ) | |||
|
|
|
|
|
|||||
| Net decrease in cash, cash equivalents, and restricted cash |
$ | (10,806 | ) | $ | (3,439 | ) | ||
|
|
|
|
|
|||||
Net cash used in operating activities
In all periods presented, our largest source of cash inflow stemmed from our collections of establishment and World Pack fees from our franchisees. The most significant cash outflow is our equipment/merchandise costs and employee costs. Historically, we have produced positive net cash flow. We have seen a decrease in operating cash flows due to the pandemic and studio shutdowns during COVID-19.
51
Table of Contents
For the six months ended June 30, 2021, net cash used in operating activities amounted to $7.6 million compared to net cash used in operating activities of $10.5 million for the six months ended June 30, 2020. This $2.9 million decrease in net cash used in operating activities was primarily attributable to a $72.5 million fluctuation in net loss being offset by a net decrease of $67.9 million in non-cash adjustments to net income including a $48.6 million loss on derivative liabilities, which was included in the three months ended June 30, 2021 and not in the same period in the prior year. This change was further impacted by a net $7.6 million decrease in working capital primarily due to higher legal and professional fees as well as higher marketing costs during the six months ended June 30, 2021 compared to the same period in the prior year.
Net cash used in investing activities
For the six months ended June 30, 2021, our cash used in investing activities increased by less than $0.1 million from the cash used in investing activities for the six months ended June 30, 2020, as our investing activities included a decrease of less than $0.1 million of purchases of intangibles and less than $0.1 million of downward change in purchases of property and equipment.
Net cash (used in) provided by financing activities
For the six months ended June 30, 2021, net cash used in financing activities was $2.6 million compared to net cash provided by financing activities of $8.3 million during the six months ended June 30, 2020, a decrease of $10.9 million. This decrease was primarily due to an increase of borrowings under our Revolving Facility of $8.1 million during the six months ended June 30, 2020 to provide cash to fund the decrease in operating cash flows as a result of the COVID-19 pandemic. The decrease in cash provided by financing activities was further impacted by repayments under our First Lien Loan of $2.6 million during the six months ended June 30, 2021.
Contractual Obligations and Commitments
Contractual obligations and commitments as of June 30, 2021 consisted of $16.1 million in operating leases, all of which is due within the next four years and thereafter. Please see “Note 6—Debt” and “Note 11—Commitments and contingencies” to the interim unaudited condensed consolidated financial statements for discussion of the contractual obligations under the Term Facility and Revolving Facility related to our debt and operating leases.
Off-Balance Sheet Arrangements
As of June 30, 2021, our off-balance sheet arrangements consisted of operating leases for office space. See “Note 11—Commitments and Contingencies” to the interim unaudited condensed consolidated financial statements included elsewhere in this filing for more information regarding these operating leases.
Critical Accounting Policies and Use of Estimates
Our consolidated financial statements included elsewhere in this filing have been prepared in accordance with GAAP. The preparation of our financial statements requires us to make estimates and judgments that affect the reported amounts of assets, liabilities, revenues and expenses. We base our estimates on historical experience and on various other assumptions that we believe are reasonable under the circumstances. Actual results may differ from these estimates under different assumptions or conditions. While our significant accounting policies are more fully described in the notes to our consolidated financial statements included elsewhere in this filing, we believe that the following accounting policies and estimates are critical to our business operations and understanding of our financial results.
52
Table of Contents
Revenue from contracts with customers
Our contracts with customers are typically comprised of multiple performance obligations including exclusive franchise rights to access our intellectual property to operate an F45 Training-branded fitness facility in a specific territory (franchise agreements), a material right related to discounted renewals of the franchise agreements (both reflected in franchise revenue in the consolidated statements of operations and comprehensive (loss) income), and equipment and merchandise. Taxes collected from customers and remitted to government authorities are recorded on a net basis.
Franchise revenue
Our primary performance obligation under the franchise agreement is granting certain exclusive rights to access our intellectual property to operate an F45 Training-branded fitness facility in a defined territory. This performance obligation is a right to access our intellectual property, which is satisfied ratably over the term of the franchise agreement. Renewal fees are generally recognized over the renewal term for the respective agreement from the start of the renewal period. Transfer fees are recognized over the remaining term of the franchise agreement beginning at the time of transfer.
Franchise agreements generally consist of an obligation to grant exclusive rights over a defined territory and may include options to renew the agreement. Earlier franchise agreements had an initial term of three years while more recent agreements have an initial term of five years. With our approval, a franchisee may transfer a franchise agreement to a new or existing franchisee, at which point a transfer fee is paid. Our arrangements have no financing elements as there is no difference between the promised consideration and the cash selling price. Additionally, we have assessed that a significant amount of the costs incurred under the contract to perform are incurred up-front.
Franchise revenue consists primarily of upfront establishment fees, monthly franchise fees and other franchise-related fees. The upfront establishment fee is payable by the franchisee upon signing a new franchise agreement and monthly franchise and related fees are payable throughout the term of the franchise license.
Discounted franchise agreement renewal fees
Our franchise agreements may include discounted renewal options allowing franchisees to renew at no cost or at a reduction of the initial upfront establishment fee. The resulting discount in fees at renewal provides a material right to franchisees. Our obligation to provide future discounted renewals to franchisees are accounted for as separate performance obligations. The value of these material rights related to the future discount was determined by reference to the estimated franchise agreement term, which has been estimated to be 10 years, and related estimated transaction price. The estimated transaction price allocated to the franchise agreements is recognized as revenue over the estimated contract term of 10 years, which gives recognition to the renewal option containing a material right. At the end of the initial contract term, any unrecognized transaction price would be recognized during the renewal term, if exercised, or when renewal option expires, if unexercised.
53
Table of Contents
Equipment and merchandise revenue
We require our franchisees to purchase fitness and technology equipment directly from us and payment is required to be made prior to the placement of the franchisees’ orders. Revenue is recognized upon transfer of control of ordered items, generally upon delivery to the franchisee, which is when the franchisee obtains physical possession of the goods, legal title has transferred, and the franchisee has all risks and rewards of ownership. The franchisees are charged for all freight costs incurred for the delivery of equipment. Freight revenue is recorded within equipment and merchandise revenue and freight costs are recorded within cost of equipment and merchandise revenue.
We are the principal in a majority of its equipment revenue transactions as we control the proprietary equipment prior to delivery to the franchisee, have pricing discretion over the goods, and have primary responsibility to fulfill the franchisee order through its direct third-party vendor.
We are the agent in a limited number of equipment and merchandise revenue transactions where the franchisee interacts directly with third-party vendors for which it receives a rebate on sales directly from the vendor.
Allocation of transaction price
Our contracts include multiple performance obligations – typically the franchise license, equipment and material rights for discounted renewal fees. Judgment is required to determine the standalone selling price for these performance obligations. We do not sell the franchise license or World Pack equipment on a stand-alone basis (our contracts with customers almost always include both performance obligations); as such, the standalone selling prices of the performance obligations are not directly observable on a stand-alone basis. Accordingly, we estimate the standalone selling prices using available information including the prices charged for each performance obligation within our contracts with customers in the relevant geographies and market conditions. Individual standalone selling prices are estimated for each geographic location, primarily the United States and Australia, due to the unique market conditions of those performance obligations in each region.
Contract assets
Our contract assets primarily consist of unbilled revenue where we are utilizing our costs incurred as the measure of progress of satisfying our performance obligation. When the contract price is invoiced, the related unbilled receivable is reclassified to trade accounts receivable, where the balance will be settled upon the collection of the invoiced amount. The unbilled receivable represents the amount expected to be billed and collected for services performed through period-end in accordance with contract terms.
Deferred costs
Deferred costs consist of incremental costs to obtain (e.g., commissions) and fulfill (e.g., payroll costs) a contract with a franchisee. Both the incremental costs to obtain and fulfill a contract with a franchisee are capitalized and amortized on a straight-line basis over the expected period if we expect to recover those costs. As of June 30, 2021 and December 31, 2020, we had $13.6 million and $12.8 million of deferred costs, respectively, to obtain and fulfill contracts with franchisees. During the three months ended June 30, 2021 and 2020, we recognized $0.3 million and $0.4 million in amortization of these deferred costs, respectively. During the six months ended June 30, 2021 and 2020, we recognized $0.7 million and $0.7 million in amortization of these deferred costs, respectively. The amortization of these costs is included in selling, general and administrative expenses for costs to obtain a contract and cost of franchise revenue for costs to fulfill a contract in the consolidated statements of operations and comprehensive (loss) income.
54
Table of Contents
Impairment of long-lived assets, including intangible assets
We assess potential impairments to our long-lived assets, which include property and equipment, whenever events or circumstances indicate that the carrying amount of an asset may not be recoverable. Recoverability of an asset is measured by a comparison of the carrying amount of an asset group to the estimated undiscounted future cash flows expected to be generated by the asset. If the carrying amount of the asset group exceeds its estimated undiscounted future cash flows, an impairment charge is recognized as the amount by which the carrying amount of the asset exceeds the fair value of the asset. There were no impairment charges recorded on long-lived assets during the three and six months ended June 30, 2021 and 2020.
We evaluate our indefinite-lived intangible asset (trademark) to determine whether current events and circumstances continue to support an indefinite useful life. In addition, our indefinite-lived intangible asset is tested for impairment annually. The indefinite-lived intangible asset impairment test consists of a comparison of the fair value of each asset with its carrying value, with any excess of carrying value over fair value being recognized as an impairment loss. We are also permitted to make a qualitative assessment of whether it is more likely than not an indefinite-lived intangible asset’s fair value is less than its carrying value prior to applying the quantitative assessment. If, based on our qualitative assessment, it is more likely than not that the carrying value of the asset is less than its fair value, then a quantitative assessment may be required.
We perform our annual impairment test for our indefinite-lived intangible asset during the fourth quarter of the calendar year. We also test for impairment whenever events or circumstances indicate that the fair value of such indefinite-lived intangible asset has been impaired. No impairment triggers were observed during the three and six months ended June 30, 2021 and 2020.
Income taxes
We account for income taxes using an asset and liability approach, which requires the recognition of taxes payable or refundable for the current year and deferred tax liabilities and assets for the future tax consequences of events that have been recognized in our financial statements or tax returns. The measurement of current and deferred tax assets and liabilities is based on provisions of enacted tax laws at the end of the reporting period; the effect of future changes in tax laws or rates are not anticipated. If necessary, the measurement of deferred tax assets is reduced by the amount of any tax benefits that are not expected to be realized based on available evidence.
We account for uncertain tax positions by reporting a liability for unrecognized tax benefits resulting from uncertain tax positions taken or expected to be taken in a tax return. We recognize interest and penalties, if any, related to unrecognized tax benefits in the provision for income tax.
Stock-based Compensation Expense
On March 15, 2019, we issued 1,369,324 RSUs, which are also referred to herein as the RSUs, to Mr. Wahlberg pursuant to a Promotional Agreement executed between him and us. The Promotional Agreement specifies the terms and conditions under which the RSUs will vest. Specifically, the RSUs vest only if we complete a liquidity event as specified within the Promotional Agreement, which was considered to be a performance-based vesting condition. In addition, the RSUs vest only if we achieve certain target equity values at the liquidity event or thereafter, which was considered to be a market-based vesting condition.
55
Table of Contents
For stock-based compensation with both performance and market-condition vesting, such as the RSUs, cost is measured at the grant date, based on the fair value of the award considering the market conditions, and then recorded over the requisite service period if the performance condition is probable. We estimated the fair value of stock-based payment awards considering the market conditions on the date of grant using a Monte Carlo simulation model.
Vesting for the RSUs was not considered probable, since the performance condition was not expected to be met prior to the consummation of a liquidity event as specified within the Promotional Agreement. Therefore, we did not record the expense. Upon completion of a liquidity event, we will record the expense based on the percentage of the requisite service period completed through that date.
Because there was no public market for our common stock, the board of directors determined the fair value of common stock at the time of grant by considering a number of objective and subjective factors including independent third-party valuations of our common stock, operating and financial performance, the lack of liquidity of our capital stock and general and industry specific economic outlook, among other factors.
The expected stock price volatility for the common stock was estimated by taking the historic price volatility for industry peers and comparable companies based on daily price observations over a period equivalent to the expected term of the RSUs. Industry peers consist of several public companies in our industry. Given our size and stage of development relative to the peer group, we selected the third quartile volatility of the peers. The risk-free interest rate for the term of the RSUs is based on the U.S. Treasury implied yield at the date of grant.
Internal-use software
We capitalize certain development costs incurred in connection with our internal-use software and website. These capitalized costs are primarily related to our software tools that are hosted by us and accessed by our customers on a subscription basis. Costs incurred in the preliminary stages of development are expensed as incurred. Once an application has reached the development stage, internal and external costs, if direct and incremental, are capitalized until the software is substantially complete and ready for its intended use. Capitalization ceases upon completion of all substantial testing. We also capitalize costs related to specific upgrades and enhancements when it is probable the expenditures will result in additional features and functionality. Maintenance costs are expensed as incurred. Internal use software is amortized on a straight-line basis over its estimated useful life, generally three years.
Derivative financial instruments
Interest rate swaps
We are subject to interest rate volatility on our floating-rate debt. We have entered into interest rate swap agreements to manage our exposure to interest rate fluctuations. The principal objective of these agreements is to eliminate or reduce the variability of the cash flows in interest payments associated with our floating-rate debt, thus reducing the impact of interest rate changes on future interest payment cash flows. We have elected to apply the hedge accounting rules in accordance with authoritative guidance for these agreements. These agreements are carried at fair value either as an asset or liability on the consolidated balance sheets. Changes in the fair value of these agreements designated as cash flow hedges are recorded as a component of accumulated other comprehensive income (loss) within stockholders’ equity and are amortized to interest expense over the term of the related debt.
56
Table of Contents
The fair value of the interest rate swap agreements as of June 30, 2021 and December 31, 2020 was $0.5 million and $0.7 million, respectively.
Embedded derivatives
When we enter into a financial instrument such as a debt or equity agreement (the “host contract”), we assess whether the economic characteristics of any embedded features are clearly and closely related to the primary economic characteristics of the remainder of the host contract. When it is determined that (i) an embedded feature possesses economic characteristics that are not clearly and closely related to the primary economic characteristics of the host contract, and (ii) a separate, standalone instrument with the same terms would meet the definition of a financial derivative instrument, then the embedded feature is bifurcated from the host contract and accounted for as a derivative liability. The estimated fair value of the derivative feature is recorded as a liability in the consolidated balance sheets separately from the carrying value of the host contract. Subsequent changes in the estimated fair value of derivatives are recorded as a gain or loss in our consolidated statements of operations.
We fair value the embedded derivatives using the “with-and-without method” framework under the Bond plus Black-Scholes option pricing model. Under this framework the value of Convertible Notes including the embedded derivatives is defined as the “with”, and the value of the Convertible Notes excluding the embedded derivatives is defined as the “without”. This method estimates the value of the embedded derivatives by comparing the difference in the values between the Convertible Notes with the embedded derivatives and the value of the Convertible Notes without the embedded derivatives. The Bond plus Black-Scholes option pricing model requires the following inputs: (i) expected terms of the instruments, (ii) expected volatility of stock price, (iii) expected dividends, (iv) risk-free interest rate, and (v) probability of liquidity events and qualified offerings. These inputs are considered Level 3 inputs in the fair value hierarchy. In the embedded Liquidity and QPO derivatives, the payout is greater of the 1.5 times the OIP or 20% of the Equity Value. The Bond part of the model would capture the minimum payoff of 1.5 times the OIP and the Black-Scholes part of the model would capture the upside based on 20% of the Equity Value.
Valuations derived from this model are subject to ongoing internal and external verification review. Estimating fair values of derivative financial instruments requires the development of significant and subjective estimates that may, and are likely to, change over the duration of the instrument with related changes in internal and external market factors.
The fair value of the embedded derivative on the debt agreement as of June 30, 2021 and December 31, 2020 $85.2 million and $36.6 million, respectively.
Recent Accounting Pronouncements
See “Note 2—Summary of significant accounting policies” to the consolidated financial statements included elsewhere in this filing for recently adopted accounting pronouncements and recently issued accounting pronouncements not yet adopted as of the dates of the statement of financial position included in this filing.
Jumpstart Our Business Startups Act of 2012
We have chosen to apply the provision of the JOBS Act that permits us, as an “emerging growth company,” to take advantage of an extended transition period to comply with new or revised accounting standards applicable to public companies.
57
Table of Contents
Item 3. Quantitative and Qualitative Disclosures about Market Risk
Interest rate risk
As of June 30, 2021, we had cash and cash equivalents of $16.6 million deposited with major financial institutions, which consisted of bank deposits. Due to the short-term nature of these instruments, our exposure to interest rate risk is limited to changes in our bank interest rates for which an immediate one percent change would not have had a material effect on our financial condition or operating results.
We are, however, subject to interest rate risk with respect to our borrowings under the First Lien Term Facility and Revolving Facility. Borrowings under the Revolving Facility currently bear interest at a floating rate of LIBOR plus 1.5%. As of June 30, 2021, we had outstanding borrowings of $7.0 million under the Revolving Facility. The First Lien Term Facility also currently bears interest at a floating rate of LIBOR plus 1.5%. As of June 30, 2021, we had outstanding borrowings of $31.0 million under the First Lien Term Facility. On October 25, 2019, we entered into the Swap Agreement to fix the interest rate on the First Lien Term Facility over the life of the loan. Under the terms of the Swap Agreement, effective October 30, 2019, the Term Facility will accrue interest at a fixed rate of 1.741% on an annualized basis.
Foreign exchange risk
We report our results in U.S. dollars, which is our reporting currency. The operations of Australia and ROW that are denominated in currencies other than the U.S. dollar are impacted by fluctuations in currency exchange rates and changes in currency regulations. The majority of Australia’s operations, income, revenues, expenses and cash flows are denominated in Australian dollars, which we translate to U.S. dollars for financial reporting purposes. ROW revenues and expenses in their respective local currencies are translated using the average rates during the period in which they are recognized and are impacted by changes in currency exchange rates.
58
Table of Contents
During the three months ended June 30, 2021, income from operations would have decreased or increased approximately $0.1 million if all foreign currencies uniformly weakened or strengthened 10% relative to the U.S. dollar, holding other variables constant, including sales volumes. The effect of a uniform movement of all currencies by 10% is provided to illustrate a hypothetical scenario and related effect on operating income. Actual results will differ as foreign currencies may move in uniform or different directions and in different magnitudes.
Item 4. Controls and Procedures
Evaluation of Disclosure and Procedures
We maintain disclosure controls and procedures (as defined in Rule 13a-15(e) and 15d-15(e) of the Securities Exchange Act of 1934) that are designed to ensure that information required to be disclosed in our reports that we file or submit under the Exchange Act is recorded, processed, summarized and reported within the time period specified in the SEC’s rules and forms, and that such information is accumulated and communicated to the officers who certify the Company’s financial reports and to other members of senior management and the Board of Directors as appropriate to allow, to allow for timely decisions regarding disclosure.
As required by Rule 13a-15(b) of the Exchange Act, we have evaluated, under the supervision and with the participation of senior management, including our Chief Executive Officer and Chief Financial Officer, the effectiveness of our disclosure controls and procedures. Based upon our evaluation, certain material weaknesses were identified in our internal control over financial reporting in the course of preparing the financial statements included in our prospectus filed in July 2021.
Material Weakness in Internal Control Over Financial Reporting
The material weaknesses related to a failure to properly staff and design our financial closing and reporting team and processes, a lack of segregation of duties in certain key financial reporting processes and a lack of formal documentation of policies and internal controls being followed by us, including, but not limited to, controls involving risk assessment procedures, tools to prevent a cybersecurity breach and controls designed to prevent or detect fraud.
Remediation Measures
To address the material weakness described above, the Company continues to take the following steps including:
| • | adopt formal internal control processes and documentation related to controls that address the elements of the Committee of Sponsoring Organizations of the Treadway Commission (COSO) Internal Control Framework; |
| • | hired additional accounting personnel to implement more robust internal controls and enhanced financial reporting; |
| • | maintain sufficient accounting personnel so that journal entries and account reconciliations are reviewed by someone other than the preparer, including retaining evidence of the reviews performed by management; |
59
Table of Contents
| • | implemented a more robust enterprise resource planning, or ERP, system to assist with the monthly close process, segregation of duties and the timely review and recording of financial transactions; and |
| • | restrict access to our financial systems to appropriate personnel and implementing segregation of duties within our finance and accounting processes. |
We believe the actions described above will be sufficient to remediate the identified material weakness and strengthen our internal control over financial reporting. However, the steps taken to address the material weakness have not operated for a sufficient amount of time to conclude that the material weakness has been remediated. We will continue to monitor the effectiveness of these controls and will make further changes management determines appropriate.
Changes in Internal Control over Financial Reporting
There have been no changes in our internal control over financial reporting (as defined in Rule 13a-15(f) and 15d-15(f) of the Exchange Act) that occurred during the quarter ended June 30, 2021 that have materially affected, or are reasonably likely to materially affect, our internal control over financial reporting.
60
Table of Contents
We are currently, and from time to time may become, involved in legal or regulatory proceedings arising in the ordinary course of our business, including personal injury claims, employment disputes and commercial contract disputes. Although the outcome of these and other claims cannot be predicted with certainty and except for those matters discussed below, we are not currently a party to any litigation or regulatory proceeding that would reasonably be expected to have a material adverse effect on our business, results of operations, financial condition or cash flows.
We have received demand letters from a number of performance rights organizations in the United States and Australia with respect to our and our franchisees’ use of music in studios. On July 1, 2019, we received a letter from Universal Music Group, or UMG alleging copyright infringement and licensing violations in connection with our distribution of music to our franchisees. We have entered into an ongoing tolling agreement with UMG and are having ongoing discussions regarding resolution of the matter. In addition, we previously received demand letters from APRA AMCOS and PPCA, and entered into licensing arrangements with these rights holders. In response to the allegations, we have contracted with Soundtrack Your Brand, a streaming service for businesses, which provides a global database of licensed music that is made available directly to our franchisees. We believe our relationship with Soundtrack Your Brand and the services provided by Soundtrack Your Brand will help to mitigate the risk of future copyright infringement allegations regarding use of music in our studios and during our classes.
There have been no material changes to our risk factors from the risk factors disclosed in our Final Prospectus dated July 14, 2021, filed in connection with our initial public offering. The risks described in our Final Prospectus, in addition to the other information set forth in this Quarterly Report on Form 10-Q, are not the only risks facing we face. Additional risks and uncertainties not currently known to us or that we currently deem to be immaterial also may materially adversely affect our business, financial condition and/or operating results.
Item 2. Unregistered Sales of Equity Securities and Use of Proceeds.
Use of Proceeds
In connection with our initial public offering, we filed a Registration Statement on Form S-1 (File No. 333-257193) on June 21, 2021. The registration statement, as amended, registered up to 19,375,000 shares of our common stock to be issued and sold by us and up to 3,984,375 shares of common stock to be issued and sold by MWIG LLC, one of our stockholders. The SEC declared the registration statement effective on July 14, 2021. The offering commenced immediately thereafter. In the initial public offering, we sold 19,057,889 shares of our common stock (including 307,889 shares that were sold on August 17, 2021 to the underwriters pursuant to exercise of their overallotment option) and MWIG LLC sold 2,794,055 shares of our common stock (including 1,231,555 shares that were sold on August 17, 2021 to the underwriters pursuant to the exercise of their overallotment option) at a public offering price of $16.00 per share, resulting in aggregate gross proceeds to us of approximately $304.9 million and aggregate gross proceeds to MWIG LLC of approximately $44.7 million.
The net offering proceeds received by us after deducting total estimated expenses were $279 million. Our estimated expenses incurred of $23.5 million consisted of $21 million in underwriting discounts, fees and commissions and $2.5 million in other offering expenses. No payments for such expenses were made directly or indirectly to any of our officers, directors or their associates, to any persons owning 10% or more of any class of our equity securities or to any of our affiliates. We did not receive any proceeds from the sale of shares of our common stock by MWIG LLC. Goldman Sachs & Co. LLC and J.P. Morgan Securities LLC served as the representatives of the underwriters.
We used (i) approximately $190.6 million to repay indebtedness, including repayment of our First Lien Term Facility, Revolving Facility, Subordinated Term Facility and PPP loan; (ii) approximately $25.0 million to pay the purchase price for our acquisition of certain assets of the Flywheel indoor cycling studio business; (iii) approximately $2.4 million to pay cash bonuses to certain of our employees, including certain of our executive officers, in connection with our initial public offering; (iv) approximately $2.5 million to pay expenses incurred in connection with our initial public offering; and (v) approximately $2.4 million for working capital and general corporate purposes.
61
Table of Contents
Item 3. Defaults Upon Senior Securities.
None.
Item 4. Mine Safety Disclosures.
Not applicable.
None.
| * | Filed herewith. |
| ** | Exhibit is furnished and shall not be deemed “filed” for purposes of Section 18 of the Exchange Act, or otherwise subject to the liabilities of that section, nor shall it be deemed incorporated by reference in any filing under the Securities Act, or the Exchange Act, except as shall be expressly set forth by specific reference in such filing. |
| *** | To be filed by amendment. |
62
Table of Contents
Pursuant to the requirements of the Securities Exchange Act of 1934, the registrant has duly caused this report to be signed on its behalf by the undersigned thereunto duly authorized.
| F45 Training Holdings Inc. | ||||||
| Date: August 30, 2021 | By: | /s/ Chris E. Payne | ||||
| Chris E. Payne | ||||||
| Chief Financial Officer | ||||||
63