Attached files
| file | filename |
|---|---|
| EX-99.2 - EX-99.2 - AMERISERV FINANCIAL INC /PA/ | tmb-20210826xex99d2.htm |
| EX-10.1 - EX-10.1 - AMERISERV FINANCIAL INC /PA/ | tmb-20210826xex10d1.htm |
| 8-K - 8-K - AMERISERV FINANCIAL INC /PA/ | tmb-20210826x8k.htm |
Exhibit 99.1
| Subordinated Notes Offering AmeriServ Financial, Inc. August 16, 2021 |

| Legal Disclaimer 1 AmeriServ Financial, Inc. (the “Company,” the “holding company,” “we” or “our” together with its wholly-owned bank subsidiary, AmeriServ Financial Bank, the “Bank”) has prepared this confidential presentation (the “Presentation”) and is furnishing it solely for general informational purposes and solely for use by prospective participants in the proposed private placement offering (the “Offering”) by the Company of its subordinated unsecured notes (the “Securities”). Neither the Company nor any other person makes any representation or warranty, express or implied, as to the accuracy, completeness or fairness of the information contained in this Presentation. Neither the Company nor any other person shall have any liability for any information contained in or omitted from this Presentation or for any other written or oral communication transmitted by the Company or its representatives to a recipient of this Presentation in the course of the recipient’s evaluation of an investment in the Securities. This Presentation does not contain all of the information you should consider before investing in the Securities. Each recipient of the information and data contained herein should perform its own independent investigation and analysis of the Offering and the value of the Company. The information and data contained herein are not a substitute for a recipient’s independent evaluation and analysis. You will be given the opportunity to ask questions of and receive answers from Company representatives concerning the Company’s business and the terms and conditions of the Offering, and the Company may provide you with additional relevant information that you may reasonably request to the extent the Company possesses such information or can obtain it without unreasonable effort or expense. Except for information provided in response to such requests, the Company has not authorized any other person to give you information that is not found in this Presentation. If such unauthorized information is obtained or provided, the Company cannot and does not assume responsibility for its accuracy, credibility, or validity. Any offering of securities may be made only by a purchase agreement and the information contained herein will be superseded in its entirety by such purchase agreement, together with the actual forms of subordinated notes offered thereby. Each potential investor should review the purchase agreement, make such investigation, including asking any questions, as it deems necessary to arrive at an independent evaluation of an investment in the Securities mentioned in this Presentation. You should consult your own legal counsel and financial, accounting, regulatory and tax advisors to determine the consequences of such an investment prior to making an investment decision. This Presentation contains certain forward-looking statements related to the Company’s expected future financial condition and results of operations, which are not historical facts and are based on management’s current beliefs, expectations and assumptions about the Company its future performance, including financial performance, and prospects and the Company’s business. Such words as “anticipate,” “assume,” “believe,” “continue,” “could,” “estimate,” “expect,” “intend,” “may,” “outlook,” “plan,” “project,” “seek,” “should,” “target,” “will,” and “would,” as well as variations of such words and similar expressions are intended to identify such forward-looking statements. These statements are not guarantees and involve risks and uncertainties that could cause actual results to differ materially from those contemplated in such forward-looking statements. Expectations and assumptions related to forward-looking statements involve judgments with respect to, among other things, future economic, competitive and market conditions and future business decisions, all of which are difficult or impossible to predict accurately and many of which are beyond the Company’s control. Therefore, there can be no assurance that the expected results contemplated in the forward-looking information will be achieved and the inclusion of such information in this Presentation should not be relied upon or regarded as the Company’s express or implied representation that any strategy, objectives or other plans will be achieved. Any market and industry data used or disclosed in this Presentation was obtained from research, surveys or studies conducted by third parties or contained in industry or general publications. Neither the Company nor any of its representatives has verified market or industry data by third parties or industry or general publications. Forward-looking statements are not a guarantee of future performance or results, are based on information available at the time the statements are made and involve known and unknown risks, uncertainties and other factors that could cause our actual results to differ materially from the information in the forward-looking statements and can change as a result of many possible events or factors, not all of which are known to us or in our control. These factors include but are not limited to: (i) prevailing local, regional, national, and international economic conditions and the impact they may have on us and our customers and our assessment of that impact; (ii) changes in interest rates, loan demand and real estate values, any of which can materially affect origination levels and gain on sale results in our business, as well as other aspects of our financial performance, including earnings on interest-bearing assets; (iii) the level of defaults, losses and prepayments on loans made by us, whether held in portfolio or sold in the whole loan secondary markets, which can materially affect charge-off levels and required credit loss reserve levels; (iv) changes in monetary and fiscal policies of the U.S. Government, including policies of the U.S. Department of the Treasury and the Board of Governors of the Federal Reserve System; |
| Legal Disclaimer 2 (v) changes in the banking and other financial services regulatory environment; (vi) competition with national, regional and community financial institutions; (vii) failures of or interruptions in the communications and information systems on which we rely to conduct business; (viii) expected or potential impacts of public health crises (such as governmental, social and economic effects of the novel coronavirus (COVID-19) pandemic); (ix) levels of unemployment in the Company’s market area; (x) the impact of the COVID-19 pandemic on our business, including the impact of actions taken by governmental and regulatory authorities in response to such pandemic, such as the CARES Act and the programs established thereunder, and our participation in such programs; (xi) volatility and disruption in national and international financial markets; (xii) the effect of changes in accounting policies and practices as may be adopted by the regulatory agencies, as well as the Financial Accounting Standards Board, and other accounting standard setters; (xiii) the ability to redeem our existing indebtedness (and any required regulatory approvals); and (xiv) our success at managing the risks involved in the foregoing factors. All statements in this Presentation, including forward-looking statements, speak only as of the date they are made. Although the Company believes that these forward-looking statements are based on reasonable assumptions, beliefs and expectations, if a change occurs or our beliefs, assumptions and expectations were incorrect, our business, financial condition, liquidity or results of operations may vary materially from those expressed in our forward-looking statements. New risks and uncertainties arise from time to time, and we cannot predict these events or how they may affect the Company. The Company has no duty to, and does not intend to, update or revise the forward-looking statements after the date on which they are made except as required by law. In light of these risks and uncertainties, you should keep in mind that any forward-looking statement made in this Presentation or elsewhere might not reflect our actual results. This Presentation contains certain pro forma and projected information, including projected pro forma information that reflects the Company’s current expectations and assumptions. This pro forma information does not purport to present the results that the Company will ultimately realize. Investment in the Securities involves a high degree of risk and is suitable only for persons of substantial means who have no need for liquidity from this investment and who are able to bear the economic risks of the investment, including loss of principal. The Securities are not a deposit or bank account, and are not, and will not be, insured or guaranteed by the Federal Deposit Insurance Corporation (the “FDIC”) or any other federal or state government agency. Investment in the Securities has not been approved or disapproved by the U.S. Securities and Exchange Commission, the FDIC, the Board of Governors of the Federal Reserve System, the Pennsylvania Department of Banking and Securities or any other federal or state regulatory authority, nor has any regulatory authority passed upon or endorsed the merits of the Securities or the accuracy or adequacy of this Presentation. Any representation to the contrary is a criminal offense. The Company has not engaged any law firm to represent the Investors and each Investor should consult with and rely on the Investor’s own legal counsel and advisers concerning a purchase of the Securities, particularly with regard to the tax and financial consequences. The information about the business and operations of the Company and the business risks of an investment in the Securities was prepared solely from information provided by the Company’s management and market and industry data. The Company’s legal counsel has not performed any due diligence in connection with this Offering or independently verified the business information or business risks contained in this Presentation or otherwise made available to prospective Investors in connection with any further investigation of the Company, and therefore make no representations or warranties as to the accuracy or completeness of such information. This Presentation includes certain non-GAAP financial measures intended to supplement, not substitute for, comparable GAAP measures and the Company’s reported results prepared in accordance with GAAP. This Presentation is being furnished on a confidential basis. The information in this Presentation is confidential and may not be reproduced or redistributed, passed on or divulged, directly or indirectly, to any other person. The Company reserves the right to request the return or destruction of this Presentation at any time. |
| Notice to Investors 3 The notes have not been and will not be registered with the SEC under the Securities Act, or with any state or other jurisdiction. The notes are being offered and sold pursuant to an exemption from the registration requirements of the Securities Act provided by Section 4(a)(2) of the Securities Act. The notes will be offered and sold only to institutions that are accredited investors as defined in Rule 501(a) under the Securities Act. Accordingly, each purchaser of a note, in making its purchase, will be deemed to have represented to and agreed with the Company and the Placement Agent that it is an institution that is an “accredited investor” within the meaning of Rule 501(a) under the Securities Act, and that it is purchasing the notes for its own account or the account of one or more other institutional accredited investors. No resale of the notes may be made unless the notes are subsequently registered under the Securities Act or an exemption from the registration requirements of the Securities Act is available, including without limitation, the exemption provided by Rule 144A of the Securities Act relating to resales of the notes to “qualified institutional buyers” (as such term is defined therein). Any prospective investor should proceed on the assumption that it must bear the economic risk of an investment in the notes for an indefinite period of time. Prospective investors whose investment authority is subject to legal restrictions should consult their own legal advisors to determine whether and to what extent the notes constitute legal investments for them. |
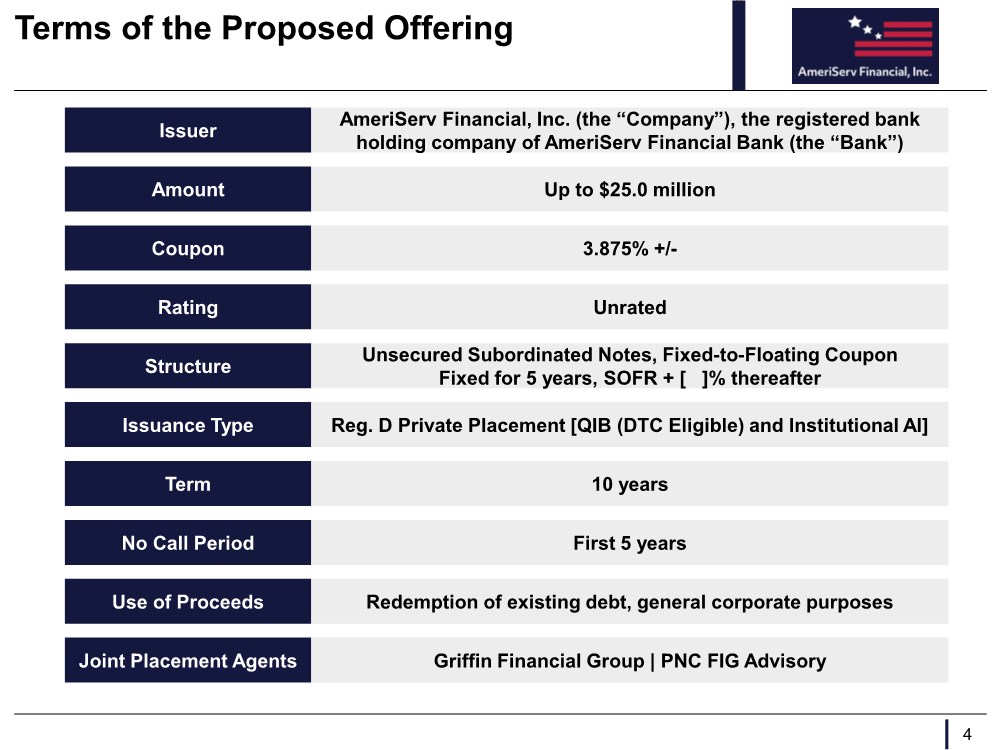
| Terms of the Proposed Offering 4 Issuer Amount Rating Structure Issuance Type Term No Call Period Use of Proceeds Joint Placement Agents AmeriServ Financial, Inc. (the “Company”), the registered bank holding company of AmeriServ Financial Bank (the “Bank”) Up to $25.0 million Unrated Unsecured Subordinated Notes, Fixed-to-Floating Coupon Fixed for 5 years, SOFR + [ ]% thereafter Reg. D Private Placement [QIB (DTC Eligible) and Institutional AI] 10 years First 5 years Redemption of existing debt, general corporate purposes Griffin Financial Group | PNC FIG Advisory Coupon 3.875% +/- |
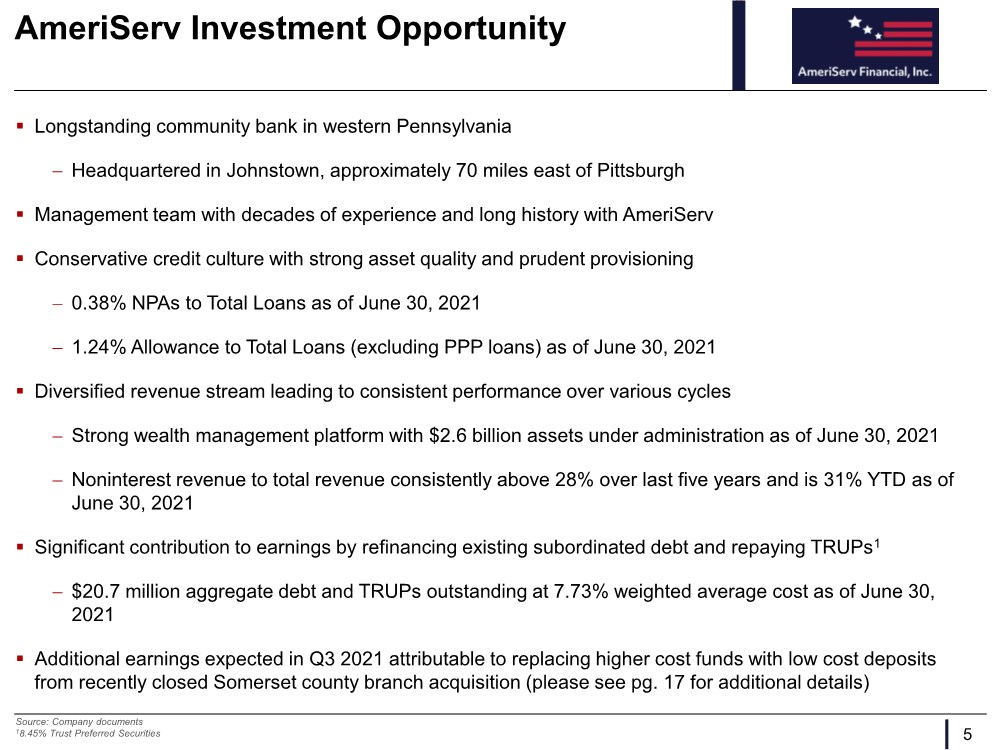
| AmeriServ Investment Opportunity 5 ▪ Longstanding community bank in western Pennsylvania − Headquartered in Johnstown, approximately 70 miles east of Pittsburgh ▪ Management team with decades of experience and long history with AmeriServ ▪ Conservative credit culture with strong asset quality and prudent provisioning − 0.38% NPAs to Total Loans as of June 30, 2021 − 1.24% Allowance to Total Loans (excluding PPP loans) as of June 30, 2021 ▪ Diversified revenue stream leading to consistent performance over various cycles − Strong wealth management platform with $2.6 billion assets under administration as of June 30, 2021 − Noninterest revenue to total revenue consistently above 28% over last five years and is 31% YTD as of June 30, 2021 ▪ Significant contribution to earnings by refinancing existing subordinated debt and repaying TRUPs1 − $20.7 million aggregate debt and TRUPs outstanding at 7.73% weighted average cost as of June 30, 2021 ▪ Additional earnings expected in Q3 2021 attributable to replacing higher cost funds with low cost deposits from recently closed Somerset county branch acquisition (please see pg. 17 for additional details) Source: Company documents 18.45% Trust Preferred Securities |
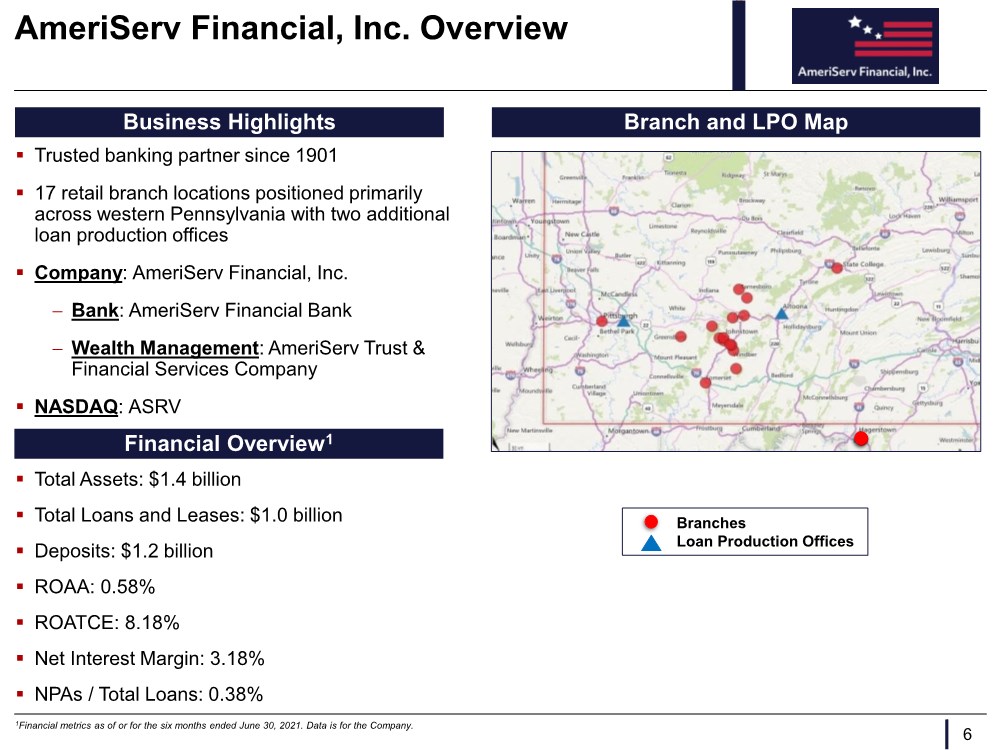
| Business Highlights AmeriServ Financial, Inc. Overview ▪ Trusted banking partner since 1901 ▪ 17 retail branch locations positioned primarily across western Pennsylvania with two additional loan production offices ▪ Company: AmeriServ Financial, Inc. − Bank: AmeriServ Financial Bank − Wealth Management: AmeriServ Trust & Financial Services Company ▪ NASDAQ: ASRV 6 1Financial metrics as of or for the six months ended June 30, 2021. Data is for the Company. Financial Overview1 ▪ Total Assets: $1.4 billion ▪ Total Loans and Leases: $1.0 billion ▪ Deposits: $1.2 billion ▪ ROAA: 0.58% ▪ ROATCE: 8.18% ▪ Net Interest Margin: 3.18% ▪ NPAs / Total Loans: 0.38% Branches Loan Production Offices Branch and LPO Map |
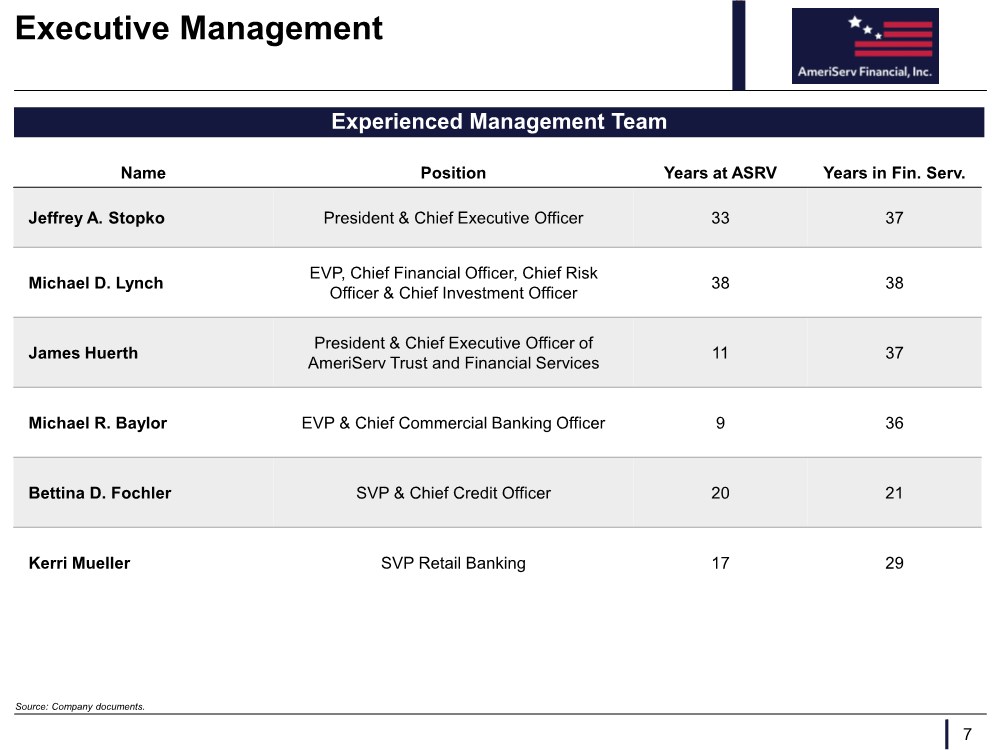
| Executive Management Experienced Management Team Name Position Years at ASRV Years in Fin. Serv. Jeffrey A. Stopko President & Chief Executive Officer 33 37 Michael D. Lynch EVP, Chief Financial Officer, Chief Risk Officer & Chief Investment Officer 38 38 James Huerth President & Chief Executive Officer of AmeriServ Trust and Financial Services 11 37 Michael R. Baylor EVP & Chief Commercial Banking Officer 9 36 Bettina D. Fochler SVP & Chief Credit Officer 20 21 Kerri Mueller SVP Retail Banking 17 29 7 Source: Company documents. |
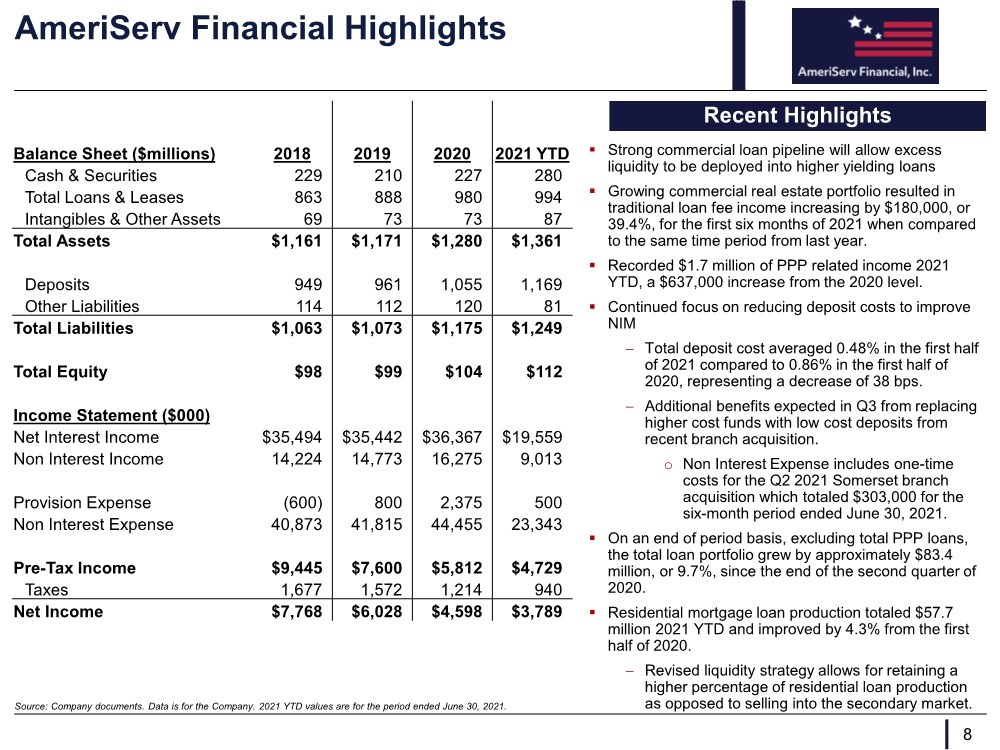
| AmeriServ Financial Highlights Balance Sheet ($millions) 2018 2019 2020 2021 YTD Cash & Securities 229 210 227 280 Total Loans & Leases 863 888 980 994 Intangibles & Other Assets 69 73 73 87 Total Assets $1,161 $1,171 $1,280 $1,361 Deposits 949 961 1,055 1,169 Other Liabilities 114 112 120 81 Total Liabilities $1,063 $1,073 $1,175 $1,249 Total Equity $98 $99 $104 $112 Income Statement ($000) Net Interest Income $35,494 $35,442 $36,367 $19,559 Non Interest Income 14,224 14,773 16,275 9,013 Provision Expense (600) 800 2,375 500 Non Interest Expense 40,873 41,815 44,455 23,343 Pre-Tax Income $9,445 $7,600 $5,812 $4,729 Taxes 1,677 1,572 1,214 940 Net Income $7,768 $6,028 $4,598 $3,789 8 Source: Company documents. Data is for the Company. 2021 YTD values are for the period ended June 30, 2021. ▪ Strong commercial loan pipeline will allow excess liquidity to be deployed into higher yielding loans ▪ Growing commercial real estate portfolio resulted in traditional loan fee income increasing by $180,000, or 39.4%, for the first six months of 2021 when compared to the same time period from last year. ▪ Recorded $1.7 million of PPP related income 2021 YTD, a $637,000 increase from the 2020 level. ▪ Continued focus on reducing deposit costs to improve NIM − Total deposit cost averaged 0.48% in the first half of 2021 compared to 0.86% in the first half of 2020, representing a decrease of 38 bps. − Additional benefits expected in Q3 from replacing higher cost funds with low cost deposits from recent branch acquisition. o Non Interest Expense includes one-time costs for the Q2 2021 Somerset branch acquisition which totaled $303,000 for the six-month period ended June 30, 2021. ▪ On an end of period basis, excluding total PPP loans, the total loan portfolio grew by approximately $83.4 million, or 9.7%, since the end of the second quarter of 2020. ▪ Residential mortgage loan production totaled $57.7 million 2021 YTD and improved by 4.3% from the first half of 2020. − Revised liquidity strategy allows for retaining a higher percentage of residential loan production as opposed to selling into the secondary market. Recent Highlights |
| Addressing the COVID-19 Pandemic ▪ AmeriServ’s customer-focused business model enabled the Company to successfully address the unexpected challenges resulting from the COVID-19 pandemic. ▪ AmeriServ remains committed to working with and supporting borrowers that have been hardest hit by the pandemic. ▪ Loan modifications, which peaked at just over $200 million (21.7% of total loans), are $26.7 million (2.8% of total loans) at June 30, 2021. − These loans include 11 commercial borrowers primarily in the hospitality industry ▪ AmeriServ has increased its allowance for loan losses by $2.1 million since June 30, 2020 (as of June 30, 2021), as provision expense has sharply exceeded net charge-offs. − As of June 30, 2021, allowance for loan losses totaled $11.8 million or 1.18% of total loans (1.24% excluding PPP loans) and provided 315% coverage of non-performing assets, which totaled $3.7 million. − Management continues to carefully monitor asset quality, with a particular focus on loan customers that have requested an additional payment deferral. ▪ Net charge-offs were 0.02% of total loans in the first half of 2021, which compares favorably to net loan charge- offs of 0.05% for the first half of 2020 ▪ AmeriServ processed 264 PPP loans totaling $32.3 million during the second round of the PPP program that ended in May 2021. ▪ Recognized PPP loan fees totaled $3.64 million as of June 30, 2021, with $2.76 million accounted for as income and $0.88 million remaining to be realized ($48.1 million PPP loans remain outstanding as of June 30, 2021). 9 Source: Company documents |
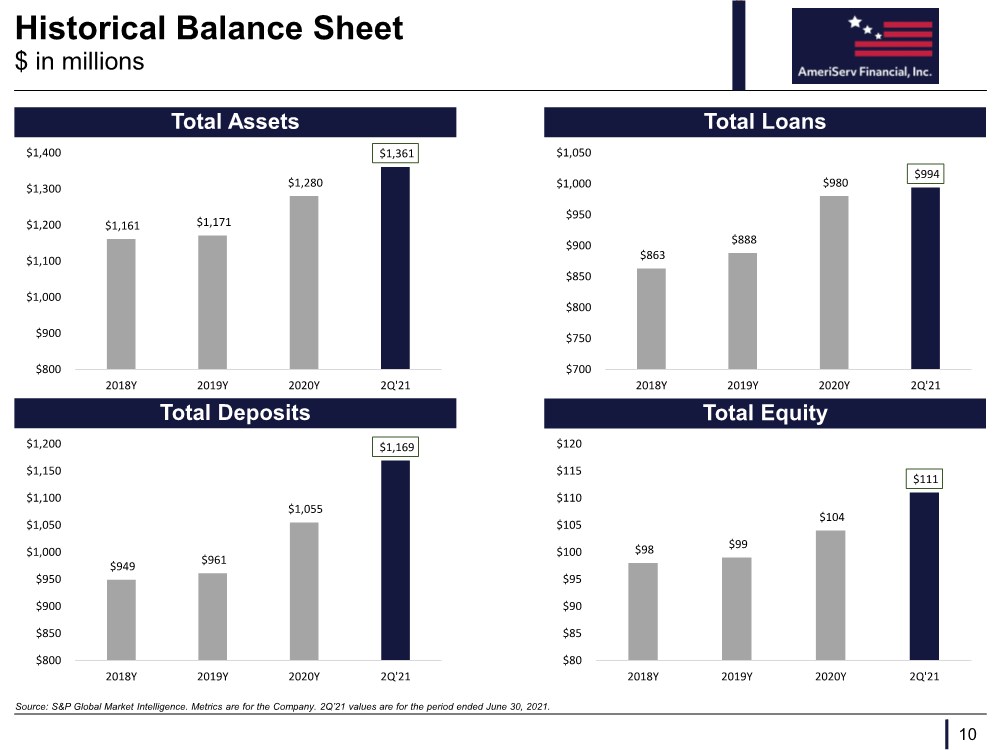
| Historical Balance Sheet Total Assets Total Loans 10 Source: S&P Global Market Intelligence. Metrics are for the Company. 2Q’21 values are for the period ended June 30, 2021. $ in millions Total Equity Total Deposits $1,161 $1,171 $1,280 $1,361 $800 $900 $1,000 $1,100 $1,200 $1,300 $1,400 2018Y 2019Y 2020Y 2Q'21 $863 $888 $980 $994 $700 $750 $800 $850 $900 $950 $1,000 $1,050 2018Y 2019Y 2020Y 2Q'21 $949 $961 $1,055 $1,169 $800 $850 $900 $950 $1,000 $1,050 $1,100 $1,150 $1,200 2018Y 2019Y 2020Y 2Q'21 $98 $99 $104 $111 $80 $85 $90 $95 $100 $105 $110 $115 $120 2018Y 2019Y 2020Y 2Q'21 |
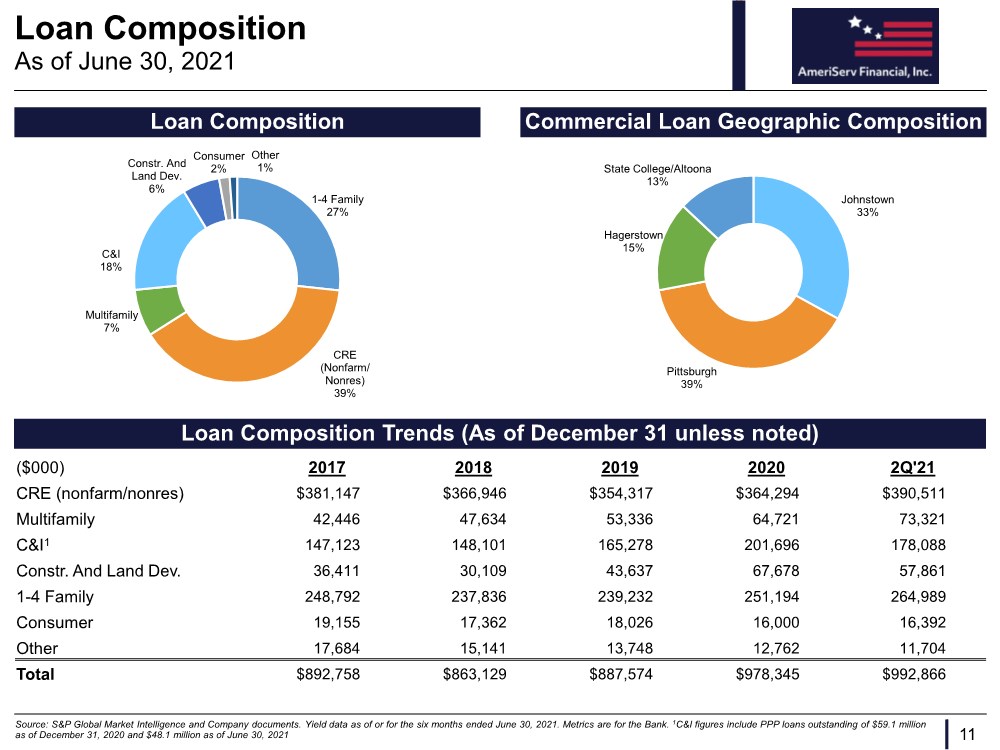
| Loan Composition 11 Source: S&P Global Market Intelligence and Company documents. Yield data as of or for the six months ended June 30, 2021. Metrics are for the Bank. 1C&I figures include PPP loans outstanding of $59.1 million as of December 31, 2020 and $48.1 million as of June 30, 2021 As of June 30, 2021 Loan Composition Commercial Loan Geographic Composition Loan Composition Trends (As of December 31 unless noted) ($000) 2017 2018 2019 2020 2Q'21 CRE (nonfarm/nonres) $381,147 $366,946 $354,317 $364,294 $390,511 Multifamily 42,446 47,634 53,336 64,721 73,321 C&I1 147,123 148,101 165,278 201,696 178,088 Constr. And Land Dev. 36,411 30,109 43,637 67,678 57,861 1-4 Family 248,792 237,836 239,232 251,194 264,989 Consumer 19,155 17,362 18,026 16,000 16,392 Other 17,684 15,141 13,748 12,762 11,704 Total $892,758 $863,129 $887,574 $978,345 $992,866 1-4 Family 27% CRE (Nonfarm/ Nonres) 39% Multifamily 7% C&I 18% Constr. And Land Dev. 6% Consumer 2% Other 1% Johnstown 33% Pittsburgh 39% Hagerstown 15% State College/Altoona 13% |
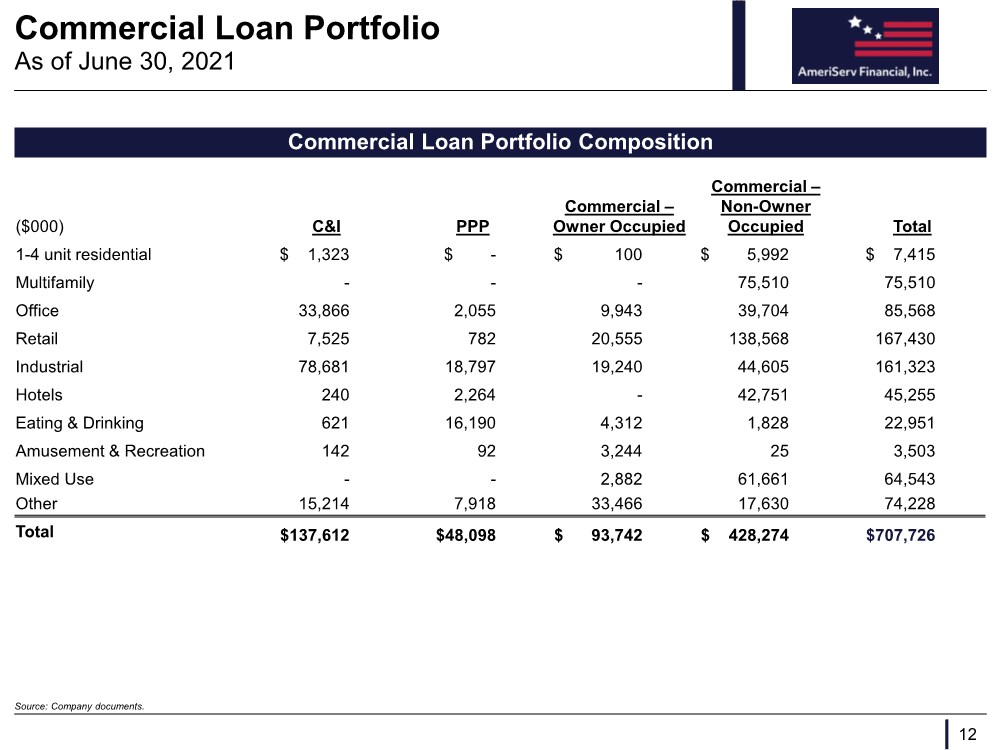
| Commercial Loan Portfolio 12 Source: Company documents. As of June 30, 2021 Commercial Loan Portfolio Composition ($000) C&I PPP Commercial – Owner Occupied Commercial – Non-Owner Occupied Total 1-4 unit residential $ 1,323 $ - $ 100 $ 5,992 $ 7,415 Multifamily --- 75,510 75,510 Office 33,866 2,055 9,943 39,704 85,568 Retail 7,525 782 20,555 138,568 167,430 Industrial 78,681 18,797 19,240 44,605 161,323 Hotels 240 2,264 - 42,751 45,255 Eating & Drinking 621 16,190 4,312 1,828 22,951 Amusement & Recreation 142 92 3,244 25 3,503 Mixed Use -- 2,882 61,661 64,543 Other 15,214 7,918 33,466 17,630 74,228 Total $137,612 $48,098 $ 93,742 $ 428,274 $707,726 |
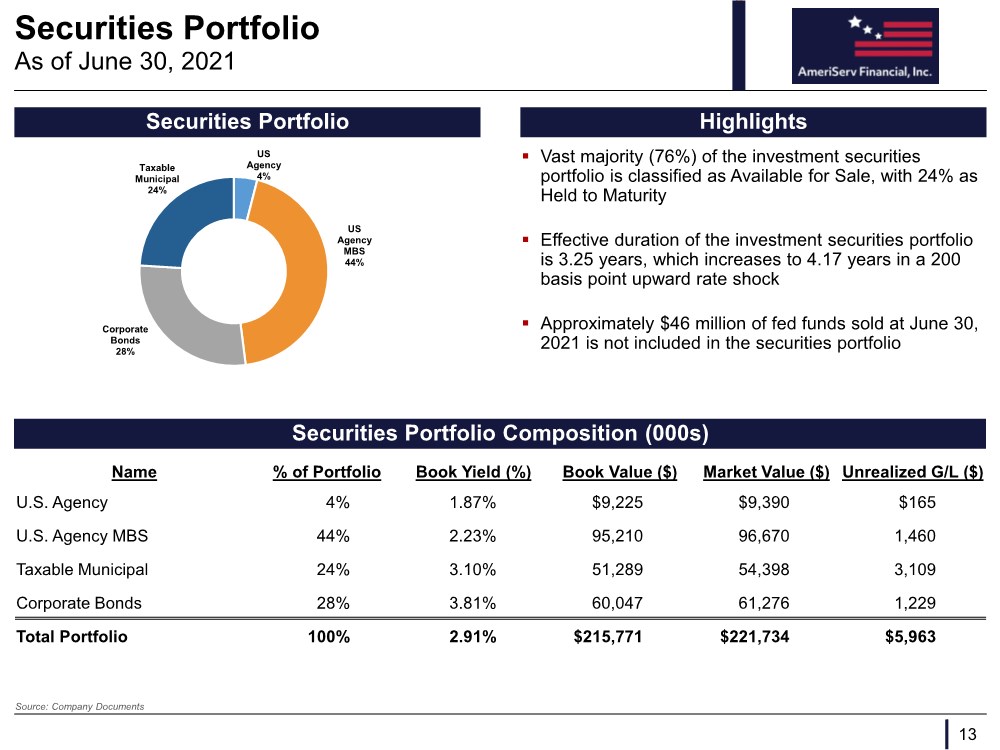
| Securities Portfolio ▪ Vast majority (76%) of the investment securities portfolio is classified as Available for Sale, with 24% as Held to Maturity ▪ Effective duration of the investment securities portfolio is 3.25 years, which increases to 4.17 years in a 200 basis point upward rate shock ▪ Approximately $46 million of fed funds sold at June 30, 2021 is not included in the securities portfolio 13 Source: Company Documents As of June 30, 2021 Securities Portfolio Securities Portfolio Composition (000s) Highlights Name % of Portfolio Book Yield (%) Book Value ($) Market Value ($) Unrealized G/L ($) U.S. Agency 4% 1.87% $9,225 $9,390 $165 U.S. Agency MBS 44% 2.23% 95,210 96,670 1,460 Taxable Municipal 24% 3.10% 51,289 54,398 3,109 Corporate Bonds 28% 3.81% 60,047 61,276 1,229 Total Portfolio 100% 2.91% $215,771 $221,734 $5,963 US Agency 4% US Agency MBS 44% Corporate Bonds 28% Taxable Municipal 24% |
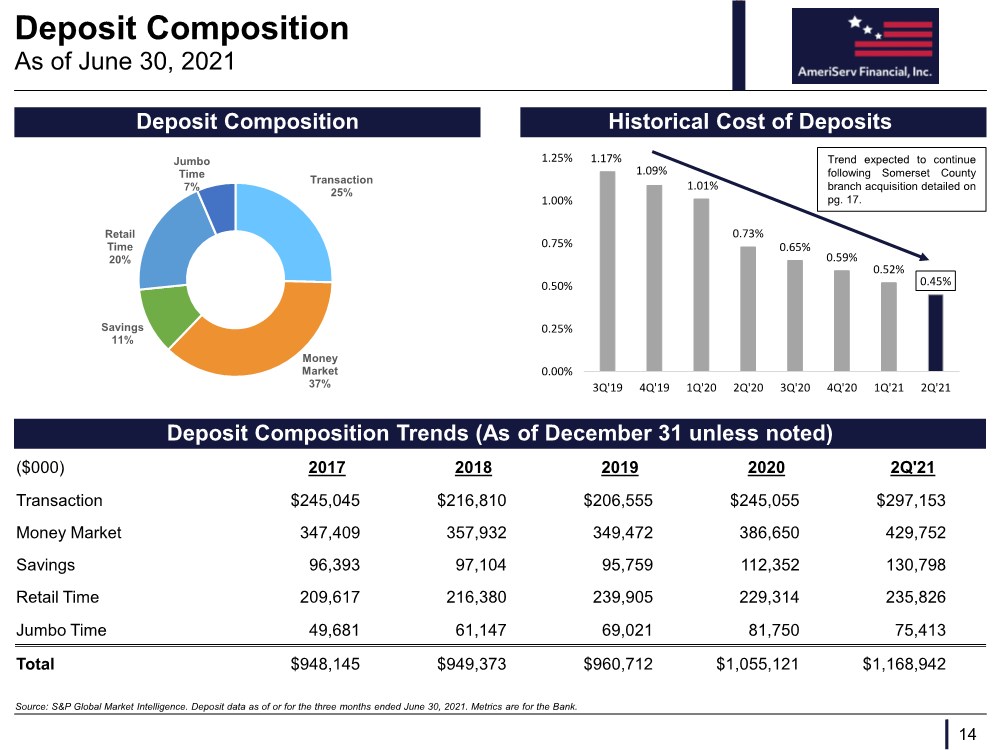
| Deposit Composition 14 Source: S&P Global Market Intelligence. Deposit data as of or for the three months ended June 30, 2021. Metrics are for the Bank. As of June 30, 2021 Deposit Composition Historical Cost of Deposits Deposit Composition Trends (As of December 31 unless noted) ($000) 2017 2018 2019 2020 2Q'21 Transaction $245,045 $216,810 $206,555 $245,055 $297,153 Money Market 347,409 357,932 349,472 386,650 429,752 Savings 96,393 97,104 95,759 112,352 130,798 Retail Time 209,617 216,380 239,905 229,314 235,826 Jumbo Time 49,681 61,147 69,021 81,750 75,413 Total $948,145 $949,373 $960,712 $1,055,121 $1,168,942 Transaction 25% Money Market 37% Savings 11% Retail Time 20% Jumbo Time 7% 1.17% 1.09% 1.01% 0.73% 0.65% 0.59% 0.52% 0.45% 0.00% 0.25% 0.50% 0.75% 1.00% 1.25% 3Q'19 4Q'19 1Q'20 2Q'20 3Q'20 4Q'20 1Q'21 2Q'21 Trend expected to continue following Somerset County branch acquisition detailed on pg. 17. |
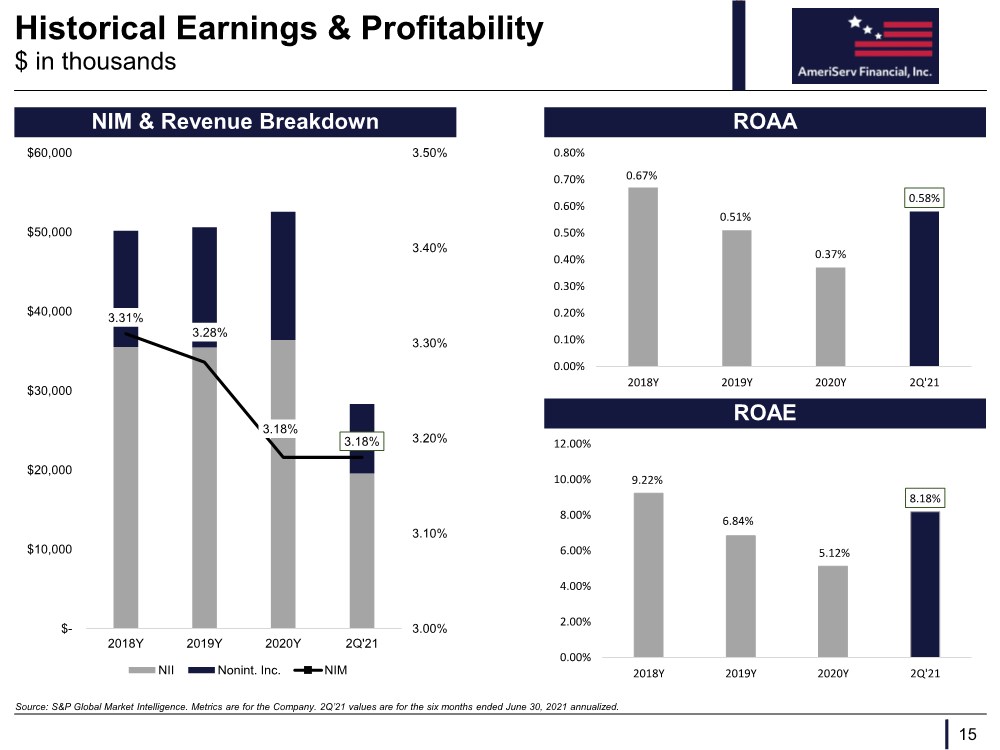
| Historical Earnings & Profitability NIM & Revenue Breakdown ROAA 15 Source: S&P Global Market Intelligence. Metrics are for the Company. 2Q’21 values are for the six months ended June 30, 2021 annualized. $ in thousands ROAE 3.31% 3.28% 3.18% 3.18% 3.00% 3.10% 3.20% 3.30% 3.40% 3.50% $- $10,000 $20,000 $30,000 $40,000 $50,000 $60,000 2018Y 2019Y 2020Y 2Q'21 NII Nonint. Inc. NIM 0.67% 0.51% 0.37% 0.58% 0.00% 0.10% 0.20% 0.30% 0.40% 0.50% 0.60% 0.70% 0.80% 2018Y 2019Y 2020Y 2Q'21 9.22% 6.84% 5.12% 8.18% 0.00% 2.00% 4.00% 6.00% 8.00% 10.00% 12.00% 2018Y 2019Y 2020Y 2Q'21 |
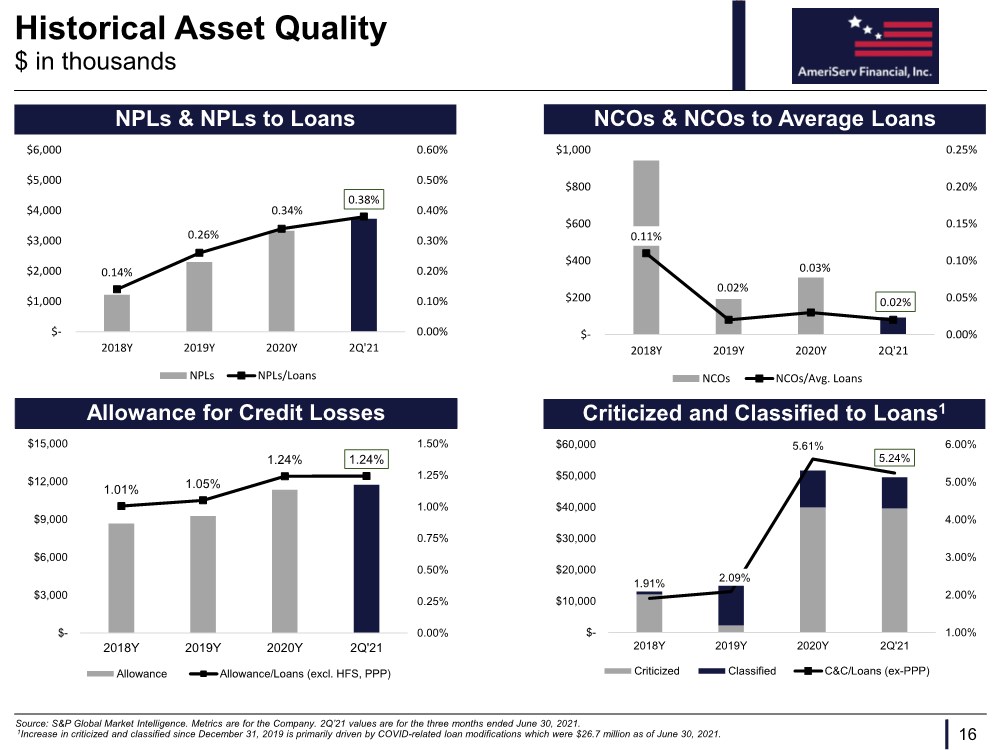
| Historical Asset Quality NPLs & NPLs to Loans 16 Source: S&P Global Market Intelligence. Metrics are for the Company. 2Q’21 values are for the three months ended June 30, 2021. 1Increase in criticized and classified since December 31, 2019 is primarily driven by COVID-related loan modifications which were $26.7 million as of June 30, 2021. $ in thousands Allowance for Credit Losses NCOs & NCOs to Average Loans 0.11% 0.02% 0.03% 0.02% 0.00% 0.05% 0.10% 0.15% 0.20% 0.25% $- $200 $400 $600 $800 $1,000 2018Y 2019Y 2020Y 2Q'21 NCOs NCOs/Avg. Loans 0.14% 0.26% 0.34% 0.38% 0.00% 0.10% 0.20% 0.30% 0.40% 0.50% 0.60% $- $1,000 $2,000 $3,000 $4,000 $5,000 $6,000 2018Y 2019Y 2020Y 2Q'21 NPLs NPLs/Loans 1.01% 1.05% 1.24% 1.24% 0.00% 0.25% 0.50% 0.75% 1.00% 1.25% 1.50% $- $3,000 $6,000 $9,000 $12,000 $15,000 2018Y 2019Y 2020Y 2Q'21 Allowance Allowance/Loans (excl. HFS, PPP) Criticized and Classified to Loans1 1.91% 2.09% 5.61% 5.24% 1.00% 2.00% 3.00% 4.00% 5.00% 6.00% $- $10,000 $20,000 $30,000 $40,000 $50,000 $60,000 2018Y 2019Y 2020Y 2Q'21 Criticized Classified C&C/Loans (ex-PPP) |
| Somerset County Branch Acquisition ▪ Completed acquisition of two branches in the second quarter 2021, acquiring $43 million in deposits in Somerset County − Meyersdale branch ($36 million of deposits) will continue operations as an AmeriServ branch − Somerset branch ($7 million of deposits) was consolidated with AmeriServ’s existing Somerset location ▪ Logical expansion within existing market that results in AmeriServ having the fourth largest market share in Somerset County with 4 branches and approximately $150 million in deposits − Meyersdale is a strategic fit, extending the franchise south towards Maryland and the Hagerstown location ▪ $33 million of acquired low-cost deposits (0.50% cost of deposits as of June 30, 2021) will be used to replace an institutional deposit with a rate of 2.95% that will mature in September 2021 ▪ The replacement of the institutional deposit, together with the pro forma effects of redeeming the outstanding TRUPs and existing subordinated debt will improve deposit concentration issues and is expected to increase net interest income by approximately $1.4 million. 17 Source: S&P Global Market Intelligence, Company documents |
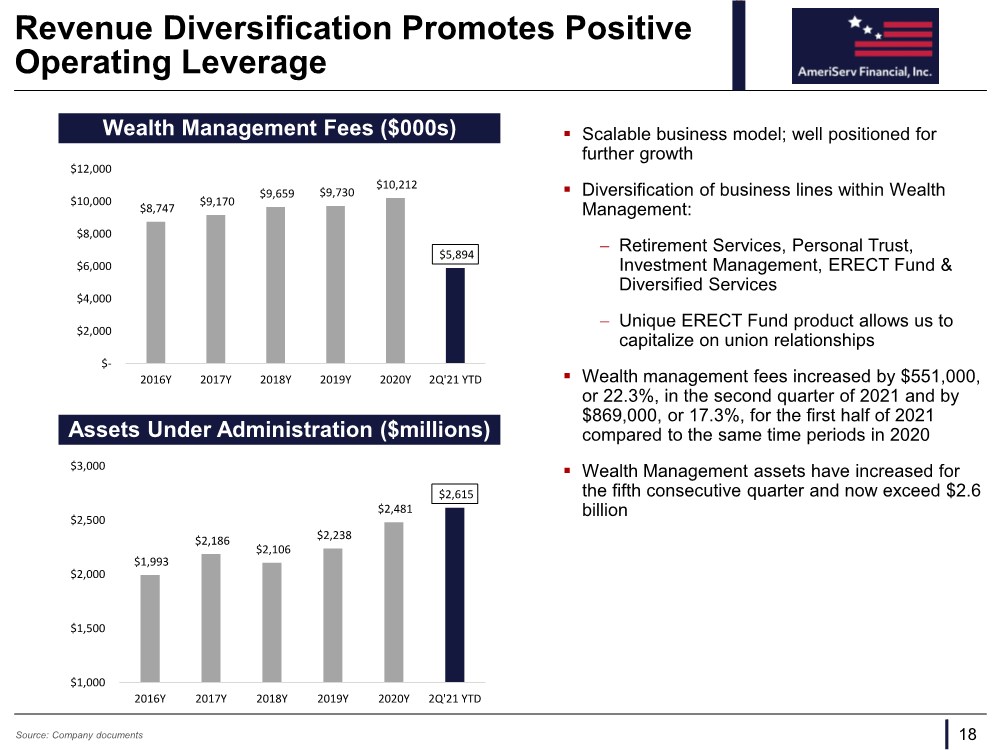
| Revenue Diversification Promotes Positive Operating Leverage ▪ Scalable business model; well positioned for further growth ▪ Diversification of business lines within Wealth Management: − Retirement Services, Personal Trust, Investment Management, ERECT Fund & Diversified Services − Unique ERECT Fund product allows us to capitalize on union relationships ▪ Wealth management fees increased by $551,000, or 22.3%, in the second quarter of 2021 and by $869,000, or 17.3%, for the first half of 2021 compared to the same time periods in 2020 ▪ Wealth Management assets have increased for the fifth consecutive quarter and now exceed $2.6 billion 18 Source: Company documents $8,747 $9,170 $9,659 $9,730 $10,212 $5,894 $- $2,000 $4,000 $6,000 $8,000 $10,000 $12,000 2016Y 2017Y 2018Y 2019Y 2020Y 2Q'21 YTD Wealth Management Fees ($000s) Assets Under Administration ($millions) $1,993 $2,186 $2,106 $2,238 $2,481 $2,615 $1,000 $1,500 $2,000 $2,500 $3,000 2016Y 2017Y 2018Y 2019Y 2020Y 2Q'21 YTD |
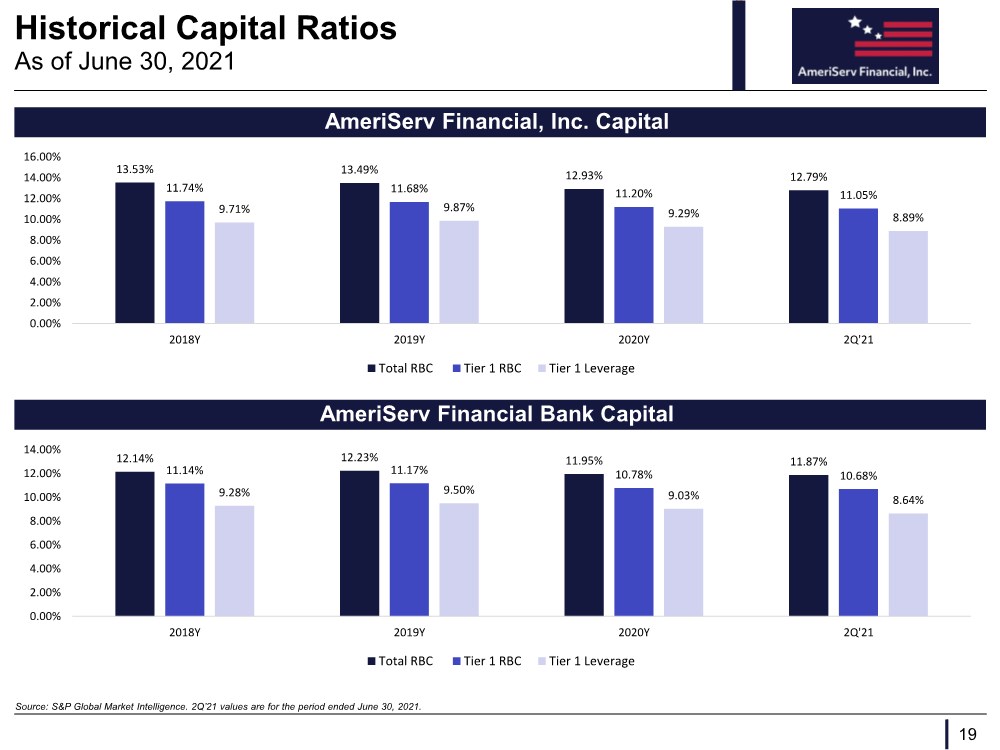
| Historical Capital Ratios 19 Source: S&P Global Market Intelligence. 2Q’21 values are for the period ended June 30, 2021. As of June 30, 2021 AmeriServ Financial, Inc. Capital 13.53% 13.49% 12.93% 12.79% 11.74% 11.68% 11.20% 11.05% 9.71% 9.87% 9.29% 8.89% 0.00% 2.00% 4.00% 6.00% 8.00% 10.00% 12.00% 14.00% 16.00% 2018Y 2019Y 2020Y 2Q'21 Total RBC Tier 1 RBC Tier 1 Leverage 12.14% 12.23% 11.95% 11.87% 11.14% 11.17% 10.78% 10.68% 9.28% 9.50% 9.03% 8.64% 0.00% 2.00% 4.00% 6.00% 8.00% 10.00% 12.00% 14.00% 2018Y 2019Y 2020Y 2Q'21 Total RBC Tier 1 RBC Tier 1 Leverage AmeriServ Financial Bank Capital |
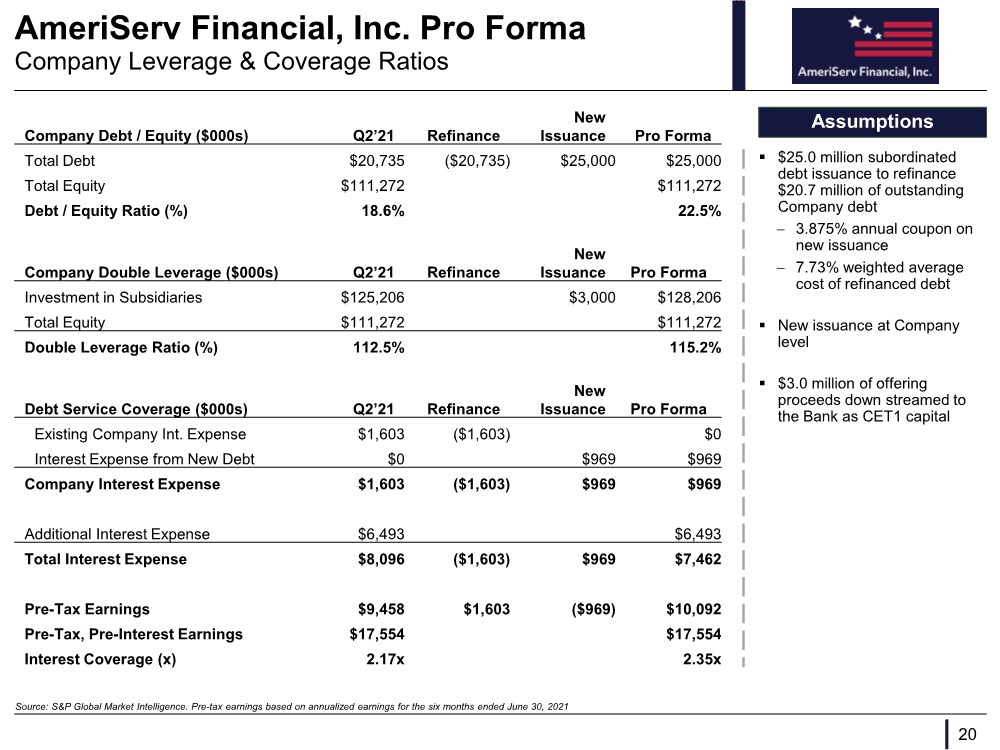
| AmeriServ Financial, Inc. Pro Forma 20 Source: S&P Global Market Intelligence. Pre-tax earnings based on annualized earnings for the six months ended June 30, 2021 Company Leverage & Coverage Ratios Company Debt / Equity ($000s) Q2’21 Refinance New Issuance Pro Forma Total Debt $20,735 ($20,735) $25,000 $25,000 Total Equity $111,272 $111,272 Debt / Equity Ratio (%) 18.6% 22.5% Company Double Leverage ($000s) Q2’21 Refinance New Issuance Pro Forma Investment in Subsidiaries $125,206 $3,000 $128,206 Total Equity $111,272 $111,272 Double Leverage Ratio (%) 112.5% 115.2% Debt Service Coverage ($000s) Q2’21 Refinance New Issuance Pro Forma Existing Company Int. Expense $1,603 ($1,603) $0 Interest Expense from New Debt $0 $969 $969 Company Interest Expense $1,603 ($1,603) $969 $969 Additional Interest Expense $6,493 $6,493 Total Interest Expense $8,096 ($1,603) $969 $7,462 Pre-Tax Earnings $9,458 $1,603 ($969) $10,092 Pre-Tax, Pre-Interest Earnings $17,554 $17,554 Interest Coverage (x) 2.17x 2.35x Assumptions ▪ $25.0 million subordinated debt issuance to refinance $20.7 million of outstanding Company debt − 3.875% annual coupon on new issuance − 7.73% weighted average cost of refinanced debt ▪ New issuance at Company level ▪ $3.0 million of offering proceeds down streamed to the Bank as CET1 capital |