Attached files
| file | filename |
|---|---|
| 8-K - 8-K - CORE MOLDING TECHNOLOGIES INC | cmt-20210823.htm |
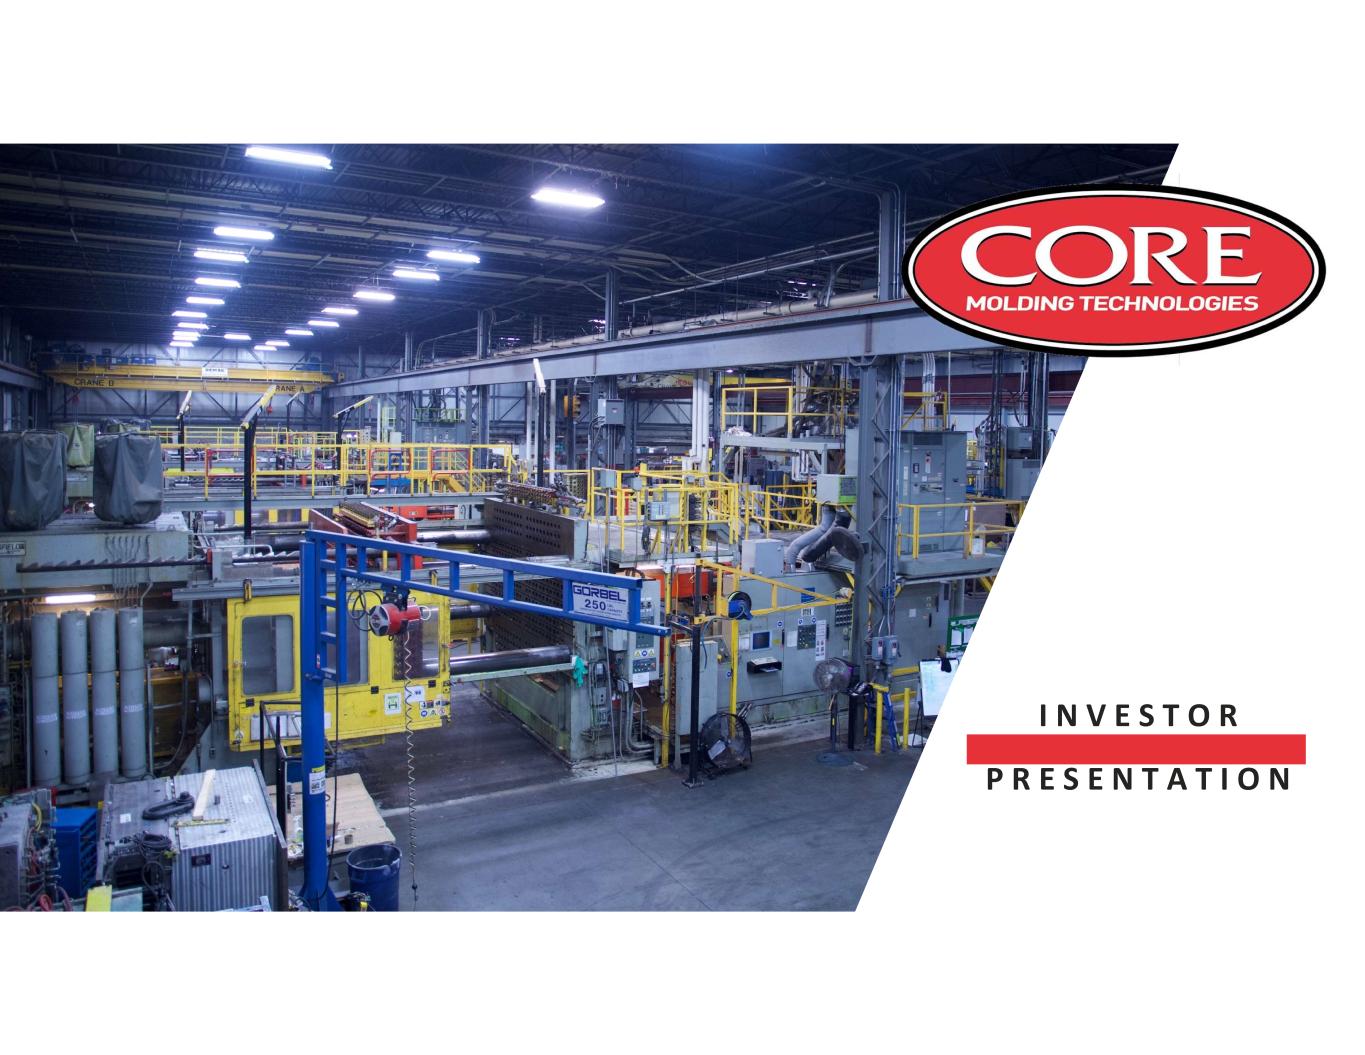
I N V E S T O R P R E S E N T A T I O N

Forward Looking Statements This presentation, our remarks, and answers to questions contains forward-looking statements within the meaning of the federal securities laws. As a general matter, forward-looking statements are those focused upon future plans, objectives or performance as opposed to historical items and include statements of anticipated events or trends and expectations and beliefs relating to matters not historical in nature. Such forward-looking statements involve known and unknown risks and are subject to uncertainties and factors relating to Core Molding Technologies' operations and business environment, all of which are difficult to predict and many of which are beyond Core Molding Technologies' control. Words such as “may,” “will,” “could,” “would,” “should,” “anticipate,” “predict,” “potential,” “continue,” “expect,” “intend,” “plans,” “projects,” “believes,” “estimates,” “encouraged,” “confident” and similar expressions are used to identify these forward-looking statements. These uncertainties and factors could cause Core Molding Technologies' actual results to differ materially from those matters expressed in or implied by such forward-looking statements. Core Molding Technologies believes that the following factors, among others, could affect its future performance and cause actual results to differ materially from those expressed or implied by forward-looking statements made in this Quarterly Report on Form 10-Q: business conditions in the plastics, transportation, marine and commercial product industries (including changes in demand for truck production); federal and state regulations (including engine emission regulations); general economic, social, regulatory (including foreign trade policy) and political environments in the countries in which Core Molding Technologies operates; the adverse impact of coronavirus (COVID-19) global pandemic on our business, results of operations, financial position, liquidity or cash flow, as well as impact on customers and supply chains; safety and security conditions in Mexico and Canada; fluctuations in foreign currency exchange rates; dependence upon certain major customers as the primary source of Core Molding Technologies’ sales revenues; efforts of Core Molding Technologies to expand its customer base; the ability to develop new and innovative products and to diversify markets, materials and processes and increase operational enhancements; ability to accurately quote and execute manufacturing processes for new business; the actions of competitors, customers, and suppliers; failure of Core Molding Technologies’ suppliers to perform their obligations; the availability of raw materials; inflationary pressures; new technologies; regulatory matters; labor relations; labor availability; a work stoppage or labor disruption at one of our union locations or one of our customer or supplier locations; the loss or inability of Core Molding Technologies to attract and retain key personnel; the Company's ability to successfully identify, evaluate and manage potential acquisitions and to benefit from and properly integrate any completed acquisitions; federal, state and local environmental laws and regulations; the availability of sufficient capital; the ability of Core Molding Technologies to provide on-time delivery to customers, which may require additional shipping expenses to ensure on-time delivery or otherwise result in late fees and other customer charges; risk of cancellation or rescheduling of orders; management’s decision to pursue new products or businesses which involve additional costs, risks or capital expenditures; inadequate insurance coverage to protect against potential hazards; equipment and machinery failure; product liability and warranty claims; and other risks identified from time to time in Core Molding Technologies’ other public documents on file with the Securities and Exchange Commission, including those described in Item 1A of the Annual Report on Form 10-K for the year ended December 31, 2020. C O R E M O L D I N G T E C H N O L O G I E S 2

3 Company Overview 3 2020 Net Sales $222 MILLION Employees 1,600 NYSE CMT Headquarters COLUMBUS OHIO Founded in 1980 Incorporated in 1996 Core Molding Technologies is a custom manufacturer of composites and highly- specialized plastic products for diverse industries

Composite Industry Growth 4 Composite industry growing at 7.7% per year across multiple markets provides the Company with significant growth opportunities Carbon FiberCAGR = 7.7% Composites Market Analysis, 2020 ; Grand View Research, Inc., USA. Glass Fiber Other Wind Energy Aerospace & Defense Electrical & Electronics Marine Pipes & Tanks Construction Transportation

5 Leverage Our Existing Strengths to Grow the Business • Over 40 years of experience in structural plastics manufacturing • Design for manufacturing and tailored material expertise • Twenty years of experience operating in Mexico • Over 75% of revenues from long term customers (more than 10 years) • Large press expertise • Sole source provider of products • Most diverse process offering in the industry • Large part focus which reduces foreign competition • Engineered and commodity material expertise • Existing asset base which would take years to duplicate • Large In-Place press capacity • Over 70 total presses and 40 large tonnage presses • Plants located within 150 miles of most customer locations EXPERIENCE PRODUCTS & PROCESSES FOOTPRINT

Market Applications Why They Choose Core Building Products Lattice, Decking, Cabinets Durability Cost savings Material substitution Powersports Personal Watercraft, ATV, On-board Vehicles Strength to weight ratio Part consolidation Corrosion resistance In-mold color Transportation HD / MD Truck, Bus Class A finish Durability Light weighting Part Reduction Utilities Water & Power Distribution Corrosion resistance Cost savings Part consolidation Weight reduction 6 Wide Range of Complex Products
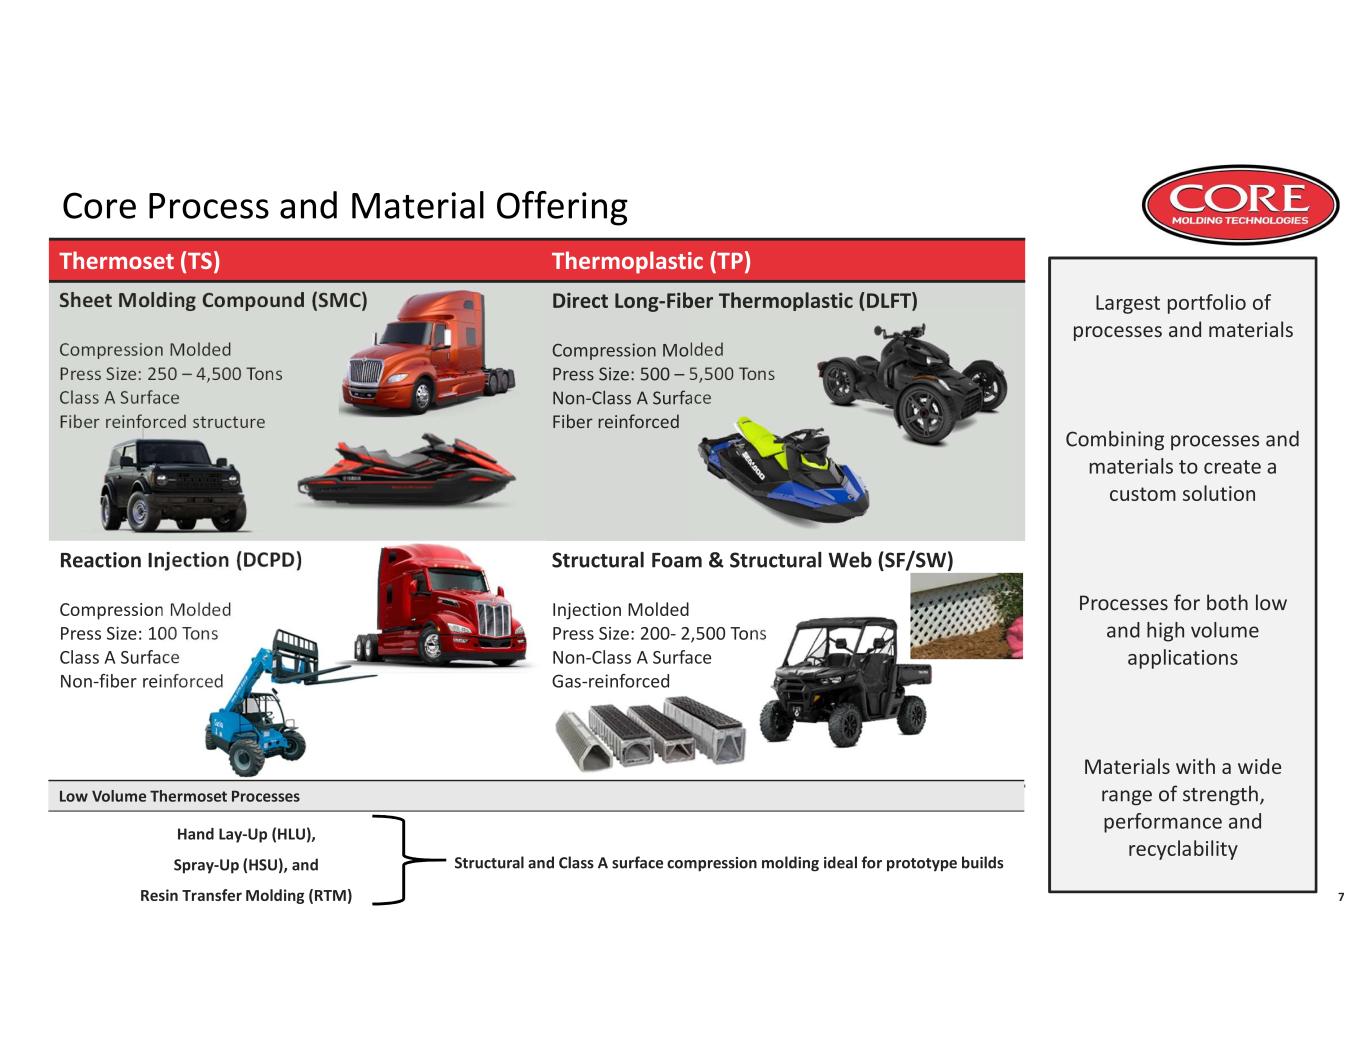
7 Core Process and Material Offering Thermoset (TS) Thermoplastic (TP) Sheet Molding Compound (SMC) Compression Molded Press Size: 250 – 4,500 Tons Class A Surface Fiber reinforced structure Direct Long-Fiber Thermoplastic (DLFT) Compression Molded Press Size: 500 – 5,500 Tons Non-Class A Surface Fiber reinforced Reaction Injection (DCPD) Compression Molded Press Size: 100 Tons Class A Surface Non-fiber reinforced Structural Foam & Structural Web (SF/SW) Injection Molded Press Size: 200- 2,500 Tons Non-Class A Surface Gas-reinforced Low Volume Thermoset Processes Hand Lay-Up (HLU), Spray-Up (HSU), and Resin Transfer Molding (RTM) Structural and Class A surface compression molding ideal for prototype builds Largest portfolio of processes and materials Combining processes and materials to create a custom solution Processes for both low and high volume applications Materials with a wide range of strength, performance and recyclability

CORE Value Proposition Customer Benefit Applications Conversion Expertise • Lower Total Cost • Light-weighting • Improved performance Integrated Material Development and Advanced Manufacturing Engineering • Unique solutions – Designed from material formulation to final production • Improved performance Part Consolidation • Lower Total Cost • Reduced mfg. complexity • Improved performance Design / Simulation / Rapid Prototyping • Reduced lead time • Solution provider • Improved performance 8 Core Molding Value Proposition in Action Concrete Structural Foam 48 pcs 1 pc DLFT Hull SMC Hull DLFT + Structural Foam Computer Modeling 3D printed molds

9 CULTURE is one of our Competitive Advantages Companies that effectively manage their culture deliver 20% higher returns to shareholders relative to comparable companies over a five-year period. “Winners Win” Transparency Mutual Respect Courage to Challenge Learning Organization

10 Serving a Diverse Industry Base of Customers 91% 43% 5% 22% 19% 5% 4% 12% 0% 25% 50% 75% 100% 2011 2020 Revenue Mix By Industry (1) Truck Power Sports Building Products Utilities Other Diverse industry base provides business stability Industry diversification provides opportunity to sell entire line of processes and materials Decreased truck concentration from 91% to 43% over 10 years Additional industries served include Automotive, Con-Ag, Industrial and Consumer (1) Based on annual product revenues

Diversified Customer Base No customer makes up more than 18% of the Company’s business Customers are sole source on programs providing predictable revenue streams Blue chip customer base with long-term relationships Customers in multiple industries with wide range of needs for structural plastics 18% 15% 13% 11% 9% 7% 3% 24% All Other Customers 11 *Data based on 2020 Product Revenues

12 Strategic Manufacturing Footprint 478 338 274 140 87 61 Matamoros Columbus Cobourg Gaffney Winnona Monterrey Floor Space Square Feet (in 000's) 30.0% 24.0% 22.0% 9.0% 5.0% 5.0% 5.0% Columbus Matamoros Cobourg Cincinnati (1) Winona Gaffney Monterrey 2020 Sales Revenue (by facility) Columbus, OH Matamoros, MexicoCobourg, Canada Gaffney, SC Monterrey, Mexico Winona, MN (1) Cincinnati scheduled to close December 31, 2021

S T R A T E G I C D I R E C T I O N
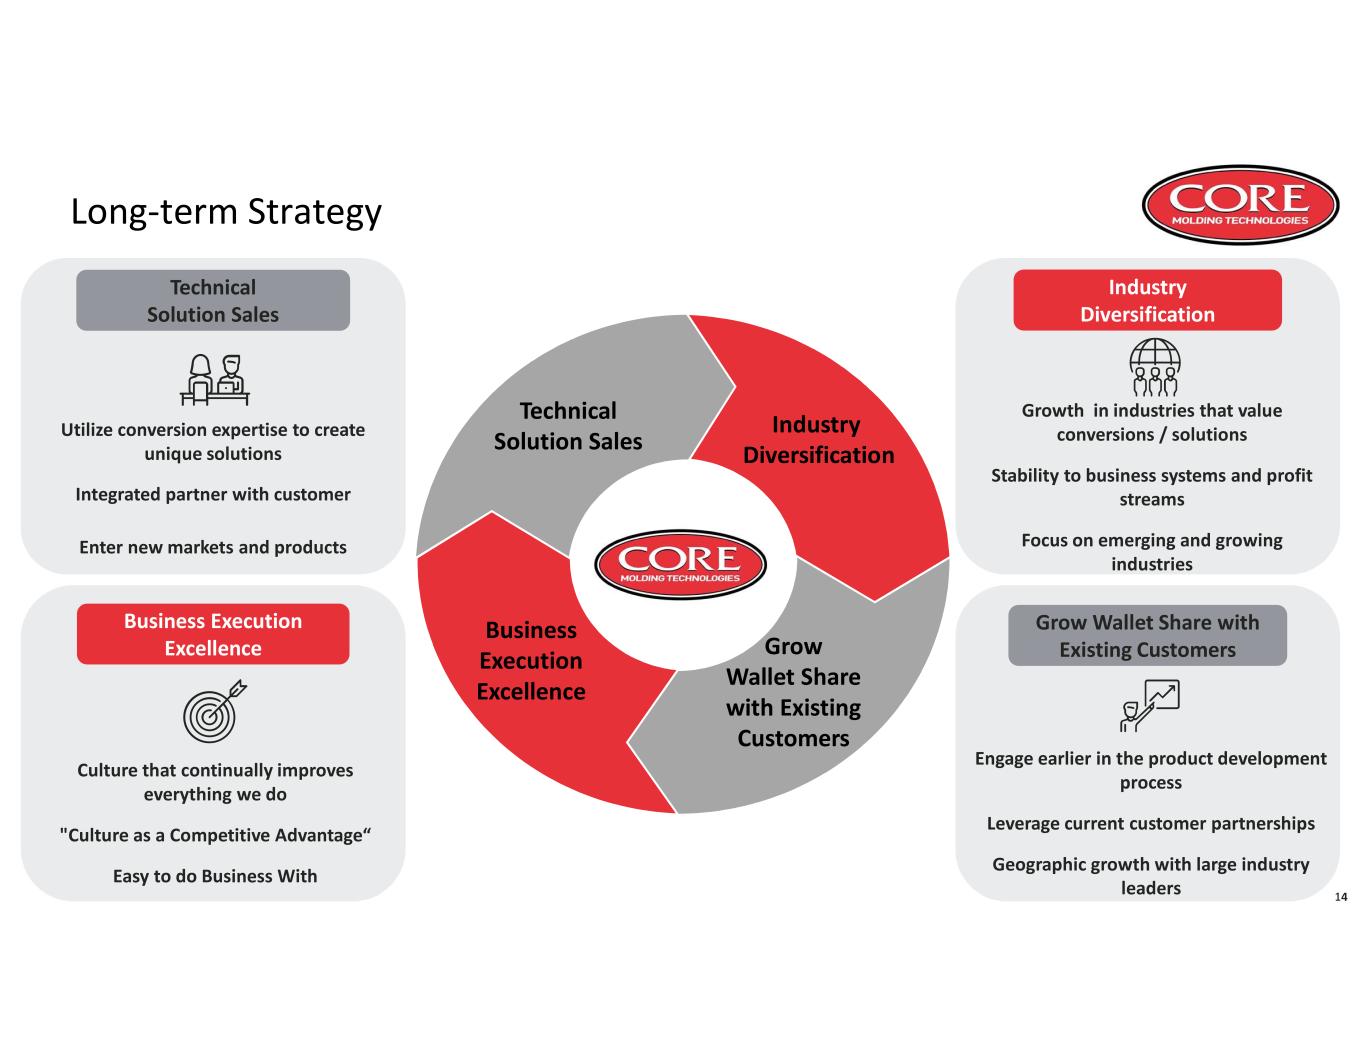
Utilize conversion expertise to create unique solutions Integrated partner with customer Enter new markets and products Growth in industries that value conversions / solutions Stability to business systems and profit streams Focus on emerging and growing industries 14 Long-term Strategy Technical Solution Sales Industry Diversification Grow Wallet Share with Existing Customers Business Execution Excellence Technical Solution Sales Engage earlier in the product development process Leverage current customer partnerships Geographic growth with large industry leaders Grow Wallet Share with Existing Customers Industry Diversification Culture that continually improves everything we do "Culture as a Competitive Advantage“ Easy to do Business With Business Execution Excellence

15 Strategic Investments Research & Development Material functionality and performance Ultra light Class A materials Material and process integration Strategic Investments Speed to Market Additive compression molds Design simulation and testing Robust launch processes Sales Force Transformation Implement application engineering Intimate customer and industry knowledge Grow technical sales capabilities Core Business Operating Model Organizational development Company wide continuous improvement Automated manufacturing systems Investments in Four Key Areas to support Strategic Plan

16 Long Term Business Plan Goals Revenue - Grow Revenue: • Increased Sales in Current and Targeted Industries • Strategic Acquisitions Profitability - Increase Operating Income: • Operational Improvements • Higher Margin New Business Increase Return on Capital Employed (ROCE)(1): • Increase Profitability • Efficient Use of Fixed Assets • Disciplined Use of Working Capital • Free Cash Flows Diversify Business: • Leverage Growth Opportunities in Current Industries • Organically Grow and Acquire into New Growth Industries (1) ROCE = Pre-tax Net Operating Income / Capital Invested Business Goals 2020 Future Revenues $222 million Revenues $500 million Operating Income Margin 4.7% Operating Income Margin 10% ROCE 8.5% ROCE 16.0% Significant Industries 3 Significant Industries 6 to 8

17 Acquisition Strategy Before Acquisitions After Acquisitions Diversified Revenues 100% from base business Over 46% of 2020 revenues came from processes and materials acquired since 2015 Expanded Material Capabilities / Reduced Material Concentration Risk 100% Thermosets 54% Thermosets / 46% Thermoplastics Process Expansion 4 Processes 7 Processes Reduced Industry Concentration Risk 83% Truck 9% Marine 8% Other 43% Truck 22% Power Sports 19% Building Products 5% Utilities 11% Other (multiple markets) Geographic Expansion (Revenue By Operating Country) US 68% Mexico 32% Canada 0% US 41% Mexico 29% Canada 30% Increased Profitability Profit from acquired businesses has increased over 500% (CPI 2015) and 200% (HPI 2018) since acquisition Acquisitions anticipated to support strategic goals and accelerate growth: • Reduce customer concentration; further diversify industries • Enhance technological capabilities • Create operating synergies and portfolio extensions Past acquisitions have transformed the Company and increased profitability:

F I N A N C I A L I N F O R M A T I O N

19 Operational Performance Company undertook an operational turnaround in 2019: • Replaced operational management team • Implemented new operational systems and processes • Increased repair and maintenance spending to improve asset reliability Returned to profitability in 2020 on lower net sales with operating income of 4.7% of net sales Continued improvements in 1H 2021 with operational income of $11.5 million or 7.5% of net sales $- $50 $100 $150 $200 $250 $300 2016 2017 2018 2019 2020 Net Sales (in millions) $(15) $(10) $(5) $- $5 $10 $15 2016 2017 2018 2019 2020 Operating Income (Loss) (in millions)

20 Operational Turnaround – Get the Basic Right Execution Plan Safety First program implemented (Equipment & People) Company wide Standard Daily Operating System (DOS) Organizational improvement & development plan / Employee engagement & Retention Electronic Preventive Maintenance / Spare parts system Root cause problem solving system and customer responsiveness systems Continuous Improvement team implemented IATF and ISO systems implemented and certification Operational Turnaround Scorecard 2019 Foundational Metric Improvement Safety Incident Rate 82% People (Glassdoor Rating) 95% Quality (Parts Per Million) 78% Delivery (On Time Delivery) 67% Cost (Scrap & Productivity) 47%

21 Operational Transformation Core Completed an Operational Turnaround in 2019 which Returned the Company to Profitability in 2020 15.9% 16.4% 17.2% 18.2% 16.0% 15.2% 10.1% 7.6% 15.5% 17.3% 0.0% 5.0% 10.0% 15.0% 20.0% 2012 2013 2014 2015 2016 2017 2018 2019 2020 1H 2021 Gross Margin Turnaround - Only two years with negative net income over past 20 years Operational Changes Delivered Financial Improvement • Customer Pricing – Increased pricing on unprofitable business • Customer Performance - Improved delivery and quality resulting in decreased customer chargebacks, expedited freight and part inspection costs • Operational Performance - Improvements in product quality and productivity resulting in lower scrap, labor and overhead costs • Strategic Sourcing – Implemented strategic sourcing resulting in material and overhead cost savings • Operating System – Implemented continuous improvement, value selling, and advance manufacturing engineering processes resulting in higher selling price and lower operating costs Operational Transformation Resulting in Stable Processes Capable of Handling Changing Customer Demand and Delivering Operational Improvements and Cost Savings

22 Capital Expenditures Sustaining Capital Expenditures • Increased sustaining capital expenditures improving asset reliability • Increased 2021 spending makes up for 2020 reduced spending due to COVID • Five year average spend of 2.6% of product sales • Company plans to continue to spend 2.5% - 3.0% per year Growth Capital • Investment of ~$8.5 million for new DLFT press in Matamoros in 2021 • Anticipating additional capacity investment in next five years as Company grows 0.0% 1.0% 2.0% 3.0% 4.0% 5.0% $- $2.0 $4.0 $6.0 $8.0 $10.0 $12.0 2017 2018 2019 2020 2021 Projected Sustaining Capital (in millions) Sustaining % of Product Sales

23 Capitalization Wells Fargo Term Notes $15.2 million Libor + 300bps FGI (net of $1.2mm deposit) $11.8 million Fixed 8.25% Total Commitment $25.0 million Libor + 175 to 225 bps Available $23.7 million Accordion Commitment $10.0 million As of June 30, 2021 In millions Shareholders' Equity $102.1 Senior Term Debt Outstanding $27.0 ABL Debt Outstanding $0.2 Debt to Equity Ratio 26.6% Leverage Ratio (Debt / TTM EBITDA) 0.86 Positioned to Invest for Growth • Low debt leverage • Total Credit Facility of $62 million • Unused Debt Capacity of $25 million • Ability to restructure debt for additional capacity Completed Refinancing Senior Credit Facility in October 2020: Term Notes As of June 30, 2021 ABL Credit Facility As of June 30, 2021

24 Why Core Molding Technologies S U M M A R Y • Composite industry growing faster than the overall economy • Over 40 years of experience in manufacturing large structural composite parts • Successful 2019 turnaround with new operating management, systems and processes • Diversified customer and industry base • Investment in sustaining capex improving asset reliability • Long-term relations with large blue-chip entities • Single source provider for parts produced • Recapitalized balance sheet with low overall leverage, sufficient liquidity and ability to access growth capital Most reliable innovative and responsive partner in material and manufacturing solution development
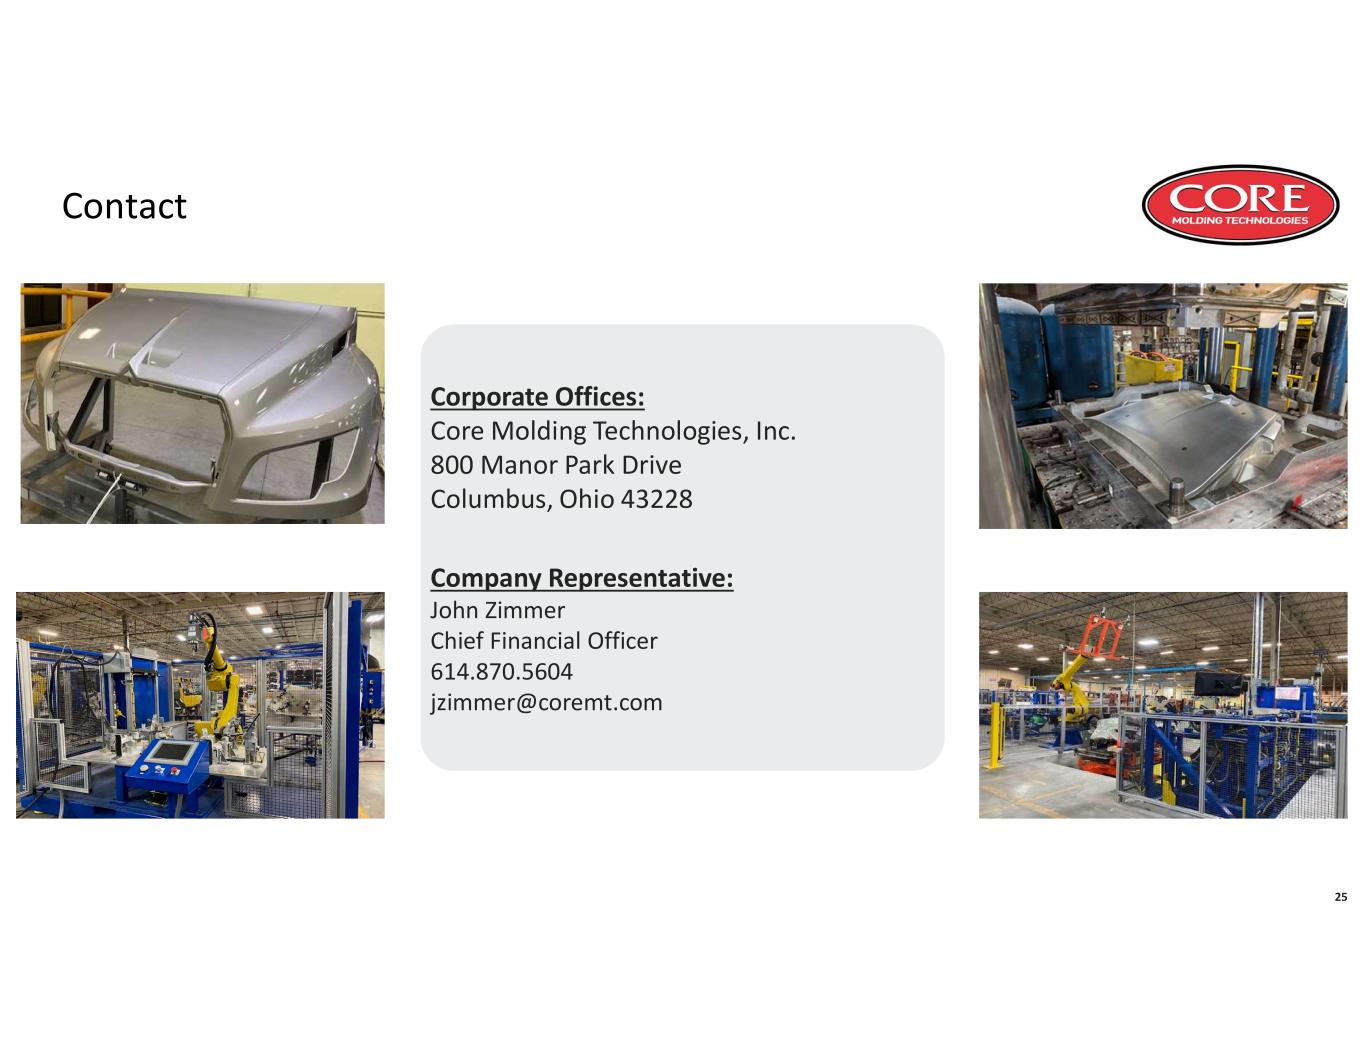
25 Contact Corporate Offices: Core Molding Technologies, Inc. 800 Manor Park Drive Columbus, Ohio 43228 Company Representative: John Zimmer Chief Financial Officer 614.870.5604 jzimmer@coremt.com

26 Appendix

27 Historical Financial Information in 000's 2012 2013 2014 2015 2016 2017 2018 2019 2020 1H 2021 Net Sales 162,450$ 144,125$ 175,204$ 199,068$ 174,882$ 161,673$ 269,485$ 284,290$ 222,356$ 153,290$ Gross Margin 25,848$ 23,574$ 30,186$ 36,252$ 27,906$ 24,631$ 27,141$ 21,506$ 34,474$ 26,454$ Gross Margin % 15.9% 16.4% 17.2% 18.2% 16.0% 15.2% 10.1% 7.6% 15.5% 17.3% Operating Profit (Loss) 12,490$ 10,114$ 14,647$ 18,498$ 11,527$ 7,941$ (3,100)$ (11,528)$ 10,390$ 11,519$ Operating Profit (Loss) % 7.7% 7.0% 8.4% 9.3% 6.6% 4.9% -1.2% -4.1% 4.7% 7.5% EBITDA 17,423$ 15,405$ 20,414$ 25,324$ 18,831$ 15,561$ 10,478$ 4,606$ 23,487$ 18,567$ EBITDA % 10.7% 10.7% 11.7% 12.7% 10.8% 9.6% 3.9% 1.6% 10.6% 12.1% ROCE (Annualized for 2021) 19.0% 14.4% 19.0% 20.2% 11.1% 7.4% -2.3% -7.9% 8.5% 18.4% The Company believes that supplementing its financial statements prepared in accordance with United States generally accepted accounting principles (“GAAP”) with certain non-GAAP financial measures, as defined by the Securities and Exchange Commission (the “SEC”), provides a more comprehensive understanding of the Company’s results of operations. Such measures include EBITDA, which should not be considered an alternative to GAAP financial measures, but instead should be read in conjunction with the GAAP financial measures. Readers are urged to review carefully the various disclosures made by the Company in its Form 10-K and its other SEC filings, which advise interested parties of certain factors that affect the Company’s business.

28 Historical EBITDA in 000's 2012 2013 2014 2015 2016 2017 2018 2019 2020 1H 2021 Net Income 8,190$ 6,866$ 9,634$ 12,050$ 7,411$ 5,459$ (4,782)$ (15,223)$ 8,165$ 7,542$ Income Tax Expense (Benefit) 3,966$ 3,034$ 4,891$ 6,118$ 3,836$ 2,286$ (664)$ (355)$ (3,618)$ 2,894$ Interest Expense 334$ 214$ 122$ 330$ 298$ 245$ 2,394$ 4,144$ 5,923$ 1,163$ Depreciation and Amortization 4,523$ 4,878$ 5,023$ 6,041$ 6,283$ 6,240$ 9,384$ 10,376$ 11,662$ 6,164$ Share Based Compensation 410$ 413$ 744$ 785$ 1,003$ 1,331$ 1,743$ 1,564$ 1,355$ 804$ Goodwill Impairment -$ -$ -$ -$ -$ -$ 2,403$ 4,100$ -$ -$ EBITDA 17,423$ 15,405$ 20,414$ 25,324$ 18,831$ 15,561$ 10,478$ 4,606$ 23,487$ 18,567$ The Company believes that supplementing its financial statements prepared in accordance with United States generally accepted accounting principles (“GAAP”) with certain non-GAAP financial measures, as defined by the Securities and Exchange Commission (the “SEC”), provides a more comprehensive understanding of the Company’s results of operations. Such measures include EBITDA, which should not be considered an alternative to GAAP financial measures, but instead should be read in conjunction with the GAAP financial measures. Readers are urged to review carefully the various disclosures made by the Company in its Form 10-K and its other SEC filings, which advise interested parties of certain factors that affect the Company’s business.
