Attached files
| file | filename |
|---|---|
| 8-K - 8-K - CENTURY CASINOS INC /CO/ | cnty-20210805x8k.htm |
| EX-99.1 - EX-99.1 - CENTURY CASINOS INC /CO/ | cnty-20210805xex99_1.htm |
Exhibit 99.2
CENTURY CASINOS, INC. Financial Results Q2 2021 CENTURY CASINOS 1
Forward-Looking Statements, Business Environment and Risk Factors This presentation may contain “forward-looking statements” within the meaning of Section 27A of the Securities Act of 1933, as amended, Section 21E of the Securities Exchange Act of 1934, as amended (the “Exchange Act”), and the Private Securities Litigation Reform Act of 1995. In addition, Century Casinos, Inc. (together with its subsidiaries, the “Company”, “we”, “us”, “our”) may make other written and oral communications from time to time that contain such statements. Forward-looking statements include statements as to industry trends and future expectations of the Company and other matters that do not relate strictly to historical facts and are based on certain assumptions by management at the time such statements are made. Forward-looking statements in this presentation include statements regarding future results of operations, including statements about operating margins, the impact of the current coronavirus (COVID-19) pandemic, estimates of the financial impact of COVID-19, the adequacy of cash flows from operations and available cash to meet our future liquidity needs, particularly if we cannot operate our casinos due to COVID-19 or their operations are restricted, operating efficiencies, synergies and operational performance, the prospects for and timing and costs of new projects, projects in development and other opportunities, the credit agreement with Macquarie (as defined herein) and obligations under our Master Lease (as defined herein) and the ability to repay debt and other obligations, investments in joint ventures, outcomes of legal proceedings, changes in our tax provisions or exposure to additional income tax liabilities, and plans for our casinos and our Company. These statements are often identified by the use of words such as “may,” “will,” “expect,” “believe,” “anticipate,” “intend,” “could,” “estimate,” or “continue,” and similar expressions or variations. These statements are based on the beliefs and assumptions of the management of the Company based on information currently available to management. Such forward-looking statements are subject to risks, uncertainties and other factors that could cause actual results to differ materially from future results expressed or implied by such forward-looking statements. Important factors that could cause actual results to differ materially from the forward-looking statements include, among others, the risks described in the section entitled “Risk Factors” under Item 1A in our Annual Report on Form 10-K for the year ended December 31, 2020 (the “2020 Annual Report”) and our subsequent periodic and current reports filed with the SEC. We caution the reader to carefully consider such factors. Furthermore, such forward-looking statements speak only as of the date on which such statements are made. We undertake no obligation to update any forward-looking statements to reflect events or circumstances after the date of such statements. CENTURY CASIONO 2
Notes on Presentation In this presentation the term “USD” refers to US dollars, the term “CAD” refers to Canadian dollars and the term “PLN” refers to Polish zloty. Adjusted EBITDA, Adjusted EBITDA margin and Net Debt are non-GAAP financial measures. See Appendix A for the definition and reconciliation of Adjusted EBITDA, Adjusted EBITDA margin and Net Debt. Amounts presented are rounded. As such, rounding differences could occur in period-over-period changes and percentages reported throughout this presentation. The names of the Company’s subsidiaries and certain operating segments are abbreviated on certain of the following slides. See Appendix A for a list of the subsidiaries and their abbreviations. CENTURY CASINOS 3
COVID-19 UPDATE In late 2019, an outbreak of COVID-19 was identified in China and has since spread throughout much of the world. The COVID-19 pandemic has had an adverse effect on the Company’s 2020 results of operations and financial condition, and impacted the Company’s results of operations to a lesser extent in the first half of 2021 because the Company’s United States properties were open and operating during this period. The Company’s Canada properties reopened on June 10, 2021, and its Poland casinos reopened on May 28, 2021. The Company’s casinos in the United States have been open since June 2020 but have been required to vary their operations based on the governmental health and safety requirements in the jurisdictions in which they are located. The duration and ultimate impact of the COVID-19 pandemic otherwise remains uncertain. CENTURY CASINOS 4
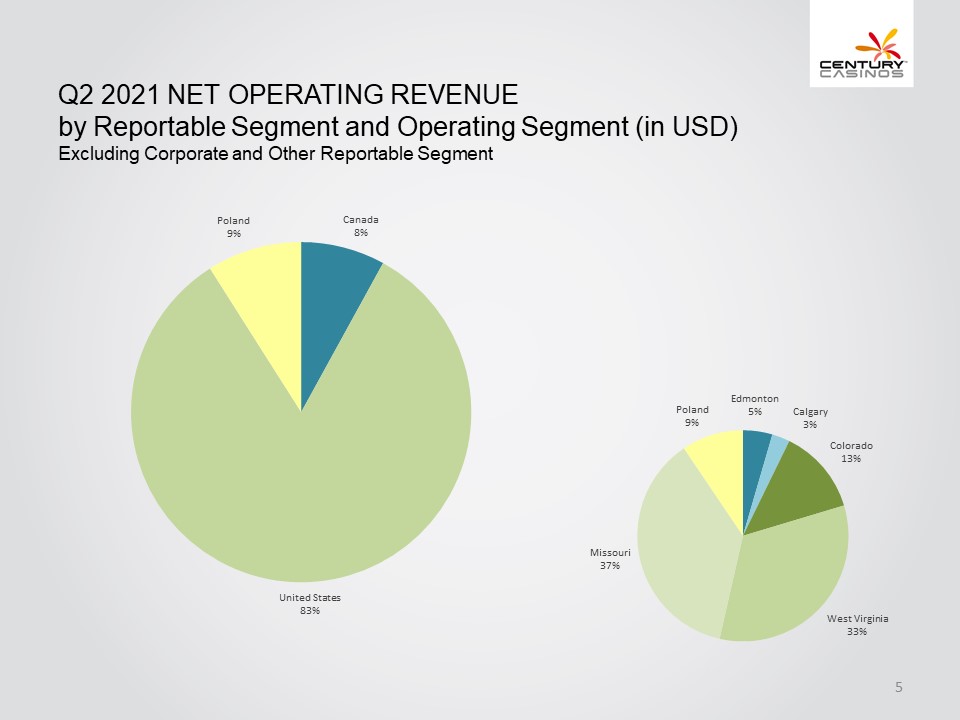
Q2 2021 Net Operating Revenue by Reportable Segment and Operating Segment (in USD) Excluding Corporate and Other Reportable Segment Poland 9% Canada 8% United States 83% Missouri 37% Poland 9% Edmonton 5% Calgary 3% Colorado 13% West Virginia 33% CENTURY CASINOS 5
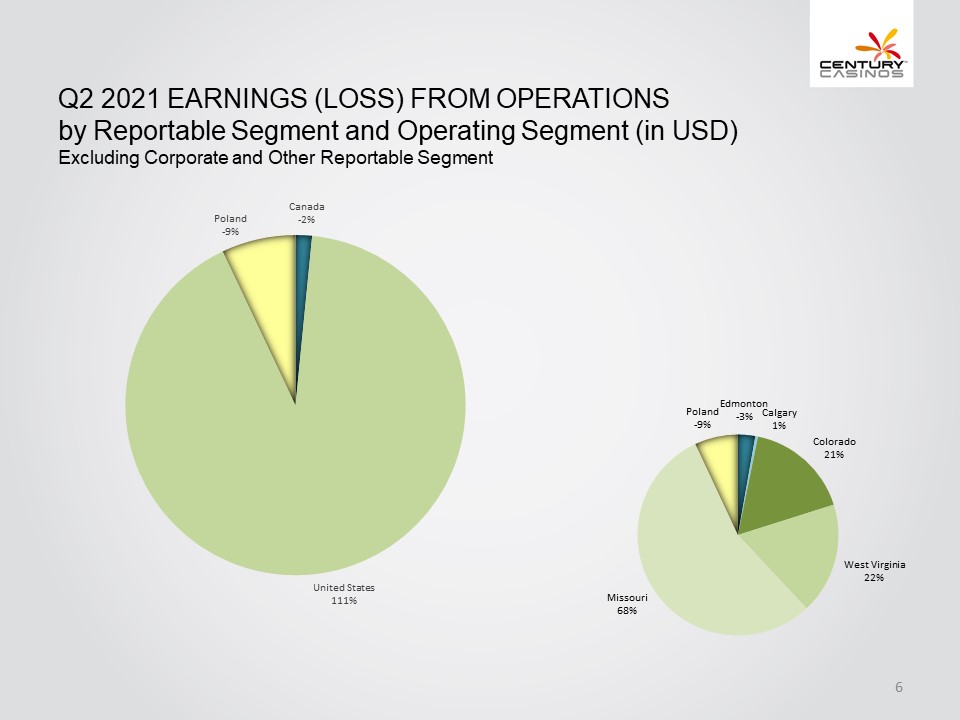
Q2 2021 Earnings (Loss) from Operations by Reportable Segment and Operating Segment (in USD) Excluding Corporate and Other Reportable Segment Poland -9% Canada -2% United States 111% Missouri 68% Poland -9% Edmonton -3% Calgary 1% Colorado 21% West Virginia 22% Century Casinos 6
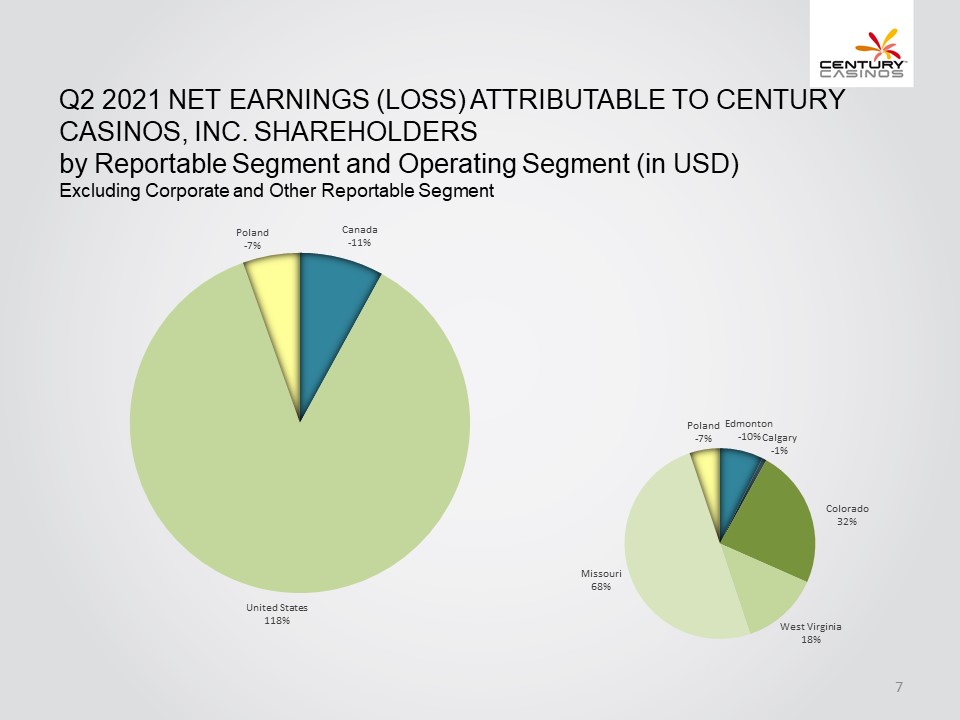
Q2 2021 Net Earnings (Loss) Attributable to Century Casinos, Inc. Shareholders by Reportable Segment and Operating Segment (in USD) Excluding Corporate and Other Reportable Segment United States 118% Poland -7% Canada -11% Missouri 68% Poland -7% Edmonton -10% Calgary -1% Colorado 32% West Virginia 18% Century Casinos 7
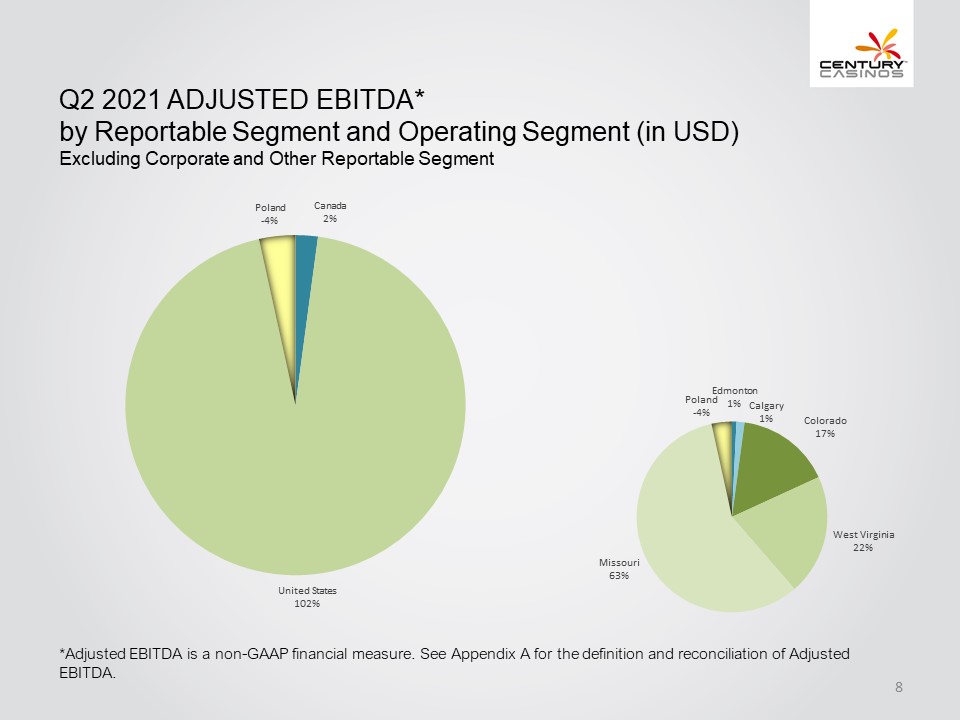
Q2 2021 Adjusted EBITDA* by Reportable Segment and Operating Segment (in USD) Excluding Corporate and Other Reportable Segment United States 102% Poland -4% Canada 2% Missouri 63% Poland -4% Edmonton 1% Calgary 1% Colorado 17% West Virginia 22% *Adjusted EBITDA is a non-GAAP financial measure. See Appendix A for the definition and reconciliation of Adjusted EBITDA. CENTURY CASINOS 8
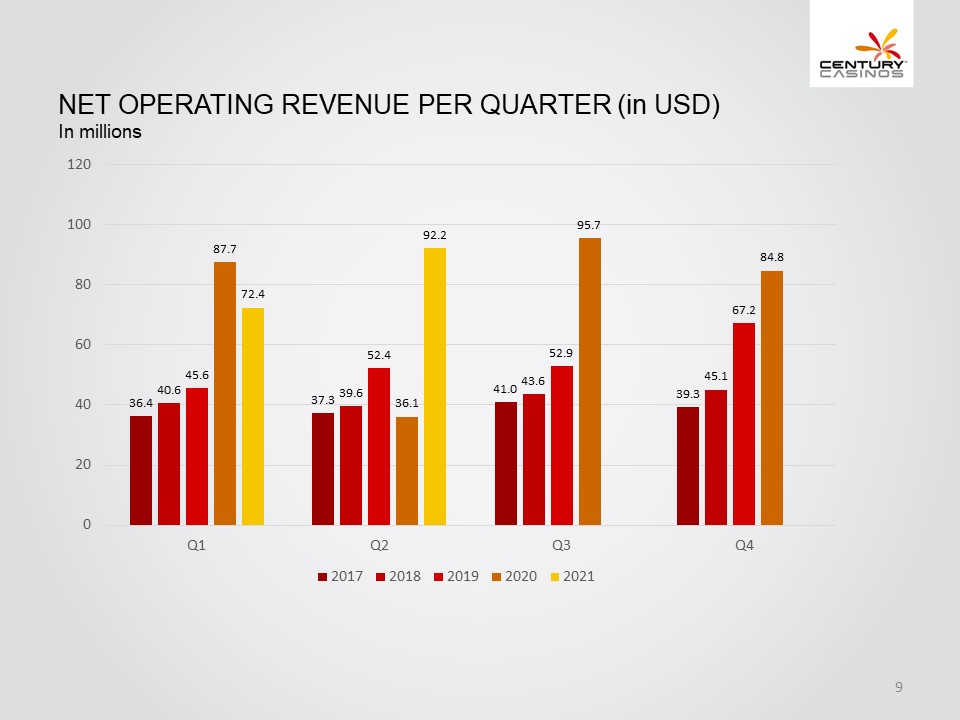
Net Operating Revenue per Quarter (in USD) In millions 0 20 40 60 80 100 120 Q1 36.4 40.6 45.6 87.7 72.4 Q2 37.3 39.6 52.4 36.1 92.2 Q3 41.0 43.6 52.9 95.7 Q4 39.3 45.1 67.2 84.8 2017 2018 2019 2020 2021 Century Casinos 9
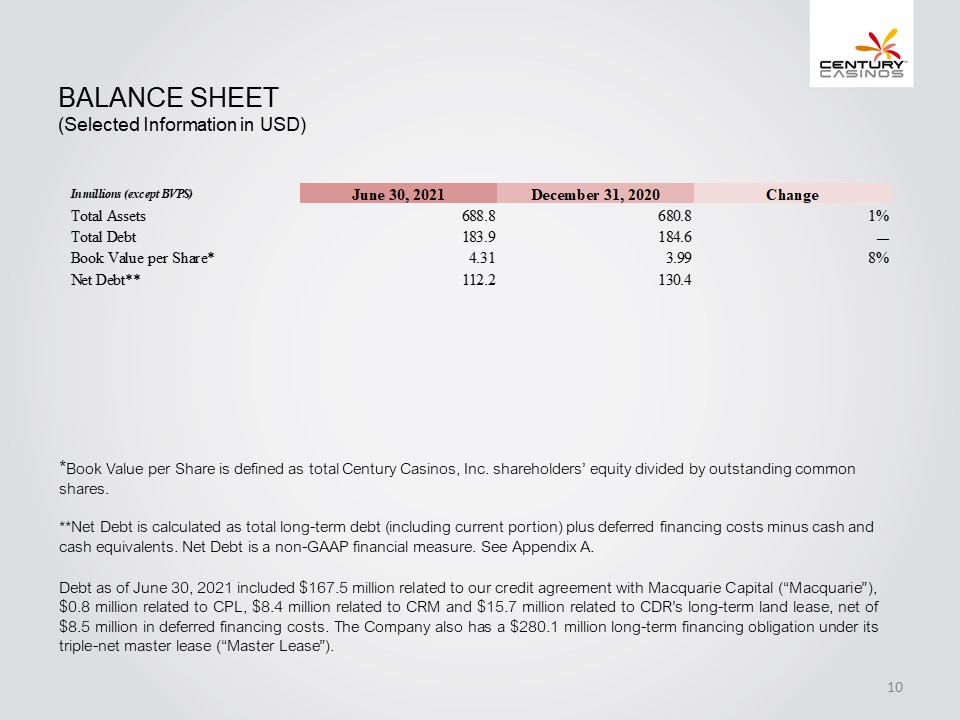
Balance Sheet (Selected Information in USD) In millions (except BVPS) June 30, 2021 December 31, 2020 Change Total Assets 688.8 680.8 1% Total Debt 183.9 184.6 - Book Value per Share* 4.31 3.99 8% Net Debt** 112.2 130.4 *Book Value per Share is defined as total Century Casinos, Inc. shareholders’ equity divided by outstanding common shares. **Net Debt is calculated as total long-term debt (including current portion) plus deferred financing costs minus cash and cash equivalents. Net Debt is a non-GAAP financial measure. See Appendix A. Debt as of June 30, 2021 included $167.5 million related to our credit agreement with Macquarie Capital (“Macquarie”), $0.8 million related to CPL, $8.4 million related to CRM and $15.7 million related to CDR’s long-term land lease, net of $8.5 million in deferred financing costs. The Company also has a $280.1 million long-term financing obligation under its triple-net master lease (“Master Lease”). CENTURY CASINOS 10
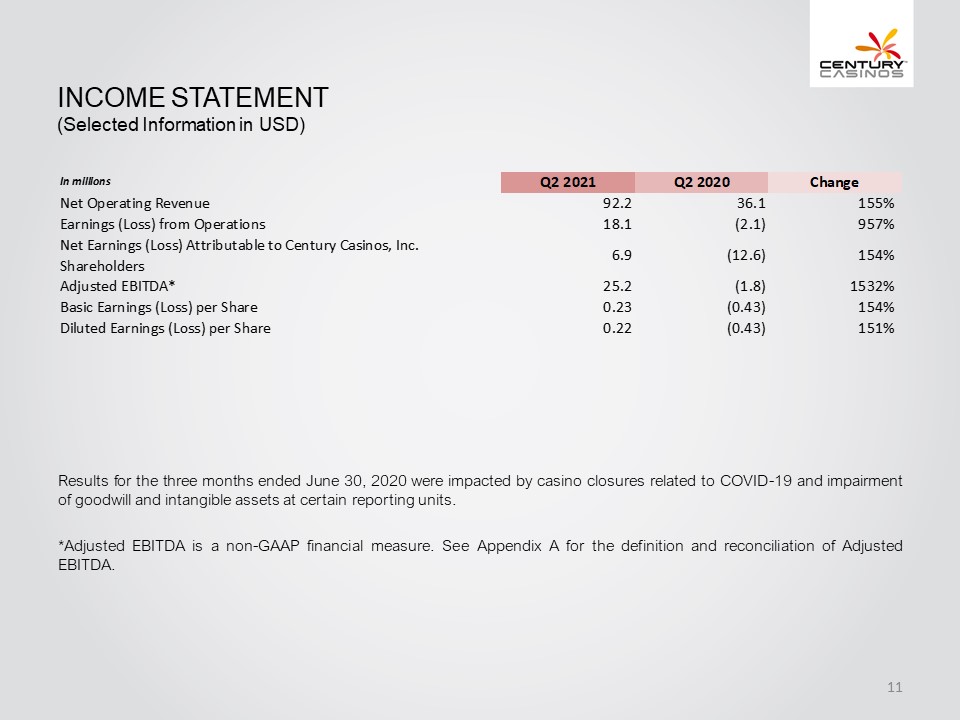
Income Statement (Selected Information in USD) In millions Q2 2021 Q2 2020 Change Net Operating Revenue 92.2 36.1 155% Earnings (Loss) from Operations 18.1 (2.1) 957% Net Earnings (Loss) Attributable to Century Casinos, Inc. Shareholders 6.9 (12.6) 154% Adjusted EBITDA* 25.2 (1.8) 1532% Basic Earnings (Loss) per Share 0.23 (0.43) 154% Diluted Earnings (Loss) per Share 0.22 (0.43) 151% Results for the three months ended June 30, 2020 were impacted by casino closures related to COVID-19 and impairment of goodwill and intangible assets at certain reporting units. *Adjusted EBITDA is a non-GAAP financial measure. See Appendix A for the definition and reconciliation of Adjusted EBITDA. CENTURY CASINOS 11
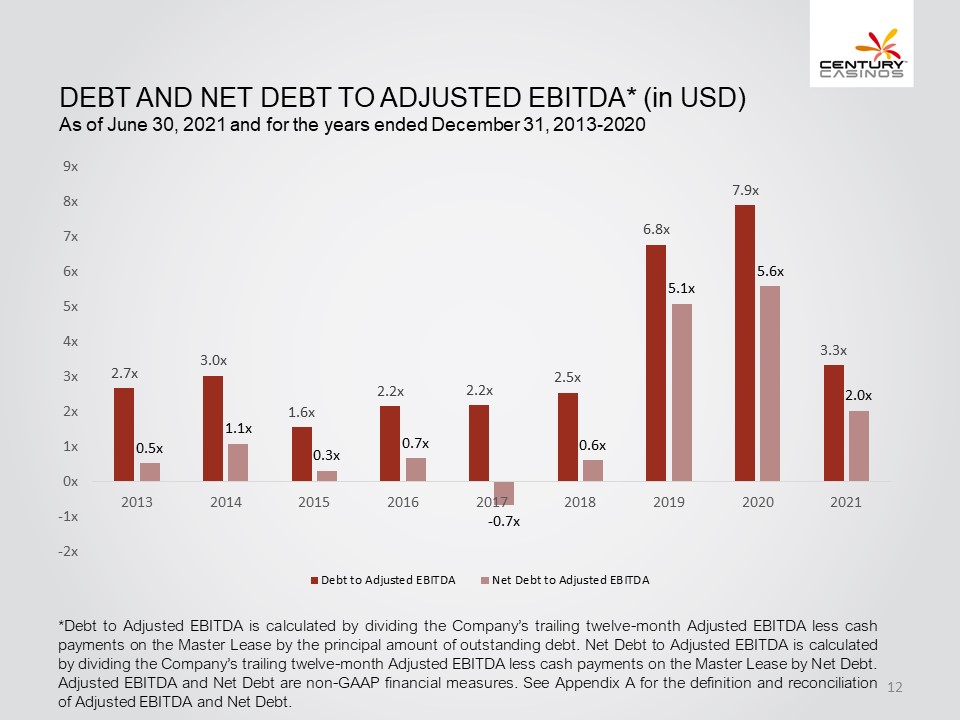
Debt and Net Debt to Adjusted EBITDA* (in USD) As of June 30, 2021 and for the years ended December 31, 2013-2020 9x 8x 7x 6x 5x 4x 3x 2x lx 0x -1x -2x 2013 2.7X 0.5X 2014 3.0X 1.1X 2015 1.6X 0.3X 2016 2.2X 0.7X 2017 2.2X -0.7X 2018 2.5X 0.6X 2019 6.8X 5.1X 2020 7.9X 5.6X 2021 3.3X 2.0X Debt to Adjusted EBITDA Net Debt to Adjusted EBITDA *Debt to Adjusted EBITDA is calculated by dividing the Company’s trailing twelve-month Adjusted EBITDA less cash payments on the Master Lease by the principal amount of outstanding debt. Net Debt to Adjusted EBITDA is calculated by dividing the Company’s trailing twelve-month Adjusted EBITDA less cash payments on the Master Lease by Net Debt. Adjusted EBITDA and Net Debt are non-GAAP financial measures. See Appendix A for the definition and reconciliation of Adjusted EBITDA and Net Debt. CENTURY CASINOS 12
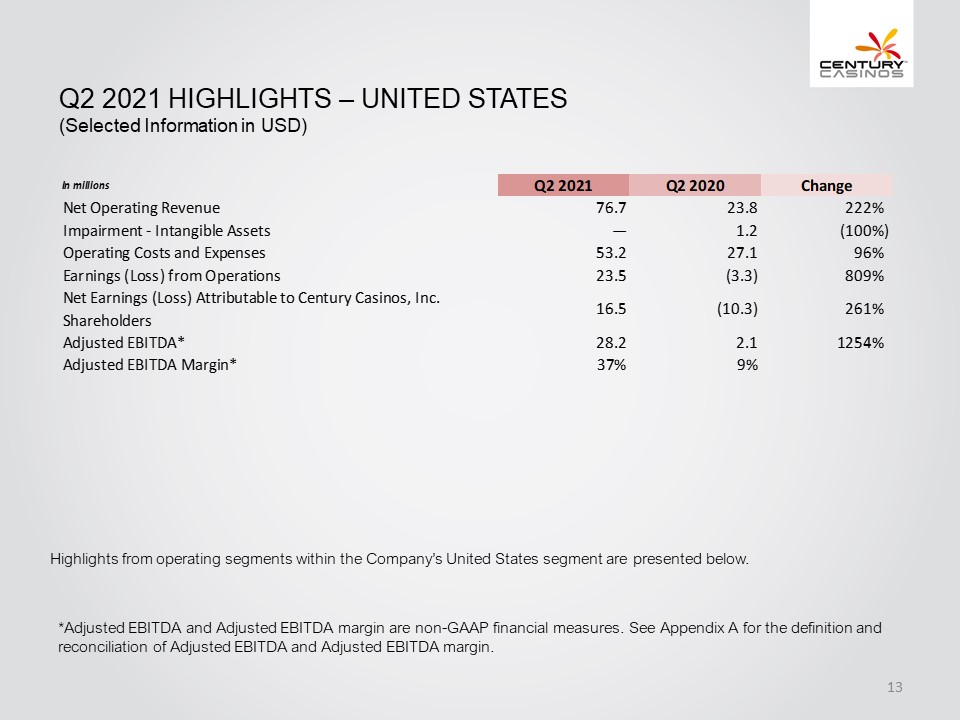
Q2 2021 Highlights – UNITED STATES (Selected Information in USD) In millions Q2 2021 Q2 2020 Change Net Operating Revenue 76.7 23.8 222% Impairment -Intangible Assets — 1.2 (100%) Operating Costs and Expenses 53.2 27.1 96% Earnings (Loss) from Operations 23.5 (3.3) 809% Net Earnings (Loss) Attributable to Century Casinos, Inc. Shareholders 16.5 (10.3) 261% Adjusted EBITDA* 28.2 2.1 1254% Adjusted EBITDA Margin* 37% 9% Highlights from operating segments within the Company’s United States segment are presented below. *Adjusted EBITDA and Adjusted EBITDA margin are non-GAAP financial measures. See Appendix A for the definition and reconciliation of Adjusted EBITDA and Adjusted EBITDA margin. CENTURY CASINOS 13
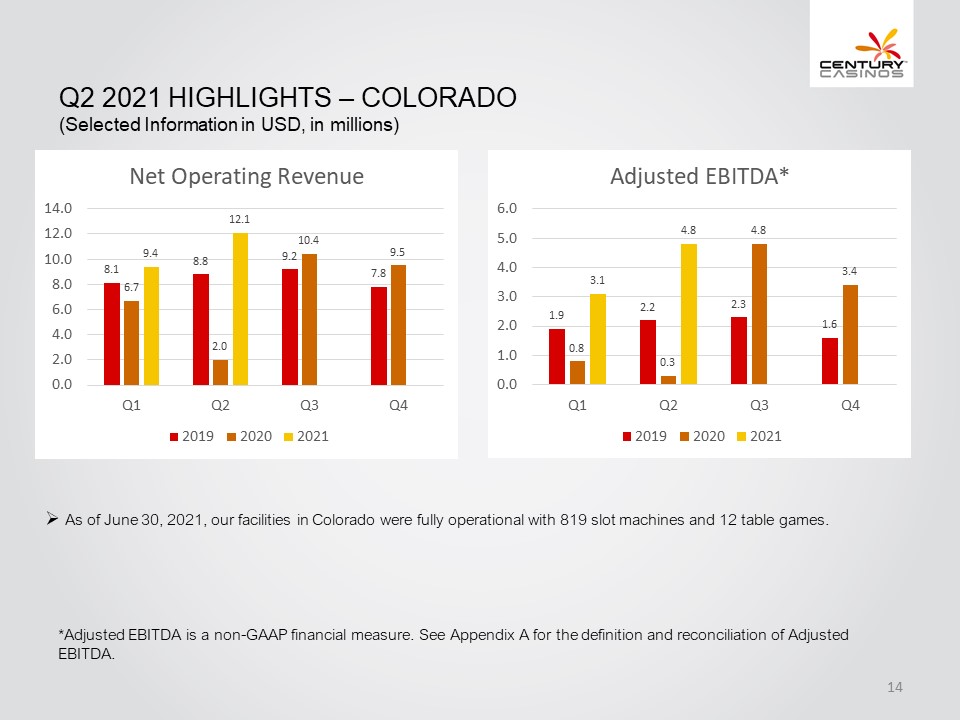
Q2 2021 Highlights – COLORADO (Selected Information in USD, in millions) Net Operating Revenue 0.0 2.0 4.0 6.0 8.0 10.0 12.0 14.0 Q1 8.1 6.7 9.4 Q2 8.8 2.0 12.1 Q3 9.2 10.4 Q4 7.8 9.5 2019 2020 2021 Adjusted EBITDA* 0.0 1.0 2.0 3.0 4.0 5.0 6.0 Q1 1.9 0.8 3.1 Q2 2.2 0.3 4.8 Q3 2.3 4.8 Q4 1.6 3.4 2019 2020 2021 As of June 30, 2021, our facilities in Colorado were fully operational with 819 slot machines and 12 table games. *Adjusted EBITDA is a non-GAAP financial measure. See Appendix A for the definition and reconciliation of Adjusted EBITDA. CENTURY CASINOS 14
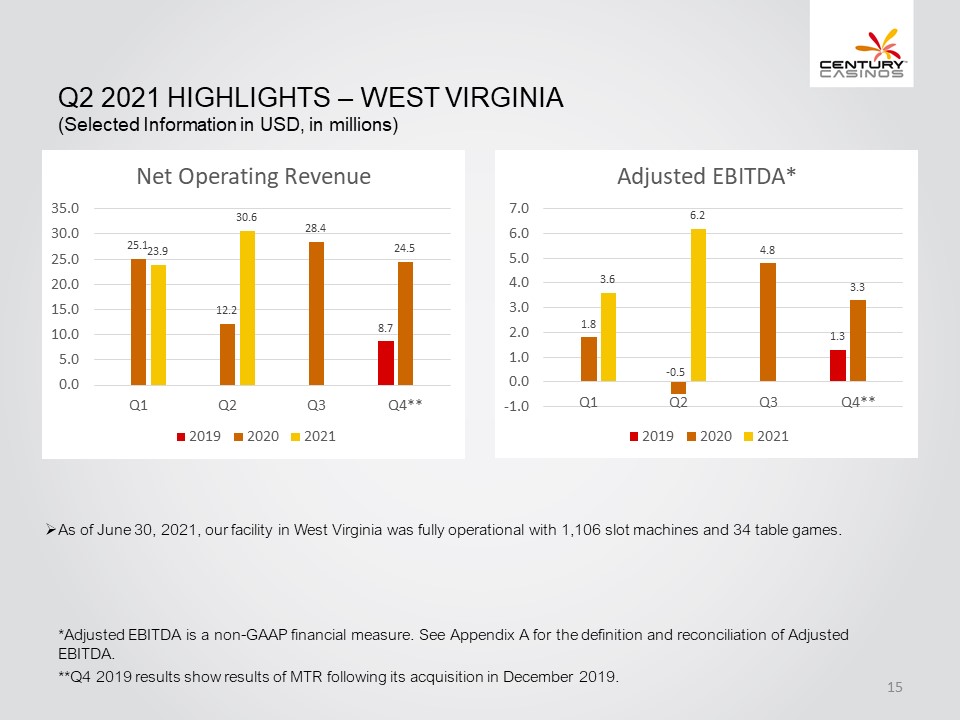
Q2 2021 Highlights – WEST VIRGINIA (Selected Information in USD, in millions) Net Operating Revenue 0.0 5.0 10.0 15.0 20.0 25.0 30.0 35.0 Q1 25.1 23.9 Q2 12.2 30.6 Q3 28.4 Q4** 8.7 24.5 2019 2020 2021 Adjusted EBITDA* -1.0 0.0 1.0 2.0 3.0 4.0 5.0 6.0 7.0 Q1 1.8 3.6 Q2 -0.5 6.2 Q3 4.8 Q4** 1.3 3.3 2019 2020 2021 As of June 30, 2021, our facility in West Virginia was fully operational with 1,106 slot machines and 34 table games. *Adjusted EBITDA is a non-GAAP financial measure. See Appendix A for the definition and reconciliation of Adjusted EBITDA. **Q4 2019 results show results of MTR following its acquisition in December 2019. Century Casinos 15
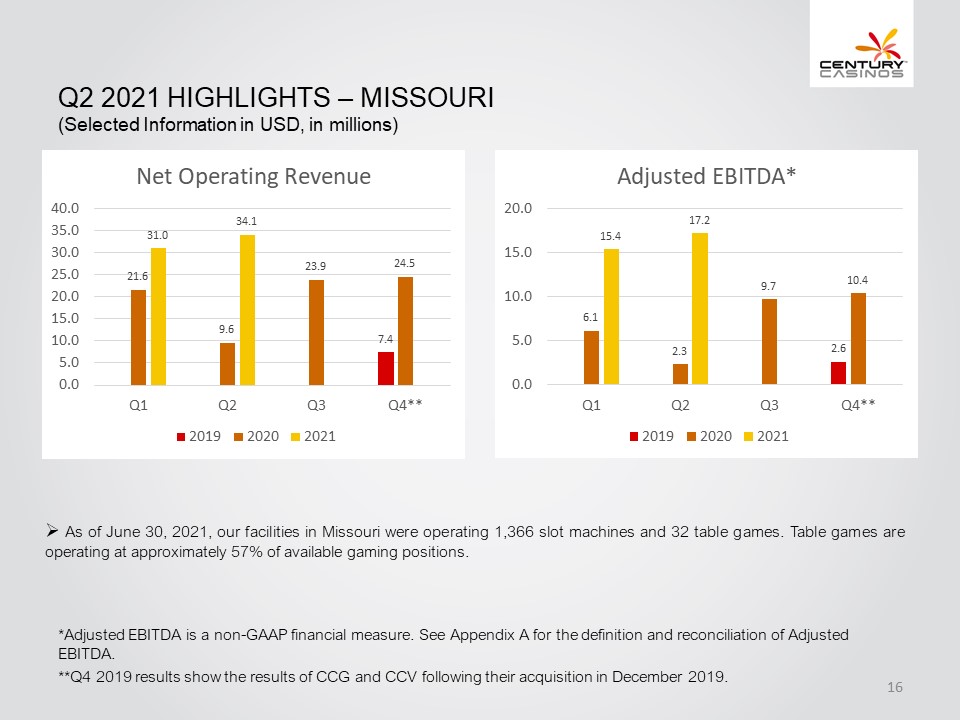
Q2 2021 Highlights – MISSOURI (Selected Information in USD, in millions) Net Operating Revenue 0.0 5.0 10.0 15.0 20.0 25.0 30.0 35.0 40.0 Q1 21.6 31.0 Q2 9.6 34.1 Q3 23.9 Q4** 7.4 24.5 2019 2020 2021 Adjusted EBITDA* 0.0 5.0 10.0 15.0 20.0 Q1 6.1 15.4 Q2 2.3 17.2 Q3 9.7 Q4** 2.6 10.4 2019 2020 2021 As of June 30, 2021, our facilities in Missouri were operating 1,366 slot machines and 32 table games. Table games are operating at approximately 57% of available gaming positions. *Adjusted EBITDA is a non-GAAP financial measure. See Appendix A for the definition and reconciliation of Adjusted EBITDA. **Q4 2019 results show the results of CCG and CCV following their acquisition in December 2019. CENTURY CASINOS 16
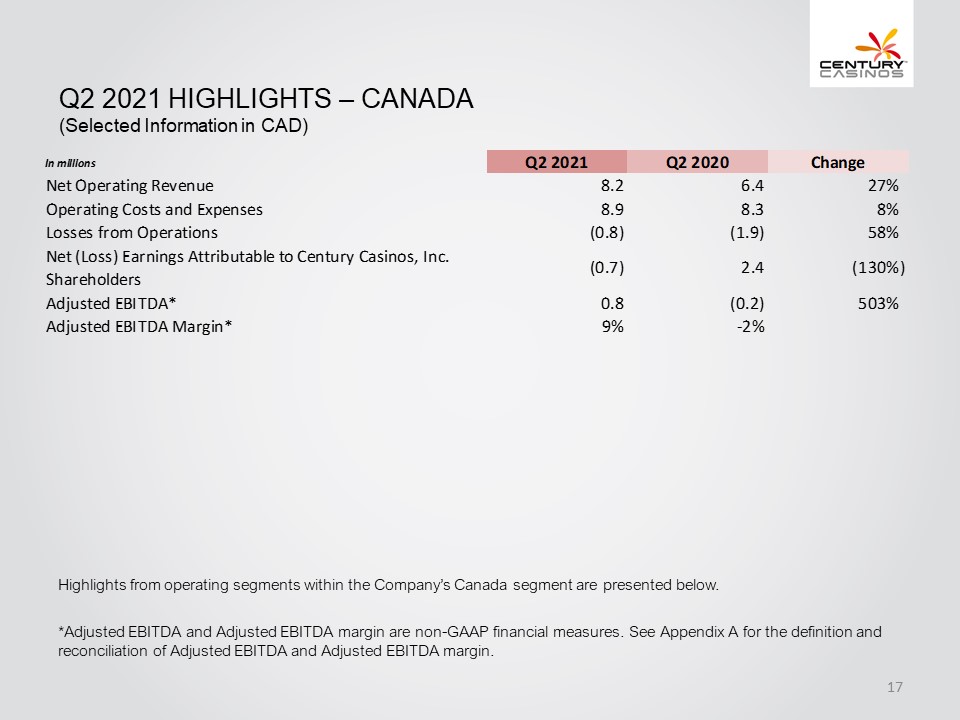
Q2 2021 Highlights – CANADA (Selected Information in CAD) In millions Q2 2021 Q2 2020 Change Net Operating Revenue 8.2 6.4 27% Operating Costs and Expenses 8.9 8.3 8% Losses from Operations (0.8) (1.9) 58% Net (Loss) Earnings Attributable to Century Casinos, Inc. Shareholders (0.7) 2.4 (130%) Adjusted EBITDA* 0.8 (0.2) 503% Adjusted EBITDA Margin* 9% -2% Highlights from operating segments within the Company’s Canada segment are presented below. *Adjusted EBITDA and Adjusted EBITDA margin are non-GAAP financial measures. See Appendix A for the definition and reconciliation of Adjusted EBITDA and Adjusted EBITDA margin. CENTURY CASINOS 17
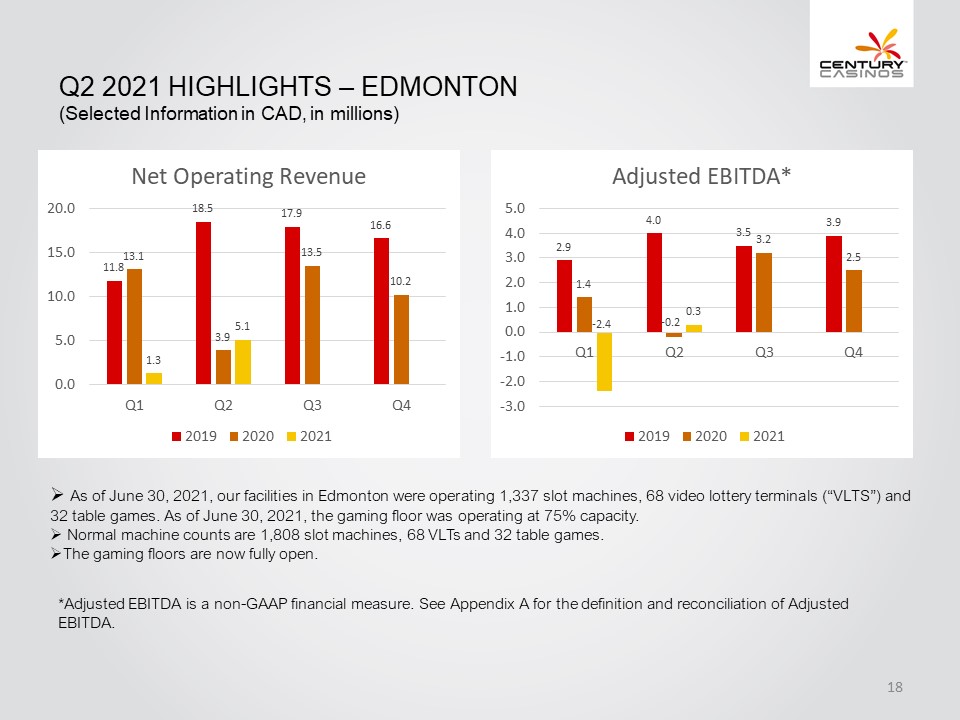
Q2 2021 Highlights – Edmonton (Selected Information in CAD, in millions) Net Operating Revenue 0.0 5.0 10.0 15.0 20.0 Q1 11.8 13.1 1.3 Q2 18.5 3.9 5.1 Q3 17.9 13.5 Q4 16.6 10.2 2019 2020 2021 Adjusted EBITDA* -3.0 -2.0 -1.0 0.0 1.0 2.0 3.0 4.0 5.0 Q1 2.9 1.4 -2.4 Q2 4.0 -0.2 0.3 Q3 3.5 3.2 Q4 3.9 2.5 2019 2020 2021 As of June 30, 2021, our facilities in Edmonton were operating 1,337 slot machines, 68 video lottery terminals (“VLTS”) and 32 table games. As of June 30, 2021, the gaming floor was operating at 75% capacity. Normal machine counts are 1,808 slot machines, 68 VLTs and 32 table games. The gaming floors are now fully open. *Adjusted EBITDA is a non-GAAP financial measure. See Appendix A for the definition and reconciliation of Adjusted EBITDA. CENTURY CASINOS 18
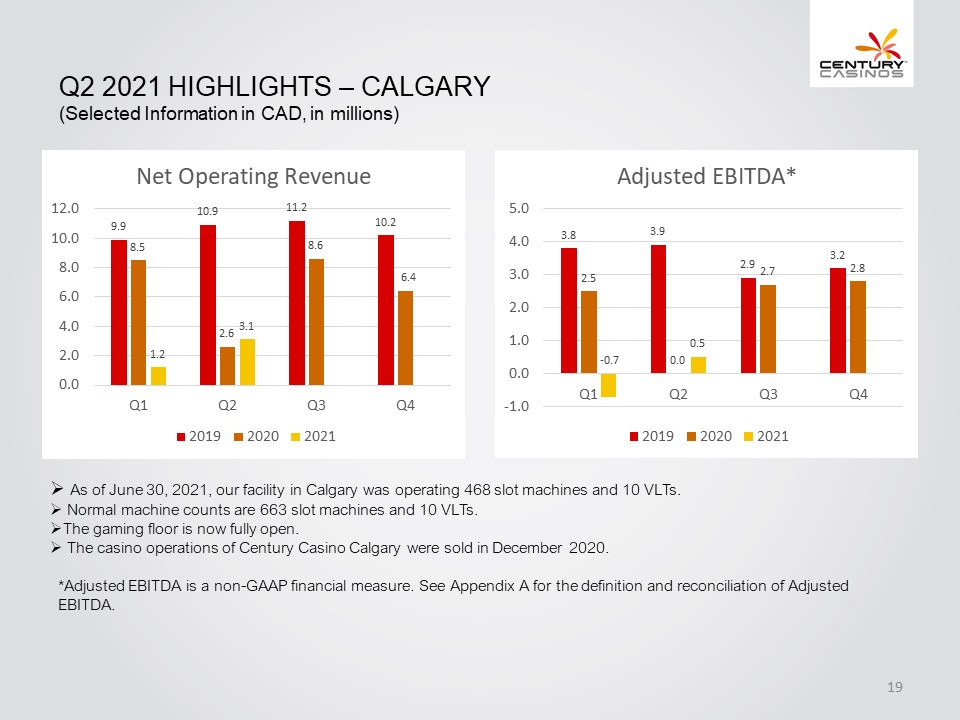
Q2 2021 Highlights – Calgary (Selected Information in CAD, in millions) Net Operating Revenue 0.0 2.0 4.0 6.0 8.0 10.0 12.0 Q1 9.9 8.5 1.2 Q2 10.9 2.6 3.1 Q3 11.2 8.6 Q4 10.2 6.4 2019 2020 2021 Adjusted EBITDA* -1.0 0.0 1.0 2.0 3.0 4.0 5.0 Q1 3.8 2.5 -0.7 Q2 3.9 0.0 0.5 Q3 2.9 2.7 Q4 3.2 2.8 2019 2020 2021 As of June 30, 2021, our facility in Calgary was operating 468 slot machines and 10 VLTs. Normal machine counts are 663 slot machines and 10 VLTs. The gaming floor is now fully open. The casino operations of Century Casino Calgary were sold in December 2020. *Adjusted EBITDA is a non-GAAP financial measure. See Appendix A for the definition and reconciliation of Adjusted EBITDA. Century Casinos 19
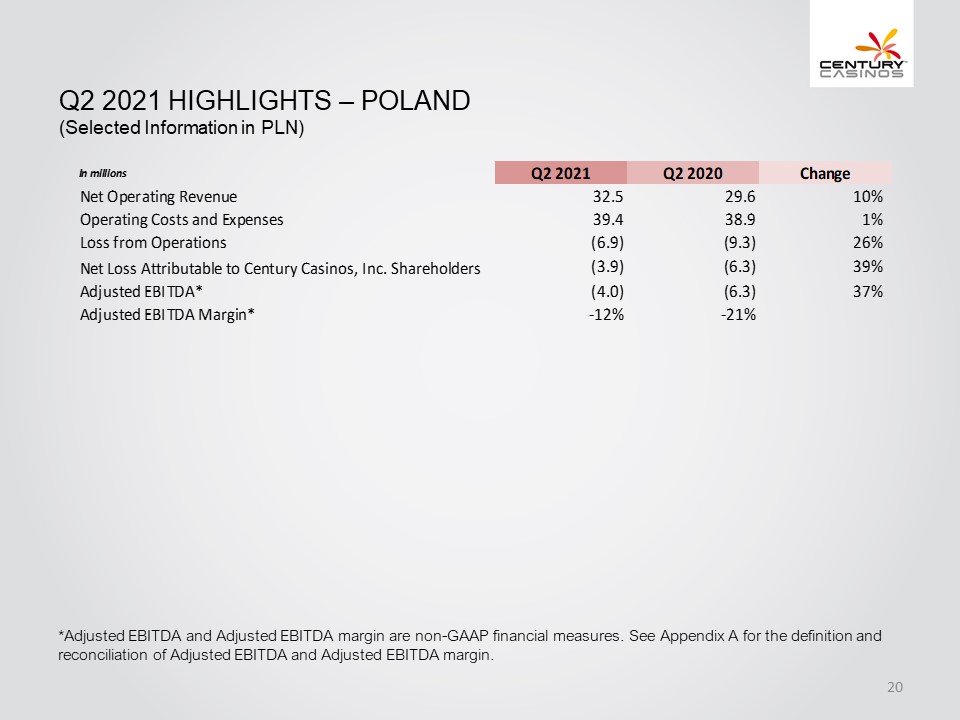
Q2 2021 Highlights – POLAND (Selected Information in PLN) In millions Q2 2021 Q2 2020 Change Net Operating Revenue 32.5 29.6 10% Operating Costs and Expenses 39.4 38.9 1% Loss from Operations (6.9) (9.3) 26% Net Loss Attributable to Century Casinos, Inc. Shareholders (3.9) (6.3) 39% Adjusted EBITDA* (4.0) (6.3) 37% Adjusted EBITDA Margin* -12% -21% *Adjusted EBITDA and Adjusted EBITDA margin are non-GAAP financial measures. See Appendix A for the definition and reconciliation of Adjusted EBITDA and Adjusted EBITDA margin. CENTURY CASINOS 20
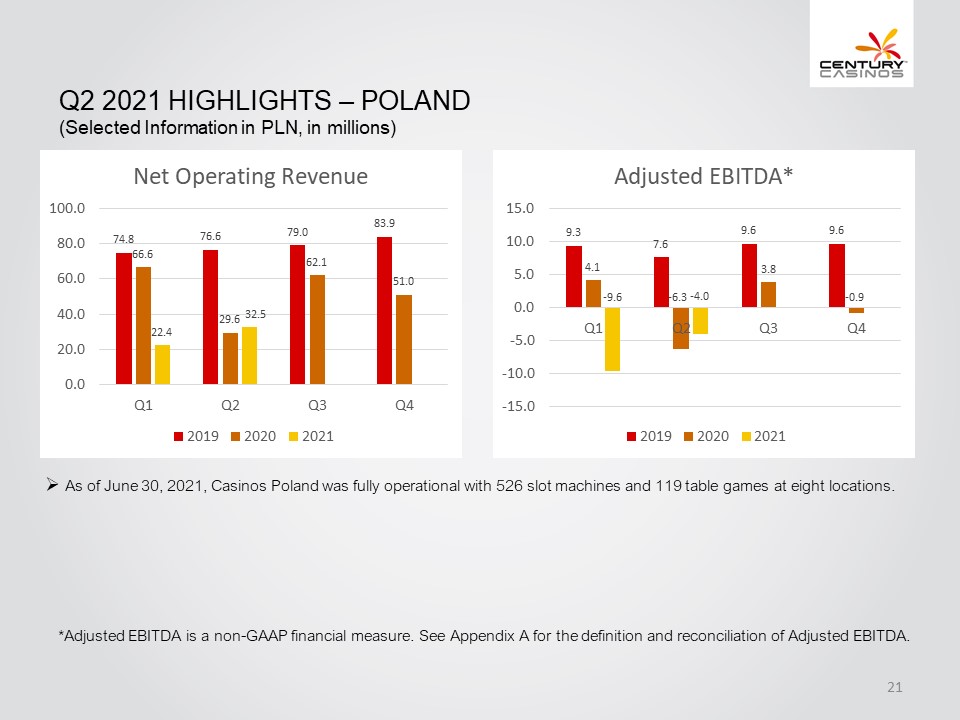
Q2 2021 Highlights – POLAND (Selected Information in PLN, in millions) Net Operating Revenue 0.0 20.0 40.0 60.0 80.0 100.0 Q1 74.8 66.6 22.4 Q2 76.6 29.6 32.5 Q3 79.0 62.1 Q4 83.9 51.0 2019 2020 2021 Adjusted EBITDA* -15.0 -10.0 -5.0 0.0 5.0 10.0 15.0 Q1 9.3 4.1 -9.6 Q2 7.6 -6.3 -4.0 Q3 9.6 3.8 Q4 9.6 -0.9 2019 2020 2021 As of June 30, 2021, Casinos Poland was fully operational with 526 slot machines and 119 table games at eight locations. *Adjusted EBITDA is a non-GAAP financial measure. See Appendix A for the definition and reconciliation of Adjusted EBITDA. CENTURY CASINOS 21
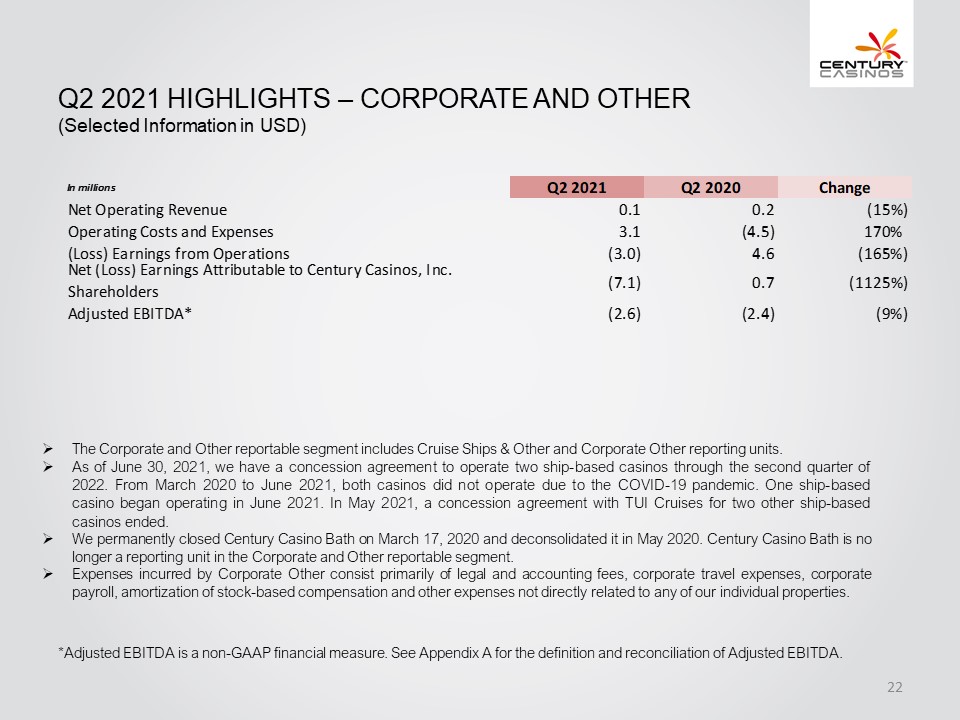
Q2 2021 Highlights – CORPORATE AND OTHER (Selected Information in USD) In millions Q2 2021 Q2 2020 Change Net Operating Revenue 0.1 0.2 (15%) Operating Costs and Expenses 3.1 (4.5) 170% (Loss) Earnings from Operations (3.0) 4.6 (165%) Net (Loss) Earnings Attributable to Century Casinos, Inc. Shareholders (7.1) 0.7 (1125%) Adjusted EBITDA* (2.6) (2.4) (9%) The Corporate and Other reportable segment includes Cruise Ships & Other and Corporate Other reporting units. As of June 30, 2021, we have a concession agreement to operate two ship-based casinos through the second quarter of 2022. From March 2020 to June 2021, both casinos did not operate due to the COVID-19 pandemic. One ship-based casino began operating in June 2021. In May 2021, a concession agreement with TUI Cruises for two other ship-based casinos ended. We permanently closed Century Casino Bath on March 17, 2020 and deconsolidated it in May 2020. Century Casino Bath is no longer a reporting unit in the Corporate and Other reportable segment. Expenses incurred by Corporate Other consist primarily of legal and accounting fees, corporate travel expenses, corporate payroll, amortization of stock-based compensation and other expenses not directly related to any of our individual properties. *Adjusted EBITDA is a non-GAAP financial measure. See Appendix A for the definition and reconciliation of Adjusted EBITDA. CENTURY CASINOS 22
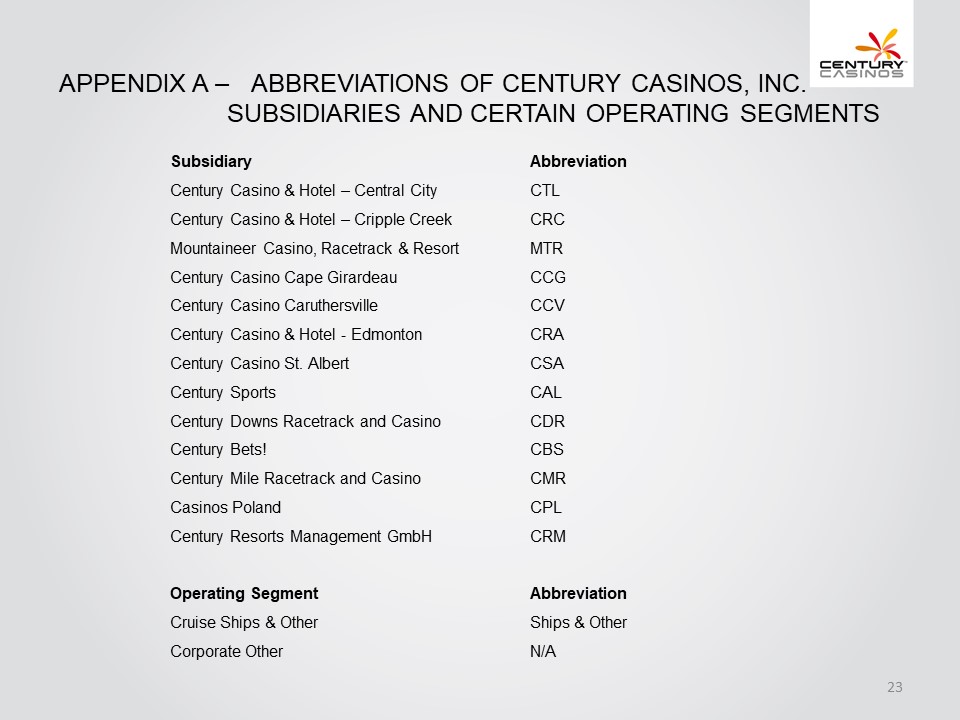
Appendix A – ABBREVIATIONS OF CENTURY CASINOS, INC. SUBSIDIARIES AND CERTAIN OPERATING SEGMENTS Subsidiary Abbreviation Century Casino & Hotel – Central City CTL Century Casino & Hotel – Cripple Creek CRC Mountaineer Casino, Racetrack & Resort MTR Century Casino Cape Girardeau CCG Century Casino Caruthersville CCV Century Casino & Hotel - Edmonton CRA Century Casino St. Albert CSA Century Sports CAL Century Downs Racetrack and Casino CDR Century Bets! CBS Century Mile Racetrack and Casino CMR Casinos Poland CPL Century Resorts Management GmbH CRM Operating Segment Abbreviation Cruise Ships & Other Ships & Other Corporate Other N/A CENTURY CASINOS 23
Appendix A – NON-GAAP FINANCIAL MEASURES The Company supplements its consolidated financial statements prepared in accordance with U.S. generally accepted accounting principles (“GAAP”) by using the following non-GAAP financial measures, which management believes are useful in properly understanding the Company’s short-term and long-term financial trends. Management uses these non-GAAP financial measures to forecast and evaluate the operational performance of the Company as well as to compare results of current periods to prior periods on a consolidated basis. Adjusted EBITDA Adjusted EBITDA margin Net Debt Management believes presenting the non-GAAP financial measures used in this presentation provides investors greater transparency to the information used by management for financial and operational decision-making and allows investors to see the Company’s results “through the eyes” of management. Management also believes providing this information better enables our investors to understand the Company’s operating performance and evaluate the methodology used by management to evaluate and measure such performance. The adjustments made to GAAP financial measures result from facts and circumstances that vary in frequency and impact on the Company’s results of operations. The following is an explanation of each of the adjustments that management excludes in calculating its non-GAAP financial measures. CENTURY CASINOS 24
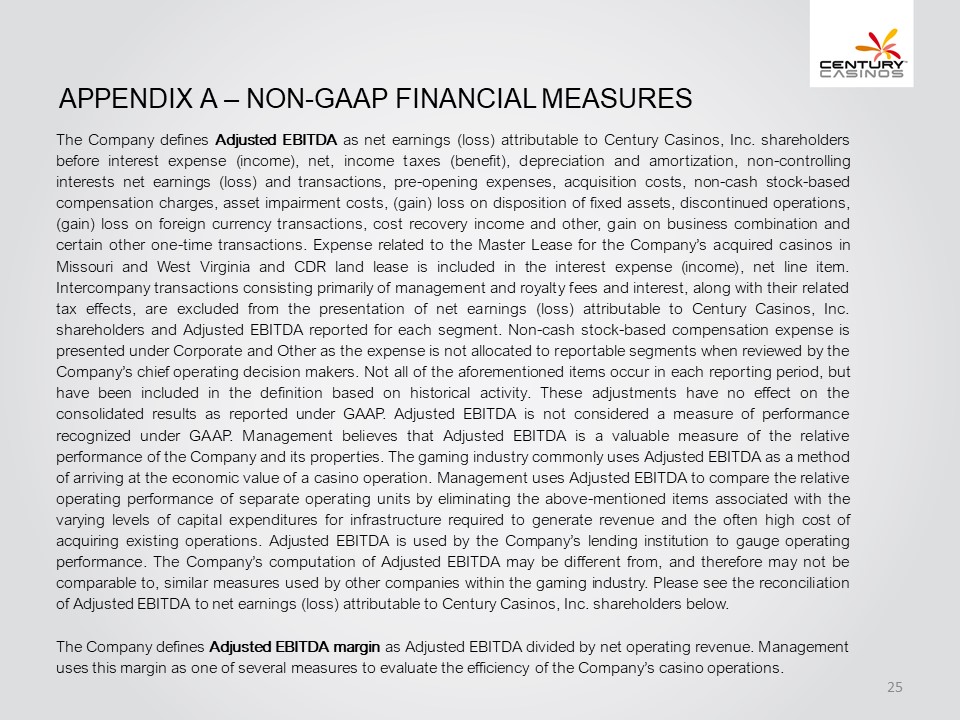
Appendix A – NON-GAAP FINANCIAL MEASURES The Company defines Adjusted EBITDA as net earnings (loss) attributable to Century Casinos, Inc. shareholders before interest expense (income), net, income taxes (benefit), depreciation and amortization, non-controlling interests net earnings (loss) and transactions, pre-opening expenses, acquisition costs, non-cash stock-based compensation charges, asset impairment costs, (gain) loss on disposition of fixed assets, discontinued operations, (gain) loss on foreign currency transactions, cost recovery income and other, gain on business combination and certain other one-time transactions. Expense related to the Master Lease for the Company’s acquired casinos in Missouri and West Virginia and CDR land lease is included in the interest expense (income), net line item. Intercompany transactions consisting primarily of management and royalty fees and interest, along with their related tax effects, are excluded from the presentation of net earnings (loss) attributable to Century Casinos, Inc. shareholders and Adjusted EBITDA reported for each segment. Non-cash stock-based compensation expense is presented under Corporate and Other as the expense is not allocated to reportable segments when reviewed by the Company’s chief operating decision makers. Not all of the aforementioned items occur in each reporting period, but have been included in the definition based on historical activity. These adjustments have no effect on the consolidated results as reported under GAAP. Adjusted EBITDA is not considered a measure of performance recognized under GAAP. Management believes that Adjusted EBITDA is a valuable measure of the relative performance of the Company and its properties. The gaming industry commonly uses Adjusted EBITDA as a method of arriving at the economic value of a casino operation. Management uses Adjusted EBITDA to compare the relative operating performance of separate operating units by eliminating the above-mentioned items associated with the varying levels of capital expenditures for infrastructure required to generate revenue and the often high cost of acquiring existing operations. Adjusted EBITDA is used by the Company’s lending institution to gauge operating performance. The Company’s computation of Adjusted EBITDA may be different from, and therefore may not be comparable to, similar measures used by other companies within the gaming industry. Please see the reconciliation of Adjusted EBITDA to net earnings (loss) attributable to Century Casinos, Inc. shareholders below. The Company defines Adjusted EBITDA margin as Adjusted EBITDA divided by net operating revenue. Management uses this margin as one of several measures to evaluate the efficiency of the Company’s casino operations. CENTURY CASINOS 25
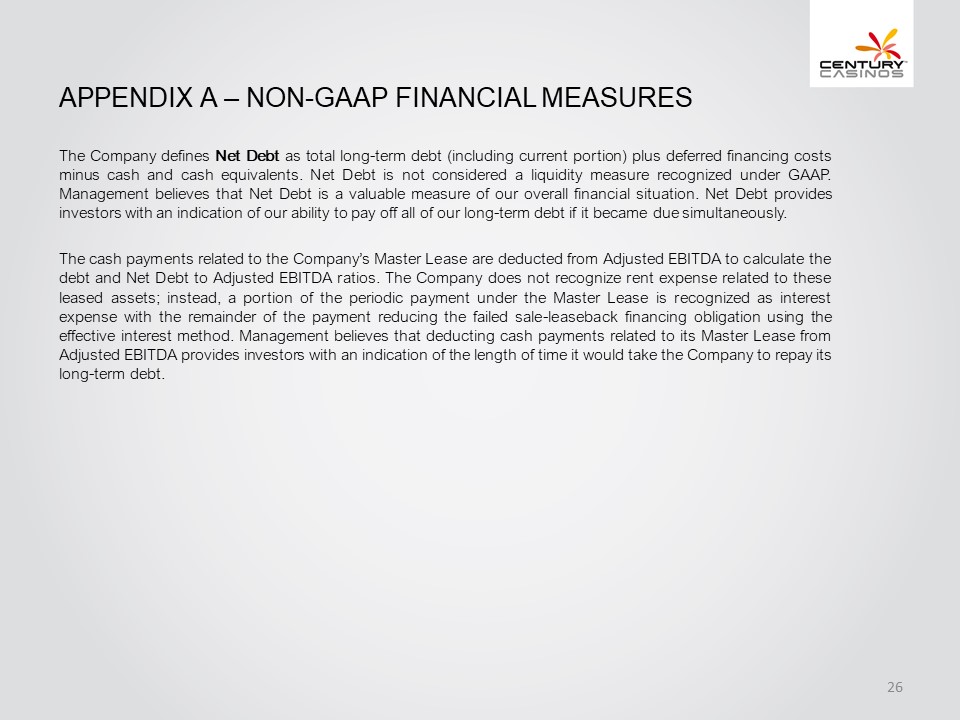
Appendix A – NON-GAAP FINANCIAL MEASURES The Company defines Net Debt as total long-term debt (including current portion) plus deferred financing costs minus cash and cash equivalents. Net Debt is not considered a liquidity measure recognized under GAAP. Management believes that Net Debt is a valuable measure of our overall financial situation. Net Debt provides investors with an indication of our ability to pay off all of our long-term debt if it became due simultaneously. The cash payments related to the Company’s Master Lease are deducted from Adjusted EBITDA to calculate the debt and Net Debt to Adjusted EBITDA ratios. The Company does not recognize rent expense related to these leased assets; instead, a portion of the periodic payment under the Master Lease is recognized as interest expense with the remainder of the payment reducing the failed sale-leaseback financing obligation using the effective interest method. Management believes that deducting cash payments related to its Master Lease from Adjusted EBITDA provides investors with an indication of the length of time it would take the Company to repay its long-term debt. CENTURY CASINOS 26
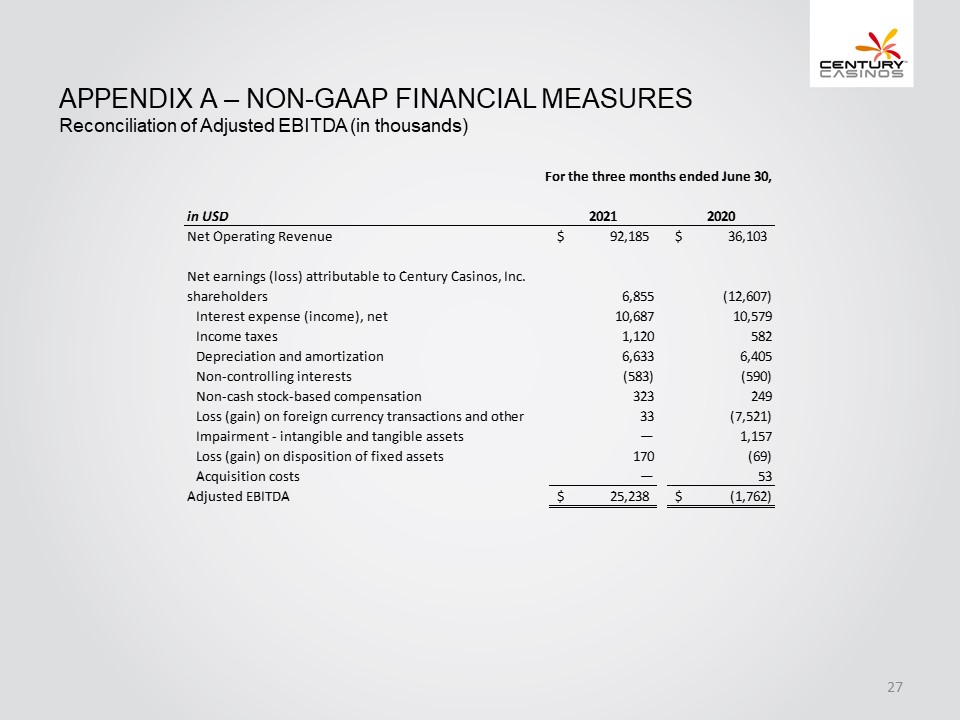
Appendix A – NON-GAAP FINANCIAL MEASURES Reconciliation of Adjusted EBITDA (in thousands) For the three months ended June 30, in USD 2021 2020 Net Operating Revenue $ 92,185 $ 36,103 Net earnings (loss) attributable to Century Casinos, Inc. shareholders 6,855 (12,607) Interest expense (income), net 10,687 10,579 Income taxes 1,120 582 Depreciation and amortization 6,633 6,405 Non-controlling interests (583) (590) Non-cash stock-based compensation 323 249 Loss (gain) on foreign currency transactions and other 33 (7,521) Impairment - intangible and tangible assets — 1,157 Loss (gain) on disposition of fixed assets 170 (69) Acquisition costs — 53 Adjusted EBITDA $ 25,238 $ (1,762) CENTURY CASINOS 27
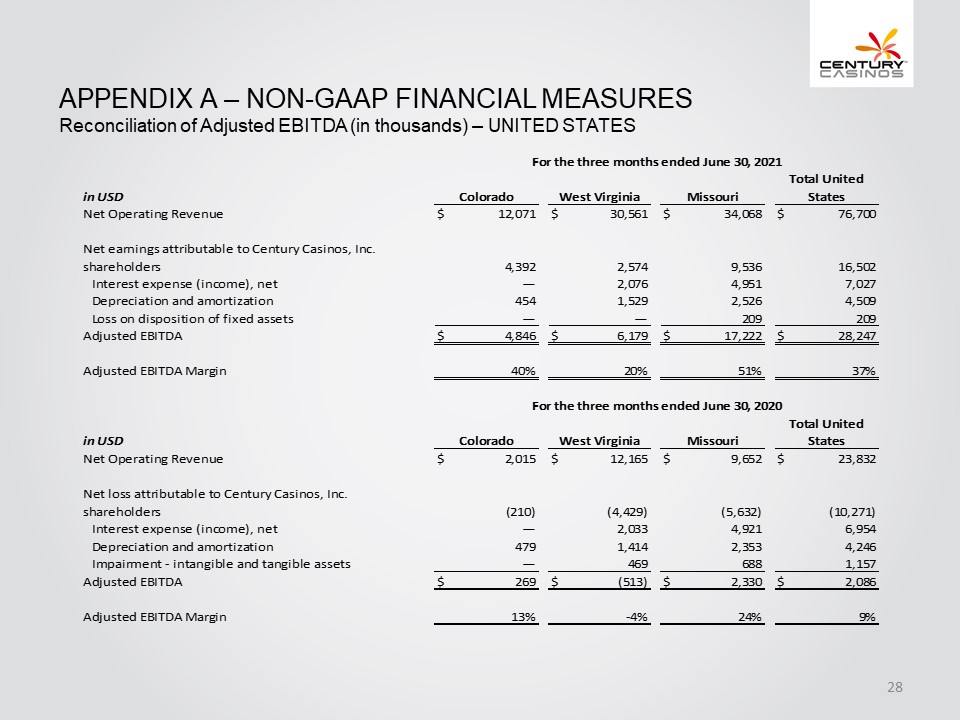
Appendix A – NON-GAAP FINANCIAL MEASURES Reconciliation of Adjusted EBITDA (in thousands) – UNITED STATES For the three months ended June 30, 2021 in USD Colorado West Virginia Missouri Total United States Net Operating Revenue $ 12,071 $ 30,561 $ 34,068 $ 76,700 Net earnings attributable to Century Casinos, Inc. shareholders 4,392 2,574 9,536 16,502 Interest expense (income), net — 2,076 4,951 7,027 Depreciation and amortization 454 1,529 2,526 4,509 Loss on disposition of fixed assets — — 209 209 Adjusted EBITDA $ 4,846 $ 6,179 $ 17,222 $ 28,247 Adjusted EBITDA Margin 40% 20% 51% 37% For the three months ended June 30, 2020 in USD Colorado West Virginia Missouri Total United States Net Operating Revenue $ 2,015 $ 12,165 $ 9,652 $ 23,832 Net loss attributable to Century Casinos, Inc. shareholders (210) (4,429) (5,632) (10,271) Interest expense (income), net — 2,033 4,921 6,954 Depreciation and amortization 479 1,414 2,353 4,246 Impairment - intangible and tangible assets — 469 688 1,157 Adjusted EBITDA $ 269 $ (513) $ 2,330 $ 2,086 Adjusted EBITDA Margin 13% -4% 24% 9% CENTURY CASINOS 28
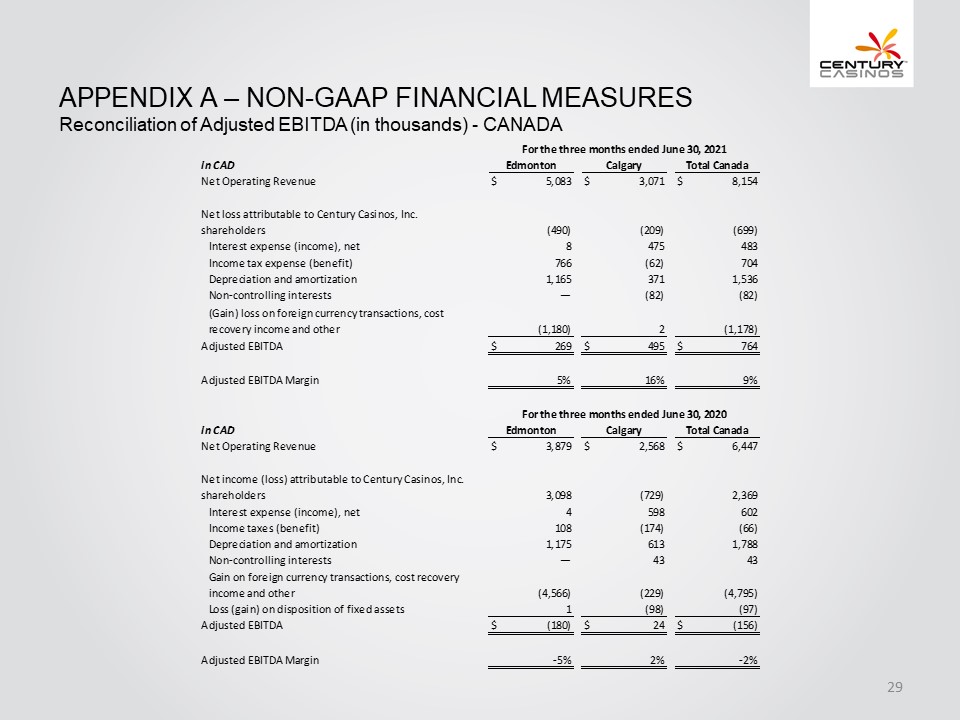
Appendix A – NON-GAAP FINANCIAL MEASURES Reconciliation of Adjusted EBITDA (in thousands) – CANADA For the three months ended June 30, 2021 in CAD Edmonton Calgary Total Canada Net Operating Revenue $ 5,083 $ 3,071 $ 8,154 Net loss attributable to Century Casinos, Inc. shareholders (490) (209) (699) Interest expense (income), net 8 475 483 Income tax expense (benefit) 766 (62) 704 Depreciation and amortization 1,165 371 1,536 Non-controlling interests — (82) (82) (Gain) loss on foreign currency transactions, cost recovery income and other (1,180) 2 (1,178) Adjusted EBITDA $ 269 $ 495 $ 764 Adjusted EBITDA Margin 5% 16% 9% For the three months ended June 30, 2020 in CAD Edmonton Calgary Total Canada Net Operating Revenue $ 3,879 $ 2,568 $ 6,447 Net income (loss) attributable to Century Casinos, Inc. shareholders 3,098 (729) 2,369 Interest expense (income), net 4 598 602 Income taxes (benefit) 108 (174) (66) Depreciation and amortization 1,175 613 1,788 Non-controlling interests — 43 43 Gain on foreign currency transactions, cost recovery income and other (4,566) (229) (4,795) Loss (gain) on disposition of fixed assets 1 (98) (97) Adjusted EBITDA $ (180) $ 24 $ (156) Adjusted EBITDA Margin -5% 2% -2% CENTURY CASINOS 29
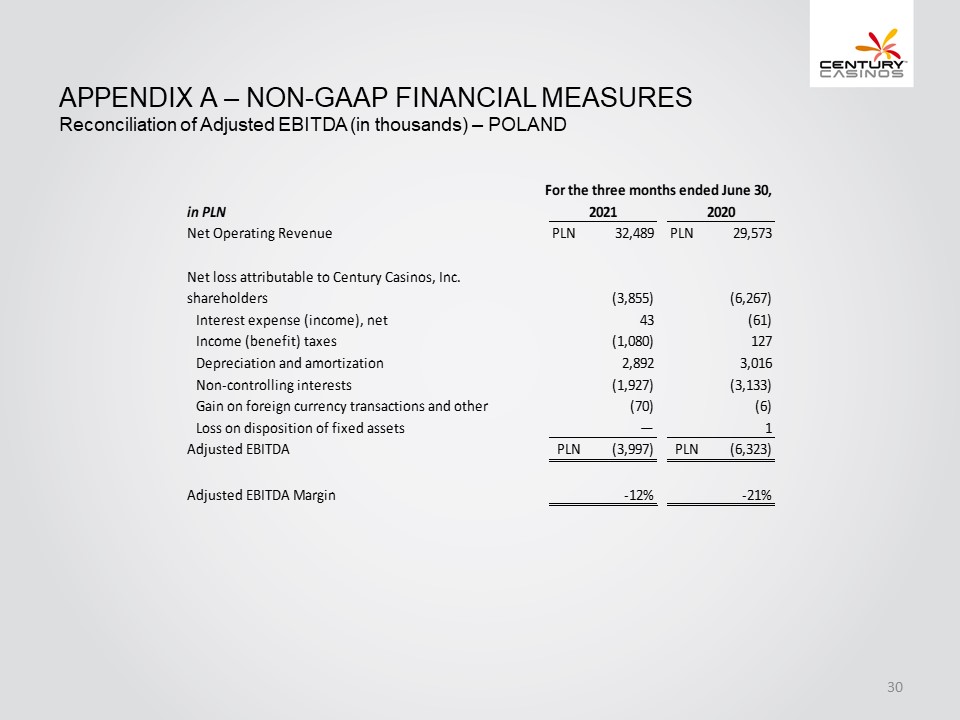
Appendix A – NON-GAAP FINANCIAL MEASURES Reconciliation of Adjusted EBITDA (in thousands) – POLAND For the three months ended June 30, in PLN 2021 2020 Net Operating Revenue PLN 32,489 PLN 29,573 Net loss attributable to Century Casinos, Inc. shareholders (3,855) (6,267) Interest expense (income), net 43 (61) Income (benefit) taxes (1,080) 127 Depreciation and amortization 2,892 3,016 Non-controlling interests (1,927) (3,133) Gain on foreign currency transactions and other (70) (6) Loss on disposition of fixed assets — 1 Adjusted EBITDA PLN (3,997) PLN (6,323) Adjusted EBITDA Margin -12% -21% CENTURY CASINOS 30
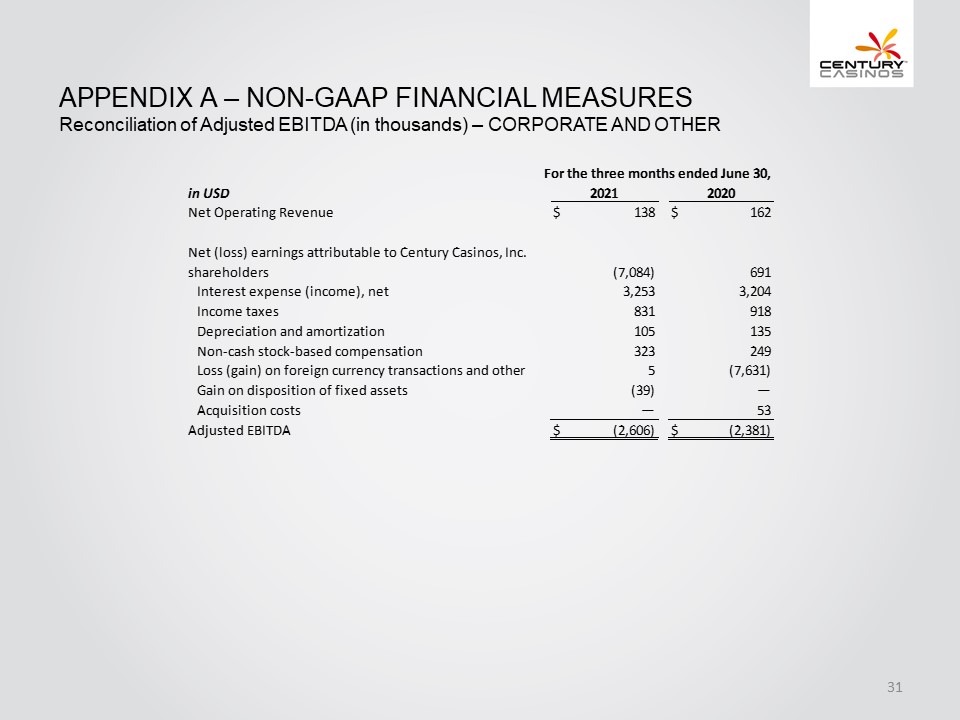
Appendix A – NON-GAAP FINANCIAL MEASURES Reconciliation of Adjusted EBITDA (in thousands) – CORPORATE AND OTHER For the three months ended June 30, in USD 2021 2020 Net Operating Revenue $ 138 $ 162 Net (loss) earnings attributable to Century Casinos, Inc. shareholders (7,084) 691 Interest expense (income), net 3,253 3,204 Income taxes 831 918 Depreciation and amortization 105 135 Non-cash stock-based compensation 323 249 Loss (gain) on foreign currency transactions and other 5 (7,631) Gain on disposition of fixed assets (39) — Acquisition costs — 53 Adjusted EBITDA $ (2,606) $ (2,381) CENTURY CASINOS 31
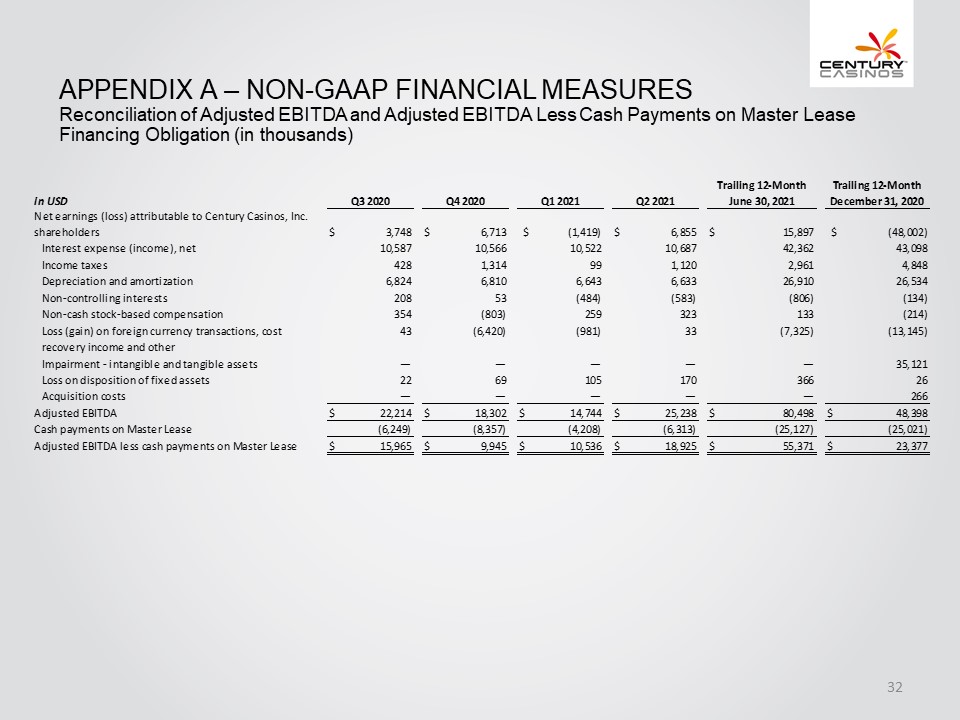
Appendix A – NON-GAAP FINANCIAL MEASURES Reconciliation of Adjusted EBITDA and Adjusted EBITDA Less Cash Payments on Master Lease Financing Obligation (in thousands) in USD Q3 2020 Q4 2020 Q1 2021 Q2 2021 Trailing 12-Month June 30, 2021 Trailing 12-Month December 31, 2020 Net earnings (loss) attributable to Century Casinos, Inc. shareholders $ 3,748 $ 6,713 $ (1,419) $ 6,855 $ 15,897 $ (48,002) Interest expense (income), net 10,587 10,566 10,522 10,687 42,362 43,098 Income taxes 428 1,314 99 1,120 2,961 4,848 Depreciation and amortization 6,824 6,810 6,643 6,633 26,910 26,534 Non-controlling interests 208 53 (484) (583) (806) (134) Non-cash stock-based compensation 354 (803) 259 323 133 (214) Loss (gai n) on foreign currency transactions, cost 43 (6,420) (981) 33 (7,325) (13,145) recovery income and other Impairment - intangible and tangible assets — — — — — 35,121 Loss on disposition of fixed assets 22 69 105 170 366 26 Acquisition costs — — — — — 266 Adjusted EBITDA $ 22,214 $ 18,302 $ 14,744 $ 25,238 $ 80,498 $ 48,398 Cash payments on Master Lease (6,249) (8,357) (4,208) (6,313) (25,127) (25,021) Adjusted EBITDA less cash payments on Master Lease $ 15,965 $ 9,945 $ 10,536 $ 18,925 $ 55,371 $ 23,377 CENTURY CASINOS 32
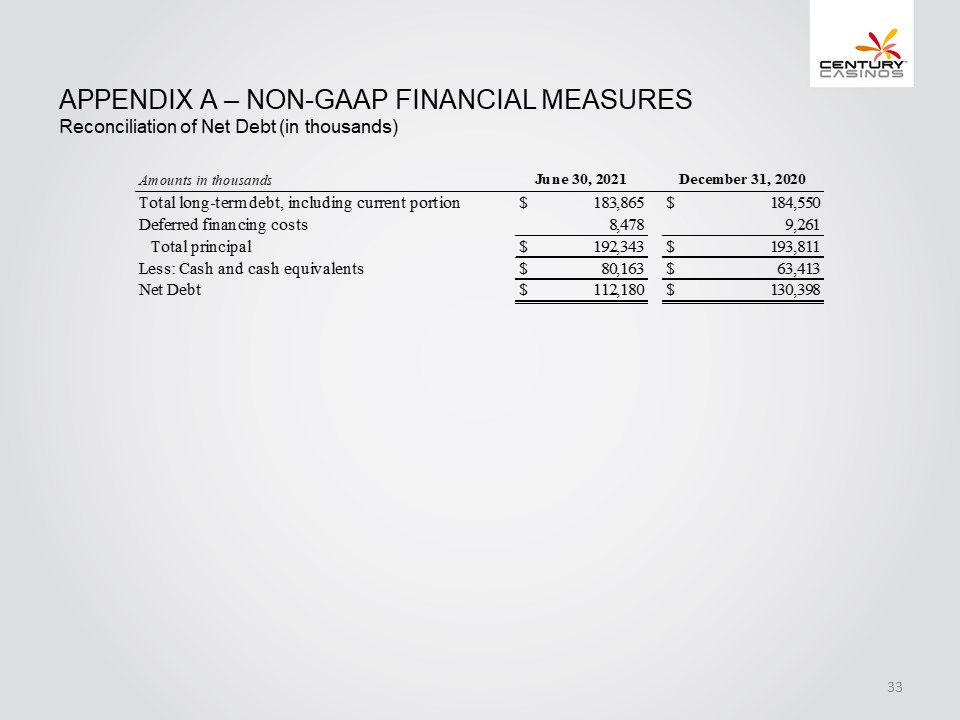
Appendix A – NON-GAAP FINANCIAL MEASURES Reconciliation of Net Debt (in thousands) Amounts in thousands June 30, 2021 December 31,2020 Total long-term debt, including current portion $ 183,865 $ 184,550 Deferred financing costs 8,478 9,261 Total principal $ 192,343 $ 193,811 Less: Cash and cash equivalents $ 80,163 $ 63,413 Net Debt $ 112,180 $ 130,398 CENTURY CASINOS 33