Attached files
| file | filename |
|---|---|
| 8-K - FORM 8-K - PennyMac Financial Services, Inc. | tm2124224d1_8k.htm |
| EX-99.1 - EXHIBIT 99.1 - PennyMac Financial Services, Inc. | tm2124224d1_ex99-1.htm |
| EX-10.5 - EXHIBIT 10.5 - PennyMac Financial Services, Inc. | tm2124224d1_ex10-5.htm |
| EX-10.4 - EXHIBIT 10.4 - PennyMac Financial Services, Inc. | tm2124224d1_ex10-4.htm |
| EX-10.3 - EXHIBIT 10.3 - PennyMac Financial Services, Inc. | tm2124224d1_ex10-3.htm |
| EX-10.2 - EXHIBIT 10.2 - PennyMac Financial Services, Inc. | tm2124224d1_ex10-2.htm |
| EX-10.1 - EXHIBIT 10.1 - PennyMac Financial Services, Inc. | tm2124224d1_ex10-1.htm |
Exhibit 99.2

PENNYMAC FINANCIAL SERVICES, INC. 2Q21 EARNINGS REPORT August 2021

2 This presentation contains forward - looking statements within the meaning of Section 21E of the Securities Exchange Act of 1934, as amended, regarding management’s beliefs, estimates, projections and assumptions with respect to, among other things, the Company’s financial results, future operations, business plans and inves tme nt strategies, as well as industry and market conditions, all of which are subject to change. Words like “believe,” “expect,” “anticipate,” “promise,” “project,” “plan,” and other expressions or words of simi lar meanings, as well as future or conditional verbs such as “will,” “would,” “should,” “could,” or “may” are generally intended to identify forward - looking statements. Actual results and operations for any future pe riod may vary materially from those projected herein and from past results discussed herein. These forward - looking statements include, but are not limited to, statements regarding the future impact of th e COVID - 19 pandemic on our business; future loan origination, servicing and production; future loan delinquencies, forbearances and servicing advances; future early buyout activity; elimination of the FHF A’s adverse market refinance fee and other business and financial expectations. Factors which could cause actual results to differ materially from historical results or those anticipated include, but are n ot limited to: our exposure to risks of loss and disruptions in operations resulting from adverse weather conditions, man - made or natural disasters, climate change and pandemics such as COVID - 19; failure to modify, res ell or refinance early buyout loans; the continually changing federal, state and local laws and regulations applicable to the highly regulated industry in which we operate; lawsuits or governmental actions tha t may result from any noncompliance with the laws and regulations applicable to our businesses; elimination of the FHFA’s adverse market refinance fee; the mortgage lending and servicing - related regulations p romulgated by the Consumer Financial Protection Bureau and its enforcement of these regulations; our dependence on U.S. government - sponsored entities and changes in their current roles or their guarantees o r guidelines; changes to government mortgage modification programs; the licensing and operational requirements of states and other jurisdictions applicable to the Company’s businesses, to which our ba nk competitors are not subject; foreclosure delays and changes in foreclosure practices; changes in macroeconomic and U.S. real estate market conditions; difficulties inherent in growing loan production vol ume; difficulties inherent in adjusting the size of our operations to reflect changes in business levels; purchase opportunities for mortgage servicing rights and our success in winning bids; changes in prevaili ng interest rates; our substantial amount of indebtedness; expected discontinuation of LIBOR; increases in loan delinquencies and defaults; our reliance on PennyMac Mortgage Investment Trust (NYSE: PMT) as a significant source of financing for, and revenue related to, our mortgage banking business; maintaining sufficient capital and liquidity to support business growth including compliance with financial covenan ts; our obligation to indemnify third - party purchasers or repurchase loans if loans that we originate, acquire, service or assist in the fulfillment of, fail to meet certain criteria or characteristics or under oth er circumstances; our obligation to indemnify PMT if our services fail to meet certain criteria or characteristics or under other circumstances; decreases in the returns on the assets that we select and manage for our cli ent s, and our resulting management and incentive fees; the extensive amount of regulation applicable to our investment management segment; conflicts of interest in allocating our services and investment o ppo rtunities among us and our advised entities; the effect of public opinion on our reputation; our recent growth; our ability to effectively identify, manage, monitor and mitigate financial risks; our initiat ion or expansion of new business activities or strategies; our ability to detect misconduct and fraud; our ability to mitigate cybersecurity risks and cyber incidents; our ability to pay dividends to our stockholders; an d our organizational structure and certain requirements in our charter documents. You should not place undue reliance on any forward - looking statement and should consider all of the uncertainties and risks desc ribed above, as well as those more fully discussed in reports and other documents filed by the Company with the Securities and Exchange Commission from time to time. The Company undertakes no oblig ati on to publicly update or revise any forward - looking statements or any other information contained herein, and the statements made in this presentation are current as of the date of this presentat ion only. This presentation contains financial information calculated other than in accordance with U.S. generally accepted accounting princ ipl es (“GAAP”), such as pretax income excluding valuation - related items that provide a meaningful perspective on the Company’s business results since the Company utilizes this information to evaluate an d m anage the business. Non - GAAP disclosure has limitations as an analytical tool and should not be viewed as a substitute for financial information determined in accordance with GAAP. FORWARD - LOOKING STATEMENTS

3 • Net income was $ 204.2 million, or diluted earnings per share (EPS) of $ 2.94 ; annualized return on average common stockholders’ equity of 23% – Earnings reflect continued strong production and core servicing results partially offset by net MSR fair value declines – Repurchased 2.6 million shares of PFSI’s common stock at a cost of $154.9 million; also repurchased an additional 2.5 million shares in July at a cost of $151.4 million – PFSI’s Board of Directors approved an increase to its stock repurchase authorization from $1.0 billion to $2.0 billion of outstandin g c ommon stock – B ook value per share increased 5 % to $54.49 from $51.78 at March 31, 2021 – PFSI’s Board of Directors declared a second quarter cash dividend of $0.20 per share, payable on August 26, 2021, to common stockholders of record as of August 16, 2021 • Production segment pretax income of $ 244.4 million, down 33% from 1Q21 and 55% from 2Q20 primarily as a result of lower industry margins – Consumer direct lock volume was a record $14.1 billion in unpaid principal balance (UPB), up 5% from 1Q21 and up 58% from 2Q20 – Broker direct lock volume was $4.5 billion in UPB, down 21% from 1Q21 and up 10 % from 2Q20 – Government correspondent lock volume was $15.7 billion in UPB, down 8% from 1Q21 and up 21 % from 2Q20 – Total loan acquisitions and originations were $61.3 billion in UPB, down 8 % from 1Q21 and up 63 % from 2Q20 – Correspondent acquisitions of conventional loans fulfilled for PennyMac Mortgage Investment Trust (NYSE: PMT) were $30.5 bill ion in UPB, down 10 % from 1Q21 and up 61 % from 2Q20 SECOND QUARTER HIGHLIGHTS

4 • Servicing segment pretax income was $30.9 million, down from $141.7 million in 1Q21 and up from a pretax loss of $62.4 million in 2Q20 – Pretax income excluding valuation - related items was $174.4 million (1) , down 33% from 1Q21 driven by decreased income from loss mitigation activity related to COVID - 19 – Sold $3.4 billion in UPB of early buyout (EBO) loans to third - party, whole loan investors – $250.6 million in MSR fair value losses primarily driven by increased expectations for prepayment activity in the future from lo wer mortgage rates and a flatter yield curve combined with significant levels of prepayment activity and early buyouts, partially offset by $91.1 mill ion in hedging gains o Net impact on pretax income was $(159.5) million and on EPS was $(1.69) – Servicing portfolio grew to $ 473.2 billion in UPB, up 5% from March 31, 2021 and 22% from June 30, 2020, driven by strong production volumes which offset elevated prepayment activity • Investment Management segment pretax income was $4.1 million, up from $1.4 million in 1Q21 as a result of incentive fees earned and down from $4.7 million in 2Q20 – Net assets under management (AUM) were $ 2.3 billion , down slightly from March 31, 2021, and up 5% from June 30, 2020 SECOND QUARTER HIGHLIGHTS (CONTINUED) (1) Excludes $250.6 million in MSR fair value losses, $91.1 million in hedging gains and a $16.0 million reversal related to provisions for losses on active loans. See slide 13 for additional details.

5 0.0% 1.0% 2.0% 3.0% 4.0% 5.0% Average 30-year fixed rate mortgage Primary/secondary spread ORIGINATION MARKET REMAINS HISTORICALLY STRONG • Economic forecasts for 2021 total originations range from $3.6 to $4.2 trillion driven by the continuation of low mortgage rates ‒ Purchase originations are expected to total $1.7 and $1.9 trillion in 2021 and 2022, respectively , higher than 2020 levels • Economic forecasts for 2022 total originations average $ 2.7 trillion, a strong market by historical standards, supported by a strong purchase market • FHFA’s elimination of the Adverse Market Refinance Fee is expected to increase the population of loans currently eligible for re finance (1) Actual originations: Inside Mortgage Finance. Total originations forecast: Average of Mortgage Bankers Association (7/21/21), Fannie Mae (7/12/21), and Freddie Mac (7/15/21) forecasts. (2) Freddie Mac Primary Mortgage Market Survey. 2.80% as of 7/29/21 (3) Bloomberg: Difference between Freddie Mac Primary Mortgage Market Survey and the 30 - Year Fannie Mae or Freddie Mac Par Coupon ( MTGEFNCL) Index ($ in trillions) (2) (3) U.S. Mortgage Origination Market (1) Mortgage Rates Remain Historically Low $1.3 $1.5 $1.7 $1.9 $1.1 $2.6 $2.2 $0.9 $2.3 $4.1 $3.9 $2.7 2019 2020 2021E 2022E Purchase Refinance

6 DIRECT LENDING AND SERVICING ARE DRIVING PFSI’S PROFITABILITY ($ in millions) ($ in millions) (1) Valuation - related changes include MSR fair value changes before recognition of realization of cash flows, related hedging and o ther gains (losses), and provision for losses on active loans considered in the assessment of MSR fair value changes – see slide 13. (2) See slide 20 (1) • Our consumer direct lending channel remains a significant contributor to PFSI’s sustained profitability despite margins that have declined from record levels • Servicing income reflects growing portfolio, economies of scale and loss mitigation activities Production Pretax Income Servicing Pretax Income For the remainder of 2021, we expect PFSI’s return on equity to remain near our pre - COVID historical returns (2) ($62) $142 $31 $87 $258 $174 2Q20 1Q21 2Q21 Pretax income Pretax income excluding valuation-related changes $538 $363 $244 2Q20 1Q21 2Q21 Estimated contribution from direct lending (CDL & BDL)

7 0.3% 1.1% 2.2% 2.5% 2017 2018 2019 2020 1H21 N/A 2.3% 2.8% 3.4% 3.7% 4.0% 12/31/17 12/31/18 12/31/19 12/31/20 6/30/21 PENNYMAC CONTINUES TO DRIVE TOWARDS ITS MEDIUM - TERM GOALS Note: All figures are for PFSI and include volume fulfilled or subserviced for PMT (1) Historical market share estimates based on Inside Mortgage Finance. Inside Mortgage Finance estimates $2.585 trillion in tota l o rigination volume for 1H21. For 1H21, we estimate the correspondent channel represented 21% of the overall origination market, retail represented 65% and broker represented 14%. Loan servicing market share is based on PFSI’s servicing portfolio UPB of $ 473.1 billion divided by an estimated $ 11.7 trillion in mortgage debt outstanding as of March 31, 2021. Correspondent Market Share (1) Loan Servicing Market Share (1) Consumer Direct Market Share (1) Broker Direct Market Share (1) 10.5% 11.8% 14.9% 17.7% 18.0% 2017 2018 2019 2020 1H21 0.5% 0.5% 0.7% 0.9% 1.3% 2017 2018 2019 2020 1H21

8 $11.0 $17.4 $16.2 $18.9 $33.8 $30.5 $29.9 $51.2 $46.7 $37.7 $51.1 $46.0 2Q20 1Q21 2Q21 Government loans Conventional loans for PMT Total locks PRODUCTION SEGMENT HIGHLIGHTS – VOLUME BY CHANNEL (1) (2) (3) Note: Figures may not sum due to rounding ( 1 ) For government - insured loans, PFSI earns income from holding and selling or securitizing the loans (2) For conventional and jumbo loans, PFSI earns a fulfillment fee from PMT rather than income from holding and selling or securi tiz ing the loans ( 3) Includes locks related to PMT loan acquisitions, including conventional loans for which PFSI earns a fulfillment fee upon loa n funding (4) Commitments to originate mortgage loans at specified terms at period end Correspondent Consumer Direct Broker Direct (UPB in billions) (UPB in billions) (UPB in billions) July 2021 July 2021 July 2021 $2.6 $6.0 $5.7 $2.5 $4.6 $5.0 $5.1 $10.7 $10.7 $8.9 $13.4 $14.1 2Q20 1Q21 2Q21 Government loans Conventional loans Total locks $0.5 $1.2 $0.7 $2.1 $4.0 $3.2 $2.6 $5.1 $4.0 $4.1 $5.7 $4.5 2Q20 1Q21 2Q21 Government loans Conventional loans Total locks Locks: (UPB in billions) $12.8 Locks: (UPB in billions) $5.5 Locks: (UPB in billions) $1.7 Acquisitions: (UPB in billions) $15.0 Originations: (UPB in billions) $3.5 Originations: (UPB in billions) $1.2 Committed pipeline (4) : (UPB in billions) $7.2 Committed pipeline (4) : (UPB in billions) $1.9
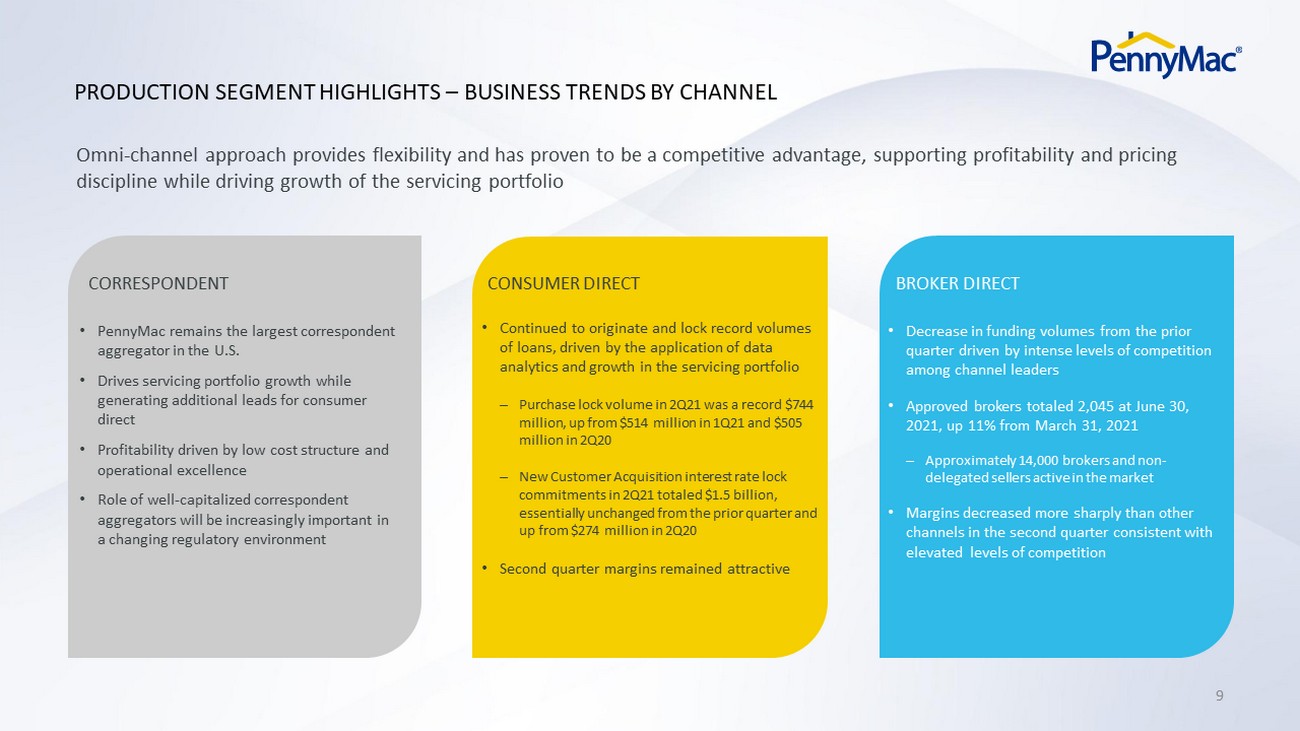
9 PRODUCTION SEGMENT HIGHLIGHTS – BUSINESS TRENDS BY CHANNEL • PennyMac remains the largest correspondent aggregator in the U.S. • Drives servicing portfolio growth while generating additional leads for consumer direct • Profitability driven by low cost structure and operational excellence • Role of well - capitalized correspondent aggregators will be increasingly important in a changing regulatory environment • Continued to originate and lock record volumes of loans, driven by the application of data analytics and growth in the servicing portfolio ‒ Purchase lock volume in 2Q21 was a record $744 million, up from $514 million in 1Q21 and $505 million in 2Q20 ‒ New Customer Acquisition interest rate lock commitments in 2Q21 totaled $1.5 billion, essentially unchanged from the prior quarter and up from $274 million in 2 Q20 • Second quarter margins remained attractive • Decrease in funding volumes from the prior quarter driven by intense levels of competition among channel leaders • Approved brokers totaled 2,045 at June 30, 2021, up 11% from March 31, 2021 ‒ Approximately 14,000 brokers and non - delegated sellers active in the market • Margins decreased more sharply than other channels in the second quarter consistent with elevated levels of competition CORRESPONDENT CONSUMER DIRECT BROKER DIRECT Omni - channel approach provides flexibility and has proven to be a competitive advantage, supporting profitability and pricing discipline while driving growth of the servicing portfolio

10 DRIVERS OF PRODUCTION SEGMENT PROFITABILITY (1) Expected revenue net of direct origination costs at time of lock (2) Reflects hedging, pricing and execution changes, timing of revenue recognition, and other items (3) Costs are fully allocated Production expenses net of Loan origination expense • Direct lending channels (consumer and broker direct) have outsized impact on Production earnings – represented 23% of fallout ad justed lock volume in 2Q21, but approximately 70% of segment pretax income • Production revenue margins across all channels declined – revenue per fallout adjusted lock for PFSI’s own account was 154 basis points in 2Q21, down from 176 basis points in 1Q21; impact on profitability mitigated by the larger proportion of loans originated in the consumer direct channel • Costs (3 ) vary by channel – range from approximately 15 basis points in correspondent to 150 basis points in consumer direct; as the mix shift towards direct lending continues, production expenses as a percentage of fallout adjusted locks are expected to trend higher 2Q20 1Q21 2 Q21 Fallout Adjusted Locks Margin / Fulfillment Fee (bps) (1) Revenue Contribution (net of Loan origination expense) % of Production Revenue Fallout Adjusted Locks Margin / Fulfillment Fee (bps) (1) Revenue Contribution (net of Loan origination expense) % of Production Revenue Fallout Adjusted Locks Margin / Fulfillment Fee (bps) (1) Revenue Contribution (net of Loan origination expense) % of Production Revenue Government Correspondent 11,757$ 163 191.6$ 28% 16,073$ 37 60.1$ 10% 15,022$ 30 45.1$ 9% Consumer Direct 5,637 575 324.1 47% 9,362 477 446.3 76% 9,713 343 333.1 68% Broker Direct 3,073 304 93.4 14% 4,413 140 61.6 11% 3,560 71 25.4 5% Other (2) n/a n/a 25.5 4% n/a n/a (43.4) -7% n/a n/a 32.8 7% Total PFSI account revenues (net of Loan origination expense) 20,467$ 310 634.7$ 92% 29,849$ 176 524.7$ 90% 28,296$ 154 436.5$ 89% PMT Conventional Correspondent 22,324 24 52.8 8% 31,626 19 60.8 10% 29,279 18 54.0 11% Total Production revenues (net of Loan origination expense) 161 687.5$ 100% 95 585.5$ 100% 85 490.5$ 100% Production expenses (less Loan origination expense) 35 149.4$ 22% 36 222.6$ 38% 43 246.0$ 50% Production segment pretax income 126 538.1$ 78% 59 362.9$ 62% 42 244.4$ 50% 57,575$ 61,475$ 42,790$

11 1Q21 2Q21 Loans serviced (in thousands) 1,998 2,058 60+ day delinquency rate - owned portfolio (1) 8.6% 6.7% 60+ day delinquency rate - sub-serviced portfolio (2) 2.1% 1.6% Actual CPR - owned portfolio (1) 32.6% 28.3% Actual CPR - sub-serviced (2) 35.1% 24.7% UPB of completed modifications ($ in millions) (3) $5,464 $5,487 EBO loan volume ($ in millions) (4) $4,159 $6,776 Selected Operational Metrics $448.8 $473.2 ($36.9) $61.3 At 3/31/21 Runoff Additions from loan production At 6/30/21 (1) CPR = Conditional Prepayment Rate. Owned portfolio is predominantly government - insured and guaranteed loans under the FHA (49%), VA (29%), and USDA (12%) programs. Delinquency data b ased on loan count (i.e., not UPB). (2) Represents PMT’s MSRs. Excludes distressed loan investments (3) UPB of completed modifications includes loss mitigation efforts associated with partial claims programs (4) Early buyouts of delinquent loans from Ginnie Mae pools during the period (5) Also includes loans servicing released in connection with any asset sales by PMT (6) Includes consumer direct production, government correspondent acquisitions, and conventional conforming and jumbo loan acquis it ions subserviced for PMT SERVICING SEGMENT HIGHLIGHTS • Servicing portfolio totaled $473.2 billion in UPB at June 30, 2021, up 5 % Q/Q and 22% Y/Y • Strong production volumes led to continued portfolio growth despite elevated prepayment activity • Decrease in delinquency rates as borrowers continue to emerge from forbearance plans with the successful implementation of loss mitigation activities • Increase in EBO loan volume as a result of additional partner relationships – see slide 12 (5) (6) Loan Servicing Portfolio Composition Net Portfolio Growth (UPB in billions) (UPB in billions) $388.3 $448.8 $473.2 6/30/20 3/31/21 6/30/21 Prime owned Prime subserviced and other

12 ENHANCEMENTS • Buyout volume increased to $6.8 billion in UPB in 2Q21 versus $4.2 billion in 1Q21 • The UPB of government - insured EBOs serviced for third - party investors totaled $6.1 billion at June 30, up from $3.2 billion at March 31, 2021 • Provides meaningful savings over the life of the loans and the opportunity for redelivery in the future • Lower capital utilization and margin call risk compared to holding EBOs in inventory • Removes the obligation to remit advances of scheduled principal and interest to Ginnie Mae for delinquent government - insured loans • PennyMac retains the servicing rights with an option to repurchase the loans in the event they become eligible for redelivery into Ginnie Mae securities • PFSI has had a program in place for several years to buy delinquent Ginnie Mae loans out of securitizations and simultaneously sell them to third - party EBO loan investors • PFSI increased the volumes of EBO sales to existing and new partners in the second quarter IMPACT BENEFITS DETAILS AND BENEFITS OF PFSI’S SALE OF DELINQUENT GOVERNMENT - INSURED LOANS

13 (1) Of average portfolio UPB, annualized (2 ) Comprised of net gains on mortgage loans held for sale at fair value and net interest income related to EBO loans (3) Consists of interest shortfall and recording and release fees (4) Changes in fair value do not include realization of MSR cash flows, which are included in a mortization and realization of MSR cash flows above (5) Includes fair value changes and provision for impairment (6) Considered in the assessment of MSR fair value changes SERVICING PROFITABILITY EXCLUDING VALUATION - RELATED CHANGES • EBO loan related revenue decreased $76 million driven by lower gains recognized from EBO - related activities • Operating revenue decreased $2.0 million Q/Q primarily driven by declines in earnings on custodial balances; operating expens es also decreased slightly as the prior quarter included seasonal accruals of compensation - related expenses • Payoff - related expense from prepayments remains elevated but decreased slightly Q/Q • Valuation - related changes include $16 million of reversals related to provisions for losses on active loans $ in millions basis points (1) $ in millions basis points (1) $ in millions basis points (1) Operating revenue 257.2$ 26.6 266.7$ 24.4 264.7$ 22.9 Realization of MSR cash flows (97.4) (10.1) (82.7) (7.6) (85.7) (7.4) EBO loan-related revenue (2) 75.9 7.9 283.7 25.9 208.0 18.0 Servicing expenses: Operating expenses (85.9) (8.9) (109.5) (10.0) (107.9) (9.3) Payoff-related expense (3) (25.1) (2.6) (43.7) (4.0) (42.9) (3.7) Losses and provisions for defaulted loans (12.3) (1.3) (9.4) (0.9) (16.5) (1.4) EBO loan transaction-related expense (6.2) (0.6) (8.0) (0.7) (10.3) (0.9) Financing expenses: Interest on ESS (2.4) (0.2) (1.3) (0.1) - 0.0 Interest to third parties (16.8) (1.7) (37.4) (3.4) (35.1) (3.0) Pretax income excluding valuation-related changes 86.9$ 9.0 258.4$ 23.6 174.4$ 15.1 Valuation-related changes (4) MSR fair value (5) (108.4) 306.1 (250.6) ESS liability fair value 0.6 (1.0) - Hedging derivatives gains (losses) (15.8) (442.2) 91.1 Provision for losses on active loans (6) (25.8) 20.4 16.0 Servicing segment pretax income (62.4)$ 141.7$ 30.9$ Average servicing portfolio UPB 386,456$ 437,826$ 461,499$ 2Q211Q212Q20

14 ($108.4) $306.1 ($250.6) ($15.1) ($443.2) $91.1 $538.0 $362.9 $244.4 2Q20 1Q21 2Q21 MSR fair value change before recognition of realization of cash flows Hedging and related gains (declines) Production pretax income HEDGING APPROACH CONTINUES TO MODERATE THE VOLATILITY OF PFSI’S RESULTS • PFSI seeks to moderate the impact of interest rate changes on the fair value of its MSR asset through a comprehensive hedge strategy that also considers production - related income • In 2Q21, MSR fair value decreased $251 million – $196 million in fair value losses as a result of higher expectations for prepayment activity in the future driven by lower mortgage rates and a flatter yield curve – $55 million in other valuation declines, primarily driven by significant levels of prepayment activity and early buyouts • MSR fair value losses partially offset by hedging and related gains of $91 million MSR Valuation Changes and Offsets ($ in millions)

15 Beginning period forbearance TRENDS IN DELINQUENCIES, FORBEARANCE AND LOSS MITIGATION • In PFSI’s predominately government MSR portfolio, approximately 249,000 borrowers have been enrolled in a forbearance plan related to COVID - 19 since the enactment of the CARES Act – Through June 30, approximately 185,000 borrowers have exited or are in the process of exiting their forbearance plan including those borrowers that have paid - in - full • Servicing advances outstanding decreased to approximately $424 million at June 30, 2021 from $437 million at March 31, 2021 – Advances are expected to increase over the next few quarters as many property tax payments become due toward the end of the calendar year – No P&I advances are outstanding, as prepayment activity continues to sufficiently cover remittance obligations • Of the 0.8% reduction in forbearance related to re - performance – 0.3% were forbearances that remained current or went delinquent and subsequently became current – 0.5% were FHA Partial Claims or completed modifications • Elevated EBO activity is expected to continue in 2021 Note: Figures may not sum due to rounding (1) Owned MSR portfolio. Delinquency and forbearance data based on loan count (i.e. not UPB). As of 6/30/21, 30+ day delinquency units amounted to 115,860, forbearance units amounted to 63,829, total portfolio units were 1,294,030, and portfolio UPB was $270 billion. (2) Forbearance outcomes based on loan count as a percentage of beginning period loans in forbearance. 30+ Day Delinquency Rate and Forbearance Trend (1) Forbearance Outcomes (2) Ending period forbearance 4.9% 6.3% 0.8% 0.9% 0.2% 0.0% 4.4% 0.6% 3/31/21 Re- performing Active Loss Mitigation Paid- in-full 30+ DQ not in forbearance Extended New forbearances 6/30/21 6.4% 12.4% 10.1% 7.8% 6.3% 4.9% 7.2% 15.1% 14.1% 12.6% 10.2% 9.0% 3/31/20 6/30/20 9/30/20 12/31/20 3/31/21 6/30/21 Forbearance Rate 30+ Day Delinquency Rate

16 INVESTMENT MANAGEMENT SEGMENT HIGHLIGHTS • Net AUM as of June 30, 2021 were $2.3 billion, down slightly from March 31, 2021, and up 5% from June 30, 2020 • Investment M anagement segment revenues were $ 13.5 million, up 41% from 1Q21 and 28% from 2Q20 ‒ PMT’s strong performance over the last four quarters resulted in $3.3 million of performance - based incentive fees $9.9 Investment Management Revenues ($ in millions) Investment Management AUM ($ in b illions) $10.2 $3.3 $10.5 $9.6 $13.5 2Q20 1Q21 2Q21 Base management fees & other revenue Performance incentive $2.2 $2.4 $2.3 6/30/20 3/31/21 6/30/21

APPENDIX

18 $197 billion in 2020 $ 473 billion outstanding IN SER VIC ING (1) YEARS FOR PFSI AS A PUBLIC COMPANY 8 14 YEARS OF OPERATIONS PMT # 2 • CORRESPONDENT PRODUCTION • CONSUMER DIRECT • BROKER DIRECT IN PRODUCTION (1) IS A LEADING RESIDENTIAL MORTGAGE REIT PENNYMAC IS AN ESTABLISHED LEADER IN THE U.S. MORTGAGE MARKET WITH SUBSTANTIAL GROWTH POTENTIAL # 6 Note: All figures are for PFSI and include volume fulfilled or subserviced for PMT. All figures are as of 6/30/21. (1) Inside Mortgage Finance for the year ended or as of 6/30/21 $ 2.3 billion in assets under management 12 - year track record 2+ million customers $ 128 billion in 1H21

19 OVERVIEW OF PENNYMAC FINANCIAL’S BUSINESSES LOAN PRODUCTION Correspondent aggregation of newly originated loans from third - party sellers - PFSI earns gains on delegated government - insured and non - delegated loans - Fulfillment fees for PMT’s delegated conventional loans Consumer direct origination of conventional and government - insured loans Broker direct origination launched in 2018 LOAN SERVICING Servicing for owned MSRs and subservicing for MSRs owned by PMT Major loan servicer for Fannie Mae, Freddie Mac and Ginnie Mae Industry - leading capabilities in special servicing Organic growth results from loan production, supplemented by MSR acquisitions and PMT investment activity INVESTMENT MANAGEMENT External manager of PMT, which invests in mortgage - related assets: - GSE credit risk transfer investments - MSR investments - Investments in prime non - agency MBS and asset - backed securities Synergistic partnership with PMT Complex and highly regulated mortgage industry requires effective governance, compliance and operating systems Operating platform has been developed organically and is highly scalable Commitment to strong corporate governance, compliance and risk management since inception PFSI is well positioned for continued growth in this market and regulatory environment

20 $1.8 $1.3 $1.7 $2.1 $1.8 $1.6 $2.3 $4.1 $3.9 2013 2014 2015 2016 2017 2018 2019 2020 2021E U.S. Origination Market (in trillions) 0.0% 1.0% 2.0% 3.0% 4.0% 10-Year Treasury Yield 11% 19% 20% 22% 26% 13% 22% 61% 33% 2013 2014 2015 2016 2017 2018 2019 2020 1H21 PFSI's Annualized Return on Average Common Stockholders' Equity (ROE) 48% 75% 64% 61% 73% 80% 63% 40% 40% 40% 58% 53% 49% 63% 71% 54% 36% 36% 2013 2014 2015 2016 2017 2018 2019 2020 1H21 PFSI Purchase Mix Industry Purchase Mix Average: 25% PFSI’S TRACK RECORD ACROSS VARIOUS MARKET ENVIRONMENTS IS UNIQUE AMONG INDEPENDENT MORTGAGE BANKS (1) (4) Proven ability to generate attractive ROEs… …across different market environments… …with a strong orientation towards purchase money mortgages. (1) Represents partial year. Initial Public Offering was May 8, 2013. (2) Bloomberg (3) Inside Mortgage Finance. Full year 2021 estimate is an average of Mortgage Bankers Association (7/21/21), Fannie Mae (7/12/21), and Freddie Mac (7/15/21) forecasts. (4) Inside Mortgage Finance for historical data. Industry purchase mix for 1H21 represents the average of Mortgage Bankers Association (7/21/21), Fannie Mae (7/12/21), and Freddie Mac (7/15/21) estimates. (2) (3) 1H2 1

21 2.0% 2.5% 3.0% 3.5% 4.0% 4.5% 5.0% 0.0% 1.0% 2.0% 3.0% 4.0% CURRENT MARKET ENVIRONMENT AND MACROECONOMIC TRENDS (1) Freddie Mac Primary Mortgage Market Survey. 2.80% as of 7/29/21 (2) U.S. Department of the Treasury. 1.22% as of 7/30/21 (3) 10 - year Treasury bond yield and 2/10 year Treasury yield spread: Bloomberg. Average 30 - year fixed rate mortgage: Freddie Mac Primary Mortgage Market Survey. Average secondary mortgage rate: 30 - Year FNCL Par Coupon Index (MTGEFNCL), Bloomberg. U.S. home price appreciation: S&P CoreLogic Case - Schiller U.S. National Home Price NSA Index (SPCSUSA). Data for 6/30/21 is as of 5/31/21. Residential mortgage originations are for the quarterly period ended. Source: Inside Mortgage Finance. Average 30 - year fixed rate mortgage (1) 10 - year Treasury Bond Yield (2) Macroeconomic Metrics (3) 3.02% 3.17% 1.47% 1.74% Footnotes 6/30/209/30/2012/31/203/31/216/30/21 10-year Treasury bond yield 0.7% 0.7% 0.9% 1.7% 1.5% 2/10 year Treasury yield spread 0.5% 0.6% 0.8% 1.6% 1.2% 30-year fixed rate mortgage 3.1% 2.9% 2.7% 3.2% 3.0% Secondary mortgage rate 1.6% 1.4% 1.3% 2.0% 1.9% U.S. home price appreciation (Y/Y % change) 4.4% 7.0% 10.4% 13.3% 16.6% Residential mortgage originations (in billions) $990 $1,155 $1,265 $1,305 $1,280

22 PFSI’s BALANCED BUSINESS MODEL IS A FLYWHEEL • Diversified business through correspondent, consumer direct and broker direct channels • Correspondent and broker direct channels in particular allow PFSI to access purchase - money volume • Lacks the fixed overhead of the traditional, retail origination model • Recurring fee income business captured over the life of the loan • In the event of higher interest rates, expected life of the loan increases resulting in a more valuable MSR asset • Creates a natural hedge to production income Customer base of over 2 million drives leads for consumer direct Large volumes of production grow servicing portfolio Loan Production 2 nd largest in the U.S. (1) Loan Servicing 6 th largest in the U.S. (1) (1) Inside Mortgage Finance for the year ended or as of March 31, 2021. Includes volume fulfilled or subserviced for PMT. In both businesses, scale and efficiency are critical for success

23 SIGNIFICANT TECHNOLOGY INVESTMENTS DRIVE GROWTH, EFFICIENCY AND SCALE Investments in technology, processes, and data management to - date have resulted in PennyMac’s integrated and scalable platform Invested $165 MILLION in transformational technology initiatives from 2018 through 2020; plan to invest an additional $140 MILLION in 2021 STATE - OF - THE - ART TECHNOLOGY combining PROPRIETARY and leading THIRD PARTY PLATFORMS Proven ability to INVEST IN TECHNOLOGY with MORTGAGE BANKING EXPERTISE Pricing & Loan Bidding Engine Workflows and processes Fulfillment SSE

24 PENNYMAC HAS DEVELOPED IN A SUSTAINABLE MANNER FOR LONG - TERM GROWTH 2008 2009 2010 2011 2012 2013 2014 2015 2016 2017 2018 2019 2020 2021 Operations launched; de novo build of legacy - free mortgage servicer Raised $500 million of capital in private opportunity funds PMT formed in an initial public offering raising $320 million Correspondent group established with a focus on operations development and process design Added servicing leadership for prime portfolio and to drive scalable growth Correspondent system launches Expanded infrastructure with flagship operations facility in Moorpark, CA Correspondent leadership team expands Expanded infrastructure in Tampa, FL Became largest non - bank correspondent aggregator PFSI completed initial public offering Expanded infrastructure in Fort Worth, TX Continued organic growth and servicing portfolio UPB reaches $100 billion (1) PFSI stockholders’ equity surpasses $1 billion Substantial growth in PFSI’s consumer direct capacity PFSI issued MSR - backed term notes PFSI launched broker - direct lending channel PFSI completes corporate reorganization Achieved position as the largest correspondent aggregator in the U.S. PFSI launched proprietary, cloud - based Servicing Systems Environment (SSE) Record production volumes across all channels; nearly $200 billion in UPB (1) PFSI issued inaugural unsecured Senior Notes of $650 million PFSI issued an additional $650 million of unsecured Senior Notes Servicing portfolio surpasses 2 million customers (1) • Disciplined growth to address the demands of the GSEs, Agencies, regulators and our financing partners ‒ Since inception, PennyMac has focused on building and testing processes and systems before adding significant transaction vol ume s • Highly experienced management team has created a robust corporate governance system centered on compliance, risk management a nd quality control (1) All figures are for PFSI and include volume fulfilled or subserviced for PMT.

25 Pool UPB $252,475 Coupon 3.3% Servicing fee/spread 0.34% Prepayment speed assumption (CPR) 10.5% Fair value $3,412.6 As a multiple of servicing fee 3.97 June 30, 2021 Unaudited ($ in millions) MSR ASSET VALUATION Mortgage Servicing Rights

26 ACQUISITIONS AND ORIGINATIONS BY PRODUCT First Lien Acquisitions/Originations Note: Figures may not sum exactly due to rounding Unaudited ($ in millions) 2Q20 3Q20 4Q20 1Q21 2Q21 Correspondent Acquisitions Conventional Conforming 18,900$ 27,351$ 37,986$ 33,762$ 30,479$ Government 10,991 16,977 18,923 17,440 16,175 Total 29,890$ 44,328$ 56,908$ 51,202$ 46,654$ Consumer Direct Originations Conventional Conforming 2,475$ 3,091$ 3,659$ 4,634$ 5,012$ Government 2,647 3,240 4,356 6,023 5,661 Total 5,122$ 6,331$ 8,015$ 10,657$ 10,672$ Broker Direct Originations Conventional Conforming 2,136$ 2,657$ 3,527$ 3,959$ 3,246$ Government 481 845 956 1,158 728 Total 2,617$ 3,502$ 4,484$ 5,117$ 3,974$ Total acquisitions/originations 37,630$ 54,161$ 69,407$ 66,976$ 61,300$ UPB of loans fulfilled for PMT (included in correspondent acquisitions) 18,900$ 27,351$ 37,986$ 33,762$ 30,479$

27 INTEREST RATE LOCKS BY PRODUCT First Lien Locks Note: Figures may not sum exactly due to rounding Unaudited ($ in millions) 2Q20 3Q20 4Q20 1Q21 2Q21 Correspondent Locks Conventional Conforming 24,804$ 34,363$ 39,451$ 33,998$ 30,332$ Government 12,920 20,167 19,728 17,064 15,657 Total 37,725$ 54,531$ 59,179$ 51,062$ 45,990$ Consumer Direct Locks Conventional Conforming 4,666$ 5,699$ 5,711$ 6,337$ 7,486$ Government 4,281 5,207 7,126 7,047 6,621 Total 8,947$ 10,906$ 12,837$ 13,384$ 14,108$ Broker Direct Locks Conventional Conforming 3,229$ 4,236$ 4,375$ 4,634$ 3,387$ Government 868 1,256 1,341 1,036 1,119 Total 4,097$ 5,492$ 5,716$ 5,671$ 4,503$ Total locks 50,769$ 70,928$ 77,731$ 70,117$ 64,600$

28 CREDIT CHARACTERISTICS BY ACQUISITION/ORIGINATION PERIOD Correspondent Consumer Direct Broker Direct 2Q20 3Q20 4Q20 1Q21 2Q21 2Q20 3Q20 4Q20 1Q21 2Q21 Government-insured 719 715 714 707 702 Government-insured 37 37 36 37 42 Conventional 769 772 768 761 757 Conventional 32 32 33 34 34 2Q20 3Q20 4Q20 1Q21 2Q21 2Q20 3Q20 4Q20 1Q21 2Q21 Government-insured 719 719 720 719 708 Government-insured 41 40 39 39 39 Conventional 752 756 759 757 748 Conventional 33 32 32 32 33 2Q20 3Q20 4Q20 1Q21 2Q21 2Q20 3Q20 4Q20 1Q21 2Q21 Government-insured 738 756 753 743 726 Government-insured 42 45 43 43 43 Conventional 767 770 768 767 760 Conventional 32 32 32 33 34 Weighted Average FICO Weighted Average DTI Weighted Average FICO Weighted Average DTI Weighted Average FICO Weighted Average DTI