Attached files
| file | filename |
|---|---|
| 8-K - 8-K - Cornerstone Building Brands, Inc. | cnr-20210803.htm |

NEWS RELEASE
Cornerstone Building Brands Reports Strong Second-Quarter 2021 Results
•Posted second-quarter net sales growth of 29 percent, with strong performance across all business segments
•Generated earnings per diluted share of $0.07, with adjusted earnings per diluted share of $0.67
•Delivered net income of $9 million, with adjusted net income of $84 million, 11 percent higher than prior year
•Generated $190 million of pro forma Adjusted EBITDA1, 18 percent higher than prior year
•Expects to reduce year end net debt leverage by one to one and a half turns versus year end 2020
CARY, NC, August 3, 2021 - Cornerstone Building Brands, Inc. (NYSE: CNR) (the “Company”), the largest manufacturer of exterior building products in North America, today reported strong financial results for the second quarter of 2021 that reflected net sales growth and strong performance across all business segments.
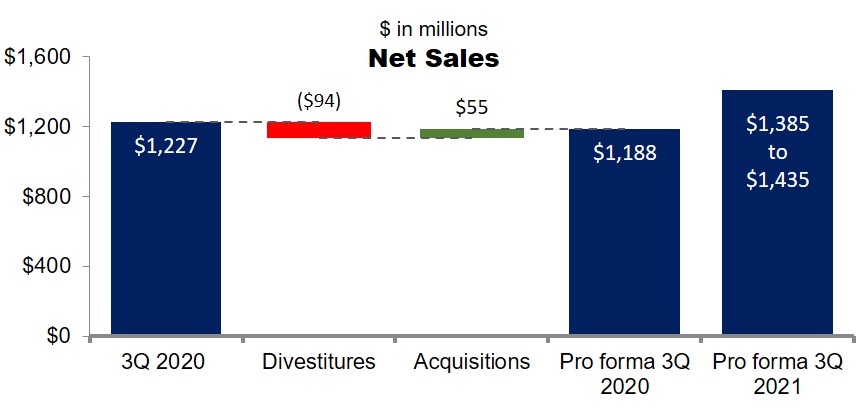
Net sales for the second quarter were $1,400.1 million, an increase of 29.1 percent compared with net sales of $1,084.9 million in the same quarter last year, and an increase of 8.1 percent from the second quarter of 2019. Pro forma net sales1 of $1,406.3 million were 28.0 percent higher than in the second quarter of 2020. The net sales growth was driven by increased volume of 13.4 percent compared with the prior-year quarter and price actions in response to rising commodity costs and other inflationary impacts. For the first half of 2021, pro forma net sales1 were $2,691.1 million, a 20.4 percent increase over the prior-year first half, led by strong volume growth of 11.3 percent with two fewer fiscal ship days.
Net income was $8.8 million or $0.07 per diluted share compared with $26.5 million or $0.21 per diluted share in the same quarter last year. Adjusted net income1 was $84.5 million or $0.67 per diluted share, an 11.2 percent increase compared to the prior year. For the first half of 2021, Adjusted net income1 was $122.7 million or $0.97 per diluted share compared with a net loss of $41.3 million in the same period last year.
Pro forma Adjusted EBITDA1 for the second quarter of 2021 was $190.2 million, which was 18.3 percent higher than the same pro forma period a year ago and 7.9% percent higher than the comparable 2019 period. Pro forma Adjusted EBITDA1 growth was driven by strong residential demand and price actions offsetting inflationary impacts partially reduced by higher manufacturing costs incurred to serve customers. For the first half of 2021, pro forma Adjusted EBITDA1 of $331.4 million was 12.3 percent of pro forma net sales1, which increased 70 basis points over the same pro forma period a year ago and 200 basis points from the comparable 2019 period.
“We continue to leverage the strengths of our business model to deliver long-term profitable growth,” said James S. Metcalf, Chairman and Chief Executive Officer. “This quarter we delivered record second quarter earnings and made significant progress toward optimizing our portfolio. These actions strengthen our financial flexibility and position the Company to deliver value to all our stakeholders.”
As part of the Company’s ongoing effort to optimize its portfolio, the Company entered into definitive agreements to divest its Insulated Metal Panels business to Nucor Insulated Panel Group Inc and the Roll-up Sheet Doors business to Janus Industrial Holdings Inc for approximately $1.2 billion in cash transactions, subject to customary closing adjustments. Both transactions are expected to close in the third quarter of 2021.
Segment Results Versus Prior Year
Due to the timing of the Company’s fiscal calendar, second-quarter 2021 had one more ship day than second-quarter 2020.
•Windows segment net sales for the quarter were $579.7 million, an increase of 35.4 percent versus the same period last year. Strong volumes across all sales channels drove increased volume of 22.5 percent coupled with incremental sales growth from recent acquisition of Prime Windows. Also contributing to the increase was disciplined price actions in response to rising commodity costs and other inflationary impacts. Operating income was $38.8 million for the quarter, an increase of $15.7 million or 67.9 percent from the prior year quarter. Pro forma Adjusted EBITDA1 was
(1)Adjusted and pro forma financial metrics used in this release, including Adjusted EBITDA, are non-GAAP measures. See reconciliations of GAAP results to adjusted results and pro forma results in the accompanying tables.
1
$73.2 million or 12.5 percent of pro forma net sales1, an increase of 17.6 percent, primarily due to increased volume of 47.2 percent and favorable price, net of commodity and other inflation impacts, partially offset by increased manufacturing costs to serve customers and inefficiencies caused by labor shortages. On a year-to-date basis, pro forma net sales1 increased 25.1 percent, and pro forma Adjusted EBITDA1 margin increased 50 basis points.
•Siding segment net sales for the quarter were $362.2 million, an increase of 27.0 percent versus the pro forma second-quarter 2020 net sales1. During the quarter, strong order momentum in the wholesale and retail channels drove increased volume of 12.0 percent and disciplined price actions in response to rising commodity costs and other inflationary impacts. Operating income was $53.4 million for the quarter, an increase of $22.7 million or 74.2 percent from the prior year quarter. Adjusted EBITDA1 was $79.4 million or 21.9 percent of net sales1, an increase of 25.5 percent, primarily due to increased volume of 20.1 percent and favorable price, net of commodity and other inflation impacts, partially offset by increased manufacturing costs to serve customers. On a year-to-date basis, net sales increased 26.9 percent, and Adjusted EBITDA1 margin increased 110 basis points as compared to the pro forma period last year.
•Commercial segment net sales for the quarter were $458.2 million, an increase of 23.4 percent from the prior year, driven by disciplined price actions to mitigate rising steel costs and increased volume of 3.6 percent. Operating income was $53.3 million for the quarter, an increase of $16.7 million or 45.5 percent from the prior year. Adjusted EBITDA1 was $67.5 million or 14.7 percent of net sales, an increase of 19.4 percent over the same quarter last year, primarily due to favorable price, net of commodity and other inflation impacts, partially offset by return of near term expenses. On a year-to-date basis, net sales increased 10.8 percent, and Adjusted EBITDA1 margin increased 80 basis points.
Balance Sheet and Liquidity
The Company’s cash flow used in operations of $31.8 million was driven by investments in net working capital to support the robust demand environment. Capital expenditures were $26.4 million, with approximately 50 percent invested in innovative product offerings and process automation that are expected to generate profitable growth in the future.
During the quarter, the Company fully redeemed its $645 million, 8.00% Senior Notes due April 2026 using available cash from the balance sheet and net proceeds from its extended and upsized senior term loan facility. Additionally, the Company refinanced its credit facilities, meaningfully extending its debt maturities and reducing annual interest costs by over $50 million a year. Unrestricted cash on hand was approximately $89 million and liquidity was approximately $608 million as of July 3, 2021. The net debt leverage ratio improved to 4.6x at the end of the second-quarter 2021 compared with 5.3x at the end of the second-quarter 2020.
Outlook
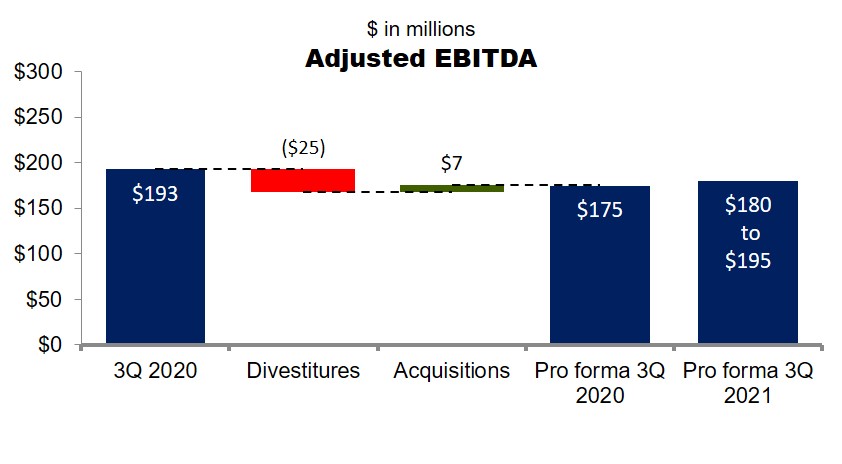
Third-Quarter 2021 Guidance anticipating the impacts of acquisitions and divestitures as if occurred at the beginning of the quarter. For comparison purposes a reconciliation of the pro forma 3Q 2020 financial measures have also been provided.
•The Company expects net sales to be between $1,385 million and $1,435 million
•Gross Profit is anticipated to be between $310 million and $330 million
•Adjusted EBITDA1 is expected to be between $180 million and $195 million
(1)Adjusted and pro forma financial metrics used in this release, including Adjusted EBITDA, are non-GAAP measures. See reconciliations of GAAP results to adjusted results and pro forma results in the accompanying tables.
2
Fiscal Year 2021 Guidance
•Capital spending is projected to be approximately $100 million to $120 million
•Cash interest expense is expected to be approximately $170 million
•Cash tax rate expected to be approximately 30%
•Expects to improve year end net debt leverage by one to one and a half turns versus year end 2020
(1)Adjusted and pro forma financial metrics used in this release, including Adjusted EBITDA, are non-GAAP measures. See reconciliations of GAAP results to adjusted results and pro forma results in the accompanying tables.
3
Conference Call Information
The Company will host a conference call at 9:00 a.m. EDT on Wednesday, August 4, to discuss its financial performance with investors and securities analysts. The financial results and supplemental information will be available online at investors.cornerstonebuildingbrands.com.
To register, please use this link http://www.directeventreg.com/registration/event/4089544.
After registering, an email confirmation with dial-in details and a unique code for entry will be sent. To ensure you are connected for the entirety of the call, please register a day in advance or at least 10 minutes before the start of the call. Additional call participation options are as follows:
By Webcast: Cornerstone Building Brands 2Q21 Earnings Call
Date: Wednesday, August 4, 2021
Time: 9:00 a.m. Eastern Daylight Time
Access link: Visit the Events & Presentations section of the Investors Page at investors.cornerstonebuildingbrands.com or access directly at
http://www.directeventreg.com/registration/event/4089544
Registration is open throughout the live call.
Replay dial-in will be available through August 18, 2021
Dial-in number: 800-585-8367
Replay code: 4089544
About Cornerstone Building Brands
Cornerstone Building Brands is the largest manufacturer of exterior building products for residential and low-rise non-residential buildings in North America. Headquartered in Cary, N.C., we serve residential and commercial customers across the new construction and repair and remodel markets. Our market-leading portfolio of products spans vinyl windows, vinyl siding, stone veneer, insulated metal panels, metal roofing, metal wall systems and metal accessories. Cornerstone Building Brands’ broad, multichannel distribution platform and expansive national footprint includes more than 20,000 employees at manufacturing, distribution and office locations throughout North America. Corporate stewardship and environmental, social and governance (ESG) responsibility are deeply embedded in our culture. We are committed to contributing positively to the communities where we live, work and play. For more information, visit us at www.cornerstonebuildingbrands.com
Investor Relations
Tina Beskid
Vice President, Finance and Investor Relations
1-866-419-0042
info@investors.cornerstonebuildingbrands.com
4
Forward-Looking Statements
This press release contains forward-looking statements within the meaning of the Private Securities Litigation Reform Act of 1995. Words such as “believe,” “anticipate,” “guidance,” “plan,” “potential,” “expect,” “should,” “will,” “forecast,” “target” and similar expressions are forward-looking statements within the meaning of the “safe harbor” provisions of the Private Securities Litigation Reform Act of 1995. These forward-looking statements reflect our current expectations, assumptions and/ or beliefs concerning future events. As a result, these forward-looking statements rely on a number of assumptions, forecasts, and estimates and, therefore, these forward-looking statements are subject to a number of risks and uncertainties that may cause the Company’s actual performance to differ materially from that projected in such statements. Such forward-looking statements may include, but are not limited to, statements concerning our market commentary and performance expectations, including our third quarter 2021 forecasted net sales, gross profit, and Adjusted EBITDA, and our fiscal year 2021 forecasted cost savings initiatives, return of near-term costs, net debt leverage, capital spending, cash interest expense, cash tax rate and other consolidated financial performance guidance. Among the factors that could cause actual results to differ materially include, but are not limited to: industry cyclicality; seasonality of the business and adverse weather conditions; challenging economic conditions affecting the residential, non-residential and repair and remodeling construction industry and markets; commodity price volatility and/or limited availability of raw materials, including polyvinyl chloride resin, glass, aluminum, and steel; our ability to identify and develop relationships with a sufficient number of qualified suppliers and to avoid a significant interruption in our supply chains; increasing difficulty in credit or financing availability of consumers or builders; increase in inflationary activity; ability to successfully achieve price increases; success of automation initiatives; successful implementation of restructuring initiatives; successful integration of our acquired businesses; ability to recruit and retain employees; volatility in the United States and international economies and in the credit markets; the severity, duration and spread of the COVID-19 pandemic, as well as actions that may be taken by the Company or governmental authorities to contain COVID-19 or to treat its impact; an impairment of our goodwill and/or intangible assets; our ability to successfully develop new products or improve existing products; the effects of manufacturing or assembly realignments; retention and replacement of key personnel; enforcement and obsolescence of our intellectual property rights; costs related to compliance with, violations of or liabilities under environmental, health and safety laws; changes in building codes and standards; competitive activity and pricing pressure in our industry; our ability to make strategic acquisitions accretive to earnings and dispositions at favorable prices and terms; our ability to carry out our restructuring plans and to fully realize the expected cost savings; global climate change, including legal, regulatory or market responses thereto; breaches of our information system security measures; damage to our computer infrastructure and software systems; necessary maintenance or replacements to our enterprise resource planning technologies; potential personal injury, property damage or product liability claims or other types of litigation; compliance with certain laws related to our international business operations; increases in labor costs, potential labor disputes, union organizing activity and work stoppages at our facilities or the facilities of our suppliers; significant changes in factors and assumptions used to measure certain of our defined benefit plan obligations and the effect of actual investment returns on pension assets; the cost and difficulty associated with integrating and combining acquired businesses; our ability to realize the anticipated benefits of acquisitions and dispositions and to use the proceeds from dispositions; volatility of the Company’s stock price; substantial governance and other rights held by our sponsor investors; the effect on our common stock price caused by transactions engaged in by our sponsor investors, our directors or executives; our substantial indebtedness and our ability to incur substantially more indebtedness; limitations that our debt agreements place on our ability to engage in certain business and financial transactions; our ability to obtain financing on acceptable terms; downgrades of our credit ratings; and the effect of increased interest rates on our ability to service our debt. See also the “Risk Factors” in the Company’s Annual Report on Form 10-K for the fiscal year ended December 31, 2020 and other risks described in documents subsequently filed by the Company from time to time with the SEC, which identify other important factors, though not necessarily all such factors, that could cause future outcomes to differ materially from those set forth in the forward-looking statements. The Company expressly disclaims any obligation to release publicly any updates or revisions to these forward-looking statements, whether as a result of new information, future events, or otherwise.
Non-GAAP Financial Measures
This press release includes certain “non-GAAP financial measures” as defined under the Securities Exchange Act of 1934 and in accordance with Regulation G. Management believes the use of such non-GAAP financial measures assists investors in understanding the ongoing operating performance of the Company by presenting the financial results between periods on a more comparable basis. Such non-GAAP financial measures should not be construed as an alternative to reported results determined in accordance with U.S. GAAP. We have included reconciliations of these non-GAAP financial measures to the most directly comparable financial measures calculated and provided in accordance with U.S. GAAP at the end of this release. A reconciliation of the forecasted range for Adjusted EBITDA for the third quarter of 2021 is not included in this release due to the number of variables in the projected range and because we are currently unable to quantify accurately certain amounts that would be required to be included in the GAAP measure or the individual adjustments for such reconciliation. In addition, we believe such reconciliation would imply a degree of precision that would be confusing or misleading to investors.
5
6
| CORNERSTONE BUILDING BRANDS, INC. | |||||||||||||||||||||||
| CONSOLIDATED STATEMENTS OF OPERATIONS | |||||||||||||||||||||||
| (In thousands, except per share data) | |||||||||||||||||||||||
| (Unaudited) | |||||||||||||||||||||||
| Three Months Ended | Six Months Ended | ||||||||||||||||||||||
| July 3, 2021 | July 4, 2020 | July 3, 2021 | July 4, 2020 | ||||||||||||||||||||
| Net sales | $ | 1,400,121 | $ | 1,084,936 | $ | 2,667,153 | $ | 2,198,747 | |||||||||||||||
| Cost of sales | 1,088,393 | 830,205 | 2,095,696 | 1,713,129 | |||||||||||||||||||
| Gross profit | 311,728 | 254,731 | 571,457 | 485,618 | |||||||||||||||||||
| 22.3 | % | 23.5 | % | 21.4 | % | 22.1 | % | ||||||||||||||||
| Selling, general and administrative expenses | 163,518 | 134,371 | 316,686 | 299,325 | |||||||||||||||||||
| Intangible asset amortization | 46,809 | 45,240 | 93,011 | 90,101 | |||||||||||||||||||
| Restructuring and impairment charges, net | 4,652 | 15,411 | 6,490 | 29,246 | |||||||||||||||||||
| Strategic development and acquisition related costs | (61) | 784 | 3,252 | 5,641 | |||||||||||||||||||
| Goodwill impairment | — | — | — | 503,171 | |||||||||||||||||||
| Income (loss) from operations | 96,810 | 58,925 | 152,018 | (441,866) | |||||||||||||||||||
| Interest income | 23 | 341 | 140 | 679 | |||||||||||||||||||
| Interest expense | (47,458) | (52,384) | (103,957) | (107,219) | |||||||||||||||||||
| Foreign exchange gain (loss) | 229 | 2,025 | 203 | (2,112) | |||||||||||||||||||
| Loss on extinguishment of debt | (42,234) | — | (42,234) | — | |||||||||||||||||||
| Other income (expense), net | 493 | 660 | 830 | (2) | |||||||||||||||||||
| Income (loss) before income taxes | 7,863 | 9,567 | 7,000 | (550,520) | |||||||||||||||||||
| Benefit for income taxes | (1,064) | (17,332) | (272) | (35,346) | |||||||||||||||||||
| (13.5) | % | (181.2) | % | (3.9) | % | 6.4 | % | ||||||||||||||||
| Net income (loss) | 8,927 | 26,899 | 7,272 | (515,174) | |||||||||||||||||||
| Net income allocated to participating securities | (123) | (442) | (93) | — | |||||||||||||||||||
| Net income (loss) applicable to common shares | $ | 8,804 | $ | 26,457 | $ | 7,179 | $ | (515,174) | |||||||||||||||
| Income (loss) per common share: | |||||||||||||||||||||||
| Basic | $ | 0.07 | $ | 0.21 | $ | 0.06 | $ | (4.09) | |||||||||||||||
| Diluted | $ | 0.07 | $ | 0.21 | $ | 0.06 | $ | (4.09) | |||||||||||||||
| Weighted average number of common shares outstanding: | |||||||||||||||||||||||
| Basic | 125,863 | 125,754 | 125,683 | 125,927 | |||||||||||||||||||
| Diluted | 126,841 | 125,755 | 126,469 | 125,927 | |||||||||||||||||||
| Increase (decrease) in sales | 29.1 | % | (16.3) | % | 21.3 | % | (6.8) | % | |||||||||||||||
| Selling, general and administrative expenses percentage of net sales | 11.7 | % | 12.4 | % | 11.9 | % | 13.6 | % | |||||||||||||||
7
| CORNERSTONE BUILDING BRANDS, INC. | |||||||||||
| CONSOLIDATED BALANCE SHEETS | |||||||||||
| (In thousands) | |||||||||||
| (Unaudited) | |||||||||||
| July 3, 2021 | December 31, 2020 | ||||||||||
| ASSETS | |||||||||||
| Current assets: | |||||||||||
| Cash and cash equivalents | $ | 88,978 | $ | 674,255 | |||||||
| Restricted cash | 6,224 | 6,223 | |||||||||
| Accounts receivable, net | 613,193 | 554,649 | |||||||||
| Inventories, net | 549,736 | 431,937 | |||||||||
| Income taxes receivable | 46,358 | 39,379 | |||||||||
| Investments in debt and equity securities, at market | 2,695 | 2,333 | |||||||||
| Prepaid expenses and other | 88,942 | 77,751 | |||||||||
| Assets held for sale | 390,025 | 4,644 | |||||||||
| Total current assets | 1,786,151 | 1,791,171 | |||||||||
| Property, plant and equipment, net | 568,901 | 631,821 | |||||||||
| Lease right-of-use assets | 272,366 | 264,107 | |||||||||
| Goodwill | 1,107,758 | 1,194,729 | |||||||||
| Intangible assets, net | 1,488,426 | 1,584,604 | |||||||||
| Deferred income taxes | 2,178 | 1,867 | |||||||||
| Other assets, net | 28,283 | 10,191 | |||||||||
| Total assets | $ | 5,254,063 | $ | 5,478,490 | |||||||
| LIABILITIES AND STOCKHOLDERS’ EQUITY | |||||||||||
| Current liabilities: | |||||||||||
| Current portion of long-term debt | $ | 26,000 | $ | 25,600 | |||||||
| Accounts payable | 266,067 | 211,441 | |||||||||
| Accrued compensation and benefits | 75,966 | 81,548 | |||||||||
| Accrued interest | 21,406 | 25,485 | |||||||||
| Accrued income taxes | 6,560 | 5,060 | |||||||||
| Current portion of lease liabilities | 68,198 | 70,125 | |||||||||
| Other accrued expenses | 280,236 | 247,893 | |||||||||
| Liabilities held for sale | 75,927 | — | |||||||||
| Total current liabilities | 820,360 | 667,152 | |||||||||
| Long-term debt | 3,180,759 | 3,563,429 | |||||||||
| Deferred income taxes | 233,602 | 269,792 | |||||||||
| Long-term lease liabilities | 205,530 | 198,875 | |||||||||
| Other long-term liabilities | 334,565 | 337,437 | |||||||||
| Total long-term liabilities | 3,954,456 | 4,369,533 | |||||||||
| Common stock | 1,261 | 1,255 | |||||||||
| Additional paid-in capital | 1,265,887 | 1,257,262 | |||||||||
| Accumulated deficit | (757,413) | (764,685) | |||||||||
| Accumulated other comprehensive loss, net | (30,064) | (51,517) | |||||||||
| Treasury stock, at cost | (424) | (510) | |||||||||
| Total stockholders’ equity | 479,247 | 441,805 | |||||||||
| Total liabilities and stockholders’ equity | $ | 5,254,063 | $ | 5,478,490 | |||||||
8
| CORNERSTONE BUILDING BRANDS, INC. | |||||||||||
| CONSOLIDATED STATEMENTS OF CASH FLOWS | |||||||||||
| (In thousands) | |||||||||||
| (Unaudited) | |||||||||||
| Six Months Ended | |||||||||||
| July 3, 2021 | July 4, 2020 | ||||||||||
| Cash flows from operating activities: | |||||||||||
| Net income (loss) | $ | 7,272 | $ | (515,174) | |||||||
| Adjustments to reconcile net income (loss) to net cash provided by (used in) operating activities: | |||||||||||
| Depreciation and amortization | 145,901 | 140,480 | |||||||||
| Non-cash interest expense | 10,924 | 4,593 | |||||||||
| Share-based compensation expense | 8,593 | 8,543 | |||||||||
| Loss on extinguishment of debt | 42,234 | — | |||||||||
| Goodwill impairment | — | 503,171 | |||||||||
| Asset impairment | 3,988 | 3,490 | |||||||||
| Loss on sale of assets, net | — | 169 | |||||||||
| Provision for credit losses | 1,428 | 252 | |||||||||
| Deferred income taxes | (24,758) | (48,190) | |||||||||
| Changes in operating assets and liabilities, net of effect of acquisitions: | |||||||||||
| Accounts receivable | (119,813) | (24,844) | |||||||||
| Inventories | (176,077) | 36,872 | |||||||||
| Income taxes | (6,979) | 12,226 | |||||||||
| Prepaid expenses and other | (15,960) | 9,782 | |||||||||
| Accounts payable | 73,627 | (7,818) | |||||||||
| Accrued expenses | 38,347 | (53,834) | |||||||||
| Other, net | (448) | (2,756) | |||||||||
| Net cash provided by (used in) operating activities | (11,721) | 66,962 | |||||||||
| Cash flows from investing activities: | |||||||||||
| Acquisitions, net of cash acquired | (94,383) | (41,841) | |||||||||
| Capital expenditures | (47,643) | (47,609) | |||||||||
| Proceeds from sale of property, plant and equipment | 715 | 114 | |||||||||
| Net cash used in investing activities | (141,311) | (89,336) | |||||||||
| Cash flows from financing activities: | |||||||||||
| Proceeds from ABL facility | 160,000 | 345,000 | |||||||||
| Payments on ABL facility | — | (30,000) | |||||||||
| Proceeds from cash flow revolver | — | 115,000 | |||||||||
| Proceeds from term loan | 108,438 | — | |||||||||
| Payments on term loan | (12,905) | (12,810) | |||||||||
| Payments on senior notes | (670,800) | — | |||||||||
| Payments of financing costs | (13,187) | — | |||||||||
| Purchases of treasury stock | — | (6,428) | |||||||||
| Payments on derivative financing obligations | (2,848) | — | |||||||||
| Other | (61) | (467) | |||||||||
| Net cash provided by (used in) financing activities | (431,363) | 410,295 | |||||||||
| Effect of exchange rate changes on cash and cash equivalents | (881) | (508) | |||||||||
| Net increase (decrease) in cash, cash equivalents and restricted cash | (585,276) | 387,413 | |||||||||
| Cash, cash equivalents and restricted cash at beginning of period | 680,478 | 102,307 | |||||||||
| Cash, cash equivalents and restricted cash at end of period | $ | 95,202 | $ | 489,720 | |||||||
| Supplemental disclosure of cash flow information | |||||||||||
| Interest paid, net of amounts capitalized | $ | 102,045 | $ | 101,142 | |||||||
| Taxes paid, net | $ | 23,968 | $ | 1,109 | |||||||
9
| CORNERSTONE BUILDING BRANDS, INC. | |||||||||||||||||||||||
| NON-GAAP FINANCIAL MEASURES AND RECONCILIATIONS | |||||||||||||||||||||||
| ADJUSTED NET INCOME (LOSS) PER DILUTED COMMON SHARE AND | |||||||||||||||||||||||
| NET INCOME (LOSS) COMPARISON | |||||||||||||||||||||||
| (In thousands, except per share data) | |||||||||||||||||||||||
| (Unaudited) | |||||||||||||||||||||||
| Three Months Ended | Six Months Ended | ||||||||||||||||||||||
| July 3, 2021 | July 4, 2020 | July 3, 2021 | July 4, 2020 | ||||||||||||||||||||
| Net income (loss) per diluted common share, GAAP basis | $ | 0.07 | $ | 0.21 | $ | 0.06 | $ | (4.09) | |||||||||||||||
| Restructuring and impairment charges, net | 0.04 | 0.12 | 0.05 | 0.23 | |||||||||||||||||||
| Strategic development and acquisition related costs | — | 0.01 | 0.03 | 0.04 | |||||||||||||||||||
| Non-cash loss (gain) on foreign currency transactions | — | (0.02) | — | 0.02 | |||||||||||||||||||
| Goodwill impairment | — | — | — | 4.00 | |||||||||||||||||||
Intangible asset amortization(4) | 0.37 | 0.36 | 0.74 | 0.72 | |||||||||||||||||||
| Customer inventory buybacks | — | — | — | — | |||||||||||||||||||
COVID-19(3) | — | 0.05 | — | 0.06 | |||||||||||||||||||
Other, net(5) | 0.40 | — | 0.43 | 0.01 | |||||||||||||||||||
Tax effect of applicable non-GAAP adjustments(1) | (0.21) | (0.14) | (0.32) | (1.32) | |||||||||||||||||||
Adjusted net income (loss) per diluted common share(2) | $ | 0.67 | $ | 0.60 | $ | 0.97 | $ | (0.33) | |||||||||||||||
| Three Months Ended | Six Months Ended | ||||||||||||||||||||||
| July 3, 2021 | July 4, 2020 | July 3, 2021 | July 4, 2020 | ||||||||||||||||||||
| Net income (loss) applicable to common shares, GAAP basis | $ | 8,804 | $ | 26,457 | $ | 7,179 | $ | (515,174) | |||||||||||||||
| Restructuring and impairment charges, net | 4,652 | 15,411 | 6,490 | 29,403 | |||||||||||||||||||
| Strategic development and acquisition related costs | (61) | 784 | 3,252 | 5,641 | |||||||||||||||||||
| Non-cash loss (gain) on foreign currency transactions | (229) | (2,025) | (203) | 2,112 | |||||||||||||||||||
| Goodwill impairment | — | — | — | 503,171 | |||||||||||||||||||
Intangible asset amortization(4) | 46,815 | 45,240 | 93,017 | 90,101 | |||||||||||||||||||
| Customer inventory buybacks | — | 193 | — | 313 | |||||||||||||||||||
COVID-19(3) | 244 | 6,805 | (399) | 8,035 | |||||||||||||||||||
Other, net(5) | 50,824 | 474 | 54,002 | 1,612 | |||||||||||||||||||
Tax effect of applicable non-GAAP adjustments(1) | (26,584) | (17,389) | (40,601) | (166,501) | |||||||||||||||||||
Adjusted net income (loss) applicable to common shares(2) | $ | 84,465 | $ | 75,950 | $ | 122,737 | $ | (41,287) | |||||||||||||||
(1)The Company calculated the tax effect of non-GAAP adjustments by applying the applicable federal and state statutory tax rate for the period to each applicable non-GAAP item.
(2)The Company discloses a tabular comparison of Adjusted net income (loss) per diluted common share and Adjusted net income (loss) applicable to common shares, which are non-GAAP measures, because they are referred to in the text of our press releases and are instrumental in comparing the results from period to period. Adjusted net income (loss) per diluted common share and Adjusted net income (loss) applicable to common shares should not be considered in isolation or as a substitute for net income (loss) per diluted common share and net income (loss) applicable to common shares as reported on the face of our consolidated statements of operations.
(3)Costs included within the COVID-19 line item for the three and six months ended July 3, 2021 and July 4, 2020 include incremental labor costs due to quarantine related absenteeism, incremental facility cleaning costs, pandemic related supplies and personal protective equipment for employees, among other costs.
(4)Effective July 3, 2021, we revised the definition of Adjusted Net Income to exclude intangible amortization expense.
(5)Costs included within the Other, net line item include $8.5 million and $11.6 million of non-capitalizable debt issuance costs for the three and six months ended July 3, 2021, respectively; and $42.2 million of loss on extinguishment of debt for the three and six months ended July 3, 2021.
Certain amounts in this release have been subject to rounding adjustments. Accordingly, amounts shown as totals may not be the arithmetic aggregation of the individual amounts that comprise or precede them.
10
| CORNERSTONE BUILDING BRANDS, INC. | |||||||||||||||||||||||||||||||||||
| NON-GAAP FINANCIAL MEASURES AND RECONCILIATIONS | |||||||||||||||||||||||||||||||||||
| (In thousands) | |||||||||||||||||||||||||||||||||||
| (Unaudited) | |||||||||||||||||||||||||||||||||||
| Consolidated | |||||||||||||||||||||||||||||||||||
| Three Months Ended | Six Months Ended | ||||||||||||||||||||||||||||||||||
| July 3, 2021 | July 4, 2020 | June 29, 2019 | July 3, 2021 | July 4, 2020 | June 29, 2019 | ||||||||||||||||||||||||||||||
| Net sales | $ | 1,400,121 | $ | 1,084,936 | $ | 1,295,457 | $ | 2,667,153 | $ | 2,198,747 | $ | 2,360,289 | |||||||||||||||||||||||
Impact of Prime, Kleary and Environmental Stoneworks acquisitions(1) | 6,175 | 13,606 | 25,238 | 23,936 | 35,504 | 60,521 | |||||||||||||||||||||||||||||
| Pro forma net sales | $ | 1,406,296 | $ | 1,098,542 | $ | 1,320,695 | $ | 2,691,089 | $ | 2,234,251 | $ | 2,420,810 | |||||||||||||||||||||||
| Gross profit | $ | 311,728 | $ | 254,731 | $ | 304,663 | $ | 571,457 | $ | 485,618 | $ | 490,580 | |||||||||||||||||||||||
| 22.3 | % | 23.5 | % | 23.5 | % | 21.4 | % | 22.1 | % | 20.8 | % | ||||||||||||||||||||||||
| Operating income (loss), GAAP | $ | 96,810 | $ | 58,925 | $ | 80,931 | $ | 152,018 | $ | (441,866) | $ | 53,566 | |||||||||||||||||||||||
| Restructuring and impairment charges, net | 4,652 | 15,411 | 7,107 | 6,490 | 29,403 | 10,538 | |||||||||||||||||||||||||||||
| Strategic development and acquisition related costs | (61) | 784 | 12,086 | 3,252 | 5,641 | 26,168 | |||||||||||||||||||||||||||||
| Non-cash charge of purchase price allocated to inventories | — | — | — | — | — | 16,249 | |||||||||||||||||||||||||||||
| Goodwill impairment | — | — | — | — | 503,171 | — | |||||||||||||||||||||||||||||
| Customer inventory buybacks | — | 193 | 175 | — | 313 | 417 | |||||||||||||||||||||||||||||
| COVID-19 | 244 | 6,805 | — | (399) | 8,035 | — | |||||||||||||||||||||||||||||
| Other, net | 8,588 | 474 | 1,357 | 11,768 | 1,612 | 2,081 | |||||||||||||||||||||||||||||
| Adjusted operating income | 110,233 | 82,592 | 101,656 | 173,129 | 106,309 | 109,019 | |||||||||||||||||||||||||||||
| Other income (expense), net | 493 | 660 | (397) | 830 | (2) | (52) | |||||||||||||||||||||||||||||
| Depreciation and amortization | 73,286 | 70,711 | 67,529 | 145,901 | 140,480 | 127,476 | |||||||||||||||||||||||||||||
| Share-based compensation expense | 5,291 | 5,156 | 3,474 | 8,593 | 8,543 | 7,479 | |||||||||||||||||||||||||||||
| Adjusted EBITDA | 189,303 | 159,119 | 172,262 | 328,453 | 255,330 | 243,922 | |||||||||||||||||||||||||||||
Impact of Prime, Kleary and Environmental Stoneworks acquisitions(1) | 876 | 1,583 | 3,945 | 2,903 | 4,528 | 5,216 | |||||||||||||||||||||||||||||
| Pro Forma Adjusted EBITDA | $ | 190,179 | $ | 160,702 | $ | 176,207 | $ | 331,356 | $ | 259,858 | $ | 249,138 | |||||||||||||||||||||||
| Pro forma Adjusted EBITDA as a % of Pro Forma Net sales | 13.5 | % | 14.6 | % | 13.3 | % | 12.3 | % | 11.6 | % | 10.3 | % | |||||||||||||||||||||||
(1)Reflects the net sales and Adjusted EBITDA of Prime Windows LLC for the periods January 1, 2019 to June 29, 2019, January 1, 2020 to July 4, 2020 and January 1, 2021 to April 29, 2021; Kleary Masonry, Inc. for the periods January 1, 2019 to June 29, 2019 and January 1, 2020 to March 1, 2020; and Environmental Stoneworks for the period of January 1, 2019 to February 20, 2019.
11
| CORNERSTONE BUILDING BRANDS, INC. | |||||||||||||||||||||||
| NON-GAAP FINANCIAL MEASURES AND RECONCILIATIONS | |||||||||||||||||||||||
| (In thousands) | |||||||||||||||||||||||
| (Unaudited) | |||||||||||||||||||||||
| Windows | |||||||||||||||||||||||
| Three Months Ended | Six Months Ended | ||||||||||||||||||||||
| July 3, 2021 | July 4, 2020 | July 3, 2021 | July 4, 2020 | ||||||||||||||||||||
| Net Sales | $ | 579,744 | $ | 428,275 | $ | 1,107,007 | $ | 876,725 | |||||||||||||||
Impact of Prime acquisition(1) | 6,175 | 13,606 | 23,936 | 27,146 | |||||||||||||||||||
| Pro forma net sales | $ | 585,919 | $ | 441,881 | $ | 1,130,943 | $ | 903,871 | |||||||||||||||
| Gross profit | $ | 102,320 | $ | 84,363 | $ | 194,854 | $ | 158,364 | |||||||||||||||
| 17.6 | % | 19.7 | % | 17.6 | % | 18.1 | % | ||||||||||||||||
| Operating income (loss), GAAP | $ | 38,783 | $ | 23,101 | $ | 68,145 | $ | (290,089) | |||||||||||||||
| Restructuring and impairment charges, net | 23 | 4,184 | 955 | 5,650 | |||||||||||||||||||
| Strategic development and acquisition related costs | 1,314 | — | 1,314 | 16 | |||||||||||||||||||
| Goodwill impairment | — | — | — | 320,990 | |||||||||||||||||||
| COVID-19 | — | 3,964 | — | 4,892 | |||||||||||||||||||
| Other, net | — | (785) | — | — | |||||||||||||||||||
| Adjusted operating income | 40,120 | 30,464 | 70,414 | 41,459 | |||||||||||||||||||
| Other income (expense), net | 13 | — | (74) | — | |||||||||||||||||||
| Depreciation and amortization | 32,174 | 30,182 | 62,972 | 60,035 | |||||||||||||||||||
| Adjusted EBITDA | 72,307 | 60,646 | 133,312 | 101,494 | |||||||||||||||||||
Impact of Prime acquisition(1) | 876 | 1,583 | 2,903 | 2,659 | |||||||||||||||||||
| Pro Forma Adjusted EBITDA | $ | 73,183 | $ | 62,229 | $ | 136,215 | $ | 104,153 | |||||||||||||||
| Pro Forma Adjusted EBITDA as a % of Pro Forma Net Sales | 12.5 | % | 14.1 | % | 12.0 | % | 11.5 | % | |||||||||||||||
(1)Reflects the net sales and Adjusted EBITDA of Prime Windows LLC for the periods January 1, 2020 to July 4, 2020 and January 1, 2021 to April 29, 2021.
12
| CORNERSTONE BUILDING BRANDS, INC. | |||||||||||||||||||||||
| NON-GAAP FINANCIAL MEASURES AND RECONCILIATIONS | |||||||||||||||||||||||
| (In thousands) | |||||||||||||||||||||||
| (Unaudited) | |||||||||||||||||||||||
| Siding | |||||||||||||||||||||||
| Three Months Ended | Six Months Ended | ||||||||||||||||||||||
| July 3, 2021 | July 4, 2020 | July 3, 2021 | July 4, 2020 | ||||||||||||||||||||
| Net Sales | $ | 362,187 | $ | 285,249 | $ | 678,578 | $ | 526,292 | |||||||||||||||
Impact of Kleary acquisition(1) | — | — | — | 8,358 | |||||||||||||||||||
| Pro forma net sales | $ | 362,187 | $ | 285,249 | $ | 678,578 | $ | 534,650 | |||||||||||||||
| Gross profit | $ | 99,867 | $ | 78,137 | $ | 175,866 | $ | 137,179 | |||||||||||||||
| 27.6 | % | 27.4 | % | 25.9 | % | 26.1 | % | ||||||||||||||||
| Operating income (loss), GAAP | $ | 53,383 | $ | 30,638 | $ | 80,911 | $ | (138,229) | |||||||||||||||
| Restructuring and impairment charges, net | 13 | 2,524 | 154 | 3,615 | |||||||||||||||||||
| Strategic development and acquisition related costs | (3,167) | 955 | (2,844) | 976 | |||||||||||||||||||
| Goodwill impairment | — | — | — | 176,774 | |||||||||||||||||||
| Customer inventory buybacks | — | 193 | — | 313 | |||||||||||||||||||
| COVID-19 | 7 | 43 | 20 | 43 | |||||||||||||||||||
| Other, net | 27 | 412 | 27 | — | |||||||||||||||||||
| Adjusted operating income | 50,263 | 34,765 | 78,268 | 43,492 | |||||||||||||||||||
| Other income (expense), net | (34) | (6) | (66) | (6) | |||||||||||||||||||
| Depreciation and amortization | 29,209 | 28,514 | 58,357 | 56,521 | |||||||||||||||||||
| Adjusted EBITDA | 79,438 | 63,273 | 136,559 | 100,007 | |||||||||||||||||||
Impact of Kleary acquisition(1) | — | — | — | 1,869 | |||||||||||||||||||
| Pro Forma Adjusted EBITDA | $ | 79,438 | $ | 63,273 | $ | 136,559 | $ | 101,876 | |||||||||||||||
| Adjusted EBITDA as a % of Net Sales | 21.9 | % | 22.2 | % | 20.1 | % | 19.0 | % | |||||||||||||||
| Pro Forma Adjusted EBITDA as a % of Pro Forma Net Sales | 21.9 | % | 22.2 | % | 20.1 | % | 19.1 | % | |||||||||||||||
(1)Reflects the net sales and Adjusted EBITDA of Kleary Masonry, Inc. for the period January 1, 2020 to March 1, 2020.
13
| CORNERSTONE BUILDING BRANDS, INC. | |||||||||||||||||||||||
| NON-GAAP FINANCIAL MEASURES AND RECONCILIATIONS | |||||||||||||||||||||||
| (In thousands) | |||||||||||||||||||||||
| (Unaudited) | |||||||||||||||||||||||
| Commercial | |||||||||||||||||||||||
| Three Months Ended | Six Months Ended | ||||||||||||||||||||||
| July 3, 2021 | July 4, 2020 | July 3, 2021 | July 4, 2020 | ||||||||||||||||||||
| Net Sales | $ | 458,190 | $ | 371,412 | $ | 881,568 | $ | 795,730 | |||||||||||||||
| Gross profit | $ | 109,541 | $ | 92,231 | $ | 200,737 | $ | 190,075 | |||||||||||||||
| 23.9 | % | 24.8 | % | 22.8 | % | 23.9 | % | ||||||||||||||||
| Operating income, GAAP | $ | 53,330 | $ | 36,664 | $ | 94,915 | $ | 53,505 | |||||||||||||||
| Restructuring and impairment charges, net | 2,374 | 7,364 | 3,046 | 19,069 | |||||||||||||||||||
| Strategic development and acquisition related costs | 774 | (149) | 832 | (254) | |||||||||||||||||||
| Goodwill impairment | — | — | — | 5,407 | |||||||||||||||||||
| COVID-19 | — | 1,220 | (774) | 1,522 | |||||||||||||||||||
| Other, net | 14 | 289 | 177 | 1,100 | |||||||||||||||||||
| Adjusted operating income | 56,492 | 45,388 | 98,196 | 80,349 | |||||||||||||||||||
| Other income (expense), net | 371 | 123 | 725 | 237 | |||||||||||||||||||
| Depreciation and amortization | 10,643 | 11,020 | 22,003 | 21,921 | |||||||||||||||||||
| Adjusted EBITDA | $ | 67,506 | $ | 56,531 | $ | 120,924 | $ | 102,507 | |||||||||||||||
| Adjusted EBITDA as a % of Net Sales | 14.7 | % | 15.2 | % | 13.7 | % | 12.9 | % | |||||||||||||||
| CORNERSTONE BUILDING BRANDS, INC. | ||||||||||||||||||||
| NON-GAAP FINANCIAL MEASURES AND RECONCILIATIONS | ||||||||||||||||||||
| (In thousands) | ||||||||||||||||||||
| (Unaudited) | ||||||||||||||||||||
| Three Months Ended | Six Months Ended | |||||||||||||||||||
| July 3, 2021 | July 4, 2020 | July 3, 2021 | July 4, 2020 | |||||||||||||||||
| Net cash provided (used) in operating activities | $ | (31,752) | $ | 69,186 | $ | (11,721) | $ | 66,962 | ||||||||||||
| Less: Capital expenditures | (26,413) | (20,042) | (47,643) | (47,609) | ||||||||||||||||
| Free cash flow | $ | (58,165) | $ | 49,144 | $ | (59,364) | $ | 19,353 | ||||||||||||
14