Attached files
| file | filename |
|---|---|
| 8-K - 8-K - Consolidated Communications Holdings, Inc. | cnsl-20210729x8k.htm |
| EX-99.1 - EX-99.1 - Consolidated Communications Holdings, Inc. | cnsl-20210729xex99d1.htm |
Exhibit 99.2
| Q2 2021 Earnings July 29, 2021 |

| Safe Harbor The Securities and Exchange Commission (“SEC”) encourages companies to disclose forward-looking information so that investors can better understand a company’s future prospects and make informed investment decisions. Certain statements in this communication are forward-looking statements and are made pursuant to the safe harbor provisions of the Securities Litigation Reform Act of 1995. These forward-looking statements reflect, among other things, our current expectations, plans, strategies, and anticipated financial results. There are a number of risks, uncertainties, and conditions that may cause our actual results to differ materially from those expressed or implied by these forward-looking statements. These risks and uncertainties include a number of factors related to our business, including the uncertainties relating to the impact of the novel coronavirus (COVID-19) pandemic on the company’s business, results of operations, cash flows, stock price and employees; the ability to obtain regulatory approvals required for the Searchlight investment and meet other closing conditions to the investment on a timely basis or at all; economic and financial market conditions generally and economic conditions in our service areas; various risks to the price and volatility of our common stock; changes in the valuation of pension plan assets; the substantial amount of debt and our ability to repay or refinance it or incur additional debt in the future; our need for a significant amount of cash to service and repay the debt restrictions contained in our debt agreements that limit the discretion of management in operating the business; regulatory changes, including changes to subsidies, rapid development and introduction of new technologies and intense competition in the telecommunications industry; risks associated with our possible pursuit of acquisitions; system failures; cyber-attacks, information or security breaches or technology failure of ours or of a third party; losses of large customers or government contracts; risks associated with the rights-of-way for the network; disruptions in the relationship with third party vendors; losses of key management personnel and the inability to attract and retain highly qualified management and personnel in the future; changes in the extensive governmental legislation and regulations governing telecommunications providers and the provision of telecommunications services; new or changing tax laws or regulations; telecommunications carriers disputing and/or avoiding their obligations to pay network access charges for use of our network; high costs of regulatory compliance; the competitive impact of legislation and regulatory changes in the telecommunications industry; and liability and compliance costs regarding environmental regulations; and risks associated with discontinuing paying dividends on our common stock. A detailed discussion of these and other risks and uncertainties that could cause actual results and events to differ materially from such forward-looking statements are discussed in more detail in our filings with the SEC, including our reports on Form 10-K and Form 10-Q. Many of these circumstances are beyond our ability to control or predict. Moreover, forward-looking statements necessarily involve assumptions on our part. These forward- looking statements generally are identified by the words “believe,” “expect,” “anticipate,” “estimate,” “project,” “intend,” “plan,” “should,” “may,” “will,” “would,” “will be,” “will continue” or similar expressions. Such forward-looking statements involve known and unknown risks, uncertainties and other factors that may cause actual results, performance or achievements of Consolidated Communications Holdings, Inc. and its subsidiaries to be different from those expressed or implied in the forward-looking statements. All forward-looking statements attributable to us or persons acting on our behalf are expressly qualified in their entirety by the cautionary statements that appear throughout this communication. Furthermore, forward-looking statements speak only as of the date they are made. Except as required under the federal securities laws or the rules and regulations of the SEC, we disclaim any intention or obligation to update or revise publicly any forward- looking statements. You should not place undue reliance on forward-looking statements. 2 |
| Non-GAAP Measures 3 This presentation includes certain non-GAAP historical and forward-looking financial measures, including but not limited to “EBITDA,” “adjusted EBITDA,” “total net debt to last twelve month adjusted EBITDA ratio,” and “free cash flow.” In addition to providing key metrics for management to evaluate the Company’s performance, we believes these measurements assist investors in their understanding of operating performance and in identifying historical and prospective trends. A reconciliation of the differences between these non-GAAP financial measures and the most directly comparable financial measures presented in accordance with GAAP are available on the Company’s website at https://ir.consolidated.com. Non-GAAP measures are not presented to be replacements or alternatives to the GAAP measures, and investors are urged to consider these non-GAAP measures in addition to, and not in substitution for, measures prepared in accordance with GAAP. Consolidated may present or calculate its non-GAAP measures differently from other companies. Consolidated has filed a Form 8-K reporting the quarterly results for the second quarter of 2021. The Company’s 8-K, Form 10-K, Form 10-Q and other filings should be read in conjunction with this presentation as they contain additional important details on the quarterly results. . |
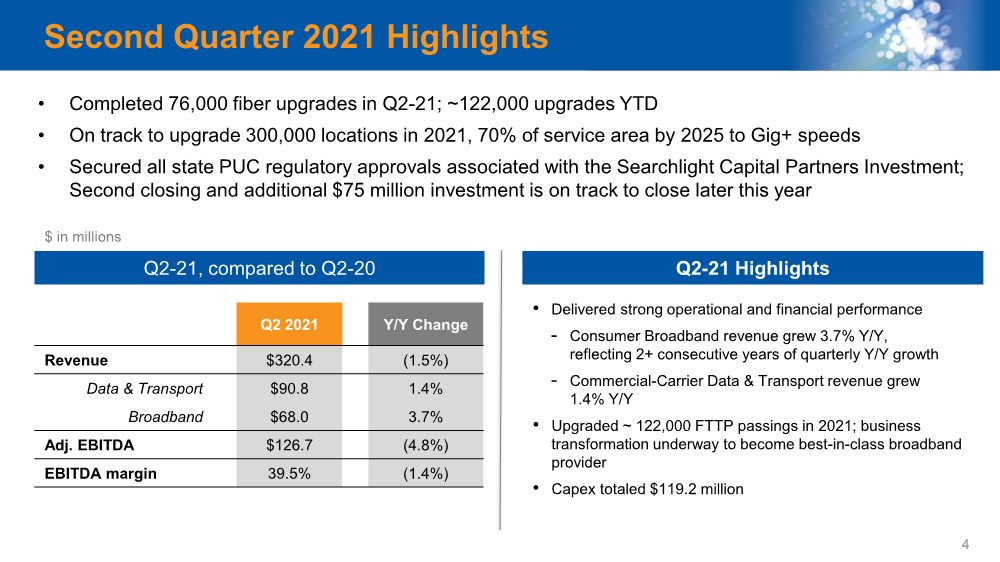
| Second Quarter 2021 Highlights • Delivered strong operational and financial performance - Consumer Broadband revenue grew 3.7% Y/Y, reflecting 2+ consecutive years of quarterly Y/Y growth - Commercial-Carrier Data & Transport revenue grew 1.4% Y/Y • Upgraded ~ 122,000 FTTP passings in 2021; business transformation underway to become best-in-class broadband provider • Capex totaled $119.2 million Q2-21 Highlights 4 • Completed 76,000 fiber upgrades in Q2-21; ~122,000 upgrades YTD • On track to upgrade 300,000 locations in 2021, 70% of service area by 2025 to Gig+ speeds • Secured all state PUC regulatory approvals associated with the Searchlight Capital Partners Investment; Second closing and additional $75 million investment is on track to close later this year Q2-21, compared to Q2-20 Q2 2021 Y/Y Change Revenue $320.4 (1.5%) Data & Transport $90.8 1.4% Broadband $68.0 3.7% Adj. EBITDA $126.7 (4.8%) EBITDA margin 39.5% (1.4%) $ in millions |
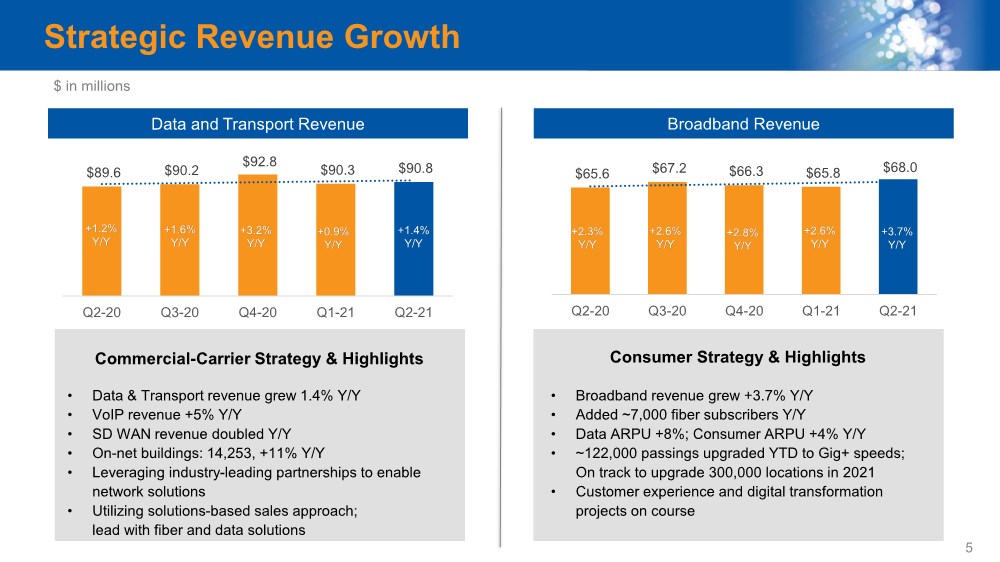
| $65.6 $67.2 $66.3 $65.8 $68.0 Q2-20 Q3-20 Q4-20 Q1-21 Q2-21 $89.6 $90.2 $92.8 $90.3 $90.8 Q2-20 Q3-20 Q4-20 Q1-21 Q2-21 Strategic Revenue Growth • Broadband revenue grew +3.7% Y/Y • Added ~7,000 fiber subscribers Y/Y • Data ARPU +8%; Consumer ARPU +4% Y/Y • ~122,000 passings upgraded YTD to Gig+ speeds; On track to upgrade 300,000 locations in 2021 • Customer experience and digital transformation projects on course Consumer Strategy & Highlights $ in millions 5 Broadband Revenue +3.7% Y/Y +2.6% Y/Y +2.8% Y/Y +2.6% Y/Y +2.3% Y/Y Data and Transport Revenue +1.4% Y/Y +0.9% Y/Y +3.2% Y/Y +1.6% Y/Y +1.2% Y/Y • Data & Transport revenue grew 1.4% Y/Y • VoIP revenue +5% Y/Y • SD WAN revenue doubled Y/Y • On-net buildings: 14,253, +11% Y/Y • Leveraging industry-leading partnerships to enable network solutions • Utilizing solutions-based sales approach; lead with fiber and data solutions Commercial-Carrier Strategy & Highlights |
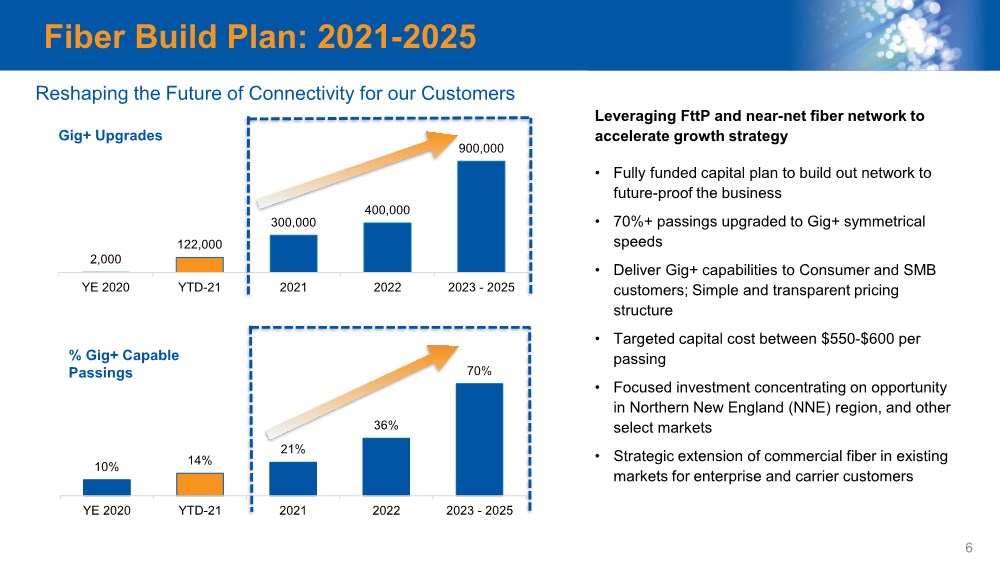
| 2,000 122,000 300,000 400,000 900,000 YE 2020 YTD-21 2021 2022 2023 - 2025 10% 14% 21% 36% 70% YE 2020 YTD-21 2021 2022 2023 - 2025 Fiber Build Plan: 2021-2025 Reshaping the Future of Connectivity for our Customers Leveraging FttP and near-net fiber network to accelerate growth strategy • Fully funded capital plan to build out network to future-proof the business • 70%+ passings upgraded to Gig+ symmetrical speeds • Deliver Gig+ capabilities to Consumer and SMB customers; Simple and transparent pricing structure • Targeted capital cost between $550-$600 per passing • Focused investment concentrating on opportunity in Northern New England (NNE) region, and other select markets • Strategic extension of commercial fiber in existing markets for enterprise and carrier customers Gig+ Upgrades % Gig+ Capable Passings 6 |
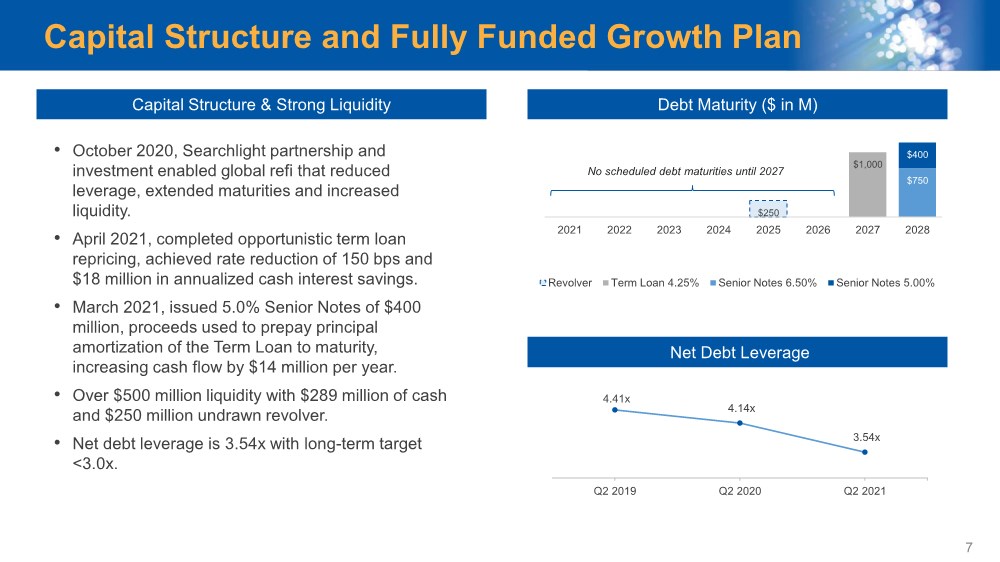
| Capital Structure and Fully Funded Growth Plan 7 Debt Maturity ($ in M) $250 $1,000 $750 $400 2021 2022 2023 2024 2025 2026 2027 2028 Revolver Term Loan 4.25% Senior Notes 6.50% Senior Notes 5.00% No scheduled debt maturities until 2027 • October 2020, Searchlight partnership and investment enabled global refi that reduced leverage, extended maturities and increased liquidity. • April 2021, completed opportunistic term loan repricing, achieved rate reduction of 150 bps and $18 million in annualized cash interest savings. • March 2021, issued 5.0% Senior Notes of $400 million, proceeds used to prepay principal amortization of the Term Loan to maturity, increasing cash flow by $14 million per year. • Over $500 million liquidity with $289 million of cash and $250 million undrawn revolver. • Net debt leverage is 3.54x with long-term target <3.0x. Capital Structure & Strong Liquidity Net Debt Leverage 4.41x 4.14x 3.54x Q2 2019 Q2 2020 Q2 2021 |
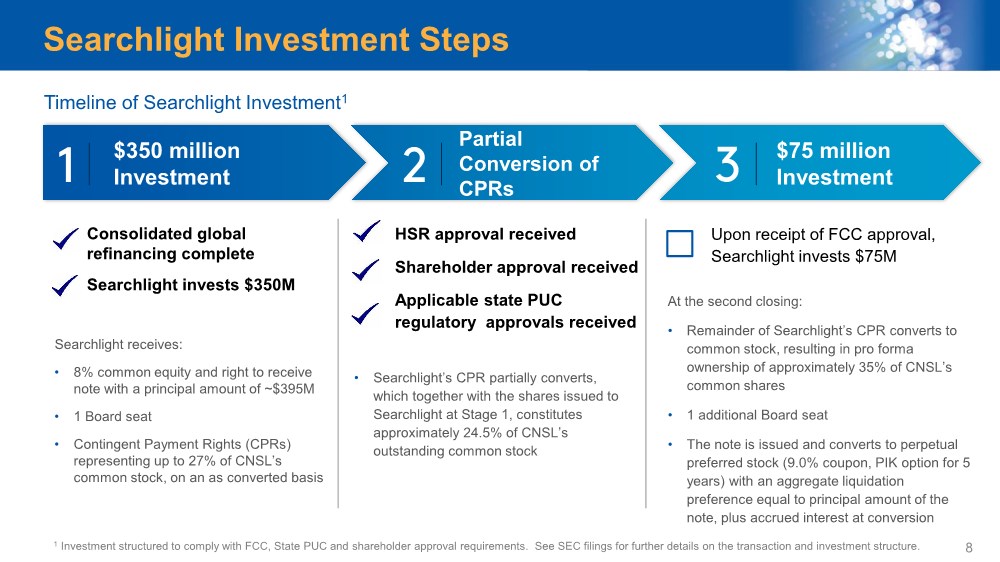
| Searchlight receives: • 8% common equity and right to receive note with a principal amount of ~$395M • 1 Board seat • Contingent Payment Rights (CPRs) representing up to 27% of CNSL’s common stock, on an as converted basis • Searchlight’s CPR partially converts, which together with the shares issued to Searchlight at Stage 1, constitutes approximately 24.5% of CNSL’s outstanding common stock Searchlight Investment Steps $75 million Investment $350 million Investment Partial Conversion of CPRs 1 Investment structured to comply with FCC, State PUC and shareholder approval requirements. See SEC filings for further details on the transaction and investment structure. Timeline of Searchlight Investment1 Consolidated global refinancing complete Searchlight invests $350M HSR approval received Shareholder approval received Applicable state PUC regulatory approvals received At the second closing: • Remainder of Searchlight’s CPR converts to common stock, resulting in pro forma ownership of approximately 35% of CNSL’s common shares • 1 additional Board seat • The note is issued and converts to perpetual preferred stock (9.0% coupon, PIK option for 5 years) with an aggregate liquidation preference equal to principal amount of the note, plus accrued interest at conversion Upon receipt of FCC approval, Searchlight invests $75M 8 |
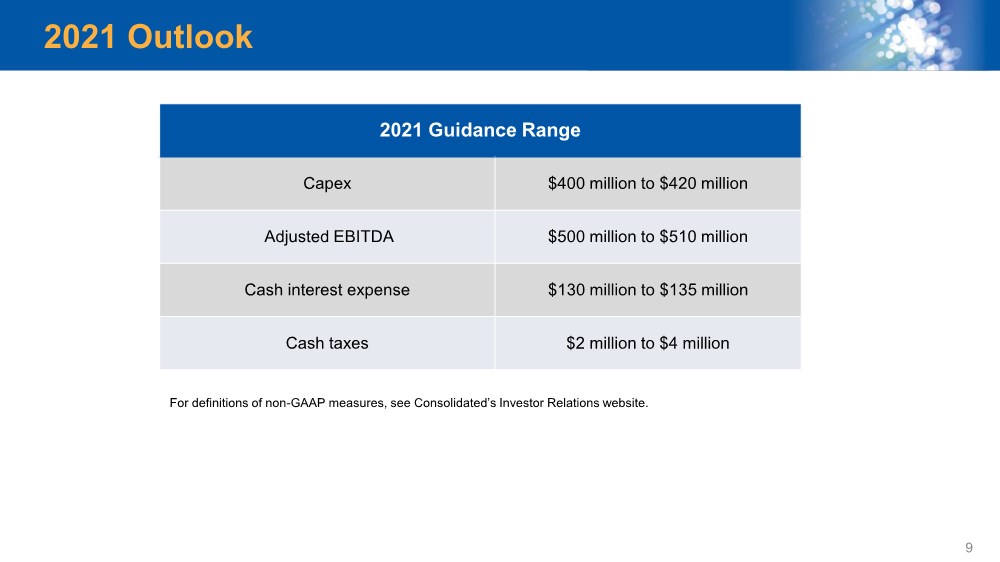
| 2021 Outlook 9 2021 Guidance Range Capex $400 million to $420 million Adjusted EBITDA $500 million to $510 million Cash interest expense $130 million to $135 million Cash taxes $2 million to $4 million For definitions of non-GAAP measures, see Consolidated’s Investor Relations website. |
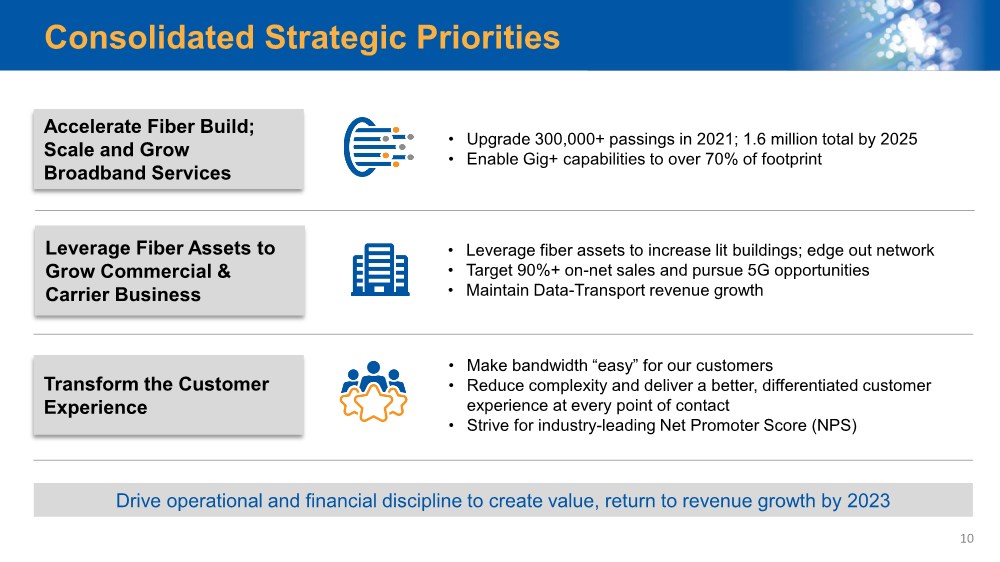
| Consolidated Strategic Priorities • Upgrade 300,000+ passings in 2021; 1.6 million total by 2025 • Enable Gig+ capabilities to over 70% of footprint Accelerate Fiber Build; Scale and Grow Broadband Services Leverage Fiber Assets to Grow Commercial & Carrier Business • Leverage fiber assets to increase lit buildings; edge out network • Target 90%+ on-net sales and pursue 5G opportunities • Maintain Data-Transport revenue growth • Make bandwidth “easy” for our customers • Reduce complexity and deliver a better, differentiated customer experience at every point of contact • Strive for industry-leading Net Promoter Score (NPS) Transform the Customer Experience Drive operational and financial discipline to create value, return to revenue growth by 2023 10 |
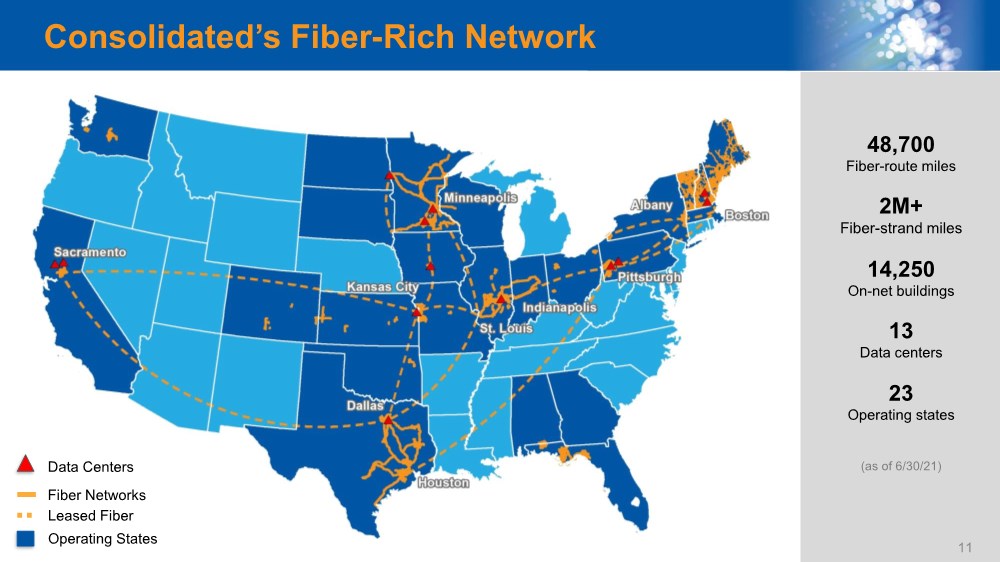
| Consolidated’s Fiber-Rich Network 48,700 Fiber-route miles 2M+ Fiber-strand miles 14,250 On-net buildings 13 Data centers 23 Operating states (as of 6/30/21) Data Centers Operating States Fiber Networks Leased Fiber 11 |
| Q&A Q2 2021 Earnings |