Attached files
| file | filename |
|---|---|
| 8-K - 8-K - PEAPACK GLADSTONE FINANCIAL CORP | pgc-8k_20210728.htm |
Q2 2021 Investor Update (and Supplemental Financial Information) 06/30/2021 Peapack-Gladstone Bank The Q2 2021 Investor Update (and Supplemental Financial Information) should be read in conjunction with the Q2 2021 Earnings Release issued on July 28, 2021. Exhibit 99.1
Statement Regarding Forward-Looking Information This presentation contains forward-looking statements within the meaning of the Private Securities Litigation Reform Act of 1995. Such statements are not historical facts and may include expressions about Management’s strategies and Management’s expectations about financial results, new and existing programs and products, investments, relationships, opportunities and market conditions. These statements may be identified by such forward-looking terminology as “expect,” “look,” “believe,” “anticipate,” “may,” or similar statements or variations of such terms. Actual results may differ materially from such forward-looking statements. Factors that may cause actual results to differ materially from those contemplated by such forward-looking statements include, but are not limited to: 1) our inability to successfully grow our business and implement our strategic plan, including an inability to generate revenues to offset the increased personnel and other costs related to the strategic plan; 2) the impact of anticipated higher operating expenses in 2020 and beyond; 3) our inability to successfully integrate wealth management firm acquisitions; 4) our inability to manage our growth; 5) our inability to successfully integrate our expanded employee base; 6) an unexpected decline in the economy, in particular in our New Jersey and New York market areas; 7) declines in our net interest margin caused by the interest rate environment (including the shape of yield curve) and our highly competitive market; 8) declines in the value in our investment portfolio; 9) impact on our business from a pandemic event on our business, operations, customers, allowance for loan losses, and capital levels; 10) higher than expected increases in our allowance for loan and lease losses; 11) higher than expected increases in loan and lease losses or in the level of nonperforming loans; 12) changes in interest rates; 13) a decline in real estate values within our market areas; 14) legislative and regulatory actions (including the impact of the Dodd-Frank Wall Street Reform and Consumer Protection Act, Basel III and related regulations) that may result in increased compliance costs; 15) changes in monetary policy by the Federal Reserve Board; 16) changes to tax or accounting matters; 17) successful cyberattacks against our IT infrastructure and that of our IT providers; 18) higher than expected FDIC insurance premiums; 19) adverse weather conditions; 20) our inability to successfully generate business in new geographic markets; 21) a reduction in our lower-cost funding sources; 22) our inability to adapt to technological changes; 23) claims and litigation pertaining to fiduciary responsibility, environmental laws and other matters; 24) our inability to retain key employees; 25) demands for loans and deposits in our market areas; 26) adverse changes in securities markets and 27) other unexpected material adverse changes in our operations or earnings. Further, given its ongoing and dynamic nature, it is difficult to predict the full impact of the COVID-19 outbreak on our business. The extent of such impact will depend on future developments, which are highly uncertain, including when the coronavirus can be controlled and abated and whether the gradual reopening of businesses will result in a meaningful increase in economic activity. As the result of the COVID-19 pandemic and the related adverse local and national economic consequences, we could be subject to any of the following risks, any of which could have a material, adverse effect on our business, financial condition, liquidity, and results of operations: 1) demand for our products and services may decline, making it difficult to grow assets and income; 2) if the economy is unable to substantially reopen, and high levels of unemployment continue for an extended period of time, loan delinquencies, problem assets, and foreclosures may increase, resulting in increased charges and reduced income; 3) collateral for loans, especially real estate, may decline in value, which could cause loan losses to increase; 4) our allowance for loan losses may increase if borrowers experience financial difficulties, which will adversely affect our net income; 5) the net worth and liquidity of loan guarantors may decline, impairing their ability to honor commitments to us; 6) a material decrease in net income or a net loss over several quarters could result in the elimination or a decrease in the rate of our quarterly cash dividend; 7) our wealth management revenues may decline with continuing market turmoil; 8) our cyber security risks are increased as the result of an increase in the number of employees working remotely; and 9) FDIC premiums may increase if the agency experience additional resolution costs. The Company undertakes no duty to update any forward-looking statement to conform the statement to actual results or changes in the Company’s expectations. Although we believe that the expectations reflected in the forward-looking statements are reasonable, the Company cannot guarantee future results, levels of activity, performance or achievements. 2
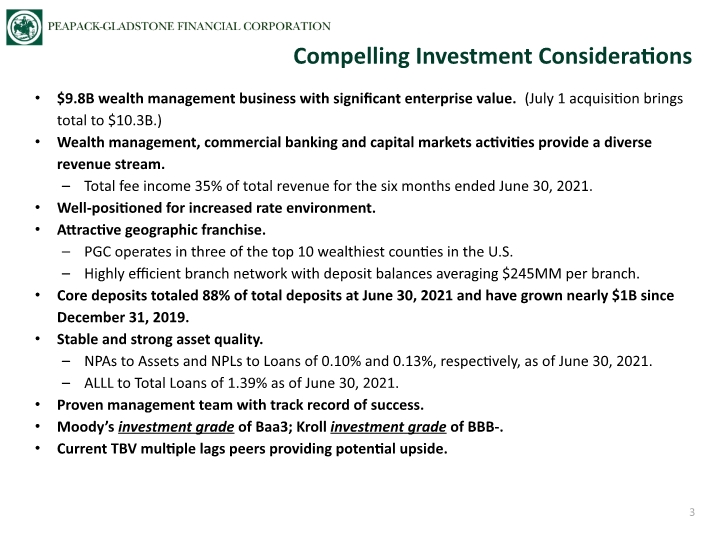
$9.8B wealth management business with significant enterprise value. (July 1 acquisition brings total to $10.3B.) Wealth management, commercial banking and capital markets activities provide a diverse revenue stream. Total fee income 35% of total revenue for the six months ended June 30, 2021. Well-positioned for increased rate environment. Attractive geographic franchise. PGC operates in three of the top 10 wealthiest counties in the U.S. Highly efficient branch network with deposit balances averaging $245MM per branch. Core deposits totaled 88% of total deposits at June 30, 2021 and have grown nearly $1B since December 31, 2019. Stable and strong asset quality. NPAs to Assets and NPLs to Loans of 0.10% and 0.13%, respectively, as of June 30, 2021. ALLL to Total Loans of 1.39% as of June 30, 2021. Proven management team with track record of success. Moody’s investment grade of Baa3; Kroll investment grade of BBB-. Current TBV multiple lags peers providing potential upside. Compelling Investment Considerations 3
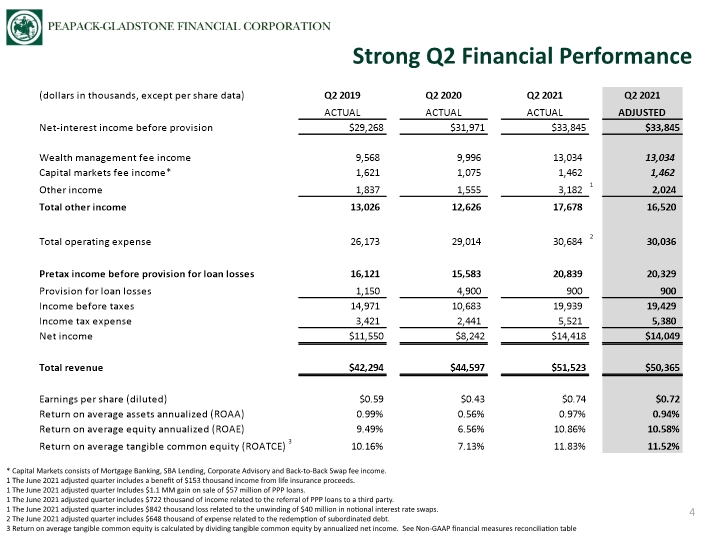
Strong Q2 Financial Performance 4 * Capital Markets consists of Mortgage Banking, SBA Lending, Corporate Advisory and Back-to-Back Swap fee income. 1 The June 2021 adjusted quarter includes a benefit of $153 thousand income from life insurance proceeds. 1 The June 2021 adjusted quarter Includes $1.1 MM gain on sale of $57 million of PPP loans. 1 The June 2021 adjusted quarter includes $722 thousand of income related to the referral of PPP loans to a third party. 1 The June 2021 adjusted quarter includes $842 thousand loss related to the unwinding of $40 million in notional interest rate swaps. 2 The June 2021 adjusted quarter includes $648 thousand of expense related to the redemption of subordinated debt. 3 Return on average tangible common equity is calculated by dividing tangible common equity by annualized net income. See Non-GAAP financial measures reconciliation table
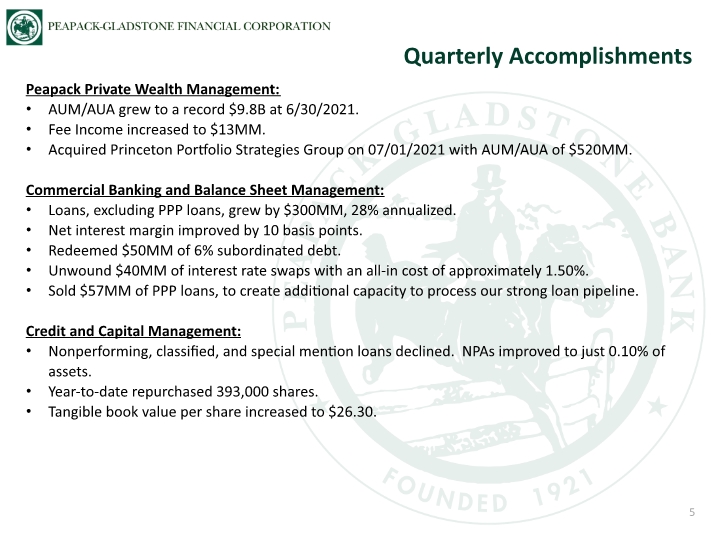
Peapack Private Wealth Management: AUM/AUA grew to a record $9.8B at 6/30/2021. Fee Income increased to $13MM. Acquired Princeton Portfolio Strategies Group on 07/01/2021 with AUM/AUA of $520MM. Commercial Banking and Balance Sheet Management: Loans, excluding PPP loans, grew by $300MM, 28% annualized. Net interest margin improved by 10 basis points. Redeemed $50MM of 6% subordinated debt. Unwound $40MM of interest rate swaps with an all-in cost of approximately 1.50%. Sold $57MM of PPP loans, to create additional capacity to process our strong loan pipeline. Credit and Capital Management: Nonperforming, classified, and special mention loans declined. NPAs improved to just 0.10% of assets. Year-to-date repurchased 393,000 shares. Tangible book value per share increased to $26.30. Quarterly Accomplishments 5
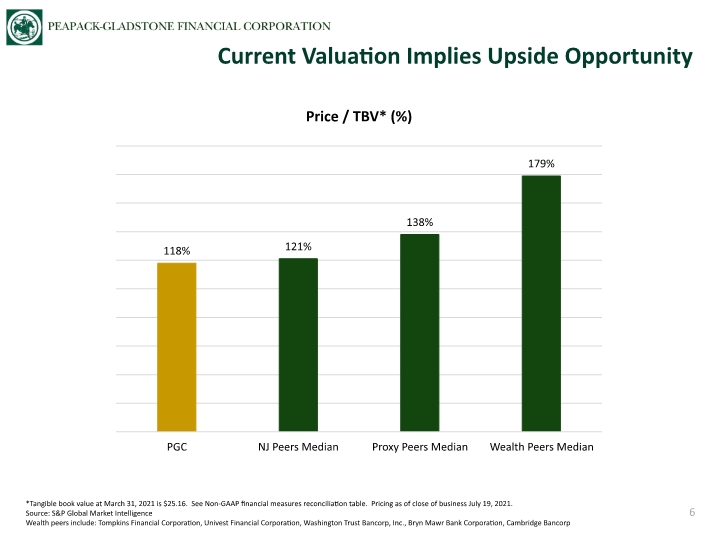
Current Valuation Implies Upside Opportunity 6 *Tangible book value at March 31, 2021 is $25.16. See Non-GAAP financial measures reconciliation table. Pricing as of close of business July 19, 2021. Source: S&P Global Market Intelligence Wealth peers include: Tompkins Financial Corporation, Univest Financial Corporation, Washington Trust Bancorp, Inc., Bryn Mawr Bank Corporation, Cambridge Bancorp Price / TBV* (%)
Largest NJ-headquartered, bank-owned trust company. 5 acquisitions and 2 lift-outs with total AUMs of $2.95B since 2015. Acquisition of Princeton Portfolio Strategies Group ($520MM) completed 7/1/2021. 2,500+ relationships. Average relationship size $3.5MM. “Sweet Spot” is HNW individuals with $2MM to $20MM liquidity. Current annualized run-rate fee revenue $50MM. Revenue CAGR of 21% since 2015. 9 private banking offices in NJ, DE & FL. High quality professional team of over 100. Peapack Private Wealth Management Snapshot 7
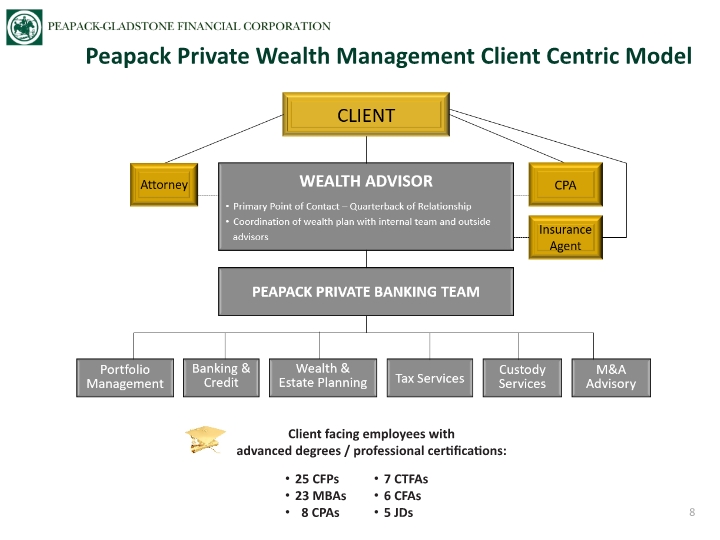
Client facing employees with advanced degrees / professional certifications: Peapack Private Wealth Management Client Centric Model 25 CFPs 23 MBAs 8 CPAs 7 CTFAs 6 CFAs 5 JDs 8
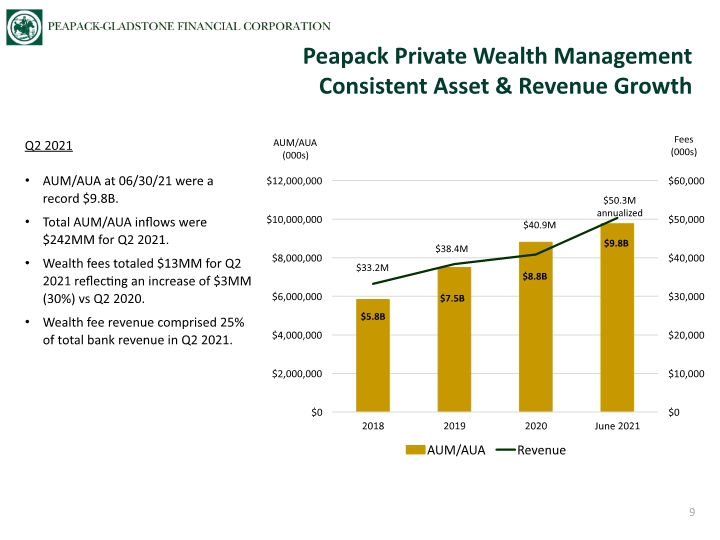
AUM/AUA (000s) Fees (000s) Peapack Private Wealth Management Consistent Asset & Revenue Growth Q2 2021 AUM/AUA at 06/30/21 were a record $9.8B. Total AUM/AUA inflows were $242MM for Q2 2021. Wealth fees totaled $13MM for Q2 2021 reflecting an increase of $3MM (30%) vs Q2 2020. Wealth fee revenue comprised 25% of total bank revenue in Q2 2021. 9
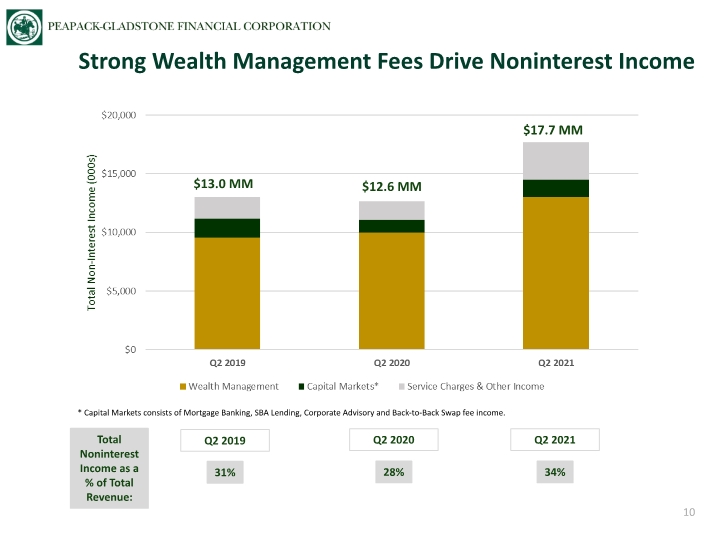
Strong Wealth Management Fees Drive Noninterest Income 10 * Capital Markets consists of Mortgage Banking, SBA Lending, Corporate Advisory and Back-to-Back Swap fee income. $13.0 MM $12.6 MM $17.7 MM Total Noninterest Income as a % of Total Revenue: 31% 28% 34% Q2 2019 Q2 2020 Q2 2021
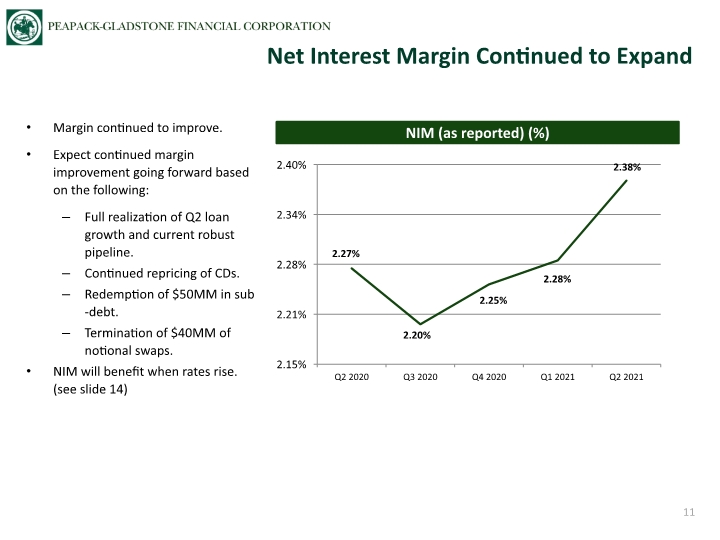
NIM (as reported) (%) 11 Net Interest Margin Continued to Expand Margin continued to improve. Expect continued margin improvement going forward based on the following: Full realization of Q2 loan growth and current robust pipeline. Continued repricing of CDs. Redemption of $50MM in sub-debt. Termination of $40MM of notional swaps. NIM will benefit when rates rise. (see slide 14)
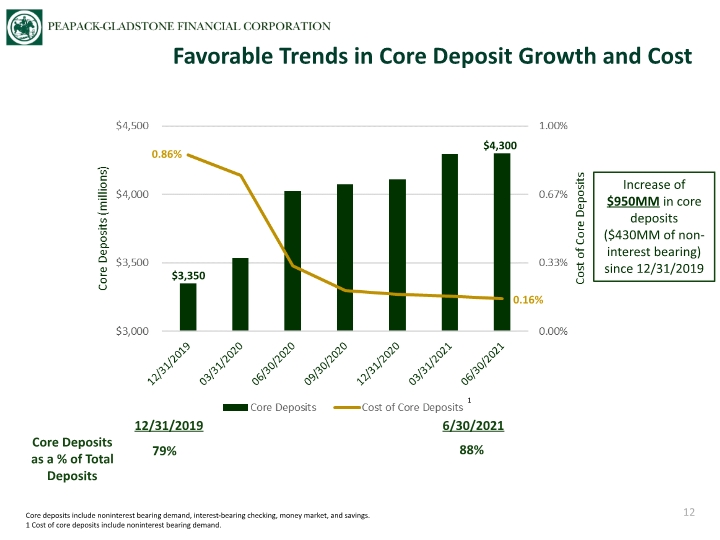
12 Favorable Trends in Core Deposit Growth and Cost Increase of $950MM in core deposits ($430MM of non-interest bearing) since 12/31/2019 Core Deposits as a % of Total Deposits 88% 79% 12/31/2019 6/30/2021 $3,350 $4,300 0.16% 0.86% Core deposits include noninterest bearing demand, interest-bearing checking, money market, and savings. 1 Cost of core deposits include noninterest bearing demand. 1
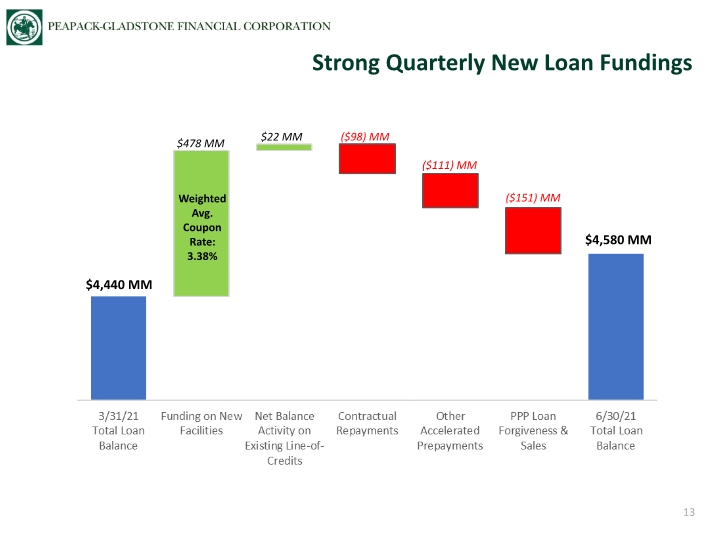
13 $4,580 MM ($98) MM $478 MM Strong Quarterly New Loan Fundings ($111) MM $4,440 MM $22 MM ($151) MM Weighted Avg. Coupon Rate: 3.38%
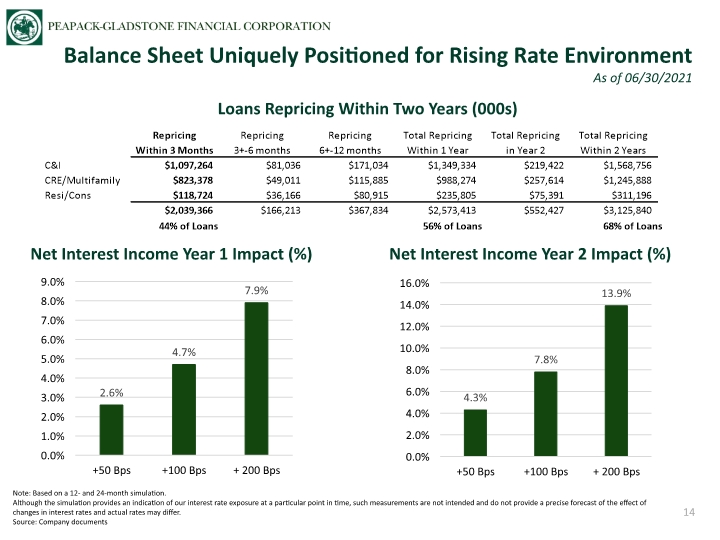
14 Balance Sheet Uniquely Positioned for Rising Rate Environment As of 06/30/2021 Net Interest Income Year 1 Impact (%) Note: Based on a 12- and 24-month simulation. Although the simulation provides an indication of our interest rate exposure at a particular point in time, such measurements are not intended and do not provide a precise forecast of the effect of changes in interest rates and actual rates may differ. Source: Company documents Loans Repricing Within Two Years (000s) Net Interest Income Year 2 Impact (%)
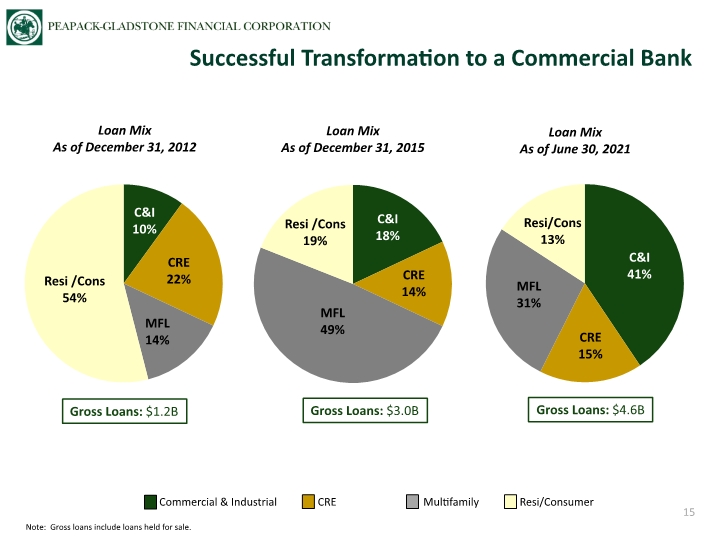
Note: Gross loans include loans held for sale. 15 MFL 31% CRE 15% C&I 41% Resi/Cons 13% Resi /Cons 54% C&I 10% CRE 22% MFL 14% Loan Mix As of June 30, 2021 Loan Mix As of December 31, 2012 Gross Loans: $1.2B Gross Loans: $4.6B Commercial & Industrial CRE Multifamily Resi/Consumer Resi /Cons 19% C&I 18% CRE 14% MFL 49% Loan Mix As of December 31, 2015 Gross Loans: $3.0B Successful Transformation to a Commercial Bank
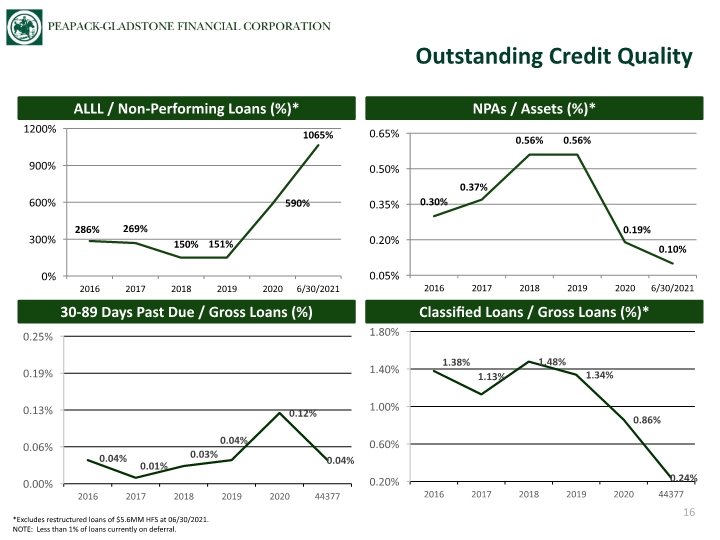
NPAs / Assets (%)* ALLL / Non-Performing Loans (%)* 30-89 Days Past Due / Gross Loans (%) Outstanding Credit Quality 16 *Excludes restructured loans of $5.6MM HFS at 06/30/2021. NOTE: Less than 1% of loans currently on deferral. Classified Loans / Gross Loans (%)*
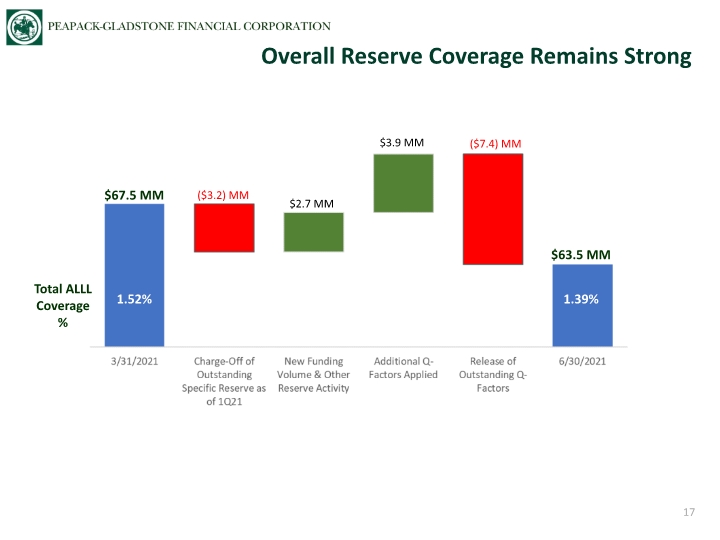
17 Overall Reserve Coverage Remains Strong $63.5 MM $67.5 MM ($3.2) MM $3.9 MM $2.7 MM 1.52% 1.39% Total ALLL Coverage % ($7.4) MM
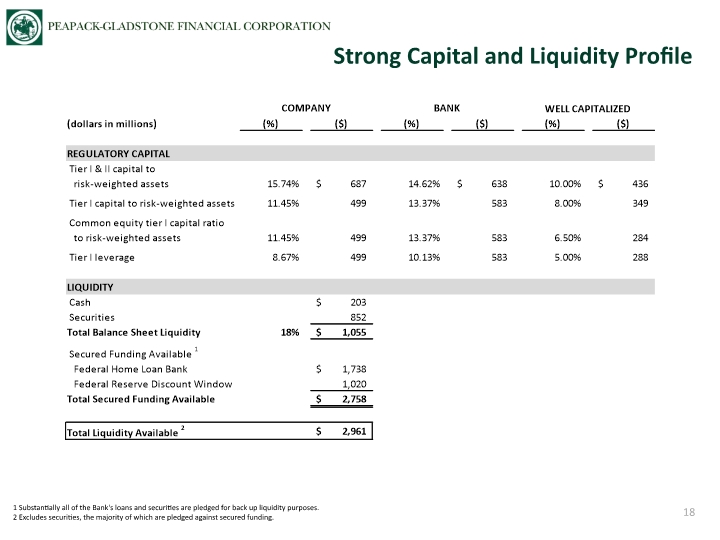
Strong Capital and Liquidity Profile 18 1 Substantially all of the Bank's loans and securities are pledged for back up liquidity purposes. 2 Excludes securities, the majority of which are pledged against secured funding.
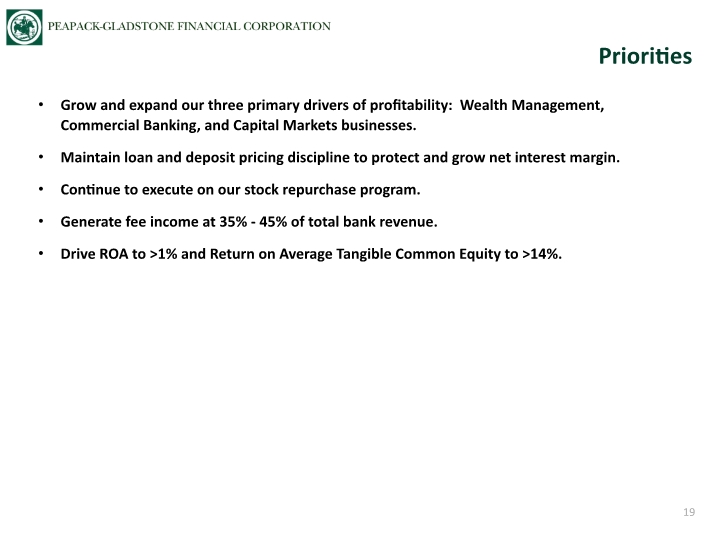
Grow and expand our three primary drivers of profitability: Wealth Management, Commercial Banking, and Capital Markets businesses. Maintain loan and deposit pricing discipline to protect and grow net interest margin. Continue to execute on our stock repurchase program. Generate fee income at 35% - 45% of total bank revenue. Drive ROA to >1% and Return on Average Tangible Common Equity to >14%. Priorities 19
Appendix Peapack-Gladstone Bank
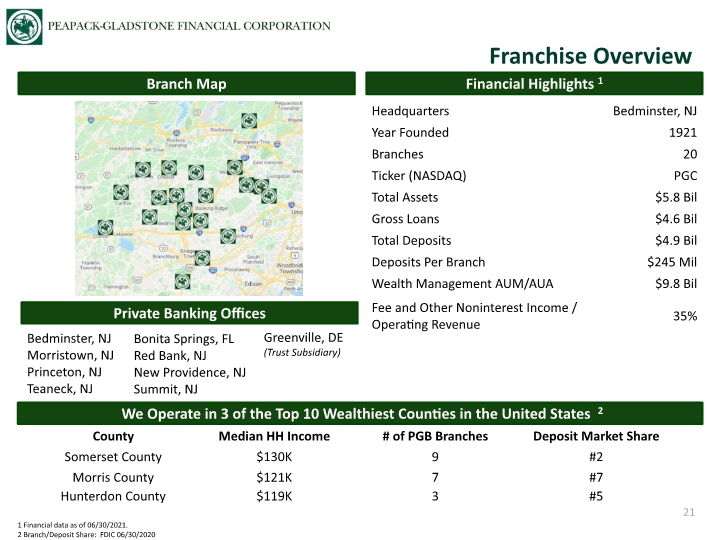
Financial Highlights 1 Branch Map Franchise Overview 21 Private Banking Offices Bedminster, NJ Morristown, NJ Princeton, NJ Teaneck, NJ Bonita Springs, FL Red Bank, NJ New Providence, NJ Summit, NJ We Operate in 3 of the Top 10 Wealthiest Counties in the United States 2 1 Financial data as of 06/30/2021. 2 Branch/Deposit Share: FDIC 06/30/2020 Greenville, DE (Trust Subsidiary)
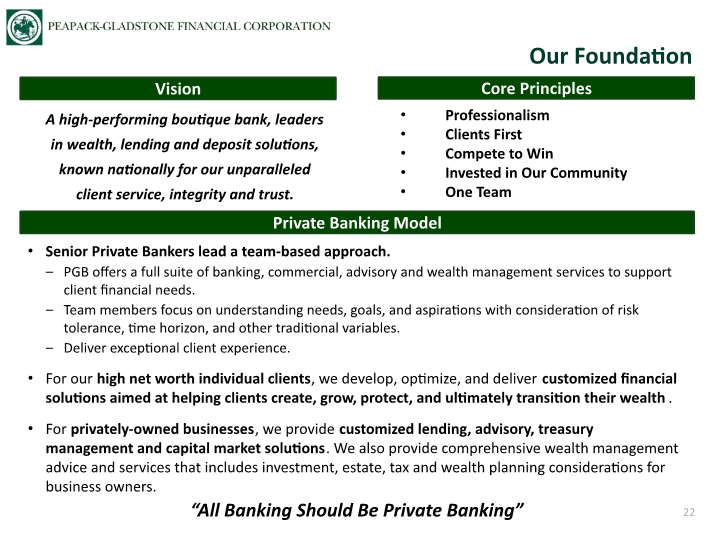
A high-performing boutique bank, leaders in wealth, lending and deposit solutions, known nationally for our unparalleled client service, integrity and trust. Professionalism Clients First Compete to Win Invested in Our Community One Team Vision 22 Senior Private Bankers lead a team-based approach. PGB offers a full suite of banking, commercial, advisory and wealth management services to support client financial needs. Team members focus on understanding needs, goals, and aspirations with consideration of risk tolerance, time horizon, and other traditional variables. Deliver exceptional client experience. For our high net worth individual clients, we develop, optimize, and deliver customized financial solutions aimed at helping clients create, grow, protect, and ultimately transition their wealth. For privately-owned businesses, we provide customized lending, advisory, treasury management and capital market solutions. We also provide comprehensive wealth management advice and services that includes investment, estate, tax and wealth planning considerations for business owners. “All Banking Should Be Private Banking” Private Banking Model Core Principles Our Foundation
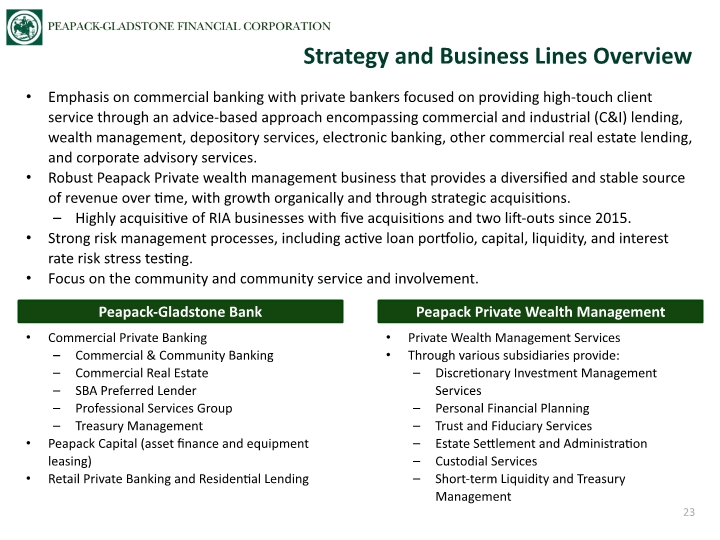
Emphasis on commercial banking with private bankers focused on providing high-touch client service through an advice-based approach encompassing commercial and industrial (C&I) lending, wealth management, depository services, electronic banking, other commercial real estate lending, and corporate advisory services. Robust Peapack Private wealth management business that provides a diversified and stable source of revenue over time, with growth organically and through strategic acquisitions. Highly acquisitive of RIA businesses with five acquisitions and two lift-outs since 2015. Strong risk management processes, including active loan portfolio, capital, liquidity, and interest rate risk stress testing. Focus on the community and community service and involvement. Strategy and Business Lines Overview 23 Peapack-Gladstone Bank Peapack Private Wealth Management Commercial Private Banking Commercial & Community Banking Commercial Real Estate SBA Preferred Lender Professional Services Group Treasury Management Peapack Capital (asset finance and equipment leasing) Retail Private Banking and Residential Lending Private Wealth Management Services Through various subsidiaries provide: Discretionary Investment Management Services Personal Financial Planning Trust and Fiduciary Services Estate Settlement and Administration Custodial Services Short-term Liquidity and Treasury Management
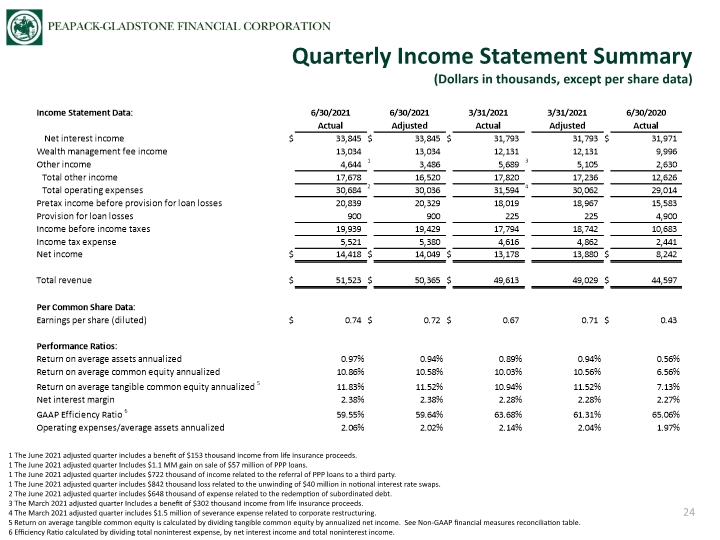
Quarterly Income Statement Summary (Dollars in thousands, except per share data) 24
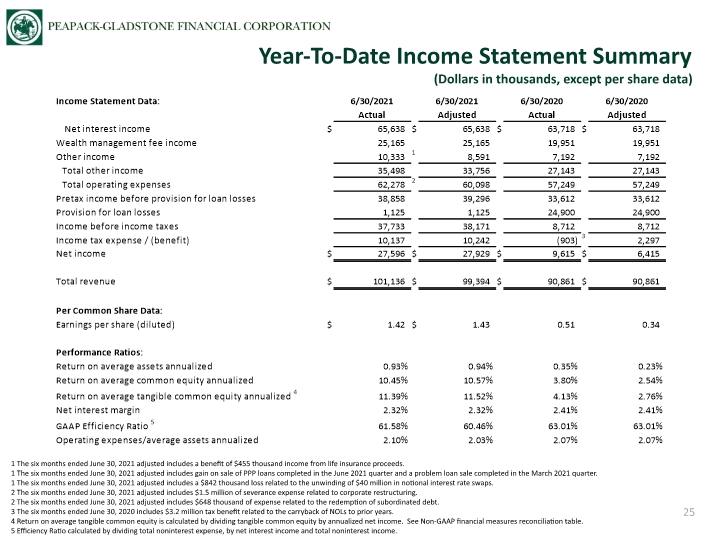
Year-To-Date Income Statement Summary (Dollars in thousands, except per share data) 25
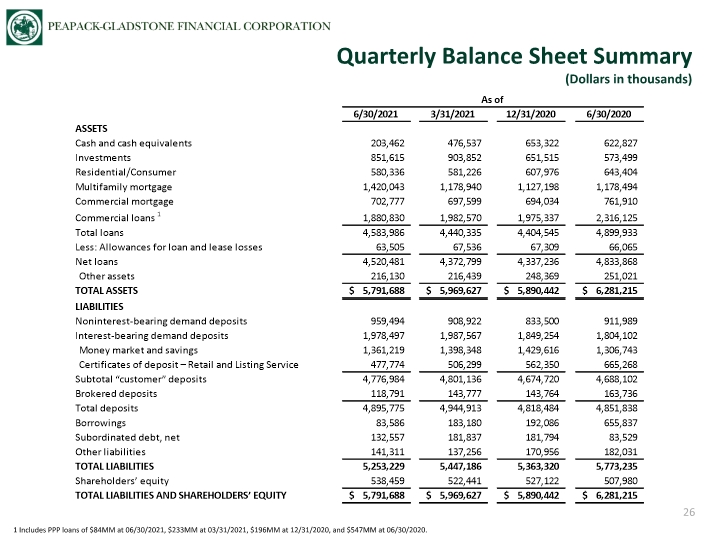
Quarterly Balance Sheet Summary (Dollars in thousands) 26 1 Includes PPP loans of $84MM at 06/30/2021, $233MM at 03/31/2021, $196MM at 12/31/2020, and $547MM at 06/30/2020.
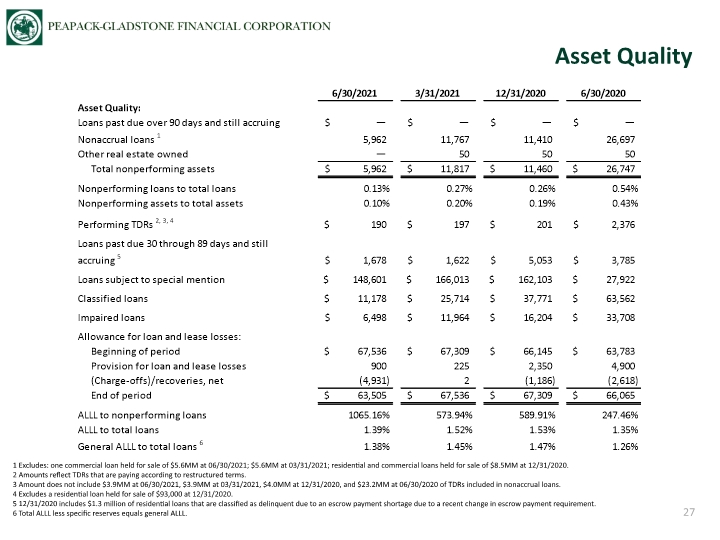
Asset Quality 27 1 Excludes: one commercial loan held for sale of $5.6MM at 06/30/2021; $5.6MM at 03/31/2021; residential and commercial loans held for sale of $8.5MM at 12/31/2020. 2 Amounts reflect TDRs that are paying according to restructured terms. 3 Amount does not include $3.9MM at 06/30/2021, $3.9MM at 03/31/2021, $4.0MM at 12/31/2020, and $23.2MM at 06/30/2020 of TDRs included in nonaccrual loans. 4 Excludes a residential loan held for sale of $93,000 at 12/31/2020. 5 12/31/2020 includes $1.3 million of residential loans that are classified as delinquent due to an escrow payment shortage due to a recent change in escrow payment requirement. 6 Total ALLL less specific reserves equals general ALLL.
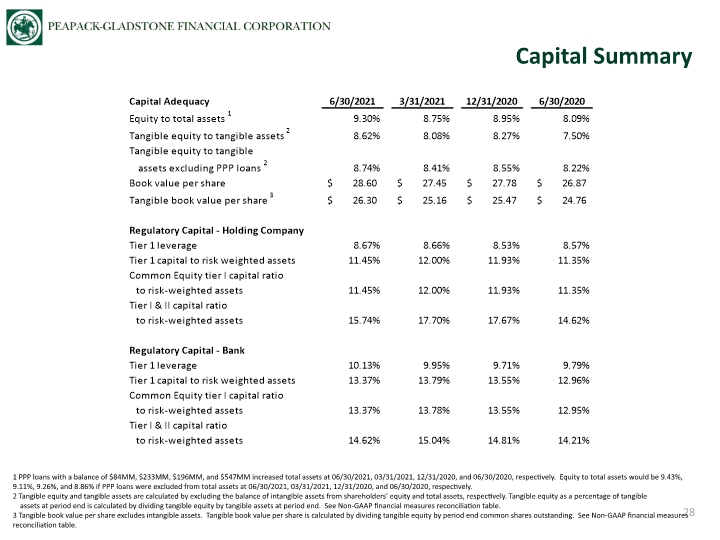
Capital Summary 28 1 PPP loans with a balance of $84MM, $233MM, $196MM, and $547MM increased total assets at 06/30/2021, 03/31/2021, 12/31/2020, and 06/30/2020, respectively. Equity to total assets would be 9.43%, 9.11%, 9.26%, and 8.86% if PPP loans were excluded from total assets at 06/30/2021, 03/31/2021, 12/31/2020, and 06/30/2020, respectively. 2 Tangible equity and tangible assets are calculated by excluding the balance of intangible assets from shareholders’ equity and total assets, respectively. Tangible equity as a percentage of tangible assets at period end is calculated by dividing tangible equity by tangible assets at period end. See Non-GAAP financial measures reconciliation table. 3 Tangible book value per share excludes intangible assets. Tangible book value per share is calculated by dividing tangible equity by period end common shares outstanding. See Non-GAAP financial measures reconciliation table.
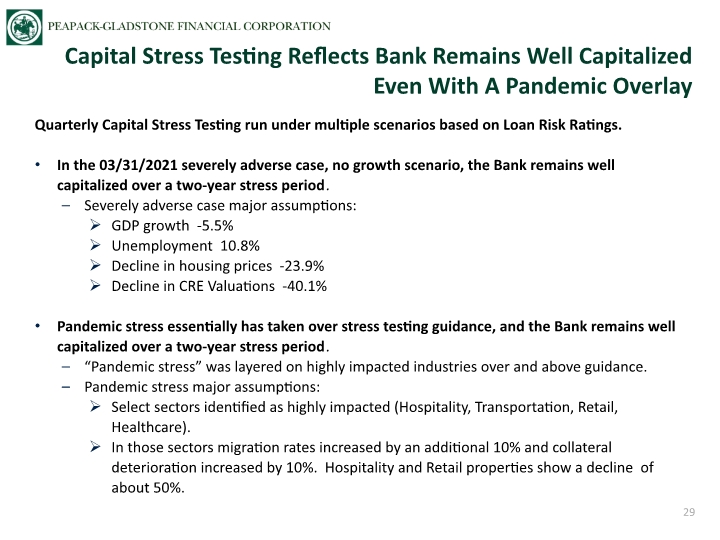
29 Quarterly Capital Stress Testing run under multiple scenarios based on Loan Risk Ratings. In the 03/31/2021 severely adverse case, no growth scenario, the Bank remains well capitalized over a two-year stress period. Severely adverse case major assumptions: GDP growth -5.5% Unemployment 10.8% Decline in housing prices -23.9% Decline in CRE Valuations -40.1% Pandemic stress essentially has taken over stress testing guidance, and the Bank remains well capitalized over a two-year stress period. “Pandemic stress” was layered on highly impacted industries over and above guidance. Pandemic stress major assumptions: Select sectors identified as highly impacted (Hospitality, Transportation, Retail, Healthcare). In those sectors migration rates increased by an additional 10% and collateral deterioration increased by 10%. Hospitality and Retail properties show a decline of about 50%. Capital Stress Testing Reflects Bank Remains Well Capitalized Even With A Pandemic Overlay
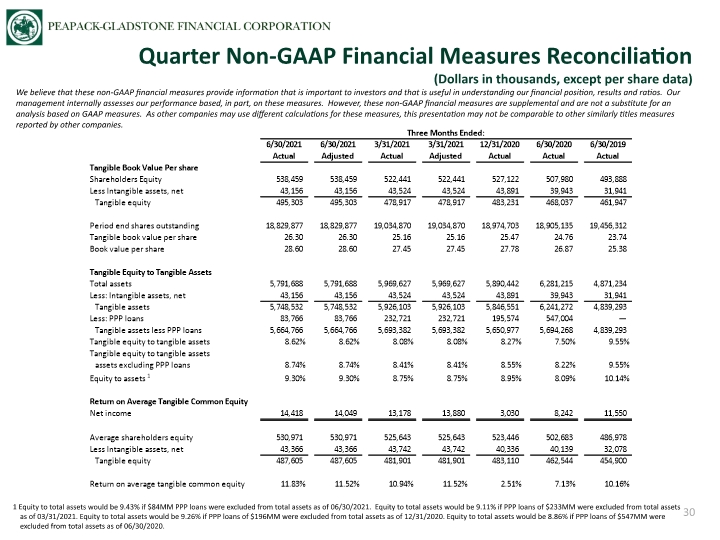
Quarter Non-GAAP Financial Measures Reconciliation (Dollars in thousands, except per share data) 30 We believe that these non-GAAP financial measures provide information that is important to investors and that is useful in understanding our financial position, results and ratios. Our management internally assesses our performance based, in part, on these measures. However, these non-GAAP financial measures are supplemental and are not a substitute for an analysis based on GAAP measures. As other companies may use different calculations for these measures, this presentation may not be comparable to other similarly titles measures reported by other companies. 1 Equity to total assets would be 9.43% if $84MM PPP loans were excluded from total assets as of 06/30/2021. Equity to total assets would be 9.11% if PPP loans of $233MM were excluded from total assets as of 03/31/2021. Equity to total assets would be 9.26% if PPP loans of $196MM were excluded from total assets as of 12/31/2020. Equity to total assets would be 8.86% if PPP loans of $547MM were excluded from total assets as of 06/30/2020.
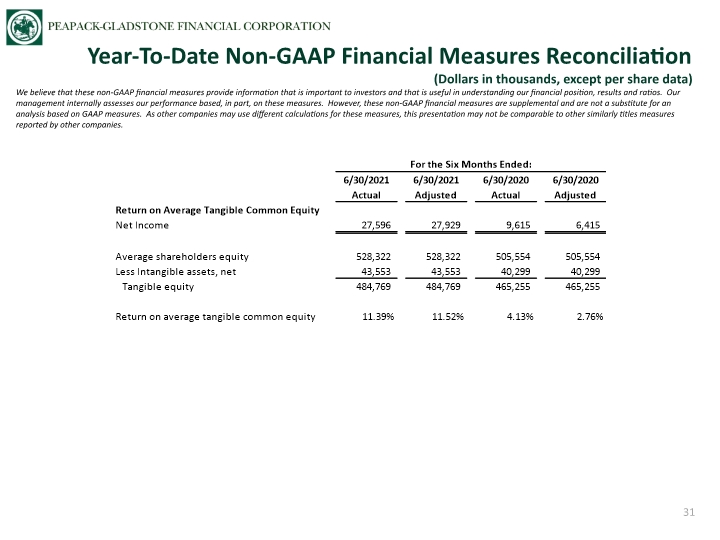
Year-To-Date Non-GAAP Financial Measures Reconciliation (Dollars in thousands, except per share data) 31 We believe that these non-GAAP financial measures provide information that is important to investors and that is useful in understanding our financial position, results and ratios. Our management internally assesses our performance based, in part, on these measures. However, these non-GAAP financial measures are supplemental and are not a substitute for an analysis based on GAAP measures. As other companies may use different calculations for these measures, this presentation may not be comparable to other similarly titles measures reported by other companies.
Peapack-Gladstone Financial Corporation 500 Hills Drive, Suite 300 P.O. Box 700 Bedminster, New Jersey 07921 (908) 234-0700 www.pgbank.com Douglas L. Kennedy President & Chief Executive Officer (908) 719-6554 dkennedy@pgbank.com Jeffrey J. Carfora Senior EVP & Chief Financial Officer (908) 719-4308 jcarfora@pgbank.com John P. Babcock Senior EVP & President of Peapack Private Wealth Management (908) 719-3301 jbabcock@pgbank.com Contacts Corporate Headquarters Contact 32
