Attached files
| file | filename |
|---|---|
| EX-99.1 - EXHIBIT 99.1 - NABORS INDUSTRIES LTD | tm2123280d1_ex99-1.htm |
| 8-K - FORM 8-K - NABORS INDUSTRIES LTD | tm2123280d1_8k.htm |
Exhibit 99.2

1 7/28/2021 NABORS INDUSTRIES LTD. 2Q Earnings Presentation

2 Forward Looking Statements We often discuss expectations regarding our future markets, demand for our products and services, and our performance in our annual, quarterly, and current reports, press releases, and other written and oral statements . Such statements, including statements in this document that relate to matters that are not historical facts, are “forward - looking statements” within the meaning of the safe harbor provisions of Section 27 A of the U . S . Securities Act of 1933 and Section 21 E of the U . S . Securities Exchange Act of 1934 . These “forward - looking statements” are based on our analysis of currently available competitive, financial and economic data and our operating plans . They are inherently uncertain, and investors should recognize that events and actual results could turn out to be significantly different from our expectations . Factors to consider when evaluating these forward - looking statements include, but are not limited to: • the Covid - 19 pandemic and its impact on oil and gas markets and prices; • fluctuations and volatility in worldwide prices of and demand for oil and natural gas; • fluctuations in levels of oil and natural gas exploration and development activities; • fluctuations in the demand for our services; • competitive and technological changes and other developments in the oil and gas and oilfield services industries; • our ability to renew customer contracts in order to maintain competitiveness; • the existence of operating risks inherent in the oil and gas and oilfield services industries; • the possibility of the loss of one or a number of our large customers; • the impact of long - term indebtedness and other financial commitments on our financial and operating flexibility; • our access to and the cost of capital, including the impact of a further downgrade in our credit rating, covenant restrictions, availability under our unsecured revolving credit facility, and future issuances of debt or equity securities; • our dependence on our operating subsidiaries and investments to meet our financial obligations; our ability to retain skilled employees; • our ability to complete, and realize the expected benefits, of strategic transactions; • changes in tax laws and the possibility of changes in other laws and regulation; • the possibility of political or economic instability, civil disturbance, war or acts of terrorism in any of the countries in which we do business; • the possibility of changes to U.S. trade policies and regulations including the imposition of trade embargoes or sanctions; and • general economic conditions, including the capital and credit markets. Our businesses depend, to a large degree, on the level of spending by oil and gas companies for exploration, development and production activities . Therefore, sustained lower oil or natural gas prices that have a material impact on exploration, development or production activities could also materially affect our financial position, results of operations and cash flows . The above description of risks and uncertainties is by no means all - inclusive, but is designed to highlight what we believe are important factors to consider . For a discussion of these factors and other risks and uncertainties, please refer to our filings with the Securities and Exchange Commission ("SEC"), including those contained in our Annual Reports on Form 10 - K and Quarterly Reports on Form 10 - Q, which are available at the SEC's website at www . sec . gov . Non - GAAP Financial Measures This presentation refers to certain “non - GAAP” financial measures, such as adjusted EBITDA, net debt and free cash flow . The components of these non - GAAP measures are computed by using amounts that are determined in accordance with accounting principles generally accepted in the United States of America (“GAAP”) . A reconciliation of adjusted EBITDA to income (loss) from continuing operations before income taxes, net debt to total debt, and free cash flow to net cash provided by operating activities, which are their nearest comparable GAAP financial measures, as provided in the Appendix at the end of this presentation .
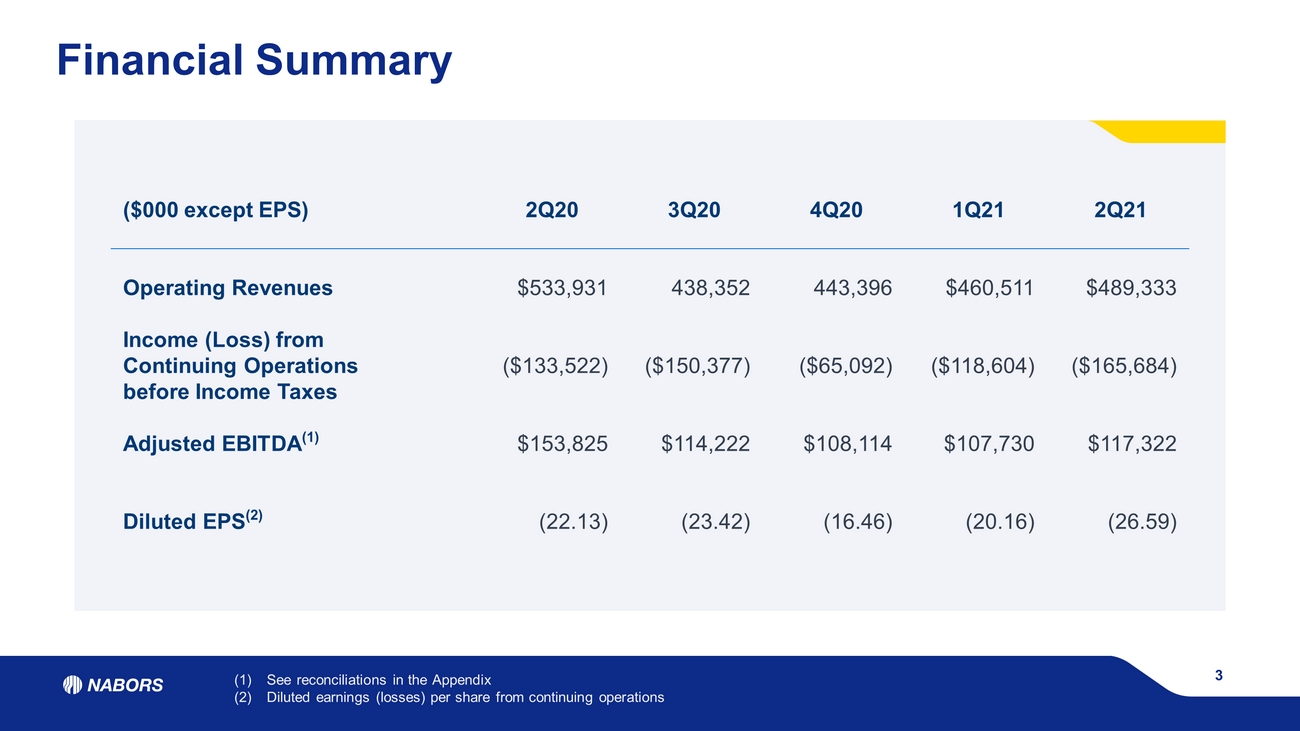
3 Financial Summary (1) See reconciliations in the Appendix (2) Diluted earnings (losses) per share from continuing operations ($000 except EPS) 2Q20 3Q20 4Q20 1Q21 2Q21 Operating Revenues $533,931 438,352 443,396 $460,511 $489,333 Income (Loss) from Continuing Operations before Income Taxes ($133,522) ($150,377) ($65,092) ($118,604) ($165,684) Adjusted EBITDA (1) $153,825 $114,222 $108,114 $107,730 $117,322 Diluted EPS (2) (22.13) (23.42) (16.46) (20.16) (26.59)

Recent Company Highlights Generated FCF of $68M in 2Q 2021 After funding $77M in capital spending, including $32M for SANAD newbuilds in the quarter Reduced Net Debt by $58M during 2Q 2021 Total debt improved by $76M in the quarter Total debt reduction of more than $450M vs 2Q 2020 2Q 2021 adjusted EBITDA of $117M, above guidance Drilling activity strengthened throughout our markets Significant progress across multiple strategic initiatives Drilling Solutions continues growth of new product offerings and market penetration in Lower 48 2Q21 adjusted EBITDA of $13M, 12% growth vs 1Q21 50% revenue growth on third party rigs vs 1Q, across multiple service lines 5 awards received to date by SANAD for newbuild rigs Each rig adds ~$10M adjusted EBITDA annually 2021 newbuild capex of approx. $100M, fully funded by SANAD ESG score (ISS) improvement in 2Q Overall Environmental score improved by 2 points Social subcategory scores improved in 2Q 4 Note: For adjusted EBITDA, FCF and Net Debt see non - GAAP reconciliations in the Appendix 4

$(400) $(300) $(200) $(100) $- $100 $200 $300 $400 1H 2H 1H 2H 1H 2H 1H 2H 1H FY17 FY18 FY19 FY20 FY21 $MM 5 Positive Financial Progression $- $0.5 $1.0 $1.5 $2.0 $2.5 $3.0 $3.5 $4.0 $4.5 Q1 Q2 Q3 Q4 Q1 Q2 Q3 Q4 Q1 Q2 Q3 Q4 Q1 Q2 FY18 FY19 FY20 FY21 $B Semiannual FCF has been trending upward since 1H 2017 (previous downturn) $1.4B Net Debt reduction from previous high in 1Q 2018 Net Debt Semiannual Free Cash Flow $1.4B

6 Key Delevering Initiatives Optimizing our capital allocation with sales of $22M through 2Q 2021 Asset Sales Innovative, non - dilutive, full exercise with notes would delever by approx. $538M Warrants $128M in 1H 2021 Free Cash Flow

7 Technology & Environment Operational Efficiency & Safety Energy Transition - Power management - Carbon capture - Emissions reporting - Sigma TM top drive - Green fuels - Energy Storage - Geothermal - Automation - Digitalization - Integrated platform - Engine management systems Key Strategic Initiatives - Geothermal Drilling & Completions - Supercritical Turbine Technology

8 2Q Rig Utilization and Availability RIG FLEET (1) 383 2Q21 AVERAGE RIGS ON REV 146 AVERAGE UTILIZATION 38% (1) As of June 30, 2021 Note: Subtotals may not foot due to rounding TOTAL U.S. OFFSHORE 12 3 23% CANADA 16 3 18% ALASKA 35 8 23% INTERNATIONAL 133 68 51% 187 64 34% U.S. LOWER 48 HIGH SPEC 110 HIGH SPEC 55 HIGH SPEC 58%

9 Nabors’ Commitment to Environmental Stewardship 54 dual - fuel - capable rigs in Lower 48 Image: Rig 27E in Deadhorse Alaska Operating environmentally friendly rigs: 17 dual - fuel (blended natural gas & diesel) 2 using biodiesel 3 w/advanced energy mgmt. system (incl. 1 natural gas) 3 high - line (grid powered) Evaluating carbon capture, emissions minimization, power storage and power management technologies

Millions # of Wells Drilled Footage Drilled Smart Suite TM Products G rowth • Over 20 Million Feet Drilled • 900+ Wells Drilled • 90% Customer Retention Rate* in Q2 2021 SmartDRILL TM Automation Commercialization SmartNAV TM & SmartSLIDE TM Solutions Commercialization *Number of active users that continue the service/total number of active users at the beginning of the time period 10

Increased addressable market by 25% for Smart Suite TM products through successful Smart NAV TM + Smart ROS TM tools downlinking to Rotary Steerable. Expanding Next - Gen Smart Suite TM Digital Solutions and Automation Smart Suite TM Applications Active RigCLOUD ® EDGE Active 5+ Rigs 1 - 5 Rigs 11
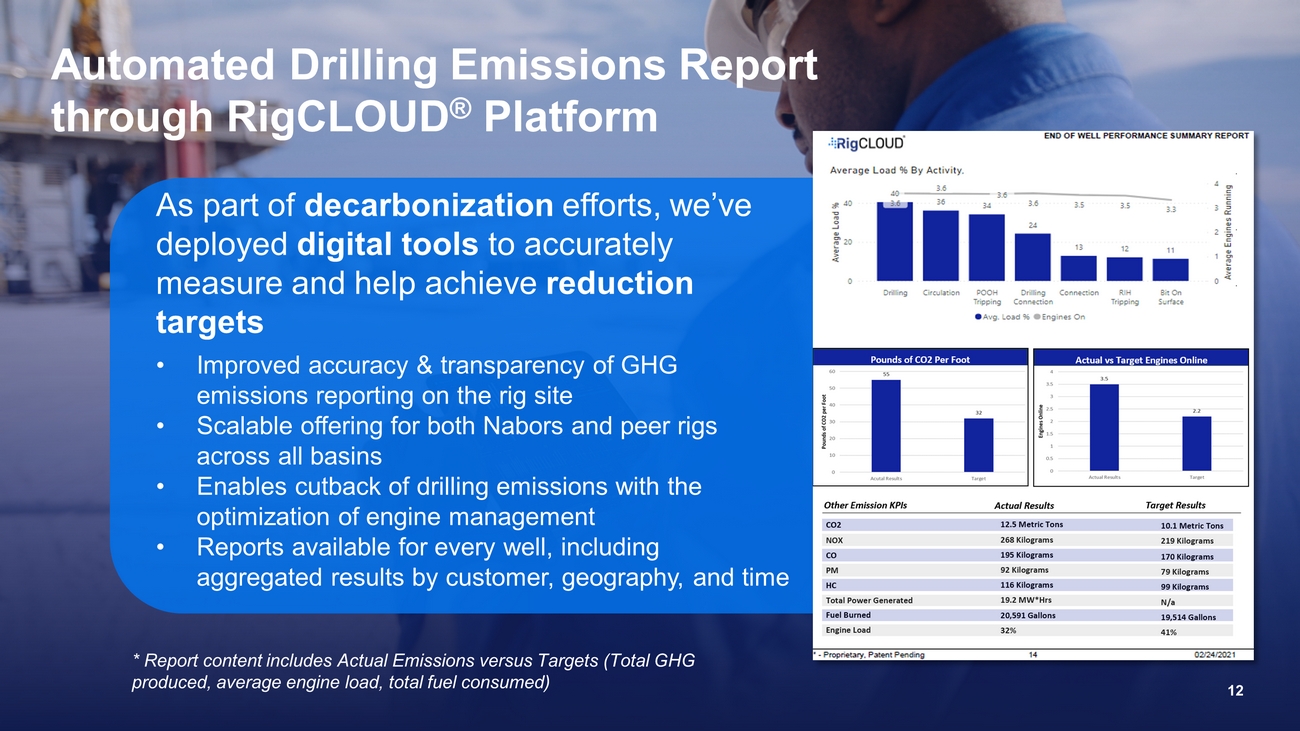
Automated Drilling Emissions Report through RigCLOUD ® Platform * Report content includes Actual Emissions versus Targets (Total GHG produced, average engine load, total fuel consumed) As part of decarbonization efforts, we’ve deployed digital tools to accurately measure and help achieve reduction targets • Improved accuracy & transparency of GHG emissions reporting on the rig site • Scalable offering for both Nabors and peer rigs across all basins • Enables cutback of drilling emissions with the optimization of engine management • Reports available for every well, including aggregated results by customer, geography, and time 12

82 145 287 855 560 390 558 $0 $250 $500 $750 $1,000 $1,250 $1,500 2021 2022 2023 2024 2025 2026 2027 2028 Revolving Credit Facility Notes Outstanding (1) 13 (1) Annual figures shown in millions at maturity face value as of June 30, 2021 Total Debt lowered by $76M, Net Debt $58M, during 2Q 2021 driven by positive FCF, reducing near term debt hurdle (1) Debt Maturity Profile as of June 30, 2021

14 APPENDIX

Three Months Ended June 30, Sep 30, Dec 31, March 31, June 30, 2020 2020 2020 2021 2021 Adjusted EBITDA $153,825 $114,222 $108,114 $107,730 $117,322 Depreciation and Amortization (211,120) (206,862) (208,658) (177,276) (174,775) Adjusted Operating Income (loss) (57,295) (92,640) (100,540) (69,546) (57,453) Investment Income (loss) 2,036 (742) 3,342 1,263 (62) Interest Expense (51,206) (52,403) (47,943) (42,975) (41,741) Other, net 30,795 425 151,377 (4,863) (6,587) Impairments and other charges (57,852) (5,017) (71,328) (2,483) (59,868) Income (loss) from continuing operations before income taxes ($133,522) ($150,377) ($65,092) ($118,604) ($165,684) (In Thousands) 15 Reconciliation of Adjusted EBITDA to Income (Loss) From Continuing Operations Before Income Tax Adjusted EBITDA represents income (loss) from continuing operations before income taxes, interest expense, depreciation and a mor tization, earnings (losses) from unconsolidated affiliates, investment income (loss), impairments and other charges and other, net. Adjusted EBITDA is a non - GAAP financial measure and should not be used in isolation or as a substitute for the amounts reported in accordance with GAAP. In addition, adjusted EBITDA excludes certa in cash expenses that the Company is obligated to make. However, management evaluates the performance of its operating segments and the consolidated Company based on several c rit eria, including adjusted EBITDA, because it believes that this financial measure accurately reflects the Company’s ongoing profitability and performance. Sec uri ties analysts and investors use this measure as one of the metrics on which they analyze the Company’s performance. Other companies in this industry may compute this measur es differently. A reconciliation of this non - GAAP measure to income (loss) from continuing operations before income taxes, which is the most closely comparable GAAP measu re, is provided below.
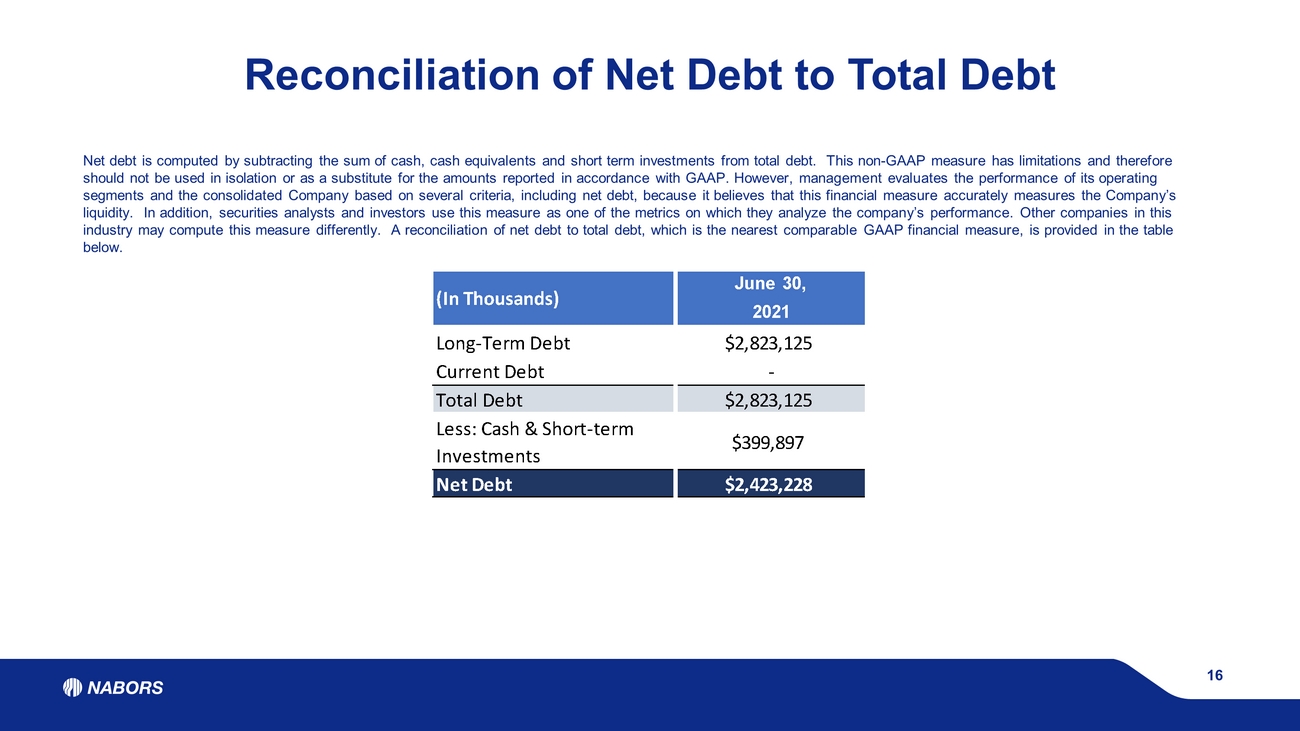
June 30, 2021 Long-Term Debt $2,823,125 Current Debt - Total Debt $2,823,125 Less: Cash & Short-term Investments $399,897 Net Debt $2,423,228 (In Thousands) 16 Reconciliation of Net Debt to Total Debt Net debt is computed by subtracting the sum of cash, cash equivalents and short term investments from total debt. This non - GAAP measure has limitations and therefore should not be used in isolation or as a substitute for the amounts reported in accordance with GAAP. However, management eval uat es the performance of its operating segments and the consolidated Company based on several criteria, including net debt, because it believes that this financial mea sure accurately measures the Company’s liquidity. In addition, securities analysts and investors use this measure as one of the metrics on which they analyze the comp any’s performance. Other companies in this industry may compute this measure differently. A reconciliation of net debt to total debt, which is the nearest comparable GAAP financial measure, is provided in the table below.
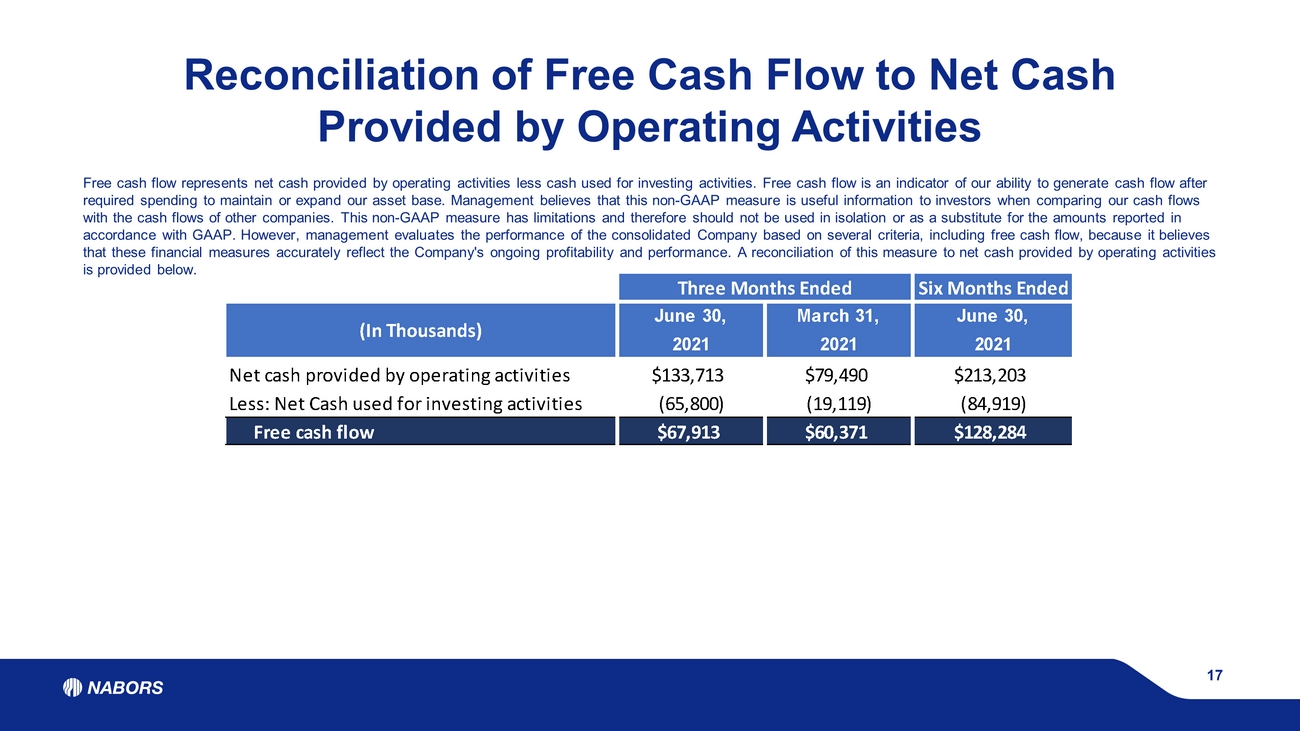
Three Months Ended Six Months Ended June 30, March 31, June 30, 2021 2021 2021 Net cash provided by operating activities $133,713 $79,490 $213,203 Less: Net Cash used for investing activities (65,800) (19,119) (84,919) Free cash flow $67,913 $60,371 $128,284 (In Thousands) 17 Reconciliation of Free Cash Flow to Net Cash Provided by Operating Activities Free cash flow represents net cash provided by operating activities less cash used for investing activities. Free cash flow i s a n indicator of our ability to generate cash flow after required spending to maintain or expand our asset base. Management believes that this non - GAAP measure is useful information to investors when comparing our cash flows with the cash flows of other companies. This non - GAAP measure has limitations and therefore should not be used in isolation or a s a substitute for the amounts reported in accordance with GAAP. However, management evaluates the performance of the consolidated Company based on several criteria, in clu ding free cash flow, because it believes that these financial measures accurately reflect the Company's ongoing profitability and performance. A reconciliation of thi s m easure to net cash provided by operating activities is provided below.

nabors.com Contact Us: William C. Conroy VP - Corporate Development and Investor Relations William.Conroy@nabors.com Kara K. Peak Director - Corporate Development and Investor Relations Kara.Peak@nabors.com NABORS CORPORATE SERVICES 515 W. Greens Road Suite 1200 Houston, TX 77067 - 4525 18