UNITED STATES
SECURITIES AND EXCHANGE COMMISSION
WASHINGTON, D.C. 20549
FORM 8-K
CURRENT REPORT
Pursuant to Section 13 or 15(d) of the
Securities Exchange Act of 1934
Date of Report (Date of earliest event reported): July 28, 2021
Commission File Number of Issuing Entity: 000-20787-07
Central Index Key Number of Issuing Entity: 0001003509
AMERICAN EXPRESS CREDIT ACCOUNT MASTER TRUST
(Exact Name of Issuing Entity as Specified in its Charter)
Commission File Number of Depositor/Registrant:
333-113579-02
Central Index Key Number of Depositor/Registrant:
0001283434
AMERICAN EXPRESS RECEIVABLES FINANCING
CORPORATION III LLC
(Exact Name of Depositor/Registrant
as Specified in its Charter)
| Delaware | 20-0942395 | |
| (State or Other Jurisdiction of Incorporation or Organization) |
(I.R.S. Employer Identification Number) |
115 W Towne Ridge Pkwy
Room #454
Sandy, Utah 84070
(801) 945-5648
(Address, Including Zip Code, and Telephone Number, Including Area Code, of the Registrant’s Principal Executive
Office)
N/A
(Former Name or Former Address,
if Changed Since Last Report)
Central Index Key Number of Sponsor:
0000949348
AMERICAN EXPRESS NATIONAL BANK
(Exact Name of Sponsor as Specified in its Charter)
Check the appropriate box below if the Form 8-K filing is intended to simultaneously satisfy the filing obligation of the registrant under any of the following provisions.
| ☐ | Written communications pursuant to Rule 425 under the Securities Act (17 CFR 230.425) |
| ☐ | Soliciting material pursuant to Rule 14a-12(b) under the Exchange Act (17 CFR 240.14a-12) |
| ☐ | Pre-commencement communications pursuant to Rule 14d-2(b) under the Exchange Act (17 CFR 240.14d-2(b)) |
| ☐ | Pre-commencement communications pursuant to Rule 13e-4(c) under the Exchange Act (17 CFR 240.13e-4(c)) |
Securities registered pursuant to Section 12(b) of the Act:
| Title of each class | Trading Symbol(s) | Name of each exchange on which registered | ||
| N/A | N/A | N/A |
Indicate by check mark whether the registrant is an emerging growth company as defined in Rule 405 of the Securities Act of 1933 (§230.405 of this chapter) or Rule 12b-2 of the Securities Exchange Act of 1934 (§240.12b-2 of this chapter).
| ☐ | Emerging growth company |
If an emerging growth company, indicate by check mark if the registrant has elected not to use the extended transition period for complying with any new or revised financial accounting standards provided pursuant to Section 13(a) of the Exchange Act. ☐
INFORMATION TO BE INCLUDED IN THE REPORT
| Item 8.01. | Other Events. |
The following information relates to the credit card receivables owned by American Express Credit Account Master Trust and the related credit card accounts. Some of the terms used herein are used as defined in the Glossary of Terms at the end of this report.
The Trust Portfolio
General
The primary assets of the trust are receivables generated from time to time in a portfolio of designated consumer American Express credit card accounts and Pay Over Time revolving credit features associated with certain American Express credit card accounts and, in the future, may include other charge or credit accounts or products.
The accounts in the Trust Portfolio were selected from the Total Portfolio based upon the eligibility criteria specified in the purchase agreement and the pooling and servicing agreement applied with respect to the accounts as of their selection date. Subject only to these criteria and any applicable regulatory guidelines, the account owner has the discretion to select the accounts in the Total Portfolio for addition to the Trust Portfolio. The account owner has in the past considered, and may in the future consider, factors such as product type, tenure of an account and interest rate applicable to an account in determining the accounts to be added to the Trust Portfolio. Set forth below is certain information with respect to the Trust Portfolio.
Additional accounts were most recently designated for the Trust Portfolio on October 1, 2018, adding approximately $8 billion of receivables in additional accounts.
The Trust Portfolio’s yield, loss, delinquency and payment rate is comprised of segments which may, when taken individually, have yield, loss, delinquency and payment rate characteristics different from those of the overall Trust Portfolio. There can be no assurance that the yield, loss, delinquency and payment rate experience relating to the receivables in the Trust Portfolio in the future will be comparable to the historical experience relating to the receivables in the Trust Portfolio set forth below.
Loss and Delinquency Experience
The following tables set forth the loss and delinquency experience for the Trust Portfolio for each of the periods shown. The loss and delinquency rates at any time reflect, among other factors, the quality of the Trust Portfolio, the average seasoning of the accounts, the success of the account owner’s collection efforts, the product mix of the Trust Portfolio and general economic conditions.
The following table sets forth the loss experience for the Trust Portfolio for each indicated period. Total gross charge-offs include charge-offs of principal receivables only, and do not include any charge-offs of finance charge and fee receivables or the amount of any reductions in principal receivables due to a rebate, refund, error, fraudulent charge or other miscellaneous adjustment. If finance charge and fee receivables that have been charged-off were included in total gross charge-offs, total gross charge-offs would be higher as an absolute number and as a percentage of the average principal receivables outstanding during the periods indicated. Recoveries are collections received in respect of charged-off accounts in the Trust Portfolio during the period indicated in the following table. Total recoveries for each indicated period include recoveries of principal, finance charges and certain fees for that period. Under the pooling and servicing agreement, recoveries are treated as collections of finance charge receivables. Total net charge-offs are an amount equal to total gross charge-offs minus total recoveries, each for the applicable period. Average principal receivables outstanding for each indicated period is the average of the month-end principal receivables balances for that period. We cannot provide any assurance that the loss experience for the receivables in the Trust Portfolio in the future will be similar to the historical experience set forth below.
1
Loss Experience of the Trust Portfolio
(Dollars in Thousands)
| Six Months Ended June 30, 2021 |
Year Ended December 31, | |||||||||||||||||||||||
| 2020 | 2019 | 2018 | 2017 | 2016 | ||||||||||||||||||||
| Average Principal Receivables Outstanding |
$ | 23,387,148 | $ | 25,433,730 | $ | 30,427,058 | $ | 25,310,903 | $ | 23,930,194 | $ | 25,041,699 | ||||||||||||
| Total Gross Charge-Offs |
$ | 198,335 | $ | 614,951 | $ | 632,374 | $ | 503,288 | $ | 484,397 | $ | 464,101 | ||||||||||||
| Total Recoveries |
95,116 | 162,146 | 168,368 | 157,192 | 157,341 | 178,720 | ||||||||||||||||||
|
|
|
|
|
|
|
|
|
|
|
|
|
|||||||||||||
| Total Net Charge-Offs |
$ | 103,219 | $ | 452,806 | $ | 464,005 | $ | 346,096 | $ | 327,056 | $ | 285,382 | ||||||||||||
|
|
|
|
|
|
|
|
|
|
|
|
|
|||||||||||||
| Total Gross Charge-Offs as a Percentage of Average Principal Receivables Outstanding |
1.70 | %(1) | 2.42 | % | 2.08 | % | 1.99 | % | 2.02 | % | 1.85 | % | ||||||||||||
| Total Recoveries as a Percentage of Average Principal Receivables Outstanding |
0.81 | (1) | 0.64 | 0.55 | 0.62 | 0.66 | 0.71 | |||||||||||||||||
|
|
|
|
|
|
|
|
|
|
|
|
|
|||||||||||||
| Total Net Charge-Offs as a Percentage of Average Principal Receivables Outstanding |
0.88 | %(1) | 1.78 | % | 1.52 | % | 1.37 | % | 1.37 | % | 1.14 | % | ||||||||||||
|
|
|
|
|
|
|
|
|
|
|
|
|
|||||||||||||
| Number of Accounts Experiencing a Loss |
39,919 | 106,919 | 112,613 | 93,637 | 95,860 | 99,648 | ||||||||||||||||||
| Number of Accounts Experiencing a Recovery(2) |
170,358 | 358,918 | 383,006 | 393,900 | 430,840 | 551,284 | ||||||||||||||||||
| Average Net Loss per Account Experiencing a Loss(3) |
$ | 2.59 | $ | 4.24 | $ | 4.12 | $ | 3.70 | $ | 3.41 | $ | 2.86 | ||||||||||||
| (1) | This percentage is an annualized figure. |
| (2) | Calculated by totaling the number of accounts experiencing a recovery in each of the months during the indicated period. Therefore, an account that has experienced a recovery in multiple months during the indicated period will be counted more than once. |
| (3) | Calculated as Net Charge-Offs divided by Number of Accounts Experiencing a Loss. |
The following tables set forth the delinquency experience for the Trust Portfolio for each indicated period. With respect to the “Average Receivables Delinquent as a Percentage of the Trust Portfolio” table below, the average receivables delinquent is the average of the month-end delinquent amounts, while the average receivables outstanding is the average of month-end receivables balances, each for the applicable period. With respect to the “Average Number of Delinquent Accounts as a Percentage of the Trust Portfolio” table below, the average number of delinquent accounts is the average of the month-end delinquent accounts, while the average number of outstanding accounts is the average of total month-end accounts, each for the applicable period. We cannot provide any assurance that the delinquency experience for the receivables in the Trust Portfolio in the future will be similar to the historical experience set forth below.
Average Receivables Delinquent as a Percentage of the Trust Portfolio
(Dollars in Thousands)
| Six Months Ended June 30, 2021 |
Year Ended December 31, | |||||||||||||||||||||||||||||||||||||||||||||||
| 2020 | 2019 | 2018 | 2017 | 2016 | ||||||||||||||||||||||||||||||||||||||||||||
| Dollar Amount |
Percentage of Avg. Receivables Outstanding |
Dollar Amount |
Percentage of Avg. Receivables Outstanding |
Dollar Amount |
Percentage of Avg. Receivables Outstanding |
Dollar Amount |
Percentage of Avg. Receivables Outstanding |
Dollar Amount |
Percentage of Avg. Receivables Outstanding |
Dollar Amount |
Percentage of Avg. Receivables Outstanding |
|||||||||||||||||||||||||||||||||||||
| Average Receivables Outstanding |
$ | 24,394,183 | 100.00 | % | $ | 26,500,354 | 100.00 | % | $ | 31,495,289 | 100.00 | % | $ | 26,167,433 | 100.00 | % | $ | 24,664,429 | 100.00 | % | $ | 25,714,143 | 100.00 | % | ||||||||||||||||||||||||
| Average Receivables Delinquent: |
||||||||||||||||||||||||||||||||||||||||||||||||
| 31 to 60 Days |
$ | 35,873 | 0.15 | % | $ | 68,327 | 0.26 | % | $ | 89,834 | 0.29 | % | $ | 70,311 | 0.27 | % | $ | 67,637 | 0.27 | % | $ | 65,579 | 0.26 | % | ||||||||||||||||||||||||
| 61 to 90 Days |
27,289 | 0.11 | 52,933 | 0.20 | 67,000 | 0.21 | 50,893 | 0.19 | 49,471 | 0.20 | 47,233 | 0.18 | ||||||||||||||||||||||||||||||||||||
| 91 to 120 Days |
24,865 | 0.10 | 46,576 | 0.18 | 56,273 | 0.18 | 43,311 | 0.17 | 42,415 | 0.17 | 40,079 | 0.16 | ||||||||||||||||||||||||||||||||||||
| 121 to 150 Days |
20,933 | 0.09 | 41,086 | 0.16 | 48,507 | 0.15 | 36,960 | 0.14 | 36,640 | 0.15 | 33,497 | 0.13 | ||||||||||||||||||||||||||||||||||||
| 151 to 180 Days |
20,089 | 0.08 | 39,469 | 0.15 | 43,388 | 0.14 | 34,003 | 0.13 | 32,722 | 0.13 | 29,102 | 0.11 | ||||||||||||||||||||||||||||||||||||
| 181 Days or More |
49 | 0.00 | 207 | 0.00 | 136 | 0.00 | 88 | 0.00 | 82 | 0.00 | 131 | 0.00 | ||||||||||||||||||||||||||||||||||||
|
|
|
|
|
|
|
|
|
|
|
|
|
|
|
|
|
|
|
|
|
|
|
|
|
|||||||||||||||||||||||||
| Total |
$ | 129,097 | 0.53 | % | $ | 248,599 | 0.94 | % | $ | 305,137 | 0.97 | % | $ | 235,566 | 0.90 | % | $ | 228,966 | 0.93 | % | $ | 215,621 | 0.84 | % | ||||||||||||||||||||||||
|
|
|
|
|
|
|
|
|
|
|
|
|
|
|
|
|
|
|
|
|
|
|
|
|
|||||||||||||||||||||||||
2
Average Number of Delinquent Accounts as a Percentage of the Trust Portfolio
| Six Months Ended June 30, 2021 |
Year Ended December 31, | |||||||||||||||||||||||||||||||||||||||||||||||
| 2020 | 2019 | 2018 | 2017 | 2016 | ||||||||||||||||||||||||||||||||||||||||||||
| Number of Accounts |
Percentage of Total Number of Accounts |
Number of Accounts |
Percentage of Total Number of Accounts |
Number of Accounts |
Percentage of Total Number of Accounts |
Number of Accounts |
Percentage of Total Number of Accounts |
Number of Accounts |
Percentage of Total Number of Accounts |
Number of Accounts |
Percentage of Total Number of Accounts |
|||||||||||||||||||||||||||||||||||||
| Average Number of Accounts Outstanding |
15,635,167 | 100.00 | % | 15,726,662 | 100.00 | % | 16,203,623 | 100.00 | % | 13,777,782 | 100.00 | % | 14,842,542 | 100.00 | % | 17,207,287 | 100.00 | % | ||||||||||||||||||||||||||||||
| Average Number of Accounts Delinquent: |
||||||||||||||||||||||||||||||||||||||||||||||||
| 31 to 60 Days |
6,123 | 0.04 | 9,857 | 0.06 | 13,167 | 0.08 | 11,117 | 0.08 | 11,308 | 0.08 | 12,066 | 0.07 | ||||||||||||||||||||||||||||||||||||
| 61 to 90 Days |
3,763 | 0.02 | 6,298 | 0.04 | 8,109 | 0.05 | 6,535 | 0.05 | 6,764 | 0.05 | 6,910 | 0.04 | ||||||||||||||||||||||||||||||||||||
| 91 to 120 Days |
3,072 | 0.02 | 5,253 | 0.03 | 6,528 | 0.04 | 5,281 | 0.04 | 5,460 | 0.04 | 5,449 | 0.03 | ||||||||||||||||||||||||||||||||||||
| 121 to 150 Days |
2,588 | 0.02 | 4,631 | 0.03 | 5,573 | 0.03 | 4,476 | 0.03 | 4,662 | 0.03 | 4,472 | 0.03 | ||||||||||||||||||||||||||||||||||||
| 151 to 180 Days |
2,433 | 0.02 | 4,413 | 0.03 | 4,970 | 0.03 | 4,105 | 0.03 | 4,183 | 0.03 | 3,913 | 0.02 | ||||||||||||||||||||||||||||||||||||
| 181 Days or More |
6 | 0.00 | 15 | 0.00 | 12 | 0.00 | 7 | 0.00 | 6 | 0.00 | 8 | 0.00 | ||||||||||||||||||||||||||||||||||||
|
|
|
|
|
|
|
|
|
|
|
|
|
|
|
|
|
|
|
|
|
|
|
|
|
|||||||||||||||||||||||||
| Total |
17,984 | 0.12 | % | 30,466 | 0.19 | % | 38,359 | 0.24 | % | 31,522 | 0.23 | % | 32,383 | 0.22 | % | 32,818 | 0.19 | % | ||||||||||||||||||||||||||||||
|
|
|
|
|
|
|
|
|
|
|
|
|
|
|
|
|
|
|
|
|
|
|
|
|
|||||||||||||||||||||||||
Revenue Experience
The following table sets forth the revenue experience for the Trust Portfolio from total finance charge and fee collections for each indicated period. Total finance charge and fee collections set forth in the table below include periodic finance charges, cash advance fees, annual membership fees, other fees, discount option yield, Issuer Rate Fees and recoveries on charged-off accounts. Under the pooling and servicing agreement, recoveries on charged-off accounts are treated as collections of finance charge receivables. There can be no assurance that the revenues for the Trust Portfolio in the future will be similar to the historical experience of the Trust Portfolio set forth below.
Revenue experience from total finance charge and fee collections results from dividing total finance charges and fee collections by the average principal receivables outstanding. The average principal receivables outstanding for each indicated period is the average of the month-end principal receivables balances for that period.
Revenue Experience of the Trust Portfolio
(Dollars in Thousands)
| Six Months Ended June 30, 2021 |
Year Ended December 31, | |||||||||||||||||||||||
| 2020 | 2019 | 2018 | 2017 | 2016 | ||||||||||||||||||||
| Average Principal Receivables Outstanding |
$ | 23,387,148 | $ | 25,433,730 | $ | 30,427,058 | $ | 25,310,903 | $ | 23,930,194 | $ | 25,041,699 | ||||||||||||
| Finance Charge and Fee Collections |
$ | 3,292,434 | $ | 6,552,078 | $ | 7,499,093 | $ | 5,903,353 | $ | 5,303,695 | $ | 5,375,072 | ||||||||||||
| Collections of Discount Option Receivables |
0 | 0 | 0 | 0 | 0 | 0 | ||||||||||||||||||
|
|
|
|
|
|
|
|
|
|
|
|
|
|||||||||||||
| Total Finance Charge and Fee Collections |
$ | 3,292,434 | $ | 6,552,078 | $ | 7,499,093 | $ | 5,903,353 | $ | 5,303,695 | $ | 5,375,072 | ||||||||||||
|
|
|
|
|
|
|
|
|
|
|
|
|
|||||||||||||
| Total Finance Charge and Fee Collections as a Percentage of Average Principal Receivables Outstanding |
28.16 | %(1) | 25.76 | % | 24.65 | % | 23.32 | % | 22.16 | % | 21.46 | % | ||||||||||||
| (1) | This percentage is an annualized figure. |
The historical revenue figures for the Trust Portfolio shown in the table above include interest on purchases and cash advances and fees collected from holders of the accounts during the applicable month. Revenues from finance charges and fees collected will be affected by numerous factors, including the periodic finance charges on the receivables, the amount of fees paid by account holders, the percentage of account holders who pay off their balances in full each month and do not incur periodic finance charges on purchases and change in the level of delinquencies on the receivables. Revenues related to finance charges and fees also depend on the types of charges and fees assessed by the account owner on the accounts in the Trust Portfolio. Accordingly, revenues will be affected by future changes in the types of charges and fees assessed on the accounts and other factors. None of the servicer, the account owner or any of their respective affiliates has any basis to predict how future changes in the use of the accounts by account holders or in the terms of accounts may affect the revenue for the Trust Portfolio.
3
Principal Payment Rates
The following table sets forth the highest and lowest account holder monthly principal payment rates for the Trust Portfolio during any month in the period shown and the average account holder monthly principal payment rates for all months during each period shown, calculated as the percentage equivalent of a fraction. The monthly principal payment rates for each month is calculated as the amount of principal payments from account holders (excluding recoveries on charged-off receivables) as posted to the accounts during the applicable month divided by the aggregate amount of principal receivables outstanding as of the beginning of the applicable month, normalized for a 30-day month by dividing the resulting rate by the actual number of days in the applicable month and multiplying the result by 30. In addition, as of six months ended June 30, 2021, and with regard to the prior month’s statement only, 8.17% of the accounts in the Trust Portfolio had account holders that made only the minimum payment due under the terms of the related account agreement, and 64.79% of the accounts in the Trust Portfolio had account holders that paid their full balance under the terms of the related account agreement.
Account Holder Monthly Principal Payment Rates of the Trust Portfolio
| Six Months Ended June 30, 2021 |
Year Ended December 31, | |||||||||||||||
| 2020 | 2019 | 2018 | 2017 | 2016 | ||||||||||||
| Lowest Month |
39.41% | 29.66% | 35.18% | 32.74% | 31.31 | % | 30.55 | % | ||||||||
| Highest Month |
46.40% | 40.76% | 37.09% | 35.86% | 34.42 | % | 39.36 | % | ||||||||
| Monthly Average |
42.56% | 35.55% | 36.09% | 34.22% | 32.77 | % | 33.60 | % | ||||||||
4
The Receivables
As of June 30, 2021, the receivables in the accounts included in the Trust Portfolio totaled $25,149,292,082 comprised of $24,165,680,504 of principal receivables and $983,611,578 of finance charge receivables.
The following tables, together with the paragraph under “— Composition by Geographic Distribution,” summarize the Trust Portfolio by various criteria as of June 30, 2021. Because the future composition of the Trust Portfolio may change over time, these tables are not necessarily indicative of the composition of the Trust Portfolio at any time subsequent to June 30, 2021.
Composition By Account Balance
Trust Portfolio
| Account Balance Range |
Number
of Accounts |
Percentage of Total Number of Accounts |
Receivables Outstanding |
Percentage of Total Receivables Outstanding |
||||||||||||
| Credit Balance |
146,243 | 0.94 | % | $ | (43,468,779 | ) | (0.17 | )% | ||||||||
| Zero Balance |
9,230,320 | 59.19 | 0 | 0.00 | ||||||||||||
| $0.01 to $1,000 |
2,770,009 | 17.76 | 900,464,497 | 3.58 | ||||||||||||
| $1,000.01 to $5,000 |
1,989,956 | 12.76 | 5,000,019,546 | 19.88 | ||||||||||||
| $5,000.01 to $10,000 |
741,626 | 4.76 | 5,263,979,515 | 20.93 | ||||||||||||
| $10,000.01 or More |
716,235 | 4.59 | 14,028,297,302 | 55.78 | ||||||||||||
|
|
|
|
|
|
|
|
|
|||||||||
| Total |
15,594,389 | 100.00 | % | $ | 25,149,292,082 | 100.00 | % | |||||||||
|
|
|
|
|
|
|
|
|
|||||||||
The average account balance as of June 30, 2021 was $1,613 for all accounts and $3,952 for all accounts other than accounts with a zero balance as of that date.
5
Composition By Credit Limit
Trust Portfolio
| Credit Limit Range |
Number
of Accounts |
Percentage of Total Number of Accounts |
Receivables Outstanding |
Percentage of Total Receivables Outstanding |
||||||||||||
| Less than $1,000.99 |
711,326 | 4.56 | % | $ | 41,760,560 | 0.17 | % | |||||||||
| $1,001 to $5,000.99 |
1,941,726 | 12.45 | 660,393,125 | 2.63 | ||||||||||||
| $5,001 to $10,000.99 |
3,243,830 | 20.80 | 1,664,916,926 | 6.62 | ||||||||||||
| $10,001 to $15,000.99 |
1,938,698 | 12.43 | 1,986,982,565 | 7.90 | ||||||||||||
| $15,001 to $20,000.99 |
1,415,585 | 9.08 | 2,166,291,201 | 8.61 | ||||||||||||
| $20,001 to $25,000.99 |
966,530 | 6.20 | 2,012,503,864 | 8.00 | ||||||||||||
| $25,001 or More(1) |
1,415,816 | 9.08 | 7,351,578,392 | 29.23 | ||||||||||||
| Other |
4 | 0.00 | 0 | 0.00 | ||||||||||||
|
|
|
|
|
|
|
|
|
|||||||||
| Total (Credit Card) |
11,633,515 | 74.60 | % | $ | 15,884,426,633 | 63.16 | % | |||||||||
| No Pre-Set Spending Limit |
3,960,874 | 25.40 | 9,264,865,449 | 36.84 | ||||||||||||
|
|
|
|
|
|
|
|
|
|||||||||
| Grand Total |
15,594,389 | 100.00 | % | $ | 25,149,292,082 | 100.00 | % | |||||||||
|
|
|
|
|
|
|
|
|
|||||||||
| (1) | The maximum credit limit generally is $100,000. |
Composition by Period of Delinquency
Trust Portfolio
| Period of Delinquency (Days Contractually Delinquent) |
Number
of Accounts |
Percentage of Total Number of Accounts |
Receivables Outstanding |
Percentage of Total Receivables Outstanding |
||||||||||||
| Current to 30 days |
15,579,037 | 99.90 | % | $ | 25,043,774,257 | 99.58 | % | |||||||||
| 31 to 60 Days |
5,655 | 0.04 | 31,267,644 | 0.12 | ||||||||||||
| 61 to 90 Days |
3,140 | 0.02 | 22,007,366 | 0.09 | ||||||||||||
| 91 to 120 Days |
2,373 | 0.02 | 18,750,161 | 0.07 | ||||||||||||
| 121 to 150 Days |
2,175 | 0.01 | 17,440,655 | 0.07 | ||||||||||||
| 151 to 180 Days |
2,005 | 0.01 | 16,002,637 | 0.06 | ||||||||||||
| 181 Days or More |
4 | 0.00 | 49,362 | 0.00 | ||||||||||||
|
|
|
|
|
|
|
|
|
|||||||||
| Total |
15,594,389 | 100.00 | % | $ | 25,149,292,082 | 100.00 | % | |||||||||
|
|
|
|
|
|
|
|
|
|||||||||
6
Composition by Account Age
Trust Portfolio
| Account Age (1) |
Number
of Accounts |
Percentage of Total Number of Accounts |
Receivables Outstanding |
Percentage of Total Receivables Outstanding |
||||||||||||
| Not More than 11 Months |
0 | 0.00 | % | $ | 0 | 0.00 | % | |||||||||
| 12 Months to 17 Months |
0 | 0.00 | 0 | 0.00 | ||||||||||||
| 18 Months to 23 Months |
0 | 0.00 | 0 | 0.00 | ||||||||||||
| 24 Months to 35 Months |
0 | 0.00 | 0 | 0.00 | ||||||||||||
| 36 Months to 47 Months |
0 | 0.00 | 0 | 0.00 | ||||||||||||
| 48 Months to 59 Months |
207,175 | 1.33 | 353,629,707 | 1.41 | ||||||||||||
| 60 Months to 71 Months |
1,634,875 | 10.48 | 2,122,370,143 | 8.44 | ||||||||||||
| 72 Months or More |
13,752,339 | 88.19 | 22,673,292,233 | 90.15 | ||||||||||||
|
|
|
|
|
|
|
|
|
|||||||||
| Total |
15,594,389 | 100.00 | % | $ | 25,149,292,082 | 100.00 | % | |||||||||
|
|
|
|
|
|
|
|
|
|||||||||
| (1) | For purposes of this table, the age of an account is rounded down to the nearest whole month. For example, the age of an account that has been in existence for eleven months and twenty days would be rounded down to eleven months, and that account would be included in the “Not More than 11 Months” age range. |
Composition by Geographic Distribution
Trust Portfolio
As of June 30, 2021, approximately 11.80%, 10.53%, 9.50%, 7.39%, 6.11% and 5.25% of the receivables related to account holders having billing addresses in California, New York, Florida, Texas, Georgia and New Jersey, respectively. Not more than 5% of the receivables related to account holders have billing addresses in any other single state.
Composition by Standardized Credit Score
Trust Portfolio
The following table sets forth the composition of the Trust Portfolio as of June 30, 2021 by FICO®* score ranges. To the extent available, FICO scores are obtained at origination and monthly thereafter. A FICO score is a measurement determined by Fair Isaac Corporation using information collected by the major credit bureaus to assess consumer credit risk. FICO risk scores rank-order consumers according to the likelihood that their credit obligations will be paid in accordance with the terms of their accounts. Although Fair Isaac Corporation discloses only limited information about the variables it uses to assess credit risk, those variables likely include, but are not limited to, debt level, credit history, payment patterns (including delinquency experience), and level of utilization of available credit. FICO scores of an individual may change over time, depending on the conduct of the individual, including the individual’s usage of his or her available credit and changes in credit score technology used by Fair Isaac Corporation.
| * | FICO® is a registered trademark of Fair Isaac Corporation. |
7
FICO scores are based on independent, third-party information, the accuracy of which we cannot verify. The account owner does not use standardized credit scores, such as a FICO score, alone to determine the amount of charges that should be approved on a credit card account. Rather, a FICO score is only one of many factors used by AENB, as account owner, to assess an individual’s credit and default risk. In connection with its underwriting and authorization decisions, the account owner uses proprietary scoring models, which it generally has found to be more accurate predictors of credit and default risk than any single standardized credit score such as FICO. The use of proprietary models also enables the account owner to extend credit to an account holder with a lower FICO score without changing the account owner’s risk tolerance than would be the case if the account owner relied solely on FICO. The FICO scores presented below should not be used alone as a method of forecasting whether account holders will make payments in accordance with the terms of their accounts. References to “Receivables Outstanding” in the following table include both finance charge receivables and principal receivables. Because the future composition of the Trust Portfolio may change over time, this table is not necessarily indicative of the composition of the Trust Portfolio at any specific time in the future.
Composition by Standardized Credit Score(1)
Trust Portfolio
| FICO Score Range |
Receivables Outstanding |
Percentage of
Total Receivables Outstanding |
||||||
| Less than 560 |
$ | 113,721,252 | 0.45 | % | ||||
| 560 - 659 |
1,121,495,699 | 4.46 | ||||||
| 660 - 699 |
2,480,006,189 | 9.86 | ||||||
| 700 - 759 |
8,451,498,449 | 33.61 | ||||||
| 760 and above |
12,966,661,420 | 51.56 | ||||||
| Refreshed FICO Unavailable |
15,909,073 | 0.06 | ||||||
|
|
|
|
|
|||||
| Total |
$ | 25,149,292,082 | 100.00 | % | ||||
|
|
|
|
|
|||||
| (1) | Standardized Credit Score defined as the FICO score in the most recent Monthly Period. |
8
Static Pool Information
The Trust Portfolio is comprised of designated consumer American Express credit card accounts and Pay Over Time revolving credit features associated with certain American Express credit card accounts owned by AENB.
The following tables present charge-off, delinquency, payment rate and revenue experience of the Trust Portfolio. Due to the nature of the receivables in the Trust Portfolio, the following tables do not include information relating to (i) prepayments, because the concept of prepayments is not an applicable consideration beyond payment rate data, which is provided, or (ii) standardized credit scores, because credit decisions are being made on an ongoing basis based on continuously evolving obligor credit scores.
Data is presented in the following tables in separate increments based on the calendar year of origination of the accounts, each an “Origination Segment.” Data is presented for the five most recent Origination Segments and for the portion of the current Origination Segment ended June 30, 2021. As used in the tables, the date of origination is generally either the date the account became effective or was first used. The account aging shows activity through the indicated age of the account (e.g., 0-12 months, 13-24 months), which is referred to in this report as the “performance period.” In the following tables, highlighted data is based on a full 12 months of activity for all accounts in the applicable Origination Segment and, therefore, will not change in future disclosures unless the transferor designates Additional Accounts for inclusion in the trust or removes accounts from the trust or a party to the transaction accepts the reassignment of Ineligible Receivables following the breach of certain representations and warranties, and then only if any such addition or removal of accounts or reassignment of Ineligible Receivables involves accounts in the applicable Origination Segments. The data that is not highlighted will change in future disclosures and, in some cases, will reflect activity in an account for less than 12 full months, depending on when the account is originated and when the data for that disclosure is generated.
As of June 30, 2021, the accounts reflected in the following tables had receivables outstanding that were approximately 5.74% of the total receivables outstanding in the Trust Portfolio at such date. Because the accounts reflected in the following tables are only a portion of the Trust Portfolio, the overall performance of the receivables in the Trust Portfolio may be different from the performance reflected in the tables below. There can be no assurance that the performance of receivables in the future will be similar to the historical experience set forth below.
9
Gross Charge-Off Rate of the Trust Portfolio
As of Date: June 30, 2021
| Origination Year |
0-12 Months |
13-24 Months |
25-36 Months |
37-48 Months |
49-60 Months |
>=61 Months |
||||||||||||||||||
| 2021 Origination |
0.00% | |||||||||||||||||||||||
| 2020 Origination |
0.00% | 0.00% | ||||||||||||||||||||||
| 2019 Origination |
0.00% | 0.00% | 0.00% | |||||||||||||||||||||
| 2018 Origination |
0.00% | 0.00% | 0.00% | 0.00% | ||||||||||||||||||||
| 2017 Origination |
0.00% | 0.00% | 0.00% | 0.00% | 0.00% | |||||||||||||||||||
| 2016 Origination |
0.14% | 0.84% | 1.82% | 3.75% | 3.86% | 2.49% | ||||||||||||||||||
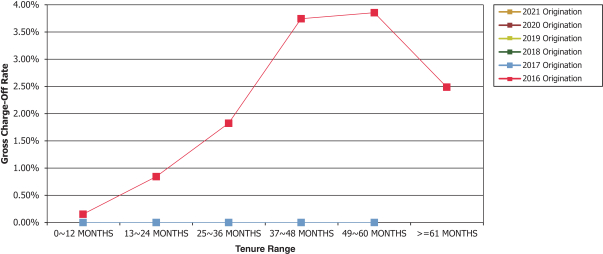
Total gross charge-offs for any Origination Segment include charge-offs of principal receivables only, and do not include any charge-offs of finance charge and fee receivables or the amount of any reductions in principal receivables due to a rebate, refund, error, fraudulent charge or other miscellaneous adjustment. The gross charge-off rate, which is an annualized percentage, results from dividing total gross charge-offs by the average of the month-end principal receivables balances for each month in the applicable performance period, which is referred to in this report as the “average month-end principal receivables outstanding.”
10
Net Charge-Off Rate of the Trust Portfolio
As of Date: June 30, 2021
| Origination Year |
0-12 Months |
13-24 Months |
25-36 Months |
37-48 Months |
49-60 Months |
>=61 Months |
||||||||||||||||||
| 2021 Origination |
0.00% | |||||||||||||||||||||||
| 2020 Origination |
0.00% | 0.00% | ||||||||||||||||||||||
| 2019 Origination |
0.00% | 0.00% | 0.00% | |||||||||||||||||||||
| 2018 Origination |
0.00% | 0.00% | 0.00% | 0.00% | ||||||||||||||||||||
| 2017 Origination |
0.00% | 0.00% | 0.00% | 0.00% | 0.00% | |||||||||||||||||||
| 2016 Origination |
0.14% | 0.82% | 1.79% | 3.70% | 3.80% | 2.45% | ||||||||||||||||||
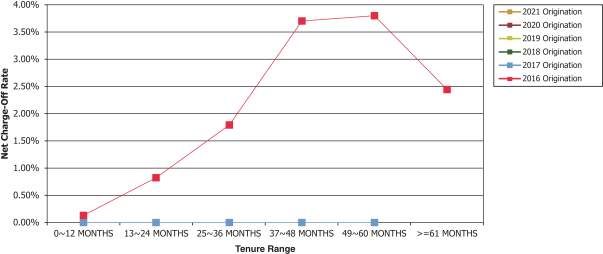
Total net charge-offs for any Origination Segment are an amount equal to total gross charge-offs minus total recoveries. The net charge-off rate, which is an annualized percentage, results from dividing total net charge-offs by the average month-end principal receivables outstanding.
11
30 Days+ Delinquency Rate of the Trust Portfolio
As of Date: June 30, 2021
| Origination Year |
0-12 Months |
13-24 Months |
25-36 Months |
37-48 Months |
49-60 Months |
>=61 Months |
||||||||||||||||||
| 2021 Origination |
0.00% | |||||||||||||||||||||||
| 2020 Origination |
0.00% | 0.00% | ||||||||||||||||||||||
| 2019 Origination |
0.00% | 0.00% | 0.00% | |||||||||||||||||||||
| 2018 Origination |
0.00% | 0.00% | 0.00% | 0.00% | ||||||||||||||||||||
| 2017 Origination |
0.00% | 0.00% | 0.00% | 0.00% | 0.00% | |||||||||||||||||||
| 2016 Origination |
0.13% | 0.46% | 0.99% | 1.77% | 1.45% | 0.83% | ||||||||||||||||||
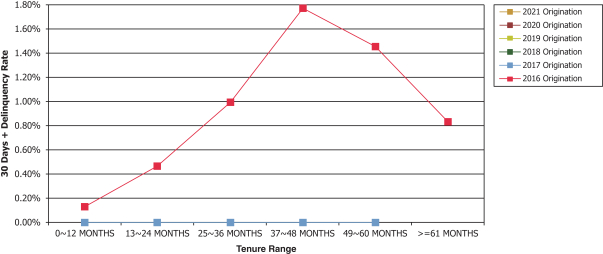
The 30 Days+ Delinquency Rate (i.e., accounts 31 days or more delinquent) is the result of dividing the average of the month-end delinquent amounts for each month in the applicable performance period by the average month-end receivables outstanding.
12
Account Holder Monthly Payment Rate of the Trust Portfolio
As of Date: June 30, 2021
| Origination Year |
0-12 Months |
13-24 Months |
25-36 Months |
37-48 Months |
49-60 Months |
>=61 Months |
||||||||||||||||||
| 2021 Origination |
0.00% | |||||||||||||||||||||||
| 2020 Origination |
0.00% | 0.00% | ||||||||||||||||||||||
| 2019 Origination |
0.00% | 0.00% | 0.00% | |||||||||||||||||||||
| 2018 Origination |
0.00% | 0.00% | 0.00% | 0.00% | ||||||||||||||||||||
| 2017 Origination |
0.00% | 0.00% | 0.00% | 0.00% | 0.00% | |||||||||||||||||||
| 2016 Origination |
47.39% | 42.12% | 38.95% | 36.26% | 38.01% | 46.00% | ||||||||||||||||||
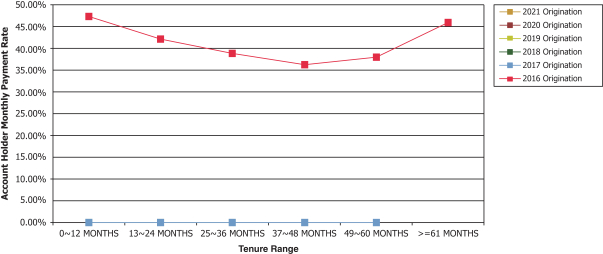
The monthly payment rate results from dividing total principal collections received (excluding recoveries on charged-off receivables) during each month by that month’s opening total principal receivables balance, which is then normalized for a 30-day month.
13
Revenue Experience of the Trust Portfolio
As of Date: June 30, 2021
| Origination Year |
0-12 Months |
13-24 Months |
25-36 Months |
37-48 Months |
49-60 Months |
>=61 Months |
||||||||||||||||||
| 2021 Origination |
0.00% | |||||||||||||||||||||||
| 2020 Origination |
0.00% | 0.00% | ||||||||||||||||||||||
| 2019 Origination |
0.00% | 0.00% | 0.00% | |||||||||||||||||||||
| 2018 Origination |
0.00% | 0.00% | 0.00% | 0.00% | ||||||||||||||||||||
| 2017 Origination |
0.00% | 0.00% | 0.00% | 0.00% | 0.00% | |||||||||||||||||||
| 2016 Origination |
16.47% | 23.52% | 27.18% | 27.48% | 27.95% | 34.08% | ||||||||||||||||||
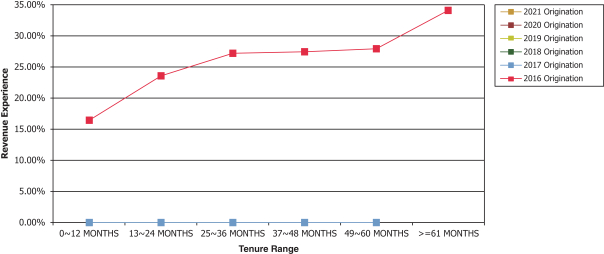
The percentages set forth above, which are annualized percentages, result from dividing total finance charges and fees billed by the average month-end principal receivables outstanding. Total finance charges and fees billed include periodic finance charges, cash advance fees, annual membership fees, other fees and Issuer Rate Fees.
Historical data for revenue experience as reported with respect to the Trust Portfolio (i) unlike the calculation of total finance charges and fees billed above which is based on the related amounts posted to accounts, is calculated based on the related amounts collected on the accounts including recoveries and (ii) is calculated using Issuer Rate Fees. As a result, there are limitations to any comparison of the historical data presented in this report and the static pool data presented in the table above.
14
Glossary of Terms
“AENB” means American Express National Bank, a national banking association.
“Additional Accounts” are any accounts in the Total Portfolio that are designated to the trust pursuant to an addition.
“Business Day” means, for purposes of this report (unless otherwise indicated), any day other than (a) a Saturday or Sunday, or (b) any other day on which banking institutions in New York, New York or any other state in which the principal executive offices of AENB, any other account owner or the trustee are located, are authorized or are obligated by law or executive order to be closed.
“Distribution Date” means, with respect to any series, the 15th day of each month (or, if such 15th day is not a Business Day, the next Business Day).
“Ineligible Receivables” means all receivables with respect to an affected account that has been reassigned to the transferor as a result of the transferor’s breach of certain representations and warranties specified in the purchase agreement and the pooling and servicing agreement.
“Issuer Rate Fees” means certain fees collected by the American Express network, in connection with account holder charges for merchandise and services, that are received by AENB, in its capacity as issuer of American Express cards.
“Monthly Period” means, with respect to each Distribution Date, the calendar month immediately preceding such Distribution Date; provided, however, that the initial Monthly Period with respect to any series will commence on the closing date with respect to such series.
“Origination Segment” has the meaning described in “Static Pool Information” in this report.
“Total Portfolio” is the revolving credit account portfolio of consumer American Express credit card accounts and Pay Over Time revolving credit features associated with credit card accounts owned by AENB and in the future may include other charge or credit accounts or products owned by AENB or other account owners, including revolving credit features of the charge card accounts, but excluding certain accounts owned by AENB issued to Latin American obligors.
“Trust Portfolio” means certain accounts selected from the Total Portfolio and designated for the trust based on the eligibility criteria specified in the purchase agreement and the pooling and servicing agreement.
15
SIGNATURES
Pursuant to the requirements of the Securities Exchange Act of 1934, as amended, the registrant has duly caused this report to be signed on its behalf by the undersigned hereunto duly authorized.
| American Express Receivables Financing Corporation III LLC, as Depositor of the Trust | ||||||
| By: | /s/ Kerri S. Bernstein | |||||
| Name: | Kerri S. Bernstein | |||||
| Title: | President | |||||
| Date: July 28, 2021 | ||||||