Attached files
| file | filename |
|---|---|
| EX-23.2 - EX-23.2 - Weber Inc. | d39834dex232.htm |
| EX-23.1 - EX-23.1 - Weber Inc. | d39834dex231.htm |
| EX-21 - EX-21 - Weber Inc. | d39834dex21.htm |
| EX-10.23 - EX-10.23 - Weber Inc. | d39834dex1023.htm |
| EX-10.15 - EX-10.15 - Weber Inc. | d39834dex1015.htm |
| EX-10.14 - EX-10.14 - Weber Inc. | d39834dex1014.htm |
| EX-10.13 - EX-10.13 - Weber Inc. | d39834dex1013.htm |
| EX-10.12 - EX-10.12 - Weber Inc. | d39834dex1012.htm |
| EX-10.11 - EX-10.11 - Weber Inc. | d39834dex1011.htm |
| EX-5.1 - EX-5.1 - Weber Inc. | d39834dex51.htm |
| EX-1.1 - EX-1.1 - Weber Inc. | d39834dex11.htm |
Table of Contents
As filed with the Securities and Exchange Commission on July 27, 2021.
Registration No. 333-257824
SECURITIES AND EXCHANGE COMMISSION
Washington, D.C. 20549
AMENDMENT NO. 1
TO
FORM S-1
REGISTRATION STATEMENT
UNDER
THE SECURITIES ACT OF 1933
Weber Inc.
(Exact Name of Registrant as Specified in Its Charter)
| DELAWARE | 3630 | 61-1999408 | ||
| (State or Other Jurisdiction of Incorporation or Organization) |
(Primary Standard Industrial Classification Code Number) |
(I.R.S. Employer Identification Number) |
1415 S. Roselle Road
Palatine, Illinois 60067
(847) 934-5700
(Address, Including Zip Code, and Telephone Number, Including Area Code, of Registrant’s Principal Executive Offices)
Chris M. Scherzinger Chief Executive Officer 1415 S. Roselle Road
Palatine, Illinois 60067 (847) 934-5700
(Name, Address, Including Zip Code, and Telephone Number, Including Area Code, of Agent For Service)
Copies to:
| Michael Kaplan Pedro J. Bermeo Davis Polk & Wardwell LLP 450 Lexington Avenue New York, New York 10017 (212) 450-4000 |
Richard A. Fenyes Joshua Ford Bonnie |
Approximate date of commencement of proposed sale to the public: As soon as practicable after the effective date of this Registration Statement.
If any of the securities being registered on this form are to be offered on a delayed or continuous basis pursuant to Rule 415 under the Securities Act of 1933, check the following box. ☐
If this form is filed to register additional securities for an offering pursuant to Rule 462(b) under the Securities Act, check the following box and list the Securities Act registration statement number of the earlier effective registration statement for the same offering. ☐
If this form is a post-effective amendment filed pursuant to Rule 462(c) under the Securities Act, check the following box and list the Securities Act registration statement number of the earlier effective registration statement for the same offering. ☐
If this form is a post-effective amendment filed pursuant to Rule 462(d) under the Securities Act, check the following box and list the Securities Act registration statement number of the earlier effective registration statement for the same offering. ☐
Indicate by check mark whether the registrant is a large accelerated filer, an accelerated filer, a non-accelerated filer, a smaller reporting company or an emerging growth company. See the definitions of “large accelerated filer,” “accelerated filer,” “smaller reporting company” and “emerging growth company” in Rule 12b-2 of the Exchange Act.
| Large accelerated filer ☐ | Accelerated filer ☐ | |
| Non-accelerated filer ☒ | Smaller reporting company ☐ | |
| Emerging growth company ☐ | ||
If an emerging growth company, indicate by check mark if the registrant has elected not to use the extended transition period for complying with any new or revised financial accounting standards provided pursuant to Section 7(a)(2)(B) of the Securities Act. ☐
CALCULATION OF REGISTRATION FEE
|
| ||||||||
| Title Of Each Class Of Securities To Be Registered |
Amount to be registered(1) |
Proposed Maximum offering price per share(2) |
Proposed Offering Price(2) |
Amount Of Registration Fee(3) | ||||
| Class A common stock, par value $0.001 per share |
53,906,250 |
$17.00 | $916,406,250 |
$99,980 | ||||
|
| ||||||||
|
| ||||||||
| (1) | Includes additional shares of Class A common stock that the underwriters have the option to purchase. See “Underwriting.” |
| (2) | Estimated solely for the purpose of computing the amount of the registration fee pursuant to Rule 457(a) under the Securities Act of 1933. |
| (3) | Of this amount, $10,910 was previously paid in connection with the initial filing of this Registration Statement on July 12, 2021. |
The Registrant hereby amends this registration statement on such date or dates as may be necessary to delay its effective date until the Registrant shall file a further amendment which specifically states that this registration statement shall thereafter become effective in accordance with Section 8(a) of the Securities Act of 1933 or until the registration statement shall become effective on such date as the Commission, acting pursuant to said Section 8(a), may determine.
Table of Contents
Information in this preliminary prospectus is not complete and may be changed. We may not sell these securities until the registration statement filed with the Securities and Exchange Commission is effective. This preliminary prospectus is not an offer to sell these securities and we are not soliciting offers to buy these securities in any jurisdiction where the offer or sale is not permitted.
Subject to completion, dated July 27, 2021
Preliminary Prospectus
46,875,000 shares
Class A Common Stock

Weber Inc.
Weber Inc. is offering 46,875,000 shares of its Class A common stock. This is our initial public offering and no public market exists for our Class A common stock. We anticipate that the initial public offering price of our Class A common stock will be between $15.00 and $17.00 per share.
Upon completion of this offering, we will have two classes of common stock: Class A common stock and Class B common stock. The Class A common stock offered hereby will have one vote per share and economic rights and the Class B common stock will have one vote per share but no economic rights. Upon completion of this offering, the Pre-IPO LLC Members (as defined herein), including entities controlled by BDT Capital Partners, LLC, our sponsor, and certain members of management, will hold shares of Class B common stock that will entitle them to 74% of the combined voting power of our common stock (or 71% if the underwriters exercise their option to purchase additional shares of Class A common stock in full). In addition, entities controlled by BDT Capital Partners, LLC will be able to control any action requiring the general approval of our stockholders, including the election of our board of directors, the adoption of amendments to our certificate of incorporation and bylaws and the approval of any merger or sale of the Company or substantially all of our assets. As a result, we will be a “controlled company” within the meaning of the New York Stock Exchange (“NYSE”) rules. See “Management—Board Structure—Controlled Company Exception.”
We are a holding company, and immediately after the consummation of the Reorganization Transactions (as defined herein) and this offering our principal asset will be our ownership interests in Weber HoldCo LLC. As the sole managing member of Weber HoldCo LLC, we will operate and control all of the business and affairs of Weber HoldCo LLC and, through Weber HoldCo LLC and its subsidiaries, conduct our business. See “Organizational Structure.”
We will use all of the net proceeds we receive from this offering (i) to purchase new membership interests of Weber HoldCo LLC, which we refer to as “LLC Units,” from Weber HoldCo LLC, (ii) to purchase LLC Units from certain Pre-IPO LLC Members and (iii) to repurchase a portion of our Class A common stock received by the Blocker equityholders (as defined below) in connection with the Reorganization Transactions, in each case at a price per LLC Unit and share of Class A common stock, as applicable, equal to the initial public offering price of our Class A common stock minus underwriting discounts. We will cause Weber HoldCo LLC to use the proceeds from the sale of LLC Units to Weber Inc.: (i) to pay fees and expenses in connection with this offering and the Reorganization Transactions; (ii) to repay a portion of the outstanding borrowings under our Secured Credit Facility (as defined herein) and (iii) for general corporate purposes. See “Use of Proceeds.” Weber HoldCo LLC will not receive any proceeds from purchase of LLC Units from certain Pre-IPO LLC Members by us or the repurchase of shares of Class A common stock by us.
We have applied to list our Class A common stock on the NYSE under the symbol “WEBR.”
Investing in our Class A common stock involves risk. See “Risk Factors” beginning on page 37.
Neither the Securities and Exchange Commission, or the SEC, nor any state securities commission has approved or disapproved of these securities or determined if this prospectus is truthful or complete. Any representation to the contrary is a criminal offense.
| Per share | Total | |||||||
| Initial public offering price |
$ | $ | ||||||
| Underwriting discounts and commissions(1) |
$ | $ | ||||||
| Proceeds to us before expenses |
$ | $ | ||||||
| (1) | See “Underwriting” for a description of compensation to be paid to the underwriters. |
We have granted the underwriters the option to purchase an additional 7,031,250 shares of Class A common stock from us at the initial public offering price less the underwriting discount within 30 days of the date of this prospectus.
The underwriters expect to deliver the shares against payment in New York, New York on or about , 2021 through the book-entry facilities of The Depository Trust Company.
| Goldman Sachs & Co. LLC | BofA Securities | J.P. Morgan |
| BMO Capital Markets | Citigroup | UBS Investment Bank | Wells Fargo Securities | KeyBanc Capital Markets | ||||
| Academy Securities | Cabrera Capital Markets LLC | Siebert Williams Shank | Telsey Advisory Group |
The date of this prospectus is , 2021.
Table of Contents
| Page | ||||
| 1 | ||||
| 37 | ||||
| 79 | ||||
| 80 | ||||
| 86 | ||||
| 88 | ||||
| 89 | ||||
| Unaudited Pro Forma Condensed Consolidated Financial Information |
91 | |||
| 102 | ||||
| 104 | ||||
| Management’s Discussion and Analysis of Financial Condition and Results of Operations |
107 | |||
| 142 | ||||
| 144 | ||||
| 167 | ||||
| 174 | ||||
| 197 | ||||
| 206 | ||||
| 209 | ||||
| Material U.S. Federal Tax Considerations for Non-U.S. Holders of Common Stock |
217 | |||
| 220 | ||||
| 222 | ||||
| 229 | ||||
| 229 | ||||
| 230 | ||||
| F-1 | ||||
In this prospectus, unless the context otherwise requires, “Weber,” the “Company,” “we,” “us” and “our” refer (i) prior to the consummation of the reorganization transactions described under “Organizational Structure—The Reorganization Transactions,” to Weber-Stephen Products LLC and its subsidiaries and (ii) after the reorganization transactions described under “Organizational Structure—The Reorganization Transactions,” to Weber Inc., Weber HoldCo LLC, Weber-Stephen Products LLC and their subsidiaries. “Fiscal year” refers to the year ended September 30 of a particular year. Unless otherwise stated or the context otherwise requires, all information in this prospectus reflects the consummation of the Reorganization Transactions.
We and the underwriters have not authorized anyone to provide any information or to make any representations other than those contained in this prospectus or in any free writing prospectuses we have prepared. We and the underwriters take no responsibility for, and can provide no assurance as to the reliability of, any other information that others may provide you. We are offering to sell, and seeking offers to buy, shares of Class A common stock only in jurisdictions where offers and sales are permitted. The information contained in this prospectus is accurate only as of the date of this prospectus, regardless of the time of delivery of this prospectus or of any sale of Class A common stock. Our business, financial condition, results of operations and prospects may have changed since the date on the front cover of this prospectus.
i
Table of Contents
Market and Industry Data
This prospectus includes industry and market data that we obtained from periodic industry publications, third-party studies and surveys, including (i) Frost & Sullivan: Grill Market Study, an independent third-party market study we commissioned in May 2021, (ii) MetrixLab; Brand Health & Habits Study and (iii) Hunter PR’s Food Study Special Report, filings of public companies in our industry and internal company surveys. These sources include government and industry sources. Industry publications and surveys generally state that the information contained therein has been obtained from sources believed to be reliable. Although we believe the industry and market data to be reliable as of the date of this prospectus, this information could prove to be inaccurate. Industry and market data could be wrong because of the method by which sources obtained their data and because information cannot always be verified with complete certainty due to the limits on the availability and reliability of raw data, the voluntary nature of the data gathering process and other limitations and uncertainties. In addition, we do not know all of the assumptions regarding general economic conditions or growth that were used in preparing the forecasts from the sources relied upon or cited herein.
This prospectus includes references to our Net Promoter Score (NPS). A Net Promoter Score is a metric used for measuring consumer satisfaction and loyalty. We calculate our Net Promoter Score annually through an outside agency by asking a sample of consumers the following question: “How likely are you to recommend the Weber brand to a friend or colleague?” Consumers are then given a scale from 0 (labeled as “Not at all likely to recommend”) to 10 (labeled as “Extremely Likely to recommend”). Consumers rating us 6 or below are considered “Detractors”, 7 or 8 are considered “Passives”, and 9 or 10 are considered “Promoters”. To calculate our Net Promoter Score, we subtract the total percentage of Detractors from the total percentage of Promoters. For example, if 50% of overall respondents were Promoters and 10% were Detractors, our Net Promoter Score would be 40. Net Promoter Scores can range from -100 to 100. The Net Promoter Score gives no weight to consumers who decline to answer the survey question, and is asked among current grill owners about the grill brand they use most often. This method is substantially consistent with how other businesses and industries typically calculate their Net Promoter Score. Our Net Promoter Scores disclosed in this
prospectus were derived from sample sizes of 159 consumers in the U.S., 142 consumers in Germany and 266 consumers in Australia.
The sources of certain statistical data, estimates, and forecasts contained in this prospectus are provided below:
| • | United Nations |
| • | OECD (HM1-5-Housing-stock-by-dwelling-type) |
Statistics and estimates related to our Total Addressable Market, or TAM, and Serviceable Addressable Market, or SAM, are based on internal reports conducted with the assistance of our third-party marketing partner, Frost & Sullivan, Inc. In order to determine our TAM and SAM, we conducted a multi-regional survey of 4,089 consumers living in the United States, Canada, France, Germany, Australia, Argentina, Mexico and Brazil, surveying a minimum of 500 respondents per country.
Consumer responses to the survey, combined with external research, were used as the basis for determining our TAM and SAM by weighing such responses to population censuses based on poverty rate, dwelling type, grill ownership, and consumer spend for fuel and accessories. To calculate our TAM, we identified the total number of relevant households (excluding households in poverty and households without outdoor space) in 117 countries. Multiplying an annual grill spend by the targeted grill owner households, we then calculated the total grill TAM. To calculate the TAM for fuel and accessories, we considered an income level-dependent percentage of grill spend. Adding total global TAM for grills, fuel and accessories resulted in the total global TAM.
ii
Table of Contents
In lieu of the top-down approach taken for TAM estimates, for SAM we estimated unit market share and price points for major players in the grill market in Weber’s top five countries (United States, Canada, France, Germany and Australia). To calculate the fuel costs, we considered the total number of relevant households multiplied by total spend by fuel for each specific fuel type. We then considered the total grill SAM and multiplied by 25% to calculate the total accessories spend. Adding total grill, fuel and accessories costs resulted in total SAM for the five countries noted above. We then assumed the percentage for which the top five countries accounted to find the global SAM.
Trademarks, Trade Names and Service Marks
This prospectus contains references to a number of trademarks, trade names and service marks which include our registered trademarks or service marks, such as “Weber,” “Weber Connect,” “Weber Grill Academy,” “Summit,” “SmokeFire,” “Pulse” and “Genesis,” or trademarks, trade names or service marks for which we have pending applications or common law rights. This prospectus also contains trademarks, trade names, and service marks of third parties which, to our knowledge, are the property of their respective holders. Solely for convenience, (i) references in this prospectus to trademark(s) shall also include service mark(s) and (ii) the trademarks, trade names and service marks referred to in this prospectus may appear without the TM and ® symbols, but the absence of such symbols is not intended to indicate, in any way, that we will not assert, to the fullest extent under applicable law, our rights to such trademarks, trade names and service marks. We do not intend our use or display of other parties’ trademarks, trade names or service marks to imply, and such use or display should not be construed to imply, a relationship with, or endorsement or sponsorship of us by, these other parties.
Non-GAAP Financial Measures
We provide supplemental non-GAAP financial measures that our management utilizes to evaluate our ongoing financial performance and provide additional insight to investors as supplemental information to our U.S. GAAP (as defined below) results. The use of non-GAAP financial information should not be considered as an alternative to, or more meaningful than, the comparable U.S. GAAP measures. In addition, because our non-GAAP measures are not determined in accordance with U.S. GAAP, it is susceptible to differing calculations, and not all comparable or peer companies may calculate their non-GAAP measures in the same manner. As a result, the non-GAAP financial measures presented in this prospectus may not be directly comparable to similarly titled measures presented by other companies.
We refer in this prospectus to the following non-GAAP financial measures:
| • | Adjusted income from operations; |
| • | Adjusted net income; |
| • | EBITDA; and |
| • | Adjusted EBITDA. |
These non-GAAP financial measures are not prepared in accordance with generally accepted accounting principles in the United States (“U.S. GAAP”). They are supplemental financial measures of our performance only, and should not be considered substitutes for net income, income from operations or any other measure derived in accordance with U.S. GAAP.
As used in this prospectus, these non-GAAP financial measures have the following meanings:
| • | Adjusted income from operations is income from operations adjusted for non-cash stock compensation / Management Incentive Plan (“LTIP”) and profits interest expense, business transformation costs, operational transformation costs, impairment costs, debt refinancing and |
iii
Table of Contents
| IPO costs, COVID-19 costs, foreign currency (loss) gain, and gain on disposal of assets. Adjusted income from operations excludes loss from early extinguishment of debt, interest expense, net, income taxes and loss (gain) from investments in unconsolidated affiliates; |
| • | Adjusted net income is net income adjusted for non-cash stock compensation / LTIP and profits interest expense, business transformation costs, operational transformation costs, impairment costs, debt refinancing and IPO costs, COVID-19 costs, loss from early extinguishment of debt, and gain on disposal of assets held for sale, net of the tax impact of such adjustments; |
| • | EBITDA is net income before interest expense, net, income taxes, and depreciation and amortization; and |
| • | Adjusted EBITDA is net income before interest expense, net, income taxes, depreciation and amortization, adjusted for non-cash stock compensation / LTIP and profits interest expense, business transformation costs, operational transformation costs, impairment costs, debt refinancing and IPO costs, COVID-19 operational costs, loss from early extinguishment of debt, and gain on disposal of assets held for sale. |
Adjusted income from operations and adjusted net income are key metrics used by management and our board of directors to assess our financial performance. We use adjusted income from operations and adjusted net income as indicators of the productivity, profitability and performance of our business and our ability to manage expenses, after adjusting for certain one-time expenses. For a reconciliation of adjusted income from operations to income from operations and adjusted net income to net income, see “Prospectus Summary—Summary Historical and Unaudited Pro Forma Condensed Consolidated Financial Data.”
EBITDA and adjusted EBITDA are key metrics used by management and our board of directors to assess our financial performance. We use EBITDA and adjusted EBITDA to supplement U.S. GAAP measures of performance to evaluate the effectiveness of our business strategies, to make budgeting decisions, and to compare our performance against that of other companies using similar measures.
Our use of the terms adjusted income from operations, adjusted net income, EBITDA and adjusted EBITDA may vary from the use of similar terms by other companies in our industry and accordingly may not be comparable to similarly titled measures used by other companies.
The non-GAAP financial measures used in this prospectus have not been reviewed or audited by our or any independent registered public accounting firm.
Adjusted income from operations, adjusted net income, EBITDA and adjusted EBITDA have important limitations as analytical tools. For example:
| • | All metrics do not reflect changes in, or cash requirements for, our working capital; |
| • | Adjusted income from operations, adjusted net income and adjusted EBITDA do not reflect the impact of certain expenses, including cash charges, resulting from matters we consider not to be indicative of our core operations, and do not reflect stock-based compensation expense and other non-cash charges or awards under our Management Incentive Compensation Plan, which have historically settled in cash but will be restructured to settle in stock of Weber Inc. in connection with this offering; |
| • | Adjusted net income, EBITDA and adjusted EBITDA exclude certain tax payments that may represent a reduction in cash available to us; and |
| • | EBITDA and adjusted EBITDA do not account for any cash capital expenditure requirements for the assets being depreciated and amortized that may have to be replaced in the future, nor do they reflect the interest expense or the cash requirements necessary to service interest or principal payments on our debt. |
iv
Table of Contents
This summary highlights selected information that is presented in greater detail elsewhere in this prospectus. This summary does not contain all of the information you should consider before investing in our Class A common stock. You should read this entire prospectus carefully, including the sections titled “Risk factors,” “Management’s Discussion and Analysis of Financial Condition and Results of Operations” and our financial statements and the related notes included elsewhere in this prospectus, before deciding whether to purchase shares of our Class A common stock.
Our Mission and Purpose
Our mission at Weber is to lead the outdoor cooking industry by innovating breakthrough new products and services that enhance our global consumers’ grilling experiences. Our purpose is to ignite inspiration and discovery through everything we do, at every touchpoint with our consumers. Grilling is about making delicious food, bringing people together and creating memories. Weber is an experience, a passion, a way of life and a journey to discover what grilling can be.
Who We Are
We are the leading outdoor cooking company with the strongest and most trusted brand in the global outdoor cooking market. Our founder George Stephen, Sr., established the outdoor cooking category when he invented the original charcoal grill nearly 70 years ago. In the decades since, we have built a loyal and global following of both grilling enthusiasts and barbeque professionals in backyards all around the world. We have continuously disrupted and led the outdoor cooking category, through a comprehensive and expanding product portfolio including traditional charcoal grills, gas grills, smokers, pellet and electric grills, and recently our cutting-edge Weber Connect™ technology-enabled grills. We believe we offer the most complete outdoor cooking portfolio globally, with our full range of premium products sold in 78 countries in fiscal 2020.
We believe Weber is the only outdoor cooking brand with global scale and a vertically integrated manufacturing platform. Our track record of premium product innovation and the strength of our brand has led to a market-leading share of 23% in the U.S. and 24% globally in 2020, according to Frost & Sullivan. We are leaders in the largest and most attractive markets in outdoor cooking, including the U.S., Germany, Australia, Canada and France. Beyond these markets, we estimate that we have either the number one or number two brand position in each of the key geographies we serve.
We have spent decades building brand affinity and awareness by teaching people how to grill the “Weber Way.” By consistently delivering high-performing, differentiated products and best-in-class customer service, we have built a global community of passionate brand loyalists who value our innovation, uncompromising quality and performance. Over the years, families have passed down their affinity for Weber from one generation to the next, forging a deep emotional connection between consumers and our brand. We continue to deepen our relationship with our consumers by bringing innovation to our grill and accessory portfolio, introducing breakthrough connected products, expanding into new categories, and providing engaging brand experiences.
Product Innovation and Technology
Weber has developed one of the most technologically advanced outdoor cooking portfolios in the industry, and maintains a diverse product portfolio across fuel types, pricing tiers, and a wide range of
1
Table of Contents
accessories, consumables and services. We consistently maintain an uncompromising commitment to exceptional quality and innovative ways to cook outdoors. Accelerated technology adoption in and around the home and new home buying occasions create opportunities to further integrate our brand into the daily lives of our consumers.
With the 2020 introduction of our connected grilling platform, Weber Connect™, we continue to be at the forefront of innovation in the outdoor cooking industry. Weber Connect brings together cutting-edge grilling technology, a mobile app and a cloud-based infrastructure on a single interconnected platform. We believe that our connected products make grilling the perfect meal simple with our smartphone-enabled, step-by-step cooking experience. The Weber Connect platform is powered by June OS, our award-winning smart cooking software solution developed by June Life. In 2018, we made a minority investment in June Life and entered into a license and development agreement. In January 2021, we acquired the company in full to further enhance our leadership position in connected outdoor cooking.
2
Table of Contents
Our current product portfolio includes:

3
Table of Contents
Omni-Channel Strategy
We bring our products to market through a diverse and powerful omni-channel network comprised of wholesale, direct-to-consumer (“DTC”) and e-commerce channels. Our wholesale channel is made up of 4,710 retailers with 31,690 physical locations. We work with leading global, regional and large multi-national retailers such as Costco Wholesale, The Home Depot, Lowe’s Companies, and Walmart Inc., as well as European retailers including Bauhaus and OBI. Independent and Specialty retailers comprise an important part of our channel mix by serving consumers who seek more education, a broader assortment of products and higher service. We believe our broad global brick-and-mortar retail presence reinforces our brand leadership. Our commitment to our retailers is evidenced by the numerous awards that we have won for our category leadership, service excellence and new product innovation. Most recently, in 2020, we were recognized as Supplier of the Year at leading retailers such as Ace Hardware and The Home Depot Canada.
Our DTC approach includes both a digital platform (Weber.com) and brick-and-mortar locations (a majority are independently operated Weber branded retail stores and Weber Grill Academy™ experience centers). Our DTC initiatives have led to a compounded annual revenue growth rate of 47% in our DTC business since 2018. Weber.com has been the fastest growing channel across our omni-channel network with a compounded annual revenue growth rate of 135% since 2018. Internationally, we have 170 Weber branded retail stores and Weber Grill Academy sites (161 independently operated, 9 Weber-operated) making us the only outdoor cooking brand with a global network of experiential retail environments. Our Weber branded retail stores and Weber Grill Academy sites represent a significant component of our international sales channels. At most of our Weber Grill Academy sites, we offer world-class instruction by Grill Masters with culinary expertise who help our consumers improve their cooking skills and better engage with our products. Our Weber branded stores and Weber Grill Academy sites offer unique branded experiences and consumer engagement that strengthen the consumers’ connection with the Weber brand. We believe that the physical experience of our branded retail stores and the global scale of our network would be difficult to replicate by competitors in the outdoor cooking market.
4
Table of Contents

With our e-commerce and digital initiatives, we have been the leaders in shifting outdoor cooking purchases to online. Our e-commerce channel is made up of the online platforms of our global, regional, and multi-national retailers such as Costco Wholesale, The Home Depot, Lowe’s, Walmart, Bauhaus and OBI, as well as digitally native retailers such as Amazon and Wayfair. We believe our online share in the U.S. in fiscal year 2020 was two times greater than that of our nearest competitor, including our revenues through Weber.com and our e-commerce partners. On Amazon, we are the number one outdoor cooking brand, and according to Weber management estimates, we captured 29% market share in the outdoor cooking category sold online in the U.S. in 2020.
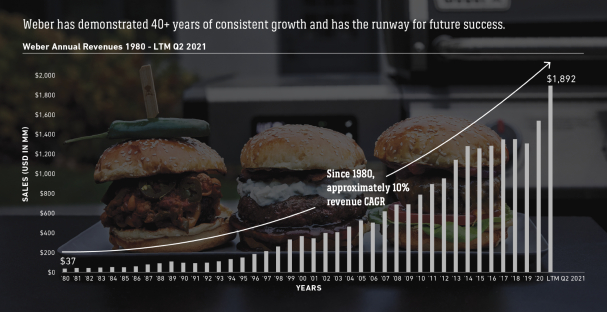
Long-Term Track Record of Performance
We have experienced growth in various economic environments and have benefited from lasting consumer shifts in behavior towards outdoor cooking, which is evidenced by our 10% revenue CAGR
5
Table of Contents
from 1980 to 2021. Our track record of growth is driven by our iconic brand, massive installed base of loyal enthusiasts, and approximately 26% of our revenues being comprised of accessories and consumables all of which support a predictable, recurring revenue model. More recently, our significant investments in Weber Connect, Weber.com, and the ongoing consumer shifts towards backyard and outdoor leisure have further enhanced our growth profile. We expect these consumer shifts to continue in the future.
Our Recent Financial Performance
Our compelling financial profile is characterized by stable revenue growth, solid profitability and consistent high cash flow generation.
Comparing our six months ended March 31, 2021 with six months ended March 31, 2020, we achieved the following results:
| • | Increase in revenue from $596.4 million to $963.3 million, representing year-over-year growth of 62%; |
| • | Increase in income from operations from $56.4 million to $120.9 million, representing year-over-year growth of 114%; |
| • | Increase in net income from $23.6 million to $73.8 million, representing year-over-year growth of 213%; |
| • | Increase in adjusted income from operations from $58.3 million to $161.1 million, representing year-over-year growth of 176%; |
| • | Increase in adjusted net income from $30.6 million to $111.1 million, representing year-over-year growth of 263%; |
| • | Increase in EBITDA from $69.0 million to $141.3 million, representing year-over-year growth of 105%; and |
6
Table of Contents
| • | Increase in Adjusted EBITDA from $77.0 million to $186.9 million, representing year-over-year growth of 143%. |
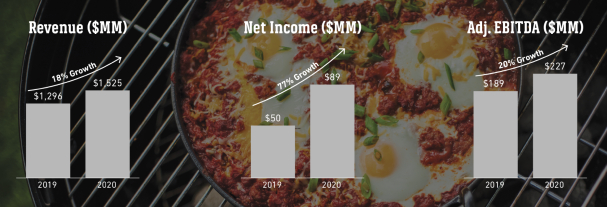
Comparing our fiscal year 2020 with fiscal year 2019, we achieved the following results:
| • | Increase in revenue from $1,296.2 million to $1,525.3 million, representing year-over-year growth of 18%; |
| • | Increase in income from operations from $106.9 million to $151.5 million, representing year-over-year growth of 42%; |
| • | Increase in net income from $50.1 million to $88.9 million, representing year-over-year growth of 77%; |
| • | Increase in adjusted income from operations from $143.8 million to $189.0 million, representing year-over-year growth of 31%; |
| • | Increase in adjusted net income from $77.9 million to $126.0 million, representing year-over-year growth of 62%; |
| • | Increase in EBITDA from $154.0 million to $184.1 million, representing year-over-year growth of 20%; and |
| • | Increase in Adjusted EBITDA from $189.1 million to $226.7 million, representing year-over-year growth of 20%. |
| ||||||
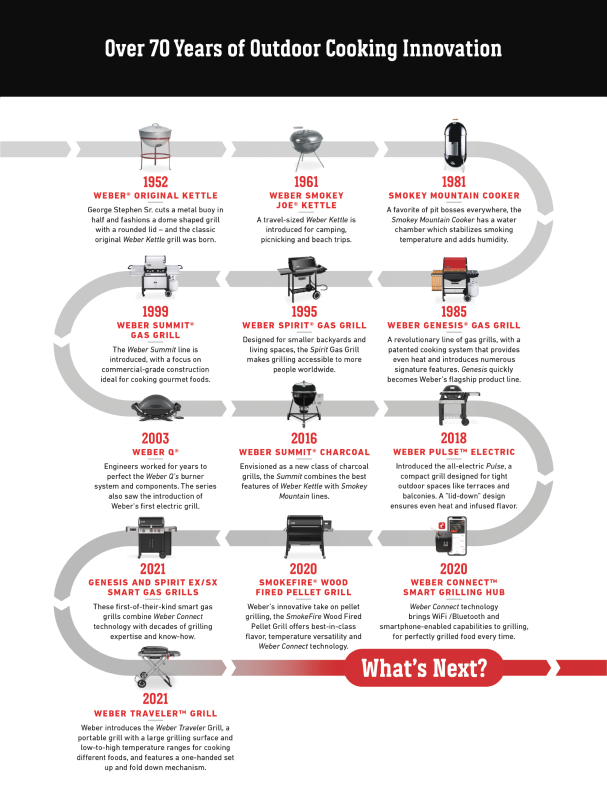
Our History and Legacy of Innovation
We believe that our track record of innovation and category leadership is unparalleled in the outdoor cooking industry. The Weber journey began in 1952, when our founder George Stephen invented covered charcoal cooking with the iconic Weber Kettle grill. In the 1980s, we used the same ingenuity and unwavering approach to product quality and innovation to develop our Genesis gas grill, and again quickly became the market leader in the new category. In the 2000s, we disrupted the grilling market for the third time with the portable Weber Q grill and redefined mobility for millions of outdoor cooking enthusiasts. Recently, we introduced the SmokeFire wood pellet grill, the Pulse electric grill and the Weber Traveler gas grill, fueling additional expansion and leadership globally into these subcategories.
Today, we continue to disrupt the grilling category through our innovations with Weber Connect, which will further enhance the consumer experience, while staying true to our steadfast commitment to delivering premium products. We believe that the connected capabilities offered by our technology-enabled products will enable a closer relationship with our consumers and usher in a new generation of enthusiasts who will join our global community of Weber loyalists.
7
Table of Contents
8
Table of Contents
Highly Experienced and Visionary Management Team
To achieve our goals and meet our growth initiatives, we have assembled a management team that combines world-class brand expertise and advanced technological capabilities. In mid-2018, Chris Scherzinger joined as Chief Executive Officer, after spending the prior decade in a number of group CEO roles in the largest operating divisions at Jarden Corporation and Newell Brands. Prior to joining Newell/Jarden, Mr. Scherzinger held global marketing leadership and brand management and operational roles at Johnson & Johnson, Procter & Gamble and General Electric. In 2018, Bill Horton also joined as Chief Financial Officer, having also previously served as group CFO for a number of business units within Jarden Corporation and Newell Brands from 2009 to 2018. Prior to his time with Newell/Jarden, Mr. Horton spent 12 years in a number of leadership roles with Procter & Gamble, and served in the United States Air Force for five years. During their time at Jarden Corporation and Newell Brands, Scherzinger and Horton partnered for four years as group CEO and CFO of Jarden’s largest operating segment. Our management team has a proven track record of building brands, leading market innovation, expanding distribution, driving best-in-class operations and delivering consistently strong financial results.
Our Competitive Strengths
We believe that the following competitive strengths are key drivers of our past and future success.
Iconic Global Brand and Market Leader
For nearly 70 years, the Weber brand has defined the outdoor cooking category by enriching the experience of grilling consumers around the world. Based on internal management estimates and in coordination with Frost & Sullivan, we believe revenue in our top five markets to be up to three times that of the next leading competitor. We are the most recommended brand in the outdoor cooking industry by consumers, according to MetrixLab, with total brand awareness of 87% in the United States, 86% in Germany, 89% in Australia, 74% in Canada, and 76% in France, the five largest grilling markets in the world. Our consumers often share a deep emotional connection with our iconic brand that is passed down from one generation to the next. 41% of consumers indicated Weber as the U.S. brand they are most likely to purchase next relative to only 18% and 2% for our next closest competitors, according to a 2020 MetrixLab Brand Health & Habits Survey. We are the only global manufacturer and distributor in the outdoor cooking industry with leading market share in nearly every product sub-category across geographies. The leadership of our global brand is demonstrated by holding the number one brand position in grilling, in the United States, Germany, Australia, France and Canada with 23%, 44%, 30%, 26% and 24% market share respectively, and 24% globally, according to Frost & Sullivan. In addition, we have the number one brand position in gas grilling across these five markets and the number one brand position in charcoal grilling in the United States and Australia, according to Frost & Sullivan. Gas and charcoal grill types continue to be preferred by consumers, with 51% of survey respondents indicating they are most likely to purchase a gas grill next and 26% indicating charcoal grills, relative to only 3% for pellet grills, according to a 2020 MetrixLab Brand Health & Habits Survey. Our brand leadership is further emphasized by our 22 global points of distribution through wholesale and direct retail channels across 78 countries.
Massive Community of Loyal Weber Enthusiasts
Since 1952, we have cultivated deep bonds with generations of Weber owners and their families, as evidenced by our massive installed base of 30 million Weber grills in the U.S. and 50 million Weber grills globally. Our installed base coupled with impressive net promoter scores of 62 in the U.S., 65 in
9
Table of Contents
Germany and 52 in Australia, as of 2020, enable a powerful recurring revenue model through repeat grill sales, and branded accessories and consumables purchases. Our installed base continues to grow as we expand in international markets, where we combine what consumers love about their local grilling traditions with the magic of the Weber grilling experience. Our marketing strategies and recent investments in Weber.com continue to grow our massive community of Weber enthusiasts, with 65 million site visits in 2020 globally, representing an increase of 83% compared to 2019. Alongside this growth in Weber.com, we are rapidly building database marketing initiatives to further enhance our consumer relationships and maximize purchase frequency.
Leader in Product Development with Exceptional Quality
Disruptive innovation has been part of the Weber culture since the introduction of the iconic Weber Kettle grill in 1952. Today we continue our legacy of innovation with our SmokeFire wood pellet grills, Pulse electric grills, and our Weber Connect platform. We believe that the Weber Connect platform has set the standard for connected grilling, as evidenced by the recent Consumer Electronics Show Award for best Connected-Home Product in 2020, and represents the future of our industry. We believe that our acquisition of June Life provides us with industry-leading in-house software engineering talent that will help drive continued innovation for years to come.
Throughout the decades, we have maintained an uncompromising approach to exceptional quality and performance. We believe this has allowed us to expand from our roots in charcoal grills to a diverse portfolio across price points and fuel types, including gas grills, electric grills, smokers, pellet grills and accessories, consumables and services. We pride ourselves on bringing our commitment to quality and performance standards in each new category we enter. Weber is also recognized for developing and utilizing industry-leading features in the grilling category, such as Flavorizer bars (for even heating) and porcelain-enameled coating (for withstanding the high-heat applications). We employ an in-house team of engineers and designers to develop our products to ensure they meet our high standards of performance and quality. We also employ a best-in-class customer service organization that fuels brand satisfaction and loyalty.
Diversified Global Revenue Base and Broad Network of Distribution Partners in Each Region
The iconic nature of our global brand enables us to sell in 78 countries across six continents. In 2020, approximately 58% of our revenue was generated in the Americas, 35% in Europe, Middle East and Africa (“EMEA”) and 7% in Asia-Pacific (“APAC”). We distribute our products through a diverse and powerful omni-channel platform, consisting of our wholesale, DTC and e-commerce channels. Across our distribution network, we believe Weber is the outdoor cooking brand that reinforces our distribution partners’ presence in the grilling category. In our wholesale channel, we work with leading global retailers including Ace Hardware and Costco Wholesale across the Americas, Europe and Asia. Our wholesale business also spans large international retail partners such as The Home Depot, Lowes Companies and Walmart Inc. across the U.S., Canada and Mexico, as well as Bauhaus and OBI in Europe. According to management estimates, at Ace Hardware, The Home Depot and Lowes, we represented 52%, 39%, and 32% dollar share of each retailer’s grilling category respectively in 2020. Across other regions, we distribute our products through a global network of independent and specialty dealers. Our DTC channel provides an unparalleled customer experience at Weber.com and our independently operated Weber branded retail stores and Weber Grill Academy sites. Weber.com features our complete product assortment and exclusive online offerings so consumers are able to compare products, read reviews and transact in a virtual environment. To complement our online presence, we operate a network of 170 Weber branded retail stores globally, which are strategically located in markets where we are leading consumer shifts to popularize the
10
Table of Contents
outdoor cooking industry. To further enhance our online presence, we offer our products on the online platforms of our retailer partners and digitally native retailers such as Amazon.com, where we are the number one outdoor cooking brand in the U.S. and capture 29% of the outdoor grill category.
U.S.-Led, Global Manufacturing Footprint and World-Class Supply Chain
We are a vertically integrated manufacturer and the only major outdoor cooking company that maintains a significant U.S.-based manufacturing footprint that is complemented by other manufacturing capabilities throughout the world. We operate three manufacturing facilities in Illinois with core competencies in metal fabrication, welding, deep drawn stamping and porcelain-enameled coatings. In 2018, our U.S. operations were consolidated into our Huntley facility where approximately 55% of our global grill demand is currently produced. In addition, Weber maintains trusted relationships of more than 15 years with three major grill manufacturers in China and Taiwan to provide flexibility to produce some of our grills, which provides redundant manufacturing of key product lines. We have a long-standing history with a diversified set of suppliers who send components to our U.S. manufacturing facilities as well as our China manufacturing partners. Our 22 global distribution facilities serve 78 countries and have capabilities including truckload shipping to our customers and parcel service to support our growing DTC business. Our U.S.-led, diversified global manufacturing and distribution footprint provides Weber with a significant competitive advantage, allowing for a balanced combination of quality, speed and agility in response to customer demand locally and globally. We believe our diversified manufacturing platform also enables us to better manage potential supply chain disruptions and navigate changes in tariff policies more effectively than our competitors.
In 2020, we expanded our “Make Where We Sell” philosophy, and continued growth in the EMEA region drove the decision to commission a manufacturing plant in Europe and break ground on a new facility in Zabrze, Poland. This new location will manufacture and distribute key product lines for the EMEA market and is expected to open for operation in the fourth quarter of fiscal year 2021. The strategic location of this facility will facilitate reduced labor and transportation costs, resulting in positive improvements to our operating margin. The breadth and depth of our supply chain initiatives have been, and will continue to be, a key business focus and source of strong cash flow generation.
Exceptional Financial Profile Through Business Cycles
Weber has a long track record of strong growth and resilient financial performance, through periods of varying macro-economic cycles. Our growth has been broad-based across product categories and geographies. Weber benefits from countercyclical trends associated with “eat at home” categories, where challenging economic periods lead families to cook and spend more time at home. However, Weber also thrives in strong economic times when disposable income and investments in and around the home and backyard are strong. Our business maintains a strong margin profile driven by our consistent premium pricing strategy, global scale, vertically integrated manufacturing capabilities, operational productivity programs and commitment to value-added product innovations. We are well positioned to continue to execute on our operational excellence initiatives, including our new manufacturing and distribution facility in Poland. Our resilient growth, margin improvement and efficient capital intensity all contribute to our strong free cash flow. Our strong free cash flow profile allows for significant capital allocation flexibility, enabling long-term shareholder value creation through multiple operating and financial strategies.
Highly Experienced and Visionary Management Team
We believe our management team, led by CEO Chris Scherzinger and CFO Bill Horton, is among the most experienced in the industry, representing decades of leading global consumer brands. We
11
Table of Contents
have built a broad executive leadership team with extensive brand building experience from companies such as Amazon, Bosch, Danaher, Dyson, General Motors, Royal Dutch Shell, Unilever, Whirlpool and more. In addition, with our recent acquisition of June, we have acquired software and hardware engineering talent from Apple, Google, Lyft, Microsoft, SpaceX, Tesla and other leading technology companies. Our management team is uniquely capable of executing upon our strategic vision and successfully continuing to create long-term shareholder value by scaling our business, leading innovation, expanding distribution, and managing expansive global operations.
12
Table of Contents
Our Growth Strategy
13
Table of Contents
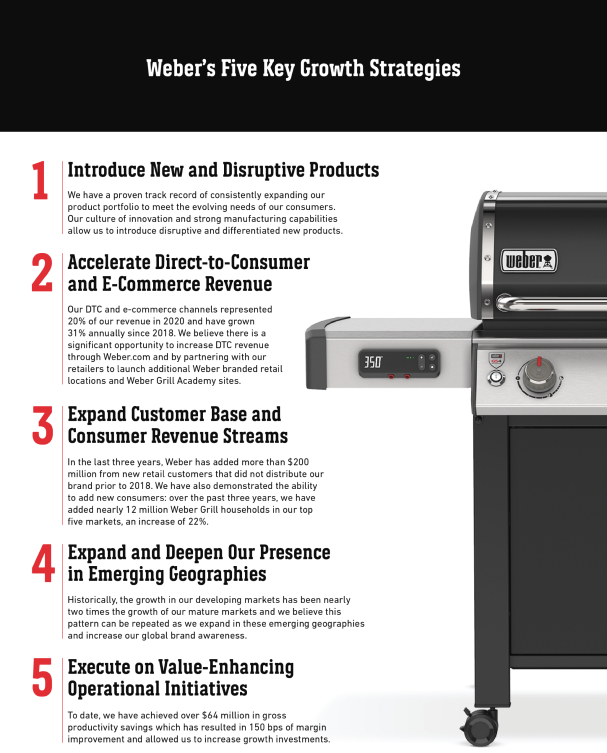
We intend to build on our competitive strengths and deliver sustainable growth by executing on the following strategies:
Introduce New and Disruptive Products
We have a proven track record of consistently expanding our product portfolio to meet the evolving needs of our consumers. Our culture of innovation and strong manufacturing capabilities allow us to introduce disruptive and differentiated new products. Our success is evidenced by our diverse product portfolio and recent launches across technology, grilling, accessories, consumables and services including:
| • | Grilling Innovations — Historically, we have captured share in the outdoor cooking market by launching grill products that have revolutionized our consumer’s grilling experience. Our legacy of innovation started over 70 years ago when we invented the iconic Weber Kettle and transformed the charcoal grilling market. Since then, we have introduced the Genesis gas grill, the portable Weber Q grill, and the Pulse electric grill. In 2020, we launched the SmokeFire wood pellet grill to capitalize on demand in the fast-growing pellet grill sub-category. We believe the SmokeFire wood pellet grill will have a similar impact on the pellet industry as our iconic grills have had historically in their respective categories. We also have a long track record of success refreshing products in existing categories, which allows customers to upgrade while staying loyal to the Weber brand. |
| • | Weber Connect™ — In 2020, we introduced our new connected device platform, Weber Connect powered by June OS. This Consumer Electronics Show award-winning precision grilling technology was first made available as the stand-alone Smart Grilling Hub, and as an integrated feature in our SmokeFire wood pellet grill. Today, Weber Connect is also available in our Genesis / Spirit gas grill and Pulse electric grill. We intend to make Weber Connect available in our charcoal grills and smokers in the future. Weber Connect is an integral part of our connected product pipeline of cutting-edge, technology-enabled grills and devices that will enhance the grilling experience for consumers. |
| • | Accessories, Consumables and Services — Over the past 70 years, we have consistently developed and launched Weber branded outdoor cooking accessories and consumables to complement our core offering and provide a predictable, recurring revenue stream. These product offerings help ensure that Weber’s iconic brand stays at the forefront of all facets of the outdoor cooking experience while also providing attractive margins. We have developed a robust product pipeline that includes tools and cookware, cleaning supplies, multiple fuel types, gear, carts and covers, among others. Innovation in our growing accessory and consumables business will continue to create higher transaction frequency and drive increased consumer loyalty. We also intend to expand our service offerings to capitalize on our best-in-class customer service organization and the global footprint of our Weber branded retail stores and Weber Grill Academy sites to capture new revenue streams. |
As we have done throughout our history, we have identified opportunities for new product introductions in existing and new categories. We will continue to leverage our extensive experience and deep expertise to continue to regularly introduce new products that differentiate us from our competition and accelerate our growth.
14
Table of Contents
Accelerate Direct-to-Consumer and E-Commerce Revenue
Our DTC and e-commerce channels represented 20% of our revenue in 2020 and have grown 31% annually since 2018. Our DTC channel includes Weber.com, our independently operated Weber branded retail locations and Weber Grill Academy sites. Within our DTC channel, Weber.com has experienced explosive growth achieving a 135% CAGR from 2018 to 2020. Weber.com is a strategic focus as we believe consumers enjoy engaging directly with our brand through this channel. Due to our efforts, visits to Weber.com have expanded rapidly as evidenced by the 65 million global site visits we achieved in 2020, representing an increase of 83% compared to 2019. We also have long-standing relationships with the largest e-commerce players in our industry, including Amazon, HomeDepot.com and Lowes.com, and have experienced significant growth in this channel over the last several years. Our network of 170 Weber branded retail locations deliver an immersive brand experience for consumers as well as engagement with culinary grilling experts and knowledgeable staff. We believe there is a significant opportunity to increase DTC revenue by accelerating site visits and engagement of Weber.com and partnering with our retailers to launch additional Weber branded retail locations and Weber Grill Academy sites in attractive geographies throughout the world. We also expect purchasing to continue to migrate online providing positive tailwinds for our e-commerce channel.
Expand Customer Base and Consumer Revenue Streams
In the last three years, Weber has added more than $200 million from new retail customers that did not distribute our brand prior to 2018. We have also demonstrated the ability to add new consumers: over the past three years, we have added nearly 12 million Weber Grill households in our top five markets, an increase of 22%. We have invested significantly in all facets of marketing to fuel this growth. From 2018 to 2020, we increased our advertising and marketing spending by 14%. In addition, we have bolstered our consumer insights, analytics and marketing team, hiring over 40 new positions in the last 12 months, to strengthen our marketing organization and build broader capabilities. In addition to adding new consumers, we believe we have a sizable opportunity to optimize direct engagement with our existing consumer base and create new sources of revenue. We currently maintain a database of millions of registered consumers; that base, supplemented with new data from sources like Weber.com and our connected products, gives us the ability to personalize marketing, promotional offers and programs to drive increased consumer loyalty. This will open up new revenue streams like incremental accessory sales and new customized subscription services.
Expand and Deepen Our Presence in Emerging Geographies
We believe we have the opportunity to continue to expand into additional growing international markets. We intend to focus on the most attractive markets in Asia, Europe and Latin America. Within these markets, we aim to enhance the consumer outdoor cooking experience and teach millions of people how to grill the “Weber Way.” Although our top 12 developing markets currently account for approximately 10% of our revenue, we believe we can meaningfully expand this percentage in the future, to grow our customer base and drive net sales. Historically, the growth in our developing markets has been nearly two times the growth of our mature markets and we believe this pattern can be repeated as we expand in these emerging geographies and increase our global brand awareness.
Execute on Value-Enhancing Operational Initiatives
In 2018, we launched our “Fuel the Growth” initiative to improve productivity within our supply chain, focusing on “Make Where We Sell” initiatives and distribution footprint optimization projects. To date, we have achieved over $64 million in gross productivity savings which has resulted in 150 bps of margin improvement and allowed us to increase growth investments. Key ongoing drivers of our Fuel
15
Table of Contents
the Growth initiative include sourcing initiatives in Mexico, Poland and Southeast Asia, our U.S. assembly plant consolidation, our new EMEA manufacturing facility in Zabrze, Poland and our distribution network optimization initiatives. In addition, we have various ongoing continuous improvement projects within our plants and distribution centers. We believe there is a significant opportunity for us to continue to expand our margins.
Our Industry and Opportunity
We operate in the large, growing global outdoor cooking market which we believe is highly predictable, recurring and resilient. This market is comprised of outdoor products that include gas grills, charcoal grills, wood pellet grills, electric grills, smokers, grilling accessories, and solid fuel products (including charcoal briquettes, lump charcoal, pellets, and wood chips and chunks).
According to MetrixLab the installed base of U.S. grills is nearly 70 million units representing 56% penetration of U.S. households. We estimate that more than 30 million of these grills are Weber grills, based on MetrixLab, and are being replaced at a rate of over 2 million units per year. While we benefit from growth from our installed base, our business is not dependent on replacements. We will continue to grow based on the increasing number of first-time grill buyers; consumers purchasing second grills with a different fuel type; heightened demand for specialty grills such as smokers, pellet grills, electric grills and kamado grills; and additional revenue streams including accessories, consumables and grill services. We expect the outdoor cooking market will continue to benefit from increased investment in and around the home as well as macro consumer trends in at home food consumption, culinary exploration and health and wellness.
We believe that several fundamental shifts in consumer behavior are providing positive tailwinds for our industry, including the increasing adoption of outdoor lifestyles and rising focus on health and wellness. More than half (54%) of consumers report cooking more in 2020 and 52% of people cited health as one of their top reasons for cooking at home based on a survey from Hunter PR. The COVID-19 pandemic accelerated certain trends that benefited our industry, and, according to a 2020 survey of grill owners, 85% of grillers globally expect to grill as often or more often after the pandemic than they did before the pandemic. We believe that the grill represents the center of any outdoor lifestyle and our industry will see continued resiliency through the business cycle and growth driven by increasing demand for outdoor spaces.
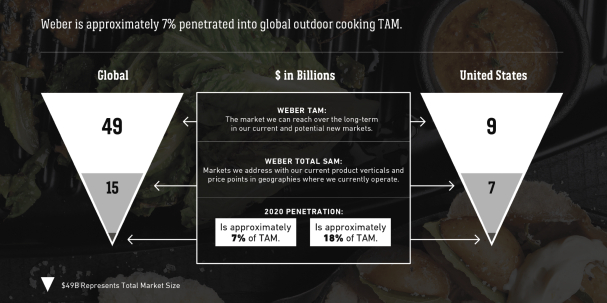
We consider our market opportunity in terms of TAM, which is the revenue opportunity from the number of total households that we believe are able to own a grill and could be interested in purchasing a new one in current geographies where Weber operates and in potential markets. We define the SAM as the revenue opportunity from the total number of households that purchased a grill in a given year in markets where Weber currently operates.
According to Frost & Sullivan, our TAM is estimated at $49 billion globally and $9 billion in the United States and our SAM is estimated at $15 billion globally and $7 billion in the United States From 2015 to 2020, our SAM grew at a 3.0% CAGR and is projected to grow at a 4.5% CAGR from 2020 to 2025. We expect to grow both TAM and SAM as we expand beyond our current geographies and grow SAM as we introduce new products in our existing verticals and add new verticals to our product portfolio in geographies where we currently operate. As of 2020, we are approximately 7% penetrated in our global TAM and 18% penetrated in our U.S. TAM. For additional discussion of the methodology used to determine our TAM and SAM, see the section entitled “Market and Industry Data.”
16
Table of Contents
Recent Developments
Preliminary Estimated Financial Data
Set forth below are preliminary estimates of certain of our consolidated financial data as of and for the three months ended June 30, 2021 and actual consolidated financial data as of September 30, 2020. Our consolidated financial statements as of and for the three months ended June 30, 2021 are not yet available and are subject to completion of our financial closing procedures. The following information reflects our preliminary estimates based on currently available information and is subject to change. We have provided ranges, rather than specific amounts, for the preliminary estimated results described below primarily because we are still in the process of finalizing our financial and operating results as of and for the three months ended June 30, 2021 and, as a result, our final reported results may vary materially from the preliminary estimates. The preliminary estimated financial data set forth below have been prepared by, and are the responsibility of, our management. Our auditors have not audited, reviewed, compiled or applied agreed-upon procedures with respect to the preliminary estimated financial data. Accordingly, our auditors do not express an opinion or any other form of assurance with respect thereto. Our preliminary estimated results also include non-GAAP financial measures. Neither such measures nor our estimates of GAAP results should be viewed as a substitute for interim financial statements prepared in accordance with GAAP. You should not place undue reliance on the preliminary estimates, and the preliminary estimates are not necessarily indicative of the results to be expected in the future. The preliminary estimates should be read in conjunction with “Management’s Discussion and Analysis of Financial Condition and Results of Operations,” “Special Note Regarding Forward-Looking Statements,” “Risk Factors” and the consolidated financial statements and related notes thereto included elsewhere in this prospectus.
| For the Three Months Ended June 30, 2021 |
||||||||
| (Dollars in thousands) | Low | High | ||||||
| (unaudited) | ||||||||
| Net sales |
$ | 662,178 | $ | 675,556 | ||||
| Net income |
$ | 27,631 | $ | 49,287 | ||||
| Adjusted EBITDA(1) |
$ | 130,255 | $ | 140,044 | ||||
17
Table of Contents
| As of | ||||||||
| September 30, 2020 |
June 30, 2021 |
|||||||
| Cash and cash equivalents |
$ | 123,792 | $ | 146,469 | ||||
| Long-term debt (including the current portion thereof and net of unamortized debt issuance costs of $4,341 and $23,002, respectively) |
$ | 611,909 | $ | 1,220,748 | ||||
| (1) | We define Adjusted EBITDA as net income before interest expense, net, income taxes, depreciation and amortization, adjusted for non-cash stock compensation / LTIP and profits interest expense, business transformation costs, operational transformation costs, impairment costs, debt refinancing and IPO costs, COVID-19 operational costs, loss from early extinguishment of debt, and gain on disposal of assets held for sale. |
The following table reconciles net income to Adjusted EBITDA for the period presented.
| For the Three Months Ended June 30, 2021 |
||||||||
| (Dollars in thousands) | Low | High | ||||||
| Net income |
$ | 27,631 | $ | 49,287 | ||||
| Adjustments: |
||||||||
| Interest expense, net |
18,534 | 17,534 | ||||||
| Income tax expense |
(14,597 | ) | (13,207 | ) | ||||
| Depreciation and amortization |
12,628 | 11,425 | ||||||
| Non-cash stock compensation / LTIP and profits interest costs |
65,323 | 56,776 | ||||||
| Business transformation costs |
5,933 | 4,933 | ||||||
| Operational transformation costs |
5,527 | 4,527 | ||||||
| Impairment costs |
— | — | ||||||
| Debt refinancing and IPO costs |
9,204 | 8,704 | ||||||
| COVID-19 costs |
72 | 65 | ||||||
| Loss from early extinguishment of debt |
— | — | ||||||
| Gain on disposal of assets held for sale |
— | — | ||||||
|
|
|
|
|
|||||
| Adjusted EBITDA |
$ | 130,255 | $ | 140,044 | ||||
|
|
|
|
|
|||||
April Transactions
In April 2021, Weber-Stephen Products, LLC consummated a series of equity repurchase agreements to repurchase common units held by WSP Investment LLC, an entity held by the Stephen family, for an aggregate amount of approximately $189 million, and additionally issued a special distribution to its equityholders in an aggregate amount of approximately $261 million (collectively, the “April Transactions”). Weber financed the April Transactions using cash on hand and approximately $170 million of borrowings under the revolving facility of our Secured Credit Facility. See “Management’s Discussion and Analysis of Financial Condition and Results of Operations—Liquidity and Capital Resources.”
As of June 30, 2021, we had fully repaid the $170 million of borrowings used to finance the April Transactions and, accordingly, as of June 30, 2021, we had no outstanding borrowings other than approximately $6.4 million in undrawn letters of credit, or approximately $293.6 million of available
18
Table of Contents
capacity, under the revolving facility of our Secured Credit Facility and approximately $146.5 million of cash on hand. For more information regarding the effect of the April Transactions as well as our subsequent repayment of indebtedness, see “Unaudited Pro Forma Condensed Consolidated Financial Information.”
R. McDonald Acquisition
Also in April 2021, Weber-Stephen Products, LLC acquired substantially all of the assets of R. McDonald Co. Pty. Ltd., a sales and marketing company headquartered in Australia, for approximately $29 million in cash and $14 million in equity. As part of the acquisition, the Company reacquired R. McDonald’s exclusive rights to sell and market Weber products in Australia and New Zealand. See note 17 to our unaudited consolidated financial statements for the six months ended March 31, 2021 included elsewhere in this prospectus.
Risk Factors
Participating in this offering involves substantial risk. Our ability to execute our strategies also is subject to certain risks. The risks described under the heading “Risk Factors” immediately following this summary may cause us not to realize the full benefits of our competitive strengths or may cause us to be unable to successfully execute all or part of our strategies. Some of the more significant challenges and risks we face include the following:
| • | maintaining and strengthening our brand to generate and maintain ongoing demand for our products; |
| • | our ability to execute our business objectives and growth strategies successfully, including our efforts to expand into new markets, or sustain our growth; |
| • | the high degree of competition in the markets in which we operate; |
| • | the impacts of both extreme weather events and unusual or poor weather patterns; |
| • | seasonal and quarterly variations in our operating results; |
| • | the sensitivity of our operating results to general economic conditions and levels of consumer discretionary spending; |
| • | our reliance on information technology systems and proprietary software; |
| • | our exposure to numerous international business risks due to our reliance on foreign suppliers and our global presence in international markets; |
| • | our reliance on our own internal network of manufacturing and distribution facilities, including a small number of key geographical locations that constitute our principal manufacturing and distribution centers; |
| • | disruptions in our supply chain and manufacturing and distribution channels; |
| • | the impacts of tariffs and exchange rate fluctuations; |
| • | fluctuations in the cost and availability of raw materials, equipment, labor, and transportation; and |
| • | a significant portion of our sales are to large, multi-national retail partners and our business could be harmed if these retail partners cease to carry our current products, choose not to carry new products that we develop or cease operations altogether. |
Before you invest in our Class A common stock, you should carefully consider all the information in this prospectus, including matters set forth under the heading “Risk Factors.”
19
Table of Contents
Organizational Structure
Weber Inc., a Delaware corporation, was formed in April 2021 and is the issuer of the Class A common stock offered by this prospectus. We currently conduct our business through Weber-Stephen Products LLC. Following this offering, Weber Inc. will be a holding company and its sole asset will be a controlling equity interest in Weber HoldCo LLC, a Delaware limited liability company formed in April 2021; Weber-Stephen Products LLC will be a wholly owned subsidiary of Weber HoldCo LLC.
All of Weber-Stephen Products LLC’s outstanding equity interests are currently owned by the following persons and entities, to whom we refer collectively as the “Pre-IPO LLC Members:”
| • | BDT WSP Holdings, LLC, an entity controlled by BDT Capital Partners, LLC, our sponsor; |
| • | WSP Investment LLC, an entity held by the Stephen family; |
| • | Weber-Stephen Management Pool LLC, an entity held by current and former members of our management team and directors; and |
| • | certain other historical equityholders. |
In connection with this offering, we intend to enter into the following series of transactions to implement an internal reorganization, which we collectively refer to as the “Reorganization Transactions:”
| • | Weber Merger Sub, LLC, a subsidiary of Weber Inc. formed in April 2021, will merge with and into BDT WSP Blocker, LLC (“Blocker”), an entity controlled by BDT Capital Partners, LLC, our sponsor, with Blocker surviving the merger. As a result, (i) the Blocker equityholders will receive Class A common stock of Weber Inc. in exchange for their equity interests in Blocker, (ii) the nominal shares of Weber Inc. held by Weber-Stephen Products LLC will be canceled for no consideration (because Weber Inc. was originally formed as a subsidiary of Weber-Stephen Products LLC) and (iii) Weber Inc. will become wholly owned by the former Blocker equityholders; |
| • | Blocker will then merge with and into Weber Inc., with Weber Inc. surviving the merger. Weber Inc.’s certificate of incorporation will be amended to authorize the issuance of two classes of common stock: Class A common stock and Class B common stock, which we refer to collectively as our “common stock.” Each share of Class A common stock and Class B common stock will entitle its holder to one vote per share on all matters submitted to a vote of our stockholders. See “Description of Capital Stock”; |
| • | WSP Merger Sub, a subsidiary of WSP Intermediate formed in April 2021, will merge with and into Weber-Stephen Products LLC, with Weber-Stephen Products LLC surviving the merger. As a result, (i) the Pre-IPO LLC Members will receive non-voting common interest units (the “LLC Units”) in Weber HoldCo LLC in exchange for all of their equity interests in Weber-Stephen Products LLC, (ii) Weber-Stephen Management Pool LLC will receive LLC Units in exchange for all equity interest that it holds in Weber-Stephen Products LLC and profits interests (the “Profits Interests”) in Weber HoldCo LLC with terms substantially similar to the terms of the profits interests that it holds in Weber-Stephen Products LLC and (iii) Weber-Stephen Products LLC will become a wholly owned subsidiary of Weber HoldCo LLC; |
| • | the LLC Agreement of Weber HoldCo LLC will be amended and restated prior to this offering to, among other things, appoint Weber Inc. as the sole managing member of Weber HoldCo LLC; |
| • | members of the management team who indirectly hold Profits Interests through their direct interests in Weber-Stephen Management Pool LLC will be able to direct Weber-Stephen |
20
Table of Contents
| Management Pool LLC to convert those Profits Interests into a number of LLC Units based on a formula that calculates the positive difference between the then implied value of an LLC Unit and the then applicable threshold price associated with the Profits Interest; |
| • | as sole managing member of Weber HoldCo LLC, Weber Inc. will have sole authority to determine the amount and timing of distributions from Weber HoldCo LLC and offer LLC Units to future Partners, subject to any limitations set forth under the Secured Credit Facility. Because we will manage and operate the business and control the strategic decisions and day-to-day operations of Weber HoldCo LLC and will also have a substantial financial interest in Weber HoldCo LLC, we will consolidate the financial results of Weber HoldCo LLC, and a portion of our net income will be allocated to noncontrolling interest to reflect the entitlement of the Pre-IPO LLC Members to a portion of Weber HoldCo LLC’s net income. In addition, because Weber HoldCo LLC will be under the common control of BDT Capital Partners, LLC before and after the Reorganization Transactions, we will account for the Reorganization Transactions as a reorganization of entities under common control and will initially measure the interests of the Pre-IPO LLC Members in the assets and liabilities of Weber HoldCo LLC at their carrying amounts as of the date of the completion of these Reorganization Transactions; |
| • | each of the Pre-IPO LLC Members will be issued shares of our Class B common stock in an amount equal to the number of LLC Units held by each such Pre-IPO LLC Member; |
| • | under the Amended LLC Agreement, all current and future holders of LLC Units (including LLC Units issued upon conversion of Profits Interests), including the Pre-IPO LLC Members, will have the right, from and after the completion of this offering, to require Weber HoldCo LLC to redeem all or a portion of their LLC Units for, at our election, newly issued shares of Class A common stock on a one-for-one basis or a cash payment equal to the volume weighted average market price of one share of our Class A common stock for each LLC Unit redeemed (subject to customary adjustments, including for stock splits, stock dividends and reclassifications) in accordance with the terms of the Amended LLC Agreement (the “Redemption Right”). Additionally, in the event of a redemption request by a holder of LLC Units, we may, at our option, effect a direct exchange of cash or Class A common stock for LLC Units in lieu of such a redemption. A corresponding number of shares of Class B common stock will be canceled on a one-for-one basis if we, following a redemption request of a holder of LLC Units, redeem or exchange LLC Units of such holder of LLC Units pursuant to the terms of the Amended LLC Agreement. See “Certain Relationships and Related Party Transactions—Amended LLC Agreement.” Except for transfers to us pursuant to the Amended LLC Agreement or to certain permitted transferees, the holders of LLC Units are not permitted to sell, transfer or otherwise dispose of any LLC Units or shares of Class B common stock; |
| • | members of the management team who indirectly hold LLC Units (including LLC Units issued upon conversion of Profits Interests) through their direct interests in Weber-Stephen Management Pool LLC will be able to exercise the Redemption Right with respect to those LLC Units (to the extent vested) by directing Weber-Stephen Management Pool LLC to distribute those LLC Units to them (in redemption of a corresponding number of their interests in Weber-Stephen Management Pool LLC), which will then be redeemed pursuant to the Redemption Right; |
| • | Weber Inc. will enter into a Tax Receivable Agreement that will obligate us to make payments to the Pre-IPO LLC Members and any future party to the Tax Receivable Agreement generally equal to 85% of the applicable cash savings that we actually realize as a result of Weber Inc.’s allocable share of certain existing tax basis in tangible and intangible assets related to certain transactions that resulted in a step-up in Weber HoldCo LLC’s tax basis, certain tax basis |
21
Table of Contents
| adjustments resulting from the purchase of LLC Units from the Pre-IPO LLC Members in connection with or after this offering, future taxable redemptions or exchanges of LLC Units by the holders of LLC Units and from payments made under the Tax Receivable Agreement. We will retain the benefit of the remaining 15% of these tax savings; |
| • | Weber Inc. and the Pre-IPO LLC Members will enter into the Stockholders Agreement, which will, among other things, provide that, for so long as the Pre-IPO LLC Members beneficially hold at least 10% of the aggregate number of outstanding shares of our common stock, which we refer to as the “Substantial Ownership Requirement,” approval by the Pre-IPO LLC Members will be required for certain corporate actions; |
| • | Weber Inc. will issue 46,875,000 shares of Class A common stock to the public pursuant to this offering; |
| • | Weber Inc. will use all of its net proceeds from this offering (i) to acquire 15,625,000 newly issued LLC Units from Weber HoldCo LLC, (ii) to acquire 27,421,266 LLC Units from certain Pre-IPO LLC Members, and (iii) to repurchase 3,828,734 shares of the Class A common stock received by the Blocker equityholders in connection with the merger of Weber Merger Sub, LLC with and into Blocker described in the first step of these Reorganization Transactions, in each case at a price per LLC Unit and share of Class A common stock equal to the initial public offering price of our Class A common stock minus underwriting discounts; and |
| • | Weber Inc. will cause Weber HoldCo LLC to use the proceeds from the sale of the LLC Units to Weber Inc. as follows: (i) to pay fees and expenses of approximately $17.4 million in connection with this offering and the Reorganization Transactions; (ii) to repay $220.1 million of the outstanding borrowings under our Secured Credit Facility and (iii) for general corporate purposes. Weber HoldCo LLC will not receive any proceeds from the purchase of LLC Units from certain Pre-IPO LLC Members by us or from the repurchase of shares of Class A common stock by us. See “Use of Proceeds.” |
22
Table of Contents
The diagram below depicts our Organizational Structure immediately following the Reorganization Transactions, this offering and the application of the net proceeds from this offering, assuming an initial public offering price of $16.00 per share (the midpoint of the estimated initial public offering price range set forth on the cover page of this prospectus) and no exercise of the underwriters’ option to purchase additional shares. This chart is provided for illustrative purposes only and does not purport to represent all legal entities within our Organizational Structure.
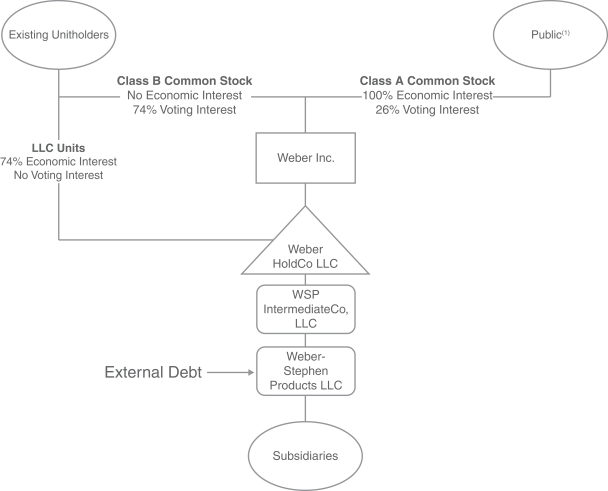
| (1) | Also includes Blocker equityholders that will hold 28,498,197 shares of Class A common stock after the Reorganization Transactions and the completion of this offering and the application of the net proceeds therefrom. |
Upon the completion of this offering and the application of the net proceeds therefrom, Weber Inc. will be appointed as sole managing member of Weber HoldCo LLC, and, assuming no exercise of the underwriters’ option to purchase additional shares, Weber Inc. will hold 75,373,197 LLC Units, constituting 26% of the outstanding economic interests in Weber HoldCo LLC (or 81,542,982 LLC Units, constituting 29% of the outstanding economic interests in Weber HoldCo LLC if the underwriters exercise their option to purchase additional shares of Class A common stock in full) and the Pre-IPO LLC Members will hold (i) 209,573,267 LLC Units, representing approximately 74% of the economic interest in Weber HoldCo LLC (or 71% if the underwriters exercise their option to purchase additional
23
Table of Contents
shares of Class A common stock in full) and (ii) through their ownership of Class B common stock, approximately 74% of the combined voting power of our common stock (or 71% if the underwriters exercise their option to purchase additional shares of Class A common stock in full). Additionally, Blocker equityholders will hold 10% of the combined voting power of our common stock (or 9.7% if the underwriters exercise their option to purchase additional shares of Class A common stock in full). See “Organizational Structure,” “Certain Relationships and Related Party Transactions” and “Description of Capital Stock” for more information on the rights associated with our common stock and the LLC Units. Upon the completion of this offering, there will be 284,946,464 LLC Units outstanding. There are no limitations in the Amended LLC Agreement on the number of LLC Units issuable in the future and we are not required to own a majority of LLC Units.
The acquisition of LLC Units from certain of our existing equityholders in connection with this offering and future taxable redemptions or exchanges by holders of LLC Units for shares of our Class A common stock or cash are expected to produce tax basis adjustments that will be allocated to us and thus favorable tax attributes. These tax attributes would not be available to us in the absence of those transactions. In connection with the Reorganization Transactions, we will enter into the Tax Receivable Agreement that will obligate us to make payments to the Pre-IPO LLC Members and any future party to the Tax Receivable Agreement generally equal to 85% of the applicable cash savings that we actually realize as a result of these tax attributes and tax attributes resulting from payments made under the Tax Receivable Agreement. We will retain the benefit of the remaining 15% of these tax savings. See “Organizational Structure—Holding company structure and the Tax Receivable Agreement.”
Our Sponsor
BDT Capital Partners, LLC, through its affiliated investment funds (collectively, “BDTCP”), has been our controlling shareholder in partnership with the Stephen family and management, since its investment in December 2010. BDT Capital Partners provides family- and founder-led businesses with long-term, differentiated capital. The firm has raised over $18 billion across its investment funds and its global investor base has invested an additional $10 billion of debt and equity in the funds’ portfolio companies. The firm’s affiliate, BDT & Company, LLC, is a merchant bank that works with family- and founder-led businesses to pursue their strategic and financial objectives. BDT & Company provides solutions-based advice and access to a world-class network of business owners and leaders.
After the closing of this offering, BDTCP will own approximately 56% of our outstanding common stock (or approximately 54% if the underwriters exercise their option to purchase additional shares in full).
Corporate Information
We were incorporated in the State of Delaware in April 2021. We are a newly formed corporation, have no material assets and have not engaged in any business or other activities except in connection with the Reorganization Transactions. Our principal executive offices are located at 1415 S. Roselle Road, Palatine, Illinois 60067, and our telephone number is (847) 934-5700. Our website is www.weber.com. Our website and the information contained therein or connected thereto is not incorporated into this prospectus or the registration statement of which it forms a part.
24
Table of Contents
The Offering
This summary highlights information presented in greater detail elsewhere in this prospectus. This summary is not complete and does not contain all the information you should consider before investing in our Class A common stock. You should carefully read this entire prospectus before investing in our Class A common stock, including “Risk Factors” and our consolidated financial statements.
| Class A common stock offered by us |
46,875,000 shares (or 53,906,250 shares if the underwriters exercise their option to purchase additional shares of Class A common stock in full). |
| Class A common stock to be outstanding after this offering |
75,373,197 shares (or 81,542,982 shares if the underwriters exercise their option to purchase additional shares of Class A common stock in full). |
| Class A common stock to be outstanding after conversion of all LLC Units |
284,946,464 shares if all outstanding LLC Units held by the Pre-IPO LLC Members were redeemed or exchanged for a corresponding number of newly issued shares of Class A common stock (or 284,946,464 shares if the underwriters exercise their option to purchase additional shares of Class A common stock in full). |
| Class B common stock to be outstanding after this offering |
209,573,267 shares. |
| Voting power held by holders of Class A common stock after giving effect to this offering |
26% (or 29% if the underwriters exercise their option to purchase additional shares of Class A common stock in full). |
| Voting power held by holders of all outstanding shares of Class B common stock after giving effect to this offering |
74% (or 71% if the underwriters exercise their option to purchase additional shares of Class A common stock in full). |
| Voting rights after giving effect to this offering |
Each share of Class A and Class B common stock will entitle its holder to one vote per share. Investors in this offering will hold approximately 16% of the combined voting power of our common stock (or 19% if the underwriters exercise their option to purchase additional shares of Class A common stock in full). |
| Class A common stock and Class B common stock generally vote together as a single class on all matters submitted to a vote of our stockholders. See “Description of Capital Stock.” |
25
Table of Contents
| Redemption rights of the holders of LLC Units |
under the Amended LLC Agreement, all current and future holders of LLC Units (including LLC Units issued upon conversion of Profits Interests), including the Pre-IPO LLC Members, will have the right, from and after the completion of this offering, to require Weber HoldCo LLC to redeem all or a portion of their LLC Units for, at our election, newly issued shares of Class A common stock on a one-for-one basis or a cash payment equal to the volume weighted average market price of one share of our Class A common stock for each LLC Unit redeemed (subject to customary adjustments, including for stock splits, stock dividends and reclassifications) in accordance with the terms of the Amended LLC Agreement. Additionally, in the event of a redemption request by a holder of LLC Units, we may, at our option, effect a direct exchange of cash or Class A common stock for LLC Units in lieu of such a redemption. A corresponding number of shares of Class B common stock will be canceled on a one-for-one basis if we, following a redemption request of a holder of LLC Units, redeem or exchange LLC Units of such holder of LLC Units pursuant to the terms of the Amended LLC Agreement. See “Certain Relationships and Related Party Transactions—Amended LLC Agreement.” |
| Except for transfers to us pursuant to the Amended LLC Agreement or to certain permitted transferees, holders of LLC Units are not permitted to sell, transfer or otherwise dispose of any LLC Units or shares of Class B common stock. |
| Use of Proceeds |
We estimate that our net proceeds from this offering will be approximately $712.5 million (or approximately $819.4 million if the underwriters exercise their option to purchase additional shares of Class A common stock in full), after deducting underwriting discounts and commissions but before deducting estimated offering expenses. |
| We intend to use the net proceeds that we receive from this offering (i) to acquire 15,625,000 newly issued LLC Units from Weber HoldCo LLC, (ii) to acquire 27,421,266 LLC Units from certain Pre-IPO LLC Members and (iii) to repurchase 3,828,734 shares of the Class A common stock received by the Blocker |
26
Table of Contents
| equityholders in connection with the merger of Weber Merger Sub, LLC with and into Blocker, in each case at a price per LLC Unit and share of Class A common stock equal to the initial public offering price of our Class A common stock minus underwriting discounts. |
| We will cause Weber HoldCo LLC to use the proceeds from the sale of the LLC Units to Weber Inc. as follows: (i) to pay fees and expenses of approximately $17.4 million in connection with this offering and the Reorganization Transactions; (ii) to repay $220.1 million of the outstanding borrowings under our Secured Credit Facility and (iii) for general corporate purposes. |
Weber HoldCo LLC will not receive any proceeds from purchase of LLC Units from certain Pre-IPO LLC Members by us or the repurchase of shares of Class A common stock by us.
| If the underwriters exercise their option to purchase additional shares of Class A common stock in full, we estimate that our additional net proceeds will be approximately $106.9 million. We will use the additional net proceeds we receive pursuant to any exercise of the underwriters’ option to purchase additional shares of Class A common stock to purchase LLC Units from certain Pre-IPO LLC Members and/or to repurchase shares of the Class A common stock received by the Blocker equityholders in connection with the merger of Weber Merger Sub, LLC with and into Blocker, in each case at a price per LLC Unit and share of Class A common stock equal to the initial public offering price of our Class A common stock minus underwriting discounts. As a result, Weber HoldCo LLC will not receive any additional proceeds from any exercise of the underwriters’ option to purchase additional shares of Class A common stock. |
See “Use of Proceeds.”
| Controlled Company |
Upon the closing of this offering, entities controlled by BDT Capital Partners, LLC will beneficially own more than 50% of the voting power for the election of members of our board of directors and will enter into the Stockholders Agreement. Consequently, we will be a “controlled company” under the rules. As a |
27
Table of Contents
| controlled company, we qualify for, and intend to rely on, exemptions from certain corporate governance requirements of the NYSE. See “Management—Controlled company exception.” |
| Tax Receivable Agreement |
Pursuant to the Tax Receivable Agreement we expect to enter into with the Pre-IPO LLC Members, we will pay 85% of the amount of certain cash savings, if any, in U.S. federal, state and local income tax or franchise tax that we actually realize to the Pre-IPO LLC Members as a result of (i) Weber Inc.’s allocable share of certain existing tax basis in tangible and intangible assets related to certain transactions that resulted in a step-up in Weber HoldCo LLC’s tax basis, (ii) any increase in tax basis in Weber-Stephen Products LLC’s assets resulting from (a) acquisitions by Weber Inc. of LLC Units from the Pre-IPO LLC Members in connection with this offering, (b) the acquisition of LLC Units from the Pre-IPO LLC Members using the net proceeds from any future offering, (c) future taxable redemptions or exchanges by the Pre-IPO LLC Members of LLC Units for shares of our Class A common stock or cash or (d) payments under the Tax Receivable Agreement and (iii) tax benefits related to imputed interest resulting from payments made under the Tax Receivable Agreement. Our obligations under the Tax Receivable Agreement will also apply with respect to any person who is issued LLC Units in the future and who becomes a party to the Tax Receivable Agreement. See “Organizational Structure—Holding company structure and the Tax Receivable Agreement.” |
| Dividend Policy |
The declaration and payment by us of any future dividends to holders of our Class A common stock will be at the sole discretion of our board of directors. Our Class B common stock will not have any economic ownership of us and will not be entitled to cash dividends. |
| Following this offering and subject to funds being legally available, we intend to cause Weber-Stephen Products LLC to make pro rata distributions to the Pre-IPO LLC Members and us in an amount at least sufficient to allow us and the Pre-IPO LLC Members to pay all applicable taxes, to make payments under the Tax Receivable Agreement we will enter into with the |
28
Table of Contents
| Pre-IPO LLC Members and to pay our corporate and other overhead expenses. |
| Risk Factors |
See “Risk Factors” for a discussion of risks you should carefully consider before deciding to invest in our Class A common stock. |
| Certain U.S. Federal Income and Estate Tax Consequences to Non-U.S. Holders |
For a discussion of certain U.S. federal income and estate tax consequences that may be relevant to non-U.S. stockholders, see “Certain U.S. Federal Income and Estate Tax Consequences to Non-U.S. Holders.” |
| Proposed stock symbol |
WEBR. |
Unless we indicate otherwise throughout this prospectus, the number of shares of our Class A common stock outstanding after this offering excludes:
| • | 209,573,267 shares of Class A common stock reserved for issuance upon the exchange of 209,573,267 LLC Units that will be held by the Pre-IPO LLC Members upon consummation of this offering; |
| • | shares of Class A common stock reserved for issuance upon exchange of LLC Units issuable in exchange for the 17,838,668 Profits Interests outstanding as of the consummation of this offering (the number of LLC Units issuable in exchange for such Profit Interests is calculated using the treasury stock method, whereby the weighted average distribution threshold of the Profit Interests of $8.24 is subtracted from the price of our shares of Class A common stock and the difference is multiplied by total number of Profits Interest outstanding (using the assumed initial offering price of $16.00 per share (the midpoint of the estimated initial public offering price range set forth on the cover page of this prospectus) approximately 8,653,155 LLC Units would be issuable in exchange for such Profit Interests)); |
| • | 7,031,250 shares of our Class A common stock issuable if the underwriters exercise their option to purchase additional shares of Class A common stock from us; |
| • | 22,694,608 shares of Class A common stock reserved for issuance under our Incentive Plan (as defined below), of which 376,968 restricted stock units in respect of vested LTIP Replacement Awards (as defined below) will be granted in connection with this offering. See “Compensation Discussion and Analysis—Long-Term Incentive Compensation—Omnibus Incentive Plan” for more information regarding our Incentive Plan and the IPO Grants (as defined below); and |
| • | 9,077,843 shares of Class A common stock reserved for issuance under our ESPP (as defined below). See “Compensation Discussion and Analysis—Long-Term Incentive Compensation—Employee Stock Purchase Plan” for more information regarding our ESPP. |
Unless we indicate otherwise throughout this prospectus, all information in this prospectus reflects an initial public offering price of $16.00 per share (the midpoint of the estimated initial public offering price range set forth on the cover page of this prospectus). Although the number of shares of Class A common stock being offered hereby to the public and the total number of shares of common stock issued to the Pre-IPO LLC Members and the Blocker equityholders in the Reorganization Transactions remain fixed regardless of the initial public offering price in this offering, certain share information presented in this prospectus will vary depending on the initial public offering price in this offering. For example, the relative allocation of the shares of Class B common stock (and corresponding LLC Units) issued in the Reorganization Transactions as among the Pre-IPO LLC Members will vary, depending on the initial public offering price in this offering.
29
Table of Contents
Summary Historical and Unaudited Pro Forma Condensed Consolidated Financial Data
The following tables present, as of the dates and for the periods indicated, (1) the summary historical consolidated financial data for Weber-Stephen Products LLC and its consolidated subsidiaries and (2) the summary unaudited pro forma condensed consolidated financial data for Weber Inc. and its consolidated subsidiaries, including Weber-Stephen Products LLC. Weber-Stephen Products LLC is the predecessor of Weber Inc. for financial reporting purposes. Weber Inc. was formed as a Delaware corporation on April 1, 2021 and has not, to date, conducted any activities other than those incident to its formation, the Reorganization Transactions and the preparation of this prospectus and the registration statement of which this prospectus forms a part.
The summary consolidated statement of income data for the fiscal years ended September 30, 2018, 2019 and 2020 and summary consolidated balance sheet data as of September 30, 2019 and 2020 have been derived from Weber-Stephen Products LLC’s audited consolidated financial statements included elsewhere in this prospectus. The summary condensed consolidated statement of income data for the six months ended March 31, 2020 and 2021 (unaudited) and the summary condensed consolidated balance sheet data as of March 31, 2021 (unaudited) have been derived from Weber-Stephen Products LLC’s unaudited condensed consolidated financial statements included elsewhere in this prospectus which, in the opinion of management, include all adjustments, consisting only of normal recurring adjustments, necessary for a fair statement of the results for the unaudited interim periods.
The summary unaudited pro forma condensed consolidated statement of income data for the fiscal year ended September 30, 2020 and the six months ended March 31, 2021 gives effect to the Pro Forma Transactions (which includes the Reorganization Transactions and this offering as more fully described in “Unaudited Pro Forma Condensed Consolidated Financial Information”) as if they had occurred on October 1, 2019.
The summary unaudited pro forma condensed consolidated balance sheet data as of March 31, 2021 gives effect to the Pro Forma Transactions as if they had occurred on March 31, 2021. See “Unaudited Pro Forma Condensed Consolidated Financial Information” and “Capitalization.”
30
Table of Contents
The summary historical and unaudited pro forma condensed consolidated financial data presented below do not purport to be indicative of the results that can be expected for any future period and should be read together with “Capitalization,” “Unaudited Pro Forma Condensed Consolidated Financial Information,” “Selected Historical Consolidated Financial Data,” “Management’s Discussion and Analysis of Financial Condition and Results of Operations” and our financial statements and related notes thereto included elsewhere in this prospectus. The presentation of the summary unaudited pro forma condensed consolidated financial information is prepared in conformity with Article 11 of Regulation S-X. The Pro Forma Transactions include various estimates that are subject to material change and may not be indicative of what our operations or financial position would have been had this offering and related transactions taken place on the dates indicated, or that may be expected to occur in the future. See “Unaudited Pro Forma Condensed Consolidated Financial Information” for a complete description of the adjustments and assumptions underlying the summary unaudited pro forma condensed consolidated financial data.
| Weber-Stephen Products LLC | Pro Forma Weber Inc. | |||||||||||||||||||||||||||
| Fiscal Year Ended September 30, | Six Months Ended March 31, |
Fiscal Year Ended September 30, 2020 |
Six Months Ended March 31, 2021 |
|||||||||||||||||||||||||
| 2018 | 2019 | 2020 | 2020 | 2021 | ||||||||||||||||||||||||
| (Dollars in thousands, except share and per share information) |
(Unaudited) | (Unaudited) | ||||||||||||||||||||||||||
| Consolidated Statement of Income Data |
||||||||||||||||||||||||||||
| Net sales |
$ | 1,340,032 | $ | 1,296,210 | $ | 1,525,260 | $ | 596,376 | $ | 963,309 | $ | 1,525,260 | $ | 963,309 | ||||||||||||||
| Cost of goods sold(1)(2) |
759,786 | 793,536 | 915,586 | 358,417 | 542,782 | 915,586 | 542,782 | |||||||||||||||||||||
|
|
|
|
|
|
|
|
|
|
|
|
|
|
|
|||||||||||||||
| Gross profit |
580,246 | 502,674 | 609,674 | 237,959 | 420,527 | 609,674 | 420,527 | |||||||||||||||||||||
| Operating expenses: |
||||||||||||||||||||||||||||
| Selling, general and administrative(1)(2) |
397,444 | 369,651 | 444,975 | 174,718 | 297,986 | 518,594 | 297,986 | |||||||||||||||||||||
| Amortization of intangible assets |
11,786 | 13,586 | 13,235 | 6,855 | 6,864 | 13,235 | 6,864 | |||||||||||||||||||||
| Impairment of assets |
— | 12,568 | — | — | — | — | — | |||||||||||||||||||||
| Gain on disposal of assets held for sale |
— | — | — | — | (5,185 | ) | — | (5,185 | ) | |||||||||||||||||||
|
|
|
|
|
|
|
|
|
|
|
|
|
|
|
|||||||||||||||
| Income from operations |
171,016 | 106,869 | 151,464 | 56,386 | 120,862 | 77,845 | 120,862 | |||||||||||||||||||||
| Foreign currency loss (gain) |
7,118 | (1,837 | ) | 5,081 | 6,033 | (14 | ) | 5,081 | (14 | ) | ||||||||||||||||||
| Interest income |
(1,594 | ) | (1,153 | ) | (1,270 | ) | (701 | ) | (425 | ) | (1,270 | ) | (425 | ) | ||||||||||||||
| Interest expense |
34,609 | 45,170 | 40,357 | 21,111 | 32,174 | 29,022 | 32,411 | |||||||||||||||||||||
| Loss from early extinguishment of debt |
— | — | — | — | 5,448 | — | 5,448 | |||||||||||||||||||||
|
|
|
|
|
|
|
|
|
|
|
|
|
|
|
|||||||||||||||
| Income before taxes |
130,883 | 64,689 | 107,296 | 29,943 | 83,679 | 45,012 | 83,442 | |||||||||||||||||||||
| Income taxes |
17,588 | 13,544 | 13,812 | 3,558 | 15,389 | 16,634 | 20,619 | |||||||||||||||||||||
| Loss (gain) from investments in unconsolidated affiliates |
— | 1,025 | 4,604 | 2,778 | (5,505 | ) | 4,604 | (5,505 | ) | |||||||||||||||||||
|
|
|
|
|
|
|
|
|
|
|
|
|
|
|
|||||||||||||||
| Net income |
113,295 | 50,120 | 88,880 | 23,607 | 73,795 | 23,774 | 68,328 | |||||||||||||||||||||
| Earnings allocated to participating securities |
(738 | ) | (320 | ) | (473 | ) | (234 | ) | (610 | ) | — | — | ||||||||||||||||
|
|
|
|
|
|
|
|
|
|
|
|
|
|
|
|||||||||||||||
| Net income attributable to common members |
$ | 112,557 | $ | 49,800 | $ | 88,407 | $ | 23,373 | $ | 73,185 | $ | 23,774 | $ | 68,328 | ||||||||||||||
| Net income attributable to noncontrolling interests |
$ | 19,935 | $ | 55,602 | ||||||||||||||||||||||||
|
|
|
|
|
|||||||||||||||||||||||||
| Net income attributable to controlling interests |
$ | 3,839 | $ | 12,726 | ||||||||||||||||||||||||
|
|
|
|
|
|||||||||||||||||||||||||
31
Table of Contents
| Weber-Stephen Products LLC | Pro Forma Weber Inc. | |||||||||||||||||||||||||||
| Fiscal Year Ended September 30, | Six Months Ended March 31, |
Fiscal Year Ended September 30, 2020 |
Six Months Ended March 31, 2021 |
|||||||||||||||||||||||||
| 2018 | 2019 | 2020 | 2020 | 2021 | ||||||||||||||||||||||||
| (Dollars in thousands, except share and per share information) |
(Unaudited) | (Unaudited) | ||||||||||||||||||||||||||
| Net income per common unit |
||||||||||||||||||||||||||||
| Basic |
$ | 193.53 | $ | 87.95 | $ | 160.23 | $ | 42.36 | $ | 132.62 | ||||||||||||||||||
| Diluted |
$ | 193.53 | $ | 87.95 | $ | 160.23 | $ | 42.36 | $ | 132.62 | ||||||||||||||||||
| Weighted average common units outstanding |
||||||||||||||||||||||||||||
| Basic |
581,616 | 566,223 | 551,763 | 551,753 | 551,836 | |||||||||||||||||||||||
| Diluted |
581,616 | 566,223 | 551,763 | 551,753 | 551,836 | |||||||||||||||||||||||
| Pro forma net income (loss) per share attributable to common stockholders(3) |
||||||||||||||||||||||||||||
| Basic |
$ | 0.05 | $ | 0.17 | ||||||||||||||||||||||||
| Diluted |
$ | 0.05 | $ | 0.17 | ||||||||||||||||||||||||
| Weighted-average shares used in computing pro forma net income (loss) per share attributable to common stockholders(3) |
||||||||||||||||||||||||||||
| Basic |
75,750,165 | 75,750,165 | ||||||||||||||||||||||||||
| Diluted |
75,750,165 | 75,750,165 | ||||||||||||||||||||||||||
| Weber-Stephen Products LLC | ||||||||||||||||||||||||||||
| Fiscal Year Ended September 30, | Six Months Ended March 31, |
|||||||||||||||||||||||||||
| 2018 | 2019 | 2020 | 2020 | 2021 | ||||||||||||||||||||||||
| (Dollars in thousands, except share and per share information) |
(Unaudited) | |||||||||||||||||||||||||||
| Consolidated Statement of Cash Flows Data: |
||||||||||||||||||||||||||||
| Net cash provided by (used in) operating activities |
$ | 110,648 | $ | 126,468 | $ | 305,178 | $ | (212,035 | ) | $ | (214,649 | ) | ||||||||||||||||
| Net cash (used in) provided by investing activities |
$ | (33,079 | ) | $ | (67,257 | ) | $ | (22,207 | ) | $ | (18,226 | ) | $ | (105,565 | ) | |||||||||||||
| Net cash (used in) provided by financing activities |
$ | (204,179 | ) | $ | (50,728 | ) | $ | (213,240 | ) | $ | 252,830 | $ | 571,266 | |||||||||||||||
| Additions to property, equipment and leasehold improvements |
$ | (34,904 | ) | $ | (25,507 | ) | $ | (29,414 | ) | $ | (18,264 | ) | $ | (17,354 | ) | |||||||||||||
| Other Data: |
||||||||||||||||||||||||||||
| Adjusted income from operations(4) |
$ | 170,269 | $ | 143,778 | $ | 189,005 | $ | 58,281 | $ | 161,106 | ||||||||||||||||||
| Adjusted net income(4) |
$ | 118,812 | $ | 77,862 | $ | 126,004 | $ | 30,592 | $ | 111,068 | ||||||||||||||||||
| EBITDA(4) |
$ | 212,515 | $ | 153,998 | $ | 184,126 | $ | 69,047 | $ | 141,261 | ||||||||||||||||||
| Adjusted EBITDA(4) |
$ | 218,886 | $ | 189,070 | $ | 226,748 | $ | 76,975 | $ | 186,939 | ||||||||||||||||||
32
Table of Contents
| Weber-Stephen Products LLC | Pro Forma Weber Inc. | |||||||||||||||
| As of September 30, | As of March 31, 2021 |
As of March 31, 2021 |
||||||||||||||
| 2019 | 2020 | |||||||||||||||
| (Dollars in thousands) | (Unaudited) | (Unaudited) |
||||||||||||||
| Consolidated Balance Sheet Data: |
||||||||||||||||
| Cash and cash equivalents |
$ | 44,665 | $ | 123,792 | $ | 379,939 | $ | 99,941 | ||||||||
| Working (deficit) capital(5) |
$ | (84,879 | ) | $ | 45,023 | $ | 660,865 | $ | 211,811 | |||||||
| Total assets |
$ | 961,611 | $ | 1,139,435 | $ | 2,026,197 | $ | 1,892,520 | ||||||||
| Long-term debt, less current portion |
$ | 594,035 | $ | 575,659 | $ | 1,210,560 | $ | 994,714 | ||||||||
| Total liabilities |
$ | 1,083,371 | $ | 1,182,983 | $ | 1,999,483 | $ | 2,049,871 | ||||||||
| Total members’ (deficit) equity |
$ | (121,760 | ) | $ | (43,548 | ) | $ | 26,714 | $ | (157,351 | ) | |||||
| (1) | Amounts include unit-based compensation as follows: |
| Fiscal Year Ended September 30, | Six Months Ended March 31, |
|||||||||||||||||||
| 2018 | 2019 | 2020 | 2020 | 2021 | ||||||||||||||||
| (Dollars in thousands) | (Unaudited) | |||||||||||||||||||
| Cost of goods sold |
$ | (138 | ) | $ | — | $ | 663 | $ | 65 | $ | 279 | |||||||||
| Selling, general and administrative |
(952 | ) | (1,446 | ) | 3,851 | 827 | 32,200 | |||||||||||||
|
|
|
|
|
|
|
|
|
|
|
|||||||||||
| Total unit-based compensation |
$ | (1,090 | ) | $ | (1,446 | ) | $ | 4,514 | $ | 892 | $ | 32,479 | ||||||||
|
|
|
|
|
|
|
|
|
|
|
|||||||||||
| (2) | Amounts include depreciation and amortization expense as follows: |
| Fiscal Year Ended September 30, | Six Months Ended March 31, |
|||||||||||||||||||
| 2018 | 2019 | 2020 | 2020 | 2021 | ||||||||||||||||
| (Dollars in thousands) | (Unaudited) | |||||||||||||||||||
| Cost of goods sold |
$ | 22,066 | $ | 17,106 | $ | 15,697 | $ | 8,024 | $ | 6,457 | ||||||||||
| Selling, general and administrative |
14,765 | 15,625 | 13,415 | 6,593 | 7,007 | |||||||||||||||
|
|
|
|
|
|
|
|
|
|
|
|||||||||||
| Total depreciation and amortization expense |
$ | 36,831 | $ | 32,731 | $ | 29,112 | $ | 14,617 | $ | 13,464 | ||||||||||
|
|
|
|
|
|
|
|
|
|
|
|||||||||||
| (3) | See the unaudited pro forma condensed consolidated statement of income in “Unaudited Pro Forma Condensed Consolidated Financial Information” for the description of the assumptions underlying the pro forma net income (loss) per share calculations. |
| (4) | We define adjusted income from operations and adjusted net income as income from operations and net income adjusted for non-cash stock compensation / Management Incentive Plan (“LTIP”) and profits interest expense, business transformation costs, operational transformation costs, impairment costs, debt refinancing and IPO costs, COVID-19 costs, gain on disposal of assets held for sale, and, in the case of adjusted net income, loss from early extinguishment of debt, net of the tax impact of such adjustments. Adjusted income from operations is also adjusted for foreign currency (loss) gain. Adjusted income from operations excludes loss from early extinguishment of debt, interest expense, net, income taxes and loss (gain) from investments in unconsolidated affiliates. We define EBITDA as net income before interest expense, net, income taxes, and depreciation and amortization. We define Adjusted EBITDA as net income before interest expense, net, income taxes, depreciation and amortization, adjusted for non-cash stock compensation / LTIP and profits interest expense, business transformation costs, operational transformation costs, impairment costs, debt refinancing and IPO costs, COVID-19 operational costs, loss from early extinguishment of debt, and gain on disposal of assets held for sale. |
| (5) | We define working (deficit) capital as current assets less current liabilities. |
33
Table of Contents
Adjusted income from operations, adjusted net income, EBITDA and Adjusted EBITDA are not defined under U.S. GAAP and may not be comparable to similarly titled measures reported by other entities. We use these non-GAAP measures, along with U.S. GAAP measures, to evaluate our business, measure our performance, identify trends affecting our business and assist us in making strategic decisions. We believe these non-GAAP measures, when reviewed in conjunction with U.S. GAAP financial measures, and not in isolation or as substitutes for analysis of our results of operations under U.S. GAAP, are useful to investors as they are widely used measures of performance and the adjustments we make to these non-GAAP measures provide investors further insight into our profitability and additional perspectives in comparing our performance to other companies and in comparing our performance over time on a consistent basis.
34
Table of Contents
The following table reconciles income from operations to adjusted income from operations, net income to adjusted net income and net income to Adjusted EBITDA for the periods presented.
| Fiscal Year Ended September 30, |
Six Months Ended March 31, |
|||||||||||||||||||
| 2018 | 2019 | 2020 | 2020 | 2021 | ||||||||||||||||
| (Dollars in thousands) | ||||||||||||||||||||
| Income from operations |
$ | 171,016 | $ | 106,869 | $ | 151,464 | $ | 56,386 | $ | 120,862 | ||||||||||
| Adjustments: |
||||||||||||||||||||
| Foreign currency (loss) gain(a) |
(7,118 | ) | 1,837 | (5,081 | ) | (6,033 | ) | 14 | ||||||||||||
| Non-cash stock compensation / LTIP and profits interest expense(b) |
(1,090 | ) | (1,446 | ) | 4,514 | 892 | 32,479 | |||||||||||||
| Business transformation costs(c) |
7,461 | 22,706 | 12,515 | 3,591 | 2,924 | |||||||||||||||
| Operational transformation costs(d) |
— | 1,244 | 8,532 | 1,394 | 5,826 | |||||||||||||||
| Impairment costs(e) |
— | 12,568 | — | — | — | |||||||||||||||
| Debt refinancing and IPO costs(f) |
— | — | — | — | 3,706 | |||||||||||||||
| COVID-19 costs(g) |
— | — | 17,061 | 2,051 | 480 | |||||||||||||||
| Gain on disposal of assets held for sale |
— | — | — | — | (5,185 | ) | ||||||||||||||
|
|
|
|
|
|
|
|
|
|
|
|||||||||||
| Adjusted income from operations |
$ | 170,269 | $ | 143,778 | $ | 189,005 | $ | 58,281 | $ | 161,106 | ||||||||||
|
|
|
|
|
|
|
|
|
|
|
|||||||||||
| Net income |
$ | 113,295 | $ | 50,120 | $ | 88,880 | $ | 23,607 | $ | 73,795 | ||||||||||
| Adjustments: |
||||||||||||||||||||
| Non-cash stock compensation / LTIP and profits interest expense(b) |
(1,090 | ) | (1,446 | ) | 4,514 | 892 | 32,479 | |||||||||||||
| Business transformation costs(c) |
7,461 | 22,706 | 12,515 | 3,591 | 2,924 | |||||||||||||||
| Operational transformation costs(d) |
— | 1,244 | 8,532 | 1,394 | 5,826 | |||||||||||||||
| Impairment costs(e) |
— | 12,568 | — | — | — | |||||||||||||||
| Debt refinancing and IPO costs(f) |
— | — | — | — | 3,706 | |||||||||||||||
| COVID-19 costs(g) |
— | — | 17,061 | 2,051 | 480 | |||||||||||||||
| Loss from early extinguishment of debt |
— | — | — | — | 5,448 | |||||||||||||||
| Gain on disposal of assets held for sale |
— | — | — | — | (5,185 | ) | ||||||||||||||
| Tax impact of adjusting items |
(854 | ) | (7,330 | ) | (5,498 | ) | (943 | ) | (8,405 | ) | ||||||||||
|
|
|
|
|
|
|
|
|
|
|
|||||||||||
| Adjusted net income |
$ | 118,812 | $ | 77,862 | $ | 126,004 | $ | 30,592 | $ | 111,068 | ||||||||||
|
|
|
|
|
|
|
|
|
|
|
|||||||||||
| Net income |
$ | 113,295 | $ | 50,120 | $ | 88,880 | $ | 23,607 | $ | 73,795 | ||||||||||
| Adjustments: |
||||||||||||||||||||
| Interest expense, net |
33,015 | 44,017 | 39,087 | 20,410 | 31,749 | |||||||||||||||
| Income tax expense |
17,588 | 13,544 | 13,812 | 3,558 | 15,389 | |||||||||||||||
| Depreciation and amortization |
48,617 | 46,317 | 42,347 | 21,472 | 20,328 | |||||||||||||||
|
|
|
|
|
|
|
|
|
|
|
|||||||||||
| EBITDA |
$ | 212,515 | $ | 153,998 | $ | 184,126 | $ | 69,047 | $ | 141,261 | ||||||||||
| Non-cash stock compensation / LTIP and profits interest expense(b) |
(1,090 | ) | (1,446 | ) | 4,514 | 892 | $ | 32,479 | ||||||||||||
| Business transformation costs(c) |
7,461 | 22,706 | 12,515 | 3,591 | 2,924 | |||||||||||||||
| Operational transformation costs(d) |
— | 1,244 | 8,532 | 1,394 | 5,826 | |||||||||||||||
| Impairment costs(e) |
— | 12,568 | — | — | — | |||||||||||||||
| Debt refinancing and IPO costs(f) |
— | — | — | — | 3,706 | |||||||||||||||
| COVID-19 costs(g) |
— | — | 17,061 | 2,051 | 480 | |||||||||||||||
| Loss from early extinguishment of debt |
— | — | — | — | 5,448 | |||||||||||||||
| Gain on disposal of assets held for sale |
— | — | — | — | (5,185 | ) | ||||||||||||||
|
|
|
|
|
|
|
|
|
|
|
|||||||||||
| Adjusted EBITDA |
$ | 218,886 | $ | 189,070 | $ | 226,748 | $ | 76,975 | $ | 186,939 | ||||||||||
|
|
|
|
|
|
|
|
|
|
|
|||||||||||
| (a) | Adjusted income from operations includes foreign currency (loss) gain in order to align adjusted income from operations with Adjusted EBITDA, with the exception of depreciation and amortization and loss (gain) from investments in unconsolidated affiliates. |
| (b) | Our financial results reflect an increase in other long-term liabilities of approximately $30.0 million related to an increase in the value of our profits interest units as well as a change in accounting methodology from the intrinsic value method to the fair value method during the quarter ended March 31, 2021. These changes resulted in a selling, general and administrative expense of approximately $30.0 million for the six months ended March 31, 2021. |
35
Table of Contents
| (c) | “Business transformation costs” are defined as costs incurred typically during the earlier stages of the new leadership team’s tenure with Weber in order to transition the organization to the future operating structure. These costs include major business transformation initiatives that require severance or other unusual costs to transition to a new operating model. |
| (d) | “Operational transformation costs” are defined as restructuring and transformation initiatives related to major supply chain, operational moves and startups that are designed to enable future productivity. These costs also include significant systems integration costs, as well was plant shutdown and closure costs that will drive future efficiencies. |
| (e) | As part of our fiscal year 2019 annual goodwill impairment test, we recognized a non-cash impairment loss of $12.6 million on the iGrill goodwill. |
| (f) | “Debt refinancing and IPO costs” are defined as non-capitalizable costs from the refinancing of the Company’s term loan and costs related to the initial public offering. |
| (g) | During fiscal year 2020, the Company incurred a number of significant costs related to the global COVID-19 pandemic. These non-recurring costs included plant shutdown costs, the impact of enhanced employee safety and social distancing protocols as well as overtime and expedited freight costs to fulfill significant unexpected demand increases driven by stay-at-home orders in many of our key markets. These costs have begun normalizing in fiscal year 2021. |
36
Table of Contents
An investment in our Class A common stock involves a high degree of risk. You should carefully consider the following risks, as well as the other information contained in this prospectus, before making an investment in our Class A common stock. If any of the following risks actually occurs, our business, financial condition and results of operations may be materially adversely affected. In such an event, the trading price of our Class A common stock could decline and you could lose part or all of your investment.
Risks Related to Our Business
Risks Related to Our Operations and Industry
Our business depends on maintaining and strengthening our brand, as well as our reputation as a producer of high-quality goods, to maintain and generate ongoing demand for our products, and any harm to our brand could result in a significant reduction in such demand which could materially adversely affect our results of operations.
The “Weber” name and premium brand image are integral to the growth of our business, as well as to the implementation of our strategies for expanding our business. Our success depends on the value and reputation of our brand, which, in turn, depends on factors such as the quality, design, performance, functionality and durability of our products, the image of our e-commerce platform and retail partner floor spaces, our communication activities, including advertising, social media and public relations, and our management of the customer experience, including direct interfaces through customer service. Maintaining, promoting, and positioning our brand are important to expanding our customer base and will depend largely on the success of our marketing and merchandising efforts and our ability to provide consistent, high-quality consumer experiences. We intend to continue making substantial investments in these areas in order to maintain and enhance our brand, and such investments may not be successful. We have previously marketed our products, in part, by associating our brand and products with activities rooted in passion for grilling and outdoor cooking. To sustain long-term growth, we must continue to successfully promote our products to consumers who identify with or engage in these activities, as well as to individuals who simply value products of outstanding quality and design.
Ineffective marketing, negative publicity, product diversion to unauthorized distribution channels, product or manufacturing defects, counterfeit products, unfair labor practices, failure to protect the intellectual property rights in our brand and detrimental acts by third parties, including those who have obtained licenses to use the “Weber” name and trademarks in various capacities, including certain food products and food service companies, are potential threats to the strength of our brand, and those and other factors could rapidly and severely diminish customer confidence in us. Additionally, the growing use of social media increases the speed with which information and opinions can be shared and the speed with which a company’s reputation can be affected. If we fail to correct or mitigate misinformation or negative information, including information spread through social media or traditional media channels, about us, the products we offer, our customer experience, or any aspect of our brand, our business, sales and results of operations could be adversely impacted. Maintaining and enhancing our brand image in our current key markets, including the United States, Germany, Canada, Australia, the United Kingdom and France, and in new markets where we have limited brand recognition is important to expanding our customer base. If we are unable to maintain or enhance our brand in current or new markets, or if we fail to continue to successfully market and sell our products to our existing customers or expand our customer base, our growth strategy and results of operations could be harmed.
Additionally, independent third parties and consumers often review our products as well as those of our competitors. Perceptions of our offerings in the marketplace may be significantly influenced by
37
Table of Contents
these reviews, which are disseminated via various media, including the internet. If reviews of our products are negative, or less positive as compared to those of our competitors, our brand may be adversely affected and our results of operations materially harmed.
Our ability to understand consumers’ preferences and to timely identify, develop, manufacture, market and sell products that meet customer demand could significantly affect our business.
Our success is, in part, dependent on anticipating and appropriately reacting to changes in consumer preferences, including the shifting of consumer purchasing practices towards e-commerce, direct-to-consumer and other channels. Our success is also dependent on successful new product development undertaken in response to such changes, including in the outdoor cooking product space (e.g., our introduction of pellet cookers) and the digital space (e.g., our recent acquisition of June Life, a producer of smart ovens and developer of related software), as well related product launches and relaunches. Additionally, our success depends on consumers’ preferences regarding dining at home and consuming certain foods, including proteins. Our future results and our ability to maintain or improve our competitive position will depend on our capacity to gauge the direction of our key product categories and geographic regions, and our ability to successfully identify, develop, manufacture, market, and sell new or improved products to address these changing environments. If we are unable to timely identify and respond to changes in consumer preferences, or if our competitors are able to do so before us, our business may be materially adversely affected.
Our results of operations could be materially harmed if we are unable to accurately forecast demand for our products and manage product inventory in an effective and efficient manner.
To ensure adequate inventory supply, we must forecast inventory needs and place orders with our manufacturers before firm orders are placed by our customers. If we fail to accurately forecast customer demand, we may experience excess inventory levels or a shortage of product to deliver to our customers. Factors that could affect our ability to accurately forecast demand for our products include: (a) an increase or decrease in consumer demand for our products; (b) a failure to accurately forecast consumer acceptance for our new products; (c) product introductions by competitors; (d) unanticipated changes in general market conditions or other factors, which may result in cancellations of advance orders or a reduction or increase in the rate of reorders or at-once orders placed by retailers; (e) the impact on consumer demand due to unseasonable weather conditions; (f) weakening of economic conditions or consumer confidence in future economic conditions, which could reduce demand for discretionary items, such as our products; (g) the uncertainties and logistical challenges that accompany operations on a global scale; and (h) terrorism or acts of war, or the threat thereof, or political or labor instability or unrest, civil unrest, riots or insurrections, public health crises such as the current COVID-19 pandemic (or other future pandemics or epidemics), which could adversely affect consumer confidence and spending or interrupt production and distribution of product and raw materials.
Inventory levels in excess of customer demand may result in inventory write-downs or write-offs, and the sale of excess inventory at discounted prices or in less preferred distribution channels, which could impair our brand image and harm our gross margin. In addition, if we underestimate the demand for our products, our contract manufacturers or our manufacturing plants may not be able to produce products to meet our customer requirements, and this could result in delays in the shipment of our products, therefore impacting our ability to recognize revenue, generate lost sales, and cause damage to our reputation and relationships with our consumers, retailers and distributors.
Challenges in forecasting demand, which we have encountered during the COVID-19 pandemic, can also make it difficult to estimate future results of operations and financial condition from period to period. A failure to accurately predict the level of demand for our products or manage product inventory
38
Table of Contents
in an effective and efficient manner could adversely impact our profitability or cause us not to achieve our expected financial results.
We may be unable to execute our business objectives and growth strategies successfully or sustain our growth, and as a result, our operating results may be adversely affected.
The highly competitive nature of our industry requires that we effectively execute and manage our business objectives and growth strategies. However, we may not be able to execute on these strategies as effectively as anticipated. Our ability to execute on these strategies depends on a number of factors, including, without limitation:
| • | whether we have adequate capital resources to expand our product offerings or manufacturing capacity, and to build out our digital and data ecosystem and capabilities globally; |
| • | our ability to hire, train and retain skilled managers and personnel, including highly in-demand information technology professionals, product and software engineers and marketing and commercial specialists; |
| • | our ability to successfully increase our market share globally and expand into additional international markets, including certain markets in EMEA, Asia-Pacific, and Latin America, and manage the challenges associated therewith; |
| • | our ability to manage the financial and operational aspects of our Weber Stores and Weber Grill Academy growth strategy, including local retail operations; |
| • | our ability to successfully increase sales through our direct-to-consumer channels, which depends, in part, on our ability to develop strong e-commerce initiatives with content-rich and user-friendly websites and digital experiences that may be country and region-specific, and that comply with all applicable laws in those respective countries and regions; and |
| • | our ability to continue to upgrade and maintain our information systems, technology architecture, and other operating systems, to make safe and effective use of the data we collect through these systems to offer better products and services to our customers. |
Our existing products and operating locations may not maintain their current levels of sales and profitability, and our growth strategies may not generate sales levels necessary to achieve profitability that is comparable to that of our existing products and locations. To the extent we are unable to execute on our growth strategies in accordance with our expectations, our sales growth would come primarily from the organic growth of existing product and service offerings.
The markets in which we compete are highly competitive, subject to pricing pressure and include numerous other brands and retailers that offer a wide variety of competitive products; if we fail to compete effectively, we could lose our market position.
The markets in which we compete are highly competitive. Numerous other brands and retailers offer a wide variety of products that compete with our grills and grilling accessories. Competition in these product markets is based on a number of factors including product quality, performance, durability, styling, brand image and recognition, and price. We believe that we have been able to compete successfully on the basis of our brand, superior design capabilities, product quality and durability, and innovative new product development, as well as on the breadth of our distribution channels, including independent specialty dealers, hardware and home improvement retailers, national and regional chains, online retailers and our growing direct-to-consumer channels. Our competitors may be able to develop and market higher-quality products that compete with our products, sell their products for lower prices, adapt to changes in consumers’ needs and preferences more quickly, devote greater resources to the design, sourcing, distribution, marketing, and sale of their products, or
39
Table of Contents
generate greater brand recognition than us. In addition, as we expand into new product categories, we have faced, and will continue to face, different and, in some cases, more formidable competition. Some of our competitors and potential competitors have significant competitive advantages, including lower price points or stronger reputations in niche areas, more established relationships with a larger number of suppliers and manufacturing partners, greater brand recognition, more effective brand ambassador and endorsement relationships, greater financial strength, larger research and development teams, significant intellectual property portfolios, larger marketing budgets or more distribution and other resources than we do. Some of our competitors may aggressively discount their products or offer other attractive sales terms in order to gain market share, which could result in pricing pressures, reduced profit margins, or lost market share. Further, consolidation in the retail industry and changes in consumer preferences are factors which may exert additional pressure on pricing in the markets in which we compete. If we are not able to overcome these potential competitive challenges, effectively market our current and future products, and compete effectively against our current or potential competitors, our prospects, results of operations, and financial condition could be harmed.
If our trademarks and trade names are not adequately protected, maintained and enforced, we may not be able to build and maintain name recognition in our markets of interest and our competitive position may be harmed.
Our applications for registration of trademarks in the U.S. and other countries may not be allowed for registration in a timely fashion or at all, and we may not be successful in the maintenance and enforcement of our existing registered trademarks. In addition, the registered or unregistered trademarks or trade names that we own may be challenged, infringed, circumvented, declared generic, lapsed or determined to be infringing on or dilutive of third-party marks. Further, opposition or cancellation proceedings may in the future be filed against our trademark applications and registrations, and our trademarks may not survive such proceedings. In the event that our trademarks are subject to challenges, determinations or oppositions, or if our trademarks are otherwise infringed or diluted, we may not be able to protect our rights in these trademarks and trade names, which we need in order to build name recognition.
Third parties have filed, and may in the future file, for registration of trademarks similar or identical to our trademarks, thereby impeding our ability to build brand identity and possibly leading to market confusion. Moreover, third parties may file first for similar or identical trademarks in certain countries. If they succeed in registering or developing common law rights in such trademarks, and if we are not successful in challenging such third-party rights, we may not be able to use these trademarks to develop brand recognition of our technologies, products or services. In addition, there could be potential trade name or trademark infringement claims brought by owners of other registered trademarks or trademarks that incorporate variations of our registered or unregistered trademarks or trade names. If we are unable to establish name recognition based on our trademarks and trade names, we may not be able to compete effectively and we could be forced to rebrand our products, which could result in loss of brand recognition, which could have a material adverse effect on our competitive position, business, financial condition, and results of operations.
Our results of operations are subject to significant fluctuations due to the impacts of both extreme weather events and unusual or poor weather patterns, which could cause a decrease in revenues and operating results.
Weather can be difficult to forecast far in advance. Variations in weather conditions across seasons and throughout the year may harm our quarterly results of operations. Extreme weather events, including, without limitation, hurricanes, tornados, floods, earthquakes and wildfires, and the effects thereof, may negatively impact our net sales, manufacturing operations or supply chain in the impacted regions. Additionally, unusual weather patterns, such as extended periods of unseasonably
40
Table of Contents
cold or hot temperatures, or heavier than normal precipitation levels during peak spring/summer months, could suppress consumer demand and negatively impact our net sales. We expect that weather will continue to affect our results of operations, sales and earnings.
Our results of operations are subject to seasonal and quarterly variations.
We expect our net sales to be highest in our second and third fiscal quarters, with the first fiscal quarter generating the lowest sales, as a result of our prevalence in Northern Hemisphere countries and higher grill purchase rates in late spring and summer. Our annual and quarterly results of operations may also fluctuate significantly as a result of a variety of other factors, including, among other things, the timing of the introduction of and advertising for our new products and those of our competitors, changes in our product mix, and the shifting dynamics of distributor and retailer trade inventories in products viewed as seasonal in nature.
As a result of these seasonal and quarterly fluctuations, as well as the unpredictable nature of weather, we believe that comparisons of our operational results between different quarters within a single fiscal year, or across different fiscal years, are not necessarily meaningful and that these comparisons cannot be relied upon as indicators of our future performance. In the event that any seasonal or quarterly fluctuations in our net sales and results of operations result in our failure to meet our forecasts or the forecasts of the research analysts that may cover us in the future, the market price of our common stock could fluctuate or decline.
Past growth may not be indicative of future growth.
Historically, we have experienced sales growth through organic market share gains, geographic expansion, technological innovation, new product offerings, increased demand for outdoor living products, including as a result of the COVID-19 pandemic, and acquisitions that have increased our size, scope, and geographic footprint. Our various business strategies and initiatives, including our growth initiatives, are subject to business, economic and competitive uncertainties and contingencies, many of which are beyond our control. In the future, we may not be able to:
| • | acquire new customers, retain existing customers or grow or maintain our share of our current key markets, including the United States, Germany, Canada, Australia, the United Kingdom and France; |
| • | penetrate new markets; |
| • | identify and develop new products that meet the demand of rapidly evolving consumer expectations; |
| • | generate sufficient cash flows to support expansion plans and general operating activities; |
| • | obtain financing for our growth initiatives, including acquisitions; |
| • | identify suitable acquisition candidates and successfully integrate acquired businesses; |
| • | maintain favorable supplier and customer arrangements and relationships; |
| • | maintain consumer satisfaction and retention; and |
| • | identify and divest assets that do not continue to create value consistent with our objectives. |
In addition, the COVID-19 pandemic could exacerbate these risks. If we are not able to manage these potential difficulties successfully in order to continue to compete in our markets and grow our business, our sales, overall financial condition, results of operations and cash flows could be adversely affected.
41
Table of Contents
The COVID-19 pandemic and associated responses could adversely impact our business, operations, financial condition, results of operations or cash flows.
Our business, operations, financial condition, results of operations, or cash flows could be negatively impacted by the COVID-19 pandemic and associated responses in the future.
Early in the pandemic, some of our suppliers faced operational challenges due to regional lockdown or quarantine regulations, which resulted in some interruptions in the shipping of certain finished goods or components. This negatively affected our production capabilities in the second quarter of fiscal year 2020. In addition, our manufacturing plant in Huntley was closed for a three-week period during April 2020 until we demonstrated to the Illinois Department of Commerce and Economic Opportunity that Weber met the definition of an Essential Business and, more importantly, had established safety protocols that met or exceeded state regulations. During the third fiscal quarter, we secured secondary sources of supply and added additional shifts at the Huntley facility such that we were able to return production to full capabilities. Continued restrictions and disruption across key elements of our supply chain, including logistics, the acquisition of raw materials and certain electronic components and labor availability, had an impact on our profitability. In fiscal year 2021, our supply chain and operations has resumed “normal” operations. However, if the COVID-19 pandemic worsens, we could experience further supply chain disruptions or delays that could have a material impact on our business. Moreover, if additional shut-down orders are issued in the future due to the COVID-19 pandemic, our ability to operate as an Essential Business could be altered, depending on the language of such orders.
The COVID-19 pandemic caused a sustained global economic slowdown of varying durations across different industries, and it is possible that it could still cause a global recession. Deteriorating economic and political conditions caused by the COVID-19 pandemic, such as increased unemployment, decreased capital spending, declines in consumer confidence, or economic slowdowns or recessions, could cause a decrease in demand for our products. In addition, a prolonged or worsened COVID-19 pandemic could lead to the shutdown or material reduction of grill manufacturing, repair and replacement as well as a reduction in residential construction and remodeling activity, which could have a material adverse effect on our business, financial condition, results of operations and cash flows. While we have experienced higher demand in our grill business as consumers sheltered in place and have spent more time at home as a result of the COVID-19 pandemic, such growth may not be sustainable and may not be repeated in future periods. Furthermore, even if growth in demand continues, we may not be able to meet that demand due to production and capacity challenges.
The severity, magnitude and duration of the current COVID-19 pandemic is uncertain, rapidly changing and hard to predict. We may not be able respond to the impacts of the COVID-19 pandemic on a timely basis to prevent near- or long-term adverse impacts to our results of operations. Any negative impact on our business, financial condition, results of operations and cash flows cannot be reasonably estimated at this time, but the COVID-19 pandemic could lead to extended disruption of economic activity and the impact on our business, financial condition, results of operations and cash flows could be material.
Our net sales and profitability depend on the level of consumer spending for our products, which is sensitive to general economic conditions and other factors that affect global markets; during a downturn in the economy, consumer purchases of discretionary items are affected, which could materially harm our sales, profitability, and financial condition.
Our products are discretionary items for consumers. Therefore, our business depends on the strength of the retail, commercial and industrial sectors of the economy in various parts of the world, and trends therein, primarily in North America, Europe and Australia/New Zealand, and to a lesser
42
Table of Contents
extent the rest of the Asia-Pacific region and Latin America. There are many factors that influence consumer spending, including actual and perceived economic conditions, consumer confidence, disposable consumer income, consumer credit availability, unemployment and tax rates in the markets where we sell our products. Consumers also have discretion as to where to spend their disposable income and may choose to purchase other items or services if we do not continue to provide authentic, compelling and high-quality products at appropriate price points. Consumer preferences may shift with regard to environmental, health or sustainability concerns, and as those concerns receive greater attention, consumers may shift demand away from gas, charcoal, or pellet fueled grills to other cooking alternatives. As global economic conditions continue to be volatile and economic uncertainty persists, trends in consumer discretionary spending may also remain unpredictable and subject to declines. Any of these factors could harm discretionary consumer spending, resulting in a reduction in demand for our premium products, decreased prices, and harm to our business and results of operations. Moreover, consumer purchases of discretionary items tend to decline during recessionary periods when disposable income is lower or during other periods of economic instability or uncertainty, which may slow our growth more than anticipated. A downturn in the individual economies in markets where we sell our products, particularly in the United States, Germany, Canada, Australia, the United Kingdom and France, may materially harm our sales, profitability, and financial condition. For example, the lasting adverse effects of COVID-19 across geographies could lead to a decline in discretionary spending by consumers, resulting in a reduction in demand for our products, and in turn may materially impact our sales, profitability and financial condition.
We face risks associated with our acquisitions, divestitures and other strategic activities.
From time to time, we make acquisitions, divestitures and other strategic investments and participate in joint ventures. We engage in such strategic transactions where we identify advantageous opportunities in connection with businesses, products, or technologies that we believe could complement or expand our business, enhance our capabilities, or otherwise offer growth opportunities. For example, we recently acquired both June Life, a producer of smart ovens and developer of related software, and substantially all of the assets of R. McDonald Co., the company that was formerly managing our operations in Australia and New Zealand as a contracted third party.
We may engage in the issuance of dilutive equity securities, the incurrence of debt or the use of cash to fund such transactions. These transactions, and other transactions that we have entered into or which we may enter into in the future, can involve significant challenges and risks, including that the transaction does not advance our business strategy or fails to produce a satisfactory return on our investment. We have encountered and may encounter difficulties in integrating acquisitions with our operations, undertaking post-acquisition restructuring activities, applying our internal control processes to these acquisitions, managing strategic investments, and in overseeing the operations, systems and controls of acquired companies. Integrating acquisitions, managing combined businesses and carving out divestitures are often expensive, may involve unanticipated costs or liabilities and may require significant attention from management. We may not realize the degree, or timing, of benefits or synergies we anticipate when we first enter into a transaction. Additionally, following such a transaction, we may struggle to retain our or an acquired business’ key employees.
While our evaluation of any potential transaction includes business, legal and financial due diligence with the goal of identifying and evaluating the material risks involved, our due diligence reviews may not identify all of the issues necessary to accurately estimate the cost and potential loss contingencies of a particular transaction, including potential exposure to regulatory sanctions resulting from an acquisition target’s previous activities or costs associated with any quality issues with an acquisition target’s legacy products. In addition, certain liabilities may be retained by Weber when closing a facility, divesting an entity or selling physical assets, and such liabilities may be material. Further, there may be breaches of the representations or warranties or other violations of the
43
Table of Contents
contractual obligations required by the acquisition agreement of other parties to the acquisition transaction and any contractual remedies related thereto may not adequately protect or compensate us. A significant portion of the purchase price of companies we acquire may be allocated to acquired goodwill and other intangible assets, which must be assessed for impairment at least annually. In the future, if our acquisitions do not yield expected returns, we may be required to take charges to our results of operations based on this impairment assessment process, which could harm our results of operations.
A deterioration in labor relations could adversely impact our global business.
We are subject to separate collective bargaining agreements with certain labor unions in the United States, including with respect to employees in our Huntley, Illinois and Palatine, Illinois facilities, and works councils in Europe, as well as various other commitments regarding our workforce. We periodically negotiate with such unions and works councils representing our employees and may be subject to union campaigns, work stoppages and other potential labor disputes. At routine intervals, we renegotiate these collective bargaining agreements and may be unable to renew these collective bargaining agreements on the same or similar terms, or at all. Further, we may be subject to work stoppages at our suppliers or customers that are beyond our control. A deterioration in labor relations may have a material adverse effect on our business and financial condition.
We rely on information technology systems to support our business operations. A significant disruption or breach of our technological infrastructure, or the technological infrastructure of our vendors or others with which we do business or rely on, could adversely affect our financial condition and results of operations. Additionally, failure to maintain the security of proprietary, personal, sensitive or confidential information could damage our reputation and expose us to litigation.
Information technology supports several aspects of our business, including, among others, supply, pricing, customer service and communication, distribution and transportation, transaction processing, financial reporting, collections and cost management. In addition, we expect our reliance on information technology systems to increase as we continue to develop connected products, connected devices, and other consumer-facing technology solutions, such as our Weber Grills App, Weber Connect App, Weber iGrill App, Weber Connect Cloud Infrastructure and our websites. As a result, our ability to operate effectively on a day-to-day basis and accurately report our results depends on a solid technological infrastructure, which is inherently susceptible to internal and external threats. We are vulnerable to interruption and breakdown by fire, natural disaster, power loss, telecommunication failures, internet failures, security incidents, and other catastrophic events.
Advances in computer and software capabilities, encryption technology, and other discoveries increase the complexity of our technological environment, including how each interacts with our various software platforms. Such advances could delay or hinder our ability to process transactions or could compromise the integrity of our data, resulting in a material adverse impact on our financial condition and results of operations. The risk of system disruption is increased when significant system changes are undertaken. If we fail to timely integrate and update our information technology systems and processes, we may fail to realize the cost savings or operational benefits anticipated to be derived from these initiatives. We also may experience occasional system interruptions and delays that make our information technology systems unavailable or slow to respond, including the interaction of our information technology systems with those of third parties. A lack of sophistication or reliability of our information technology systems could adversely impact our operations and consumer service and could require major repairs, replacements or remodels, resulting in significant costs and foregone sales.
44
Table of Contents
Cybersecurity threats, which include hackers, computer viruses, spyware, ransomware and malware, unauthorized attempts to access information, physical or electronic break-ins, phishing schemes, social engineering, denial of service attacks, human error or malfeasance, fraud or malice on the part of employees or third parties (including state-sponsored organizations with significant financial and technological resources), terrorism or acts of war, political protests and other electronic security breaches, are persistent and evolve quickly, and we have in the past and may in the future experience such cybersecurity threats. Such threats have increased in frequency, scope, and potential impact in recent years because of the proliferation of new technologies and the increased number, sophistication and activities of perpetrators of cyberattacks. We and others are also subject to increased cybersecurity threats and potential breaches because of the increase in the number of individuals working from home as a result of the COVID-19 pandemic. Since the techniques used to obtain unauthorized access to or to sabotage information technology systems change frequently and are often not recognized until after they are launched against a target, we may be unable to anticipate these techniques or to implement adequate preventative measures. The accidental or willful security breaches or other unauthorized access by third parties to our information technology systems or facilities, or those of our vendors and/or others with which we do business or rely on, or the existence of computer viruses in our or their data or software, and/or any other failure of our or their information technology systems could expose us to a risk of information loss, the misappropriation of proprietary, personal, sensitive and confidential information, work stoppages, disruptions, and/or the defective manufacture or defective design of our products, which could expose us to liability. Any theft, misuse, unauthorized or inadvertent disclosure, manipulation or destruction of this information could result in, among other things, unfavorable publicity, damage to our reputation, difficulty in marketing our products, allegations by our customers that we have not performed our contractual obligations, indemnification obligations, regulatory investigations, fines or penalties, litigation or other claims by affected parties and possible financial obligations for liabilities and damages related to the theft or misuse of this information, any of which could have an adverse effect on our business, financial condition, results of operations, reputation, and relationships with our customers and suppliers. Further, we could be forced to expend significant financial and operational resources in response to a security breach, including repairing system damage, increasing security protection costs by deploying additional personnel and modifying or enhancing our protection technologies, investigating and remediating any information security vulnerabilities and defending against and resolving legal and regulatory claims, all of which could divert resources and the attention of our management and key personnel away from our business operations and adversely affect our business, financial condition and results of operations.
Risks Related to the Manufacturing, Supply and Distribution of Our Products
We depend on suppliers, including single-source suppliers and, in a few cases, sole-source suppliers, to consistently supply us with finished goods, raw materials and components for our products, and any failure to procure such finished goods, raw materials and components could have a material adverse effect on our business, product inventories, sales and profit margins. Additionally, if our independent suppliers and manufacturing partners do not comply with ethical business practices or with applicable laws and regulations, our reputation, business, and results of operations could be harmed.
We use a wide range of materials and components in the global production of our products, which come from numerous suppliers around the world. Our suppliers (and those they depend upon for materials and services) are subject to risks, including supplier plant shutdowns or slowdowns, labor disputes or constraints, union organizing activities, intellectual property claims, financial liquidity, information technology failures, inclement weather, natural disasters, significant public health and safety events, supply constraints, and general economic and political conditions that could limit their ability to provide us with materials. Insurance for certain disruptions may not be available, affordable or
45
Table of Contents
adequate. The effects of climate change, including extreme weather events, long-term changes in temperature levels and water availability may exacerbate these risks. Such disruption has in the past and could in the future interrupt our ability to manufacture certain products. Any significant disruption could negatively impact our financial statements.
While we have manufacturing and supply agreements with our most strategic and critical suppliers, with most of our suppliers, we place purchase orders on an as-needed basis. Because not all of our business arrangements provide for guaranteed supply and some key parts may be available only from a single supplier or a limited group of suppliers, we are subject to supply and pricing risk. Our suppliers could discontinue the manufacturing or supply of these components at any time. We carry safety stocks within our inventory, but do not carry a significant inventory of these components that could cover every potential supply constraint. Our suppliers may not be able to meet our demand for their products, either because of acts of nature, the nature of our agreements with those manufacturers or our relative importance to them as a customer, and our manufacturers may decide in the future to discontinue or reduce the level of business they conduct with us. We might not be able to identify and obtain additional or replacement suppliers for any of these components quickly or at all or without incurring significant additional costs. We cannot guarantee that we will be able to establish alternative relationships on similar terms, without delay or at all. In addition, we rely on single-source suppliers for certain types of parts in our products, and, in a few cases, on sole-source suppliers. A single-source supplier is a supplier from which we make all purchases of a particular component used in our products even though other suppliers of the component exist. A sole-source supplier is a supplier from which we make all purchases of a particular component used in our product, and the supplier is the only source of that particular component in the market. Establishing additional or replacement suppliers for any of these materials or components, if required, or any supply interruption from our suppliers, could limit our ability to manufacture our products, result in production delays and increased costs and adversely affect our ability to deliver products to our customers on a timely basis or at all. If we are not able to identify alternate sources of supply for the components, we might need to modify our product to use substitute components, which could cause delays in shipments, increase design and manufacturing costs and increase prices for our products. Any such modified product might not be as effective as the predecessor product or might not gain market acceptance. This could lead to customer or consumer dissatisfaction and damage to our reputation and could materially and adversely affect our business, product inventories, sales and profit margins.
Additionally, our reputation and our consumers’ willingness to purchase our products depend in part on our suppliers’, manufacturers’, and retail partners’ compliance with ethical employment practices, such as with respect to child labor, wages and benefits, forced labor, discrimination, safe and healthy working conditions, and with all legal and regulatory requirements relating to the conduct of their businesses. We do not exercise control over our suppliers, manufacturers, and retail partners and cannot guarantee their compliance with ethical and lawful business practices. Additionally, our internal audits of our suppliers, manufacturers, and retail partners may not uncover all instances of noncompliance with such practices and our own stringent policies and standards. If our suppliers, manufacturers, or retail partners fail to comply with applicable laws, regulations, safety codes, employment practices, human rights standards, quality standards, environmental standards, production practices, or other obligations, norms, or ethical standards, our reputation and brand image could be harmed, and we could be exposed to litigation and additional costs that would harm our business, reputation, and results of operations.
46
Table of Contents
Because we rely on foreign suppliers and we sell products in foreign markets, we are susceptible to numerous international business risks that could increase our costs or disrupt the supply of our products.
Our international operations subject us to risks, including:
| • | economic and political instability, including international conflicts, acts of terrorism, war and the threat thereof; |
| • | fluctuations in the currency exchange rates; |
| • | restrictive actions by foreign governments, including those with respect to tariffs or trade policies; |
| • | changes in tariffs, import duties or import or export restrictions; |
| • | required compliance with anti-corruptions laws, including the Foreign Corrupt Practices Act, which may require extensive measures in certain markets; |
| • | timely shipping of product and unloading of product, including the timely rail/truck delivery to our warehouses and/or a customer’s warehouse of our products; |
| • | impacts of extreme weather events or trends that are more prevalent in particular geographic regions; |
| • | opportunity costs and reputational damage related to the presence of counterfeit versions of the Company’s products in such foreign markets; |
| • | greater difficulty enforcing intellectual property rights and weaker laws protecting intellectual property rights; |
| • | complications in complying with the laws and policies of the United States affecting the importation of goods, including tariffs, duties, quotas and taxes; |
| • | required compliance with U.S. laws that impact the Company’s operations in foreign jurisdictions that do not impact local operating companies; and |
| • | complications in complying with trade laws, embargoes and economic sanctions, foreign tax laws and other regulatory standards and requirements. |
Further, the impact of the decision of the United Kingdom to withdraw from the European Union may cause the value of several European currencies, including the euro, to fluctuate, which may adversely affect our non-U.S. dollar sales and earnings. The emergence of any other international geopolitical or trade disputes could exacerbate the various risks that our international presence makes us susceptible to. As we are developing manufacturing operations in Poland, a significant disruption of the political or financial systems there could put these manufacturing operations at risk, which could ultimately adversely affect our profitability or operating results.
In addition to suppliers, we rely on our own production and manufacturing facilities; if we fail to timely and effectively obtain shipments of products from our manufacturing facilities and deliver products to our retail partners and customers, our business and results of operations could be harmed.
Our business depends on our ability to source raw material and components, manufacture our finished goods and distribute products in a timely manner. However, we cannot control all of the factors that might affect the timely and effective procurement of such raw material and components from our third-party suppliers, manufacture of our finished goods and the delivery of our products to our retail partners and customers.
47
Table of Contents
Globally, we operate 22 distribution facilities in our key markets and supplement our distribution network by engaging distribution partners in certain markets, particularly in EMEA and Asia-Pacific. Certain of our facilities play key roles in our distribution network. Specifically, we operate in a leased warehouse located in Huntley, Illinois which we have referred to as our Global Distribution Center (“GDC”). This facility distributes our products to Weber affiliates worldwide but is most critical to the direct distribution of our products to our customers located in the United States, Canada and Mexico. We are currently constructing an additional manufacturing and distribution center in Zabrze, Poland which we expect will serve a critical role in our operations in EMEA, similar to the role the GDC plays in our service of the U.S., Canadian and Mexican markets. Our reliance on a small number of key geographical locations for our principal manufacturing and distribution centers makes us more vulnerable to natural disasters, weather-related disruptions, accidents, system failures, public health issues such as the current COVID-19 pandemic (or other future pandemics or epidemics), and other unforeseen events that could delay or impair our ability to manufacture our finished goods, fulfill retailer orders and/or ship merchandise, which could harm our sales and results of operations.
We import certain raw materials and components, and we are also vulnerable to risks associated with manufacturing abroad, including, among other things: (a) risks of damage, destruction, or confiscation of products while in transit to our distribution centers; (b) foreign currency fluctuations; (c) the effects of international and regional geopolitical dynamics, instability and conflicts; and (d) transportation and other delays in shipments, including as a result of heightened security screening, port congestion, and inspection processes or other port-of-entry limitations or restrictions in the United States. Failure to procure our inputs from our third-party suppliers and manufacture and deliver merchandise to our retail partners and direct-to-consumer channels in a timely, effective, and economically viable manner could reduce our sales and gross margins, damage our brand, and harm our business. Further, the construction of our Zabrze facility is a large undertaking and we have not, in the recent past, opened a new facility of this scale. Any delays in the completion and integration of the Zabrze facility, cost overruns in connection with its construction or complications with respect to transitioning a significant portion of our regional operations from a model in which we contracted with third-party manufacturers and distributors to one in which such operations are conducted in-house in Zabrze, could materially increase our cost of goods sold and similarly reduce our gross margins and harm our business.
As current tariffs are implemented, or if additional tariffs or other restrictions are placed on foreign imports or any related countermeasures are taken by other countries, our business and results of operations could be harmed.
Recently, the United States has put in place higher tariffs and other trade restrictions and signaled that it may additionally alter trade agreements and terms between the United States and China, the European Union, Canada, and Mexico, among others, including limiting trade and/or imposing tariffs on imports from such countries. In addition, China, the European Union, Canada, and Mexico, among others, have either threatened or put into place retaliatory tariffs of their own. As announced tariffs are implemented, or additional tariffs or other restrictions are placed on foreign imports, including on any of our products manufactured overseas for sale in the United States, or any related countermeasures are taken by other countries, our business and results of operations may be materially harmed. Additionally, tariffs on foreign imports of raw materials and components for our products may cause domestic U.S. suppliers to opportunistically take price increases, which may impact our profitability.
Current and additional tariffs have the potential to significantly raise the absolute and relative cost of our products compared with those of our competitors, particularly our finished goods and certain components. Additionally, disparities in the application of tariffs across product categories and based upon the location of manufacturing operations could place us at a competitive disadvantage and
48
Table of Contents
detrimentally affect or business and results of operations. For example, differing tariff regimes may be applied across product categories and depending on whether (a) finished goods are imported from abroad or (b) raw materials and components are domestically assembled into finished goods. In such cases, there can be no assurance that we will be able to shift manufacturing and supply agreements to non-impacted countries, including the United States, to reduce the effects of the tariffs. As a result, we may suffer margin erosion or be required to raise our prices, which may place us at a competitive disadvantage, result in the loss of customers, negatively impact our results of operations or otherwise harm our business. In addition, the imposition of tariffs on products that we export to international markets could make such products more expensive compared to those of our competitors if we pass related additional costs on to our customers, which may also result in the loss of customers, negatively impact our results of operations, or otherwise harm our business.
Exchange rate fluctuations could adversely affect our financial condition, results of operations and cash flows.
We incur currency transaction risk whenever we enter into either a purchase or sale transaction using a currency other than the local currency of the transacting entity. We conduct business in various locations throughout the world and are subject to market risk due to changes in value of foreign currencies in relation to our reporting currency, the U.S. dollar. Periodically, we use derivative financial instruments to manage these risks. The functional currencies of our foreign operating locations are generally the local currency in the country. We manage these operating activities at the local level and net sales, costs, assets and liabilities are generally denominated in local currencies, thereby mitigating the risk associated with changes in foreign exchange. However, our results of operations and assets and liabilities are reported in U.S. dollars and thus will fluctuate with changes in exchange rates between such local currencies and the U.S. dollar. Furthermore, the sales of inventory between U.S. and foreign locations are often denominated in currencies other than the U.S. dollar, which generates additional risk. While we engage in hedging activities in order to mitigate our exposure, we may incur costs in connection with such activities and we may not be successful in hedging our exposure.
The Company’s financial instruments that can be affected by foreign currency fluctuations and exchange risks consist primarily of cash and cash equivalents, trade receivables, trade payables, and net sales denominated in currencies other than the U.S. dollar. For fiscal year 2020, approximately 47% of our net sales were denominated in a currency other than our functional U.S. dollar currency. These sales were primarily transacted in euros, Australian dollars, Canadian dollars and British pounds. Consequently, we are exposed to the impact of exchange rate volatility between the U.S. dollar and these currencies. To hedge against this risk, we enter into foreign currency forward exchange contracts to protect our U.S. trade receivable positions with our foreign operations.
We expect that the amount of our sales denominated in non-dollar currencies may increase in future periods. Given the volatility of exchange rates, there can be no assurance that we will be able to effectively manage our currency transaction risks or that any volatility in currency exchange rates will not have a material adverse effect on our financial condition or results of operations. See “Management’s Discussion and Analysis of Financial Condition and Results of Operations—Quantitative and Qualitative Disclosures about Market Risk.”
Additionally, because our consolidated financial results are reported in U.S. dollars, the translation of sales or earnings generated in other currencies into U.S. dollars can result in a significant increase or decrease in the amount of those sales or earnings in our financial statements, which also affects the comparability of our results of operations and cash flows between financial periods. Further, currency fluctuations may negatively impact our debt service requirements, which are primarily in U.S. dollars.
49
Table of Contents
Fluctuations in the cost and availability of raw materials, equipment, labor and transportation could cause manufacturing delays or increase our costs.
The price and availability of key raw materials and components used to manufacture our products, including aluminum ingot, carbon steel, enameling iron, stainless steel, certain plastic materials, certain electronic components and various engineered coating materials as well as manufacturing equipment and molds, may fluctuate significantly. Additionally, the cost of logistics and transportation fluctuates in large part due to the price of oil, currency fluctuations, and global demand trends. Any fluctuations in the cost and availability of any of our raw materials or other sourcing or transportation costs related to our raw materials or products could harm our gross margins and our ability to meet customer demand. If we are unable to successfully mitigate a significant portion of these product cost increases or fluctuations, our results of operations could be harmed.
A significant portion of our sales are to large, multi-national retail partners. If these retail partners cease to carry our current products, choose not to carry new products that we develop or cease operations altogether, our brand as well as our results of operations and financial condition could be harmed. Additionally, we depend on these retail partners to display and present our products to consumers, and our failure to maintain and further develop our relationships with our retail partners could harm our business.
For fiscal years 2019 and 2020, approximately 37% and 39%, respectively, of our net sales were made to large, multi-national retail partners. For fiscal years 2019 and 2020, our top national retail partner accounted for approximately 14% and 16% of our net sales, respectively. Our retail partners service consumers by stocking and displaying our products, explaining our product attributes, and sharing our brand story. Our relationships with these retail partners are important to the authenticity of our brand and the marketing programs we continue to deploy. Our failure to maintain these relationships with our retail partners or financial difficulties experienced by these retail partners could harm our business. These retail partners may decide to emphasize products from our competitors, to redeploy their retail floor space to other product categories, or to take other actions that reduce their purchases of our products. We do not receive long-term purchase commitments from our retail partners, and orders received from these retail partners are cancelable. Factors that could affect our ability to maintain or expand our sales to these retail partners include: (a) failure to accurately identify the needs of our customers; (b) a lack of customer acceptance of new products or product expansions; (c) unwillingness of our key retail partners and customers to attribute premium value to our new or existing products or product expansions relative to competing products; (d) failure to obtain floor space from our retail partners; (e) new, well-received product introductions by competitors; (f) damage to our relationships with key retail partners due to brand or reputational harm; (g) delays or defaults on our retail partners’ payment obligations to us; and (h) store closures, decreased foot traffic, recession or other adverse effects resulting from public health crises such as the current COVID-19 pandemic (or other future pandemics or epidemics).
We cannot assure you that our current retail partners will continue to carry our current products, carry any new products that we develop or continue to operate. And if we lose any of our key retail partners or any key retail partner reduces its purchases of our existing or new products or its number of stores or operations or promotes products of our competitors over ours, our sales would be harmed. Because we are a premium brand, our sales depend, in part, on retail partners effectively displaying our products, including providing attractive space in their stores, and training their sales personnel to sell our products. If our retail partners reduce or terminate those activities, we may experience reduced sales of our products, resulting in lower gross margins, which would harm our results of operations. If these risks occur, they could harm our brand as well as our results of operations and financial condition. In addition, store closures, decreased foot traffic and recession resulting from the COVID-19
50
Table of Contents
pandemic will adversely affect the performance and will likely adversely affect the financial condition of many of these customers. The foregoing would be expected to have a material adverse effect on our business and financial condition.
Product manufacturing disruptions, at our own facilities and those of our suppliers, including as a result of catastrophic and other events beyond our control, could cause us to be unable to meet customer demands or increase our costs.
If operations at any of our manufacturing facilities, or the facilities of our supply chain partners, were to be disrupted as a result of significant equipment failures, natural or man-made disasters, earthquakes, power outages, fires, explosions, terrorism, adverse or extreme weather conditions, labor disputes, public health epidemics or other catastrophic events or events outside of our control, we may be unable to fill customer orders and otherwise meet customer demand for our products. In addition, these types of events may negatively impact residential, commercial and industrial spending in impacted regions or, depending on the severity, globally. As a result, any of such events could have a material adverse effect on our business, financial condition, results of operations and cash flows.
Interruptions in production, in particular at our manufacturing facilities, could increase our costs and reduce our sales. Any interruption in production capability could require us to make substantial capital expenditures to fill customer orders. While we maintain property damage insurance, as well as business interruption insurance to mitigate losses resulting from any production interruption or shutdown caused by an insured loss, any recovery under our insurance policies may not offset the lost sales or increased costs that may be experienced during the disruption of operations, which could have a material adverse effect on our business, financial condition, results of operations and cash flows.
Disruptions in our supply chain and other logistical factors affecting the distribution of our merchandise could adversely impact our business.
A disruption within our logistics or supply chain network could adversely affect our ability to deliver inventory in a timely manner, which could impair our ability to meet customer demand for products and result in lost sales, increased supply chain costs, or damage to our reputation. Such disruptions may result from damage or destruction to our distribution or fulfillment centers; weather-related events; natural disasters; international trade disputes or trade policy changes or restrictions; tariffs or import-related taxes; third-party strikes, lock-outs, work stoppages or slowdowns; shortages of supply chain labor, including truck drivers; shipping capacity constraints, including shortages of related equipment; third-party contract disputes; supply or shipping interruptions or costs, including the blockage of key shipping channels; military conflicts; acts of terrorism; public health issues, including pandemics or quarantines (such as the COVID-19 pandemic) and related shutdowns, reopenings, or other actions by the government; civil unrest; or other factors beyond our control. As a result of these disruptions, we have in the past chosen, and may choose in the future, to arrange for additional quantities of affected products, if available, to be delivered through air freight, which is significantly more expensive than standard shipping by sea and, consequently, could harm our gross margins.
We also rely on the timely and free flow of goods through open and operational ports from our suppliers. Labor disputes or disruptions at ports, our common carriers, or our suppliers could create significant risks for our business, particularly if these disputes result in work slowdowns, lockouts, strikes, or other disruptions during periods of significant importing or manufacturing, potentially resulting in delayed or canceled orders, unanticipated inventory accumulation or shortages, and harm to our business, results of operations, and financial condition. In recent years, global ports, particularly those located on the West Coast of the U.S., China and certain European locations, have been impacted by capacity constraints, port congestion and delays, periodic labor disputes, security issues, weather-related events, and natural disasters, which have been further exacerbated by the pandemic.
51
Table of Contents
Disruptions to our supply or distribution chains due to any of the factors listed above could negatively impact our financial performance or financial condition.
Insolvency, credit problems or other financial difficulties that could confront our customers and retail partners could expose us to financial risk.
We sell to the large majority of our retail partners on open account terms and do not require collateral or a security interest in the inventory we sell them. Consequently, the majority of our accounts receivable with our retail partners are unsecured. Insolvency, credit problems, or other financial difficulties confronting our customers and retail partners could expose us to financial risk. These actions could expose us to risks, including increases in our bad debt expense, if they are unable to pay for the products they purchase from us. Financial difficulties of our customers and retail partners could also cause them to reduce their sales staff, use of attractive displays, number or size of stores, and the amount of floor space dedicated to our products. For example, the COVID-19 pandemic caused public health officials to recommend precautions to mitigate the spread of the virus that resulted in widespread temporary store closures or reduced store hours for our retail partners during the second and third fiscal quarters of 2020. Significant uncertainty about the ultimate duration and severity of the spread of COVID-19, uncertainties regarding consumer willingness to visit retail stores during the COVID-19 pandemic and in the future, and the overall economic impact of COVID-19 and the related impact on consumer confidence and spending may lead to a material reduction in sales of our products by our retail partners. Any reduction in sales by, or loss of, our current retail partners or customer demand, or credit risks associated with our customers and retail partners, could harm our business, results of operations, and financial condition.
Conflicts with our channel and distribution partners could harm our business and operating results.
Our increasing focus on direct-to-consumer channels could cause one or more of our traditional retailer partners to de-emphasize our brand, causing a potential reduction in product sales from that partner. Retailer partners may perceive themselves to be at a disadvantage relative to content quality or online shopping convenience. Due to these and other factors, conflicts in our sales channels could arise and cause channel partners to divert resources away from the promotion and sale of our products. Any of these situations could adversely impact our business and results of operations.
We are subject to risks related to online payment methods.
We currently accept payments for purchases through our website and mobile apps using a variety of methods, including credit cards, debit cards, gift cards and Affirm, a third-party provider of financing for consumer purchases. As we offer new payment options to consumers, we may be subject to additional regulations, compliance requirements, fraud, and other risks. For certain payment methods, we pay interchange and other fees, which may increase over time and raise our operating costs and lower profitability. As a merchant that accepts debit and credit cards for payment, we are subject to the Payment Card Industry (“PCI”) Data Security Standard (“PCI DSS”), issued by the PCI Security Standards Council. PCI DSS contains a set of requirements designed to ensure that companies that process, store or transmit payment card information maintain a secure environment to protect cardholder data. Because we accept debit and credit cards for payment, we are also subject to the data encryption standards and payment network security operating guidelines of the American National Standards Institute. Additionally, the Fair and Accurate Credit Transactions Act requires systems that print payment card receipts to employ personal account number truncation so that the consumer’s full account number is not viewable on the slip. Failure to be PCI compliant or to meet other payment card standards may result in the imposition of financial penalties or the allocation by the card brands of the costs of fraudulent charges to us.
52
Table of Contents
Further, as our business changes, we may be subject to different rules under existing standards, which may require new assessments that involve costs above what we currently pay for compliance. In the future, as we offer new payment options to consumers, including offering integrated emerging mobile and other payment methods, we may be subject to additional regulations, compliance requirements, and fraud. If we fail to comply with the rules or requirements of any provider of a payment method we accept, if the volume of fraud in our transactions limits or terminates our rights to use payment methods we currently accept, or if a data breach occurs relating to our payment systems, we may, among other things, be subject to fines, investigations, legal proceedings, or higher transaction fees and may lose, or face restrictions placed upon, our ability to accept credit card payments from consumers or facilitate other types of online payments. If any of these events were to occur, our business, financial condition, and results of operations could be materially and adversely affected.
Social media platforms present risks and challenges that could cause damage to our brand and reputation as well as to our results of operations.
Social media platforms present risks and challenges that have resulted, and may in the future result, in damage to our brand and reputation, and could materially impact our results of operations. As social media platforms have grown in size and popularity, we have received, and may continue to receive, a high degree of coverage that is published or otherwise disseminated by third parties via such platforms, as well as via blogs, articles, message boards, forums and other media. The considerable expansion in the use of social media platforms over recent years has increased the volume of, and speed at which, negative publicity arising from certain events can be generated and spread, and we may be unable to timely respond to, correct any inaccuracies in, or adequately address negative perceptions arising from such coverage. Such negative or inaccurate posts or comments about us or our products on social media platforms could damage our reputation, brand image and goodwill, and we could lose the confidence of our customers and partners, regardless of whether such information is true and regardless of any number of measures we may take to address them.
This social media coverage includes coverage that is not attributable to statements made by our officers or associates. Information provided by third parties, including by individuals or entities that are self-described grilling “experts” or that make use of our trademarks without permission, may not be reliable or accurate and could materially impact our brand, reputation and results of operations. There is also the potential that bad actors with interests that conflict with ours could disingenuously post negatively or critically about us on social media for their own benefit, an action for which we have little recourse. Our policies and procedures regarding social media have not always been, and may not in the future be effective in preventing the inappropriate use of social media platforms, including blogs, social media websites, unofficial user groups, and other forms of internet-based communications, and the related spread of misinformation or unauthorized display of our trademarks by third parties thereon.
Our brand could be harmed if we are unable to correct misinformation, or if our public image were to be tarnished by negative publicity, including through social media or other communications from our community. Unfavorable publicity about us, including our products, technology, personnel and suppliers, could diminish confidence in, and the use of, our products. Such negative publicity also could adversely affect the size, engagement, activity and loyalty of our customer base or the effectiveness of word-of-mouth marketing, and result in decreased revenue, or require us to expend additional funds for marketing efforts, which could adversely affect our business, financial condition and results of operations.
53
Table of Contents
Risks Related to Government Regulation, Litigation and Intellectual Property Matters
We may be negatively impacted by litigation and other claims, including intellectual property, product liability or warranty claims, and health and safety concerns, including product recalls, could negatively impact our sales and expose us to litigation.
We have been, and in the future may be, made a party to litigation arising in the ordinary course of our business, including those relating to commercial or contractual disputes with suppliers, customers or parties to acquisitions and divestitures, intellectual property matters, product liability, the use or installation of our products, consumer matters, employment and labor matters, and environmental, health and safety matters, including claims based on alleged exposure to asbestos-containing product components. The outcome of such legal proceedings cannot be predicted with certainty and some may be disposed of unfavorably to us. Regardless of outcome, legal proceedings can have an adverse impact on us because of defense and settlement costs, diversion of management resources and other factors. In addition, we have agreed to provide indemnification in connection with prior acquisitions or dispositions for certain of these matters, and we cannot assure you that material indemnification claims will not be brought against us in the future.
Product quality issues could negatively impact consumer confidence in our brands and our business. If our products do not meet applicable safety standards or grill owners’ expectations regarding safety or quality, we could experience lost sales and increased costs and be exposed to legal, financial, and reputational risks, as well as governmental enforcement actions. Actual, potential or perceived product safety concerns could expose us to litigation, as well as government enforcement actions, and result in costly product recalls and other liabilities.
We have in the past and may in the future implement a voluntarily recall or market withdrawal or may be required to do so by a regulatory authority. A recall or market withdrawal of one of our products would be costly and would divert management resources. A recall or withdrawal of one of our products, or a similar product processed by another entity, also could impair sales of our products because of confusion concerning the scope of the recall or withdrawal, or because of the damage to our reputation for quality and safety.
In addition, if our products are, or are alleged to be, defectively designed, manufactured or labeled, contain, or are alleged to contain, defective components or components containing hazardous materials, such as asbestos, or are misused, we may become subject to costly litigation initiated by grill owners. For example, in the past, we have been subject to litigation arising from fires and other thermal events which occurred in connection with our products, due to consumer misuse, incorrect third-party assembly, improper maintenance and faulty propane tanks as well as other causes. This risk is inherent as our products are designed to be used in connection with highly flammable and volatile fuels. In addition to the reputational effects that fire and thermal events may cause due to the negative publicity that these events may receive on social media, product liability claims themselves could harm our reputation, divert management’s attention from our core business, be expensive to defend, and may result in sizable damage awards against us. Although we maintain product liability insurance, we may not have sufficient insurance coverage for future product liability claims. We may not be able to obtain insurance in amounts or scope sufficient to provide us with adequate coverage against all potential liabilities. Product liability claims brought against us, with or without merit, could increase our product liability insurance rates or prevent us from securing continuing coverage, harm our reputation, significantly increase our expenses, and reduce product sales. Product liability claims could cause us to incur significant legal fees, and deductibles and claims in excess of our insurance coverage would be paid out of cash reserves, harming our financial condition and operating results. In addition, successful product liability claims made against one of our competitors could cause claims to be made against us or expose us to a perception that we are vulnerable to similar claims. Claims against us, regardless of their merit or potential outcome, may also hurt our ability to obtain acceptance of our products or to expand our business.
54
Table of Contents
If we are unable to obtain, maintain, and enforce intellectual property protection for our products or if the scope of our intellectual property protection is not sufficiently broad, others may be able to develop and commercialize products substantially similar to ours, and our ability to successfully commercialize our products may be compromised.
Our business and our ability to compete effectively depend on our ability to obtain, maintain, protect and enforce our intellectual property rights, confidential information and know-how. We rely on a combination of patent, copyright, trademark, trade secret and other intellectual property laws in the U.S. and similar laws in other countries, as well as confidentiality procedures, cybersecurity practices and contractual provisions and restrictions, to protect the intellectual property rights and other proprietary rights relating to our products and proprietary technology. Despite our efforts to obtain, maintain, protect and enforce our intellectual property rights and other proprietary rights, there can be no assurance that these protections will be available in all cases or will be adequate to prevent our competitors or other third parties from copying, reverse engineering, accessing or otherwise obtaining and using our technology, intellectual property rights or other proprietary rights or products without our permission. Further, there can be no assurance that our competitors will not independently develop products that are substantially equivalent or superior to our products or design around our intellectual property rights and other proprietary rights. In each case, our ability to compete could be significantly impaired.
We may, over time, increase our investment in protecting our intellectual property rights through additional trademark, patent, copyright and other intellectual property filings, which could be expensive and time-consuming. We may not be able to obtain registered intellectual property protection for our products and even if we are successful in obtaining effective patent, trademark, trade secret and copyright protection, it is expensive to maintain these rights in terms of application and maintenance costs, and the time and costs required to defend our rights could be substantial. Moreover, our failure to develop and properly manage new intellectual property rights could hurt our market position and business opportunities. Furthermore, recent changes to U.S. intellectual property laws may jeopardize the enforceability and validity of our intellectual property portfolio and harm our ability to obtain patent protection of some of our unique business methods.
In addition, these measures may not be sufficient to offer us meaningful protection or provide us with any competitive advantages. We will not be able to protect our intellectual property rights if we are unable to enforce our rights or if we do not detect unauthorized use of our intellectual property rights. Additionally, effective intellectual property protection may not be available in every country in which we offer our products and services, and the laws of certain non-U.S. countries where we do business or may do business in the future may not recognize intellectual property rights or protect them to the same extent as do the laws of the U.S. Moreover, any changes in, or unexpected interpretations of, intellectual property laws may compromise our ability to enforce our trade secret and intellectual property rights. If we are unable to adequately protect our intellectual property rights and other proprietary rights, our competitive position and our business could be harmed, as third parties may be able to commercialize and use products and technologies that are substantially the same as ours to compete with us without incurring the development and licensing costs that we have incurred. Any of our owned or licensed intellectual property rights could be challenged, invalidated, circumvented, infringed, misappropriated or violated, our trade secrets and other confidential information could be disclosed in an unauthorized manner to third parties, or our intellectual property rights may not be sufficient to permit us to take advantage of current market trends or to otherwise provide us with competitive advantages, which could result in costly redesign efforts, discontinuance of some of our offerings or other competitive harm.
55
Table of Contents
We may become involved in lawsuits to protect or enforce our intellectual property rights, which could be expensive, time-consuming and unsuccessful.
Third parties, including our competitors, could be infringing, misappropriating or otherwise violating our intellectual property rights. Monitoring unauthorized use of our intellectual property rights is difficult and costly. From time to time, we seek to analyze our competitors’ products and services, and may in the future seek to enforce our rights against potential infringement, misappropriation or violation of our intellectual property rights. However, the steps we have taken to protect our proprietary rights may not be adequate to enforce our rights as against such infringement, misappropriation or violation of our intellectual property rights. We may not be able to detect unauthorized use of, or take appropriate steps to enforce, our intellectual property rights. Any inability to meaningfully enforce our intellectual property rights could harm our ability to compete and reduce demand for our products and services.
We are, and may in the future become, involved in lawsuits to protect or enforce our intellectual property rights. An adverse result in any litigation proceeding could harm our business. In any lawsuit we bring to enforce our intellectual property rights, a court may refuse to stop the other party from using the technology or products at issue on grounds that our intellectual property rights do not cover the technology or products in question. Further, in such proceedings, the defendant could counterclaim that our intellectual property rights are invalid or unenforceable and the court may agree, in which case we could lose valuable intellectual property rights. The outcome in any such lawsuits are unpredictable. Even if resolved in our favor, such lawsuits may cause us to incur significant expenses, and could distract our technical and management personnel from their normal responsibilities. We may not have sufficient financial or other resources to conduct any such litigation or proceedings adequately, and some of our counterparties may be able to sustain the costs of such litigation or proceedings more effectively than we can because of their greater financial resources. In addition, there could be public announcements of the results of hearings, motions or other interim proceedings or developments, and if securities analysts or investors perceive these results to be negative, it could have a substantial effect on the price of our common stock. Moreover, because of the substantial amount of discovery required in connection with intellectual property litigation, there is a risk that some of our confidential information could be compromised by disclosure during this type of litigation. Any of the foregoing could have a material adverse effect on our competitive position, business, financial condition and results of operations.
Sales of counterfeit versions of our products, as well as unauthorized sales of our products, may adversely affect our reputation, business, financial condition, results of operations and cash flows.
Our products, including our grills and grilling accessories, have and may continue to become subject to competition from counterfeit products, which are products sold under the same or very similar brand names and/or having a similar appearance to genuine products, but which are sold without proper licenses or approvals. Because a portion of our products are manufactured overseas in countries where counterfeiting is more prevalent and our intellectual property rights may not be as adequately protected as they are in the U.S., and we intend to increase our sales internationally over the long term, we may experience increased counterfeiting of our products. Increased counterfeiting has also resulted from the proliferation of internet-based marketplaces through which third parties can, with relative ease, sell and distribute imitation products. Such counterfeit products divert sales from genuine products, often are of lower cost and quality, may pose safety risks, and have the potential to damage the reputation for quality and effectiveness of our genuine products. Illegal sales of counterfeit products could have an adverse impact on our business, financial condition, results of operations and cash flows. In addition, if illegal sales of counterfeit products result in adverse product liability or negative consumer experiences, we may be associated with negative publicity resulting from such
56
Table of Contents
incidents. Although we seek to monitor the existence of counterfeit products and initiate actions to remove them from sale, we may not be able to prevent third parties from manufacturing, selling or purporting to sell counterfeit products competing with our products. Such sales of counterfeit products may also be occurring without our knowledge. The existence and any increase in production or sales of counterfeit products or unauthorized sales could negatively impact our sales, brand reputation, business, financial condition, results of operations and cash flows.
Any claim of infringement, misappropriation or violation of another party’s intellectual property rights could cause us to incur significant costs and to cease the commercialization of our products and services, which could have a material and adverse effect on our business, financial condition and results of operations.
In recent years, there has been significant litigation in the U.S. involving intellectual property rights. Companies in the outdoor cooking industry are increasingly bringing and becoming subject to lawsuits alleging infringement, misappropriation or violation of intellectual property rights, particularly patent rights, and our competitors and other third parties may hold patents or have pending patent applications or other intellectual property rights, which could be related to our business. These risks have been amplified by the increase in patent holding companies and other third parties, commonly referred to as non-practicing entities, that seek to monetize patents they have purchased or otherwise obtained and whose sole or primary business is to assert such claims. Regardless of the merits of any other intellectual property litigation, we may be required to expend significant management time and financial resources on the defense of such claims, and any adverse outcome of any such claim or the above-referenced review could harm our business. We expect that we may receive in the future notices that claim we or our partners, customers, or other third parties using our products and services have infringed, misappropriated, misused or otherwise violated other parties’ intellectual property rights, particularly as the number of competitors in our market grows and the functionality of applications amongst competitors overlaps. Any future litigation, whether or not successful, could be extremely costly to defend, divert our management’s time, attention and resources, damage our reputation and brand, harm our ability to compete in the marketplace and substantially harm our business.
If any of our technologies, products or services are found to infringe, misappropriate or violate a third party’s intellectual property rights, we could be required to obtain a license from such third party to continue commercializing or using such technologies, products or services. However, we may not be able to obtain any required license on commercially reasonable terms or at all. Even if we were able to obtain a license, it could be nonexclusive, thereby giving our competitors and other third parties access to the same technologies or products licensed to us, and it could require us to make substantial licensing and royalty payments. We also could be forced, including by court order, to cease the commercialization or use of the violating technology, products or services. Accordingly, we may be forced to design around such violated intellectual property rights, which may be expensive, time-consuming or infeasible. In addition, we could be found liable for significant monetary damages, including treble damages and attorneys’ fees, if we are found to have willfully infringed a patent or other intellectual property right. Claims that we have misappropriated the confidential information or trade secrets of third parties could similarly harm our business. If we are required to make substantial payments or undertake any of the other actions noted above as a result of any intellectual property infringement, misappropriation or violation claims against us, such payments, costs or actions could have a material adverse effect on our competitive position, business, financial condition, and results of operations.
Additionally, in certain of our agreements with customers and other third parties, we have indemnification obligations for losses related to, among other things, claims by third parties of intellectual property infringement, misappropriation or other violation. Such customers or other third
57
Table of Contents
parties may in the future require us to indemnify them for such infringement, misappropriation or violation, breach of confidentiality or violation of applicable law, among other things. Although we normally seek to contractually limit our liability with respect to such obligations, some of these indemnity agreements may provide for uncapped liability and some indemnity provisions survive termination or expiration of the applicable agreement. Any legal claims from customers or other third parties could result in substantial liabilities, reputational harm, or the delay or loss of market acceptance of our products, and could have adverse effects on our relationships with such customers and other third parties.
If we cannot license rights to use technologies on reasonable terms, we may not be able to commercialize new products in the future.
In the future, we may identify additional third-party intellectual property rights we may need to license in order to engage in our business, including to develop or commercialize new products or services. However, such licenses may not be available on acceptable terms or at all. The licensing or acquisition of third-party intellectual property rights is a competitive area, and other well-established companies may pursue strategies to license or acquire third-party intellectual property rights that we may consider attractive or necessary. These established companies may have a competitive advantage over us due to their size, capital resources and greater development or commercialization capabilities. In addition, companies that perceive us to be a competitor may be unwilling to assign or license rights to us. Even if such licenses are available, we may be required to pay the licensor substantial royalties based on sales of our products and services. Such royalties are a component of the cost of our products or services and may affect the margins on our products and services. In addition, such licenses may be nonexclusive, which could give our competitors access to the same intellectual property rights licensed to us. If we are unable to enter into the necessary licenses on acceptable terms or at all, if any necessary licenses are subsequently terminated, if our licensors fail to abide by the terms of the licenses, if our licensors fail to prevent infringement by third parties, or if the licensed intellectual property rights are found to be invalid or unenforceable, our business, financial condition, and results of operations could be materially and adversely affected. Moreover, we could encounter delays in the introduction of tests while we attempt to develop alternatives. Defense of any lawsuit or failure to obtain any of these licenses on favorable terms could prevent us from commercializing products, which could have a material adverse effect on our competitive position, business, financial condition and results of operations.
We may not be able to enforce our intellectual property rights throughout the world.
We may be required to protect our proprietary technology in an increasing number of jurisdictions, a process that is expensive and may not be successful, or which we may not pursue in every location due to costs, complexities or other reasons. Filing, prosecuting, maintaining, defending, and enforcing patents and other intellectual property rights on our products, services and technologies in all countries throughout the world would be prohibitively expensive, and our intellectual property rights in some countries outside the U.S. can be less extensive than those in the U.S. Competitors may use our technologies in jurisdictions where we have not obtained patent protection or other intellectual property rights to develop their own products and services and, further, may export otherwise infringing, misappropriating or violating products and services to territories where we have patent or other intellectual property protection but enforcement is not as strong as that in the U.S. These products and services may compete with our products and services, and our intellectual property rights may not be effective or sufficient to prevent them from competing.
In addition, the laws of some foreign countries do not protect proprietary rights to the same extent as the laws of the U.S., and many companies have encountered significant challenges in establishing and enforcing their proprietary rights outside of the U.S. These challenges can be caused by the
58
Table of Contents
absence or inconsistency of the application of rules and methods for the establishment and enforcement of intellectual property rights outside of the U.S. In addition, the legal systems of some countries, particularly developing countries, do not favor the enforcement of intellectual property protection. This could make it difficult for us to stop the infringement, misappropriation or other violation of our intellectual property rights. Accordingly, we may choose not to seek protection in certain countries, and we will not have the benefit of protection in such countries. Proceedings to enforce our intellectual property rights in foreign jurisdictions could result in substantial costs and divert our efforts and attention from other aspects of our business. Accordingly, our efforts to protect our intellectual property rights in such countries may be inadequate. In addition, changes in the law and legal decisions by courts in the U.S. and foreign countries may affect our ability to obtain adequate protection for our products, services and other technologies and the enforcement of intellectual property rights. Any of the foregoing could have a material adverse effect on our competitive position, business, financial condition and results of operations.
If we are unable to protect the confidentiality of our trade secrets, our business, financial condition, results of operations and competitive position would be harmed.
We rely on trade secrets and confidentiality agreements to protect our unpatented know-how, technology, and other proprietary information and to maintain our competitive position. With respect to our products, we consider trade secrets and know-how to be one of our primary sources of intellectual property rights. However, trade secrets and know-how can be difficult to protect. We seek to protect these trade secrets and other proprietary technology, in part, by entering into non-disclosure and confidentiality agreements with parties who have access to them, such as certain of our employees, corporate collaborators, outside contractors, consultants, advisors, and other third parties, but we cannot guarantee that we have entered into such agreements with each party that may have or have had access to our trade secrets or proprietary information, including our technology and processes. Despite these efforts, any of these parties may breach the agreements and disclose our proprietary or confidential information, including our trade secrets, and we may not be able to obtain adequate remedies for such breaches. Enforcing a claim that a party illegally disclosed or misappropriated a trade secret is difficult, expensive, and time-consuming, and the outcome is unpredictable. In addition, some courts inside and outside the U.S. are less willing or unwilling to protect trade secrets. If any of our trade secrets were to be lawfully obtained or independently developed by a competitor or other third party, we would have no right to prevent them from using that technology or information to compete with us. If any of our trade secrets were to be disclosed to or independently developed by a competitor or other third party, it could have a material adverse effect on our competitive position, business, financial condition and results of operations.
We may be subject to claims that our employees, consultants, advisors or independent contractors have wrongfully used or disclosed alleged trade secrets or other confidential information of their current or former employers or other third parties or claims asserting ownership of what we regard as our own intellectual property or proprietary rights.
Many of our employees, consultants, advisors and independent contractors are currently or were previously employed at other companies in our field, including our competitors or potential competitors. Although we try to ensure that our employees, consultants, advisors and independent contractors do not use the confidential or proprietary information, trade secrets or know-how of others in their work for us, we may be subject to claims that we or these individuals have, inadvertently or otherwise, improperly used or disclosed intellectual property rights, confidential or proprietary information, trade secrets or know-how, of any such individual’s current or former employer or other third party. Further, we may be subject to ownership disputes in the future arising, for example, from conflicting obligations of consultants or others who are involved in developing our products. We may also be subject to claims that former employees, consultants, independent contractors or other third parties have an ownership
59
Table of Contents
interest in our intellectual property rights. Litigation may be necessary to defend against these claims. If we fail in defending any such claims, in addition to paying monetary damages, we may lose valuable intellectual property rights or personnel. Even if we are successful in defending against such claims, litigation could result in substantial costs and be a distraction to management.
In addition, while it is our policy to require certain of our employees, suppliers, consultants, advisors and independent contractors who may be involved in the conception or development of intellectual property rights to execute agreements assigning such intellectual property rights to us, we cannot guarantee that we have entered into such agreements with each party that may have developed intellectual property rights for us. Individuals involved in the development of intellectual property rights for us may make adverse ownership claims to our current and future intellectual property rights. The assignment of intellectual property rights in agreements entered into by individuals involved in the development of intellectual property rights for us may not be self-executing, or the assignment agreements otherwise may be insufficient or breached, and we may not be able to obtain adequate remedies for such breaches. We may be forced to bring claims against third parties, or defend claims that they may bring against us, to determine the ownership of what we regard as our intellectual property rights. Additionally, to the extent that our employees, independent contractors or other third parties with whom we do business use intellectual property rights owned by others in their work for us, disputes may arise as to the rights in related or resulting know-how and inventions. Any of the foregoing could have a material adverse effect on our competitive position, business, financial condition and results of operations.
Some of our products and services contain open source software, which may pose particular risks to our proprietary software, products and services in a manner that could have a material and adverse effect on our business, financial condition and results of operations.
We use open source software in connection with our products and services and anticipate using open source software in the future. Some open source software licenses require users who distribute open source software as part of their own software product to publicly disclose all or part of the source code to such software product or to make available any derivative works of the open source code on unfavorable terms or at no cost, and we may be subject to such terms. The terms of certain open source licenses to which we are subject have not been interpreted by U.S. or foreign courts, and there is a risk that open source software licenses could be construed in a manner that imposes unanticipated conditions or restrictions on our ability to provide, or distribute the products or services related to, the open source software subject to those licenses. While we monitor our use of open source software and try to ensure that none is used in a manner that would require us to disclose our proprietary source code or that would otherwise breach the terms of an open source agreement, such use could inadvertently occur, or could be claimed to have occurred, in part because open source license terms are often ambiguous. Additionally, we could face claims from third parties claiming ownership of, or demanding release of, any open source software or derivative works that we have developed using such software, which could include proprietary source code, or otherwise seeking to enforce the terms of the applicable open source license. These claims could result in litigation and could require us to make our software source code freely available, purchase a costly license or cease offering the implicated products or services unless and until we can recode or reengineer such source code in a manner that avoids infringement. This reengineering process could require us to expend significant additional research and development resources, and we may not be able to complete the reengineering process successfully. In addition to risks related to license requirements, use of certain open source software can lead to greater risks than use of third-party commercial software, as open source licensors generally do not provide support, warranties, indemnification or other contractual protection regarding infringement claims or the quality of the code. There is little legal precedent in this area and any actual or claimed requirement to disclose our proprietary source code or pay damages for breach of contract could harm our business and could help third parties, including our competitors,
60
Table of Contents
develop products and services that are similar to or better than ours. Any of the foregoing could have a material adverse effect on our competitive position, business, financial condition and results of operations.
Our proprietary software may not operate properly, which could damage our reputation, give rise to claims against us or divert application of our resources from other purposes, any of which could harm our business.
Proprietary software development is time-consuming, expensive and complex, and may involve unforeseen difficulties. We may encounter technical obstacles, and it is possible that we may discover additional problems that prevent our proprietary applications, including our Weber Apps, cloud infrastructure, websites or other systems from operating properly. If our proprietary mobile applications do not function reliably or fail to achieve member or customer expectations in terms of performance, we may lose or fail to grow member usage and customers could assert liability claims against us. This could damage our reputation and impair our ability to attract or maintain relationships with customers and other third parties.
If we fail to comply with our obligations under license or technology agreements with third parties, we may be required to pay damages and we could lose license rights that are critical to our business.
We license certain intellectual property rights, including technologies, data, content and software from third parties, that is important to our business, and in the future we may enter into additional agreements that provide us with licenses to valuable intellectual property rights or technology. If we fail to comply with any of the obligations under our license agreements, we may be required to pay damages and the licensor may have the right to terminate the license. Termination by the licensor would cause us to lose valuable rights, and could prevent us from selling our products and services, or inhibit our ability to commercialize future products and services. Our business would suffer if any current or future licenses terminate, if the licensors fail to abide by the terms of the license, if the licensors fail to enforce licensed patents against infringing third parties, if the licensed intellectual property rights are found to be invalid or unenforceable, or if we are unable to enter into necessary licenses on acceptable terms. In addition, our rights to certain technologies are licensed to us on a nonexclusive basis. The owners of these non-exclusively licensed technologies are therefore free to license them to third parties, including our competitors, on terms that may be superior to those offered to us, which could place us at a competitive disadvantage. Moreover, our licensors may own or control intellectual property rights that have not been licensed to us and, as a result, we may be subject to claims, regardless of their merit, that we are infringing, misappropriating or otherwise violating the licensor’s rights. In addition, the agreements under which we license intellectual property rights or technology from third parties are generally complex, and certain provisions in such agreements may be susceptible to multiple interpretations. The resolution of any contract interpretation disagreement that may arise could narrow what we believe to be the scope of our rights to the relevant intellectual property rights or technology, or increase what we believe to be our financial or other obligations under the relevant agreement. Any of the foregoing could have a material adverse effect on our competitive position, business, financial condition, and results of operations.
Our collection, use, storage, transmission, disclosure and processing of personal information is subject to federal, state and international privacy and security regulations, and our failure to comply with those regulations or to adequately secure such information could result in significant liability or reputational harm and, in turn, substantial harm to our customer base and revenue.
In operating our business and providing products and services to customers, we collect, use, store, transmit, disclose and otherwise process sensitive employee and customer data, including
61
Table of Contents
personal information, in and across multiple jurisdictions, including, at times, across national borders. As a result, we are subject to a variety of laws and regulations in the U.S., Europe, the United Kingdom and around the world, as well as contractual obligations, regarding data privacy, security and protection. In many cases, these laws and regulations apply not only to third-party transactions, but also to transfers of information between or among us, our subsidiaries and other parties with which we have commercial relationships.
Personal privacy, information security and data protection are significant issues in the United States and globally. The regulatory framework governing the collection, use, storage, transmission, disclosure and processing of certain information, particularly financial and other personal information, is rapidly evolving and is likely to continue to be subject to uncertainty and varying interpretations. The occurrence of unanticipated events and development of evolving technologies often rapidly drives the adoption of legislation or regulations affecting the use, collection or other processing of data and manner in which we conduct our business. We publicly post documentation regarding our practices concerning the collection, use, storage, transmission, disclosure and processing of data. Although we endeavor to comply with our published policies and documentation, we may at times fail to do so or be alleged to have failed to do so. Any failure or perceived failure by us to comply with our privacy policies or any applicable privacy, security or data protection, information security or consumer protection-related laws, regulations, orders or industry standards in one or more jurisdictions could expose us to costly litigation, investigations, significant awards, fines or judgments, civil and/or criminal penalties or negative publicity, and could materially and adversely affect our business, financial condition and results of operations. The publication of our privacy policy and other documentation that provide promises and assurances about privacy and security can subject us to potential state and federal action if they are found to be deceptive, unfair or misrepresentative of our actual practices, which could materially and adversely affect our business, financial condition and results of operations.
We expect that there will continue to be new proposed and adopted laws, regulations and industry standards concerning privacy, data protection and information security in the U.S. and other jurisdictions in which we operate. Many states in which we operate have laws that protect the privacy and security of sensitive and personal information. Certain state laws may be more stringent or broader in scope, or offer greater individual rights, with respect to sensitive and personal information than federal, international or other state laws, and such laws may differ from each other, which may complicate compliance efforts. For example, California enacted the California Consumer Privacy Act of 2018 (“CCPA”) which went into effect in January 2020 and became enforceable by the California Attorney General in July 2020, and which, among other things, requires companies covered by the legislation to provide new disclosures to California residents and afford such residents new rights of access and deletion for personal information, as well as the right to opt-out of certain sales of personal information. The CCPA provides for civil penalties for violations, as well as a private right of action for certain data breaches that result in the loss of specified personal information of California residents. Additionally, a new California ballot initiative, the California Privacy Rights Act (“CPRA”) was passed in November 2020. Effective starting on January 1, 2023, the CPRA imposes additional obligations on companies covered by the legislation and will significantly modify the CCPA, including by expanding consumers’ rights with respect to certain sensitive personal information. The CPRA also creates a new state agency that will be vested with authority to implement and enforce the CCPA and the CPRA. The effects of the CCPA and the CPRA are potentially significant and may require us to modify our data collection or processing practices and policies and to incur substantial costs and expenses in an effort to comply and increase our potential exposure to regulatory enforcement and/or litigation.
Certain other state laws impose similar privacy obligations and all 50 states have laws including obligations to provide notification of security breaches of computer databases that contain personal information to affected individuals, state officers and others. For example, the CCPA has prompted a number of proposals for new federal and state-level privacy legislation, such as in Nevada, New
62
Table of Contents
Hampshire, Washington, Illinois and Nebraska, as well as in Virginia, which signed such legislation, the Virginia Consumer Data Protection Act (“VCDPA”), into law on March 2, 2021 with an effective date of January 1, 2023. The VCDPA and such other proposed legislation, if enacted, may add additional complexity, variation in requirements, restrictions and potential legal risk, require additional investment of resources in compliance programs, impact strategies and the availability of previously useful data and could result in increased compliance costs and/or changes in business practices and policies.
Internationally, many jurisdictions have established their own data security and privacy legal framework with which we or our customers may need to comply, including, but not limited to, the European Union, or EU. The EU’s data protection landscape is constantly changing and subject to differing interpretations, resulting in possible significant operational costs for internal compliance and risk to our business. For example, the EU has adopted the General Data Protection Regulation, or the GDPR, which went into effect in May of 2018, and has resulted and will continue to result in significantly greater compliance burdens and costs for companies with users and operations in the EU and European Economic Area, including robust obligations on data processors and heavier documentation requirements for data protection compliance programs by companies. In particular, under the GDPR, fines of up to 20 million euros or up to 4% of the annual global revenue of the noncompliant company, whichever is greater, could be imposed for violations of certain of the GDPR’s requirements. Such penalties are in addition to any civil litigation claims by customers and data subjects. The GDPR has also increased the scrutiny of transfers of personal data to the U.S. and other jurisdictions that the European Commission does not recognize as having “adequate” data protection laws. The efficacy and longevity of current transfer mechanisms to the U.S. remain uncertain. For example, in 2016, the EU and U.S. agreed to a transfer framework for data transferred to the U.S., called the Privacy Shield, but the Privacy Shield was invalidated in July 2020 by the Court of Justice of the European Union. Due to this evolving regulatory guidance, we may need to invest in additional technical, legal and organizational safeguards in the future to avoid disruptions to data flows within our business and to and from our customers and service providers. Furthermore, this uncertainty, and its eventual resolution, may increase our costs of compliance, impede our ability to transfer data and conduct our business, and harm our business or results of operations.
Because the interpretation and application of many privacy and data protection laws along with contractually imposed industry standards are uncertain, it is possible that these laws may be interpreted and applied in a manner that is inconsistent with our existing data management practices. Any failure or perceived failure by us, or any third parties with which we do business, to comply with our posted privacy policies, changing consumer expectations, evolving laws, rules and regulations, industry standards, or contractual obligations to which we or such third parties are or may become subject, may result in actions or other claims against us by governmental entities or private actors, the expenditure of substantial costs, time and other resources or the incurrence of significant fines, penalties or other liabilities. In addition, any such action, particularly to the extent we were found to be guilty of violations or otherwise liable for damages, would damage our reputation and adversely affect our business, financial condition and results of operations.
Following the United Kingdom’s withdrawal from the EU on January 31, 2020 and the end of the transitional period on December 31, 2020, the United Kingdom introduced the UK General Data Protection Regulation, which currently makes the privacy regimes of the EU and United Kingdom parallel in nature, though it is possible either the EU or the United Kingdom could elect to change its approach and create differences in legal requirements and regulation. The relationship between the United Kingdom and the EU in relation to certain aspects of data protection law remains unclear, for example, with respect to how data transfers between EU member states and the United Kingdom will be treated and the role of the United Kingdom’s Information Commissioner’s Office with respect to the EU following the end of the transitional period. Following the expiration of such period, there will be
63
Table of Contents
increasing scope for divergence in application, interpretation and enforcement of the data protection law as between the United Kingdom and the European Economic Area.
We cannot yet fully determine the long-term impact these or future laws, rules and regulations may have on our business or operations. Any such laws, rules and regulations may be inconsistent among different jurisdictions, subject to differing interpretations or may conflict with our current or future practices. Additionally, our customers may be subject to differing privacy laws, rules and legislation, which may mean that they require us to be bound by varying contractual requirements applicable to certain other jurisdictions. Adherence to such contractual requirements may impact our collection, use, processing, storage, sharing and disclosure of various types of information, including financial information and other personal information, and may cause us to become bound by, or to voluntarily comply with, self-regulatory or other industry standards relating to these matters that may further change as laws, rules and regulations evolve. Complying with these requirements and changing our policies and practices may be onerous and costly, and we may not be able to respond quickly or effectively to regulatory, legislative and other developments. These changes may in turn impair our ability to offer our existing or planned products and services and/or increase our cost of doing business. As we expand our customer base, these requirements may vary from customer to customer, further increasing the cost of compliance and doing business.
If we fail to comply with anti-corruption or economic sanction regulations, we could be subject to substantial fines or other penalties.
Some of the countries where we operate or where our products are sold may not have as strong a commitment to anti-corruption and ethical behavior that is required by U.S. laws or by our corporate policies. Any violation of the Foreign Corrupt Practices Act (“FCPA”) or any similar anti-corruption law or regulation could result in substantial fines, sanctions or civil and/or criminal penalties, debarment from business dealings with certain governments or government agencies or restrictions on the marketing of our products in certain countries, which could harm our business, financial condition or results of operations. If these anti-corruption laws or our internal policies were to be violated, our reputation and operations could also be substantially harmed. Further, detecting, investigating and resolving actual or alleged violations is expensive and can consume significant time and attention of our senior management.
Additionally, the U.S. Department of the Treasury’s Office of Foreign Assets Control and other relevant agencies of the U.S. government administer certain laws and regulations that restrict U.S. persons and, in some instances, non-U.S. persons, from conducting activities, transacting business with or making investments in certain countries, or with governments, entities and individuals subject to U.S. economic sanctions. Similar economic sanctions are imposed by the European Union and other jurisdictions. Our international operations subject us to these laws and regulations, which are complex, restrict our business dealings with certain countries, governments, entities and individuals and are constantly changing. Penalties for noncompliance with these complex laws and regulations can be significant and include substantial fines, sanctions or civil and/or criminal penalties and violations can result in adverse publicity, which could harm our business, financial condition or results of operations.
We are subject to environmental, health and safety and consumer product laws and regulations, which could subject us to liabilities, increase our costs or restrict our operations in the future.
Our properties and operations are subject to a number of environmental, health and safety laws and regulations in each of the jurisdictions in which we operate. These laws and regulations govern, among other things, air emissions, water discharges, handling and disposal of solid and hazardous substances and wastes, soil and groundwater contamination, employee health and safety and the
64
Table of Contents
chemical content of products. We expect to continue to incur costs to comply with these laws and regulations. If we fail to comply with these laws and regulations, we could incur substantial civil or criminal fines or penalties or enforcement actions, including regulatory or judicial orders enjoining or curtailing our operations or requiring us to conduct or fund remedial or corrective measures, install pollution control equipment or perform other actions. We may also be subject to joint and several liability for environmental investigations and cleanups, including at properties that we currently or previously owned or operated, or at sites at which waste we generated was disposed, even if the contamination was not caused by us or was legal at the time it occurred. We may face claims alleging harm to health or property or natural resource damages arising out of contamination or exposure to hazardous substances.
As a distributor of consumer products, certain of our products are subject to the U.S. Consumer Product Safety Act, which empowers the U.S. Consumer Product Safety Commission (CPSC) to exclude from the market products that are found to be unsafe or hazardous, and to similar laws in other jurisdictions. We are regularly subject to inquiries from regulators about product safety in the United States and in other countries. Under certain circumstances, the CPSC or other regulators could require us to repair, replace or refund the purchase price of one or more of our products, or potentially even discontinue entire product lines. We also may voluntarily take such action within strictures recommended by the CPSC or other regulators. The CPSC and other regulators also can impose fines or penalties on a manufacturer for noncompliance with its requirements. Furthermore, failure to timely notify the CPSC or other regulators of a potential safety hazard can result in significant fines being assessed. Any repurchases or recalls of our products or an imposition of fines or penalties could be costly to us and could damage the reputation or the value of our brands. Additionally, other laws regulating certain consumer products exist in certain states, as well as in other countries in which we sell our products.
In addition, future developments such as new and more restrictive, or changes to existing, environmental, health or safety laws and regulations, more aggressive enforcement of existing laws and regulations, or the discovery of presently unknown environmental conditions may require expenditures that could have an adverse effect on our business, financial condition, and results of operations.
Risks Related to Our Financial Condition
Our debt covenants may limit our ability to complete acquisitions, incur debt, make investments, sell assets, merge or complete other significant transactions.
Our credit facilities include limitations on a number of our activities in the event of a default, and in some cases regardless of whether a default has occurred, including our ability to:
| • | incur additional debt; |
| • | pay dividends or repurchase stock; |
| • | create liens on our assets or make guarantees; |
| • | enter certain transactions with affiliates; |
| • | make certain investments or loans; or |
| • | dispose of or sell assets, make acquisitions above certain amounts or enter into a merger or similar transaction. |
We are also required to comply with certain restrictive covenants in our credit facilities, any of which may limit our ability to engage in acts that may be in our best long-term interests. Additionally, a
65
Table of Contents
breach of any of the restrictive covenants in our credit facilities could result in a default under these facilities. If a default occurs while we have borrowing amounts outstanding, the lenders under our credit facilities may elect to declare all outstanding borrowings, together with accrued interest, to be immediately due and payable, to terminate any commitments they have to provide further borrowings and to exercise any other rights they have under the facilities or applicable law.
We rely on our free cash flow generation and credit facilities to provide us with sufficient working capital to operate our business and finance our growth strategies.
Historically, we have relied upon our free cash flow generation and existing credit facilities to provide us with adequate working capital to operate our business. Moreover, our growth rate depends, to a large degree, on the availability of adequate capital to fund the expansion of our products offerings and market penetration, which in turn will depend in large part on cash flow generated by our business and the availability of equity and debt capital. To the extent we become more dependent upon our credit facilities to fund our operations, if our lenders reduce or terminate our access to amounts under our credit facilities, we may not have sufficient capital to fund our working capital needs or growth strategies and/or we may need to secure additional capital or financing to fund our working capital requirements, to repay outstanding debt under our credit facilities or to finance our growth strategies. We can make no assurance that we will be successful in ensuring our availability of amounts under our credit facilities when they are needed or in connection with raising additional capital and that any amount, if raised, will be sufficient to meet our cash flow requirements. In the event we do not have available cash balances on hand for funding future operations, and if we are not able to maintain our borrowing availability under our credit facilities at that time and/or raise additional capital when needed, we may be forced to sharply curtail our efforts to manufacture and promote the sale of our products or to curtail our operations.
An increase in interest rates could have a material adverse effect on the Company’s business.
Fluctuations in interest rates can increase borrowing costs on the portion of our debt that is variable, and interest rate increases on this portion of the Company’s debt could have a material adverse effect on the Company’s business. Indeed, increases in interest rates would increase the cost of servicing our debt and could reduce our profitability and cash flows. In response to the last global economic recession, extraordinary monetary policy actions of the U.S. Federal Reserve and other central banking institutions, including the utilization of quantitative easing, were taken to create and maintain a low interest rate environment. However, the U.S. Federal Reserve raised its benchmark interest rate nine times since December 2015, including four times in 2018, each time by a quarter of a percentage point, before reducing interest rates in 2019 three times. In response to the COVID-19 pandemic, the U.S. Federal Reserve reduced its benchmark interest rate to 0% in March 2020 before voting in November 2020 to keep short-term interest rates anchored in a range between 0% and 0.25%. Any change in the fiscal policies or stated target interest rates of the U.S. Federal Reserve or other central banking institutions, or market expectations of such change, are difficult to predict and may result in significantly higher long-term interest rates. Such a transition may be abrupt and may, among other things, reduce the availability and/or increase the costs of obtaining new debt and refinancing existing indebtedness.
An increase in interest rates may also occur from changes in regulatory standards or industry practices, such as the contemplated transition away from the London Interbank Offered Rate (“LIBOR”) as a benchmark reference for short-term interest rates. Such a transition may result in the usage of a higher reference rate for our variable rate debt. The U.S. Federal Reserve has sponsored the Alternative Reference Rates Committee (“ARRC”), which serves as a forum to coordinate and track planning as market participants currently using LIBOR consider (a) transitioning to alternative reference rates where it is deemed appropriate and (b) addressing risks in legacy contracts’ language
66
Table of Contents
given the possibility that LIBOR might stop. On April 3, 2018, the U.S. Federal Reserve began publishing three new reference rates, including the Secured Overnight Financing Rate (“SOFR”). SOFR is observed and backward looking, which stands in contrast with LIBOR under the current methodology, which is an estimated forward-looking rate and relies, to some degree, on the expert judgment of submitting panel members. Given that SOFR is a secured rate backed by government securities, it will be a rate that does not take into account bank credit risk (as is the case with LIBOR). SOFR is therefore likely to be lower than LIBOR and is less likely to correlate with the funding costs of financial institutions. ARRC has recommended SOFR as the alternative to LIBOR and published fallback interest rate consultations for public comment and a Paced Transition Plan to SOFR use. The Financial Stability Board has taken an interest in LIBOR and possible replacement indices as a matter of risk management. The International Organization of Securities Commissions, or IOSCO, has been active in this area and is expected to call on market participants to have backup options if a reference rate, such as LIBOR, ceases publication. The International Swaps and Derivatives Association (“ISDA”) has published guidance on interest rate benchmarks and alternatives in July and August 2018. ISDA also published a protocol providing details of the fallback rate conversion methodology in October 2020. It cannot be predicted whether SOFR or another index or indices will become a market standard that replaces LIBOR, and if so, the effects on our future results of operations or financial condition. In a November 30, 2020 announcement, LIBOR’s administrator signaled to the market that USD LIBOR for the most liquid maturities is now likely to continue to be published until June 30, 2023, which would allow time for certain legacy contracts to mature before USD LIBOR is no longer available, and would also allow for more time for SOFR to develop. If LIBOR ceases to exist prior to the maturity of our contracts, we may need to renegotiate our credit agreements that utilize LIBOR as a factor in determining the interest rate to replace LIBOR with the new standard that is established.
Risks Related to Our Organizational Structure
We are a holding company and our principal asset after completion of this offering will be our 26% ownership interest in Weber HoldCo LLC, and we are accordingly dependent upon distributions from Weber HoldCo LLC to pay dividends, if any, and taxes, make payments under the Tax Receivable Agreement and pay other expenses.
We are a holding company and, upon completion of the Reorganization Transactions and this offering, our principal asset will be 26% of the outstanding LLC Units. See “Organizational Structure.” We have no independent means of generating income from operations. Weber HoldCo LLC is, and will continue to be, treated as a partnership for U.S. federal income tax purposes and, as such, will not be subject to U.S. federal income tax. Instead, the taxable income of Weber HoldCo LLC will be allocated to holders of LLC Units, including us. Accordingly, we will incur income taxes on our allocable share of any net taxable income of Weber HoldCo LLC. We will also incur expenses related to our operations, and will have obligations to make payments under the Tax Receivable Agreement. As the sole managing member of Weber HoldCo LLC, we intend to cause Weber HoldCo LLC to make distributions to the holders of LLC Units and us, in amounts sufficient to (i) generally cover all applicable taxes payable by us and the holders of LLC Units, (ii) allow us to make any payments required under the Tax Receivable Agreement we intend to enter into in connection with this offering, (iii) fund dividends to our stockholders in accordance with our dividend policy, to the extent that our board of directors declares such dividends and (iv) pay our expenses.
Deterioration in the financial conditions, earnings or cash flow of Weber HoldCo LLC and its subsidiaries for any reason could limit or impair their ability to pay such distributions. Additionally, to the extent that we need funds and Weber HoldCo LLC is restricted from making such distributions to us under applicable law or regulation, as a result of covenants in its debt agreements or otherwise, we may not be able to obtain such funds on terms acceptable to us, or at all, and, as a result, could suffer a material adverse effect on our liquidity and financial condition.
67
Table of Contents
In certain circumstances, Weber HoldCo LLC will be required to make distributions to us and the other holders of LLC Units, and the distributions that Weber HoldCo LLC will be required to make may be substantial.
Under the Amended LLC Agreement, Weber HoldCo LLC will generally be required from time to time to make pro rata distributions in cash to us and the other holders of LLC Units at certain assumed tax rates in amounts that are intended to be sufficient to cover the taxes on our and the other LLC Unit holders’ respective allocable shares of the taxable income of Weber HoldCo LLC. As a result of (i) potential differences in the amount of net taxable income allocable to us and the other LLC Unit holders, (ii) the lower tax rate applicable to corporations than individuals and (iii) the favorable tax benefits that we anticipate receiving from (a) acquisitions of interests in Weber HoldCo LLC in connection with acquisitions by Weber Inc. of LLC Units from certain of our existing equityholders in connection with this offering and future taxable redemptions or exchanges of LLC Units for shares of our Class A common stock or cash and (b) payments under the Tax Receivable Agreement, we expect that these tax distributions will be in amounts that exceed our tax liabilities and obligations to make payments under the Tax Receivable Agreement. Our board of directors will determine the appropriate uses for any excess cash so accumulated, which may include, among other uses, dividends, repurchases of our Class A common stock and the payment of other expenses. While we intend to distribute this excess cash to our shareholders as dividends pursuant to our dividend policy, we will have no obligation to distribute such cash (or other available cash other than any declared dividend) to our stockholders. No adjustments to the redemption or exchange ratio of LLC Units for shares of Class A common stock will be made as a result of either (i) any cash distribution by us or (ii) any cash that we retain and do not distribute to our stockholders. To the extent that we do not distribute such excess cash as dividends on our Class A common stock and instead, for example, hold such cash balances or lend them to Weber HoldCo LLC, holders of LLC Units would benefit from any value attributable to such cash balances as a result of their ownership of Class A common stock following a redemption or exchange of their LLC Units. See “Certain Relationships and Related Party Transactions—Amended LLC Agreement.”
We are controlled by the Pre-IPO LLC Members whose interests in our business may be different than yours, and certain statutory provisions afforded to stockholders are not applicable to us.
The Pre-IPO LLC Members will control approximately 74% of the combined voting power of our common stock (or 71% if the underwriters exercise their option to purchase additional shares of Class A common stock in full) after the completion of this offering and the application of the net proceeds from this offering. Further, pursuant to the Stockholders Agreement, we and the Pre-IPO LLC Members will enter into, the Pre-IPO LLC Members may approve or disapprove our change of control transactions, including mergers or amalgamations, consolidations or a sale of all or substantially all assets and any dissolution, liquidation or reorganization of us or our subsidiaries. In addition, the Stockholders Agreement will provide that approval by the Pre-IPO LLC Members is required for changes to the strategic direction or scope of our principal business or that of Weber HoldCo LLC. Furthermore, the Stockholders Agreement will provide that, until the Pre-IPO LLC members beneficially hold at least a majority of the aggregate outstanding shares of our common stock, which we refer to as the “Majority Ownership Requirement,” the Pre-IPO LLC Members may designate a majority of the nominees for election to our board of directors, including the nominee for election to serve as Chair of our board of directors; even after the Majority Ownership Requirement is no longer met, Pre-IPO LLC Members can continue to retain certain designation rights under the Stockholders Agreement proportionate to their percentage ownership in our common stock. See “Certain Relationships and Related Party Transactions—Stockholders Agreement.”
This concentration of ownership and voting power may also delay, defer or even prevent an acquisition by a third party or other change of control of our company, which could deprive you of an
68
Table of Contents
opportunity to receive a premium for your shares of Class A common stock and may make some transactions more difficult or impossible without the support of the Pre-IPO LLC Members, even if such events are in the best interests of minority stockholders. Furthermore, this concentration of voting power with the Pre-IPO LLC Members may have a negative impact on the price of our Class A common stock.
We cannot predict whether our dual-class structure, combined with the concentrated control of the Pre-IPO LLC Members, will result in a lower or more volatile market price of our Class A common stock or in adverse publicity or other adverse consequences. For example, certain index providers have announced restrictions on including companies with multiple-class share structures in certain of their indexes. In July 2017, FTSE Russell announced that it plans to require new constituents of its indexes to have greater than 5% of the company’s voting rights in the hands of public stockholders, and S&P Dow Jones announced that it will no longer admit companies with multiple-class share structures to certain of its indexes. Because of our dual-class structure, we will likely be excluded from these indexes and we cannot assure you that other stock indexes will not take similar actions. Given the sustained flow of investment funds into passive strategies that seek to track certain indexes, exclusion from stock indexes would likely preclude investment by many of these funds and could make our Class A common stock less attractive to other investors. As a result, the market price of our Class A common stock could be adversely affected.
The Pre-IPO LLC Members’ interests may not be fully aligned with yours, which could lead to actions that are not in your best interests. Because the Pre-IPO LLC Members hold a majority of their economic interests in our business through Weber HoldCo LLC rather than through Weber Inc., they may have conflicting interests with holders of shares of our Class A common stock. For example, the Pre-IPO LLC Members may have a different tax position from us, which could influence their decisions regarding whether and when we should dispose of assets or incur new or refinance existing indebtedness, especially in light of the existence of the Tax Receivable Agreement that we will enter into in connection with this offering, and whether and when we should undergo certain changes of control for purposes of the Tax Receivable Agreement or terminate the Tax Receivable Agreement. In addition, the structuring of future transactions may take into consideration these tax or other considerations even where no similar benefit would accrue to us. Pursuant to the Bipartisan Budget Act of 2015, for tax years beginning after December 31, 2017, if the IRS makes audit adjustments to Weber HoldCo LLC’s federal income tax returns, it may assess and collect any taxes (including any applicable penalties and interest) resulting from such audit adjustment directly from Weber HoldCo LLC. If, as a result of any such audit adjustment, Weber HoldCo LLC is required to make payments of taxes, penalties and interest, Weber HoldCo LLC’s cash available for distributions to us may be substantially reduced. These rules are not applicable to Weber HoldCo LLC for tax years beginning on or prior to December 31, 2017. See “Certain Relationships and Related Party Transactions—Tax Receivable Agreement.” In addition, the Pre-IPO LLC Members’ significant ownership in us and resulting ability to effectively control us may discourage someone from making a significant equity investment in us, or could discourage transactions involving a change in control, including transactions in which you as a holder of shares of our Class A common stock might otherwise receive a premium for your shares over the then-current market price.
We have opted out of Section 203 of the General Corporation Law of the State of Delaware, or DGCL, which prohibits a publicly held Delaware corporation from engaging in a business combination transaction with an interested stockholder for a period of three years after the interested stockholder became such unless the transaction fits within an applicable exemption, such as board approval of the business combination or the transaction which resulted in such stockholder becoming an interested stockholder. Therefore, after the 180-day lock-up period expires, the Pre-IPO LLC Members will be able to transfer control of us to a third party by transferring their shares of our common stock (subject
69
Table of Contents
to certain restrictions and limitations), which would not require the approval of our board of directors or our other stockholders.
The doctrine of “corporate opportunity” will not apply with respect to the Pre-IPO LLC Members and our directors who are not employed by us or our subsidiaries, and their respective affiliates.
Pursuant to our certificate of incorporation, to the fullest extent permitted by law, we will waive, on behalf of ourselves and our subsidiaries, the doctrine of “corporate opportunity” under Delaware law will only apply against the Pre-IPO LLC Members and directors who are not employed by us or our subsidiaries, and their respective affiliates. See “Description of Capital Stock—Corporate Opportunity.” The doctrine of corporate opportunity generally requires, among other things, a corporation’s fiduciary to refrain from engaging in corporate opportunities that are in lines of business reasonably similar to the present or prospective business of such corporation, unless that opportunity is first presented to the corporation and the corporation chooses not to pursue that opportunity. As a result of our waiver, certain of our stockholders, directors and their respective affiliates will not be prohibited from operating or investing in competing businesses. We, therefore, may find ourselves in competition with certain of our stockholders, directors or their respective affiliates, and we may not have knowledge of, or be able to pursue, transactions that could potentially be beneficial to us. Accordingly, we may lose a corporate opportunity or suffer competitive harm, which could negatively impact our business, financial condition, results of operations and cash flow.
We will be a “controlled company” within the meaning of the NYSE rules and, as a result, qualify for, and will rely on, exemptions from certain corporate governance requirements that provide protection to the stockholders of companies that are subject to such corporate governance requirements.
Upon completion of this offering, BDT Capital Partners LLC will continue to beneficially own more than 50% of the voting power for the election of members of our board of directors. As a result, we will be a “controlled company” within the meaning of the corporate governance standards of the NYSE rules. Under these rules, a listed company of which more than 50% of the voting power is held by an individual, group or another company is a “controlled company” and may elect not to comply with certain NYSE corporate governance requirements.
As a controlled company, we will rely on certain exemptions from the NYSE standards that may enable us not to comply with certain NYSE corporate governance requirements. Accordingly, we will not have a nominating and corporate governance committee. As a consequence of our reliance on certain exemptions from the NYSE standards provided to “controlled companies,” you will not have the same protections afforded to stockholders of companies that are subject to all of the corporate governance requirements of the NYSE. See “Management—Controlled Company Exception.”
We will be required to pay the Pre-IPO LLC Members and any other persons that become parties to the Tax Receivable Agreement for certain tax benefits we may receive, and the amounts we may pay could be significant.
As described under “Organizational Structure,” acquisitions by Weber Inc. of LLC Units from certain of our existing equityholders in connection with this offering and future taxable redemptions or exchanges by the Pre-IPO LLC Members of LLC Units for shares of our Class A common stock or cash, as well as other transactions described herein, are expected to result in tax basis adjustments to the assets of Weber HoldCo LLC. These tax basis adjustments generated over time may increase (for tax purposes) the depreciation and amortization deductions available to Weber Inc. and, therefore,
70
Table of Contents
may reduce the amount of U.S. federal, state and local tax that Weber Inc. would otherwise be required to pay in the future. These tax attributes would not be available to us in the absence of those transactions. The anticipated tax basis adjustments are expected to reduce the amount of tax that we would otherwise be required to pay in the future.
We intend to enter into the Tax Receivable Agreement with the Pre-IPO LLC Members that will provide for the payment by us to the Pre-IPO LLC Members of 85% of the amount of cash savings, if any, in U.S. federal, state and local income tax or franchise tax that we actually realize as a result of (i) Weber Inc.’s allocable share of certain existing tax basis in tangible and intangible assets related to certain transactions that resulted in a step-up in Weber HoldCo LLC’s tax basis, (ii) any increase in tax basis in Weber Inc.’s assets resulting from (a) acquisitions by Weber Inc. of LLC Units from the Pre-IPO LLC Members in connection with this offering, (b) the purchase of LLC Units from any of the Pre-IPO LLC Members using the net proceeds from any future offering, (c) redemptions or exchanges by the Pre-IPO LLC Members of LLC Units for shares of our Class A common stock or cash or (d) payments under the Tax Receivable Agreement and (iii) tax benefits related to imputed interest resulting from payments made under the Tax Receivable Agreement. The payment obligations under the Tax Receivable Agreement are our obligations and not obligations of Weber HoldCo LLC.
We expect that, as a result of the increases in the tax basis of the tangible and intangible assets of Weber HoldCo LLC attributable to the redeemed or exchanged LLC Units, the payments that we may make to the existing Pre-IPO LLC Members could be substantial. For example, if we acquired all of the LLC Units of the Pre-IPO LLC Members in taxable transactions as of this offering, based on an initial public offering price of $16.00 per share (the midpoint of the estimated initial public offering price range set forth on the cover page of this prospectus) and on certain assumptions, including that (i) there are no material changes in relevant tax law and (ii) we earn sufficient taxable income in each year to realize on a current basis all tax benefits that are subject to the Tax Receivable Agreement, we expect that the resulting reduction in tax payments for us, as determined for purposes of the Tax Receivable Agreement, would aggregate to approximately $1,404.2 million, substantially all of which would be realized over the next 15 years, and we would be required to pay the Pre-IPO LLC Members 85% of such amount, or $1,193.6 million, over the same period. The actual increases in tax basis with respect to future taxable redemptions, exchanges or purchases of LLC Units, as well as the amount and timing of any payments we are required to make under the Tax Receivable Agreement in respect of the acquisition of LLC Units from Pre-IPO LLC Members in connection with this offering or future taxable redemptions, exchanges or purchases of LLC Units, may differ materially from the amounts set forth above because the potential future reductions in our tax payments, as determined for purposes of the Tax Receivable Agreement, and the payments we will be required to make under the Tax Receivable Agreement, will each depend on a number of factors, including the market value of our Class A common stock at the time of redemption or exchange, the prevailing federal tax rates applicable to us over the life of the Tax Receivable Agreement (as well as the assumed combined state and local tax rate), the amount and timing of the taxable income that we generate in the future and the extent to which future redemptions, exchanges or purchases of LLC Units are taxable transactions.
Payments under the Tax Receivable Agreement are not conditioned on the Pre-IPO LLC Members’ continued ownership of us. There may be a material negative effect on our liquidity if, as described below, the payments under the Tax Receivable Agreement exceed the actual benefits we receive in respect of the tax attributes subject to the Tax Receivable Agreement and/or distributions to us by Weber HoldCo LLC are not sufficient to permit us to make payments under the Tax Receivable Agreement.
In addition, the Pre-IPO LLC Members will not reimburse us for any payments previously made if such tax basis increases or other tax benefits are subsequently disallowed by the Internal Revenue Service (“IRS”), except that any excess payments made to the Pre-IPO LLC Members will be netted against future payments otherwise to be made under the Tax Receivable Agreement, if any, after our determination of such excess. As a result, in such circumstances, we could make payments to the
71
Table of Contents
Pre-IPO LLC Members under the Tax Receivable Agreement that are greater than our actual cash tax savings and we may not be able to recoup those payments, which could negatively impact our liquidity.
In addition, the Tax Receivable Agreement provides that, upon certain mergers, asset sales or other forms of business combination, or certain other changes of control, our or our successor’s obligations with respect to tax benefits would be based on certain assumptions, including that we or our successor would have sufficient taxable income to fully utilize the increased tax deductions and tax basis and other benefits covered by the Tax Receivable Agreement. As a result, upon a change of control, we could be required to make payments under the Tax Receivable Agreement that are greater than the specified percentage of our actual cash tax savings, which could negatively impact our liquidity.
This provision of the Tax Receivable Agreement may result in situations where the Pre-IPO LLC Members have interests that differ from or are in addition to those of our other stockholders. In addition, we could be required to make payments under the Tax Receivable Agreement that are substantial and in excess of our, or a potential acquirer’s, actual cash savings in income tax.
Our obligations under the Tax Receivable Agreement will also apply with respect to any person who is issued LLC Units in the future and who becomes a party to the Tax Receivable Agreement.
Finally, because we are a holding company with no operations of our own, our ability to make payments under the Tax Receivable Agreement depends on the ability of Weber HoldCo LLC to make distributions to us. To the extent that we are unable to make payments under the Tax Receivable Agreement for any reason, such payments will be deferred and will accrue interest until paid, which could negatively impact our results of operations and could also affect our liquidity in periods in which such payments are made.
Risks Related to This Offering and Ownership of Our Class A Common Stock
There is no existing market for our Class A common stock, and we do not know if one will develop, which may cause our Class A common stock to trade at a discount from its initial public offering price and make it difficult for you to sell the shares you purchase.
Prior to this offering, there has not been a public market for our Class A common stock, and we cannot predict the extent to which investor interest in us will lead to the development of an active trading market on the NYSE, or otherwise, or how liquid that market might become. If an active trading market does not develop, you may have difficulty selling your shares of Class A common stock at an attractive price, or at all. The initial public offering price for our Class A common stock will be determined by negotiations between us and the underwriters and may not be indicative of prices that will prevail in the open market following this offering. Consequently, you may not be able to sell shares of our Class A common stock at prices equal to or greater than the price you paid in this offering.
Some provisions of Delaware law and our certificate of incorporation and bylaws may deter third parties from acquiring us and diminish the value of our Class A common stock.
Our certificate of incorporation and bylaws provide for, among other things:
| • | division of our board of directors into three classes of directors, with each class as equal in number as possible, serving staggered three-year terms; |
| • | until the Majority Ownership Requirement is no longer met, the Pre-IPO LLC Members may designate a majority of the nominees for election to our board of directors, including the nominee for election to serve as Chair of our board of directors; |
72
Table of Contents
| • | at any time after the Majority Ownership Requirement is no longer met, there will be: |
| — | restrictions on the ability of our stockholders to call a special meeting and the business that can be conducted at such meeting or to act by written consent; |
| — | supermajority approval requirements for amending or repealing certain provisions in the certificate of incorporation and bylaws; |
| — | removal of directors only for cause and by the affirmative vote of holders of 75% of the total voting power of our outstanding shares of common stock, voting together as a single class; and |
| — | a prohibition on business combinations with interested shareholders under Section 203 of the DGCL; |
| • | our ability to issue additional shares of Class A common stock and to issue preferred stock with terms that our board of directors may determine, in each case without stockholder approval (other than as specified in our certificate of incorporation); |
| • | the absence of cumulative voting in the election of directors; and |
| • | advance notice requirements for stockholder proposals and nominations. |
These provisions in our certificate of incorporation and bylaws may discourage, delay or prevent a transaction involving a change in control of our company that is in the best interest of our minority stockholders. Even in the absence of a takeover attempt, the existence of these provisions may adversely affect the prevailing market price of our Class A common stock if they are viewed as discouraging future takeover attempts. These provisions could also make it more difficult for stockholders to nominate directors for election to our board of directors and take other corporate actions.
If a substantial number of shares become available for sale and are sold in a short period of time, the market price of our Class A common stock could decline.
Upon the consummation of this offering, we will have 75,373,197 shares of Class A common stock outstanding (or 81,542,982 shares if the underwriters exercise their option to purchase additional shares of Class A common stock in full), excluding 209,573,267 shares of Class A common stock issuable upon potential redemptions or exchanges. Of these shares of Class A common stock, the 46,875,000 shares of Class A common stock being sold in this offering, plus any shares sold upon exercise of the underwriters’ option to purchase additional shares, will be freely tradable without further restriction or registration under the Securities Act of 1933, or the Securities Act. Upon completion of this offering, the 238,071,464 shares of Class A common stock issued to the Blocker equityholders in the Reorganization Transactions or issuable upon potential redemption or exchange of LLC Units will be deemed “restricted securities” as that term is defined under Rule 144 of the Securities Act. Following the consummation of this offering, the holders of these remaining shares of our Class A common stock will be entitled to dispose of their shares following the expiration of an initial 180-day underwriter “lock-up” period pursuant to (i) the applicable holding period, volume and other restrictions of Rule 144 or (ii) another exemption from registration under the Securities Act. See “Shares Eligible for Future Sale.” If these additional shares are sold, or if it is perceived that they will be sold, in the public market, the trading price of our common stock could decline substantially.
We expect that our stock price will be volatile, which could cause the value of your investment to decline, and you may not be able to resell your shares at or above the initial public offering price.
Securities markets worldwide have experienced, and are likely to continue to experience, significant price and volume fluctuations. This market volatility, as well as general economic, market or
73
Table of Contents
political conditions, could reduce the market price of our Class A common stock regardless of our results of operations. The trading price of our Class A common stock is likely to be volatile and subject to wide price fluctuations in response to various factors, including:
| • | market conditions in the broader stock market in general, or in our industry in particular; |
| • | actual or anticipated fluctuations in our quarterly financial and results of operations; |
| • | introduction of new products and services by us or our competitors; |
| • | issuance of new or changed securities analysts’ reports or recommendations; |
| • | investor perceptions of us and the industries in which we or our clients operate; |
| • | sales, or anticipated sales, of large blocks of our Class A common stock, including those by our existing investors; |
| • | additions or departures of key personnel; |
| • | regulatory or political developments; |
| • | litigation and governmental investigations; and |
| • | changing economic and political conditions. |
These and other factors may cause the market price and demand for shares of our Class A common stock to fluctuate substantially, which may limit or prevent investors from readily selling their shares of Class A common stock and may otherwise negatively affect the liquidity of our Class A common stock. In addition, in the past, when the market price of a stock has been volatile, holders of that stock have sometimes instituted securities class action litigation against the company that issued the stock. If any of our stockholders brought a lawsuit against us, we could incur substantial costs defending the lawsuit. Such a lawsuit could also divert the time and attention of our management from our business, which could significantly harm our profitability and reputation.
Our ability to pay dividends to our stockholders may be limited by our holding company structure, contractual restrictions and regulatory requirements.
After this offering, we will be a holding company and will have no material assets other than our ownership of LLC Units in Weber HoldCo LLC, and we will not have any independent means of generating income from operations. We intend to cause Weber HoldCo LLC to make pro rata distributions to the Pre-IPO LLC Members and us in an amount at least sufficient to allow us and the Pre-IPO LLC Members to generally pay all applicable taxes, to make payments under the Tax Receivable Agreement we will enter into with the Pre-IPO LLC Members and to pay our corporate and other overhead expenses. Weber HoldCo LLC is a distinct legal entity and may be subject to legal or contractual restrictions that, under certain circumstances, may limit our ability to obtain cash from them. If Weber HoldCo LLC is unable to make distributions, we may not receive adequate distributions, which could materially and adversely affect our dividends and financial position and our ability to fund any dividends.
Our board of directors will periodically review the cash generated from our business and the capital expenditures required to finance our global growth plans and determine whether to declare periodic dividends to our stockholders. Our board of directors will take into account general economic and business conditions, including our financial condition and results of operations, capital requirements, contractual restrictions, including restrictions and covenants contained in our credit agreement, business prospects and other factors that our board of directors considers relevant. In addition, the credit agreement limits the amount of distributions that Weber HoldCo LLC can make to us and the purposes for which distributions could be made. Accordingly, we may not be able to pay
74
Table of Contents
dividends even if our board of directors would otherwise deem it appropriate. See “Dividend Policy,” “Management’s Discussion and Analysis of Financial Condition and Results of Operations—Liquidity and Capital Resources” and “Description of Capital Stock.”
New investors in our Class A common stock will experience immediate and substantial book value dilution after this offering.
The initial public offering price of our Class A common stock will be substantially higher than the pro forma net tangible book value per share of the outstanding Class A common stock immediately after the offering. Based on our pro forma net tangible book value as of March 31, 2021, if you purchase our Class A common stock in this offering at the initial public offering price set forth on the cover page of this prospectus, you will suffer immediate dilution in net tangible book value per share of approximately $18.63 per share. See “Dilution.”
If securities analysts do not publish research or reports about our business or if they publish negative evaluations of our Class A common stock, the price of our Class A common stock could decline.
The trading market for our Class A common stock will rely in part on the research and reports that industry or securities analysts publish about us or our business. We do not currently have and may never obtain research coverage by industry or securities analysts. If no or few analysts commence coverage of us, the trading price of our Class A common stock would likely decrease. Even if we do obtain analyst coverage, if one or more of the analysts covering our business downgrade their evaluations of our Class A common stock, the price of our Class A common stock could decline. If one or more of these analysts cease to cover our Class A common stock, we could lose visibility in the trading market for our Class A common stock, which in turn could cause our Class A common stock price to decline.
We will incur increased costs and become subject to additional regulations and requirements as a result of becoming a public company, and our management will be required to devote substantial time to new compliance matters, which could lower profits or make it more difficult to run our business.
As a public company, we expect to incur significant legal, accounting, reporting and other expenses that we have not incurred as a private company, including costs associated with public company reporting requirements and costs of recruiting and retaining non-executive directors. We also have incurred and will incur costs associated with compliance with the Sarbanes-Oxley Act and rules and regulations of the SEC, and various other costs of a public company. The expenses incurred by public companies generally for reporting and corporate governance purposes have been increasing. We expect these rules and regulations to increase our legal and financial compliance costs and to make some activities more time consuming and costly, although we are currently unable to estimate these costs with any degree of certainty. Our management will need to devote a substantial amount of time to ensure that we comply with all of these requirements. Furthermore, because we have not operated as a company with publicly traded common stock in the past, we might not be successful in implementing these requirements.
In addition, changing laws, regulations and standards relating to corporate governance and public disclosure are creating uncertainty for public companies, increasing legal and financial compliance costs and making some activities more time consuming. These laws, regulations and standards are subject to varying interpretations, in many cases due to their lack of specificity, and, as a result, their application in practice may evolve over time as new guidance is provided by regulatory and governing bodies. This could result in continuing uncertainty regarding compliance matters and higher costs
75
Table of Contents
necessitated by ongoing revisions to disclosure and governance practices. We intend to invest resources to comply with evolving laws, regulations and standards, and this investment may result in increased general and administrative expenses and a diversion of management’s time and attention from revenue-generating activities to compliance activities. If our efforts to comply with new laws, regulations and standards differ from the activities intended by regulatory or governing bodies due to ambiguities related to practice, regulatory authorities may initiate legal proceedings against us, which could have an adverse effect on our business, financial condition and results of operations.
These laws and regulations also could make it more difficult or costly for us to obtain certain types of insurance, including director and officer liability insurance, and we may be forced to accept reduced policy limits and coverage or incur substantially higher costs to obtain the same or similar coverage. These laws and regulations could also make it more difficult to attract and retain qualified persons to serve on our board of directors, our board committees or as executive officers. Furthermore, if we are unable to satisfy our obligations as a public company, we could be subject to delisting of our Class A common stock, fines, sanctions and other regulatory action and potentially civil litigation.
Failure to comply with the requirements to design, implement and maintain effective internal controls could have a material adverse effect on our business and stock price.
As a public company, we will have significant requirements for enhanced financial reporting and internal controls. The process of designing and implementing effective internal controls is a continuous effort that requires us to anticipate and react to changes in our business and the economic and regulatory environments and to expend significant resources to maintain a system of internal controls that is adequate to satisfy our reporting obligations as a public company.
If we are unable to establish or maintain appropriate internal financial reporting controls and procedures, it could cause us to fail to meet our reporting obligations on a timely basis, result in material misstatements in our consolidated financial statements and harm our operating results. In addition, we will be required pursuant to Section 404 of the Sarbanes-Oxley Act, or Section 404, to furnish a report by management on, among other things, the effectiveness of our internal control over financial reporting for the first fiscal year beginning after the effective date of this offering. This assessment will need to include disclosure of any material weaknesses identified by our management in an internal control over financial reporting. In addition, our independent registered public accounting firm will be required to formally attest to the effectiveness of our internal control over financial reporting pursuant to Section 404(b) commencing the year following our first annual report required to be filed with the SEC. Testing and maintaining internal controls may divert our management’s attention from other matters that are important to our business. We may not be able to conclude on an ongoing basis that we have effective internal control over financial reporting in accordance with Section 404 or our independent registered public accounting firm may not issue an unqualified opinion. If either we are unable to conclude that we have effective internal control over financial reporting or our independent registered public accounting firm is unable to provide us with an unqualified report, investors could lose confidence in our reported financial information, which could cause the price of our common stock to decline, and we may be subject to investigation or sanctions by the SEC.
The provision of our amended and restated certificate of incorporation requiring exclusive forum in certain courts in the State of Delaware or the federal district courts of the United States for certain types of lawsuits may have the effect of discouraging lawsuits against our directors and officers.
Our amended and restated certificate of incorporation will provide that, unless we, in writing, select or consent to the selection of an alternative forum, all complaints asserting any internal
76
Table of Contents
corporate claims (defined as claims, including claims in the right of our company: (i) that are based upon a violation of a duty by a current or former director, officer, employee, or stockholder in such capacity; or (ii) as to which the DGCL confers jurisdiction upon the Court of Chancery), to the fullest extent permitted by law, and subject to applicable jurisdictional requirements, shall be the Court of Chancery of the State of Delaware (or, if the Court of Chancery does not have, or declines to accept, subject matter jurisdiction, another state court or a federal court located within the State of Delaware). Additionally, unless we consent in writing to the selection of an alternative forum, the federal district courts of the United States shall be the exclusive forum for the resolution of any complaint asserting a cause of action arising under the Securities Act. Our choice-of-forum provision will not apply to suits brought to enforce any liability or duty created by the Exchange Act. Any person or entity purchasing or otherwise acquiring or holding any interest in our common stock shall be deemed to have notice of and to have consented to the forum selection provisions described in our amended and restated certificate of incorporation. Although we believe these exclusive forum provisions benefit us by providing increased consistency in the application of Delaware law and federal securities laws in the types of lawsuits to which each applies, the exclusive forum provisions may limit a stockholder’s ability to bring a claim in a judicial forum that it finds favorable for disputes with us or any of our directors, officers, or stockholders, which may discourage lawsuits with respect to such claims. Our stockholders will not be deemed to have waived our compliance with the federal securities laws and the rules and regulations thereunder as a result of our exclusive forum provisions. Further, in the event a court finds either exclusive forum provision contained in our certificate of incorporation to be unenforceable or inapplicable in an action, we may incur additional costs associated with resolving such action in other jurisdictions, which could harm our business, operating results and financial condition.
General Risk Factors
Our future success depends on the continuing efforts of our management team and key employees, and on our ability to attract and retain highly skilled personnel and senior management.
We depend on the talents and continued efforts of our senior management and key employees. The loss of members of our management or key employees may disrupt our business and harm our results of operations. Furthermore, our ability to manage further expansion will require us to continue to attract, motivate, and retain additional qualified personnel. Competition for this type of personnel is intense, and we may not be successful in attracting, integrating, and retaining the personnel required to grow and operate our business effectively. There can be no assurance that our current management team or any new members of our management team will be able to successfully execute our business and operating strategies.
We are subject to many hazards and operational risks that can disrupt our business, some of which may not be insured or fully covered by insurance.
Our operations are subject to many hazards and operational risks inherent to our business, including: (a) general business risks; (b) product liability; (c) product recall; and (d) damage to third parties (e.g., our vendors), our infrastructure, or properties caused by fires, floods and other natural disasters, power losses, telecommunications failures, terrorist attacks, riots, cyberattacks, public health crises such as the current COVID-19 pandemic (and other future pandemics or epidemics), human errors, and similar events.
Our insurance coverage may be inadequate to cover our liabilities related to such hazards or operational risks. For example, we do not currently maintain cybersecurity insurance and our insurance providers may take the position that our coverage, under present circumstances, does not extend to business interruptions as they relate to the COVID-19 pandemic. In addition, we may not be able to
77
Table of Contents
maintain adequate insurance in the future at rates we consider reasonable and commercially justifiable, and insurance may not continue to be available on terms as favorable as our current arrangements. The occurrence of a significant uninsured claim or a claim in excess of the insurance coverage limits maintained by us could harm our business, results of operations, and financial condition.
We face risks associated with our increased presence in emerging markets.
Our growth plans include efforts to increase revenue from emerging markets, including through acquisitions. Local business practices in these countries may not comply with U.S. laws, local laws or other laws applicable to us or our compliance policies, and noncompliant practices may result in increased liability risks. For example, we may incur unanticipated costs, expenses or other liabilities as a result of an acquisition target’s violation of applicable laws, such as the U.S. Foreign Corrupt Practices Act (FCPA) or similar worldwide anti-bribery laws in non-U.S. jurisdictions. We may incur unanticipated costs or expenses, including post-closing asset impairment charges, expenses associated with eliminating duplicate facilities, litigation, and other liabilities. In addition, our recent and future acquisitions may increase our exposure to other risks associated with operating internationally, including foreign currency exchange rate fluctuations; political, legal and economic instability; inflation; changes in tax rates and tax laws; and work stoppages and labor relations.
Our real estate leases generally obligate us for long periods, which subjects us to various financial risks.
We lease certain of our manufacturing centers, distribution centers, and retail locations, generally for long terms. While we have the right to terminate some of our leases under specified conditions by making specified payments, we may not be able to terminate a particular lease if or when we would like to do so. If we decide to close these facilities, we are generally required to continue paying rent and operating expenses for the balance of the lease term, or to pay to exercise rights to terminate, and the performance of any of these obligations may be expensive. When we assign or sublease vacated locations, we may remain liable for the lease obligations if the assignee or sublessee does not perform. In addition, when leases for these facilities expire, we may be unable to negotiate renewals, either on commercially acceptable terms, or at all, which could cause us to close these facilities. Accordingly, we are subject to the risks associated with leasing real estate, which could have a material adverse effect on our operating results.
Further, the success of our and our partners’ retail locations depends on a number of factors including the sustained success of the shopping center in which the retail location is situated, consumer demographics, and consumer shopping habits and patterns. Changes in consumer shopping habits and patterns, reduced consumer traffic in the shopping centers where our and our partners’ retail locations are located, financial difficulties of our and our partners’ landlords, anchor tenants, or a significant number of other retailers, and shopping center vacancies or closures could impact the profitability of our and our partners’ retail locations and increase the likelihood that our and our partners’ landlords fail to fulfill their obligations and conditions under our and our partners’ lease agreements. While we and our partners’ have certain remedies and protections under our lease agreements, the loss of business that could result if a shopping center should close or if consumer traffic were to significantly decline as a result of lost tenants or improper care of the facilities or due to macroeconomic effects, including the impact of COVID-19, could have a material adverse effect on our financial position, results of operations, and cash flows.
78
Table of Contents
SPECIAL NOTE REGARDING FORWARD-LOOKING STATEMENTS
We have made statements under the captions “Prospectus Summary,” “Risk Factors,” “Management’s Discussion and Analysis of Financial Condition and Results of Operations,” “Business” and in other sections of this prospectus that are forward-looking statements. In some cases, you can identify these statements by forward-looking words such as “may,” “might,” “will,” “should,” “expects,” “plans,” “anticipates,” “believes,” “estimates,” “predicts,” “potential” or “continue,” the negative of these terms and other comparable terminology. These forward-looking statements, which are subject to risks, uncertainties and assumptions about us, may include projections of our future financial performance, our anticipated growth strategies and anticipated trends in our business. These statements are only predictions based on our current expectations and projections about future events. There are important factors that could cause our actual results, level of activity, performance or achievements to differ materially from the results, level of activity, performance or achievements expressed or implied by the forward-looking statements, including those factors discussed under the caption entitled “Risk Factors.” You should specifically consider the numerous risks outlined under “Risk Factors.”
Although we believe the expectations reflected in the forward-looking statements are reasonable, we cannot guarantee future results, level of activity, performance or achievements. Moreover, neither we nor any other person assumes responsibility for the accuracy and completeness of any of these forward-looking statements. We are under no duty to update any of these forward-looking statements after the date of this prospectus to conform our prior statements to actual results or revised expectations.
79
Table of Contents
Structure Prior to the Reorganization Transactions
We and our predecessors have been operating for almost 70 years. We currently conduct our business through Weber-Stephen Products LLC.
Weber Inc. was incorporated as a Delaware corporation on April 1, 2021, to serve as the issuer of the Class A common stock offered hereby. Weber Merger Sub, LLC, a Delaware limited liability company, was formed in April 2021, as a wholly owned subsidiary of Weber Inc.
Weber-Stephen Products LLC recently formed Weber HoldCo LLC, a Delaware limited liability company, as a wholly owned subsidiary. WSP Intermediate, a Delaware limited liability company, was formed as a wholly owned subsidiary of Weber HoldCo LLC, and WSP Merger Sub, a Delaware limited liability company, was formed as a wholly owned subsidiary of WSP Intermediate.
All of Weber-Stephen Products LLC’s outstanding equity interests are currently owned by the following persons and entities, to whom we refer collectively as the “Pre-IPO LLC Members:”
| • | BDT WSP Holdings, LLC, an entity controlled by BDT Capital Partners, LLC, our sponsor; |
| • | WSP Investment LLC, an entity held by the Stephen family; |
| • | Weber-Stephen Management Pool LLC, an entity held by current and former members of our management team and directors; and |
| • | certain other historical equityholders. |
The Reorganization Transactions
In connection with this offering, we intend to enter into the following series of transactions to implement an internal reorganization, which we collectively refer to as the “Reorganization Transactions:”
| • | Weber Merger Sub, LLC, a subsidiary of Weber Inc. formed in April 2021, will merge with and into Blocker, an entity controlled by BDT Capital Partners, LLC, our sponsor, with Blocker surviving the merger. As a result, (i) the Blocker equityholders will receive Class A common stock of Weber Inc. in exchange for their equity interests in Blocker, (ii) the nominal shares of Weber Inc. held by Weber-Stephen Products LLC will be canceled for no consideration (because Weber Inc. was originally formed as a subsidiary of Weber-Stephen Products LLC) and (iii) Weber Inc. will become wholly owned by the former Blocker equityholders; |
| • | Blocker will then merge with and into Weber Inc., with Weber Inc. surviving the merger. Weber Inc.’s certificate of incorporation will be amended to authorize the issuance of two classes of common stock: Class A common stock and Class B common stock, which we refer to collectively as our “common stock.” Each share of Class A common stock and Class B common stock will entitle its holder to one vote per share on all matters submitted to a vote of our stockholders. See “Description of Capital Stock;” |
| • | WSP Merger Sub, a subsidiary of WSP Intermediate formed in April 2021, will merge with and into Weber-Stephen Products LLC, with Weber-Stephen Products LLC surviving the merger. As a result, (i) the Pre-IPO LLC Members will receive non-voting common interest units (the “LLC Units”) in Weber HoldCo LLC in exchange for all of their equity interests in Weber-Stephen Products LLC, (ii) Weber-Stephen Management Pool LLC will receive LLC Units in exchange for all of its equity interests that it holds in Weber-Stephen Products LLC and profits interests (the “Profits Interests”) in Weber HoldCo LLC with terms substantially similar to the terms of the profits interests that it holds in Weber-Stephen Products LLC and (iii) Weber-Stephen Products LLC will become a wholly owned subsidiary of Weber HoldCo LLC; |
80
Table of Contents
| • | the LLC Agreement of Weber HoldCo LLC will be amended and restated prior to this offering to, among other things, appoint Weber Inc. as the sole managing member of Weber HoldCo LLC; |
| • | members of the management team who indirectly hold Profits Interests through their direct interests in Weber-Stephen Management Pool LLC will be able to direct Weber-Stephen Management Pool LLC to convert those Profits Interests into a number of LLC Units based on a formula that calculates the positive difference between the then implied value of an LLC Unit and the then applicable threshold price associated with the Profits Interest; |
| • | as sole managing member of Weber HoldCo LLC, Weber Inc. will have sole authority to determine the amount and timing of distributions from Weber HoldCo LLC and offer LLC Units to future Partners, subject to any limitations set forth under the Secured Credit Facility. Because we will manage and operate the business and control the strategic decisions and day-to-day operations of Weber HoldCo LLC and will also have a substantial financial interest in Weber HoldCo LLC, we will consolidate the financial results of Weber HoldCo LLC, and a portion of our net income will be allocated to noncontrolling interest to reflect the entitlement of the Pre-IPO LLC Members to a portion of Weber HoldCo LLC’s net income. In addition, because Weber HoldCo LLC will be under the common control of BDT Capital Partners, LLC before and after the Reorganization Transactions, we will account for the Reorganization Transactions as a reorganization of entities under common control and will initially measure the interests of the Pre-IPO LLC Members in the assets and liabilities of Weber HoldCo LLC at their carrying amounts as of the date of the completion of these Reorganization Transactions; |
| • | each of the Pre-IPO LLC Members will be issued shares of our Class B common stock in an amount equal to the number of LLC Units held by each such Pre-IPO LLC Member; |
| • | under the Amended LLC Agreement, all current and future holders of LLC Units (including LLC Units issued upon conversion of Profits Interests), including the Pre-IPO LLC Members, will have the right, from and after the completion of this offering, to require Weber HoldCo LLC to redeem all or a portion of their LLC Units for, at our election, newly issued shares of Class A common stock on a one-for-one basis or a cash payment equal to the volume weighted average market price of one share of our Class A common stock for each LLC Unit redeemed (subject to customary adjustments, including for stock splits, stock dividends and reclassifications) in accordance with the terms of the Amended LLC Agreement (the “Redemption Right”). Additionally, in the event of a redemption request by a holder of LLC Units, we may, at our option, effect a direct exchange of cash or Class A common stock for LLC Units in lieu of such a redemption. A corresponding number of shares of Class B common stock will be cancelled on a one-for-one basis if we, following a redemption request of a holder of LLC Units, redeem or exchange LLC Units of such holder of LLC Units pursuant to the terms of the Amended LLC Agreement. See “Certain Relationships and Related Party Transactions—Amended LLC Agreement.” Except for transfers to us pursuant to the Amended LLC Agreement or to certain permitted transferees, the holders of LLC Units are not permitted to sell, transfer or otherwise dispose of any LLC Units or shares of Class B common stock; |
| • | members of the management team who indirectly hold LLC Units (including LLC Units issued upon conversion of Profits Interests) through their direct interests in Weber-Stephen Management Pool LLC will be able to exercise the Redemption Right with respect to those LLC Units (to the extent vested) by directing Weber-Stephen Management Pool LLC to distribute those LLC Units to them (in redemption of a corresponding number of their interests in Weber-Stephen Management Pool LLC), which will then be redeemed pursuant to the Redemption Right; |
| • | Weber Inc. will enter into a Tax Receivable Agreement that will obligate us to make payments to the Pre-IPO LLC Members and any future party to the Tax Receivable Agreement generally |
81
Table of Contents
| equal to 85% of the applicable cash savings that we actually realize as a result of Weber Inc.’s allocable share of certain existing tax basis in tangible and intangible assets related to certain transactions that resulted in a step-up in Weber HoldCo LLC’s tax basis, certain tax basis adjustments resulting from the purchase of LLC Units from the Pre-IPO LLC Members in connection with or after this offering, future taxable redemptions or exchanges of LLC Units by the holders of LLC Units and from payments made under the Tax Receivable Agreement. We will retain the benefit of the remaining 15% of these tax savings; |
| • | Weber Inc. and the Pre-IPO LLC Members will enter into the Stockholders Agreement, which will, among other things, provide that, for so long as the Substantial Ownership Requirement is met, approval by the Pre-IPO LLC Members will be required for certain corporate actions (see “Certain Relationships and Related Party Transactions—Stockholders Agreement”); |
| • | Weber Inc. will issue 46,875,000 shares of Class A common stock to the public pursuant to this offering; |
| • | Weber Inc. will use all of its net proceeds from this offering (i) to acquire 15,625,000 newly issued LLC Units from Weber HoldCo LLC, (ii) to acquire 27,421,266 LLC Units from certain Pre-IPO LLC Members, and (iii) to repurchase 3,828,734 shares of the Class A common stock received by the Blocker equityholders in connection with the merger of Weber Merger Sub, LLC with and into Blocker described in the first step of these Reorganization Transactions, in each case at a price per LLC Unit and share of Class A common stock equal to the initial public offering price of our Class A common stock minus underwriting discounts; and |
| • | Weber Inc. will cause Weber HoldCo LLC to use the proceeds from the sale of the LLC Units to Weber Inc. as follows: (i) to pay fees and expenses of approximately $17.4 million in connection with this offering and the Reorganization Transactions; (ii) to repay $220.1 million of the outstanding borrowings under our Secured Credit Facility and (iii) for general corporate purposes. Weber HoldCo LLC will not receive any proceeds from the purchase of LLC Units from certain Pre-IPO LLC Members by us or from the repurchase of shares of Class A common stock by us. See “Use of Proceeds.” |
Effect of the Reorganization Transactions and this Offering
The Reorganization Transactions are intended to create a holding company that will facilitate public ownership of, and investment in, the Company and are structured in a tax-efficient manner for the Pre-IPO LLC Members. The Pre-IPO LLC Members desire that their investment in the Company maintains its existing tax treatment as a partnership for U.S. federal income tax purposes and, therefore, will continue to hold their ownership interests in Weber HoldCo LLC until such time in the future as they may elect to cause us to redeem or exchange their LLC Units for a corresponding number of shares of our Class A common stock.
We estimate that the offering expenses (other than the underwriting discounts and commissions) will be approximately $17.4 million. See “Use of Proceeds.”
82
Table of Contents
The diagram below depicts our Organizational Structure immediately following the Reorganization Transactions, this offering and the application of the net proceeds from this offering, assuming an initial public offering price of $16.00 per share (the midpoint of the estimated initial public offering price range set forth on the cover page of this prospectus) and no exercise of the underwriters’ option to purchase additional shares. This chart is provided for illustrative purposes only and does not purport to represent all legal entities within our Organizational Structure.
| (1) | Also includes Blocker equityholders that will hold 28,498,197 shares of Class A common stock after the Reorganization Transactions and the completion of this offering and the application of the net proceeds therefrom. |
Upon completion of the transactions described above, this offering and the application of the net proceeds from this offering:
| • | Weber Inc. will be appointed as the sole managing member of Weber HoldCo LLC and will hold 75,373,197 LLC Units, constituting 26% of the outstanding economic interests in Weber HoldCo LLC (or 81,542,982 LLC Units, constituting 29% of the outstanding economic interests in Weber HoldCo LLC if the underwriters exercise their option to purchase additional shares of Class A common stock in full); |
| • | the Pre-IPO LLC Members will hold (i) 209,573,267 LLC Units, representing approximately 74% of the economic interest in Weber HoldCo LLC (or 71% if the underwriters exercise their |
83
Table of Contents
| option to purchase additional shares of Class A common stock in full) and (ii) through their ownership of Class B common stock, approximately 74% of the combined voting power of our common stock (or 71% if the underwriters exercise their option to purchase additional shares of Class A common stock in full). Additionally, Blocker equityholders will hold 10% of the combined voting power of our common stock (or 9.7% if the underwriters exercise their option to purchase additional shares of Class A common stock in full). There are no limitations in the Amended LLC Agreement on the number of LLC Units issuable in the future and we are not required to own a majority of LLC Units; and |
| • | Investors in this offering will collectively beneficially own (i) 46,875,000 shares of our Class A common stock, representing approximately 16% of the combined voting power in us (or 53,906,250 shares and 19%, respectively, if the underwriters exercise their option to purchase additional shares of Class A common stock in full) and (ii) through our ownership of LLC Units, indirectly will hold approximately 16% of the economic interest in Weber HoldCo LLC (or 19% if the underwriters exercise their option to purchase additional shares of Class A common stock in full). |
Holding Company Structure and the Tax Receivable Agreement
We are a holding company, and immediately after the consummation of the Reorganization Transactions and this offering our principal asset will be our ownership interests in Weber HoldCo LLC. The number of LLC Units that we will own directly in the aggregate at any time will equal the aggregate number of outstanding shares of our Class A common stock. The economic interest represented by each LLC Unit that we own directly will correspond to one share of our Class A common stock, and the total number of LLC Units owned directly by us and the holders of our Class B common stock at any given time will equal the sum of the outstanding shares of all classes of our common stock.
We do not intend to list our Class B common stock on any stock exchange.
Acquisitions by Weber Inc. of LLC Units from the Pre-IPO LLC Members in connection with this offering and future taxable redemptions or exchanges by the Pre-IPO LLC Members of LLC Units for shares of our Class A common stock are expected to produce tax basis adjustments to the assets of Weber HoldCo LLC that will be allocated to us and thus produce favorable tax attributes. These tax attributes would not be available to us in the absence of those transactions.
We intend to enter into the Tax Receivable Agreement with the Pre-IPO LLC Members that will provide for the payment by us to the Pre-IPO LLC Members of 85% of the amount of cash savings, if any, in U.S. federal, state and local income tax or franchise tax that we actually realize as a result of (i) Weber Inc.’s allocable share of certain existing tax basis in tangible and intangible assets related to certain transactions that resulted in a step-up in Weber HoldCo LLC’s tax basis, (ii) any increase in tax basis in Weber-Stephen Products LLC’s assets resulting from (a) acquisitions by Weber Inc. of LLC Units from the Pre-IPO LLC Members in connection with this offering, (b) the acquisition of LLC Units from the Pre-IPO LLC Members using the net proceeds from any future offering, (c) future taxable redemptions or exchanges by the Pre-IPO LLC Members of LLC Units for shares of our Class A common stock or cash or (d) payments under the Tax Receivable Agreement and (iii) tax benefits related to imputed interest resulting from payments made under the Tax Receivable Agreement. Payments under the Tax Receivable Agreement will be based on the tax reporting positions we determine, and the IRS or another tax authority may challenge all or part of the deductions, existing tax basis, tax basis increases or other tax attributes subject to the Tax Receivable Agreement, and a court could sustain such challenge. Although we are not aware of any issue that would cause the IRS to challenge the existing tax basis, tax basis increases or other benefits arising under the Tax Receivable Agreement, the Pre-IPO LLC Members will not reimburse us for any payments previously made if such
84
Table of Contents
basis increases or other benefits are subsequently disallowed, except that excess payments made to the Pre-IPO LLC Members will be netted against future payments otherwise to be made under the Tax Receivable Agreement, if any, after our determination of such excess. As a result, in such circumstances we could make future payments to the Pre-IPO LLC Members under the Tax Receivable Agreement that are greater than our actual cash tax savings and may not be able to recoup those payments, which could negatively impact our liquidity. See “Risk Factors—We will be required to pay the Pre-IPO LLC Members for certain tax benefits we may claim, and the amounts we may pay could be significant.”
Our obligations under the Tax Receivable Agreement will also apply with respect to any person who is issued LLC Units in the future and who becomes a party to the Tax Receivable Agreement.
85
Table of Contents
We estimate that our net proceeds from this offering will be approximately $712.5 million, after deducting underwriting discounts and commissions but before deducting estimated offering expenses, based on an assumed initial offering price of $16.00 per share (the midpoint of the estimated initial public offering price range set forth on the cover page of this prospectus) and assuming the underwriters’ option to purchase additional shares is not exercised. If the underwriters exercise their option to purchase additional shares in full, we expect to receive approximately $819.4 million of net proceeds based on an assumed initial offering price of $16.00 per share (the midpoint of the estimated initial public offering price range set forth on the cover page of this prospectus).
We estimate that the offering expenses (other than the underwriting discount and commissions) will be approximately $17.4 million. See “Underwriting.”
We will use all of the net proceeds from this offering (including net proceeds received if the underwriters exercise their option to purchase additional shares of Class A common stock) (i) to acquire 15,625,000 newly issued LLC Units from Weber HoldCo LLC, (ii) to acquire 27,421,266 LLC Units from certain Pre-IPO LLC Members, and (iii) to repurchase 3,828,734 shares of the Class A common stock received by the Blocker equityholders in connection with the merger of Weber Merger Sub, LLC with and into Blocker, in each case at a price per LLC Unit and share of Class A common stock equal to the initial public offering price of our Class A common stock minus underwriting discounts. See “Organizational Structure—The Reorganization Transactions.”
We will cause Weber HoldCo LLC to use the proceeds from the sale of the LLC Units to Weber Inc. as follows: (i) to pay fees and expenses of approximately $17.4 million in connection with this offering and the Reorganization Transactions; (ii) to repay $220.1 million of the outstanding borrowings under our Secured Credit Facility, as defined below, and (iii) for general corporate purposes.
The Secured Credit Facility consists of a term loan that matures on October 30, 2027 and a revolving credit facility that matures by October 20, 2025. Proceeds from the term loan and revolving facility were used to pay off our prior credit agreement, effect a portion of a special dividend, engage in business acquisition and equity repurchase activities, pay fees and expenses in connection with the foregoing and for working capital and general corporate purposes. Borrowings under the Secured Credit Facility bear interest at a rate equal to, at our option, either (i) LIBOR for the relevant interest period, adjusted for statutory reserve requirements (subject to a floor of 0.00% per annum for all revolving loans and a 0.75% floor for the term loan), plus an applicable margin or (ii) a base rate equal to the highest of (a) the rate of interest publicly announced from time to time by the administrative agent as its “prime rate”, (b) the federal funds effective rate plus 0.50% and (c) adjusted LIBOR for an interest period of one month plus 1.00% (subject to a floor of 0.00% per annum), in each case, plus an applicable margin. See “Management’s Discussion and Analysis of Financial Condition and Results of Operations—Liquidity and Capital Resources—Overview” for additional information about the Secured Credit Facility.
Certain of the underwriters and/or their respective affiliates may be lenders under the Secured Credit Facility and, as a result, may receive a portion of the net proceeds from this offering that we intend to allocate to the repayment of such borrowings, on a pro rata basis across all applicable lenders thereunder. See “Underwriting.”
Weber HoldCo LLC will not receive any proceeds from purchase of LLC Units from certain Pre-IPO LLC Members by us or the repurchase of shares of Class A common stock by us.
86
Table of Contents
If the underwriters exercise their option to purchase additional shares of Class A common stock in full, we estimate that our additional net proceeds will be approximately $106.9 million. We will use the additional net proceeds we receive pursuant to any exercise of the underwriters’ option to purchase additional shares of Class A common stock to purchase LLC Units from certain Pre-IPO LLC Members and/or to repurchase shares of the Class A common stock received by the Blocker equityholders in connection with the merger of Weber Merger Sub, LLC with and into Blocker, in each case at a price per LLC Unit and share of Class A common stock equal to the initial public offering price of our Class A common stock minus underwriting discounts. As a result, Weber HoldCo LLC will not receive any additional proceeds from any exercise of the underwriters’ option to purchase additional shares of Class A common stock.
Each $1.00 increase (decrease) in the assumed initial public offering price of $16.00 per share would increase (decrease) the amount of proceeds available to us from this offering by approximately $44.5 million, assuming the number of shares offered by us, as set forth on the cover page of this prospectus, remains the same, and after deducting the estimated underwriting discounts and commissions. Because we intend to purchase newly issued LLC Units from Weber HoldCo LLC as described above at a price per LLC Unit and share of Class A common stock equal to the initial public offering price of our Class A common stock minus underwriting discounts, any decrease in the assumed initial public offering price of $16.00 per share, would decrease the amount of proceeds available to Weber HoldCo LLC to repay outstanding borrowings under our Secured Credit Facility. Each 1,000,000 share increase (decrease) in the number of shares offered by us would increase (decrease) the amount of proceeds available to us from this offering by approximately $15.2 million, assuming the assumed initial public offering price of $16.00 per share as set forth on the cover page of this prospectus remains the same, and after deducting the estimated underwriting discounts and commissions.
87
Table of Contents
Following this offering and subject to funds being legally available, we intend to cause Weber HoldCo LLC to make pro rata distributions to the holders of LLC Units and us in an amount at least sufficient to allow us and the holders of LLC Units to pay all applicable taxes, to make payments under the Tax Receivable Agreement we will enter into with the Pre-IPO LLC Members and to pay our corporate and other overhead expenses. The declaration and payment of any dividends by Weber Inc. will be at the sole discretion of our board of directors, which may change our dividend policy at any time. Our board of directors will take into account:
| • | general economic and business conditions; |
| • | our financial condition and operating results; |
| • | our available cash and current and anticipated cash needs; |
| • | our capital requirements; |
| • | contractual, legal, tax and regulatory restrictions and implications on the payment of dividends by us to our stockholders or by our subsidiaries (including Weber HoldCo LLC) to us; and |
| • | such other factors as our board of directors may deem relevant. |
Weber Inc. will be a holding company and will have no material assets other than its ownership of LLC Units in Weber HoldCo LLC, and as a consequence, our ability to declare and pay dividends to the holders of our Class A common stock will be subject to the ability of Weber HoldCo LLC to provide distributions to us. If Weber HoldCo LLC makes such distributions, the holders of LLC Units will be entitled to receive equivalent distributions from Weber HoldCo LLC. However, because we must pay taxes, make payments under the Tax Receivable Agreement and pay our expenses, amounts ultimately distributed as dividends to holders of our Class A common stock are expected to be less than the amounts distributed by Weber HoldCo LLC to the Pre-IPO LLC Members on a per share basis. See “Certain Relationships and Related Party Transactions—Tax Receivable Agreement.”
Assuming Weber HoldCo LLC makes distributions to its members in any given year, the determination to pay dividends, if any, to our Class A common stockholders out of the portion, if any, of such distributions remaining after our payment of taxes, Tax Receivable Agreement payments and expenses (any such portion, an “excess distribution”) will be made by our board of directors. Because our board of directors may determine to pay or not pay dividends to our Class A common stockholders, our Class A common stockholders may not necessarily receive dividend distributions relating to excess distributions, even if Weber HoldCo LLC makes such distributions to us.
88
Table of Contents
The following table sets forth our cash and cash equivalents and capitalization as of March 31, 2021:
| • | on an actual basis for Weber-Stephen Products LLC; and |
| • | a pro forma basis for Weber Inc., giving effect to the Reorganization Transactions, the April Transactions and the other matters described under “Unaudited Pro Forma Condensed Consolidated Financial Information,” which includes application of the proceeds from this offering as described in “Use of Proceeds” based upon an assumed initial public offering price of $16.00 per share (the midpoint of the range set forth on the cover page of this prospectus). |
This table should be read in conjunction with “Organizational Structure,” “Use of Proceeds,” “Unaudited Pro Forma Condensed Consolidated Financial Information,” “Management’s Discussion and Analysis of Financial Condition and Results of Operations,” “Description of Capital Stock” and the audited and unaudited consolidated financial statements of Weber-Stephen Products LLC and subsidiaries and related notes thereto included elsewhere in this prospectus.
| (Dollars in thousands, except unit and share information) |
Weber-Stephen Products LLC Actual |
Weber Inc. Pro forma(3) |
||||||
| Cash and cash equivalents |
$ | 379,939 | $ | 99,941 | ||||
|
|
|
|
|
|||||
| Indebtedness: |
||||||||
| Long-term debt (including the current portion thereof and net of unamortized debt issuance costs)(1) |
1,223,060 | 1,177,214 | ||||||
| Payable to related parties pursuant to the Tax Receivable Agreement |
— | 147,741 | ||||||
| Equity: |
||||||||
| Class A common stock, par value $0.001 per share; no shares authorized, no shares issued and outstanding, actual; 3,000,000,000 shares authorized, 75,373,197 shares issued and outstanding, pro forma |
— | 75 | ||||||
| Class B common stock, par value $0.00001 per share; no shares authorized, no shares issued and outstanding, actual; 1,500,000,000 shares authorized, 209,573,267 shares issued and outstanding, pro forma |
— | 2 | ||||||
| Additional paid in capital |
— | 348,424 | ||||||
| Members’ deficit, 551,842 units authorized, issued and outstanding, actual; no units authorized or issued and outstanding, pro forma |
|
(538 |
) |
— | ||||
| Accumulated other comprehensive loss |
(42,623 | ) | (11,275 | ) | ||||
| Retained earnings (deficit) |
69,875 | (379,587 | ) | |||||
| Noncontrolling interest(2) |
— | (114,990 | ) | |||||
|
|
|
|
|
|||||
| Total members’/stockholders’ equity (deficit) |
26,714 | (157,351 | ) | |||||
|
|
|
|
|
|||||
| Total capitalization |
$ | 1,249,774 | $ | 1,167,604 | ||||
|
|
|
|
|
|||||
| (1) | On October 30, 2020, the Company entered into the Secured Credit Facility with a term loan of $1,250.0 million and a revolving credit facility with a maximum commitment of $300.0 million. The term loan matures on October 30, 2027 and the revolving facility matures by October 30, 2025. As of the date of this prospectus, the Company had $293.6 million of capacity under the revolving facility. |
| (2) | On a pro forma basis, includes the Weber-Stephen Products LLC interests not owned by us, which represents 74% of Weber HoldCo LLC’s LLC Units. Certain Pre-IPO LLC Members will |
89
Table of Contents
| hold the noncontrolling economic interests in Weber-Stephen Products LLC. Weber Inc. will hold 26% of the economic interest in Weber-Stephen Products LLC. |
| (3) | The pro forma cash and cash equivalents and capitalization presented do not give effect to our acquisition of substantially all of the assets of R. McDonald Co. Pty. Ltd. in April 2021, which we acquired using approximately $29.3 million in cash and $14.2 million in equity. See ”Prospectus Summary—Recent Developments—R. McDonald Acquisition” and note 17 to our unaudited consolidated financial statements for the six months ended March 31, 2021 included elsewhere in this prospectus. |
A $1.00 increase or decrease in the assumed initial public offering price of $16.00 per share (which is the midpoint of the price range set forth on the cover page of this prospectus) would increase or decrease each of cash and cash equivalents, total stockholder’s equity and total capitalization on a pro forma basis by approximately $7.7 million, assuming the number of shares of Class A common stock offered, as set forth on the cover page of this prospectus, remains the same, and after deducting the estimated underwriting discounts and commissions and estimated offering expenses payable by us. Each 1,000,000 increase or decrease in the number of shares of Class A common stock offered in this offering would increase or decrease each of cash and cash equivalents, total stockholder’s equity and total capitalization on a pro forma basis by approximately $3.4 million, based on an assumed initial public offering price of $16.00 per share, which is the midpoint of the estimated public offering price range set forth on the cover page of this prospectus, and after deducting the estimated underwriting discounts and commissions and estimated offering expenses payable by us.
90
Table of Contents
UNAUDITED PRO FORMA CONDENSED CONSOLIDATED FINANCIAL INFORMATION
The unaudited pro forma condensed consolidated balance sheet as of March 31, 2021, and the unaudited pro forma condensed consolidated statements of income for the fiscal year ended September 30, 2020 and the six months ended March 31, 2021, present our financial position and results of operations after giving effect to the following pro forma transactions (the “Pro Forma Transactions”):
| • | the Reorganization Transactions described under “Organizational Structure—Reorganization Transactions”, which include but are not limited to: |
| • | the recognition of a noncontrolling interest in Weber-Stephen Products LLC held by the Pre-IPO LLC Members; |
| • | the entry into the Tax Receivable Agreement; |
| • | the issuance of 209,573,267 shares of our Class B common stock in an amount equal to the number of LLC Units held by each Pre-IPO LLC Member (other than Blocker) after the application of the net proceeds from this offering; |
| • | the issuance of 46,875,000 shares of our Class A common stock to the purchasers in this offering in exchange for net proceeds of approximately $712.5 million, assuming that the shares are offered at $16.00 per share (the midpoint of the price range listed on the cover page of this prospectus), after deducting underwriting discounts and commissions but before deducting estimated offering expenses; |
| • | the application by Weber Inc. of the net proceeds from this offering (i) to acquire newly issued LLC Units from Weber HoldCo LLC, (ii) to acquire LLC Units from certain existing equityholders and (iii) to repurchase shares of our Class A common stock received by the Blocker equityholders in connection with the merger of Weber Merger Sub, LLC, in each case at a price per LLC Unit and share of Class A common stock equal to the initial public offering price of our Class A common stock after underwriting discounts; |
| • | the application by Weber HoldCo LLC of a portion of the proceeds of the sale of LLC Units to Weber Inc. to pay fees and expenses of approximately $17.4 million in connection with this offering; and |
| • | the application by Weber HoldCo LLC of a portion of the proceeds of the sale of LLC Units to Weber Inc. to repay $220.1 million of indebtedness. |
| • | The provision for federal and state income taxes of Weber Inc. as a taxable corporation at an effective rate of 23.70% for the fiscal year ended September 30, 2020 and for the six months ended March 31, 2021, respectively. |
| • | The repurchase of LLC Unit Interests from WSP Investment LLC in the amount of $188.7 million and the dividend to Weber-Stephen Products LLC Unit Holders in the amount of $261.3 million (collectively, the “April Transactions”). See “Prospectus Summary—Recent Developments—April Transactions.” |
| • | The planned modification of the LTIP and profits interest units concurrent with the Reorganization Transactions (historical LTIP and profits interest units are described in greater detail under “Long-Term Incentive Compensation” in the “Compensation Discussion and Analysis” section). Concurrent with the Reorganization Transactions, the LTIP units for which the corresponding performance period has been completed will be converted into Weber Inc. RSUs and LTIP units with a performance period covering current future periods will be converted to Weber Inc. PSUs. Class A common stock will be issued in exchange for vested RSUs and PSUs subsequent to holding periods as applicable. As described under “Organizational Structure—The Reorganization Transactions,” the profits interest units in |
91
Table of Contents
| Weber-Stephen Products LLC will be exchanged for profits interest in Weber HoldCo LLC which will be convertible into LLC units. |
| • | The conversion of June into a limited liability company simultaneous with the Reorganization Transactions. |
The unaudited pro forma condensed consolidated statements of income for the fiscal year ended September 30, 2020 and the six months ended March 31, 2021 give effect to the Pro Forma Transactions as if the Pro Forma Transactions had occurred on October 1, 2019. The unaudited pro forma condensed consolidated balance sheet as of March 31, 2021, gives effect to the Pro Forma Transactions as if the Pro Forma Transactions occurred on March 31, 2021.
Our historical consolidated financial information has been derived from Weber-Stephen Products LLC’s consolidated financial statements and accompanying notes to the consolidated financial statements included elsewhere in this prospectus. Weber Inc. was formed on April 1, 2021 and will have no material assets or results of operations until the completion of this offering. Therefore, Weber Inc.’s historical financial information is not included in the unaudited pro forma condensed consolidated financial information.
The presentation of the unaudited pro forma condensed consolidated financial information is prepared in conformity with Article 11 of Regulation S-X as amended by the final rule, Release No. 33-10786 “Amendments to Financial Disclosures about Acquired and Disposed Businesses,” using the assumptions set forth in the notes to the unaudited pro forma condensed consolidated financial information.
We based the pro forma adjustments on available information and on assumptions that we believe are reasonable under the circumstances in order to reflect, on a pro forma basis, the impact of the Pro Forma Transactions on the historical financial information of Weber-Stephen Products LLC. See the notes to unaudited pro forma condensed consolidated financial information below for a discussion of assumptions made. As the unaudited pro forma condensed consolidated financial information has been prepared based on these assumptions, the final amounts recorded may differ materially from the information presented. The unaudited pro forma condensed consolidated financial information does not purport to be indicative of our results of operations or financial position had the relevant transactions occurred on the dates assumed and does not project our results of operations or financial position for any future period or date. The unaudited pro forma condensed consolidated financial information does not reflect any anticipated synergies, operating efficiencies, tax savings, or cost savings.
For purposes of the unaudited pro forma condensed consolidated financial information, we have assumed that we will issue shares of Class A common stock at a price per share of $16.00 (which is the midpoint of the estimated public offering price range set forth on the cover of this prospectus), and, as a result, immediately following the completion of this offering, the ownership percentage represented by LLC Units not held by us will be 74%, and the net income attributable to LLC Units not held by us will accordingly represent 74% of our net income. Except as otherwise indicated, the unaudited pro forma condensed consolidated financial information presented assumes no exercise by the underwriters of their option to purchase additional shares of Class A common stock.
As a public company, we will be implementing additional procedures and processes for the purpose of addressing the standards and requirements applicable to public companies. We expect to incur additional annual expenses related to these steps and, among other things, additional directors’ and officers’ liability insurance, director fees, reporting requirements of the SEC, transfer agent fees, hiring additional accounting, legal and administrative personnel, increased auditing and legal fees and similar expenses. We have not included any pro forma adjustments relating to these expenses.
92
Table of Contents
The unaudited pro forma condensed consolidated financial information should be read together with “Organizational Structure,” “Capitalization,” “Selected Historical Consolidated Financial Data,” “Management’s Discussion and Analysis of Financial Condition and Results of Operations” and the audited consolidated financial statements of Weber-Stephen Products LLC and subsidiaries and related notes thereto included elsewhere in this prospectus.
93
Table of Contents
UNAUDITED PRO FORMA CONDENSED CONSOLIDATED BALANCE SHEET
As of March 31, 2021
| (Dollars in thousands, except unit and share information) |
Weber-Stephen Products LLC(A) |
Pro Forma Transaction Adjustments |
Weber Inc. Pro Forma |
|||||||||
| Assets |
||||||||||||
| Current assets: |
||||||||||||
| Cash and cash equivalents |
$ | 379,939 | $ | (280,000 | )(B) | $ | 99,941 | |||||
| 2 | (D) | |||||||||||
| 712,500 | (F) | |||||||||||
| (17,368 | )(G) | |||||||||||
| (475,000 | )(H) | |||||||||||
| (220,132 | )(I) | |||||||||||
| Accounts receivable, less allowance of $2,468 at March 31, 2021 |
483,953 | — | 483,953 | |||||||||
| Inventories, net |
334,404 | — | 334,404 | |||||||||
| Prepaid expenses and other current assets |
41,300 | (388 | )(G) | 40,912 | ||||||||
|
|
|
|
|
|
|
|||||||
| Total current assets |
1,239,596 | (280,386 | ) | 959,210 | ||||||||
| Property, equipment and leasehold improvements, net |
104,616 | — | 104,616 | |||||||||
| Operating lease right-of-use assets |
44,048 | — | 44,048 | |||||||||
| Other long-term assets |
47,214 | (2,668 | )(J) | 44,546 | ||||||||
| Deferred tax asset |
— | 114,362 | (J) | 149,377 | ||||||||
| 35,015 | (K) | |||||||||||
| Trademarks, net |
359,515 | — | 359,515 | |||||||||
| Other intangible assets, net |
139,500 | — | 139,500 | |||||||||
| Goodwill |
91,708 | — | 91,708 | |||||||||
|
|
|
|
|
|
|
|||||||
| Total assets |
$ | 2,026,197 | $ | (133,677 | ) | $ | 1,892,520 | |||||
|
|
|
|
|
|
|
|||||||
| Liabilities and members’ equity (deficit) |
||||||||||||
| Current liabilities: |
||||||||||||
| Trade accounts payable |
$ | 384,071 | $ | — | $ | 384,071 | ||||||
| Accrued expenses |
174,762 | (1,332 | )(G) | 173,430 | ||||||||
| Income taxes payable |
6,846 | — | 6,846 | |||||||||
| Current portion of long-term debt and other borrowings |
12,500 | 170,000 | (B) | 182,500 | ||||||||
| Current portion of long-term financing obligation |
552 | — | 552 | |||||||||
|
|
|
|
|
|
|
|||||||
| Total current liabilities |
578,731 | 168,668 | 747,399 | |||||||||
| Long-term debt, less current portion |
1,210,560 | (215,846 | )(I) | 994,714 | ||||||||
| Long-term financing obligation, less current portion |
38,694 | — | 38,694 | |||||||||
| Non-current operating lease liabilities |
33,445 | — | 33,445 | |||||||||
| Other long-term liabilities |
138,053 | (346 | )(B) | 87,878 | ||||||||
| (14,084 | )(E) | |||||||||||
| (35,745 | )(L) | |||||||||||
| Payable to related parties pursuant to the Tax Receivable Agreement |
— | 147,741 | (K) | 147,741 | ||||||||
|
|
|
|
|
|
|
|||||||
| Total liabilities |
1,999,483 | 50,388 | 2,049,871 | |||||||||
| Commitments and Contingencies |
||||||||||||
| Class A common stock, par value $0.001 per share |
— | 32 | (C) | 75 | ||||||||
| 47 | (F) | |||||||||||
| (4 | )(H) | |||||||||||
| Class B common stock, par value $0.00001 per share |
— | 2 | (D) | 2 | ||||||||
| Additional paid in capital |
— | (32 | )(C) | 348,424 | ||||||||
| 14,084 | (E) | |||||||||||
| 712,453 | (F) | |||||||||||
| (6,366 | )(G) | |||||||||||
| (474,996 | )(H) | |||||||||||
| 111,694 | (J) | |||||||||||
| (112,727 | )(K) | |||||||||||
| 99,307 | (L) | |||||||||||
| (21,337 | )(M) | |||||||||||
| 26,344 | (N) | |||||||||||
| Members’ deficit, 551,842 units authorized, issued and outstanding as of March 31, 2021 |
(538 | ) | (20,799 | )(B) | — | |||||||
| 21,337 | (M) | |||||||||||
| Accumulated other comprehensive loss |
(42,623 | ) | 31,348 | (N) | (11,275 | ) | ||||||
| Retained earnings (deficit) |
69,875 | (428,855 | )(B) | (379,587 | ) | |||||||
| (10,058 | )(G) | |||||||||||
| (4,286 | )(I) | |||||||||||
| (63,561 | )(L) | |||||||||||
| 57,298 | (N) | |||||||||||
| Noncontrolling interests |
— | (114,990 | )(N) | (114,990 | ) | |||||||
|
|
|
|
|
|
|
|||||||
| Total members’ / stockholders’ equity (deficit) |
26,714 | (184,065 | ) | (157,351 | ) | |||||||
|
|
|
|
|
|
|
|||||||
| Total liabilities and members’ / stockholders’ equity (deficit) |
$ | 2,026,197 | $ |
(133,677 |
) |
$ | 1,892,520 | |||||
|
|
|
|
|
|
|
|||||||
94
Table of Contents
NOTES TO UNAUDITED PRO FORMA CONDENSED CONSOLIDATED
BALANCE SHEET AS OF MARCH 31, 2021
| (A) | Weber Inc. was incorporated as a Delaware corporation on April 1, 2021, and will have no material assets or results of operations until the completion of this offering and therefore its historical financial position is not shown in a separate column in this unaudited pro forma condensed consolidated balance sheet. This column represents the consolidated historical financial statements of Weber-Stephen Products LLC, the predecessor for accounting purposes. |
| (B) | Reflects the cash distributions to repurchase $188.7 million of LLC units interests from WSP Investment LLC and the dividend payment in the amount of $261.3 million to Weber-Stephen Products LLC unit holders made by Weber Stephen Products LLC subsequent to March 31, 2021 and prior to the completion of the Reorganization Transactions, as described in greater detail within “Prospectus Summary—Recent Developments—April Transactions”. $280.0 million of distributions were funded through the use of cash on hand as of March 31, 2021 and the remaining $170.0 million of distributions were funded with a $170.0 million drawdown on the Company’s Secured Credit Facility revolver subsequent to March 31, 2021. The dividend distributions resulted in a $0.3 million decrease in the value of the Management Incentive Compensation Plan (“LTIP”) liability. For purposes of the unaudited pro forma condensed consolidated balance sheet, the distributions are reflected as a reduction to retained earnings of $428.9 million, a reduction to member’s equity of $20.8 million, a reduction to other long-term liabilities of $0.3 million, a reduction to cash and cash equivalents of $280.0 million and the recognition of $170.0 million drawn down on the Secured Credit Facility revolver within current portion of long-term debt. The Company subsequently paid down the full $170.0 million drawn on the Secured Credit Facility revolver with cash flows generated from operations between April 1, 2021 and the transaction date, which has not been reflected within the unaudited pro forma condensed consolidated financial information. |
| (C) | Reflects a $0.0 million increase in Class A common stock and offset to additional paid in capital. As part of the Reorganization Transactions, Weber Merger Sub, LLC, a subsidiary of Weber Inc., will merge with and into Blocker with the Blocker equityholders receiving 32,326,931 shares of Class A common stock of Weber Inc. As a result of the merger, Weber Inc. will obtain 32,326,931 LLC Units of Weber HoldCo LLC. |
| (D) | Reflects the issuance of Class B common stock to Pre-IPO LLC Members, on a one-to-one basis with the number of LLC Units they own, in exchange for cash consideration of $0.0 million equal to the par value of the Class B common stock issued, as described in greater detail under “Organizational Structure”. |
| (E) | Reflects June’s conversion into a limited liability company simultaneous with the Reorganization Transactions. The conversion impacted June’s tax rate resulting in a decrease to an existing deferred tax liability associated with the June acquisition. The entry to reflect the decrease in the deferred tax liability is a reduction of $14.1 million to other long-term liabilities and a $14.1 million increase to additional paid in capital. |
| (F) | Reflects a $712.5 million increase to cash and cash equivalents with a corresponding offset of $712.5 million to additional paid in capital and $0.0 million to Class A common stock related to the issuance of Class A common stock to the public pursuant to this offering. We estimate that the net proceeds to us from this offering will be approximately $712.5 million (or $819.4 million if the underwriters exercise in full their option to purchase additional shares of Class A common stock), based on an assumed initial public offering price of $16.00 per share, which is the midpoint of the estimated public offering price range set forth on the cover page of this prospectus, after deducting $37.5 million of assumed underwriting discounts and commissions. We will use $475.0 million of net proceeds to acquire currently-outstanding LLC Units from Pre-IPO LLC Members and Class A common stock from the Blocker equityholders, as well as $220.1 million of |
95
Table of Contents
| net proceeds to partially pay down the Secured Credit Facility, as further discussed in note (H) and (I), respectively. |
| (G) | As of March 31, 2021, the unaudited pro forma condensed consolidated balance sheet reflects (i) the reduction of cash of $17.4 million, (ii) removal of $0.4 million from prepaid expenses and other current assets previously capitalized by Weber-Stephens Products LLC, (iii) reduction of $1.3 million from accrued expenses for transaction costs incurred but not yet paid, (iv) $6.4 million to additional paid in capital for costs directly related to the transaction and (v) $10.1 million to retained earings for the remaining transaction costs estimated to be incurred which are not subject to be deferred and capitalized as part of the transaction. |
| (H) | Reflects a reduction of $475.0 million of cash, or $15.20 per unit or share (net of underwriting fees) to purchase (i) 27,421,266 currently-outstanding LLC Units from Pre-IPO LLC Members and (ii) 3,828,734 shares of Class A common stock received by the Blocker equityholders in connection with the merger of Weber Merger Sub, LLC with and into Blocker. |
| (I) | Reflects a (i) $220.1 million reduction of cash related to the partial repayment of the Secured Credit Facility from proceeds received from the offering, (ii) $215.8 million reduction of long-term debt and (iii) $4.3 million reduction of retained earnings related to the write off of deferred financing costs associated with the Secured Credit Facility. |
| (J) | Weber Inc. is subject to U.S. federal income taxes, in addition to state, local and foreign taxes. This adjustment reflects the recognition of deferred taxes in connection with the Reorganization Transactions assuming the federal rates currently in effect and the highest statutory rates apportioned to each state, local and foreign jurisdiction. |
| We have recorded a pro forma deferred tax adjustment net of a valuation allowance of $51.1 million to increase deferred tax assets by $114.4 million. The net deferred tax asset includes (i) $111.7 million related to temporary differences in the book basis as compared to the tax basis of our Company’s investment in Weber HoldCo LLC and (ii) $2.7 million related to existing deferred tax assets reported within other long-term assets that were reclassed out of other long-term assets into deferred tax assets. The $111.7 million related to temporary differences in the book basis as compared to the tax basis of our Company’s investment in Weber HoldCo LLC was offset against additional paid in capital. In addition to the $114.4 million increase to deferred tax described, we recorded a $35.0 million increase to deferred tax assets related to tax benefits from future deductions attributable to payments under the Tax Receivable Agreement as described further in note (K). The Company has determined it is more likely than not the total net deferred taxes of $149.4 million of deferred tax assets will result in ordinary income tax deductions that will be realized based on projections of future taxable income. Weber Inc. will continue to assess all positive and negative evidence and will adjust the valuation allowance to the extent it is more likely than not its assessment changes. |
| (K) | As part of the Reorganization Transactions, Weber Inc. will enter into the Tax Receivable Agreement, pursuant to which Weber Inc. will pay to the Pre-IPO LLC Members and any future party to the Tax Receivable Agreement 85% of the amount of cash savings, if any, in U.S. federal, state, and local income tax or franchise tax that it actually realizes (or is deemed to realize in certain circumstances) in periods after this offering as (i) any increase in tax basis in Weber HoldCo LLC’s assets resulting from (a) acquisitions by Weber Inc. of LLC Units from certain existing equityholders in connection with this offering, (b) the acquisition of LLC Units using the net proceeds from any future offering, (c) redemptions or exchanges by the Pre-IPO LLC Members of LLC Units and the corresponding number of shares of Class B common stock for shares of our Class A common stock or cash or (d) payments under the Tax Receivable Agreement, and (ii) tax benefits related to imputed interest resulting from payments made under the Tax Receivable Agreement. |
96
Table of Contents
| The Tax Receivable Agreement will be accounted for as a contingent liability, with amounts accrued when considered probable and reasonably estimable. We will record a $147.7 million liability based on the Company’s estimate of the aggregate amount that it will pay to the Pre-IPO LLC Members under the Tax Receivable Agreement as a result of the Reorganization Transactions. As mentioned in note (K) above, we will record an increase of $35.0 million in deferred tax assets related to tax benefits from future deductions attributable to payments under the Tax Receivable Agreement as a result of the Reorganization Transactions. Additionally, we will record a decrease to additional paid-in capital of $112.7 million, which is equal to the difference between the increase in deferred tax assets and the increase in liabilities due to existing owners under the Tax Receivable Agreement as a result of the Reorganization Transactions. |
| No adjustment has been made to reflect future exchanges by Pre-IPO LLC Members (or their transferees of LLC Units or other assignees) of LLC Units for cash or shares of our Class A common stock, as applicable. |
| (L) | Reflects the modification of the LTIP profits interest units concurrent with the Reorganization Transactions described above. The LTIP and profits interest units were settled in cash pre modification and were therefore classified as liabilities as of March 31, 2021. As a result of the modification, the units will be reclassified from liabilities to equity resulting in a reduction of $35.7 million to other long-term liabilities and an increase of $35.7 million to additional paid in capital. Upon the modification the preliminary estimate of the fair value of the awards, assuming vesting through March 31, 2021, increased by $63.6 million compared to the value originally reported as of March 31, 2021, resulting in an additional increase of $63.6 million to additional paid in capital and a decrease of $63.6 million to retained earnings to reflect the incremental compensation expense recognized. The estimate of the incremental stock-based compensation expense was determined based on our preliminary analysis of the change in fair value of the awards at the initial public offering price of $16.00. |
| (M) | Reflects an offset of $21.3 million of members’ deficit to reflect the Reorganization Transactions which collapsed the prior capital structure. |
| (N) | Upon completion of the Reorganization Transactions, we will become the sole managing member of Weber HoldCo LLC. Although we will indirectly have a minority economic interest in Weber-Stephen Products LLC, we will indirectly have the sole voting interest in, and control the management of, Weber-Stephen Products LLC. As a result, we will consolidate the financial results of Weber-Stephen Products LLC and will report a noncontrolling interest related to the LLC Units held by the Pre-IPO LLC Members on our consolidated balance sheet. The adjustments to (i) noncontrolling interest of $115.0 million, (ii) additional paid in capital of $26.3 million, (iii) retained earnings of $57.3 million and (iv) accumulated other comprehensive income of $31.4 million reflect the proportional interest in the pro forma condensed consolidated total equity of Weber Inc. owned by Weber-Stephen Products LLC. |
97
Table of Contents
UNAUDITED PRO FORMA CONDENSED CONSOLIDATED STATEMENTS OF INCOME
Six months ended March 31, 2021
| (Dollars in thousands, except unit and share information) |
Weber-Stephen Products LLC(AA) |
Pro Forma Transaction Adjustments |
Weber Inc. Pro Forma |
|||||||||
| Net sales |
$ | 963,309 | $ | — | $ | 963,309 | ||||||
| Cost of goods sold |
542,782 | — | 542,782 | |||||||||
|
|
|
|
|
|
|
|||||||
| Gross profit |
420,527 | — | 420,527 | |||||||||
| Operating expenses: |
||||||||||||
| Selling, general and administrative |
297,986 | — | 297,986 | |||||||||
| Amortization of intangible assets |
6,864 | — | 6,864 | |||||||||
| Gain on disposal of assets held for sale |
(5,185 | ) | — | (5,185 | ) | |||||||
|
|
|
|
|
|
|
|||||||
| Income from operations |
120,862 | — | 120,862 | |||||||||
| Foreign currency (gain) loss |
(14 | ) | — | (14 | ) | |||||||
| Interest income |
(425 | ) | — | (425 | ) | |||||||
| Interest expense |
32,174 | 237 | (CC) | 32,411 | ||||||||
| Loss from early extinguishment of debt |
5,448 | — | 5,448 | |||||||||
|
|
|
|
|
|
|
|||||||
| Income before taxes |
83,679 | (237 | ) | 83,442 | ||||||||
| Income taxes |
15,389 | 5,230 | (DD) | 20,619 | ||||||||
| Loss (gain) from investments in unconsolidated affiliates |
(5,505 | ) | — | (5,505 | ) | |||||||
|
|
|
|
|
|
|
|||||||
| Net income |
73,795 | (5,467 | ) | 68,328 | ||||||||
| Earnings allocated to participating securities |
(610 | ) | 610 | (FF) | — | |||||||
|
|
|
|
|
|
|
|||||||
| Net income attributable to common members |
$ | 73,185 | $ | (4,857 | ) | $ | 68,328 | |||||
|
|
|
|
|
|
|
|||||||
| Net income attributable to noncontrolling interests |
$ | 55,602 | (EE) | $ | 55,602 | |||||||
|
|
|
|
|
|||||||||
| Net income attributable to controlling interests |
$ | 12,726 | (EE) | $ | 12,726 | |||||||
|
|
|
|
|
|||||||||
| Pro Forma net income (loss) per share attributable to common stockholders |
||||||||||||
| Basic |
(HH) | $ | 0.17 | |||||||||
| Diluted |
(HH) | $ | 0.17 | |||||||||
| Weighted-average shares used in computing pro forma net income (loss) per share attributable to common stockholders |
||||||||||||
| Basic |
(HH) | 75,750,165 | ||||||||||
| Diluted |
(HH) | 75,750,165 | ||||||||||
98
Table of Contents
UNAUDITED PRO FORMA CONDENSED CONSOLIDATED STATEMENTS OF INCOME
Fiscal year ended September 30, 2020
| (Dollars in thousands, except unit and share information) |
Weber-Stephen Products LLC(AA) |
Pro Forma Transaction Adjustments |
Weber Inc. Pro Forma |
|||||||||
| Net sales |
$ | 1,525,260 | $ | — | $ | 1,525,260 | ||||||
| Cost of goods sold |
915,586 | — | 915,586 | |||||||||
|
|
|
|
|
|
|
|||||||
| Gross profit |
609,674 | — | 609,674 | |||||||||
| Operating expenses: |
||||||||||||
| Selling, general and administrative |
444,975 | 10,058 | (BB) | 518,594 | ||||||||
| 63,561 | (GG) | |||||||||||
| Amortization of intangible assets |
13,235 | — | 13,235 | |||||||||
| Gain on disposal of assets held for sale |
— | — | — | |||||||||
|
|
|
|
|
|
|
|||||||
| Income from operations |
151,464 | (73,619 | ) | 77,845 | ||||||||
| Foreign currency loss (gain) |
5,081 | — | 5,081 | |||||||||
| Interest income |
(1,270 | ) | — | (1,270 | ) | |||||||
| Interest expense |
40,357 | (11,335 | )(CC) | 29,022 | ||||||||
|
|
|
|
|
|
|
|||||||
| Income before taxes |
107,296 | (62,284 | ) | 45,012 | ||||||||
| Income taxes |
13,812 | 2,822 | (DD) | 16,634 | ||||||||
| Loss (gain) from investments in unconsolidated affiliates |
4,604 | — | 4,604 | |||||||||
|
|
|
|
|
|
|
|||||||
| Net income |
88,880 | (65,106 | ) | 23,774 | ||||||||
| Earnings allocated to participating securities |
(473 | ) | 473 | (FF) | — | |||||||
|
|
|
|
|
|
|
|||||||
| Net (loss) income attributable to common members |
$ | 88,407 | $ | (64,633 | ) | $ | 23,774 | |||||
|
|
|
|
|
|
|
|||||||
| Net (loss) income attributable to noncontrolling interests |
$ | 19,935 | (EE) | $ | 19,935 | |||||||
|
|
|
|
|
|||||||||
| Net (loss) income attributable to controlling interests |
$ | 3,839 | (EE) | $ | 3,839 | |||||||
|
|
|
|
|
|||||||||
| Pro Forma net income (loss) per share attributable to common stockholders |
||||||||||||
| Basic |
(HH) | $ | 0.05 | |||||||||
| Diluted |
(HH) | $ | 0.05 | |||||||||
| Weighted-average shares used in computing pro forma net income (loss) per share attributable to common stockholders |
||||||||||||
| Basic |
(HH) | 75,750,165 | ||||||||||
| Diluted |
(HH) | 75,750,165 | ||||||||||
99
Table of Contents
NOTES TO UNAUDITED PRO FORMA CONDENSED CONSOLIDATED STATEMENTS OF INCOME
Fiscal year ended September 30, 2020 and six months ended March 31, 2021
| (AA) | Weber Inc. was incorporated as a Delaware corporation on April 1, 2021, and will have no material assets or results of operations until the completion of this offering and therefore its historical financial position is not shown in a separate column in the unaudited pro forma condensed consolidated statements of income. This column represents the consolidated financial statements of Weber-Stephen Products LLC, the predecessor for accounting purposes. |
| (BB) | Reflects total transaction costs incurred which are expected to be expensed, of which $0.9 million are already included in the historical condensed consolidated statement of income of Weber-Stephen Products LLC for the six months ended March 31, 2021, therefore resulting in $10.1 million recorded in the unaudited pro forma condensed consolidated statement of income for the fiscal year ended September 30, 2020. The transaction costs recorded in the unaudited pro forma condensed consolidated statement of income for the fiscal year ended September 30, 2020 would not be expected to have a continuing impact beyond twelve months. |
| (CC) | Reflects a $4.1 million reduction to interest expense from the repayment of $220.1 million of the outstanding borrowings under our Secured Credit Facility, offset by a $4.3 million write off of deferred financing costs associated with the Secured Credit Facility for the unaudited pro forma condensed consolidated statement of income for the six months ended March 31, 2021. In addition, the unaudited pro forma condensed consolidated statement of income for the fiscal year ended September 30, 2020, reflects an $11.3 million reduction to interest expense from the repayment of $220.1 million of the outstanding borrowings under our Senior Facility. Interest expense related to the $170.0 million draw on the Revolver for the April Transactions documented in note (B) has not been adjusted as the draw and subsequent repayment both occurred between April and June of 2021. |
| (DD) | Following the Reorganization Transactions and offering, Weber Inc. will be subject to U.S. federal income taxes, in addition to state, local and foreign taxes. As a result, the unaudited pro forma condensed consolidated statements of income reflects an adjustment to our provision for corporate income taxes to reflect a pro forma tax rate of 23.70% for both the six months ended March 31, 2021 and the fiscal year ended September 30, 2020, which includes a provision for U.S. federal income taxes and assumes the highest statutory rates apportioned to each state, local and foreign jurisdiction. Weber-Stephen Products LLC has been, and will continue to be, treated as a partnership for U.S. federal and state income tax purposes. As such, Weber-Stephen Products LLC’s profits and losses will flow through to its partners, including Weber Inc., and are generally not subject to tax at the Weber-Stephen Products LLC level. |
| Six months ended March 31, 2021 |
Fiscal year ended September 30, 2020 |
|||||||
| Pro forma Weber HoldCo LLC income before taxes |
83,442 | 45,012 | ||||||
| Ownership percentage of controlling interest |
26.45 | % | 26.45 | % | ||||
|
|
|
|
|
|||||
| Pro forma taxable income attributable to the controlling interest |
22,070 | 11,906 | ||||||
| Pro forma corporate tax rate |
23.70 | % | 23.70 | % | ||||
|
|
|
|
|
|||||
| Pro forma income tax expense adjustment |
$ | 5,230 | $ | 2,822 | ||||
| (EE) | Following the Reorganization Transactions, Weber Inc. will become the sole managing member of Weber HoldCo LLC, and upon consummation of this offering, Weber Inc. will initially own approximately 26.45% of the economic interest in Weber HoldCo LLC but will have 100% of the voting power and control the management of Weber HoldCo LLC. The ownership percentage held by the noncontrolling interest, the Pre-IPO LLC Members, will be approximately 73.55%. Net income attributable to the noncontrolling interest will represent approximately 73.55% of net income. |
100
Table of Contents
| (FF) | Reflects the adjustment to eliminate earnings allocated to participating securities as the Class A common stock and outstanding RSUs associated with the conversion of the LTIP agreement are the only outstanding securities which participate in distributions or dividends by Weber Inc. and they are both included in the weighted average number of shares underlying the basic earnings per share calculation as documented in note (HH) below. The adjustment results in a reduction of $0.6 million and $0.5 million to earnings allocated to participating securities in the six months ended March 31, 2021, and the fiscal year ended September 30, 2020, respectively. |
| (GG) | Reflects stock-based compensation expense associated with the increase in fair value of LTIP and profits interest units as discussed in note (L), therefore resulting in an additional $63.6 million recorded in the unaudited pro forma condensed consolidated income statement for the year ended September 30, 2020. |
| (HH) | The weighted average number of shares underlying the basic earnings per share calculation reflects 75,373,197 shares of Class A common stock outstanding as well as the 376,968 outstanding RSUs associated with the conversion of the LTIP agreement documented in note (L) that will be exchanged for Class A common stock at a later date but are not subject to ongoing service requirements. Class A common stock outstanding after the offering and the RSUs are included within the weighted average number of shares as they are the only outstanding securities which participate in distributions or dividends by Weber Inc. All of the proceeds from the sale of Class A common stock will be used to purchase LLC units and repay outstanding debt and not for general corporate purposes. Pro forma diluted income per share is computed by adjusting pro forma net income attributable to Weber Inc. and the weighted average shares of Class A common stock outstanding to give effect to potentially dilutive securities that qualify as participating securities using the treasury stock method, as applicable. Shares of Class B common stock are not participating securities and therefore are not included in the calculation of pro forma basic income per share. LLC Units, together with an equal number of shares of Class B common stock, may be exchanged, at our option, for shares of our Class A common stock or for cash. After evaluating the potential dilutive effect under the if-converted method, the outstanding LLC units for the assumed exchange of non-controlling interests were determined to be anti-dilutive and thus were excluded from the computation of diluted earnings per share. |
| (Dollars in thousands, except share and per share information) |
Six months ended March 31, 2021 |
Fiscal year ended September 30, 2020 |
||||||
| Income per share of common stock |
||||||||
| Numerator: |
||||||||
| Net income attributable to controlling interest (basic) |
$ | 12,726 | $ | 3,839 | ||||
| Reallocation of net income assuming issuance of LLC units to noncontrolling interest holders with respect to profits interest units |
(224 | ) | (42 | ) | ||||
|
|
|
|
|
|||||
| Net income (loss) attributable to controlling interest (diluted) |
12,502 | 3,797 | ||||||
| Denominator: |
||||||||
| Weighted average shares of common stock outstanding (basic and diluted) |
75,750,165 | 75,750,165 | ||||||
| Basic earnings per share |
$ | 0.17 | $ | 0.05 | ||||
| Diluted earnings per share |
$ | 0.17 | $ | 0.05 | ||||
101
Table of Contents
If you invest in our Class A common stock, you will experience dilution to the extent of the difference between the initial public offering price per share of our Class A common stock and the pro forma net tangible book value per share of our Class A common stock. Dilution results from the fact that the per share offering price of the Class A common stock is substantially in excess of the pro forma net tangible book value per share attributable to the Pre-IPO LLC Members.
We have presented dilution in pro forma net tangible book value per share of Class A common stock to investors in this offering assuming that all of the holders of LLC Units redeemed or exchanged their LLC Units for a corresponding number of newly-issued shares of Class A common stock, or the “Assumed Redemption”, in order to more meaningfully present the dilutive impact on the investors in this offering.
Our pro forma net tangible book value (deficit) as of March 31, 2021 would have been approximately $(1,000.0) million, or $(3.71) per share of our Class A common stock. Pro forma net tangible book value represents the amount of total tangible assets less total liabilities, and pro forma net tangible book value per share represents pro forma net tangible book value divided by the number of shares of common stock outstanding, in each case after giving effect to the Reorganization Transactions, assuming that the Pre-IPO LLC Members redeem or exchange all of their LLC Units and shares of Class B common stock for newly-issued shares of our Class A common stock on a one-for-one basis.
After giving effect to the Reorganization Transactions, assuming that the Pre-IPO LLC Members redeem or exchange all of their LLC Units for newly-issued shares of our Class A common stock on a one-for-one basis, and after giving effect to the sale of 46,875,000 shares of Class A common stock in this offering at the assumed initial public offering price of $16.00 per share (the midpoint of the estimated initial price range on the cover page of this prospectus) and the use of the net proceeds from this offering, our pro forma net tangible book value (deficit) would have been approximately $(748.1) million, or $(2.63) per share, representing an immediate increase in net tangible book value of $1.08 per share to existing equityholders and an immediate dilution in net tangible book value of $18.63 per share to new investors.
The following table illustrates the per share dilution:
| Assumed initial public offering price per share |
$ | 16.00 | ||||||
| Pro forma net tangible book value (deficit) per share as of March 31, 2021(1) |
$ | (3.71 | ) | |||||
| Increase in pro forma net tangible book value per share after this offering |
$ | 1.08 | ||||||
|
|
|
|||||||
| Pro forma net tangible book value (deficit) per share after this offering |
$ | (2.63 | ) | |||||
|
|
|
|||||||
| Dilution in pro forma net tangible book value per share to new investors |
$ | 18.63 | ||||||
|
|
|
| (1) | The computation of pro forma net tangible book value per share as of March 31, 2021 is set forth below: |
| (in thousands, except per share data) | ||||
| Book value of tangible assets(a) |
$ | 1,155,089 | ||
| Less: total liabilities(a) |
2,155,053 | |||
|
|
|
|||
| Pro forma net tangible book value (deficit)(a) |
(999,964 | ) | ||
| Shares of Class A common stock outstanding(a) |
269,321,463 | |||
|
|
|
|||
| Pro forma net tangible book value (deficit) per share |
$ | (3.71 | ) | |
|
|
|
|||
102
Table of Contents
| (a) | Gives pro forma effect to the Reorganization Transactions (other than the issuance of Class A common stock to the public pursuant to the offering), (ii) the April Transactions, (iii) the conversion of June into a limited liability company simultaneous with the Reorganization Transactions and (iv) the Assumed Redemption. |
Dilution is determined by subtracting pro forma net tangible book value per share after this offering from the initial public offering price per share of Class A common stock.
A $1.00 increase (decrease) in the assumed initial public offering price of $16.00 per share would increase (decrease) the dilution per share to new investors by $0.94, in each case assuming the number of shares offered, as set forth on the cover page of this prospectus, remains the same.
To the extent the underwriters’ option to purchase additional shares of Class A common stock is exercised, there will be further dilution to new investors.
The following table illustrates, as of March 31, 2021, after giving effect to the Assumed Redemption and the sale by us of shares of our Class A common stock in this offering at the initial public offering price of $16.00 per share (the midpoint of the estimated initial public offering price range set forth on the cover page of this prospectus), the difference between the existing Pre-IPO LLC Members, and the investors purchasing shares of our Class A common stock in this offering with respect to the number of shares of our common stock purchased from us, the total consideration paid or to be paid to us, and the average price per share paid or to be paid to us, before deducting underwriting discounts and commissions and the estimated offering expenses payable by us:
| Shares purchased | Total consideration | Average price | ||||||||||||||||||
| Number | Percent | Amount | Percent | Per share | ||||||||||||||||
| Pre-IPO LLC Members(1) |
238,071,464 | 84 | % | 13,548,501 | 2 | % | $ | 0.06 | ||||||||||||
| Investors purchasing shares of our Class A common stock in this offering |
46,875,000 | 16 | 750,000,000 | 98 | 16.00 | |||||||||||||||
|
|
|
|
|
|
|
|
|
|
|
|||||||||||
| Total |
284,946,464 | 100 | % | 763,548,501 | 100 | % | $ | 2.68 | ||||||||||||
|
|
|
|
|
|
|
|
|
|
|
|||||||||||
| (1) | The total consideration provided by Pre-IPO LLC Members is equal to the pro forma equity of Weber Inc. as of March 31, 2021 and does not give effect to the aggregate of $450.0 million of cash distributions made by Weber-Stephen Products LLC to WSP Investment LLC and Weber-Stephen Products LLC unit holders, which was funded through the use of $280.0 million of cash on hand as of March 31, 2021 and a $170.0 million drawdown on the Company’s Secured Credit Facility revolver subsequent to March 31, 2021. |
We may choose to raise additional capital due to market conditions or strategic considerations even if we believe we have sufficient funds for our current or future operating plans. To the extent additional capital is raised through the sale of equity or convertible debt securities, the issuance of these securities could result in further dilution to holders of our Class A common stock.
103
Table of Contents
SELECTED HISTORICAL CONSOLIDATED FINANCIAL DATA
The following tables set forth selected historical consolidated financial data of Weber-Stephen Products LLC as of and for the periods presented. Weber-Stephen Products LLC is the predecessor of Weber Inc. for financial reporting purposes. Weber Inc. was formed as a Delaware corporation on April 1, 2021 and has not, to date, conducted any activities other than those incident to its formation, the Reorganization Transactions and the preparation of this prospectus and the registration statement of which this prospectus forms a part. As such, the selected historical consolidated financial data of Weber Inc. have not been presented.
The selected consolidated statement of income data for the fiscal years ended September 30, 2018, 2019 and 2020 and selected consolidated balance sheet data as of September 30, 2019 and 2020 have been derived from Weber-Stephen Products LLC’s audited consolidated financial statements included elsewhere in this prospectus. The selected condensed consolidated statement of income for the six months ended March 31, 2020 and 2021 (unaudited) and selected condensed consolidated balance sheet data as of March 31, 2021 (unaudited) have been derived from Weber-Stephen Products LLC’s unaudited condensed consolidated financial statements included elsewhere in this prospectus which, in the opinion of management, include all adjustments, consisting only of normal recurring adjustments, necessary for a fair statement of the results for the unaudited interim periods.
The selected historical consolidated financial data presented below do not purport to be indicative of the results that can be expected for any future period and should be read together with “Capitalization,”, “Summary Historical and Unaudited Pro Forma Condensed Consolidated Financial Data,” “Management’s Discussion and Analysis of Financial Condition and Results of Operations” and our financial statements and related notes thereto included elsewhere in this prospectus.
| Weber-Stephen Products LLC | ||||||||||||||||||||
| Fiscal Year Ended September 30, | Six Months Ended March 31, |
|||||||||||||||||||
| 2018 | 2019 | 2020 | 2020 | 2021 | ||||||||||||||||
|
|
|
|
|
|
|
|
|
|
|
|||||||||||
| (Dollars in thousands, except share and per share information) |
(Unaudited) | |||||||||||||||||||
| Consolidated Statement of Income Data |
||||||||||||||||||||
| Net sales |
$ | 1,340,032 | $ | 1,296,210 | $ | 1,525,260 | $ | 596,376 | $ | 963,309 | ||||||||||
| Cost of goods sold(1)(2) |
759,786 | 793,536 | 915,586 | 358,417 | 542,782 | |||||||||||||||
|
|
|
|
|
|
|
|
|
|
|
|||||||||||
| Gross profit |
580,246 | 502,674 | 609,674 | 237,959 | 420,527 | |||||||||||||||
| Operating expenses: |
||||||||||||||||||||
| Selling, general and administrative(1)(2) |
397,444 | 369,651 | 444,975 | 174,718 | 297,986 | |||||||||||||||
| Amortization of intangible assets |
11,786 | 13,586 | 13,235 | 6,855 | 6,864 | |||||||||||||||
| Impairment of assets |
— | 12,568 | — | — | — | |||||||||||||||
| Gain on disposal of assets held for sale |
— | — | — | — | (5,185 | ) | ||||||||||||||
|
|
|
|
|
|
|
|
|
|
|
|||||||||||
| Income from operations |
171,016 | 106,869 | 151,464 | 56,386 | 120,862 | |||||||||||||||
| Foreign currency loss (gain) |
7,118 | (1,837 | ) | 5,081 | 6,033 | (14 | ) | |||||||||||||
| Interest income |
(1,594 | ) | (1,153 | ) | (1,270 | ) | (701 | ) | (425 | ) | ||||||||||
| Interest expense |
34,609 | 45,170 | 40,357 | 21,111 | 32,174 | |||||||||||||||
| Loss from early extinguishment of debt |
— | — | — | — | 5,448 | |||||||||||||||
|
|
|
|
|
|
|
|
|
|
|
|||||||||||
| Income before taxes |
130,883 | 64,689 | 107,296 | 29,943 | 83,679 | |||||||||||||||
| Income taxes |
17,588 | 13,544 | 13,812 | 3,558 | 15,389 | |||||||||||||||
| Loss (gain) from investments in unconsolidated affiliates |
— | 1,025 | 4,604 | 2,778 | (5,505 | ) | ||||||||||||||
|
|
|
|
|
|
|
|
|
|
|
|||||||||||
| Net income |
113,295 | 50,120 | 88,880 | 23,607 | 73,795 | |||||||||||||||
| Earnings allocated to participating securities |
(738 | ) | (320 | ) | (473 | ) | (234 | ) | (610 | ) | ||||||||||
|
|
|
|
|
|
|
|
|
|
|
|||||||||||
104
Table of Contents
| Weber-Stephen Products LLC | ||||||||||||||||||||
| Fiscal Year Ended September 30, | Six Months Ended March 31, |
|||||||||||||||||||
| 2018 | 2019 | 2020 | 2020 | 2021 | ||||||||||||||||
| (Dollars in thousands, except share and per share information) |
(Unaudited) | |||||||||||||||||||
| Net income attributable to common members |
$ | 112,557 | $ | 49,800 | $ | 88,407 | $ | 23,373 | $ | 73,185 | ||||||||||
| Net income per common unit |
||||||||||||||||||||
| Basic |
$ | 193.53 | $ | 87.95 | $ | 160.23 | $ | 42.36 | $ | 132.62 | ||||||||||
| Diluted |
$ | 193.53 | $ | 87.95 | $ | 160.23 | $ | 42.36 | $ | 132.62 | ||||||||||
| Weighted average common units outstanding |
||||||||||||||||||||
| Basic |
581,616 | 566,223 | 551,763 | 551,753 | 551,836 | |||||||||||||||
| Diluted |
581,616 | 566,223 | 551,763 | 551,753 | 551,836 | |||||||||||||||
| Consolidated Statement of Cash Flows Data: |
||||||||||||||||||||
| Net cash provided by (used in) operating activities |
$ | 110,648 | $ | 126,468 | $ | 305,178 | $ | (212,035 | ) | $ | (214,649 | ) | ||||||||
| Net cash (used in) provided by investing activities |
$ | (33,079 | ) | $ | (67,257 | ) | $ | (22,207 | ) | $ | (18,226 | ) | $ | (105,565 | ) | |||||
| Net cash (used in) provided by financing activities |
$ | (204,179 | ) | $ | (50,728 | ) | $ | (213,240 | ) | $ | 252,830 | $ | 571,266 | |||||||
| Additions to property, equipment and leasehold improvements |
$ | (34,904 | ) | $ | (25,507 | ) | $ | (29,414 | ) | $ | (18,264 | ) | $ | (17,354 | ) | |||||
| Weber-Stephen Products LLC | ||||||||||||
| As of September 30, | As of March 31, |
|||||||||||
| 2019 | 2020 | 2021 | ||||||||||
| (Dollars in thousands) | (Unaudited) | |||||||||||
| Consolidated Balance Sheet Data: |
||||||||||||
| Cash and cash equivalents |
$ | 44,665 | $ | 123,792 | $ | 379,939 | ||||||
| Working (deficit) capital(3) |
$ | (84,879 | ) | $ | 45,023 | $ | 660,865 | |||||
| Total assets |
$ | 961,611 | $ | 1,139,435 | $ | 2,026,197 | ||||||
| Long-term debt, less current portion |
$ | 594,035 | $ | 575,659 | $ | 1,210,560 | ||||||
| Total liabilities |
$ | 1,083,371 | $ | 1,182,983 | $ | 1,999,483 | ||||||
| Total members’ (deficit) equity |
$ | (121,760 | ) | $ | (43,548 | ) | $ | 26,714 | ||||
| (1) | Amounts include unit-based compensation as follows: |
| Fiscal Year Ended September 30, |
Six Months Ended March 31, |
|||||||||||||||||||
| 2018 | 2019 | 2020 | 2020 | 2021 | ||||||||||||||||
| (Dollars in thousands) | (Unaudited) | |||||||||||||||||||
| Cost of goods sold |
$ | (138 | ) | $ | — | $ | 663 | $ | 65 | $ | 279 | |||||||||
| Selling, general and administrative |
(952 | ) | (1,446 | ) | 3,851 | 827 | 32,200 | |||||||||||||
|
|
|
|
|
|
|
|
|
|
|
|||||||||||
| Total unit-based compensation |
$ | (1,090 | ) | $ | (1,446 | ) | $ | 4,514 | $ | 892 | $ | 32,479 | ||||||||
|
|
|
|
|
|
|
|
|
|
|
|||||||||||
105
Table of Contents
| (2) | Amounts include depreciation and amortization expense as follows: |
| Fiscal Year Ended September 30, | Six Months Ended March 31, |
|||||||||||||||||||
| 2018 | 2019 | 2020 | 2020 | 2021 | ||||||||||||||||
| (Dollars in thousands) | (Unaudited) | |||||||||||||||||||
| Cost of goods sold |
$ | 22,066 | $ | 17,106 | $ | 15,697 | $ | 8,024 | $ | 6,457 | ||||||||||
| Selling, general and administrative |
14,765 | 15,625 | 13,415 | 6,593 | 7,007 | |||||||||||||||
|
|
|
|
|
|
|
|
|
|
|
|||||||||||
| Total depreciation and amortization expense |
$ | 36,831 | $ | 32,731 | $ | 29,112 | $ | 14,617 | $ | 13,464 | ||||||||||
|
|
|
|
|
|
|
|
|
|
|
|||||||||||
| (3) | We define working (deficit) capital as current assets less current liabilities. |
106
Table of Contents
MANAGEMENT’S DISCUSSION AND ANALYSIS OF FINANCIAL CONDITION
AND RESULTS OF OPERATIONS
You should read the following discussion and analysis of our financial condition and results of operations together with the section titled “Selected Consolidated Financial and Other Data” and our consolidated financial statements and the related notes appearing elsewhere in this prospectus. Some of the information contained in this discussion and analysis or set forth elsewhere in this prospectus, including information with respect to our plans and strategy for our business, includes forward-looking statements that involve risks and uncertainties. You should read the sections titled “Risk Factors” and “Special Note Regarding Forward-Looking Statements” for a discussion of important factors that could cause actual results to differ materially from the results described in or implied by the forward-looking statements contained in the following discussion and analysis. Our fiscal year end is September 30, and our fiscal quarters end on December 31, March 31, June 30, and September 30. Our fiscal years ended September 30, 2018, 2019, 2020, and 2021 are referred to herein as Fiscal Year 2018, Fiscal Year 2019, Fiscal Year 2020, and the fiscal year ending September 30, 2021 (“Fiscal Year 2021”), respectively.
Our Company
We are the leading outdoor cooking company with the strongest and most trusted brand in the global outdoor cooking market. Our founder George Stephen, Sr., established the outdoor cooking category when he invented the original charcoal grill nearly 70 years ago. In the decades since, we have built a loyal and global following of both grilling enthusiasts and barbeque professionals in backyards all around the world. We have continuously disrupted and led the outdoor cooking category, through a comprehensive and expanding product portfolio including traditional charcoal grills, gas grills, smokers, pellet and electric grills, and recently our cutting-edge Weber Connect™ technology-enabled grills. We believe we offer the most complete outdoor cooking portfolio globally, with our full range of premium products sold in 78 countries in Fiscal Year 2020.
We believe Weber is the only outdoor cooking brand with global scale and a vertically integrated manufacturing platform. Our track record of premium product innovation and the strength of our brand has led to a market-leading share of 23% in the U.S. and 24% globally in 2020, according to Frost & Sullivan. We are leaders in the largest and most attractive markets in outdoor cooking, including the U.S., Germany, Australia, Canada and France. Beyond these markets, we estimate that we have either the number one or number two brand position in each of the key geographies we serve.
We have spent decades building brand affinity and awareness by teaching people how to grill the “Weber Way.” By consistently delivering high-performing, differentiated products and best-in-class customer service, we have built a global community of passionate brand loyalists who value our innovation, uncompromising quality and performance. Over the years, families have passed down their affinity for Weber from one generation to the next, forging a deep emotional connection between consumers and our brand. We continue to deepen our relationship with our consumers by bringing innovation to our grill and accessories portfolio, introducing breakthrough connected products, expanding into new categories, and providing engaging brand experiences.
Key Factors Affecting Our Results of Operations
We believe that our performance and future success depend on a number of factors that present significant opportunities for us but also pose risks and challenges, including those discussed below and in the section of this prospectus titled “Risk Factors.”
107
Table of Contents
Economic Conditions
Demand for our products is significantly affected by a number of economic factors impacting our customers and consumers, such as the availability of credit, consumer confidence and spending, demographic trends, employment levels, and other macroeconomic factors (e.g., lockdowns, government mandates, etc.) that may influence the extent to which consumers invest in household products such as grills, and associated accessories, consumables, and services.
Seasonality/Weather
Although we generally have demand for our products throughout the year, our sales have historically experienced some seasonality. We have typically experienced our highest level of sales of our products in the second and third fiscal quarters as retailers across North America and Europe changeover their floor sets, build inventory and fulfill consumer demand for outdoor cooking products. Sales are typically lower during our first and fourth fiscal quarters, with the exception of our Australia/New Zealand business which is counter seasonal to the balance of our business. We have a long track record of investing in our business throughout the year, including in operating expenses, working capital, and other growth initiatives. We typically borrow under our short-term revolving facility in the first and second fiscal quarters to fund working capital for building up inventory in anticipation of the higher demand we experience in the second and third fiscal quarters. While these investments drive performance during the primary selling season in our second and third fiscal quarters, they generally have a negative impact on cash flow and net income during our first and fourth fiscal quarters. Unfavorable weather during our higher sales season can also have a material adverse impact on our results, and can cause shifts in sales across fiscal quarters. A few examples are colder, wetter weather patterns during the key second and third fiscal quarters in North America and Europe, or drought conditions leading to wildfires similar to what Australia experienced in early Fiscal Year 2020.
Business Acquisitions
On January 12, 2021, we acquired all of the outstanding stock of June Life, Inc. (“June”), a smart appliance and technology company. The acquisition aligns with the Company’s strategy of revolutionizing the outdoor cooking experience through connected products, services and experiences that make grilling the perfect meal simple with our smartphone-enabled step-by-step cooking experience. Weber Connect, powered by June OS, is our award-winning smart cooking software solution developed with June. The acquisition was accounted for as a business combination, and June was acquired for aggregate consideration of $142.2 million, including $108.3 million of cash. The results of operations for June have been included in the condensed consolidated statement of income since the acquisition date, which were not material. The assets acquired and liabilities assumed in connection with this acquisition were included in our condensed consolidated balance sheet as of March 31, 2021, which have been measured at fair value as of the acquisition date.
On April 1, 2021, we acquired substantially all of the operations of R. McDonald Co. Pty. Ltd., a sales and marketing company in Australia and New Zealand, for approximately $29.3 million in cash and $14.2 million in equity.
We remain open to synergistic acquisitions that enhance our product line, geographic reach, market share and operational capabilities.
Impact of COVID-19
Since the onset of the COVID-19 pandemic, we have focused on protecting our employees’ health and safety, meeting our customers’ needs as they navigate an uncertain financial and operating
108
Table of Contents
environment, working closely with our suppliers to protect our ongoing business operations and rapidly adjusting our short-, medium- and long-term operational plans to proactively and effectively respond to the current and potential future public health crises. While the COVID-19 pandemic presents serious concerns for our business and operations, our employees and their families, our customers and our suppliers, we believe that we are adapting well to the wide-ranging changes that the global economy is currently undergoing. We remain confident in our business continuity strategy, our ability to produce and sell our products safely and in compliance with applicable laws and governmental orders and mandates, our robust and flexible supply chains and our financial flexibility even in the event of a potentially extended economic downturn. This discussion and analysis includes periods prior to the outbreak of the COVID-19 pandemic. For further discussion of the steps we have taken to respond to and mitigate the effects of the COVID-19 pandemic, see “Risk Factors.”
We are fully operational as we abide by local COVID-19 safety regulations across the world. To achieve this, we have many employees working remotely and have adopted significant protective measures for our employees on site, including staggered shifts, social distancing and hygiene best practices recommended by the United States Centers for Disease Control and Prevention (the “CDC”) and local public health officials. In addition, we have taken additional steps to monitor and strengthen our supply chain to maintain an uninterrupted supply of our products.
Although we have implemented measures to mitigate the impact of the COVID-19 pandemic on our business, these measures may not be fully effective. We cannot predict the degree to, or the period over, which we will be affected by the pandemic and resulting governmental and other measures. The economic effects of the COVID-19 pandemic could continue to affect demand for our products in the foreseeable future.
The COVID-19 environment has encouraged consumers to cook at home and enjoy the benefits of outdoor grilling, creating increased demand for our grills and accessories, and we expect to continue to benefit from these trends even after the pandemic recedes. As the COVID-19 pandemic continues, it may also have the effect of heightening many of the risks described in “Risk Factors” in this prospectus. See “Risk Factors” for a further discussion of the adverse impacts of the COVID-19 pandemic on our business.
Impacts of the Initial Public Offering
Impact of Debt Repayment
Net proceeds after expenses to us of $712.5 million in connection with the sale of Class A common stock in this offering, based on an assumed initial public offering price of $16.00 per share, which is the midpoint of the price range set forth on the cover of this prospectus, together with cash on hand, are used to repay a portion of outstanding indebtedness, as described in “Use of Proceeds.” We expect our interest expense to decrease as a result of this offering and our anticipated Use of Proceeds therefrom to repay $220.1 million of the outstanding borrowings under our Secured Credit Facility (as defined below).
Incremental Public Company Expenses
During the period leading up to, and following our initial public offering, we will incur significant expenses that we did not incur as a private company. Those costs include director and officer liability insurance expenses, increased stock compensation expense, as well as costs associated with third-party and internal resources related to accounting, auditing, Sarbanes-Oxley Act compliance, legal,
109
Table of Contents
and investor and public relations activities. These costs will generally be expensed as selling, general and administrative expenses in the consolidated statements of income.
Organizational Transactions
Weber Inc. was incorporated in April 2021 and formed for the purpose of this offering and has engaged to date only in activities in contemplation of this offering. Weber Inc. will be a holding company and its sole material asset will be a controlling ownership interest in Weber HoldCo LLC. For more information regarding our reorganization and holding company structure, see “Organizational Structure–Holding Company Structure and the Tax Receivable Agreement.” Upon completion of this offering, all of our business will be conducted through Weber HoldCo LLC and its consolidated subsidiaries, and the financial results of Weber HoldCo LLC and its consolidated subsidiaries will be included in the consolidated financial statements of Weber Inc.
Weber HoldCo LLC will be treated as a pass-through entity for U.S. federal and state income tax purposes and accordingly has not been subject to U.S. federal income tax. Certain wholly owned subsidiaries of Weber HoldCo LLC are taxed as corporations for U.S. federal and most applicable state, local income tax and foreign tax purposes. After consummation of this offering, Weber HoldCo LLC will continue to be treated as a pass-through entity for U.S. federal and state income tax purposes and certain subsidiaries will continue to be taxed as corporations for U.S. federal and most applicable state, local income tax and foreign tax purposes. As a result of its ownership of LLC Units in Weber HoldCo LLC, Weber Inc. will become subject to U.S. federal, state and local income taxes with respect to its allocable share of any taxable income of Weber HoldCo LLC and will be taxed at the prevailing corporate tax rates. In addition to tax expenses, we also will incur expenses related to our operations, and we will be required to make payments under the Tax Receivable Agreement with the Pre-IPO LLC Members. Due to the uncertainty of various factors, we cannot estimate the likely tax benefits we will realize as a result of LLC Unit exchanges, and the resulting amounts we are likely to pay out to Pre-IPO LLC Members pursuant to the Tax Receivable Agreement; however, we estimate that such payments may be substantial. We intend to cause Weber HoldCo LLC to make distributions in an amount sufficient to allow us to pay our tax obligations and operating expenses, including distributions to fund any ordinary course payments due under the Tax Receivable Agreement. See ‘‘Organizational Structure—Holding Company Structure and the Tax Receivable Agreement.”
Components of our Operating Results
We consider a variety of financial and operating measures in assessing the performance of our business. The key U.S. GAAP measures we use are net sales, gross profit, income from operations and net income.
Net Sales
We offer a broad range of products that consist of grills, accessories, and consumables. We recognize product sales upon the transfer of products to customers at a point in time. Transfer of control passes to customers upon shipment or upon delivery depending upon the written sales terms with the customer. Sales are recorded net of related discounts, allowances and taxes to be submitted to third parties. Sales are impacted by product/geography/channel mix, pricing actions, foreign exchange fluctuations, promotions, competition, and the spending habits of our consumers. Sales growth is primarily driven by new product launches, geographic expansion, direct-to-consumer initiatives, point-of-sale (“POS”) changes, and expanding our customer base.
110
Table of Contents
Cost of Goods Sold
Cost of goods sold includes the cost of direct materials, labor, purchased finished products and components, inbound freight, packaging, warranty, and depreciation and amortization. Cost of goods sold is recognized primarily using the first-in first-out (“FIFO”) method of accounting for the inventory sold.
Gross Profit and Gross Margin
Gross profit is calculated by taking net sales less cost of goods sold. Gross profit is generally impacted by purchased finished product and component costs, material/commodity costs, labor economics, product pricing, product mix, and changes in foreign currencies. Gross margin is defined as gross profit as a percentage of net sales.
Operating Expenses
Selling, General and Administrative
Selling, general and administrative expenses consist primarily of research and development (“R&D”), marketing, advertising, and selling costs; non-manufacturing employee compensation and benefit costs; transportation costs of delivering our product to customers and the costs associated with a network of warehousing facilities to house inventory until the point of sale; outside services and fees; legal, insurance, accounting, audit, and other administrative expenses; cost of non-cash stock-based compensation; and general corporate infrastructure costs. We expect our selling, general and administrative expenses to increase to support our growth initiatives and as a result of operating as a public company, including additional costs to comply with the rules and regulations of the SEC and stock exchanges; for legal and auditing services; for additional insurance; for investor relations activities; and for other administrative and professional services.
Amortization of Intangible Assets
Intangible assets other than goodwill are amortized over their useful lives in accordance with Accounting Standards Codification (“ASC”) 350, Intangibles—Goodwill and Other, unless those lives are determined to be indefinite. Intangible amortization expense is primarily related to our trademarks, customer lists, in-process R&D and non-compete agreements. The weighted average amortization period ranges from less than one year to 16.6 years.
Impairment of Assets
We review our goodwill and other intangible assets not subject to amortization for impairment on an annual basis or whenever events or changes in circumstances indicate that the carrying amount of such assets may not be recoverable. As part of our Fiscal Year 2019 annual goodwill impairment test, we recognized a non-cash impairment loss of $12.6 million on the iGrill goodwill.
Gain on Disposal of Assets Held for Sale
During Fiscal Year 2020, we determined that one of our manufacturing sites was considered to be assets held for sale, since the asset group was being marketed for sale and all the criteria to be classified as held for sale under ASC 360, Property, Plant and Equipment, had been met. The related buildings and its content were vacated and we no longer required these assets for our future operations. The carrying value of these assets was $8.3 million as of September 30, 2020. Assets held for sale are measured at the lower of their carrying value or the fair value less cost to sell. On December 30, 2020, we disposed of this manufacturing site, for net cash proceeds of $13.5 million, which resulted in a gain of $5.2 million.
111
Table of Contents
Foreign Currency Loss (Gain)
The functional currencies of the Company’s foreign subsidiaries are predominantly the respective local currencies. Foreign currency loss (gain) includes gains and losses on transactions conducted in foreign currencies other than the functional currency.
Interest Income
Interest income consists of interest earned on our cash and cash equivalents, as well as interest on member notes.
Interest Expense
Interest expense consists primarily of interest on our borrowings, including our senior credit facility (“Senior Facility”) and Secured Credit Facility (term loan and revolving facility), foreign currency revolving and overdraft facility, and charges for limited standby letters of credit. Interest expense also includes the amortization of deferred financing costs associated with our credit facility, current year impacts of interest rate swap transactions, as well as interest expense resulting from financing obligations under sale-leasebacks arrangements.
Loss from Early Extinguishment of Debt
Under extinguishment accounting, the Company recorded a $5.4 million loss from early extinguishment of debt, of which $4.1 million related to the unsecured term loan of the Company’s Senior Credit Facility and $1.3 million related to unsecured revolving credit of the Senior Facility, representing a write-off of unamortized deferred financing costs.
Income Taxes
Income taxes consist primarily of state and international taxes for jurisdictions in which we conduct business. The Company has operations that are subject to income and other similar taxes in foreign countries. A valuation allowance is provided to offset deferred tax assets if, based on available evidence, it is more likely than not that some or all of the deferred tax assets will not be realized. Weber’s practice is to recognize interest and penalties related to income tax matters, if assessed, in income taxes.
Non-GAAP Measures
In addition to the measures presented above and in our consolidated financial statements, we use the following non-GAAP measures to evaluate our business, measure our performance, identify trends affecting our business and assist us in making strategic decisions. Our non-GAAP measures are: adjusted income from operations, adjusted net income, EBITDA and Adjusted EBITDA.
Adjusted Income from Operations and Adjusted Net Income
Adjusted income from operations and adjusted net income is income from operations and net income adjusted for non-cash stock compensation / Management Incentive Plan (“LTIP”) and profits interest expense, business transformation costs, operational transformation costs, impairment costs, debt refinancing and IPO costs, COVID-19 costs, and gain on disposal of assets held for sale as shown below, and, in the case of adjusted net income, loss from early extinguishment of debt, net of the tax impact of such adjustments. Adjusted income from operations is also adjusted for foreign currency (loss) gain. Adjusted income from operations excludes loss from early extinguishment of debt, interest expense, net, income taxes, and loss (gain) from investments in unconsolidated affiliates. We use adjusted income from operations and adjusted net income as indicators of the productivity of our business and our ability to manage expenses, after adjusting for certain expenses that we view as not indicative of regular operations. Adjusted income from operations and adjusted net income are not calculated in the same manner by all companies, and accordingly, are not necessarily comparable to similarly entitled measures of other companies and may not be an appropriate measure for performance relative to other companies.
112
Table of Contents
EBITDA and Adjusted EBITDA
EBITDA is net income before interest expense, net, income taxes, and depreciation and amortization.
Adjusted EBITDA is a key metric used by management and our Board of Directors to assess our financial performance. Adjusted EBITDA is also frequently used by analysts, investors and other interested parties to evaluate companies in our industry, when considered alongside other U.S. GAAP measures. We use Adjusted EBITDA to supplement U.S. GAAP measures of performance to evaluate the effectiveness of our business strategies, to make budgeting decisions, and to compare our performance against that of other companies using similar measures.
Adjusted EBITDA is defined as net income before interest expense, net, income taxes, depreciation and amortization, adjusted for non-cash stock compensation / LTIP and profits interest expense, business transformation costs, operational transformation costs, impairment costs, debt refinancing and IPO costs, COVID-19 operational costs, loss from early extinguishment of debt, and gain on disposal of assets held for sale as shown below. Adjusted EBITDA is not calculated in the same manner by all companies, and accordingly, is not necessarily comparable to similarly entitled measures of other companies and may not be an appropriate measure for performance relative to other companies. Adjusted EBITDA should not be construed as an indicator of a company’s operating performance in isolation from, or as a substitute for, net income, cash flows from operations or cash flow data, all of which are prepared in accordance with U.S. GAAP. We have presented Adjusted EBITDA solely as supplemental disclosure because we believe it allows for a more complete analysis of results of operations. Adjusted EBITDA is not intended to represent, and should not be considered more meaningful than, or as an alternative to, measures of operating performance as determined in accordance with U.S. GAAP. Our presentation of Adjusted EBITDA should not be construed as an inference that our future results will be unaffected by these items.
The following table reconciles income from operations to adjusted income from operations; net income to adjusted net income; net income to EBITDA; and EBITDA to Adjusted EBITDA for the periods presented:
| Fiscal Years Ended September 30, | Six Months Ended March 31, |
|||||||||||||||||||
| 2018 | 2019 | 2020 | 2020 | 2021 | ||||||||||||||||
| (Dollars in thousands) | ||||||||||||||||||||
| Income from operations |
$ | 171,016 | $ | 106,869 | $ | 151,464 | $ | 56,386 | $ | 120,862 | ||||||||||
| Adjustments: |
||||||||||||||||||||
| Foreign currency (loss) gain(a) |
(7,118 | ) | 1,837 | (5,081 | ) | (6,033 | ) | 14 | ||||||||||||
| Non-cash stock compensation / LTIP and profits interest expense(b) |
(1,090 | ) | (1,446 | ) | 4,514 | 892 | 32,479 | |||||||||||||
| Business transformation costs(c) |
7,461 | 22,706 | 12,515 | 3,591 | 2,924 | |||||||||||||||
| Operational transformation costs(d) |
— | 1,244 | 8,532 | 1,394 | 5,826 | |||||||||||||||
| Impairment costs(e) |
— | 12,568 | — | — | — | |||||||||||||||
| Debt refinancing and IPO costs(f) |
— | — | — | — | 3,706 | |||||||||||||||
| COVID-19 costs(g) |
— | — | 17,061 | 2,051 | 480 | |||||||||||||||
| Gain on disposal of assets held for sale |
— | — | — | — | (5,185 | ) | ||||||||||||||
|
|
|
|
|
|
|
|
|
|
|
|||||||||||
| Adjusted income from operations |
$ | 170,269 | $ | 143,778 | $ | 189,005 | $ | 58,281 | $ | 161,106 | ||||||||||
|
|
|
|
|
|
|
|
|
|
|
|||||||||||
| Net income |
$ | 113,295 | $ | 50,120 | $ | 88,880 | $ | 23,607 | $ | 73,795 | ||||||||||
113
Table of Contents
| Fiscal Years Ended September 30, | Six Months Ended March 31, |
|||||||||||||||||||
| 2018 | 2019 | 2020 | 2020 | 2021 | ||||||||||||||||
| (Dollars in thousands) | ||||||||||||||||||||
| Adjustments: |
||||||||||||||||||||
| Non-cash stock compensation / LTIP and profits interest expense(b) |
$ | (1,090 | ) | $ | (1,446 | ) | $ | 4,514 | $ | 892 | $ | 32,479 | ||||||||
| Business transformation costs(c) |
7,461 | 22,706 | 12,515 | 3,591 | 2,924 | |||||||||||||||
| Operational transformation costs(d) |
— | 1,244 | 8,532 | 1,394 | 5,826 | |||||||||||||||
| Impairment costs(e) |
— | 12,568 | — | — | — | |||||||||||||||
| Debt refinancing and IPO costs(f) |
— | — | — | — | 3,706 | |||||||||||||||
| COVID-19 costs(g) |
— | — | 17,061 | 2,051 | 480 | |||||||||||||||
| Loss from early extinguishment of debt |
— | — | — | — | 5,448 | |||||||||||||||
| Gain on disposal of assets held for sale |
— | — | — | — | (5,185 | ) | ||||||||||||||
| Tax impact of adjusting items |
(854 | ) | (7,330 | ) | (5,498 | ) | (943 | ) | (8,405 | ) | ||||||||||
|
|
|
|
|
|
|
|
|
|
|
|||||||||||
| Adjusted net income |
$ | 118,812 | $ | 77,862 | $ | 126,004 | $ | 30,592 | $ | 111,068 | ||||||||||
|
|
|
|
|
|
|
|
|
|
|
|||||||||||
| Net income |
$ | 113,295 | $ | 50,120 | $ | 88,880 | $ | 23,607 | $ | 73,795 | ||||||||||
| Adjustments: |
||||||||||||||||||||
| Interest expense, net |
33,015 | 44,017 | 39,087 | 20,410 | 31,749 | |||||||||||||||
| Income tax expense |
17,588 | 13,544 | 13,812 | 3,558 | 15,389 | |||||||||||||||
| Depreciation and amortization |
48,617 | 46,317 | 42,347 | 21,472 | 20,328 | |||||||||||||||
|
|
|
|
|
|
|
|
|
|
|
|||||||||||
| EBITDA |
$ | 212,515 | $ | 153,998 | $ | 184,126 | $ | 69,047 | $ | 141,261 | ||||||||||
| Non-cash stock compensation / LTIP and profits interest expense(b) |
(1,090 | ) | (1,446 | ) | 4,514 | 892 | 32,479 | |||||||||||||
| Business transformation costs(c) |
7,461 | 22,706 | 12,515 | 3,591 | 2,924 | |||||||||||||||
| Operational transformation costs(d) |
— | 1,244 | 8,532 | 1,394 | 5,826 | |||||||||||||||
| Impairment costs(e) |
— | 12,568 | — | — | — | |||||||||||||||
| Debt refinancing and IPO costs(f) |
— | — | — | — | 3,706 | |||||||||||||||
| COVID-19 costs(g) |
— | — | 17,061 | 2,051 | 480 | |||||||||||||||
| Loss from early extinguishment of debt |
— | — | — | — | 5,448 | |||||||||||||||
| Gain on disposal of assets held for sale |
— | — | — | — | (5,185 | ) | ||||||||||||||
|
|
|
|
|
|
|
|
|
|
|
|||||||||||
| Adjusted EBITDA |
$ | 218,886 | $ | 189,070 | $ | 226,748 | $ | 76,975 | $ | 186,939 | ||||||||||
|
|
|
|
|
|
|
|
|
|
|
|||||||||||
| (a) | Adjusted income from operations includes foreign currency (loss) gain in order to align adjusted income from operations with Adjusted EBITDA, with the exception of depreciation and amortization and loss (gain) from investments in unconsolidated affiliates. |
| (b) | Our financial results reflect an increase in other long-term liabilities of approximately $30.0 million related to an increase in the value of our profits interest units as well as a change in accounting methodology from the intrinsic value method to the fair value method during the quarter ended March 31, 2021. These changes resulted in a selling, general and administrative expense of approximately $30.0 million for the six months ended March 31, 2021. |
| (c) | “Business transformation costs” are defined as costs incurred typically during the earlier stages of the new leadership team’s tenure with Weber in order to transition the organization to the future operating structure. These costs include major business transformation initiatives that require severance or other costs to transition to a new operating model. |
| (d) | “Operational transformation costs” are defined as restructuring and transformation initiatives related to major supply chain, operational moves and startups that are designed to enable future productivity. These costs also include significant systems integration costs, as well was plant shutdown and closure costs that will drive future efficiencies. |
| (e) | As part of our Fiscal Year 2019 annual goodwill impairment test, we recognized a non-cash impairment loss of $12.6 million on the iGrill goodwill. |
114
Table of Contents
| (f) | “Debt refinancing and IPO costs” are defined as certain non-capitalizable costs from the refinancing of the Company’s term loan and costs related to the initial public offering. |
| (g) | During Fiscal Year 2020 and the six months ended March 31, 2021, the Company incurred a number of significant costs related to the global COVID-19 pandemic. These non-recurring costs included plant shutdown costs, the impact of enhanced employee safety and social distancing protocols as well as overtime and expedited freight costs to fulfill significant unexpected demand increases driven by stay-at-home orders in many of our key markets. These costs have begun normalizing in Fiscal Year 2021. |
Results of Operations
Six Months Ended March 31, 2021 Compared to the Six Months Ended March 31, 2020
The following table sets forth our summarized condensed consolidated statements of income data for the six months ended March 31, 2020 and 2021 and the dollar and percentage change between the respective periods:
| (Dollars in thousands) |
Six Months Ended March 31, |
$ Variance Increase/ (Decrease) |
% Variance Increase/ (Decrease) |
|||||||||||||
| 2020 | 2021 | |||||||||||||||
| Net sales |
$ | 596,376 | $ | 963,309 | $ | 366,933 | 62 | % | ||||||||
| Cost of goods sold(1)(2) |
358,417 | 542,782 | 184,365 | 51 | % | |||||||||||
|
|
|
|
|
|
|
|
|
|||||||||
| Gross profit |
237,959 | 420,527 | 182,568 | 77 | % | |||||||||||
| Operating expenses: |
||||||||||||||||
| Selling, general and administrative(1)(2) |
174,718 | 297,986 | 123,268 | 71 | % | |||||||||||
| Amortization of intangible assets |
6,855 | 6,864 | 9 | N/M | (4) | |||||||||||
| Gain on disposal of assets held for sale |
— | (5,185 | ) | (5,185 | ) | N/M | (4) | |||||||||
|
|
|
|
|
|
|
|
|
|||||||||
| Income from operations |
56,386 | 120,862 | 64,476 | 114 | % | |||||||||||
| Foreign currency loss (gain) |
6,033 | (14 | ) | (6,047 | ) | N/M | (4) | |||||||||
| Interest income |
(701 | ) | (425 | ) | 276 | (39 | %) | |||||||||
| Interest expense |
21,111 | 32,174 | 11,063 | 52 | % | |||||||||||
| Loss from early extinguishment of debt |
— | 5,448 | 5,448 | N/M | (4) | |||||||||||
|
|
|
|
|
|
|
|
|
|||||||||
| Income before taxes |
29,943 | 83,679 | 53,736 | 179 | % | |||||||||||
| Income taxes |
3,558 | 15,389 | 11,831 | N/M | (4) | |||||||||||
| Loss (gain) from investments in unconsolidated affiliates |
2,778 | (5,505 | ) | (8,283 | ) | N/M | (4) | |||||||||
|
|
|
|
|
|
|
|
|
|||||||||
| Net income |
$ | 23,607 | $ | 73,795 | $ | 50,188 | 213 | % | ||||||||
|
|
|
|
|
|
|
|
|
|||||||||
| Adjusted income from operations(3) |
$ | 58,281 | $ | 161,106 | $ | 102,825 | 176 | % | ||||||||
| Adjusted net income(3) |
$ | 30,592 | $ | 111,068 | $ | 80,476 | 263 | % | ||||||||
| EBITDA(3) |
$ | 69,047 | $ | 141,261 | $ | 72,214 | 105 | % | ||||||||
| Adjusted EBITDA(3) |
$ | 76,975 | $ | 186,939 | $ | 109,964 | 143 | % | ||||||||
| (1) | Amounts include unit-based compensation as follows: |
| Six Months Ended March 31, |
||||||||
| 2020 | 2021 | |||||||
| (dollars in thousands) |
||||||||
| Cost of goods sold |
$ | 65 | $ | 279 | ||||
| Selling, general and administrative |
827 | 32,200 | ||||||
|
|
|
|
|
|||||
| Total unit-based compensation |
$ | 892 | $ | 32,479 | ||||
|
|
|
|
|
|||||
115
Table of Contents
| (2) | Amount includes depreciation and amortization expense as follows: |
| Six Months Ended March 31, |
||||||||
| 2020 | 2021 | |||||||
| (dollars in thousands) | ||||||||
| Cost of goods sold |
$ | 8,024 | $ | 6,457 | ||||
| Selling, general and administrative |
6,593 | 7,007 | ||||||
|
|
|
|
|
|||||
| Total depreciation and amortization expense |
$ | 14,617 | $ | 13,464 | ||||
|
|
|
|
|
|||||
| (3) | See the section titled “Management’s Discussion and Analysis of Financial Condition and Results of Operations—Non-GAAP Measures.” |
| (4) | “N/M” indicates that variance as a percentage is not meaningful. |
The following table sets forth our summarized consolidated statement of operations data for the six months ended March 31, 2020 and 2021, expressed as a percentage of net sales (the table may not foot due to rounding):
| Six Months Ended March 31, |
||||||||
| 2020 | 2021 | |||||||
| Net sales |
100.0 | % | 100.0 | % | ||||
| Cost of goods sold |
60.1 | % | 56.3 | % | ||||
| Gross margin |
39.9 | % | 43.7 | % | ||||
| Operating expenses: |
||||||||
| Selling, general and administrative |
29.3 | % | 30.9 | % | ||||
| Amortization of intangible assets |
1.1 | % | 0.7 | % | ||||
| Gain on disposal of assets held for sale |
0.0 | % | (0.5 | %) | ||||
| Income from operations |
9.5 | % | 12.5 | % | ||||
| Foreign currency (gain) loss |
1.0 | % | (0.0 | %) | ||||
| Interest income |
(0.1 | %) | (0.0 | %) | ||||
| Interest expense |
3.5 | % | 3.3 | % | ||||
| Loss from early extinguishment of debt |
0.0 | % | 0.6 | % | ||||
| Income before taxes |
5.0 | % | 8.7 | % | ||||
| Income taxes |
0.6 | % | 1.6 | % | ||||
| Loss (gain) from investments in unconsolidated affiliates |
0.5 | % | (0.6 | %) | ||||
| Net income |
4.0 | % | 7.7 | % | ||||
| Adjusted income from operations |
9.8 | % | 16.7 | % | ||||
| Adjusted net income |
5.1 | % | 11.5 | % | ||||
| EBITDA |
11.6 | % | 14.7 | % | ||||
| Adjusted EBITDA |
12.9 | % | 19.4 | % | ||||
Six Months Ended March 31, 2021 Compared to the Six Months Ended March 31, 2020
Net Sales
Net sales for the six months ended March 31, 2021 increased by $366.9 million, or 62%, to $963.3 million from $596.4 million during the six months ended March 31, 2020. The increase was primarily attributable to increased consumer demand for outdoor products and continued inventory restocking at our retail partners to keep pace with market trends. In particular, we saw 208% growth at Weber.com and 55% growth at our e-commerce partners versus the six months ended March 31, 2020. Fluctuation in foreign exchange rates also increased net sales by $34.0 million, particularly the Euro as compared to the U.S. dollar. Net sales for the six months ended March 31, 2021 increased in the Americas by 65%, in EMEA by 50%, and in APAC by 84%, as compared to the six months ended March 31, 2020.
116
Table of Contents
Americas—Total segment net sales for the six months ended March 31, 2021 increased by $217.4 million, or 65%, to $552.2 million from $334.9 million during the six months ended March 31, 2020. The increase was primarily attributable to increased orders across all channels in Fiscal Year 2021 to date as inventories were restocked following a strong fourth quarter of Fiscal Year 2020, and customers prepared for the continuation of favorable outdoor/backyard cooking trends. Online sales accelerated, with Weber.com sales growing 420% from Fiscal Year 2020. Our e-commerce channels grew over 55% versus prior year. Foreign exchange rates also trended favorably, contributing an additional $2.2 million of net sales in Fiscal Year 2021 to date, primarily driven by the Canadian dollar as compared to the U.S. dollar.
EMEA—Total segment net sales for the six months ended March 31, 2021 increased by $104.1 million, or 50%, to $311.3 million from $207.2 million during the six months ended March 31, 2020. The increase was attributable to widespread growth across most countries in the region, as consumer demand for at-home/outdoor grilling products continued to strengthen. Italy and France realized accelerated growth at 94% and 62%, respectively, rebounding from suppressed sales during the six months ended March 31, 2020. Foreign exchange rates also trended favorably, contributing an additional $23.8 million of net sales, primarily driven by the Euro as compared to the U.S. dollar.
APAC—Total segment net sales for the six months ended March 31, 2021 increased by $45.5 million, or 84%, to $99.8 million from $54.3 million during the six months ended March 31, 2020. The increase was primarily attributable to growth in the Australia and New Zealand markets, driven by strong consumer demand in Fiscal Year 2021 to date. During the first half of 2020, bush fires impacted the consumer’s opportunities to cook outdoors, significantly softening grill sales during that period. Sales in Asia grew by 167% due to suppressed sales in the first half of Fiscal Year 2020 resulting from the onset of the COVID-19 pandemic in that region. Foreign exchange rates also trended favorably, contributing an additional $8.2 million of net sales, primarily driven by the Australian dollar as compared to the U.S. dollar.
Cost of Goods Sold
Cost of goods sold for the six months ended March 31, 2021 increased by $184.4 million, or 51%, to $542.8 million from $358.4 million during the six months ended March 31, 2020. The increase was primarily due to the increased sales volume, partially offset by negotiated savings and other productivity measures in Fiscal Year 2021 to date.
Gross Profit and Gross Margin
Gross profit for the six months ended March 31, 2021 increased by $182.6 million, or 77%, to $420.5 million from $238.0 million during the six months ended March 31, 2020. Gross margin increased by 380 basis points to 43.7% during the six months ended March 31, 2021 compared to the six months ended March 31, 2020. The increase in gross margin was primarily driven by higher sales volumes, favorable product mix, and lower costs from suppliers.
Selling, General and Administrative
Selling, general and administrative costs for the six months ended March 31, 2021 increased by $123.3 million, or 71%, to $298.0 million from $174.7 million during the six months ended March 31, 2020. Selling, general and administrative costs as a percent of net sales increased by 160 basis points to 30.9% during the six months ended March 31, 2021 compared to the six months ended March 31, 2020. The increase in selling, general and administrative costs was primarily driven by increased distribution costs of $27.3 million associated with higher sales volumes; higher advertising costs of $15.1 million to drive revenue; higher stock-based compensation costs of $31.4 million; increased incentive compensation accruals of $21.6 million as a result of exceeding business targets; additional commission costs of $8.9 million on higher revenue; and higher corporate expenses of $14.4 million as a result of increased investment to support our growth initiatives.
117
Table of Contents
Amortization of Intangible Assets
Amortization of intangible assets of $6.9 million for the six months ended March 31, 2021 remained relatively consistent compared to the six months ended March 31, 2020. Amortization of intangible assets as a percent of net sales decreased by 40 basis points to 0.7% during the six months ended March 31, 2021 compared to six months ended March 31, 2020. The consistent amortization of intangible assets was primarily driven by the amortization of intangible assets related to the June acquisition of $1.8 million, partially offset by certain assets becoming fully amortized in Fiscal Year 2021.
Gain on Disposal of Assets Held for Sale
During Fiscal Year 2020, we determined that one of our manufacturing sites was considered to be assets held for sale, since the asset group was being marketed for sale and all the criteria to be classified as held for sale under ASC 360 had been met. On December 30, 2020, we disposed of this manufacturing site for net cash proceeds of $13.5 million, resulting in the recognition of a gain on the disposal of assets held for sale for the six months ended March 31, 2021 of $5.2 million. No gain or loss on the disposal of assets held for sale was recognized for the six months ended March 31, 2020.
Foreign Currency Loss (Gain)
The impact of foreign exchange resulted in a gain of $0.0 million for the six months ended March 31, 2021 relative to a loss of $6.0 million for the six months ended March 31, 2020 due to the foreign exchange rate impacts on transactions with affiliates conducted in foreign currencies other than the U.S. dollar.
Interest Income
Interest income decreased by $0.3 million, or 39%, during the six months ended March 31, 2021 compared to the six months ended March 31, 2020, primarily due to changes in interest rates and in the balances of cash and cash equivalents.
Interest Expense
Interest expense increased by $11.1 million, or 52%, during the six months ended March 31, 2021 compared to the six months ended March 31, 2020, primarily due to the increase in the Company’s term loan subsequent to the refinancing in the first quarter of Fiscal Year 2021 and the higher effective rate due to the Secured Credit Facility’s term loan LIBOR floor in combination with the interest rate swaps hedging the debt.
Loss from Early Extinguishment of Debt
We recognized a loss from the early extinguishment of debt of $5.4 million for the six months ended March 31, 2021 and no gain or loss from the early extinguishment of debt was recognized for the six months ended March 31, 2020.
Income Taxes
Income taxes increased by $11.8 million during the six months ended March 31, 2021 compared to the six months ended March 31, 2020, primarily due to the increase in foreign income which is taxed at local statutory rates.
118
Table of Contents
Loss (Gain) from Investments in Unconsolidated Affiliates
We recorded a loss from investments in unconsolidated affiliates for the six months ended March 31, 2020 of $2.8 million and a gain from investments in unconsolidated affiliates for the six months ended March 31, 2021 of $5.5 million. In Fiscal Year 2019, we executed an agreement with June to purchase $23.0 million of June’s preferred stock and $1.3 million of June’s common stock. We determined that we had significant influence over June, which resulted in accounting for the common stock investments in June as an equity method investment. The $2.8 million loss during the six months ended March 31, 2020 is a result of Weber recording its share of June’s losses. The $5.5 million gain during the six months ended March 31, 2021 is a result of the $6.9 million gain from the remeasurement of the existing equity interest in June to fair value at the time of acquisition, offset by a $1.4 million loss recorded for Weber’s share of June’s losses in the first quarter of Fiscal Year 2021.
Net Income
Net income increased by $50.2 million, or 213%, to net income of $73.8 million for the six months ended March 31, 2021 from net income of $23.6 million for the six months ended March 31, 2020, for the reasons described above.
Segment Information
We operate and manage our business in three reportable segments: Americas, which consists of Canada, Chile, Mexico and the United States; the European, Middle East and African regions (“EMEA”); and the Asia-Pacific region (“APAC”), which includes Australia and New Zealand. We identify our reportable segments based on the information used by the Chief Operating Decision Maker (“CODM”) to monitor performance and allocate resources. See Note 14 of the notes to our condensed consolidated financial statements included elsewhere in this prospectus for additional information regarding our reportable segments.
Net sales by reportable segment is summarized as follows:
| Six Months Ended March 31, |
$ Variance Increase/ (Decrease) |
% Variance Increase/ (Decrease) |
||||||||||||||
| (Dollars in thousands) |
2020 | 2021 | ||||||||||||||
| Americas |
$ | 334,860 | $ | 552,209 | $ | 217,349 | 65 | % | ||||||||
| EMEA |
207,203 | 311,326 | 104,123 | 50 | % | |||||||||||
| APAC |
54,313 | 99,774 | 45,461 | 84 | % | |||||||||||
|
|
|
|
|
|
|
|
|
|||||||||
| Total net sales |
$ | 596,376 | $ | 963,309 | $ | 366,933 | 62 | % | ||||||||
|
|
|
|
|
|
|
|
|
|||||||||
Adjusted income from operations by reportable segment is summarized as follows:
| Six Months Ended March 31, |
$ Variance Increase/ (Decrease) |
% Variance Increase/ (Decrease) |
||||||||||||||
| (Dollars in thousands) |
2020 | 2021 | ||||||||||||||
| Americas |
$ | 68,929 | $ | 117,041 | $ | 48,112 | 70 | % | ||||||||
| EMEA |
45,740 | 98,136 | 52,396 | 115 | % | |||||||||||
| APAC |
12,288 | 26,974 | 14,686 | 120 | % | |||||||||||
119
Table of Contents
The following table reconciles segment adjusted income from operations to income from operations for the periods presented:
| Six Months Ended March 31, |
||||||||
| 2020 | 2021 | |||||||
| (Dollars in thousands) | ||||||||
| Segment adjusted income from operations |
||||||||
| Americas |
$ | 68,929 | $ | 117,041 | ||||
| EMEA |
45,740 | 98,136 | ||||||
| APAC |
12,288 | 26,974 | ||||||
|
|
|
|
|
|||||
| Segment adjusted income from operations for reportable segments |
126,957 | 242,151 | ||||||
| Corporate and supply chain costs |
(68,676 | ) | (81,045 | ) | ||||
| Foreign currency loss (gain)(a) |
6,033 | (14 | ) | |||||
| Non-cash stock compensation / LTIP expense(a) |
(892 | ) | (32,479 | ) | ||||
| Business transformation costs(a) |
(3,591 | ) | (2,924 | ) | ||||
| Operational transformation costs(a) |
(1,394 | ) | (5,826 | ) | ||||
| Debt refinancing and IPO costs(a) |
— | (3,706 | ) | |||||
| COVID-19 costs(a) |
(2,051 | ) | (480 | ) | ||||
| Gain on disposal of assets held for sale(a) |
— | 5,185 | ||||||
|
|
|
|
|
|||||
| Income from operations |
$ | 56,386 | $ | 120,862 | ||||
|
|
|
|
|
|||||
| (a) | See “Non-GAAP Measures—adjusted income from operations” for descriptions of reconciling items from income from operations to adjusted income from operations. |
Americas
The following table summarizes certain financial information relating to the Americas segment results that have been derived from our condensed consolidated financial statements for the six months ended March 31, 2020 and 2021.
| (Dollars in thousands) |
Six Months Ended March 31, |
$ Variance Increase/ (Decrease) |
% Variance Increase/ (Decrease) |
|||||||||||||
| 2020 | 2021 | |||||||||||||||
| Total segment net sales |
$ | 334,860 | $ | 552,209 | $ | 217,349 | 65 | % | ||||||||
| Segment adjusted income from operations |
$ | 68,929 | $ | 117,041 | $ | 48,112 | 70 | % | ||||||||
Total Segment Net Sales. Total segment net sales for the six months ended March 31, 2021 increased by $217.3 million, or 65%, to $552.2 million from $334.9 million during the six months ended March 31, 2020. The increase was primarily attributable to increased order patterns across our customers in Fiscal Year 2021 as they restocked inventory following a strong fourth quarter of Fiscal Year 2020 and prepared for backyard and at-home cooking trends to continue. Online sales accelerated, with Weber.com sales growing 420% from Fiscal Year 2020. Our e-commerce channels grew over 55% versus prior year. Foreign exchange rates also trended favorably, contributing an additional $2.2 million of net sales in Fiscal Year 2021 to date, primarily driven by the Canadian dollar as compared to the U.S. dollar.
Segment Adjusted Income from Operations. Segment adjusted income from operations for the six months ended March 31, 2021 increased by $48.1 million, or 70%, to $117.0 million from $68.9 million during the six months ended March 31, 2020. This increase was primarily attributed to $217.3 million sales growth in Fiscal Year 2021 to date, partially offset by an $18.8 million increase in distribution costs on higher sales, $11.1 million strategic investment in advertising and marketing to drive revenue, $4.6 million of commissions on higher sales, and $3.5 million of incentive compensation due to
120
Table of Contents
exceeding business targets. The six months ended March 31, 2021 also includes $3.4 million of June selling, general and administrative expense as a result of the June acquisition.
EMEA
The following table summarizes certain financial information relating to the EMEA segment results that have been derived from our condensed consolidated financial statements for the six months ended March 31, 2020 and 2021.
| (Dollars in thousands) |
Six Months Ended March 31, |
$ Variance Increase/ (Decrease) |
% Variance Increase/ (Decrease) |
|||||||||||||
| 2020 | 2021 | |||||||||||||||
| Total segment net sales |
$ | 207,203 | $ | 311,326 | $ | 104,123 | 50 | % | ||||||||
| Segment adjusted income from operations |
$ | 45,740 | $ | 98,136 | $ | 52,396 | 115 | % | ||||||||
Total Segment Net Sales. Total segment net sales for the six months ended March 31, 2021 increased by $104.1 million, or 50%, to $311.3 million from $207.2 million during the six months ended March 31, 2020. The increase was attributable to widespread growth across the region as consumer demand for grilling and at-home grilling continued to strengthen. Italy and France realized accelerated growth (at 94% and 62% respectively), rebounding from suppressed sales in Fiscal Year 2020. Foreign exchange rates also trended favorably, contributing an additional $23.8 million of net sales, primarily driven by the Euro as compared to the U.S. dollar.
Segment Adjusted Income from Operations. Segment adjusted income from operations for the six months ended March 31, 2021 increased by $52.4 million, or 115%, to $98.1 million from $45.7 million during the six months ended March 31, 2020. This increase was primarily attributed to the $104.1 million sales growth in Fiscal Year 2021 to date. This was partially offset by $5.6 million of additional distribution costs on sales, $3.8 million investments in advertising to drive sales, and $4.4 million of additional incentive compensation as a result of exceeding business targets. The increase was also attributable to a positive foreign currency impact of $1.3 million.
APAC
The following table summarizes certain financial information relating to the APAC segment results that have been derived from our condensed consolidated financial statements for the six months ended March 31, 2020 and 2021.
| (Dollars in thousands) |
Six Months Ended March 31, |
$ Variance Increase/ (Decrease) |
% Variance Increase/ (Decrease) |
|||||||||||||
| 2020 | 2021 | |||||||||||||||
| Total segment net sales |
$ | 54,313 | $ | 99,774 | $ | 45,461 | 84 | % | ||||||||
| Segment adjusted income from operations |
$ | 12,288 | $ | 26,974 | $ | 14,686 | 120 | % | ||||||||
Total Segment Net Sales. Total segment net sales for the six months ended March 31, 2021 increased by $45.5 million, or 84%, to $99.8 million from $54.3 million during the six months ended March 31, 2020. The increase was primarily attributable to growth in the Australian market driven by strong consumer demand in Fiscal Year 2021 to date. During the first half of 2020, bush fires impacted the consumer’s opportunities to cook outdoors, significantly softening grill sales during that period. Sales in Asia grew by 167% due to suppressed sales in the first half of 2020 resulting from the onset of the COVID-19 pandemic in that region. Foreign exchange rates also trended favorably, contributing an additional $8.2 million of net sales, primarily driven by the Australian dollar as compared to the U.S. dollar.
121
Table of Contents
Segment Adjusted Income from Operations. Segment adjusted income from operations for the six months ended March 31, 2021 increased by $14.7 million, or 120%, to $27.0 million from $12.3 million during the six months ended March 31, 2020. This increase was primarily attributed to the $45.5 million sales growth in Fiscal Year 2021 to date. This was partially offset by $3.2 million of distribution costs on higher sales, $4.3 million of commission expense in Australia and New Zealand, and $0.5 million of additional incentive compensation as a result of exceeding business targets. A negative foreign currency impact of $1.1 million partially offset these increases.
Fiscal Year 2018 Compared to Fiscal Year 2019 and Fiscal Year 2019 Compared to Fiscal Year 2020
The following table sets forth our summarized consolidated statement of operations data for Fiscal Years 2018, 2019 and 2020 and the dollar and percentage change between the respective periods:
| (Dollars in thousands) |
Fiscal Years Ended September 30, |
$ Variance Increase/ (Decrease) |
% Variance Increase/ (Decrease) |
Fiscal Years Ended September 30, |
$ Variance Increase/ (Decrease) |
% Variance Increase/ (Decrease) |
||||||||||||||||||||||||||
| 2018 | 2019 | 2019 | 2020 | |||||||||||||||||||||||||||||
| Net sales |
$ | 1,340,032 | $ | 1,296,210 | $ | (43,822 | ) | (3 | %) | $ | 1,296,210 | $ | 1,525,260 | $ | 229,050 | 18 | % | |||||||||||||||
| Cost of goods sold(1)(2) |
759,786 | 793,536 | 33,750 | 4 | % | 793,536 | 915,586 | 122,050 | 15 | % | ||||||||||||||||||||||
|
|
|
|
|
|
|
|
|
|
|
|
|
|
|
|
|
|||||||||||||||||
| Gross profit |
580,246 | 502,674 | (77,572 | ) | (13 | %) | 502,674 | 609,674 | 107,000 | 21 | % | |||||||||||||||||||||
| Operating expenses: |
||||||||||||||||||||||||||||||||
| Selling, general and administrative(1)(2) |
397,444 | 369,651 | (27,793 | ) | (7 | %) | 369,651 | 444,975 | 75,324 | 20 | % | |||||||||||||||||||||
| Amortization of intangible assets |
11,786 | 13,586 | 1,800 | 15 | % | 13,586 | 13,235 | (351 | ) | (3 | %) | |||||||||||||||||||||
| Impairment of assets |
— | 12,568 | 12,568 | N/M | (4) | 12,568 | — | (12,568 | ) | N/M | (4) | |||||||||||||||||||||
|
|
|
|
|
|
|
|
|
|
|
|
|
|
|
|
|
|||||||||||||||||
| Income from operations |
171,016 | 106,869 | (64,147 | ) | (38 | %) | 106,869 | 151,464 | 44,595 | 42 | % | |||||||||||||||||||||
| Foreign currency loss (gain) |
7,118 | (1,837 | ) | (8,955 | ) | |
N/M |
(4) |
(1,837 | ) | 5,081 | 6,918 | |
N/M |
(4) | |||||||||||||||||
| Interest income |
(1,594 | ) | (1,153 | ) | 441 | (28 | %) | (1,153 | ) | (1,270 | ) | (117 | ) | 10 | % | |||||||||||||||||
| Interest expense |
34,609 | 45,170 | 10,561 | 31 | % | 45,170 | 40,357 | (4,813 | ) | (11 | %) | |||||||||||||||||||||
|
|
|
|
|
|
|
|
|
|
|
|
|
|
|
|
|
|||||||||||||||||
| Income before taxes |
130,883 | 64,689 | (66,194 | ) | (51 | %) | 64,689 | 107,296 | 42,607 | 66 | % | |||||||||||||||||||||
| Income taxes |
17,588 | 13,544 | (4,044 | ) | (23 | %) | 13,544 | 13,812 | 268 | 2 | % | |||||||||||||||||||||
| Loss from investments in unconsolidated affiliates |
— | 1,025 | 1,025 | N/M | (4) | 1,025 | 4,604 | 3,579 | |
N/M |
(4) | |||||||||||||||||||||
|
|
|
|
|
|
|
|
|
|
|
|
|
|
|
|
|
|||||||||||||||||
| Net income |
$ | 113,295 | $ | 50,120 | $ | (63,175 | ) | (56 | %) | $ | 50,120 | $ | 88,880 | $ | 38,760 | 77 | % | |||||||||||||||
|
|
|
|
|
|
|
|
|
|
|
|
|
|
|
|
|
|||||||||||||||||
| Adjusted income from operations(3) |
$ | 170,269 | $ | 143,778 | $ | (26,491 | ) | (16 | %) | $ | 143,778 | $ | 189,005 | $ | 45,227 | 31 | % | |||||||||||||||
| Adjusted net income(3) |
$ | 118,812 | $ | 77,862 | $ | (40,950 | ) | (34 | %) | $ | 77,862 | $ | 126,004 | $ | 48,142 | 62 | % | |||||||||||||||
| EBITDA(3) |
$ | 212,515 | $ | 153,998 | $ | (58,517 | ) | (28 | %) | $ | 153,998 | $ | 184,126 | $ | 30,128 | 20 | % | |||||||||||||||
| Adjusted EBITDA(3) |
$ | 218,886 | $ | 189,070 | $ | (29,816 | ) | (14 | %) | $ | 189,070 | $ | 226,748 | $ | 37,678 | 20 | % | |||||||||||||||
| (1) | Amounts include unit-based compensation as follows: |
| Fiscal Years Ended September 30, | ||||||||||||
| 2018 | 2019 | 2020 | ||||||||||
| (dollars in thousands) | ||||||||||||
| Cost of goods sold |
$ | (138 | ) | $ | — | $ | 663 | |||||
| Selling, general and administrative |
(952 | ) | (1,446 | ) | 3,851 | |||||||
|
|
|
|
|
|
|
|||||||
| Total unit-based compensation |
$ | (1,090 | ) | $ | (1,446 | ) | $ | 4,514 | ||||
|
|
|
|
|
|
|
|||||||
122
Table of Contents
| (2) | Amount includes depreciation and amortization expense as follows: |
| Fiscal Years Ended September 30, | ||||||||||||
| 2018 | 2019 | 2020 | ||||||||||
| (dollars in thousands) | ||||||||||||
| Cost of goods sold |
$ | 22,066 | $ | 17,106 | $ | 15,697 | ||||||
| Selling, general and administrative |
14,765 | 15,625 | 13,415 | |||||||||
|
|
|
|
|
|
|
|||||||
| Total depreciation and amortization expense |
$ | 36,831 | $ | 32,731 | $ | 29,112 | ||||||
|
|
|
|
|
|
|
|||||||
| (3) | See the section titled “Management’s Discussion and Analysis of Financial Condition and Results of Operations—Non-GAAP Measures.” |
| (4) | “N/M” indicates that variance as a percentage is not meaningful. |
The following table sets forth our summarized consolidated statement of operations data for Fiscal Years 2018, 2019 and 2020, expressed as a percentage of net sales (the table may not foot due to rounding):
| Fiscal Years Ended September 30, | ||||||||||||
| 2018 | 2019 | 2020 | ||||||||||
| Net sales |
100.0 | % | 100.0 | % | 100.0 | % | ||||||
| Cost of goods sold |
56.7 | % | 61.2 | % | 60.0 | % | ||||||
| Gross margin |
43.3 | % | 38.8 | % | 40.0 | % | ||||||
| Operating expenses: |
||||||||||||
| Selling, general and administrative |
29.7 | % | 28.5 | % | 29.2 | % | ||||||
| Amortization of intangible assets |
0.9 | % | 1.0 | % | 0.9 | % | ||||||
| Impairment of assets |
0.0 | % | 1.0 | % | 0.0 | % | ||||||
| Income from operations |
12.8 | % | 8.2 | % | 9.9 | % | ||||||
| Foreign currency (gain) loss |
0.5 | % | (0.1 | %) | 0.3 | % | ||||||
| Interest income |
(0.1 | %) | (0.1 | %) | (0.1 | %) | ||||||
| Interest expense |
2.6 | % | 3.5 | % | 2.6 | % | ||||||
| Income before taxes |
9.8 | % | 5.0 | % | 7.0 | % | ||||||
| Income taxes |
1.3 | % | 1.0 | % | 0.9 | % | ||||||
| Loss from investments in unconsolidated affiliates |
0.0 | % | 0.1 | % | 0.3 | % | ||||||
| Net income |
8.5 | % | 3.9 | % | 5.8 | % | ||||||
| Adjusted income from operations |
12.7 | % | 11.1 | % | 12.4 | % | ||||||
| Adjusted net income |
8.9 | % | 6.0 | % | 8.3 | % | ||||||
| EBITDA |
15.9 | % | 11.9 | % | 12.1 | % | ||||||
| Adjusted EBITDA |
16.3 | % | 14.6 | % | 14.9 | % | ||||||
Fiscal Year 2020 Compared to Fiscal Year 2019
Net Sales
Net sales for Fiscal Year 2020 increased by $229.1 million, or 18%, to $1,525.3 million from $1,296.2 million during Fiscal Year 2019. The increase was attributable to an increased consumer demand for outdoor goods, including the Company’s grills and accessories, new product launches and expanded distribution during Fiscal Year 2020. In particular, we saw significant increases in our DTC Business (79%) and our retail partners continued to restock inventory levels to keep up with increasing consumer demand. This increase in net sales was partially offset by fluctuations in foreign exchange rates, particularly the Euro as compared to the U.S. dollar. Net sales for Fiscal Year 2020 increased in the Americas by 23%, in EMEA by 12%, and in APAC by 6%, as compared to the prior year.
123
Table of Contents
Americas—Consumers shifting focus to the backyard and at-home cooking generated significant increases in consumer demand, especially in our DTC and e-commerce channels. Accelerated growth in our DTC channels were led by Weber.com, with sales growing in excess of 500% from Fiscal Year 2019 to Fiscal Year 2020. Growth in our e-commerce channels was over 20% from Fiscal Year 2019 to Fiscal Year 2020.
EMEA—Growth was widespread across the entire region as retailers increased purchases to keep up with accelerated consumer demand. Weber.com sales increased by over 90% as online shopping increased in Fiscal Year 2020. Strategic emerging markets realized accelerated growth with Russia and Poland experiencing the highest year over year growth (66% and 33%, respectively) in the region.
APAC—The increase was primarily attributable to favorable results in Australia during the second half of Fiscal Year 2020, after a difficult first half of Fiscal Year 2020 that resulted from the bush fires that were widespread across the country, impacting consumers’ opportunity to cook outdoors. The strong growth in Australia offset unfavorable COVID-19 impacts in Asia as retail was slower to recover from the pandemic.
Cost of Goods Sold
Cost of goods sold for Fiscal Year 2020 increased by $122.1 million, or 15%, to $915.6 million from $793.5 million during Fiscal Year 2019. The increase was primarily due to the increase in sales volume and tariff expenses, partially offset by favorable supplier costs negotiated for Fiscal Year 2020.
Gross Profit and Gross Margin
Gross profit for Fiscal Year 2020 increased by $107.0 million, or 21%, to $609.7 million from $502.7 million during Fiscal Year 2019. Gross margin increased by 120 basis points to 40.0% during Fiscal Year 2020 compared to Fiscal Year 2019. The increase in gross margin was primarily driven by higher sales volumes, a favorable product mix with a particular increase in accessory sales and the lower costs from suppliers. The increase in gross margin was partially offset by increased tariff expenses from Fiscal Year 2019 to Fiscal Year 2020.
Selling, General and Administrative
Selling, general and administrative costs for Fiscal Year 2020 increased by $75.3 million, or 20%, to $445.0 million from $369.7 million during Fiscal Year 2019. Selling, general and administrative costs as a percent of net sales increased by 70 basis points to 29.2% during Fiscal Year 2020 compared to Fiscal Year 2019. The increase in selling, general and administrative costs was primarily driven by increased distribution costs of $14.2 million associated with higher sales volumes versus the prior year; higher corporate expenses of $27.1 million as a result of increased investment in headcount to support our growth initiatives, and higher incentive compensation payouts; higher R&D costs of $5.7 million to support our future innovation; advertising increases of $15.0 million to drive revenue; and increased consulting and other outside service costs of $5.0 million related to market research and other internal projects.
Amortization of Intangible Assets
Amortization of intangible assets for Fiscal Year 2020 decreased by $0.4 million, or 3%, to $13.2 million from $13.6 million during Fiscal Year 2019. Amortization of intangible assets as a percent of net sales decreased by 10 basis points to 0.9% during Fiscal Year 2020 compared to Fiscal Year 2019. The decrease in amortization of intangible assets was primarily driven by assets becoming fully amortized in Fiscal Year 2019.
124
Table of Contents
Impairment of Assets
We recognized an impairment of goodwill related to iGrill in Fiscal Year 2019 of $12.6 million and no goodwill impairment was identified in Fiscal Year 2020.
Foreign Currency Loss (Gain)
The impact of foreign exchange resulted in a loss of $5.1 million in Fiscal Year 2020 relative to a gain of $1.8 million in Fiscal Year 2019 due to the foreign exchange rate impacts on transactions with affiliates conducted in foreign currencies other than the U.S. dollar.
Interest Income
Interest income increased by $0.1 million, or 10%, during Fiscal Year 2020 compared to Fiscal Year 2019, primarily due to changes in interest rates and in the balances of cash and cash equivalents.
Interest Expense
Interest expense decreased by $4.8 million, or 11%, during Fiscal Year 2020 compared to Fiscal Year 2019, primarily due to lower borrowing levels on the revolving facility in Fiscal Year 2020 as well as reduced market interest rates in the second half of 2020.
Income Taxes
Income taxes increased by $0.3 million, or 2%, during Fiscal Year 2020 compared to Fiscal Year 2019, primarily due to a tax settlement which was partially offset by losses being benefited in jurisdictions with valuation allowances and a decrease in UTP activity.
Loss from Investments in Unconsolidated Affiliates
Loss from investments in unconsolidated affiliates for Fiscal Year 2020 increased by $3.6 million to $4.6 million from $1.0 million in Fiscal Year 2019. In Fiscal Year 2019, we executed an agreement with June to purchase $23.0 million of June’s preferred stock and $1.3 million of June’s common stock. We determined that we had significant influence over June, which resulted in accounting for the common stock investment in June as an equity method investment. The $4.6 million loss is a result of Weber recording its share of June’s losses.
Net Income
Net income increased by $38.8 million, or 77%, to net income of $88.9 million for Fiscal Year 2020 from net income of $50.1 million for the comparable period in 2019, for the reasons described above.
Fiscal Year 2019 Compared to Fiscal Year 2018
Net Sales
Net sales for Fiscal Year 2019 decreased by $43.8 million, or 3%, to $1,296.2 million from $1,340.0 million during Fiscal Year 2018. The decrease was primarily attributable to fluctuations in foreign exchange rates, particularly in the Euro and Australian dollar as compared to the U.S. dollar. Net sales for Fiscal Year 2019 increased in the Americas by 2%, decreased in EMEA by 9%, and decreased in APAC by 8%, as compared to the prior year.
125
Table of Contents
Americas—The increase was primarily attributable to sales growth on Weber.com, and price increases taken across selected product lines to offset the impact of the new tariffs on imported grills, accessories, and components from China.
EMEA—The decrease was primarily attributable to $32.3 million of foreign exchange impact driven by year over year changes to the Euro, British pound and Nordic Currencies as compared to the U.S. dollar. In addition, we ended 2018 with high trade inventories in some markets, which impacted our pre-season retail trade sell-in for 2019.
APAC—The decrease was primarily attributable to $6.4 million foreign exchange impact driven by year over year changes to the Australian dollar as compared to the U.S. dollar. Softness in the Australian economy during 2019 and lower sales in India also contributed to the decline in sales.
Cost of Goods Sold
Cost of goods sold for Fiscal Year 2019 increased by $33.8 million, or 4%, to $793.5 million from $759.8 million during Fiscal Year 2018. The increase was primarily due to increased costs resulting from tariffs newly assessed in Fiscal Year 2019 on foreign-sourced product, as well as the increased product costs of manufacturing certain products domestically.
Gross Profit and Gross Margin
Gross profit for Fiscal Year 2019 decreased by $77.6 million, or 13%, to $502.7 million from $580.2 million during Fiscal Year 2018. Gross margin decreased by 450 basis points to 38.8% during Fiscal Year 2019 compared to Fiscal Year 2018. The decrease in gross margin was primarily driven by the increase in costs resulting from the impact of tariffs and increased manufacturing costs noted above, as well as the negative foreign exchange rate impact on sales flowing through to gross margin. Additionally, less fixed costs were absorbed as a result of lower net sales, which resulted in decreased gross margin.
Selling, General and Administrative
Selling, general and administrative expenses for Fiscal Year 2019 decreased by $27.8 million, or 7%, to $369.7 million from $397.4 million during Fiscal Year 2018. Selling, general and administrative expenses as a percent of net sales decreased by 120 basis points to 28.5% during Fiscal Year 2019 compared to Fiscal Year 2018. The decrease in selling, general and administrative costs was primarily driven by a $6.8 million reduction in advertising spending, a $5.8 million reduction in inventory holding costs versus the prior year, a $5.1 million reduction in commission expense, and a $4.2 million reduction in royalty expense as a result of the purchase of a trade name.
Amortization of Intangible Assets
Amortization of intangible assets for Fiscal Year 2019 increased by $1.8 million, or 15%, to $13.6 million from $11.8 million during Fiscal Year 2018. Amortization of intangible assets as a percent of net sales increased by 10 basis points to 1.0% during Fiscal Year 2019 compared to Fiscal Year 2018. The increase in amortization of intangible assets was primarily driven by the purchase of a trade name in 2019.
Impairment of Assets
We recognized an impairment of goodwill related to iGrill in Fiscal Year 2019 of $12.6 million. No goodwill impairment was identified in Fiscal Year 2018.
126
Table of Contents
Foreign Currency Loss (Gain)
The impact of foreign exchange resulted in a gain of $1.8 million in Fiscal Year 2019 relative to a loss of $7.1 million in Fiscal Year 2020 due to the foreign exchange rate impacts on transactions with affiliates conducted in foreign currencies other than the U.S. dollar.
Interest Income
Interest income decreased by $0.4 million, or 28%, during Fiscal Year 2019 compared to Fiscal Year 2018, primarily due to changes in interest rates and in the balances of cash and cash equivalents.
Interest Expense
Interest expense increased by $10.6 million, or 31%, during Fiscal Year 2019 compared to Fiscal Year 2018, primarily due to an increase in borrowings as a result of a debt amendment on December 17, 2017, as well as a greater outstanding revolving facility balance throughout Fiscal Year 2019.
Income Taxes
Income taxes decreased by $4.0 million, or 23%, during Fiscal Year 2019 compared to Fiscal Year 2018, primarily due to lower income in foreign jurisdictions which was partially offset by an increase in UTP activity and an increase in valuation allowances for losses which no benefit is expected.
Loss from Investments in Unconsolidated Affiliates
Loss from investments in unconsolidated affiliates for Fiscal Year 2019 increased by $1.0 million to $1.0 million from $0.0 million in Fiscal Year 2018. The $1.0 million loss is a result of Weber recording its share of June’s losses due to accounting for the common stock investment in June as an equity method investment.
Net Income
Net income decreased by $63.2 million, or 56%, to net income of $50.1 million for Fiscal Year 2019 from net income of $113.3 million for the comparable period in 2018, for the reasons described above.
Segment Information
We operate and manage our business in three reportable segments: Americas, which consists of Canada, Chile, Mexico and the United States; the European, Middle East and African regions (“EMEA”); and the Asia-Pacific region (“APAC”), which includes Australia and New Zealand. We identify our reportable segments based on the information used by the Chief Operating Decision Maker (“CODM”) to monitor performance and allocate resources. See Note 15 of the notes to our consolidated financial statements included elsewhere in this prospectus for additional information regarding our reportable segments.
127
Table of Contents
Net sales by reportable segment is summarized as follows:
| Fiscal Years Ended September 30, |
$ Variance Increase/ (Decrease) |
% Variance Increase/ (Decrease) |
Fiscal Years Ended September 30, |
$ Variance Increase/ (Decrease) |
% Variance Increase/ (Decrease) |
|||||||||||||||||||||||||||
| (Dollars in thousands) |
2018 | 2019 | 2019 | 2020 | ||||||||||||||||||||||||||||
| Americas |
$ | 704,337 | $ | 715,153 | $ | 10,816 | 2% | $ | 715,153 | $ | 880,618 | $ | 165,465 | 23% | ||||||||||||||||||
| EMEA |
530,494 | 483,914 | (46,580 | ) | (9%) | 483,914 | 541,567 | 57,653 | 12% | |||||||||||||||||||||||
| APAC |
105,201 | 97,143 | (8,058 | ) | (8%) | 97,143 | 103,075 | 5,932 | 6% | |||||||||||||||||||||||
|
|
|
|
|
|
|
|
|
|
|
|
|
|
|
|
|
|||||||||||||||||
| Total net sales |
$ | 1,340,032 | $ | 1,296,210 | $ | (43,822 | ) | (3%) | $ | 1,296,210 | $ | 1,525,260 | $ | 229,050 | 18% | |||||||||||||||||
|
|
|
|
|
|
|
|
|
|
|
|
|
|
|
|
|
|||||||||||||||||
Adjusted income from operations by reportable segment is summarized as follows:
| Fiscal Years Ended September 30, |
$ Variance Increase/ (Decrease) |
% Variance Increase/ (Decrease) |
Fiscal Years Ended September 30, |
$ Variance Increase/ (Decrease) |
% Variance Increase/ (Decrease) |
|||||||||||||||||||||||||||
| (Dollars in thousands) |
2018 | 2019 | 2019 | 2020 | ||||||||||||||||||||||||||||
| Americas |
$ | 176,431 | $ | 133,663 | $ | (42,768 | ) | (24%) | $ | 133,663 | $ | 178,079 | $ | 44,416 | 33% | |||||||||||||||||
| EMEA |
116,609 | 109,903 | (6,706 | ) | (6%) | 109,903 | 136,547 | 26,644 | 24% | |||||||||||||||||||||||
| APAC |
21,265 | 20,386 | (879 | ) | (4%) | 20,386 | 23,369 | 2,983 | 15% | |||||||||||||||||||||||
The following table reconciles segment adjusted income from operations to income from operations for the periods presented:
| Fiscal Years Ended September 30, | ||||||||||||
| 2018 | 2019 | 2020 | ||||||||||
| (Dollars in thousands) | ||||||||||||
| Segment adjusted income from operations |
||||||||||||
| Americas |
$ | 176,431 | $ | 133,663 | $ | 178,079 | ||||||
| EMEA |
116,609 | 109,903 | 136,547 | |||||||||
| APAC |
21,265 | 20,386 | 23,369 | |||||||||
|
|
|
|
|
|
|
|||||||
| Segment adjusted income from operations for reportable segments |
314,305 | 263,952 | 337,995 | |||||||||
| Corporate and supply chain costs |
(144,036 | ) | (120,174 | ) | (148,990 | ) | ||||||
| Foreign currency loss (gain)(a) |
7,118 | (1,837 | ) | 5,081 | ||||||||
| Non-cash stock compensation / LTIP expense(a) |
1,090 | 1,446 | (4,514 | ) | ||||||||
| Business transformation costs(a) |
(7,461 | ) | (22,706 | ) | (12,515 | ) | ||||||
| Operational transformation costs(a) |
— | (1,244 | ) | (8,532 | ) | |||||||
| Impairment costs(a) |
— | (12,568 | ) | — | ||||||||
| COVID-19 costs(a) |
— | — | (17,061 | ) | ||||||||
|
|
|
|
|
|
|
|||||||
| Income from operations |
$ | 171,016 | $ | 106,869 | $ | 151,464 | ||||||
|
|
|
|
|
|
|
|||||||
| (a) | See “Non-GAAP Measures—adjusted income from operations” for descriptions of reconciling items from income from operations to adjusted income from operations. |
Americas
The following table summarizes certain financial information relating to the Americas segment results that have been derived from our consolidated financial statements for the years ended September 30, 2018, 2019 and 2020.
| (Dollars in thousands) |
Fiscal Years Ended September 30, |
$ Variance Increase/ (Decrease) |
% Variance Increase/ (Decrease) |
Fiscal Years Ended September 30, |
$ Variance Increase/ (Decrease) |
% Variance Increase/ (Decrease) |
||||||||||||||||||||||||||
| 2018 | 2019 | 2019 | 2020 | |||||||||||||||||||||||||||||
| Total segment net sales |
$ | 704,337 | $ | 715,153 | $ | 10,816 | 2 | % | $ | 715,153 | $ | 880,618 | $ | 165,465 | 23 | % | ||||||||||||||||
| Segment adjusted income from operations |
$ | 176,431 | $ | 133,663 | $ | (42,768 | ) | (24 | %) | $ | 133,663 | $ | 178,079 | $ | 44,416 | 33 | % | |||||||||||||||
128
Table of Contents
Total Segment Net Sales. Total segment net sales for Fiscal Year 2020 increased by $165.5 million, or 23%, to $880.6 million from $715.2 million during Fiscal Year 2019. The increase was primarily attributable to strong consumer trends in all trade channels in Fiscal Year 2020. Consumers shifting focus to the backyard and at-home cooking generated significant increases in consumer demand, especially in our DTC and e-commerce channels. Accelerated growth in our DTC channels were led by Weber.com, with sales growing in excess of 500% from Fiscal Year 2019 to Fiscal Year 2020. Growth in our e-commerce channels was over 20% from Fiscal Year 2019 to Fiscal Year 2020. The Americas was negatively impacted by $2.6 million of foreign exchange primarily driven by declines in the Canadian dollar and Mexican peso as compared to the U.S. dollar.
Total segment net sales for Fiscal Year 2019 increased by $10.8 million, or 2%, to $715.2 million from $704.3 million during Fiscal Year 2018. The increase was primarily attributable to DTC expansion on Weber.com, and price increases taken across selected product lines to offset the impact of the new tariffs on imported grills, accessories, and components from China. Total segment net sales was also negatively impacted by $2.6 million of foreign exchange, primarily driven by the decline of the Canadian dollar as compared to the U.S. dollar.
Segment Adjusted Income from Operations. Segment adjusted income from operations for Fiscal Year 2020 increased by $44.4 million, or 33%, to $178.1 million from $133.7 million during Fiscal Year 2019. The increase was primarily attributable to the $165.5 million sales growth in Fiscal Year 2020 and the full-year effect of tariff-related price increases executed in 2019, partially offset by increased tariff expenses from $18.4 million to $42.3 million, $14.0 million of strategic investments in advertising to drive revenue, $9.8 million of increased distribution costs on higher sales, and $3.5 million of higher incentive compensation accruals based on exceeding Fiscal Year 2020 performance targets. The increase was also attributable to adjustments of $0.8 million related to severance costs, COVID-19-related expenses and a reduction in foreign exchange losses, partially offset by decreased recruiting costs during the business transformation undertaken by the new management team.
Segment adjusted income from operations for Fiscal Year 2019 decreased by $42.8 million, or 24%, to $133.7 million from $176.4 million during Fiscal Year 2018. The decrease was primarily attributable to the expense impact of $18.4 million of 301b tariff costs levied on Weber gas grills and component parts entering the United States from China, $12.0 million of steel price increases related to the China tariffs, and $9.0 million of higher costs to strategically repatriate Genesis II manufacturing from China. Additional segment income from operations decreases were due to $2.8 million of increased investment in advertising to drive revenue and brand awareness, and increased foreign exchange losses. These decreases were partially offset by price increases on select product lines in the U.S. market, a $5.4 million reduction in cooperative marketing expenses with certain retailers, and $4.1 million of savings from renegotiated commission agreements.
EMEA
The following table summarizes certain financial information relating to the EMEA segment results that have been derived from our consolidated financial statements for the years ended September 30, 2018, 2019 and 2020.
| (Dollars in thousands) |
Fiscal Years Ended September 30, |
$ Variance Increase/ (Decrease) |
% Variance Increase/ (Decrease) |
Fiscal Years Ended September 30, |
$ Variance Increase/ (Decrease) |
% Variance Increase/ (Decrease) |
||||||||||||||||||||||||||
| 2018 | 2019 | 2019 | 2020 | |||||||||||||||||||||||||||||
| Total segment net sales |
$ | 530,494 | $ | 483,914 | $ | (46,580 | ) | (9 | %) | $ | 483,914 | $ | 541,567 | $ | 57,653 | 12 | % | |||||||||||||||
| Segment adjusted income from operations |
$ | 116,609 | $ | 109,903 | $ | (6,706 | ) | (6 | %) | $ | 109,903 | $ | 136,547 | $ | 26,644 | 24 | % | |||||||||||||||
129
Table of Contents
Total Segment Net Sales. Total segment net sales for Fiscal Year 2020 increased by $57.7 million, or 12%, to $541.6 million from $483.9 million during Fiscal Year 2019. The increase was primarily attributable to strong demand resulting from consumer stay-at-home trends in Fiscal Year 2020. Growth was widespread across the entire region as retailers increased purchases to keep up with accelerated consumer demand. Weber.com sales increased by over 90% as online shopping increased in Fiscal Year 2020. Strategic emerging markets realized accelerated growth with Russia and Poland experiencing the highest year over year growth (66% and 33%, respectively) in the region. This increase in total segment net sales was partially offset by $11.7 million of negative foreign exchange impact driven by weakness in the Euro and British pound as compared to the U.S. dollar.
Total segment net sales for Fiscal Year 2019 decreased by $46.6 million, or 9%, to $483.9 million from $530.5 million during Fiscal Year 2018. The decrease was primarily attributable to $32.3 million of negative foreign exchange impact driven by year over year changes to the Euro, British pound and Nordic currencies as compared to the U.S. dollar. Excluding the foreign currency impacts, net sales decreased by 2.7%. In addition, we ended 2018 with high trade inventories in some markets, which impacted our pre-season retail trade sell-in in 2019. These were partially offset by $5.7 million of continued Weber.com growth.
Segment Adjusted Income from Operations. Segment adjusted income from operations for Fiscal Year 2020 increased by $26.6 million, or 24%, to $136.5 million from $109.9 million during Fiscal Year 2019. The increase was primarily attributable to the $57.7 million sales growth in Fiscal Year 2020, partially offset by $1.4 million of strategic investments in advertising to drive revenue, $3.7 million of increased distribution costs on sales, and $7.6 million of higher incentive compensation accruals based on exceeding 2020 business targets. The increase was also attributable to adjustments of $0.4 million related to EMEA organization restructuring costs, including employee separation costs, shared service center startup expenses and other one-time expenses, partially offset by a reduction in legal costs and increased foreign currency losses.
Segment adjusted income from operations for Fiscal Year 2019 decreased by $6.7 million, or 6%, to $109.9 million from $116.6 million during Fiscal Year 2018. The decrease was attributable to the $46.6 million decline in revenue primarily driven by FX rate movements, partially offset by lower advertising and distribution spending on lower sales, and a reduction in people costs resulting from the EMEA back-office restructuring.
APAC
The following table summarizes certain financial information relating to the APAC segment results that have been derived from our consolidated financial statements for the years ended September 30, 2018, 2019 and 2020.
| (Dollars in thousands) |
Fiscal Years Ended September 30, |
$ Variance Increase/ (Decrease) |
% Variance Increase/ (Decrease) |
Fiscal Years Ended September 30, |
$ Variance Increase/ (Decrease) |
% Variance Increase/ (Decrease) |
||||||||||||||||||||||||||
| 2018 | 2019 | 2019 | 2020 | |||||||||||||||||||||||||||||
| Total segment net sales |
$ | 105,201 | $ | 97,143 | $ | (8,058 | ) | (8 | %) | $ | 97,143 | $ | 103,075 | $ | 5,932 | 6 | % | |||||||||||||||
| Segment adjusted income from operations |
$ | 21,265 | $ | 20,386 | $ | (879 | ) | (4 | %) | $ | 20,386 | $ | 23,369 | $ | 2,983 | 15 | % | |||||||||||||||
Total Segment Net Sales. Total segment net sales for Fiscal Year 2020 increased by $5.9 million, or 6%, to $103.1 million from $97.1 million during Fiscal Year 2019. The increase was primarily attributable to favorable results in Australia during the second half of Fiscal Year 2020, after a difficult first half of Fiscal Year 2020 that resulted from the bush fires that were widespread across the country, impacting consumers’ opportunity to cook outdoors. The strong growth in Australia offset
130
Table of Contents
unfavorable COVID-19 impacts in Asia as retail was slower to recover from the pandemic. The total segment net sales increases were also partially offset by $2.6 million of foreign exchange driven by changes to the Australian dollar as compared to the U.S. dollar.
Total segment net sales for Fiscal Year 2019 decreased by $8.1 million, or 8%, to $97.1 million from $105.2 million during Fiscal Year 2018. The decrease was primarily attributable to $6.4 million foreign exchange impacts driven by year over year changes to the Australian dollar as compared to the U.S. dollar. Excluding the foreign exchange impact, net sales decreased by 1.6%. Softness in the Australian economy during 2019 and lower sales in India also contributed to the decline in total segment net sales.
Segment Adjusted Income from Operations. Segment adjusted income from operations for Fiscal Year 2020 increased by $3.0 million, or 15%, to $23.4 million from $20.4 million during Fiscal Year 2019. The increase was primarily attributable to the $5.9 million sales growth in Fiscal Year 2020, partially offset by $0.6 million of strategic investments in advertising to drive revenue, and $0.5 million of increased commission expense on Australia/New Zealand sales. The increase was also attributable to increased foreign currency gains, partially offset by a $0.4 million of adjustments primarily due to India entity closure costs and related one-time employee separation costs.
Segment adjusted income from operations for Fiscal Year 2019 decreased by $0.9 million, or 4%, to $20.4 million from $21.3 million during Fiscal Year 2018. The decrease was attributable to the $8.1 million decline in net sales primarily driven by foreign exchange movement, partially offset by advertising and commission reductions on lower sales, as well as increased foreign currency gains and $0.8 million of adjustments primarily due to India entity closure costs and related one-time employee separation costs.
Liquidity and Capital Resources
Overview
Our primary sources of liquidity are cash generated by operations and the Senior Facility. Historically, we have funded working capital requirements, capital expenditures, payments related to acquisitions, and debt service requirements with a combination of both cash on hand and the borrowing capacity under the Senior Facility. On December 20, 2017, the Senior Facility was amended and restated to allow borrowings of up to $1,150.0 million and the due date was extended to December 20, 2022. The Senior Facility had an unsecured revolving credit maximum commitment of $425.0 million and an unsecured term loan maximum commitment of $725.0 million. The Senior Facility contained certain restrictive covenants related to, among other things, limitations of indebtedness, transactions with affiliates, sales of assets, acquisitions, and members’ distributions, in addition to certain financial covenants relating to average leverage ratio and interest coverage ratio. On April 8, 2019, the Senior Facility was amended to allow for repurchases of members’ interests and to modify certain financial covenants. On March 20, 2020, the Senior Facility was again amended to include pledging the Company’s U.S.-based assets, including its interest in significant foreign subsidiaries but excluding real estate, against the senior credit facility and to modify certain financial covenants. This amendment also included modifications to the maturity principal payment schedule.
On October 30, 2020, the Company entered into a new credit facility arrangement with a term loan of $1,250.0 million and a revolving credit facility with a maximum commitment of $300.0 million (the “Secured Credit Facility”). The term loan matures on October 30, 2027 and revolving facility matures by October 30, 2025. Proceeds from the term loan and revolving facility were used to pay off the Company’s prior credit agreement, effect a portion of a special dividend, engage in business
131
Table of Contents
acquisition and equity repurchase activities, pay fees and expenses in connection with the foregoing and for working capital and general corporate purposes. Borrowings under the credit facilities bear interest at a rate equal to, at our option, either (i) LIBOR for the relevant interest period, adjusted for statutory reserve requirements (subject to a floor of 0.00% per annum for all revolving loans and a 0.75% floor for the term loans), plus an applicable margin or (ii) a base rate equal to the highest of (a) the rate of interest publicly announced from time to time by the administrative agent as its “prime rate”, (b) the federal funds effective rate plus 0.50% and (c) adjusted LIBOR for an interest period of one month plus 1.00% (subject to a floor of 0.00% per annum), in each case, plus an applicable margin. As of March 31, 2021, we were in compliance with the financial covenants of the credit facility.
In the third quarter of Fiscal Year 2021, the Company borrowed $170.0 million under its revolving facility to facilitate (i) the repurchase of LLC Unit Interests from WSP Investment LLC; and (ii) the dividend to Weber-Stephen Products LLC Unit Holders (collectively, the “April Transactions”). As of June 30, 2021, we had fully repaid the $170.0 million. Accordingly, as of June 30, 2021, there is $293.6 million available to be drawn of $300.0 million under the revolving credit facility. The availability under the revolving credit facility is reduced by $6.4 million due to outstanding letters of credit as of June 30, 2021.
The Company considers all investments with initial maturities of three months or less to be cash and cash equivalents, which consist primarily of demand deposits and money market accounts with major financial institutions in the United States and in countries where the Company’s subsidiaries operate. Cash and cash equivalents totaled $35.3 million as of September 30, 2018, $44.7 million as of September 30, 2019, $123.8 million as of September 30, 2020 and $379.9 million as of March 31, 2021.
Our primary working capital requirements are to fund our daily operational activities like purchasing raw materials and component parts to manufacture products, payments to suppliers for goods and services, and cash to be received for products sold to customers. Our working capital requirements fluctuate during the year, driven primarily by the seasonality of market demand and the timing of inventory manufacturing and purchases.
Our capital expenditures are primarily related to growth initiatives and operational spending, including investments related to new product development, manufacturing and operational activities, and investments in technology systems. We expect to fund capital expenditures from cash provided by operating activities.
Based on our growth plans, we believe our cash and cash equivalents position, net cash provided by operating activities and availability under our new credit facility will be adequate to finance our working capital requirements, planned capital expenditures, and debt service. In the future, we may allocate additional capital towards strategic acquisitions. If cash provided by operating activities and borrowings under our credit facility are not sufficient or available to meet our capital requirements, then we will be required to obtain additional equity or debt financing in the future. There can be no assurance equity or debt financing will be available to us if we need it or, if available, the terms will be satisfactory to us.
132
Table of Contents
Summary of Cash Flows
Six Months Ended March 31, 2021 Compared to the Six Months Ended March 31, 2020
A summary of our cash flows from operating, investing, and financing activities is presented in the following table:
| Six Months Ended March 31, |
||||||||
| (Dollars in thousands) |
2020 | 2021 | ||||||
| Net cash used in operating activities |
$ | (212,035 | ) | $ | (214,649 | ) | ||
| Net cash used in investing activities |
(18,226 | ) | (105,565 | ) | ||||
| Net cash provided by financing activities |
252,830 | 571,266 | ||||||
| Effect of exchange rate changes on cash and cash equivalents |
4,851 | 5,095 | ||||||
|
|
|
|
|
|||||
| Net increase in cash and cash equivalents |
$ | 27,420 | $ | 256,147 | ||||
|
|
|
|
|
|||||
Cash Used in Operating Activities
Net cash used in operating activities increased to $214.6 million for the six months ended March 31, 2021 from $212.0 million for the six months ended March 31, 2020, an increase of $2.6 million or 1%. The increase was primarily driven by the increase in working capital related to the increase in sales volume, which was largely offset by the increase in net income from the greater sales volume.
Cash Used in Investing Activities
Net cash used in investing activities increased to $105.6 million for the six months ended March 31, 2021 from $18.2 million for the six months ended March 31, 2020, an increase of $87.3 million or 479%. The increase in net cash used in investing activities primarily relates to the acquisition of June in 2021. This was partially offset by the proceeds of real estate sold in 2021.
Cash Provided by Financing Activities
Net cash provided by financing activities increased to $571.3 million for the six months ended March 31, 2021 from $252.8 million for the six months ended March 31, 2020, an increase of $318.4 million or 126%. The increase in net cash provided by financing activities is primarily the result of the issuance of the Secured Credit Facility term loan in Fiscal Year 2021 to date of $1,250.0 million, which was offset by the payoff of the previous long-term debt of $619.4 million, decreased funding from the revolving credit facility of $259.4 million and the increase in payments of deferred financing costs of $23.4 million.
Other Information
As of March 31, 2021, $128.5 million of our $379.9 million in cash and cash equivalents was held in jurisdictions outside of the U.S. Cash held outside the U.S. may be repatriated, subject to certain limitations, and would be available to be used to found our domestic operations. However, repatriation of funds may result in additional tax liabilities. We believe that our existing cash balance in the United States is sufficient to fund our working capital needs in the United States.
133
Table of Contents
Fiscal Year 2018 Compared to Fiscal Year 2019 and Fiscal Year 2019 Compared to Fiscal Year 2020
A summary of our cash flows from operating, investing, and financing activities is presented in the following table:
| Fiscal Years Ended September 30, | ||||||||||||
| (Dollars in thousands) |
2018 | 2019 | 2020 | |||||||||
| Net cash provided by operating activities |
$ | 110,648 | $ | 126,468 | $ | 305,178 | ||||||
| Net cash used in investing activities |
(33,079 | ) | (67,257 | ) | (22,207 | ) | ||||||
| Net cash used in financing activities |
(204,179 | ) | (50,728 | ) | (213,240 | ) | ||||||
| Effect of exchange rate changes on cash and cash equivalents |
5,854 | 851 | 9,396 | |||||||||
|
|
|
|
|
|
|
|||||||
| Net (decrease) increase in cash and cash equivalents |
$ | (120,756 | ) | $ | 9,334 | $ | 79,127 | |||||
|
|
|
|
|
|
|
|||||||
Cash Provided by Operating Activities
Net cash provided by operating activities increased to $305.2 million for Fiscal Year 2020 from $126.5 million for Fiscal Year 2019, an increase of $178.7 million or 141%. The increase was primarily driven by net income growth of $26.2 million (excluding non-cash goodwill impairment of $12.6 million in 2019), working capital improvements of $142.4 million mostly due to timing of trade payables and the increase of accrued expenses due to sales volume, partially offset by increases in inventories, prepaid expenses and other current assets.
Net cash provided by operating activities increased to $126.5 million for Fiscal Year 2019 from $110.6 million for Fiscal Year 2018, an increase of $15.8 million or 14%. The increase was primarily driven by changes to working capital of $68.2 million which was mostly the result of reduction of inventory, offset by reductions in accounts payable, as well as a decrease in net income of $50.6 million (excluding the non-cash charge of $12.6 million in Fiscal Year 2019).
Cash Used in Investing Activities
Net cash used in investing activities decreased to $22.2 million for Fiscal Year 2020 from $67.3 million for Fiscal Year 2019, a decrease of $45.1 million or 67%. The decrease in net cash used in investing activities primarily relates to a $24.3 million investment payment in June Life, Inc. made in Fiscal Year 2019. Additionally, there was a $17.5 million buyout of a long-standing royalty agreement in Fiscal Year 2019. The decrease in net cash used in investing activities was partially offset by additions to property, equipment, and leasehold improvements.
Net cash used in investing activities increased to $67.3 million for Fiscal Year 2019 from $33.1 million for Fiscal Year 2018, an increase of $34.2 million or 103%. The increase in net cash used in investing activities relates to investment payments made in 2019 for June Life, Inc. worth $24.3 million and a $17.5 million buyout of a long-standing royalty agreement offset by $9.4 million of lower additions to property, equipment, and leasehold improvements.
Cash Used in Financing Activities
Net cash used in financing activities increased to $213.2 million for Fiscal Year 2020 from $50.7 million for Fiscal Year 2019, an increase of $162.5 million or 320%. The increase in net cash used in 2020 is primarily the result of $290.7 million net change in usage of the revolving credit facility and a $18.0 million buyout of a long-standing royalty agreement, partially offset by a reduction of $87.7 million in member equity repurchases, decreased Member distributions of $18.6 million and the realization of $39.5 million of proceeds from financing in 2020.
134
Table of Contents
Net cash used in financing activities decreased to $50.7 million for Fiscal Year 2019 from $204.2 million for Fiscal Year 2018, a decrease of $153.5 million or 75%. The decrease in net cash used in 2019 is primarily the result of $426.7 million less distribution to members and $75.0 million less long term debt payments, partially offset by decreased proceeds of members’ equity of $6.5 million, an increase in year-over-year repurchase of members’ interests of $76.5 million, a $51.3 million net increase in usage of the revolving credit facility and $320.0 million of proceeds in long term borrowing realized in 2018 that did not repeat in 2019.
Other Information
As of September 30, 2020, $69.9 million of our $123.8 million in cash and cash equivalents was held in jurisdictions outside of the U.S. Cash held outside the U.S. may be repatriated, subject to certain limitations, and would be available to be used to found our domestic operations. However, repatriation of funds may result in additional tax liabilities. We believe that our existing cash balance in the United States is sufficient to fund our working capital needs in the United States.
Critical Accounting Policies and Estimates
Our consolidated financial statements have been prepared in accordance with U.S. GAAP. The preparation of our consolidated financial statements and notes to consolidated financial statements requires us to make estimates that affect the reported amounts of assets, liabilities, sales and expenses, and related disclosures of contingent assets and liabilities. We base these estimates on historical results and various other assumptions believed to be reasonable, all of which form the basis for making estimates concerning the carrying values of assets and liabilities that are not readily available from other sources. Actual results may differ from these estimates.
Our significant accounting policies are described in the notes to our consolidated financial statements included elsewhere in this prospectus. We believe that the following critical accounting policies affect the most significant estimates and management judgments used in preparing the consolidated financial statements.
Revenue Recognition
In May 2014, the Financial Accounting Standards Board (FASB) issued Accounting Standards Update (ASU) 2014-09, Revenue from Contracts with Customers (Topic 606), which outlines a single comprehensive five-step model for entities to use in accounting for revenue arising from contracts with customers. The Company adopted this standard on October 1, 2018, using the modified retrospective approach with no material impact on the Company’s consolidated financial statements.
Revenue transactions associated with the sale of grills and related accessories comprise a single performance obligation, which consists of the transfer of products to customers at a point in time. Substantially all of the Company’s revenues relate to the sales of grills and accessories.
The Company satisfies the performance obligation and records revenues for grills and accessories when control has passed to the customer, based on the terms of sale. Transfer of control passes to customers at a point in time, that point in time generally being upon shipment or upon delivery of the performance obligation, depending on the written sales terms with the customer.
The Company’s purchase orders from customers for specific products represent its contracts and include all key terms and conditions related to the sale of products. For all sales, no significant uncertainty exists surrounding the customers’ obligation to pay for grills and accessories. Customers’
135
Table of Contents
obligations to pay are generally under normal commercial terms, with payment terms typically being 30-60 days upon completion of the performance obligation. As payment terms are less than one year from the satisfaction of performance obligation, our sales do not include any significant financing components. Consideration promised in the Company’s contracts with customers is variable due to anticipated reductions, such as cash discounts and customer incentives (volume rebates and advertising programs). The transaction price is determined based upon the invoiced sales price, less anticipated reductions. The cost of these discounts and incentives are estimated at the inception of the contract based on the Company’s annual incentive programs with customers and recognized as a reduction to revenue at the time of sale. Subsequent adjustments to discounts or incentive programs are recognized to revenue in the period the adjustment is determinable.
The Company offers warranties on most of its products, which are considered assurance type warranties and, therefore, are not accounted for as a separate performance obligation.
Accordingly, all shipping and handling activity costs are recognized as selling, general and administrative expenses at the time the related revenue is recognized. Amounts invoiced to customers for shipping and handling are recorded in net sales. Any taxes collected on behalf of government authorities are excluded from net sales. The Company has elected to account for shipping and handling activities as a fulfillment cost.
For periods prior to adoption, revenue was realized or realizable and earned when (a) persuasive evidence of an arrangement existed, (b) shipment had occurred, (c) the seller’s price to the buyer is fixed and determinable, and (d) collectability is reasonably assured. Provisions for certain rebates and sales incentives are provided for as reductions in determining net revenues in the same period the related revenues are recorded.
Accounts Receivable
Accounts receivable consist primarily of amounts due to the Company from its normal business activities, offset by an allowance for expected credit losses. We estimate our expected credit losses based on historical experience, the aging of accounts receivable, consideration of current economic conditions and our expectations of future economic conditions. Additionally, we establish customer-specific allowances for known at-risk accounts. The Company does not require collateral from its customers. Accounts receivable are written off when it is determined that the receivable will not be collected.
Inventories
Inventories include finished products and work-in-process and materials associated with production and are recorded at standard cost, which approximates actual cost, on the FIFO. Inventory costs include those costs directly attributable to products, including all manufacturing overhead, but excluding costs to distribute. Inventories are valued at the lower of cost or market (net realizable value), including appropriate consideration given to obsolescence, excessive inventory levels, product deterioration and other factors.
Impairment of Goodwill, Indefinite-Lived Intangibles and Long-Lived Assets
Goodwill
Goodwill represents the excess of consideration transferred over the estimated fair value of assets acquired and liabilities assumed in a business combination. We evaluate goodwill for possible impairment at least annually or whenever events or changes in circumstances indicate that the carrying amount of such assets may not be recoverable. To analyze goodwill for impairment, we must assign our goodwill to individual reporting units. Our reporting units for goodwill impairment testing purposes are Americas, EMEA and APAC.
136
Table of Contents
In Fiscal Year 2019, the Company adopted ASU 2017-04, Intangibles—Goodwill and Other (Topic 350): Simplifying the Test for Goodwill Impairment, which would eliminate the requirement to calculate the implied fair value of goodwill (i.e., Step 2 of the impairment test) to measure a goodwill impairment charge in the event the fair value of a reporting unit was less than its carrying amount.
For goodwill, we may first make a qualitative assessment of whether it is more likely than not that a reporting unit’s fair value is less than its carrying value. The qualitative impairment assessment includes considering various factors including macroeconomic conditions, industry and market conditions, cost factors, overall financial performance and any reporting unit specific events. If it is determined through the qualitative assessment that the reporting unit’s fair value is more likely than not greater than its carrying value, the quantitative impairment assessment is not required. If the qualitative assessment indicates it is more likely than not that the reporting unit’s fair value is not greater than its carrying value, we must perform a quantitative impairment assessment. If it is determined a quantitative assessment is necessary, we would compare the fair value of the reporting unit to the respective carrying value, which includes goodwill.
To determine the fair value of a reporting unit as part of our quantitative test, we use the income approach. The income approach uses a discounted cash flow analysis, which involves applying appropriate discount rates to estimated future cash flows based on forecasts of sales, costs and capital requirements. The most significant estimates and assumptions inherent in this approach are the enterprise value based on the estimated present value of future net cash flows the business is expected to generate over a forecasted period and an estimate of the present value of cash flows beyond that period, which is referred to as the terminal value. The estimated present value is calculated using a discount rate known as the weighted-average cost of capital, which accounts for the time value of money and the appropriate degree of risks inherent in the business. We estimate future sales growth using a number of critical factors, including among others, our nature and our history, financial and economic conditions affecting us, our industry and the general company, past results and our current operations and future prospects. Forecasts of future operations are based, in part, on operating results and our expectations as to future market conditions. We deem the discount rate used in our analysis to be commensurate with the underlying uncertainties associated with achieving the estimated cash flows we project. This analysis contains uncertainties because it requires us to make assumptions and to apply judgments to estimate industry economic factors and the profitability of future business strategies. If actual results are not consistent with our estimates and assumptions, we may be exposed to future impairment losses that could be material.
As part of our Fiscal Year 2019 annual goodwill impairment test, we recognized a non-cash impairment loss of $12.6 million on the iGrill goodwill. Excluding the iGrill impairment charge, our qualitative assessment indicated that it was more likely than not that the estimated fair value of each reporting unit exceeded the carrying value of our net assets for the fiscal years ended September 30, 2018, 2019 and 2020. No impairment charge for our goodwill was recorded for the six months ended March 31, 2020 and 2021.
For periods prior to adoption of ASU 2017-04, we performed a two-step impairment test on goodwill. In the first step, we compared the fair value of the reporting unit to its carrying value. If the fair value of the reporting unit exceeded the carrying value of the net assets assigned to that unit, goodwill was considered not impaired and we were not required to perform further testing. If the carrying value of the net assets assigned to the reporting unit exceeded the fair value of the reporting unit, then we performed the second step of the impairment test in order to determine the implied fair value of the reporting unit’s goodwill. If the carrying value of a reporting unit’s goodwill exceeded its implied fair value, then we would record an impairment loss equal to the difference.
137
Table of Contents
Indefinite-Lived Intangibles
Our trademark, Weber, has been assigned an indefinite life as we currently anticipate that this trademark will contribute cash flows to us indefinitely. We evaluate whether the trademark continues to have an indefinite life on an annual basis. The trademark is reviewed for impairment at least annually and may be reviewed more frequently if indicators of impairment are present. Conditions that may indicate impairment include, but are not limited to, a significant adverse change in customer demand or business climate that could affect the value of an asset, a product recall or an adverse action or assessment by a regulator. We perform a qualitative assessment of whether it is more likely than not that the trademark’s fair value is less than its carrying value. The qualitative impairment assessment includes various factors including macroeconomic conditions, industry and market conditions, cost factors, overall financial performance and any reporting unit specific events. Impairment losses are recorded to the extent that the carrying value of the indefinite-lived intangible asset exceeds its fair value. No impairment charge for our trademark was recorded for the fiscal years ended September 30, 2018, 2019 and 2020, as well as the six months ended March 31, 2020 and 2021.
Long-Lived Assets
A long-lived asset (including amortizable identifiable intangible assets) or asset group is tested for recoverability whenever events or changes in circumstances indicate that its carrying amount may not be recoverable. Conditions that may indicate impairment include, but are not limited to, a significant adverse change in customer demand or business climate that could affect the value of an asset, a product recall or an adverse action or assessment by a regulator. When indicators of impairment are present, the Company evaluates the carrying value of the long-lived assets in relation to the operating performance and future undiscounted cash flows of the underlying assets. The Company adjusts the net book value of the long-lived assets to fair value if the sum of the expected future cash flows is less than book value. No impairment charge for our long-lived assets was recorded for the fiscal years ended September 30, 2018, 2019 and 2020, as well as the six months ended March 31, 2020 and 2021.
Unit-Based Compensation
The Company’s unit-based compensation is accounted for in accordance with ASC 718, Compensation—Stock Compensation. Unit-based awards have been granted to certain executives and employees via two plans: the LTIP and the Profits Interest Plan. The awards related to these plans are not shares of the Company’s common units, and when vested or earned, are settled in cash. A recipient of the awards does not receive any ownership interest in the Company, voting rights, or other incidents of ownership. For the fiscal years ended September 30, 2018, 2019 and 2020, we accounted for compensation expense related to our unit-based compensation awards using the intrinsic value method, as permitted by ASC 718 for nonpublic entities, with changes to the value of the unit-based compensation awards recognized as compensation expense at each reporting date. During the quarter ended March 31, 2021, in anticipation of becoming a public company, we prospectively changed our methodology for valuing the LTIP and the Profits Interest Plan to a fair value method as required by ASC 718. See “Management’s Discussion and Analysis of Financial Condition and Results of Operations—Critical Accounting Policies and Estimates—Change in Accounting Principle” for further information on the change in methodology and its impact.
Product Warranty
The Company offers warranties on most of its products. The specific terms and conditions of the warranties offered by the Company vary depending upon the product sold. The Company estimates the costs that may be incurred under its warranty plans and records a liability in the amount of such
138
Table of Contents
costs at the time product revenue is recognized. Factors that affect the Company’s warranty liability include the number of units sold, the type of products sold, historical and anticipated rates of warranty claims, the period for which warranty claims are honored, and cost per claim. The Company periodically assesses the adequacy of its recorded warranty liabilities and adjusts the amounts as necessary. Should any of these factors differ from our estimates, additional warranty liabilities could be incurred, which could materially affect our results of operations.
Equity Method Investment
We use the equity method of accounting for investments when we have the ability to exercise significant influence. After valuing the initial investment, we recognize our proportional share of results of operations. Judgments regarding the level of influence over each equity method investment include consideration of key factors such as our ownership interest, representation on the board of directors or other management body, participation in policy-making decisions and percentage of the company’s operations relating to Weber.
Recently Issued Accounting Pronouncements
See Note 1, Basis of Presentation and Significant Accounting Policies, of the notes to our consolidated financial statements included elsewhere in this prospectus for a description of recently issued and adopted accounting pronouncements.
Change in Accounting Principle
Profits interest units and LTIP awards historically were accounted for as liability compensatory awards under ASC 710, Compensation—General, and valued using the intrinsic value method, as permitted by ASC 718, Compensation—Stock Compensation, for nonpublic entities. In anticipation of becoming a public company, as defined in ASC 718, the Company changed its methodology for valuing the profits interest units and LTIP awards during the quarter ended March 31, 2021. While the profits interests units and LTIP awards will continue to be re-measured at each quarterly reporting date, the profits interests units and LTIP awards are required to be accounted for prospectively at fair value using a fair value pricing model, such as Black-Scholes. The effect of the change increased the profits interest liability by $23.1 million, which was the difference in compensation costs measured using the intrinsic value method and the fair value method. We expect to incur an additional charge of approximately $56.6 million during the quarter ended June 30, 2021 based on a higher valuation at June 30, 2021. Based on the midpoint of the price range on the cover of this prospectus (and assuming the stock has the same value at the next quarter-end), we would incur a liability of approximately $32.4 million in the quarter in which the IPO occurs as a result of re-measurement of such liability. The LTIP awards were not impacted by the change in valuation methods due to the nature of the grant terms and underlying calculation.
Quantitative and Qualitative Disclosures about Market Risk
We are exposed to market risks in the ordinary course of our business.
Interest Rate Risk
Our operating results are subject to risk from interest rate fluctuations on our borrowings, which carry variable interest rates. Our borrowings include our credit facility (term loan and a revolving credit facility). Because our borrowings bear interest at a variable rate, we are exposed to market risks relating to changes in interest rates. We purchase interest rate swap contacts to minimize the effect of
139
Table of Contents
fluctuating variable interest rates under the credit facility on Interest expense within our reported operating results. A hypothetical 10% change in the interest rates on our term loan and revolving facility would result in a change to annual interest expense of approximately $0.5 million to $1.0 million for Fiscal Years 2018, 2019 and 2020. For the six months ended March 31, 2020, hypothetical 10% change in the interest rates on our term loan and revolving facility would result in a change to interest expense of approximately $0.5 million. For the six months ended March 31, 2021, a hypothetical 10% change in the interest rates would not materially impact interest expense.
The Company has certain debt instruments for which the interest rates are indexed to LIBOR. In March 2020, the FASB issued ASU 2020-04, Reference Rate Reform (Topic 848): Facilitation of the Effects of Reference Rate Reform on Financial Reporting. The amendments in this update provide optional guidance for a limited period of time to ease the potential burden in accounting for (or recognizing the effects of) reference rate reform on financial reporting. This standard is effective for all entities as of March 12, 2020 through December 31, 2022. The reference rate reform has not impacted the Company’s consolidated operating results, cash flows or financial condition to date.
Raw Materials / Commodity Price Risk
The price and availability of key raw materials and components used to manufacture our products, including aluminum ingot, carbon steel, enameling iron, stainless-steel, certain plastic materials, certain electronic components and various engineered coating materials as well as manufacturing equipment and molds, may fluctuate significantly. Additionally, the cost of logistics and transportation fluctuates in large part due to the price of oil, currency fluctuations, and global demand trends. Any fluctuations in the cost and availability of any of our raw materials or other sourcing or transportation costs related to our raw materials or products could harm our gross margins and our ability to meet customer demand. If we are unable to successfully mitigate a significant portion of these product cost increases or fluctuations, our results of operations could be harmed.
We enter into commodity index contracts to minimize the effect of fluctuating variable costs related to the purchases of aluminum and steel-based components and raw materials.
Foreign Currency Risk
We incur currency transaction risk whenever we enter into either a purchase or sale transaction using a currency other than the functional currency of the transacting entity. We conduct business in various locations throughout the world and are subject to market risk due to changes in value of foreign currencies in relation to our reporting currency, the U.S. dollar. Periodically, we use derivative financial instruments to manage these risks. The functional currencies of our foreign operating locations are generally the local currency in the country. We manage these operating activities at the local level and net sales, costs, assets and liabilities are generally denominated in local currencies, thereby mitigating the risk associated with changes in foreign exchange. However, our results of operations and assets and liabilities are reported in U.S. dollars and thus will fluctuate with changes in exchange rates between such local currencies and the U.S. dollar. Furthermore, the sales of inventory between U.S. and foreign locations are often denominated in currencies other than the U.S. dollar, which generates additional risk. While we engage in hedging activities in order to mitigate our exposure, we may incur costs in connection with such activities and we may not be successful in hedging our exposure.
The Company’s financial instruments that can be affected by foreign currency fluctuations and exchange risks consist primarily of cash and cash equivalents, trade receivables, trade payables, and net sales denominated in currencies other than the U.S. dollar. For Fiscal Year 2020, approximately 47% of our net sales were denominated in a currency other than our functional U.S. dollar currency. These sales were primarily transacted in Euros, Australian dollars, Canadian dollars and British
140
Table of Contents
pounds. Consequently, we are exposed to the impact of exchange rate volatility between the U.S. dollar and these currencies. A hypothetical 10% change in the relative value of the U.S. dollar to the Euro, Australian dollar and Canadian dollar would impact our net sales by $36.1 million, $7.9 million and $6.3 million, respectively, for Fiscal Year 2020. For the six months ended March 31, 2020, a hypothetical 10% change in the relative value of the U.S. dollar to the Euro, Australian dollar and Canadian dollar would impact our net sales by $14.5 million, $4.1 million and $2.4 million, respectively. For the six months ended March 31, 2021, a hypothetical 10% change in the relative value of the U.S. dollar to the Euro, Australian dollar and Canadian dollar would impact our net sales by $21.3 million, $7.6 million and $4.9 million, respectively. To hedge against this risk, we enter into foreign currency forward exchange contracts for certain U.S. trade receivable positions with our foreign operations.
We expect that the amount of our sales denominated in non-dollar currencies may increase in future periods. Given the volatility of exchange rates, there can be no assurance that we will be able to effectively manage our currency transaction risks or that any volatility in currency exchange rates will not have a material adverse effect on our financial condition or results of operations.
Additionally, because our consolidated financial results are reported in U.S. dollars, the translation of sales or earnings generated in other currencies into U.S. dollars can result in a significant increase or decrease in the amount of those sales or earnings in our financial statements, which also affects the comparability of our results of operations and cash flows between financial periods. Further, currency fluctuations may negatively impact our debt service requirements, which are primarily in U.S. dollars.
141
Table of Contents
Table of Contents
143
Table of Contents
Our Mission and Purpose
Our mission at Weber is to lead the outdoor cooking industry by innovating breakthrough new products and services that enhance our global consumers’ grilling experiences. Our purpose is to ignite inspiration and discovery through everything we do, at every touchpoint with our consumers. Grilling is about making delicious food, bringing people together and creating memories. Weber is an experience, a passion, a way of life and a journey to discover what grilling can be.
Who We Are
We are the leading outdoor cooking company with the strongest and most trusted brand in the global outdoor cooking market. Our founder George Stephen, Sr., established the outdoor cooking category when he invented the original charcoal grill nearly 70 years ago. In the decades since, we have built a loyal and global following of both grilling enthusiasts and barbeque professionals in backyards all around the world. We have continuously disrupted and led the outdoor cooking category, through a comprehensive and expanding product portfolio including traditional charcoal grills, gas grills, smokers, pellet and electric grills, and recently our cutting-edge Weber Connect™ technology-enabled grills. We believe we offer the most complete outdoor cooking portfolio globally, with our full range of premium products sold in 78 countries in fiscal 2020.
We believe Weber is the only outdoor cooking brand with global scale and a vertically integrated manufacturing platform. Our track record of premium product innovation and the strength of our brand has led to a market-leading share of 23% in the U.S. and 24% globally in 2020, according to Frost & Sullivan. We are leaders in the largest and most attractive markets in outdoor cooking, including the U.S., Germany, Australia, Canada and France. Beyond these markets, we estimate that we have either the number one or number two brand position in each of the key geographies we serve.
We have spent decades building brand affinity and awareness by teaching people how to grill the “Weber Way.” By consistently delivering high-performing, differentiated products and best-in-class customer service, we have built a global community of passionate brand loyalists who value our innovation, uncompromising quality and performance. Over the years, families have passed down their affinity for Weber from one generation to the next, forging a deep emotional connection between consumers and our brand. We continue to deepen our relationship with our consumers by bringing innovation to our grill and accessories portfolio, introducing breakthrough connected products, expanding into new categories, and providing engaging brand experiences.
Product Innovation and Technology
Weber has developed one of the most technologically advanced outdoor cooking portfolios in the industry, and maintains a diverse product portfolio across fuel types, pricing tiers, and a wide range of accessories, consumables and services. We consistently maintain an uncompromising commitment to exceptional quality and innovative ways to cook outdoors. Accelerated technology adoption in and around the home and new home buying occasions create opportunities to further integrate our brand into the daily lives of our consumers.
With the 2020 introduction of our connected grilling platform, Weber Connect™, we continue to be at the forefront of innovation in the outdoor cooking industry. Weber Connect brings together cutting-edge grilling technology, a mobile app and a cloud-based infrastructure on a single interconnected
144
Table of Contents
platform. We believe that our connected products make grilling the perfect meal simple with our smartphone-enabled, step-by-step cooking experience. The Weber Connect platform is powered by June OS, our award-winning smart cooking software solution developed by June Life. In 2018, we made a minority investment in June Life and entered into a license and development agreement. In January 2021, we acquired the company in full to further enhance our leadership position in connected outdoor cooking.
145
Table of Contents
Our current product portfolio includes:
146
Table of Contents
Omni-Channel Strategy
We bring our products to market through a diverse and powerful omni-channel network comprised of wholesale, DTC and e-commerce channels. Our wholesale channel is made up of 4,710 retailers with 31,690 physical locations. We work with leading global, regional and large multi-national retailers such as Costco Wholesale, The Home Depot, Lowe’s Companies, and Walmart Inc., as well as European retailers including Bauhaus and OBI. Independent and Specialty retailers comprise an important part of our channel mix by serving consumers who seek more education, a broader assortment of products and higher service. We believe our broad global brick-and-mortar retail presence reinforces our brand leadership. Our commitment to our retailers is evidenced by the numerous awards that we have won for our category leadership, service excellence and new product innovation. Most recently, in 2020, we were recognized as Supplier of the Year at leading retailers such as Ace Hardware and The Home Depot Canada.
Our DTC approach includes both a digital platform (Weber.com) and brick-and-mortar locations (a majority are independently operated Weber branded retail stores and Weber Grill Academy™ experience centers). Our DTC initiatives have led to a compounded annual revenue growth rate of 47% in our DTC business since 2018. Weber.com has been the fastest growing channel across our omni-channel network with a compounded annual revenue growth rate of 135% since 2018. Internationally, we have 170 Weber branded retail stores and Weber Grill Academy sites (161 independently operated, 9 Weber-operated) making us the only outdoor cooking brand with a global network of experiential retail environments. Our Weber branded retail stores and Weber Grill Academy sites represent a significant component of our international sales channels. At most of our Weber Grill Academy sites, we offer world-class instruction by Grill Masters with culinary expertise who help our consumers improve their cooking skills and better engage with our products. Our Weber branded stores and Weber Grill Academy sites offer unique branded experiences and consumer engagement that strengthen the consumers’ connection with the Weber brand. We believe that the physical experience of our branded retail stores and the global scale of our network would be difficult to replicate by competitors in the outdoor cooking market.
147
Table of Contents
With our e-commerce and digital initiatives, we have been the leaders in shifting outdoor cooking purchases to online. Our e-commerce channel is made up of the online platforms of our global, regional, and multi-national retailers such as Costco Wholesale, The Home Depot, Lowe’s, Walmart, Bauhaus and OBI, as well as digitally native retailers such as Amazon and Wayfair. We believe our online share in the U.S. in fiscal year 2020 was two times greater than that of our nearest competitor, including our revenues through Weber.com and our e-commerce partners. On Amazon, we are the number one outdoor cooking brand, and according to Weber management estimates, we captured 29% market share in the outdoor cooking category sold online in the U.S. in 2020.
148
Table of Contents
Long-Term Track Record of Performance
We have experienced growth in various economic environments and have benefited from lasting consumer shifts in behavior towards outdoor cooking, which is evidenced by our 10% revenue CAGR from 1980 to 2021. Our track record of growth is driven by our iconic brand, massive installed base of loyal enthusiasts, and approximately 26% of our revenues being comprised of accessories and consumables all of which support a predictable, recurring revenue model. More recently, our significant investments in Weber Connect, Weber.com, and the ongoing consumer shifts towards backyard and outdoor leisure have further enhanced our growth profile. We expect these consumer shifts to continue in the future.
Our Recent Financial Performance
Our compelling financial profile is characterized by stable revenue growth, solid profitability and consistent high cash flow generation.
Comparing our six months ended March 31, 2021 with six months ended March 31, 2020, we achieved the following results:
| • | Increase in revenue from $596.4 million to $963.3 million, representing year-over-year growth of 62%; |
| • | Increase in income from operations from $56.4 million to $120.9 million, representing year- over-year growth of 114%; |
| • | Increase in net income from $23.6 million to $73.8 million, representing year-over-year growth of 213%; |
| • | Increase in adjusted income from operations from $58.3 million to $161.1 million, representing year-over-year growth of 176%; |
| • | Increase in adjusted net income from $30.6 million to $111.1 million, representing year-over- year growth of 263%; |
| • | Increase in EBITDA from $69.0 million to $141.3 million, representing year-over-year growth of 105%; and |
149
Table of Contents
| • | Increase in Adjusted EBITDA from $77.0 million to $186.9 million, representing year-over-year growth of 143%. |
Comparing our fiscal year 2020 with fiscal year 2019, we achieved the following results:
| • | Increase in revenue from $1,296.2 million to $1,525.3 million, representing year-over-year growth of 18%; |
| • | Increase in income from operations from $106.9 million to $151.5 million, representing year-over-year growth of 42%; |
| • | Increase in net income from $50.1 million to $88.9 million, representing year-over-year growth of 77%; |
| • | Increase in adjusted income from operations from $143.8 million to $189.0 million, representing year-over-year growth of 31%; |
| • | Increase in adjusted net income from $77.9 million to $126.0 million, representing year-over-year growth of 62%; |
| • | Increase in EBITDA from $154.0 million to $184.1 million, representing year-over-year growth of 20%; and |
| • | Increase in Adjusted EBITDA from $189.1 million to $226.7 million, representing year-over-year growth of 20%. |
Our History and Legacy of Innovation
We believe that our track record of innovation and category leadership is unparalleled in the outdoor cooking industry. The Weber journey began in 1952, when our founder George Stephen invented covered charcoal cooking with the iconic Weber Kettle grill. In the 1980s, we used the same ingenuity and unwavering approach to product quality and innovation to develop our Genesis gas grill, and again quickly became the market leader in the new category. In the 2000s, we disrupted the grilling market for the third time with the portable Weber Q grill and redefined mobility for millions of outdoor cooking enthusiasts. Recently, we introduced the SmokeFire wood pellet grill, the Pulse electric grill and the Weber Traveler gas grill, fueling additional expansion and leadership globally into these subcategories.
Today, we continue to disrupt the grilling category through our innovations with Weber Connect, which will further enhance the consumer experience, while staying true to our steadfast commitment to delivering premium products. We believe that the connected capabilities offered by our technology-enabled products will enable a closer relationship with our consumers and usher in a new generation of enthusiasts who will join our global community of Weber loyalists.
150
Table of Contents
151
Table of Contents
Highly Experienced and Visionary Management Team
To achieve our goals and meet our growth initiatives, we have assembled a management team that combines world-class brand expertise and advanced technological capabilities. In mid-2018, Chris Scherzinger joined as Chief Executive Officer, after spending the prior decade in a number of group CEO roles in the largest operating divisions at Jarden Corporation and Newell Brands. Prior to joining Newell/Jarden, Mr. Scherzinger held global marketing leadership and brand management and operational roles at Johnson & Johnson, Procter & Gamble and General Electric. In 2018, Bill Horton also joined as Chief Financial Officer, having also previously served as group CFO for a number of business units within Jarden Corporation and Newell Brands from 2009 to 2018. Prior to his time with Newell/Jarden, Mr. Horton spent 12 years in a number of leadership roles with Procter & Gamble, and served in the United States Air Force for five years. During their time at Jarden Corporation and Newell Brands, Scherzinger and Horton partnered for four years as group CEO and CFO of Jarden’s largest operating segment. Our management team has a proven track record of building brands, leading market innovation, expanding distribution, driving best-in-class operations and delivering consistently strong financial results.
Our Competitive Strengths
We believe that the following competitive strengths are key drivers of our past and future success.
Iconic Global Brand and Market Leader
For nearly 70 years, the Weber brand has defined the outdoor cooking category by enriching the experience of grilling consumers around the world. Based on internal management estimates and in coordination with Frost & Sullivan, we believe revenue in our top five markets to be up to three times that of the next leading competitor. We are the most recommended brand in the outdoor cooking industry by consumers, according to MetrixLab, with total brand awareness of 87% in the United States, 86% in Germany, 89% in Australia, 74% in Canada, and 76% in France, the five largest grilling markets in the world. Our consumers often share a deep emotional connection with our iconic brand that is passed down from one generation to the next. 41% of consumers indicated Weber as the U.S. brand they are most likely to purchase next relative to only 18% and 2% for our next closest competitors, according to a 2020 MetrixLab Brand Health & Habits Survey. We are the only global manufacturer and distributor in the outdoor cooking industry with leading market share in nearly every product sub-category across geographies. The leadership of our global brand is demonstrated by holding the number one brand position in grilling, in the United States, Germany, Australia, France and Canada with 23%, 44%, 30%, 26% and 24% market share respectively, and 24% globally, according to Frost & Sullivan. In addition, we have the number one brand position in gas grilling across these five markets and the number one brand position in charcoal grilling in the United States and Australia, according to Frost & Sullivan. Gas and charcoal grill types continue to be preferred by consumers, with 51% of survey respondents indicating they are most likely to purchase a gas grill next and 26% indicating charcoal grills, relative to only 3% for pellet grills, according to a 2020 MetrixLab Brand Health & Habits Survey. Our brand leadership is further emphasized by our 22 global points of distribution through wholesale and direct retail channels across 78 countries.
Massive Community of Loyal Weber Enthusiasts
Since 1952, we have cultivated deep bonds with generations of Weber owners and their families, as evidenced by our massive installed base of 30 million Weber grills in the U.S. and 50 million Weber grills globally. Our installed base coupled with impressive net promoter scores of 62 in the U.S., 65 in
152
Table of Contents
Germany and 52 in Australia, as of 2020, enable a powerful recurring revenue model through repeat grill sales, and branded accessories and consumables purchases. Our installed base continues to grow as we expand in international markets, where we combine what consumers love about their local grilling traditions with the magic of the Weber grilling experience. Our marketing strategies and recent investments in Weber.com continue to grow our massive community of Weber enthusiasts, with 65 million site visits in 2020 globally, representing an increase of 83% compared to 2019. Alongside this growth in Weber.com, we are rapidly building database marketing initiatives to further enhance our consumer relationships and maximize purchase frequency.
Leader in Product Development with Exceptional Quality
Disruptive innovation has been part of the Weber culture since the introduction of the iconic Weber Kettle grill in 1952. Today we continue our legacy of innovation with our SmokeFire wood pellet grills, Pulse electric grills, and our Weber Connect platform. We believe that the Weber Connect platform has set the standard for connected grilling, as evidenced by the recent Consumer Electronics Show Award for best Connected-Home Product in 2020, and represents the future of our industry. We believe that our acquisition of June Life provides us with industry-leading in-house software engineering talent that will help drive continued innovation for years to come.
Throughout the decades, we have maintained an uncompromising approach to exceptional quality and performance. We believe this has allowed us to expand from our roots in charcoal grills to a diverse portfolio across price points and fuel types, including gas grills, electric grills, smokers, pellet grills and accessories, consumables and services. We pride ourselves on bringing our commitment to quality and performance standards in each new category we enter. Weber is also recognized for developing and utilizing industry-leading features in the grilling category, such as Flavorizer bars (for even heating) and porcelain-enameled coating (for withstanding the high-heat applications). We employ an in-house team of engineers and designers to develop our products to ensure they meet our high standards of performance and quality. We also employ a best-in-class customer service organization that fuels brand satisfaction and loyalty.
Diversified Global Revenue Base and Broad Network of Distribution Partners in Each Region
The iconic nature of our global brand enables us to sell in 78 countries across six continents. In 2020, approximately 58% of our revenue was generated in the Americas, 35% in EMEA and 7% in APAC. We distribute our products through a diverse and powerful omni-channel platform, consisting of our wholesale, DTC and e-commerce channels. Across our distribution network, we believe Weber is the outdoor cooking brand that reinforces our distribution partners’ presence in the grilling category. In our wholesale channel, we work with leading global retailers including Ace Hardware and Costco Wholesale across the Americas, Europe and Asia. Our wholesale business also spans large international retail partners such as The Home Depot, Lowes Companies and Walmart Inc. across the U.S., Canada and Mexico, as well as Bauhaus and OBI in Europe. According to management estimates, at Ace Hardware, The Home Depot and Lowes, we represented 52%, 39%, and 32% dollar share of each retailer’s grilling category respectively in 2020. Across other regions, we distribute our products through a global network of independent and specialty dealers. Our DTC channel provides an unparalleled customer experience at Weber.com and our independently operated Weber branded retail stores and Weber Grill Academy sites. Weber.com features our complete product assortment and exclusive online offerings so consumers are able to compare products, read reviews and transact in a virtual environment. To complement our online presence, we operate a network of 170 Weber branded retail stores globally, which are strategically located in markets where we are leading consumer shifts to popularize the outdoor cooking industry. To further enhance our online presence, we offer our products on the online platforms of our retailer partners and digitally native retailers such as Amazon.com, where we are the number one outdoor cooking brand in the U.S. and capture 29% of the outdoor grill category.
153
Table of Contents
U.S.-Led, Global Manufacturing Footprint and World-Class Supply Chain
We are a vertically integrated manufacturer and the only major outdoor cooking company that maintains a significant U.S.-based manufacturing footprint that is complemented by other manufacturing capabilities throughout the world. We operate three manufacturing facilities in Illinois with core competencies in metal fabrication, welding, deep drawn stamping and porcelain-enameled coatings. In 2018, our U.S. operations were consolidated into our Huntley facility where approximately 55% of our global grill demand is currently produced. In addition, Weber maintains trusted relationships of more than 15 years with three major grill manufacturers in China and Taiwan to provide flexibility to produce some of our grills, which provides redundant manufacturing of key product lines. We have a long-standing history with a diversified set of suppliers who send components to our U.S. manufacturing facilities as well as our China manufacturing partners. Our 22 global distribution facilities serve 78 countries and have capabilities including truckload shipping to our customers and parcel service to support our growing DTC business. Our U.S.-led, diversified global manufacturing and distribution footprint provides Weber with a significant competitive advantage, allowing for a balanced combination of quality, speed and agility in response to customer demand locally and globally. We believe our diversified manufacturing platform also enables us to better manage potential supply chain disruptions and navigate changes in tariff policies more effectively than our competitors.
In 2020, we expanded our “Make Where We Sell” philosophy, and continued growth in the EMEA region drove the decision to commission a manufacturing plant in Europe and break ground on a new facility in Zabrze, Poland. This new location will manufacture and distribute key product lines for the EMEA market and is expected to open for operation in the fourth quarter of fiscal year 2021. The strategic location of this facility will facilitate reduced labor and transportation costs, resulting in positive improvements to our operating margin. The breadth and depth of our supply chain initiatives have been, and will continue to be, a key business focus and source of strong cash flow generation.
Exceptional Financial Profile Through Business Cycles
Weber has a long track record of strong growth and resilient financial performance, through periods of varying macro-economic cycles. Our growth has been broad-based across product categories and geographies. Weber benefits from countercyclical trends associated with “eat at home” categories, where challenging economic periods lead families to cook and spend more time at home. However, Weber also thrives in strong economic times when disposable income and investments in and around the home and backyard are strong. Our business maintains a strong margin profile driven by our consistent premium pricing strategy, global scale, vertically integrated manufacturing capabilities, operational productivity programs and commitment to value-added product innovations. We are well positioned to continue to execute on our operational excellence initiatives, including our new manufacturing and distribution facility in Poland. Our resilient growth, margin improvement and efficient capital intensity all contribute to our strong free cash flow. Our strong free cash flow profile allows for significant capital allocation flexibility, enabling long-term shareholder value creation through multiple operating and financial strategies.
Highly Experienced and Visionary Management Team
We believe our management team, led by CEO Chris Scherzinger and CFO Bill Horton, is among the most experienced in the industry, representing decades of leading global consumer brands. We have built a broad executive leadership team with extensive brand building experience from companies such as Amazon, Bosch, Danaher, Dyson, General Motors, Royal Dutch Shell, Unilever, Whirlpool and more. In addition, with our recent acquisition of June, we have acquired software and hardware engineering talent from Apple, Google, Lyft, Microsoft, SpaceX, Tesla and other leading technology companies. Our management team is uniquely capable of executing upon our strategic vision and successfully continuing to create long-term shareholder value by scaling our business, leading innovation, expanding distribution, and managing expansive global operations.
154
Table of Contents
Our Growth Strategy
We intend to build on our competitive strengths and deliver sustainable growth by executing on the following strategies:
Introduce New and Disruptive Products
We have a proven track record of consistently expanding our product portfolio to meet the evolving needs of our consumers. Our culture of innovation and strong manufacturing capabilities allow us to introduce disruptive and differentiated new products. Our success is evidenced by our diverse product portfolio and recent launches across technology, grilling, accessories, consumables and services including:
| • | Grilling Innovations — Historically, we have captured share in the outdoor cooking market by launching grill products that have revolutionized our consumer’s grilling experience. Our legacy of innovation started over 70 years ago when we invented the iconic Weber Kettle and transformed the charcoal grilling market. Since then, we have introduced the Genesis gas grill, the portable Weber Q grill, and the Pulse electric grill. In 2020, we launched the SmokeFire wood pellet grill to capitalize on demand in the fast-growing pellet grill sub-category. We believe the SmokeFire wood pellet grill will have a similar impact on the pellet industry as our iconic grills have had historically in their respective categories. We also have a long track record of success refreshing products in existing categories, which allows customers to upgrade while staying loyal to the Weber brand. |
| • | Weber Connect™ — In 2020, we introduced our new connected device platform, Weber Connect powered by June OS. This Consumer Electronics Show award-winning precision grilling technology was first made available as the stand-alone Smart Grilling Hub, and as an integrated feature in our SmokeFire wood pellet grill. Today, Weber Connect is also available in our Genesis / Spirit gas grill and Pulse electric grill. We intend to make Weber Connect available in our charcoal grills and smokers in the future. Weber Connect is an integral part of our connected product pipeline of cutting-edge, technology-enabled grills and devices that will enhance the grilling experience for consumers. |
| • | Accessories, Consumables and Services — Over the past 70 years, we have consistently developed and launched Weber branded outdoor cooking accessories and consumables to complement our core offering and provide a predictable, recurring revenue stream. These product offerings help ensure that Weber’s iconic brand stays at the forefront of all facets of the outdoor cooking experience while also providing attractive margins. We have developed a robust product pipeline that includes tools and cookware, cleaning supplies, multiple fuel types, gear, carts and covers, among others. Innovation in our growing accessory and consumables business will continue to create higher transaction frequency and drive increased consumer loyalty. We also intend to expand our service offerings to capitalize on our best-in-class customer service organization and the global footprint of our Weber branded retail stores and Weber Grill Academy sites to capture new revenue streams. |
As we have done throughout our history, we have identified opportunities for new product introductions in existing and new categories. We will continue to leverage our extensive experience and deep expertise to continue to regularly introduce new products that differentiate us from our competition and accelerate our growth.
Accelerate Direct-to-Consumer and E-commerce Revenue
Our DTC and e-commerce channels represented 20% of our revenue in 2020 and have grown 31% annually since 2018. Our DTC channel includes Weber.com, our independently operated Weber
155
Table of Contents
branded retail locations and Weber Grill Academy sites. Within our DTC channel, Weber.com has experienced explosive growth achieving a 135% CAGR from 2018 to 2020. Weber.com is a strategic focus as we believe consumers enjoy engaging directly with our brand through this channel. Due to our efforts, visits to Weber.com have expanded rapidly as evidenced by the 65 million global site visits we achieved in 2020, representing an increase of 83% compared to 2019. We also have long-standing relationships with the largest e-commerce players in our industry including Amazon, HomeDepot.com and Lowes.com and have experienced significant growth in this channel over the last several years. Our network of 170 Weber branded retail locations deliver an immersive brand experience for consumers as well as engagement with culinary grilling experts and knowledgeable staff. We believe there is a significant opportunity to increase DTC revenue by accelerating site visits and engagement of Weber.com and partnering with our retailers to launch additional Weber branded retail locations and Weber Grill Academy sites in attractive geographies throughout the world. We also expect purchasing to continue to migrate online providing positive tailwinds for our e-commerce channel.
Expand Customer Base and Consumer Revenue Streams
In the last three years, Weber has added more than $200 million from new retail customers that did not distribute our brand prior to 2018. We have also demonstrated the ability to add new consumers: over the past three years, we have added nearly 12 million Weber Grill households in our top five markets, an increase of 22%. We have invested significantly in all facets of marketing to fuel this growth. From 2018 to 2020, we increased our advertising and marketing spending by 14%. In addition, we have bolstered our consumer insights, analytics and marketing team, hiring over 40 new positions in the last 12 months, to strengthen our marketing organization and build broader capabilities. In addition to adding new consumers, we believe we have a sizable opportunity to optimize direct engagement with our existing consumer base and create new sources of revenue. We currently maintain a database of millions of registered consumers; that base, supplemented with new data from sources like Weber.com and our connected products, gives us the ability to personalize marketing, promotional offers and programs to drive increased consumer loyalty. This will open up new revenue streams like incremental accessory sales and new customized subscription services.
Expand and Deepen Our Presence in Emerging Geographies
We believe we have the opportunity to continue to expand into additional growing international markets. We intend to focus on the most attractive markets in Asia, Europe and Latin America. Within these markets, we aim to enhance the consumer outdoor cooking experience and teach millions of people how to grill the “Weber Way.” Although our top 12 developing markets currently account for approximately 10% of our revenue, we believe we can meaningfully expand this percentage in the future, to grow our customer base and drive net sales. Historically, the growth in our developing markets has been nearly two times the growth of our mature markets and we believe this pattern can be repeated as we expand in these emerging geographies and increase our global brand awareness.
Execute on Value-Enhancing Operational Initiatives
In 2018, we launched our “Fuel the Growth” initiative to improve productivity within our supply chain, focusing on “Make Where We Sell” initiatives and distribution footprint optimization projects. To date, we have achieved over $64 million in gross productivity savings which has resulted in 150 bps of margin improvement and allowed us to increase growth investments. Key ongoing drivers of our Fuel the Growth initiative include sourcing initiatives in Mexico, Poland and Southeast Asia, our U.S. assembly plant consolidation, our new EMEA manufacturing facility in Zabrze, Poland and our distribution network optimization initiatives. In addition, we have various ongoing continuous improvement projects within our plants and distribution centers. We believe there is a significant opportunity for us to continue to expand our margins.
156
Table of Contents
Our Industry
We operate in the large, growing global outdoor cooking market which we believe is highly predictable, recurring and resilient. This market is comprised of outdoor products that include gas grills, charcoal grills, wood pellet grills, electric grills, smokers, grilling accessories, and solid fuel products (including charcoal briquettes, lump charcoal, pellets, and wood chips and chunks).
According to MetrixLab the installed base of U.S. grills is nearly 70 million units representing 56% penetration of U.S. households. We estimate that more than 30 million of these grills are Weber grills, based on MetrixLab, and are being replaced at a rate of over 2 million units per year. While we benefit from growth from our installed base, our business is not dependent on replacements. We will continue to grow based on the increasing number of first-time grill buyers; consumers purchasing second grills with a different fuel type; heightened demand for specialty grills such as smokers, pellet grills, electric grills and kamado grills; and additional revenue streams including accessories, consumables and grill services. We expect the outdoor cooking market will continue to benefit from increased investment in and around the home as well as macro consumer trends in at home food consumption, culinary exploration and health and wellness.
We believe that several fundamental shifts in consumer behavior are providing positive tailwinds for our industry, including the increasing adoption of outdoor lifestyles and rising focus on health and wellness. More than half (54%) of consumers report cooking more in 2020 and 52% of people cited health as one of their top reasons for cooking at home based on a survey from Hunter PR. The COVID-19 pandemic accelerated certain trends that benefited our industry, and, according to a 2020 survey of grill owners, 85% of grillers globally expect to grill as often or more often after the pandemic than they did before the pandemic. We believe that the grill represents the center of any outdoor lifestyle and our industry will see continued resiliency through the business cycle and growth driven by increasing demand for outdoor spaces.
Our Opportunity
We consider our market opportunity in terms of TAM, which is the revenue opportunity from the number of total households that we believe are able to own a grill and could be interested in purchasing a new one in current geographies where Weber operates and in potential markets. We define the SAM as the revenue opportunity from the total number of households that purchased a grill in a given year in markets where Weber currently operates.
According to Frost & Sullivan, our TAM is estimated at $49 billion globally and $9 billion in the United States and our SAM is estimated at $15 billion globally and $7 billion in the United States From 2015 to 2020, our SAM grew at a 3.0% CAGR and is projected to grow at a 4.5% CAGR from 2020 to 2025. We will grow both TAM and SAM as we expand beyond our current geographies and grow SAM as we introduce new products in our existing verticals and add new verticals to our product portfolio in geographies where we currently operate. As of 2020, we are approximately 7% penetrated in our global TAM and 18% penetrated in our U.S. TAM. For additional discussion of the methodology used to determine our TAM and SAM, see the section entitled “Market and Industry Data.”
Product Portfolio
We develop premium outdoor cooking products, accessories, consumables and services designed to provide the best, most customized outdoor cooking experience. Starting with our iconic Kettle grill, our unwavering commitment to innovative products has allowed us to develop an industry leading portfolio across fuel types and pricing tiers. The innovation we bring to the outdoor cooking
157
Table of Contents
category, along with the strength of the Weber brand has allowed us to capture and maintain industry leading market share. Our current product portfolio includes grills (gas, charcoal, electric, pellet, and smokers) and accessories, consumables and services. In 2020 our grills represented 74% of our revenues and our accessories and consumables represented approximately 26%.
|
Genesis II SX-335 Smart Grill |
We are the market leader in Gas grills. Our gas grill product sub-category is comprised of our Genesis series, Spirit series, Q series, Summit® series, and recently launched Weber Traveler series. We have brought pioneering innovation to the sub-category with features such as our stainless steel Flavorizer bars and porcelain-enameled coating. As of December 31, 2020, our Gas product sub-category consisted of MSRPs ranging from $79.99 to $4,099.99. | |
|
Master-Touch Charcoal Grill |
We have continued to expand our Charcoal product line, growing the portfolio from the Original Kettle series to include the Master Touch, Performer, Summit Kamado, Ranch, and Smokey Joe and Go-Anywhere portable series. Our Charcoal grills come in a variety of sizes and colors and offer industry leading features such as high capacity ash catchers, glass-reinforced nylon handles, porcelain-enameled bowls and lids, and aluminized steel One-Touch cleaning system. As of December 31, 2020, our Charcoal product sub-category consisted of MSRPs ranging from $39.99 to $2,299.99. | |
|
Pulse 2000 Electric Grill with Cart |
We introduced our emerging portfolio of high performance outdoor Electric grills in 2018 and have quickly established a strong position internationally. Our electric product sub-category features our Q and Pulse Series grills with differentiated features such as porcelain-enameled cast-iron cooking grates, cast aluminum lid and body, and our Weber Connect Smart Grilling Hub. As of December 31, 2020, we offered MSRPs ranging from $329.99 to $1,149.99. | |
|
Smokey Mountain Cooker Smoker |
Our Smoker product sub-category features our Smokey Mountain Cooker Series and its industry leading performance. The Smokey Mountain Cooker Series is loved by both enthusiasts and professionals and includes features such as a porcelain-enameled lid, bowl, and center section; two cooking grates, and a removable fuel door. As of December 31, 2020, we offered MSRPs ranging from $239.99 to $549.99. | |


158
Table of Contents
|
SmokeFire EX6 Wood Pellet Grill |
In 2020 we launched our versatile SmokeFire Series in the Pellet sub-category. Unlike other pellet grills that can only cook at low temperatures, SmokeFire has a temperature range of 200-600°F allowing consumers to sear steaks or smoke briskets. SmokeFire features our Weber Connect smart grilling technology, our stainless steel Flavorizer bars and porcelain-enameled coating. As of December 31, 2020, we offered MSRPs ranging from $1,149.99 to $1,399.99. | |
|
Weber® Connect Smart Grilling Hub & Grillmaster Blend All-Natural Hardwood Pellets |
Accessories, consumables and services are a core component of our product offering as they deepen our relationship with consumers and represent a high margin, year-round recurring revenue stream between grill purchases. We offer MSRPs ranging from $2.99 to $199.99 including connected devices with our Weber Connect Smart Grilling Hub, serving accessories, grill care, Weber branded merchandise, grilling guide and recipe books, and Weber branded fuel. We also offer services in select geographies such as delivery, assembly, and grilling classes. | |


Sales Channels
We sell our products through an omni-channel network that consists of wholesale, DTC and e-commerce.
Wholesale — We develop and maintain relationships with our global and international retailers and independent and specialty dealers by offering them an attractive combination of category validation, marketing and merchandising support, and rapid inventory turns. Our wholesale network is supported by our direct sales organization covering all channels of distribution. We have established relationships with leading global and international retailers who expand our reach and offer our consumers a broader range of our products. We also sell our products to 2,300 independent retailers (barbecue and grilling stores, hardware stores, outdoor and recreation stores, and farm and ranch supply stores, etc.) across 78 countries, which strengthens our connection to local markets and provides valuable brand advocacy. We continue to identify and evaluate new retail partners throughout our large and emerging geographic markets. In the U.S., we utilize a Minimum Advertised Price (“MAP”) program which provides pricing integrity across all sales channels. In Europe, consistent with other market leaders, Weber employs a Selective Distribution System (SDS) to ensure a consistent consumer experience with Weber products.
DTC — We sell our products directly to consumers through Weber.com, our 170 Weber branded retail stores and Grill Academy sites (161 independently operated, 9 Weber-operated). Our DTC platform allows us to display our entire portfolio and deliver unique Weber experiences that deepen consumer relationships with our brand. We have made significant investments in our e-commerce platform by hiring top talent from leading e-commerce companies, relaunching our website in 2021, and implementing a new digital customer service experience. Additionally, consumers can now browse and purchase the entire Weber portfolio with curated search functionality on Weber.com, buy products
159
Table of Contents
exclusive to our site, and receive direct financing through a third-party provider. We also sell through an international network of 170 Weber branded retail locations and Grill Academy sites. We partner with local operators who fund and operate these locations under strict Weber guidelines. In the future, we intend to open additional stores in select locations globally to drive brand growth and awareness. We have made significant investment in our DTC capabilities which have resulted in our DTC channel revenue increasing by 47% from 2018 to 2020.
E-commerce — We have a strong presence in the e-commerce channel and a dedicated digital commerce team to drive penetration and growth within the online platforms of our global, multi-national and European retailers, as well as digitally native retailers such as Amazon and Wayfair. Our digitally native retailers have seen significant growth with the Weber brand with sales growing 24% annually since 2018. We believe our online share in the U.S. in fiscal 2020 was two times greater than that of our nearest competitor.
Marketing and Consumer Engagement
The strength of the Weber brand has been built by years of superior product performance, fan advocacy and outstanding customer care. From 2018 to 2020, we increased our advertising and marketing spending by 14%. Historically we have excelled in marketing through our trade channels; we have supplemented that strength over time by investing in marketing talent to deepen our expertise, build broader capabilities and execute a wide range of marketing tactics across the channels described below.
| • | Targeted Advertising: We develop and selectively use advertising to showcase our brand and new product launches during the key grilling seasons around the world. Our advertising appears in online display and connected and online TV, such as YouTube where Weber advertisements were viewed approximately 100 million times throughout the 2020 calendar year. In addition, we invest in search marketing and affiliate marketing programs. These advertising programs serve to increase targeted brand awareness with consumers likely to be interested in grilling. |
| • | Engagement Marketing: We collect consumer data from a wide range of sources, including our connected devices, Weber apps, purchases on Weber.com, owner warranty registrations, email opt-ins, consumer contacts, Grill Academy classes and more. Each of these connection points builds richer consumer profiles, enabling us to better know our consumers and tailor our marketing, offers and programs. Our CRM efforts are focused on deepening our database, creating robust lifecycle marketing, and developing customized offers, such as accessories and services, based on consumer profiles. |
| • | Social Media: We use social media to further cultivate our Weber community and amplify the passion for our brand and products. As of December 31, 2020, we have over 3 million followers globally, up 30% compared to the prior year across our social media accounts including Instagram, Facebook and Twitter. |
| • | Experiential Brand Events: We bring the brand to life with a variety of experiential events each grilling season. Our “Grill Masters”—a global team of Weber culinary experts with a deep expertise in grilling techniques and Weber products—participate in more than 200 events annually, doing in-person and virtual cooking demonstrations while also showcasing our broad range of products. Events they’ve attended include the American Royal World Series of Barbecue, Memphis in May, Windy City Smoke-out and Consumer Electronics Show (“CES”). In addition, we have a mobile grilling academy that does pop-up events at DIY and independent retailers across North America. These pop-ups intercept consumers at the point of |
160
Table of Contents
| sale for a new grill and educate them on the Weber brand, the features of our products and how to use them. |
| • | Brand Ambassadors and Partnerships: We work with high-profile food, lifestyle, and barbecue influencers worldwide as extensions of our brand. These influencers participate in brand-led activations and promotions and create new content for our communities to talk about and share. We also invest in select partnerships, including the American Royal World Series of Barbecue and premium-quality meat delivery brand, Butcher Box, and have generated significant unpaid media. |
| • | In Store Merchandising: We bring the Weber brand to life across a variety of retail formats, including Weber Stores, big box, independent and specialty dealers, leveraging proprietary shopper insights, category management and best-in-class retail merchandising practices. We collaborate with our retail partners to deliver an engaging and compelling Weber brand experience through custom fixtures, signage and product displays that help to educate consumers and ultimately lead to increased conversion. We also partner with many of our customers, globally, to create an omni-channel experience linking category leading digital content with in-store displays ensuring consumers have a consistent Weber brand experience. |
| • | Owner Care: Superior customer service is a deeply ingrained Weber brand equity, and we consider our owner care capability a competitive advantage that drives loyalty, repeat purchases and high referral rates. Our regional contact centers are located within the markets that they serve and provide assistance to prospective owners (such as selection and purchase of a grill) and new owners (such assistance with assembly and technical troubleshooting) and ongoing support for established owners (such as warranty and replacement part support). We offer many ways for consumers to reach us, including voice, email, live chat and text functionality. |
Product Innovation and Development
Consumers are at the center of our product innovation and development process. We significantly increased investment in product innovation and development to bring innovation to our existing product portfolio and facilitate entry into new product categories based on data driven consumer insights. Our product innovation and development (“R&D”) investment has increased by 57% from 2018 to 2020; our R&D team develops new products and enhances our existing product portfolio with an unwavering focus on improving consumers’ grilling experiences, encouraging them to grill more often and with more confidence. Our commitment to innovation is further exemplified by our 2021 acquisition of June Life, which not only brought industry leading technology to Weber, but also added a team of best-in-class software and hardware engineering capabilities.
Global Operations
We believe that our global supply chain and owned regional manufacturing capabilities provide us with a clear competitive advantage over our competitors. We are the only major grill company that maintains a significant U.S.-based manufacturing footprint and the majority of our U.S. sold grills are produced in our 621,859 square foot facility in Huntley, Illinois. We have a long standing history with a diversified set of suppliers, mainly within the U.S. and Asia, who send component parts to Huntley for finished grill manufacturing. In addition to our U.S. manufacturing, we maintain trusted relationships of 15+ years with three major grill manufacturers in China who provide us with flexibility and redundancy across our major project lines. All of our partners operate according to our strict quality standards and in accordance with our supplier code of conduct.
In 2019, we launched our “Fuel the Growth” program to drive operational efficiencies and produce more products in the markets where they are sold. We consolidated our U.S. manufacturing facilities
161
Table of Contents
into the Huntley facility and also broke ground on a new BREAM certified manufacturing and distribution facility in Zabrze, Poland, which we expect to open in 2021. When complete, we believe our facility in Zabrze will further enable our “Make Where We Sell” strategy by providing a local manufacturing footprint in each region we operate, reduce manufacturing and transportation costs resulting in reduced CO2 emissions, increase our manufacturing capacity, deliver working capital efficiencies, improve demand responsiveness in EMEA, and further diversify our global manufacturing footprint.
We enforce stringent product quality standards over our own manufacturing and that of our manufacturing partners. In 2019, we increased investment in our product quality organization with the addition of external top-talent hires, including senior leaders from industry-leading industrial and automotive companies. We provide our manufacturing partners with detailed specifications for our products and provide oversight and inspection of finished goods both at the facilities of our manufacturing partners as well as upon delivery to our locations. As part of our quality assurance program, we have developed and implemented comprehensive product inspection and facility oversight processes that are performed by our employees and third-party resources. They work closely with our suppliers to assist them in meeting our quality standards, as well as improving their production yields and throughput. Our standards for quality have enabled us to offer an industry-leading warranty on many aspects of our products, which fuels brand loyalty and best-in-industry repurchase rates.
The primary raw materials used in our manufacturing facilities as well as those of our suppliers include aluminum, carbon steel, stainless steel, polypropylene and nylon. We believe that many of these materials are available globally from multiple suppliers. In some cases, we will specify certain suppliers for key raw materials or components in order to maintain our quality standards and leverage our global volumes. In the case of certain high-volume finished grills and accessories, we may have multiple qualified suppliers and / or internal manufacturing capabilities in order to minimize the risk of disruption in supply.
Our Global Distribution Center in Huntley serves as a central hub for shipments to our North American retail customers and plays a key role in our global hub and spoke distribution model that serves 78 countries. Throughout our network, we are able to service all types of customers including individual e-commerce orders, full truckload shipments to our largest retail customers as well as smaller truck shipments to our dealer partners. Globally, we occupy 22 distribution facilities, maintaining a hub and spoke approach to distribution. We use 14 distribution partners across 11 countries to serve markets in EMEA and APAC to strengthen our network. We employ this hybrid model as it allows us to control distribution of our product in markets where it is economically viable, while extending our reach into developing markets and achieving appropriate inventory levels. As select markets grow, we may look to transition them from operating as third-party distribution partners to operating within our owned distribution network. However, we believe our international providers have sufficient expansion capacity to meet our future needs. We manage inventory through a disciplined, global sales and operations planning process that manages demand and supply dynamics in real-time.
Competition
We compete in the large global outdoor cooking market and we offer products for gas and charcoal grilling, as well as specialty grills. Competition in our markets is based on a number of factors including product quality, performance, durability, features and price, as well as brand image and recognition. Weber is the only outdoor cooking brand with significant global scale, operating a vertically integrated manufacturing platform with an omni-channel distribution network. We believe that we have been able to successfully compete due to the strength of our brand, our superior design capabilities
162
Table of Contents
and product development, and the breadth of products we offer across fuel types and pricing tiers. As the largest global grilling brand, we compete against a variety of well-known and emerging brands based on fuel type and geography. While no other company offers the breadth of our product offering, our competitors, in certain categories, include Big Green Egg, Broil King, Campingaz, Char-Broil, Landmann, Napoleon, Nexgrill, Pit Boss, Traeger and Ziegler & Brown.
Intellectual Property
We rely on a combination of patent, trademark, trade secret, copyright and other intellectual property laws in the U.S. and similar laws in other jurisdictions, as well as confidentiality procedures, cybersecurity practices and contractual provisions and restrictions, to establish, maintain and protect the intellectual property and proprietary rights and our products and technology. As of December 31, 2020, we held approximately 57 issued U.S. patents, 730 issued foreign patents and 231 pending patent applications worldwide (including 23 PCT applications and six provisional U.S. patent applications) relating to our products, as well as approximately 84 registered U.S. trademarks, 373 registered foreign trademarks and 70 pending trademark applications worldwide covering our brands and products. In addition to the intellectual property rights that we own, we license certain technologies and intellectual property rights from third parties, some of which are incorporated into our products.
We have implemented an online marketplace monitoring and seller/listing termination program to disrupt any counterfeit or infringing offerings. We collaborate with Amazon and other online marketplaces to operate such termination programs. In addition, we work to stop infringement of our intellectual property rights through the use of cease and desist letters and, if necessary, litigation in order to secure agreements that confirm our rights and prevent the continued use and sale of infringing products. Some of our brands are also recorded with the United States Customs service, and we cooperate with the United States Customs service on occasion to interdict counterfeit goods seeking to be imported. For additional discussion of how intellectual property protection affects our business, see the section titled “Risk Factors—Risks Related to Government Regulation, Litigation and Intellectual Property Matters.”
Privacy and Information Safeguard Laws
In the ordinary course of our business, we collect, use, store, transmit, disclose and otherwise process certain types of data, including personal information, which subjects us to certain privacy and information security laws in the U.S. and internationally. Such laws are evolving regularly, and complying with these various laws, rules, regulations and standards, and with any new laws or regulations or changes to existing laws, could cause us to incur substantial costs that are likely to increase over time, adjust our compliance program on an ongoing basis, change our business practices in a manner adverse to our business, divert resources from other initiatives and projects, and restrict the way products and services involving data are offered. See “Risk Factors—Risks Related to Government Regulation, Litigation and Intellectual Property Matters—Our use and disclosure of personal information is subject to federal, state and international privacy and security regulations, and our failure to comply with those regulations or to adequately secure such information we hold could result in significant liability or reputational harm and, in turn, substantial harm to our customer base and revenue.”
Seasonality
Although we generally have demand for our products throughout the year, our sales have historically experienced some seasonality. We have typically experienced our highest level of sales of our products in the second and third fiscal quarters as retailers across North America and Europe
163
Table of Contents
changeover their floor sets, build inventory and fulfill consumer demand for outdoor cooking products. Sales are typically lower during our first and fourth fiscal quarters, with the exception of our Australia/New Zealand business which is counter seasonal to the balance of our business. We have a long track record of investing in our business throughout the year, including in operating expenses, working capital, and other growth initiatives. While these investments drive performance during the primary selling season in our second and third fiscal quarters, they generally have a negative impact on cash flow and net income during our first and fourth fiscal quarters. Unfavorable weather during our higher sales season can also have a material adverse impact on our results, and can cause shifts in sales across fiscal quarters. A few examples are colder, wetter weather patterns during the key second and third fiscal quarters in North America and Europe, or drought conditions leading to wildfires similar to what we experienced in Australia in early fiscal year 2020.
Information Systems
We believe that our management information systems will support our continued growth. We select technology that is global, cloud-first and supports the localization we require to operate, compete, and differentiate ourselves in the market. Over the last five years, we have invested over $40 million in our information system infrastructure and applications, including the ongoing implementation of a Global SAP/S4 HANA ERP platform. We successfully completed the first iteration of global design for a standard SAP system in 2020, as well as the full implementation of SAP for all processes supporting global supply and demand planning. Over the course of the next several years, we expect to deploy SAP in every region and country we operate in with the industry leading SAP S4 platform. We have also made investments across all business functions for competitive IT including human resources, legal, supply chain, product innovation and development and marketing and sales. Notable achievements globally include IT infrastructure, digital marketing and e-commerce, supply & demand planning and connected devices. We will continue to exploit technology that delivers operational excellence and competitive differentiation in support of robust growth and innovation.
Employees
As of December 31, 2020, we had approximately 2,156 full-time employees, including 1,046 in global operations and supply chain, nearly 400 in sales and marketing, and the remaining headcount support various business functions around the world. Of all of our full-time employees, 1,537 are located in the U.S. and 619 are located internationally. Approximately 33% of our employees are covered by collective labor agreements, all three of which are anticipated to renew in 2021. We have not experienced any significant union-related work stoppages over the last ten years. We consider ourselves to have a good relationship with our employees and labor unions.
As part of our human capital resource objectives, we seek to attract, retain, develop and reward our employees through a variety of mechanisms. We build upon Weber’s objectives by seeking to attract, retain, develop and reward behaviors to ensure our long term sustainability as a company. We continue to advance our efforts to develop a performance culture by strengthening performance management processes through management training and the development and implementation of consistent documentation and methodologies designed to ensure a robust process for all employees. We schedule performance discussions for all employees each year, and establish clearly defined goals and incentive programs to drive employee performance in alignment with our overall business objectives. In addition, we have implemented a coordinated approach in managing our overall compensation structure and regularly conduct full evaluations of our compensation and incentive programs to ensure we are competitive in these areas. We monitor our performance by measuring numerous elements relating to our human capital management efforts, including, but not limited to, employee turnover, time to fill open roles and general diversity statistics.
164
Table of Contents
Facilities
Manufacturing, Distribution, and Product Innovation and Development
Our primary Huntley manufacturing facility, which produces charcoal, gas and pellet grills, is located in Huntley, Illinois, a Northwest suburb of Chicago. We recently executed a sale-leaseback on the 621,859 square feet facility, with a 15-year lease term, while preserving expansion options that could provide capacity for future growth. We also lease two additional manufacturing facilities in Palatine, Illinois, which are approximately 67,000 square feet and 59,000 square feet, respectively.
Our new Poland Manufacturing and Distribution Center located in Zabrze, Poland, which we expect to be completed and functioning by the fourth quarter of 2021, will be a 486,819 square foot state-of-the-art manufacturing and technical space that will include an additional 51,935 square foot office. The distribution center will initially act as a hub and spoke distribution point for our EMEA markets for products manufactured in the Zabrze facility. The Poland operations have significant capacity expansion opportunities as we build out the operations in the future.
We lease a 757,120 square foot Global Distribution Center in Huntley, Illinois, adjacent to our manufacturing plant that serves as our primary consolidation point for distribution in the U.S. and outbound distribution for grills across the globe. We also lease a smaller, domestic distribution center located in Elgin, Illinois, which is 319,043 square feet and serves as our primary DTC/e-commerce distribution facility for the U.S. and Canada. We also lease approximately 29,000 square feet of product innovation and development office space and test facilities in Palatine, Illinois.
Headquarters and Office Locations
Our Global Headquarters is located at 1415 S. Roselle Road in Palatine, Illinois. We expect that this 154,706 square foot corporate complex, which we own, will accommodate our growth plans for the foreseeable future. Generally, each of our Operating Segments HQ locations are within their respective Regions—Americas located within our Global Headquarters complex, EMEA in Germany, and APAC in Singapore. We recently added a 6,857 square foot satellite corporate office with a 65 month lease term in downtown Chicago, Illinois to attract additional talent in IT/technology and innovation/marketing roles. We operate regional shared service/back-office operations in four primary locations—Palatine (within our Global Headquarters); Prague, Czech Republic; Adelaide, Australia; and Kuala Lumpur, Malaysia. In most of the countries we operate in, we lease office space for local operations (local country leadership, consumer call centers, etc.) and we do not foresee any significant changes to these operations going forward. We believe that our headquarters and shared service center facilities are sufficient for our near-term growth plans. We intend to add new facilities or expand existing facilities in certain locations as we add staff or expand in our geographic markets and we believe that suitable additional space will be available as needed to accommodate any such expansion.
Legal Proceedings
From time to time, we may become involved in legal proceedings or be subject to claims arising in the ordinary course of our business. We are not presently a party to any legal proceedings that in the opinion of our management, if determined adversely to us, would individually or taken together have a material adverse effect on our business, operating results, financial condition or cash flows.
Government Regulations
We are subject to many varying laws and regulations in the United States, the European Union, the United Kingdom, and throughout the world, including those related to privacy, data protection,
165
Table of Contents
intellectual property, consumer protection, e-commerce, marketing, advertising, messaging, rights of publicity, health and safety, employment and labor, product liability, accessibility, competition, and taxation. These laws and regulations are constantly evolving and may be interpreted, applied, created, or amended in a manner that could harm our current or future business and operations. In addition, it is possible that certain governments may seek to block or limit our products and services or otherwise impose other restrictions that may affect the accessibility or usability of any or all of our products and services for an extended period of time or indefinitely.
Our properties and operations are subject to a number of environmental, health and safety laws and regulations in each of the jurisdictions in which we operate. These laws and regulations govern, among other things, air emissions, water discharges, handling and disposal of solid and hazardous substances and wastes, soil and groundwater contamination, employee health and safety and the chemical content of products. Under certain of these laws and regulations, we may be subject to joint and several liability for environmental investigations and cleanups, including at properties that we currently or previously owned or operated, or at sites at which waste we generated was disposed, even if the contamination was not caused by us or was legal at the time it occurred.
We are also subject to laws regulating consumer products in the jurisdictions in which we sell our products. In the United States for instance, certain of our products are subject to the U.S. Consumer Product Safety Act, under which the U.S. Consumer Product Safety Commission may exclude products from the market that are found to be unsafe or hazardous, require repair, replacement or refund of products, impose fines for noncompliance with requirements and impose fines for failure to timely notify them of potential safety hazards.
Insurance
We maintain commercial insurance policies with third parties in the areas of executive risk, commercial property, casualty (including product liability), marine cargo, vehicle, general liability, workers’ compensation and other employee-related costs including foreign casualty. Depending on perceived risk, we also self-insure other items like customer payment risk and collecting on open accounts receivable. There are various levels of deductibles and coverage limits on policies depending on the risk exposure. Self-insurance claims filed and claims incurred but not recorded are accrued based upon our estimates of the ultimate costs to be incurred using historical experience and input of the third-party entity that administrates the claims. Our ultimate exposure may be mitigated by amounts we expect to recover from third parties associated with such claims.
166
Table of Contents
Executive Officers and Directors
Set forth below is certain biographical and other information regarding our directors, after giving effect to the Reorganization Transactions, and our executive officers as of July 27, 2021.
| Name |
Age | Position | ||||
| Chris M. Scherzinger |
52 | Chief Executive Officer and Director | ||||
| Hans-Jürgen Herr |
59 | President, EMEA | ||||
| William J. Horton |
53 | Chief Financial Officer | ||||
| Michael G. Jacobs |
51 | Chief Supply Chain Officer | ||||
| Mary A. Sagripanti |
55 | Chief Marketing Officer | ||||
| Troy J. Shay |
46 | President and Chief Commercial Officer | ||||
| Kelly D. Rainko |
44 | Non-Executive Chair of the Board | ||||
| Susan T. Congalton |
75 | Director | ||||
| Elliott Hill |
57 | Director | ||||
| Martin McCourt |
64 | Director | ||||
| Melinda R. Rich |
63 | Director | ||||
| James C. Stephen |
71 | Director | ||||
| Magesvaran Suranjan |
51 | Director | ||||
Chris M. Scherzinger has served as Chief Executive Officer and a Director of Weber-Stephen Products LLC since April 2018. He has been a Director of Weber Inc. since April 2021. Mr. Scherzinger held a variety of executive leadership roles at Jarden Corporation and its 2016 acquisitor Newell Brands from 2008 to 2018, including President and CEO of the Appliances & Cookware operating unit in Newell Brands from 2016 to 2018, President and CEO of Jarden Branded Consumables from 2014 to 2016, President and CEO of Jarden Leisure & Entertainment from 2012 to 2014 and President of Jarden Home Brands from 2008 to 2012. Mr. Scherzinger held general management and marketing leadership roles at Johnson & Johnson from 2003 to 2008, marketing leadership roles at Johnson Outdoors (S.C. Johnson) from 2001 to 2003, marketing leadership roles at Procter & Gamble from 1995 to 2001, and manufacturing management roles at General Electric from 1991 to 1993. Mr. Scherzinger graduated from the University of Notre Dame in 1991 with a BS in Mechanical Engineering, and later earned an MBA from Northwestern University’s Kellogg School of Management in 1995.
Mr. Scherzinger was selected to serve on our Board of Directors because of his experience as CEO of Weber, his other CEO roles and his experience gained from serving in other senior leadership positions. These include marketing leadership, brand management and operational roles with several leading global consumer brands, all of which enables him to bring to our Board a combination of robust operational perspective and valuable marketing and industry insights.
Hans-Jürgen Herr has served as Weber-Stephen Products LLC’s President – EMEA since November 2012 and will serve in a similar role for Weber Inc. upon consummation of this offering. Mr. Herr previously served as Vice President, Central of Weber-Stephen Products LLC from 2008 to 2012 and as its General Manager, Germany from 2004 to 2008. Mr. Herr also serves as Managing Director, President or Director for numerous subsidiaries of Weber-Stephen Products LLC in the EMEA region. Mr. Herr graduated as a wholesale and foreign trade merchant from the Wirtschaftsgymnasium/Handelslehranstalt in Rastatt, Germany in 1982 and as a business economist in commerce from the Chamber of Industry and Commerce in Karlsruhe, Germany in 1987.
167
Table of Contents
William J. Horton has served as Chief Financial Officer of Weber-Stephen Products LLC since June 2018 and will serve in a similar role for Weber Inc. upon consummation of this offering. Prior to joining Weber, Mr. Horton served as Division CFO for a number of Business Units within Jarden Corporation, prior to its merger with Newell Rubbermaid, from 2009 to 2016. After the acquisition, under Newell Brands, Mr. Horton was CFO of the company’s largest Division, Rubbermaid Commercial Products, from 2016 to 2018. Mr. Horton achieved the rank of Captain in the United States Air Force, serving from 1989 to 1994 at Wright-Patterson Air Force Base in Dayton, Ohio. Mr. Horton has served as a Director of Rather Outdoors since February 2020. Mr. Horton received a BA in Mathematics from Miami University in 1989, and an MBA in Finance from Wright State University in 1994.
Michael G. Jacobs has served as Chief Supply Chain Officer of Weber-Stephen Products LLC since September 2020 and will serve in a similar role for Weber Inc. upon consummation of this offering. Mr. Jacobs’ previous roles at Weber include Executive Vice-President, Supply Chain & Operations from September 2018, Senior Vice President, Supply Chain from February 2016; and Vice President, Purchasing from 2014. Mr. Jacobs received a BA in Economics from Valparaiso University in 1992 and an MBA from Loyola University in 1994.
Mary A. Sagripanti has served as Chief Marketing Officer of Weber-Stephen Products LLC since February 2021 and will serve in a similar role for Weber Inc. upon consummation of this offering. Ms. Sagripanti previously served as Global Head of Marketing, Growth and Customer Engagement, Fire TV at Amazon from 2019 to 2021 and as General Manager, Global Product Development, Fulfillment Services at Amazon from 2016 to 2019. Ms. Sagripanti received a BA from the University of Notre Dame in 1987 and an MBA with concentrations in Marketing and Finance from the Stephen M. Ross School of Business at the University of Michigan in 1997.
Troy J. Shay has served as President and Chief Commercial Officer of Weber-Stephen Products LLC since July 2018 and will serve in a similar role for Weber Inc. upon consummation of this offering. Prior to joining Weber, Mr. Shay served as President and Chief Customer Officer for the Appliance & Cookware division of Newell Brands from 2017 to 2018 and President of the U.S. business of Moen, Incorporated from 2016 to 2017. Before that, Mr. Shay was President of Jarden Home Brands, a division of Jarden Corporation, where he spent nine years holding a progression of sales, marketing and general management positions. Mr. Shay received a B.S. in Business Administration & Marketing from the University of Illinois, Urbana-Champaign in 1997 and an MBA with High Distinction from the University of Michigan’s Stephen M. Ross School of Business in 2013.
Kelly D. Rainko has served as a Director of Weber-Stephen Products LLC since December 2010 and, since July 2021, has served as Non-Executive Chair of the Board for Weber Inc. Ms. Rainko currently serves as a Partner and member of the Executive Committee of BDT & Company, which she joined at its founding in May 2009. Ms. Rainko previously served as a Vice President of Goldman Sachs from 2007 to 2009 in the Closely Held effort within the Investment Banking Division. Ms. Rainko is a director of Peet’s Coffee and a director of Caribou Coffee. In addition, she is a board member of SAFE Project. Ms. Rainko formerly served as a board observer of KIND Healthy Snacks and an Advisory Director of Cox Automotive. Ms. Rainko received a BBA from the University of Michigan and an MBA from the Kellogg School of Management at Northwestern University.
Ms. Rainko was selected to serve on our Board of Directors because of her deep knowledge of our business and extensive experience in corporate finance and strategic planning.
Susan T. Congalton has served as a Director and Chair of the Audit Committee of Weber-Stephen Products LLC since January 2016; and since July 2021, has served as Director of Weber Inc. Ms. Congalton most recently served as Chairman and CEO of California Amforge Corporation, a metal forging company principally serving the commercial and military aerospae industries, since 2002. Prior
168
Table of Contents
to that, she engaged in business consulting and private investments; served as Senior Vice President- Finance and Law, CFO and General Counsel of Carson Pirie Scott & Company in Chicago, lL; and was a Partner in the New York law firm of Reavis & McGrath, where she specialized in corporate and venture capital transactions. Ms. Congalton previously served as a Director of BMO-Harris Financial Corp., where she chaired the Audit and Governance Committees, and as a Director of Pulitzer lnc. Ms. Congalton received a J.D. degree from Georgetown University Law Center, and a B.A. from Loretto Heights College.
Ms. Congalton was selected to serve on our Board of Directors because of her extensive experience in corporate finance, financial reporting and legal, manufacturing and governance matters.
Elliott Hill has served as a Director of Weber-Stephen Products LLC since August 2020 and, since July 2021, has served as Director for Weber Inc. Mr. Hill currently serves as an Advisor to BDT Capital Partners and as a director of Rather Outdoors and Tecovas, Inc. Mr. Hill previously worked at Nike from 1988 to 2020, most recently as President, Consumer & Marketplace from March 2018 to August 2020. Other roles during Mr. Hill’s time at Nike consist of leadership positions in Sales and Retail including Apparel Sales Director in Europe; Retail Development Director for EMEA; Vice President of Sales and Retail in EMEA; Vice President and General Manager of US Retail; Vice President of US Sales, Retail and Nike.com; Corporate Vice President of Global Retail; and President of Nike North America. Mr. Hill received a BS in Kinesiology from Texas Christian University in 1986 and a Master’s Degree in Sports Administration from Ohio University in 1988.
Mr. Hill was selected to serve on our Board of Directors because of his extensive leadership experience and knowledge of global consumer brands, corporate strategy and global markets.
Martin McCourt has served as a Director of Weber-Stephen Products LLC since January 2019 and, since July 2021, has served as Director for Weber Inc. From 1996 to 2012, Mr. McCourt served as Director and as Chief Executive Officer of Dyson where he transformed the company from single product, single market producer into a global appliance leader. Mr. McCourt also serves as a BDT Operating Partner. Mr. McCourt previously held leadership positions at Mars, Duracell, Toshiba and Pelikan. Mr. McCourt currently serves as Chairman of Simon Technologies, a subsidiary of Pure Electric; Director of Tharsus; Chairman of Free Flow Technologies; and Chairman of Lightfoot. Mr. McCourt has served on the Boards of other companies and organizations in the past, including as Chairman, at companies such as Learning Curve Group, Headbox, Your Life, Glen Dimplex, Dudson, Venture Founders, CAP, CliniSys Group, Dutch Ophthalmic Research Centre and Equatex.
Mr. McCourt was selected to serve on our Board of Directors because of his knowledge of our business, the significant insight he brings from his past and present directorships and his extensive experience in global brand leadership, product innovation and emerging market growth.
Melinda R. Rich has served as Director of Weber Inc. since July 2021. Ms. Rich currently serves as Vice Chairman of Rich Products Corporation, and sits on the company’s Board of Directors, including as Chairperson for the Finance and Audit Committee and Compensation and Organization Committee. Ms. Rich is Executive Vice Chairman of Rich Entertainment Group. She joined Rich Products Corporation in 1985 and worked in various roles as part of the leadership team including President, Rich Entertainment Group and Executive Vice President of Innovation. Ms. Rich serves as a Director of M&T Bank, including as a member of their Nomination, Compensation and Governance Committee; she is a Partner in Grove Entertainment, an Advisor to BDT Capital Partners, a member of the Cleveland Clinic Board of Trustees and serves on the Rock and Roll Hall of Fame + Museum Board of Trustees, including as a member of their Executive Committee and Co-Chair of the Marketing Committee.
169
Table of Contents
Ms. Rich was selected to serve on our Board of Directors because of her extensive leadership experience and broad understanding of strategy, corporate governance and corporate finance.
James C. Stephen has served as Executive Chairman of Weber-Stephen Products LLC since 2013 and, since July 2021, has served as Director for Weber Inc. Mr. Stephen is currently a Director of Bemis Manufacturing Company, a Director of Cornerstone National Bank and a member of the Board of Trustees for the University of Chicago Hospitals. Mr. Stephen served as President and Chief Executive Officer of Weber-Stephen Products LLC from 1992-2013.
Mr. Stephen was selected to serve on our Board of Directors because of his unique perspective and experience as a member of the company’s founding family and as its former CEO as well as his extensive experience in corporate strategy, product development and brand leadership.
Magesvaran Suranjan has served as Director of Weber Inc. since July 2021. Mr. Suranjan currently serves as President - Asia Pacific, Middle East, and Africa of Procter & Gamble. Mr. Suranjan joined Procter & Gamble in 1994 and has worked in various roles as part of the leadership team, including President, Asia Pacific Selling & Market Operations and Vice President, Asia Home Care, Personal Power, and Australasia, Japan and Korea Oral Care. Mr. Suranjan serves as a Director of the US-India Business Council, a Director of the Singapore Economic Development Board, including as a member of its Finance Committee, a Member of the Advisory Board of the Lee Kong Chan School of Business at Singapore Management University and as a Member of the Advisory Board for the Center of Emerging Markets at Northwestern University. Mr. Suranjan received a B.Sc. with Honors in Accounting from Indiana University, Bloomington, in 1989 and an M.B.A. in Finance & Marketing from the University of Chicago in 1994.
Mr. Suranjan was selected to serve on our Board of Directors because of his extensive business leadership, particularly in emerging markets, corporate finance experience and financial reporting knowledge.
Board Structure
Composition
Upon the consummation of the offering, our board of directors will consist of eight directors. Susan T. Congalton Elliott Hill, Martin McCourt, Melinda R. Rich and Magesvaran Suranjan qualify as independent directors under the applicable corporate governance standards of the NYSE.
In accordance with our certificate of incorporation and bylaws, the number of directors on our board of directors will be determined from time to time by the board of directors but shall not be less than five persons nor more than 13 persons.
Each director is to hold office until his or her successor is duly elected and qualified or until his or her earlier death, resignation or removal. Vacancies and newly created directorships on the board of directors may be filled at any time by the remaining directors.
Our board of directors will be divided into three classes with staggered three-year terms. At each annual stockholders’ meeting, the successors to directors whose terms then expire will be elected to serve from the time of election and qualification until the third annual meeting following election. Our directors will be divided among the three classes as follows:
| • | the Class I directors will be Susan T. Congalton, Kelly D. Rainko and Chris M. Scherzinger, whose terms will expire at the annual stockholders’ meeting to be held in 2021; |
170
Table of Contents
| • | the Class II directors will be Melinda R. Rich, James C. Stephen and Magesvaran Suranjan, whose terms will expire at the annual stockholders’ meeting to be held in 2022; and |
| • | the Class III directors will be Martin McCourt and Elliott Hill, whose term will expire at the annual stockholders’ meeting to be held in 2023. |
We expect that any additional directorships resulting from an increase in the number of directors will be distributed among the three classes so that, as nearly as possible, each class will consist of one third of the directors. The division of our board of directors into three classes with staggered three-year terms may delay or prevent a change of our management or a change in control.
Following the time when the Majority Ownership Requirement is no longer met directors may only be removed for cause and by the affirmative vote of holders of 75% of the total voting power of our outstanding shares of common stock, voting together as a single class. This requirement of a super-majority vote to remove directors for cause could enable a minority of our stockholders to exercise veto power over any such removal. Prior to such time, directors may be removed with or without cause by the affirmative vote of the holders of a majority of the total voting power of our outstanding shares of common stock.
Controlled Company Exception
After the consummation of this offering, entities controlled by BDT Capital Partners, LLC will beneficially own more than 50% of the voting power for the election of directors. As a result, we will be a “controlled company” within the meaning of the NYSE rules and may elect to rely on exemptions from certain corporate governance standards provided to controlled companies by the NYSE rules, including that: (i) a majority of our board of directors consists of “independent directors,” as defined under the NYSE rules; (ii) we have a nominating and corporate governance committee that is composed entirely of independent directors with a written charter addressing the committee’s purpose and responsibilities; and (iii) we have a compensation committee that is composed entirely of independent directors with a written charter addressing the committee’s purpose and responsibilities. Immediately following the consummation of this offering, we do not intend to have a nominating and corporate governance committee. We do not intend to rely on the exemption to the requirement that a majority of our directors be “independent” as defined in the NYSE rules or the requirement that our compensation committee be composed entirely of independent directors. Accordingly, to the extent and for so long as we rely on these exemptions, you will not have the same protections afforded to stockholders of companies that are subject to all of these corporate governance requirements. In the event that we cease to be a “controlled company” and our Class A common stock continues to be listed on the NYSE, we will be required to comply with these provisions within the applicable transition periods. See “Risk Factors— We are a “controlled company” within the meaning of the NYSE rules and, as a result, qualify for, and will rely on, exemptions from certain corporate governance requirements that provide protection to the stockholders of companies that are subject to such corporate governance requirements.”
Committees of the Board
Upon the consummation of this offering, our board of directors will have two standing committees: an Audit Committee and a Compensation Committee. The following is a brief description of our committees.
Audit Committee
Upon the completion of this offering, Susan T. Congalton, James C. Stephen and Magesvaran Suranjan are expected to be the members of our Audit Committee. Susan T. Congalton is the chair of our Audit Committee. The board of directors has determined that each of Susan T. Congalton,
171
Table of Contents
James C. Stephen and Magesvaran Suranjan qualifies as an “audit committee financial expert” as such term is defined under the rules of the SEC implementing Section 407 of the Sarbanes-Oxley Act of 2002 and each of Susan T. Congalton and Magesvaran Suranjan is “independent” for purposes of Rule 10A-3 of the Exchange Act and under the listing standards of the NYSE. Designation as an “audit committee financial expert” does not impose on Susan T. Congalton, James C. Stephen and Magesvaran Suranjan any duties, obligations or liabilities that are greater than are generally imposed on members of our Audit Committee and our board of directors. Our Audit Committee is directly responsible for, among other things:
| • | selecting a firm to serve as the independent registered public accounting firm to audit our financial statements; |
| • | ensuring the independence of the independent registered public accounting firm; |
| • | discussing the scope and results of the audit with the independent registered public accounting firm and reviewing, with management and that firm, our interim and year-end operating results; |
| • | establishing procedures for employees to anonymously submit concerns about questionable accounting or audit matters; |
| • | considering the adequacy of our internal controls and internal audit function; |
| • | reviewing material related party transactions or those that require disclosure; and |
| • | approving or, as permitted, pre-approving all audit and non-audit services to be performed by the independent registered public accounting firm. |
Compensation Committee
Upon the completion of this offering, Martin McCourt, Elliott Hill and Melinda R. Rich are expected to be the members of our Compensation Committee. Martin McCourt is the chair of our Compensation Committee. All of the members of this committee are non-employee directors, as defined by Rule 16b-3 promulgated under the Exchange Act, and outside directors, as defined pursuant to Section 162(m) of the Internal Revenue Code of 1986, as amended (the “Code”), and meet the requirements for independence under the current NYSE listing standards. Our Compensation Committee is responsible for, among other things:
| • | reviewing and approving, or recommending that our board of directors approve, the compensation of the executive officers employed by us; |
| • | reviewing and recommending to our board of directors the compensation of our directors; |
| • | administering our stock and equity incentive plans; |
| • | reviewing and approving, or making recommendations to our board of directors with respect to, incentive compensation and equity plans; and |
| • | reviewing our overall compensation philosophy. |
Compensation Committee Interlocks and Insider Participation
None of our executive officers have served as a member of a compensation committee (or if no committee performs that function, the board of directors) of any other entity that has an executive officer serving as a member of our board of directors.
Code of Business Conduct and Ethics Policy
We will adopt a code of business conduct and ethics policy that applies to all of our employees, officers and directors, including those officers responsible for financial reporting. These standards are designed to deter wrongdoing and to promote honest and ethical conduct. The full texts of our code of
172
Table of Contents
business conduct and ethics policy will be available on our website at www.weber.com. Any waiver of the code for directors or executive officers may be made only by our board of directors or a board committee to which the board has delegated that authority and will be promptly disclosed to our stockholders as required by applicable U.S. federal securities laws and the corporate governance rules of the NYSE. Amendments to the code must be approved by our board of directors and will be promptly disclosed (other than technical, administrative or non-substantive changes). Any amendments to the code, or any waivers of its requirements for which disclosure is required, will be disclosed on our website.
Indemnification of Officers and Directors
Our certificate of incorporation provides that we will indemnify our directors and officers to the fullest extent permitted by the DGCL. We have established directors’ and officers’ liability insurance that insures such persons against the costs of defense, settlement or payment of a judgment under certain circumstances.
Our certificate of incorporation provides that our directors will not be liable for monetary damages for breach of fiduciary duty, except for liability relating to any breach of the director’s duty of loyalty, acts or omissions not in good faith or which involve intentional misconduct or a knowing violation of law, violations under Section 174 of the DGCL or any transaction from which the director derived an improper personal benefit.
We have entered into indemnification agreements with each of our directors and executive officers. These agreements, among other things, require us to indemnify each director and executive officer to the fullest extent permitted by Delaware law, including indemnification of expenses such as attorneys’ fees, judgments, fines and settlement amounts incurred by the director or executive officer in any action or proceeding, including any action or proceeding by or in right of us, arising out of the person’s services as a director or executive officer.
173
Table of Contents
COMPENSATION DISCUSSION AND ANALYSIS
The purpose of this Compensation Discussion and Analysis section is to provide information about the material elements of compensation that, during our fiscal year ended September 30, 2020, were paid to, awarded to, or earned by our “named executive officers,” who consist of our Chief Executive Officer, our Chief Financial Officer and our three other most highly compensated executive officers during our 2020 fiscal year. This includes:
| • | Chris Scherzinger, Chief Executive Officer; |
| • | William Horton, Chief Financial Officer; |
| • | Hans-Jürgen Herr, President, EMEA; |
| • | Troy Shay, President and Chief Commercial Officer; and |
| • | Michael Jacobs, Chief Supply Chain Officer. |
As noted above, this Compensation Discussion and Analysis section describes our historical executive compensation program for our named executive officers during our 2020 fiscal year. In connection with this offering, we intend to adopt compensation plans that are designed to comply with laws applicable to public companies and we expect that, after our initial public offering, our compensation committee will set policies that may be different from the policies that applied to our executive officers before our initial public offering, including complying with laws that are applicable to public companies.
Compensation Philosophy and Objectives
Our executive compensation program has been designed to motivate, reward, attract and retain high caliber management deemed essential to ensure, and capitalize on, our success. The program seeks to tightly align executive compensation with our short- and long-term business objectives, business strategy and company-wide financial performance. Our compensation program is designed to achieve the following objectives:
| • | Provide competitive and attractive pay plans that reflect the respective positions, duties and responsibilities of our executive officers; |
| • | Incentivize contributions to the continued growth and development of our business; |
| • | Reward the success, growth and performance of our entire business rather than individual segments; |
| • | Tie performance of segmented business together and encourage collaboration to enhance value of the full enterprise; and |
| • | Retain essential executive officers and compensate their short and long-term contributions. |
In connection with this offering, we intend to formalize our post-offering compensation philosophy and implement compensation arrangements that reflect that philosophy. We expect our compensation philosophy to reflect the following general principles:
| • | Attract and retain talent—The total compensation package is designed to attract, retain and motivate highly qualified executives capable of leading us to greater performance. Base salary and annual incentives provide a competitive annual total cash compensation opportunity in the short term and equity-based incentives provide a competitive opportunity over the long term. |
| • | Align with stockholder interests—The interests of executives should align with the interests of our stockholders by using performance measures that correlate well with the creation of stockholder value. Our short-term and long-term incentive plans are both designed to use performance measures that correlate well with stockholder value. |
174
Table of Contents
| • | Balance of timing—Compensation plan designs promote a balance between annual and long-term business results. While we believe the creation of stockholder value long term is extremely important, we also believe that the achievement of our annual goals is the best way to contribute to our sustainable, long-term success. |
Determination of Compensation
Historically, the compensation of our executive officers has been set by the compensation committee of our board of directors, in consultation with our Chief Executive Officer (other than with respect to his own compensation). In anticipation of becoming a public company, our board of directors will adopt a written charter for the compensation committee that establishes, among other things, the compensation committee’s purpose and its responsibilities with respect to executive compensation. The charter of the compensation committee will provide that the compensation committee shall, among other things, assist the board of directors in its oversight of executive compensation, management development and succession, director compensation and executive compensation disclosure.
In early 2021, we engaged (i) PricewaterhouseCoopers LLC as an outside consultant to advise on the design of our go-forward equity incentive programs and (ii) Frederic W. Cook & Co., Inc. as an outside consultant to advise the compensation committee with respect to go-forward executive compensation decisions.
Elements of Compensation
Historically, our executive compensation program has consisted of the following elements: base salary, annual cash incentive compensation, long-term incentive compensation, severance and other benefits potentially payable upon termination of employment or in connection with a change in control, health, welfare and retirement benefits and perquisites, each established as part of our program in order to achieve the compensation objective outlined below with respect to each element.
We do not currently have, and following this offering we do not expect to have, formal policies relating to the allocation of total compensation among the various elements of our compensation program.
175
Table of Contents
Base Salary
Historically, the base salaries of our named executive officers have been an important part of their total compensation package, and have been intended to reflect their respective positions, duties and responsibilities. Base salary is a visible and stable fixed component of our compensation program. Although we believe that a substantial portion of each executive officer’s total compensation should be “at risk,” we also recognize the importance of setting base salaries at levels that will attract, retain and motivate top talent. In setting annual base salary levels, we take into account competitive considerations, individual performance, time in position and internal pay equity. On a prospective basis, we intend to continue to evaluate the mix of base salary, short-term incentive compensation and long-term incentive compensation to appropriately align the interests of our named executive officers with those of our stockholders. As a cost saving measure in response to the COVID-19 pandemic, from May 1, 2020 to June 30, 2020, the base salaries of our named executive officers were temporarily reduced by 10%. As of the end of fiscal year 2020, our named executive officers were entitled to the following base salaries:
| Name |
2020 Base Salary ($) | |||
| Chris Scherzinger |
720,000 | |||
| William Horton |
462,000 | |||
| Hans-Jürgen Herr |
568,262 | (1) | ||
| Troy Shay |
472,000 | |||
| Michael Jacobs |
380,000 | (2) | ||
| (1) | Mr. Herr’s base salary is paid in Euros (“EUR”). For purposes of this table, his base salary has been converted from EUR to US Dollars (“USD”) by using the exchange rate of 1.1724, which was in effect as of September 30, 2020. |
| (2) | Mr. Jacobs’ base salary was increased to $425,000, effective as of October 1, 2020, in connection with his promotion to Chief Supply Chain Officer. |
Annual Cash Incentive Compensation
We consider annual cash incentive bonuses to be an important “at risk” component of our compensation program. Historically, including during our 2020 fiscal year, our named executive officers have been eligible for annual cash incentive bonuses equal to a percentage of base salary under our Annual Incentive Compensation Program (the “AICP”) based on the Company’s achievement of applicable performance goals. For our 2020 AICP, the performance goals and actual performance levels applicable to our named executive officers were as set forth below. As indicated, certain of the performance goals applicable to Mr. Herr were specific to the EMEA region given his role.
Applicable to Named Executive Officers Other Than Mr. Herr
| Metric(1) |
Weighting (%) |
Threshold (50% payout) ($)(2) |
Target (100% payout) ($) |
Maximum (200% payout) ($) |
Actual Performance ($) |
Score (%) |
||||||||||||||||||
| Global Net Sales ($ millions) |
40 | — | 1,329.2 | 1,382.4 | 1,535.5 | 200 | ||||||||||||||||||
| Global EBIT ($ millions)(3) |
40 | 149.6 | 166.3 | 182.9 | 211.6 | 200 | ||||||||||||||||||
| Global Average Inventory ($ millions)(4) |
20 | — | 277.3 | — | 258.3 | 100 | ||||||||||||||||||
176
Table of Contents
Applicable to Mr. Herr
| Metric(1) |
Weighting (%) |
Threshold (50% payout) ($)(2) |
Target (100% payout) ($) |
Maximum (200% payout) ($) |
Actual Performance ($) |
Score (%) |
||||||||||||||||||
| Global EBIT ($ millions)(3) |
20 | 149.6 | 166.3 | 182.9 | 211.6 | 200 | ||||||||||||||||||
| EMEA Net Sales ($ millions) |
40 | — | 479.2 | 498.3 | 548 | 200 | ||||||||||||||||||
| EMEA EBIT ($ millions)(3) |
20 | — | 114.2 | 125.6 | 139.7 | 200 | ||||||||||||||||||
| EMEA Average Inventory ($ millions)(4) |
20 | — | 125.1 | — | 114.9 | 100 | ||||||||||||||||||
| (1) | The performance goals and results presented herein differ from those presented in our audited financial statements due to adjustments to (i) eliminate foreign currency fluctuations by stating at constant currency and (ii) remove the amortization of intangible assets. |
| (2) | The overall bonus payout under the AICP is 50% of target if threshold performance with respect to Global EBIT is satisfied. |
| (3) | “EBIT” is defined as income from operations. |
| (4) | “Average Inventory” is defined as the average amount of inventory during a period of time. |
As a result of our strong performance, annual cash incentive bonuses for our named executive officers under the 2020 AICP were as follows:
| Name |
2020 Earned Base Salary ($)(1) |
2020 Target Annual Cash Incentive |
2020 Actual Annual Cash Incentive |
|||||||||||||||||
| % of Base Salary |
$ | % of Target |
$ | |||||||||||||||||
| Chris Scherzinger |
708,000 | 100 | 708,000 | 200 | % | 1,416,000 | ||||||||||||||
| William Horton |
455,050 | 100 | 455,050 | 200 | % | 910,100 | ||||||||||||||
| Hans-Jürgen Herr(2) |
568,262 | 100 | 568,262 | 200 | % | 1,136,524 | ||||||||||||||
| Troy Shay |
464,133 | 100 | 464,133 | 200 | % | 928,266 | ||||||||||||||
| Michael Jacobs |
373,560 | 60 | 224,136 | 200 | % | 448,272 | ||||||||||||||
| (1) | Amounts in this column reflect earned base salaries in 2020 after taking into account the temporary COVID-19 reduction described above (or, for Mr. Herr, his full base salary). Bonuses paid under the AICP are paid based on a percentage of earned base salary (or, for Mr. Herr, his full base salary). |
| (2) | Mr. Herr’s annual cash incentive bonus is paid in EUR. For purposes of this table, his annual cash incentive bonus has been converted from EUR to USD by using the exchange rate of 1.1724, which was in effect as of September 30, 2020. |
In addition to bonuses paid under the 2020 AICP, certain of our named executive officers received additional discretionary bonuses in respect of individual performance in 2020. These amounts are set forth in the Summary Compensation Table below.
Long-Term Incentive Compensation
We view long-term incentive compensation as a critical component of our balanced total compensation program. Long-term incentive compensation provides an incentive to our employees to contribute to the long-term growth and development of our business. For us, this has historically taken the form of profits interest grants and/or phantom equity grants under our LTIP (as defined below). In connection with this offering, and as described below, we have adopted the Incentive Plan and the ESPP, under which our employees (including our named executive officers) may receive long-term incentive compensation in the future.
177
Table of Contents
Profits Units
Prior to 2021, four of our named executive officers were granted awards of profits interests (“Profits Units”) in Weber-Stephen Products LLC, which are held by them indirectly through Weber-Stephen Management Pool LLC. For Messrs. Scherzinger, Shay and Horton, these Profits Units were granted in 2018 in connection with the commencement of their employment. For Mr. Jacobs, these Profits Units (consisting of 2,150.5 Profits Units) were granted in 2020 in connection with his performance leading Operations and Supply Chain for the Company. The number of Profits Units awarded to a particular executive is designed to reflect a percentage of profit participation that we believe is appropriate in light of that person’s position, duties and responsibilities. The Profits Unit grants are generally one-time grants, though in 2021 Messrs. Horton and Jacobs each received a supplemental grant of 307.2 Profits Units in order to better align them with the rest of our executive team.
The Profits Units generally vest in three equal annual installments, in each case subject to the applicable holder’s continued employment through the applicable vesting date, provided that upon a termination for cause (as defined in the applicable award agreement) or a breach of restrictive covenants, all Profits Units held by the applicable holder (whether vested or unvested) will be forfeited (for more detail regarding the vesting terms applicable to the Profits Units, see the footnotes to the “Outstanding Equity Awards at Fiscal Year-End” table below). The Profits Units are eligible for accelerated vesting upon a sale transaction (as described in more detail in “Potential Payments Upon Termination or Change in Control” below).
The Profits Units are granted in three separate tranches, each of which is subject to a different distribution threshold. The tranches are subject to distribution thresholds that exceed the implied equity value of the Company at the time of grant, which were established in order to incentivize higher levels of performance (for more detail regarding the distribution thresholds applicable to the Profits Units, see the footnotes to the “Outstanding Equity Awards at Fiscal Year-End” table below).
In connection with this offering, all Profits Units will be restructured in the manner described under “Organizational Structure—The Reorganization Transactions.” Following this offering, we do not intend to grant additional Profits Units.
LTIP
As noted above, our named executive officers generally receive long-term incentive compensation in the form of Profits Units. However, due to Mr. Herr’s historical participation in the Amended and Restated Weber-Stephen Products LLC Management Incentive Compensation Plan (the “LTIP”), Mr. Herr instead participated in the LTIP in 2020. In addition, prior to Mr. Jacobs’ promotion to Chief Supply Chain Officer in 2020, he was granted awards under the LTIP.
The purpose of the LTIP is to enhance the Company’s performance through the efforts of certain key executives and management personnel by providing them with long-term incentive compensation opportunities based on the achievement of specific performance criteria, and which compensation opportunities are also tied to the value of the Company over time.
Under the LTIP, participants are eligible to receive an award each year based on the achievement of certain corporate performance goals (typically a combination of net sales, EBIT and/or cash flow goals) over a three-year performance period. A participant’s target award value under the LTIP is equal to his or her base salary multiplied by a multiplier, with a threshold award value and a maximum award value. At the beginning of the applicable performance period, a participant’s target award value is converted into a target number of “Unit Interests,” which are phantom equity interests
178
Table of Contents
that correspond to a common unit of Weber-Stephen Products LLC. The target number of Unit Interests that a participant receives is determined by dividing the participant’s target award value by three, and then dividing that value by the per Unit Interest value (which is determined in accordance with a formula set forth in the LTIP) as of the beginning of the applicable performance period.
The number of Unit Interests that a participant earns is determined based on performance during the applicable performance period. Earned Unit Interests are then cashed out on a future date (as described in more detail in “Nonqualified Deferred Compensation and Pension Benefits” below) based on the per Unit Interest value at that time. During the time that the earned Unit Interests are held, the holder is entitled to cash payments per Unit Interest equal to any cash distributions received by holders of common units of Weber-Stephen Products LLC.
In connection with this offering, all awards under the LTIP will be restructured to settle in stock of Weber Inc. under the Incentive Plan (described below) rather than being cashed out (such restructured awards, the “LTIP Replacement Awards”). Following this offering, we do not intend to grant additional awards under the LTIP.
For awards made to Messrs. Herr and Jacobs under the LTIP in respect of the performance period beginning on October 1, 2017 and ending on September 30, 2020 (the “2018 LTIP Awards”), the performance goals and actual performance levels were as follows:
| Metric(1) |
Weighting (%) |
Threshold (50% payout) |
Target (100% payout) |
Maximum (250% payout) |
Actual Performance ($) |
Score (%) |
||||||||||||||||||
| Cumulative Net Sales ($ millions) |
20 | 4,218.6 | 4,687.3 | 6,093.5 | 4,161.4 | (2) | 90 | |||||||||||||||||
| Cumulative EBIT ($ millions)(3) |
40 | 667.5 | 741.7 | 964.2 | 506.1 | 0 | ||||||||||||||||||
| Cumulative Cash Flow ($ millions)(4) |
40 | 777.9 | 864.3 | 1,123.6 | 391.2 | 0 | ||||||||||||||||||
| (1) | The performance goals and results presented herein differ from those presented in our audited financial statements due to adjustments to (i) eliminate foreign currency fluctuations by stating at constant currency and (ii) remove the amortization of intangible assets. |
| (2) | Our compensation committee exercised discretion in allowing this performance metric to be deemed achieved a threshold. |
| (3) | “EBIT” is defined as income from operations, plus, to the extent deducted in the calculation of income from operations, amortization of intangible assets, adjusted for extraordinary items. |
| (4) | “Cash Flow” is defined as net cash provided by operating activities plus net cash used in investing activities, adjusted for extraordinary items. |
Based on performance, the target award values, the target number of Unit Interests and the earned number of Unit Interests for Messrs. Herr and Jacobs in respect of the 2018 LTIP Awards were as follows:
| Name |
Target Award Value ($) |
Target # of Unit Interests |
Earned # of Unit Interests |
|||||||||
| Hans-Jürgen Herr |
531,000 | 170 | 17 | |||||||||
| Michael Jacobs |
272,190 | 29 | 2.9 | |||||||||
For awards made to Messrs. Herr and Jacobs under the LTIP in respect of the performance period beginning on October 1, 2019 and ending on September 30, 2022, the target award values and the target number of Unit Interests are as set forth below, with threshold and maximum awards equal to 50% and 200% of the target number of Unit Interests, respectively.
179
Table of Contents
| Name |
Target Award Value ($) |
Target # of Unit Interests |
||||||
| Hans-Jürgen Herr |
813,960 | 178 | ||||||
| Michael Jacobs |
380,000 | 83 | ||||||
Omnibus Incentive Plan
In connection with this offering, we have adopted the Weber Inc. Omnibus Incentive Plan (the “Incentive Plan”). The Incentive Plan will provide for the grant of equity-based awards to our employees, consultants and non-employee directors. We intend to grant the Director IPO Awards (as described below) and the LTIP Replacement Awards (as described above) (collectively, the “IPO Grants”) under the Incentive Plan in connection with this offering.
Administration. The Incentive Plan will be administered by our compensation committee, unless another committee is designated by our board of directors (such administrator, the “Committee”). The Committee will have the authority to, among other actions, determine eligible participants, the types of awards to be granted, the number of shares covered by any awards, the terms and conditions of any awards (and to amend any terms and conditions) and the methods by which awards may be settled, exercised, cancelled, forfeited or suspended.
Shares Reserved; Adjustments. The maximum number of shares of our Class A common stock available for issuance under the Incentive Plan will not exceed in the aggregate 22,694,608 shares, subject to adjustment as described below. Any shares underlying substitute awards and shares remaining available for grant under a plan of an acquired company will not reduce the number of shares available under the Incentive Plan, and any shares underlying awards that are forfeited, cancelled, expired, terminated or are otherwise lapsed, in whole or in part, will become available for future grant under the Incentive Plan.
In the event of certain changes in our corporate structure, including any extraordinary dividend or other distribution, recapitalization, stock split, reorganization, merger, consolidation, spin-off, or other similar corporate transaction or event affecting our Class A common stock, or changes in applicable laws, regulations or accounting principles, the Committee will make appropriate adjustments to prevent undue enrichment or harm to the number and type of shares available for issuance, the number and type of shares subject to awards, and to the grant, purchase, exercise or hurdle price for any award.
Non-Employee Director Limits. Under the Incentive Plan, the maximum number of shares of our Class A common stock subject to an award granted during a single fiscal year to any non-employee director, taken together with any cash fees paid during the fiscal year, in respect of the director’s service as a member of our board of directors during such year, shall not exceed $750,000 in total value.
Stock Options. The Incentive Plan permits the grant of incentive stock options to employees and/or nonstatutory stock options to all eligible participants. The exercise price of stock options may not be less than the fair market value of our Class A common stock on the grant date. Each stock option agreement will set forth the vesting schedule of the options and the term of the options, which may not exceed 10 years. The Committee will determine the method of payment of the exercise price. To the extent a stock option is not previously exercised as to all of the shares of our Class A common stock subject thereto, and, if the fair market value of one share of our Class A common stock is greater than the exercise price then in effect, then the stock option shall be deemed automatically exercised immediately before its expiration.
Stock Appreciation Rights. The Incentive Plan permits the grant of stock appreciation rights, which entitle the holder to receive shares of our Class A common stock or cash having an aggregate
180
Table of Contents
value equal to the appreciation in the fair market value of our Class A common stock between the grant date and the exercise date, times the number of shares of our Class A common stock subject to the award. The exercise price of stock appreciation rights may not be less than the fair market value of our Class A common stock on the date of grant. To the extent a stock appreciation right is not previously exercised as to all of the shares of our Class A common stock subject thereto, and, if the fair market value of one share of our Class A common stock is greater than the exercise price then in effect, then the stock appreciation right shall be deemed automatically exercised immediately before its expiration.
Restricted Stock and Restricted Stock Units. The Incentive Plan permits the grant of restricted stock and restricted stock units. Restricted stock awards are grants of shares of our Class A common stock, subject to certain conditions and restrictions as specified in the applicable award agreement. Restricted stock units represent the right to receive shares of our Class A common stock (or a cash amount equal to the value of our Class A common stock) on future specified dates. The Committee will determine the form or forms in which payment of the amount owing upon settlement of a restricted stock unit may be made.
Performance Awards. The Incentive Plan permits the grant of performance awards which are payable upon the achievement of performance goals determined by the Committee. The Committee may, in its discretion, increase or reduce the amount of a settlement otherwise to be made in connection with a performance award.
Other Stock-Based Awards. The Incentive Plan permits the grant of other stock-based awards, the terms and conditions of which will be determined by the Committee and specified in the applicable award agreement.
Termination of Service. In the event of a participant’s termination of service, as defined in the Incentive Plan, the Committee may determine the extent to which an award may be exercised, settled, vested, paid or forfeited prior to the end of a performance period, or the vesting, exercise or settlement of such award.
Change in Control. In the event of a change in control, as defined in the Incentive Plan, the Committee may take certain actions with respect to outstanding awards, including the continuation or assumption of awards, substitution or replacement of awards by a successor entity, acceleration of vesting and lapse of restrictions, determination of the attainment of performance conditions for performance awards or cancellation of awards in consideration of a payment.
Dissolution or Liquidation. In the event of the dissolution or liquidation of our company, each award will be terminated immediately prior to the consummation of such action, unless otherwise determined by the Committee.
No Repricing. Except pursuant to an adjustment by the Committee permitted under the Incentive Plan, no action may directly or indirectly reduce the exercise or hurdle price of any award established at the time of grant without stockholder approval.
Plan Amendment or Termination. The Committee has the authority to amend, suspend, discontinue or terminate the Incentive Plan, provided that no such action may be taken without stockholder approval if the approval is necessary to comply with a tax or regulatory requirement or other applicable law for which the Committee deems it necessary or desirable to comply. No amendment may in general adversely and materially affect a participant’s rights under any award without such participant’s written consent.
Term of the Plan. No awards may be granted under the Incentive Plan after our board of directors terminates the plan, the maximum number of shares available for issuance has been issued or 10 years from the effective date, whichever is earlier.
181
Table of Contents
Employee Stock Purchase Plan
In connection with this offering, we have adopted the Weber Inc. Employee Stock Purchase Plan (the “ESPP”). The ESPP will provide our employees and employees of participating subsidiaries with an opportunity to acquire a proprietary interest in our company through the purchase of shares of our Class A common stock. Initially, the ESPP will not be intended to qualify as an “employee stock purchase plan” under Section 423 of the Code. From and after such date as the Committee, in its discretion, determines that the ESPP is able to satisfy the requirements under Section 423 of the Code and that it will operate the ESPP in accordance with such requirements, the ESPP will be intended to qualify as an “employee stock purchase plan” under Section 423 of the Code and the ESPP will be interpreted in a manner that is consistent with that intent.
Administration. The ESPP will be administered by the Committee, which will have the authority to take any actions necessary or desirable for the administration of the ESPP, including adopting sub-plans applicable to particular participating subsidiaries or locations, which sub-plans may be designed to be outside the scope of Section 423 of the Code, or special rules applicable to participants in particular participating subsidiaries or particular locations. The Committee may change the minimum amounts of compensation (as defined in the ESPP) for payroll deductions, the frequency with which a participant may elect to change his or her rate of payroll deductions, the dates by which a participant is required to submit an enrollment form and the effective date of a participant’s withdrawal from the ESPP due to a termination or transfer of employment or change in employment status.
Shares Reserved. The maximum number of shares of our Class A common stock available for issuance under the ESPP will not exceed in the aggregate 9,077,843 shares, subject to adjustment as described below.
Eligibility. Unless otherwise determined by the Committee in a manner that is consistent with Section 423 of the Code, any employee of ours or a participating subsidiary who is customarily employed for at least 20 hours per week and more than five months in any calendar year is eligible to participate in an offering period, subject to the requirements of Section 423 of the Code. An eligible employee will not be granted an option if such grant would result in the employee owning 5% or more of the total combined voting power or value of all classes of our and our subsidiaries’ stock or if such grant would permit the employee to purchase our and our subsidiaries’ stock at a rate that exceeds $25,000 of the fair market value of the stock for each calendar year in which such option is outstanding at any time.
Offering Periods. Unless otherwise determined by the Committee, each offering period under the ESPP will have a duration of twelve months commencing on January 1, and will be subdivided by six-month purchase periods commencing on January 1 and July 1, respectively. The initial offering period under the ESPP will commence on a date to be specified by the Committee following the completion of this offering.
Participation. Participation in the ESPP is voluntary. Eligible employees may elect to participate in the ESPP by completing an enrollment form and submitting it in accordance with the enrollment procedures established by the Committee, upon which the employee authorizes payroll deductions from his or her paycheck on each payroll date during the offering period in an amount equal to at least 1% of his or her compensation.
Participants may decrease (but not increase) their rate of payroll deductions only once during an offering period by submitting a new enrollment form which must be submitted at least fifteen (15) days before the purchase date (as defined in the ESPP). The deduction rate selected for an offering period will remain in effect for subsequent offering periods unless the participant (i) submits a new enrollment form authorizing a new rate of payroll deductions, (ii) withdraws from the ESPP or (iii) terminates employment or otherwise becomes ineligible to participate in the ESPP.
182
Table of Contents
Grant and Exercise of Options. Each participant will be granted, on the first trading day of each offering period, an option to purchase, on the last trading day of each purchase period, a number of shares of our Class A common stock determined by dividing the participant’s accumulated payroll deductions by the applicable purchase price. The purchase price for the option will be equal to the lesser of (i) 85% of the fair market value of a share on the first trading day of the offering period and (ii) 85% of the fair market value of a share on the applicable purchase date. A participant’s option will be exercised automatically on the applicable purchase date to purchase the maximum number of whole shares of our Class A common stock that can be purchased with the amounts in the participant’s notional account. The maximum number of shares of our Class A common stock that may be purchased by a participant during a single offering period may not exceed 2,500 shares.
Withdrawal. Participants may withdraw from an offering at any time prior to the last day of the offering period by submitting a revised enrollment form indicating his or her election to withdraw at least fifteen (15) days before the next purchase date. The accumulated payroll deductions held on behalf of the participant in his or her notional account will be paid to the participant promptly following receipt of the participant’s revised enrollment form indicating their election to withdraw, and the participant’s option will be automatically terminated.
Termination of Employment; Change in Employment Status; Transfer of Employment. On termination of a participant’s employment for any reason, or a change in the participant’s employment status following which the participant is no longer an eligible employee, the participant will be deemed to have withdrawn from the ESPP effective as of the date of such termination of employment or change in status, the accumulated payroll deductions remaining in the participant’s notional account will be returned to the participant, and the participant’s option will be automatically terminated.
Oversubscribed Offerings. If the Committee determines that, on a particular purchase date, the number of shares with respect to which options are to be exercised exceeds the number of shares available under the ESPP, the shares will be allocated pro rata in a uniform manner as practicable and as the Committee deems equitable.
Adjustments Upon Changes in Capitalization; Corporate Transactions. In the event of any dividend or other distribution, recapitalization, stock split, reorganization, merger, consolidation, spin-off, combination, repurchase, or exchange of shares or other securities of our company or other change in our company’s structure affecting our Class A common stock, then in order to prevent dilution or enlargement of the benefits intended to be made available under the ESPP, the Committee will make equitable adjustments to the number and class of shares that may be issued under the ESPP, the purchase price per share, and the number of shares covered by each outstanding option.
In the event of a corporate transaction (as defined in the ESPP), each outstanding option will be assumed (or an equivalent option substituted) by the successor corporation or a parent or subsidiary of such successor corporation. If the successor corporation refuses to assume or substitute such option, the offering period will be shortened by setting a new purchase date on which the offering period will end. The new purchase date for the offering period will occur before the date of the corporate transaction.
Dissolution or Liquidation. Unless otherwise determined by the Committee, in the event of a proposed dissolution or liquidation of our company, any offering period in progress will be shortened by setting a new purchase date and the offering period will end immediately prior to the proposed dissolution or liquidation. Participants will be provided with written notice of the new purchase date and that the participant’s option will be exercised automatically on such date, unless before such time, the participant has withdrawn from the offering.
183
Table of Contents
Amendment and Termination. The Committee may, in its sole discretion, amend, suspend or terminate the ESPP at any time and for any reason. The Committee may elect, upon termination of the ESPP, to terminate any outstanding offering period either immediately or once shares have been purchased on the next purchase date or permit the offering period to expire in accordance with its terms.
Other Benefits and Perquisites
We provide the following benefits to our executive officers on the same basis as other eligible employees:
| • | health, dental and vision insurance; |
| • | vacation, paid holidays and sick days; |
| • | life insurance; |
| • | short-term and long-term disability; and |
| • | a 401(k) plan with matching contributions. |
In addition, we provide the following supplemental benefits to our executive officers:
| • | an annual executive physical; |
| • | financial and tax planning services; and |
| • | supplemental life and disability insurance. |
We believe these benefits are generally consistent with those of companies with which we compete for executive talent.
Employment Arrangements and Severance
We are party to employment agreements or term sheets, as applicable, with each of our named executive officers, which were in effect in 2020 and provide for certain severance entitlements in connection with a qualifying termination of employment, including certain enhanced severance entitlements for Mr. Scherzinger upon a qualifying termination in connection with a change in control. We believe these severance entitlements are generally consistent with those of companies with which we compete for executive talent. In connection with this offering, each of our named executive officers (other than Mr. Herr) will enter into a new employment agreement.
In addition, we are party to a retention agreement with Mr. Herr that provides for the payment of certain retention bonuses subject to his continued employment through the applicable retention dates. This agreement was entered into in order to bring Mr. Herr’s compensation in line with our other named executive officers given that he was not granted Profits Units.
The terms of the employment agreements and term sheets with our named executive officers and the retention agreement with Mr. Herr are described in “Narrative Disclosure to Summary Compensation Table and Grants of Plan-Based Awards Table—Employment Arrangements” below.
Tax and Accounting Considerations
As a general matter, we review and consider the various tax and accounting implications of compensation programs we utilize.
184
Table of Contents
Section 162(m) of the Internal Revenue Code (“Section 162(m)”) generally disallows public companies a tax deduction for compensation in excess of $1,000,000 paid to their chief executive officer, their chief financial officer and the three other most highly compensated executive officers (excluding the chief executive officer or the chief financial officer) unless certain performance and other requirements are met. Section 162(m) applies to corporations with any class of common equity securities required to be registered under Section 12 of the Exchange Act. Because we do not currently have any publicly held common stock, Section 162(m)’s restrictions do not currently apply to us. While the Company may take account of the implications of Section 162(m) among all factors reviewed in making compensation decisions, the Company will not limit compensation to those levels or types of compensation that will be deductible if it determines that a certain level of compensation is consistent with its philosophy and is in our and the stockholders’ best interests. Accordingly, some portion of the compensation paid to a Company executive may not be tax deductible by us under Section 162(m).
Stockholder Say-on-Pay and Say-on Frequency Vote
Our stockholders will have their first opportunity to cast an advisory vote to approve our named executive officers’ compensation at our next annual meeting of stockholders and to determine the frequency of these advisory votes. In the future, we intend to consider the outcome of the say-on-pay and say-on-frequency votes when making compensation decisions regarding our named executive officers.
Mitigation of Risk
The Company has determined that any risks arising from its compensation programs and policies are not reasonably likely to have a material adverse effect on the Company. The Company’s compensation programs and policies mitigate risk by combining performance-based, long-term compensation elements with payouts that are highly correlated to the value delivered to stockholders. The combination of performance measures for annual cash incentive compensation and long-term incentive compensation programs, as well as the multi-year vesting schedules for equity awards, encourage employees to maintain both a short and a long-term view with respect to Company performance.
Governance Oriented Provisions
We do not currently have stock ownership guidelines, a recoupment policy, and/or anti-hedging/pledging policies, but we are considering, and may adopt, one or more of these policies following this offering.
185
Table of Contents
SUMMARY COMPENSATION TABLE
The following table sets forth information concerning the compensation paid to, granted to or earned by our named executive officers during our fiscal year ended September 30, 2020.
| Name and Principal Position |
Year | Salary ($) | Bonus ($) | Stock Awards ($)(1) |
Non-Equity Incentive Plan Compensation ($)(2) |
All Other Compensation ($)(3) |
Total ($) | |||||||||||||||||||||
| Chris Scherzinger Chief Executive Officer |
2020 | 708,000 | 35,000 | (4) | — | 1,416,000 | 26,825 | 2,185,825 | ||||||||||||||||||||
| William Horton Chief Financial Officer |
2020 | 455,050 | 21,000 | (4) | — | 910,100 | 19,274 | 1,405,424 | ||||||||||||||||||||
| Hans-Jürgen Herr(5) President, EMEA |
2020 | 558,790 | 1,219,296 | (6) | 294,882 | 1,136,524 | 26,208 | 3,235,700 | ||||||||||||||||||||
| Troy Shay President and Chief Commercial Officer |
2020 | 464,133 | 23,000 | (4) | — | 928,266 | 18,773 | 1,434,172 | ||||||||||||||||||||
| Michael Jacobs(7) Chief Supply Chain Officer |
2020 | 373,560 | 13,600 | (4) | 130,825 | 448,272 | 19,175 | 985,432 | ||||||||||||||||||||
| (1) | Amounts in this column reflect the grant date fair value, as computed in accordance with ASC Topic 718, of (i) for Mr. Herr, (x) an award granted under the LTIP (as described in more detail under “—Long-Term Incentive Compensation” above) in 2020 in respect of the performance period beginning on October 1, 2019 and ending on September 30, 2022, which had a grant date fair value of $271,320 based on target performance, which was the probable outcome of the performance conditions as of the grant date (and which, if earned at the maximum payout level, would have a grant date fair value of $542,640) and (y) the incremental value of the modification to Mr. Herr’s 2018 LTIP Award (as described in more detail under “—Long-Term Incentive Compensation” above) in 2020, which had a grant date fair value of $23,562 and (ii) for Mr. Jacobs, (x) an award granted under the LTIP in 2020 in respect of the performance period beginning on October 1, 2019 and ending on September 30, 2022, which had a grant date fair value of $126,667 based on target performance, which was the probable outcome of the performance conditions as of the grant date (and which, if earned at the maximum payout level, would have a grant date fair value of $253,333), (y) Profits Units in Weber-Stephen Products LLC (as described in more detail under “—Long-Term Incentive Compensation” above) granted in 2020, which had a grant date fair value of $0 and (z) the incremental value of the modification to Mr. Jacobs’ 2018 LTIP Award (as described in more detail under “—Long-Term Incentive Compensation” above) in 2020, which had a grant date fair value of $4,158. For a discussion of valuation assumptions used to determine the grant date fair value of the foregoing LTIP awards and Profits Units, see Notes 13 and 14 to our audited consolidated financial statements for the year ended September 30, 2020 included elsewhere in this prospectus. |
| (2) | Amounts in this column reflect cash bonuses paid under the AICP (as described in more detail under “—Annual Cash Incentive Compensation” above) in respect of 2020 performance. |
186
Table of Contents
| (3) | Amounts in this column reflect the following amounts: |
| Name |
401(k) Contribution ($)(a) |
Tax Preparation and Financial Planning ($)(b) |
Annual Physical ($)(c) |
Supplemental Life Insurance and Disability ($)(d) |
Automobile ($)(e) |
|||||||||||||||
| Chris Scherzinger |
8,550 | 7,337 | 4,945 | 5,993 | — | |||||||||||||||
| William Horton |
3,900 | 5,246 | 4,770 | 5,358 | — | |||||||||||||||
| Hans-Jürgen Herr |
— | — | — | 7,093 | 19,115 | |||||||||||||||
| Troy Shay |
7,074 | 3,786 | 4,470 | 3,443 | — | |||||||||||||||
| Michael Jacobs |
8,864 | 1,675 | 4,470 | 4,166 | — | |||||||||||||||
| (a) | 401(k) Contribution: Reflects employer contributions made under our 401(k) plan. |
| (b) | Tax Preparation and Financial Planning: Reflects the cost of tax preparation and financial planning services offered to certain of our named executive officers, which are reimbursed by the Company. |
| (c) | Annual Physical: Reflects the cost of an annual physical offered to certain of our named executive officers, which is reimbursed by the Company. |
| (d) | Supplemental Life Insurance and Disability: Reflects the cost of supplemental life insurance and, other than for Mr. Herr, disability benefits provided by the Company. |
| (e) | Automobile: Reflects the cost of an automobile provided to Mr. Herr. |
| (4) | This amount reflects a discretionary bonus earned in respect of individual performance in 2020. |
| (5) | Mr. Herr’s compensation was paid in EUR. For purposes of this table, amounts have been converted from EUR to USD by using the exchange rate of 1.1724, which was in effect as of September 30, 2020. |
| (6) | This amount reflects a retention bonus paid to Mr. Herr pursuant to a retention agreement with Mr. Herr (as described in more detail under “—Employment Arrangements” below). |
| (7) | Mr. Jacobs was promoted to Chief Supply Chain Officer on September 11, 2020. |
GRANTS OF PLAN-BASED AWARDS
The following table sets forth information with respect to plan-based awards granted to our named executive officers during our fiscal year ended September 30, 2020.
| Name |
Grant Date |
Estimated Future Payouts |
Estimated Future Payouts |
All Other Stock Awards: Number of Shares of Stock or Units (#) |
Grant Date Fair Value of Stock and Option Awards ($)(3) |
|||||||||||||||||||||||||||||||
| Threshold ($) |
Target ($) |
Maximum ($) |
Threshold (#) |
Target (#) |
Maximum (#) |
|||||||||||||||||||||||||||||||
| Chris Scherzinger |
— | 354,000 | 708,000 | 1,416,000 | — | — | — | — | — | |||||||||||||||||||||||||||
| William Horton |
— | 227,525 | 455,050 | 910,100 | — | — | — | — | — | |||||||||||||||||||||||||||
| Hans-Jürgen Herr(4) |
— | 284,131 | 568,262 | 1,136,524 | — | — | — | — | — | |||||||||||||||||||||||||||
| 2/21/2020 | — | — | — | 89 | 178 | 356 | — | 271,320 | ||||||||||||||||||||||||||||
| Troy Shay |
— | 232,067 | 464,133 | 928,266 | — | — | — | — | — | |||||||||||||||||||||||||||
| Michael Jacobs |
— | 112,068 | 224,136 | 448,272 | — | — | — | — | — | |||||||||||||||||||||||||||
| 2/21/2020 | — | — | — | 41.5 | 83 | 166 | — | 126,667 | ||||||||||||||||||||||||||||
| 9/15/2020 | — | — | — | — | — | — | 2,150.5 | (5) | 0 | |||||||||||||||||||||||||||
| (1) | Amounts in these columns reflect the threshold, target and maximum payouts under the AICP in respect of 2020 performance. Actual payouts under the AICP in respect of 2020 performance are set forth in the Summary Compensation Table above under the column “Non-Equity Incentive Plan Compensation.” |
| (2) | Amounts in this column reflect the threshold, target and maximum number of Unit Interests under the LTIP in respect of the performance period beginning on October 1, 2019 and ending on September 30, 2022. |
| (3) | Amounts in this column reflect the applicable grant date fair value (including, for the LTIP awards, based on target performance, which was the probable outcome of the performance conditions as of the grant date), as computed in accordance with ASC Topic 718. For a discussion of valuation assumptions used to determine the grant date fair value of |
187
Table of Contents
| the foregoing LTIP awards and Profits Units, see Notes 13 and 14 to our audited consolidated financial statements for the year ended September 30, 2020 included elsewhere in this prospectus. |
| (4) | Mr. Herr’s bonus under the AICP is paid in EUR. For purposes of this row, amounts have been converted from EUR to USD by using the exchange rate of 1.1724, which was in effect as of September 30, 2020. |
| (5) | This amount reflects Profits Units in Weber-Stephen Products LLC (as described in more detail under “—Long-Term Incentive Compensation” above) granted in 2020, which vest in three equal installments on September 15, 2021, September 15, 2022 and September 15, 2023, in each case subject to Mr. Jacobs’ continued employment through the applicable vesting date. These Profits Units are held by Mr. Jacobs indirectly through Weber-Stephen Management Pool LLC. |
Narrative Disclosure to Summary Compensation Table and Grants of Plan-Based Awards Table
Employment Arrangements
Chris Scherzinger
Mr. Scherzinger is party to an employment agreement with the Company, dated April 12, 2018 and amended on March 15, 2019 (the “Scherzinger Agreement”). The Scherzinger Agreement provides for (i) an initial base salary of $700,000 per year (which has since been increased to $745,000 per year), (ii) an annual target cash bonus opportunity equal to 100% of base salary and (iii) participation in our 401(k) plan, health, life, disability and other benefits, as well as a term life insurance policy with a death benefit of one-times his base salary.
For a description of the payments and benefits Mr. Scherzinger would be entitled to receive under the Scherzinger Agreement in connection with a qualifying termination of employment, see “Potential Payments Upon Termination or Change in Control” below.
William Horton
Mr. Horton is party to an employment term sheet with the Company, dated May 31, 2018 (the “Horton Term Sheet”). The Horton Term Sheet provides for (i) an initial base salary of $450,000 per year (which has since been increased to $475,860), (ii) an annual target cash bonus opportunity equal to 100% of base salary and (iii) participation in our 401(k) plan, health, life, disability and other benefits.
For a description of the payments and benefits Mr. Horton would be entitled to receive under the Horton Term Sheet in connection with a qualifying termination of employment, see “Potential Payments Upon Termination or Change in Control” below.
Hans-Jürgen Herr
Mr. Herr is party to an employment agreement with the Company, dated December 9, 2010 (the “Herr Agreement”). The Herr Agreement provides for (i) an initial base salary of 260,000 EUR (which has since been increased to 499,035 EUR), (ii) eligibility for an annual cash bonus (which currently has a target equal to 100% of base salary), (iii) a company car for business and personal use and (iv) a life insurance policy. The Herr Agreement requires twelve (12) months’ prior written notice by either party in order to terminate, unless Mr. Herr is terminated for cause (which is not specifically defined but does include, at a minimum, a breach of his obligations regarding confidentiality and scope of duties).
In addition, Mr. Herr is party to a retention bonus agreement with the Company, dated October 9, 2019, the (“Retention Agreement”). The Retention Agreement provides that Mr. Herr will be paid (i) an initial retention bonus of 1,040,000 EUR on September 30, 2020 (which has been paid to him), provided that if he resigns or is terminated for cause (as defined in the Retention Agreement) prior to September 30, 2021, he will be required to repay such retention bonus and (ii) a second retention bonus of 1,320,000 EUR on September 30, 2022 (subject to his continued employment through such date), provided that if he resigns for any reason or is terminated for cause prior to September 30, 2023, he will be required to repay such retention bonus.
188
Table of Contents
For a description of the payments and benefits Mr. Herr would be entitled to receive under the Herr Agreement and the Retention Agreement in connection with a qualifying termination of employment, see “Potential Payments Upon Termination or Change in Control” below.
Troy Shay
Mr. Shay is party to an employment term sheet with the Company, dated June 11, 2018 (the “Shay Term Sheet”). The Shay Term Sheet provides for (i) an initial base salary of $460,000 per year (which has since been increased to $486,000), (ii) an annual target cash bonus opportunity equal to 100% of base salary and (iii) participation in our 401(k) plan, health, life, disability and other benefits.
For a description of the payments and benefits Mr. Shay would be entitled to receive under the Shay Term Sheet in connection with a qualifying termination of employment, see “Potential Payments Upon Termination or Change in Control” below.
Michael Jacobs
Mr. Jacobs is party to an employment term sheet with the Company, dated January 18, 2019 and amended on September 11, 2020 (the “Jacobs Term Sheet”). The Jacobs Term Sheet provides for (i) an initial base salary of $425,000 per year, (ii) an annual target cash bonus opportunity equal to 75% of base salary and (iii) participation in our 401(k) plan, health, life, disability and other benefits.
For a description of the payments and benefits Mr. Jacobs would be entitled to receive under the Jacobs Term Sheet in connection with a qualifying termination of employment, see “Potential Payments Upon Termination or Change in Control” below.
New Employment Agreements in Connection With This Offering
In connection with this offering, each of our named executive officers (other than Mr. Herr) will enter into a new employment agreement (in each case, a “New Employment Agreement”) with terms and conditions that are substantially consistent with those set forth in such named executive officer’s existing employment agreement or term sheet, as applicable, except that, (i) for Mr. Scherzinger, his base salary will be $925,000 and (ii) severance protections for each of our named executive officers (other than Mr. Herr) will be amended, as further described under “Potential Payments Upon Termination or Change in Control” below.
Retirement Benefits
We maintain a tax-qualified defined contribution plan (the “401(k) Plan”) in which U.S.-based employees of the Company, including our U.S.-based named executive officers, are eligible to participate. Under the 401(k) Plan, participants may defer a portion of their annual compensation on a pre-tax basis. In addition, the Company may make discretionary employer contributions to the 401(k) Plan at the Company’s election. During our fiscal year ended September 30, 2020, all of our named executive officers other than Mr. Herr (who is based in Germany and is not eligible to participate in the 401(k) Plan) participated in the 401(k) Plan.
Restrictive Covenants
Messrs. Scherzinger, Horton, Shay and Jacobs are each subject to 12-month post-termination (or, in the case of Mr. Scherzinger, 24-month post-termination) non-competition restrictions, 12-month post-termination customer and employee non-solicitation restrictions, perpetual confidentiality
189
Table of Contents
restrictions and invention assignment restrictions. Mr. Herr, who is based in Germany, is subject to perpetual confidentiality restrictions, and non-competition restrictions that apply during the 12-month notice period in connection with a termination of his employment pursuant to the Herr Agreement.
OUTSTANDING EQUITY AWARDS AT FISCAL YEAR-END
The following table sets forth information concerning outstanding equity awards for our named executive officers as of the end of our fiscal year ended September 30, 2020.
| Name |
Number of Shares or Units of Stock That Have Not Vested (#) |
Market Value of Shares or Units of Stock That Have Not Vested ($)(1) |
Equity Incentive Plan Awards: Number of Unearned Shares, Units or Other Rights That Have Not Vested (#) |
Equity Incentive Plan Awards: Market or Payout Value of Unearned Shares, Units or Other Rights That Have Not Vested ($)(2) |
||||||||||||
| Chris Scherzinger |
12,323 | (3)(4) | 52,220,444 | — | — | |||||||||||
| William Horton |
4,005 | (5)(4) | 17,967,437 | — | — | |||||||||||
| Hans-Jürgen Herr |
— | — | 86 | (6) | 91,762 | |||||||||||
| — | — | 178 | (7) | 189,926 | ||||||||||||
| Troy Shay |
4,313 | (8)(4) | 18,312,319 | — | — | |||||||||||
| Michael Jacobs |
2,150.5 | (9)(4) | 9,640,792 | 38.5 | (6) | 41,080 | ||||||||||
| — | — | 83 | (7) | 88,561 | ||||||||||||
| (1) | There is no public market for the Profits Units. Therefore, amounts in this column are based on an initial public offering price of $16.00 per share (the midpoint of the estimated initial public offering price range set forth on the cover page of this prospectus). |
| (2) | Amounts in this column are based on the value of the applicable Unit Interests as of September 30, 2020, as determined in accordance with the methodology described under “—Long-Term Incentive Compensation.” |
| (3) | This amount reflects Profits Units in Weber-Stephen Products LLC, which vest in three equal installments on April 22, 2021, April 22, 2022 and April 21, 2023, in each case subject to Mr. Scherzinger’s continued employment through the applicable vesting date. The Profits Units are held by Mr. Scherzinger indirectly through Weber-Stephen Management Pool LLC. |
| (4) | One third of the Profits Units have a distribution threshold of $2,000,000,000, one third of the Profits Units have a distribution threshold of $2,500,000,000, and one third of the Profits Units have a distribution threshold of $3,000,000,000. In connection with this offering, these distribution thresholds will be unitized. In addition, in connection with this offering, the number of Profits Units and their related distribution thresholds will be adjusted to reflect (i) distributions and redemptions that have occurred prior to the date of this offering and (ii) actions being taken in connection with the Reorganization Transactions. |
| (5) | This amount reflects Profits Units in Weber-Stephen Products LLC, which vest in three equal installments on June 18, 2021, June 18, 2022 and June 18, 2023, in each case subject to Mr. Horton’s continued employment through the applicable vesting date. The Profits Units are held by Mr. Horton indirectly through Weber-Stephen Management Pool LLC. |
| (6) | This amount reflects the number of Unit Interests that would be earned under the LTIP in respect of the performance period beginning on October 1, 2018 and ending on September 30, 2021 assuming a threshold payout. |
| (7) | This amount reflects the number of Unit Interests that would be earned under the LTIP in respect of the performance period beginning on October 1, 2019 and ending on September 30, 2022 assuming a target payout. |
190
Table of Contents
| (8) | This amount reflects Profits Units in Weber-Stephen Products LLC, which vest in three equal installments on July 9, 2021, July 9, 2022 and July 9, 2023, in each case subject to Mr. Shay’s continued employment through the applicable vesting date. The Profits Units are held by Mr. Shay indirectly through Weber-Stephen Management Pool LLC. |
| (9) | This amount reflects Profits Units in Weber-Stephen Products LLC, which vest in three equal installments on September 15, 2021, September 15, 2022 and September 15, 2023, in each case subject to Mr. Jacobs’ continued employment through the applicable vesting date. The Profits Units are held by Mr. Jacobs indirectly through Weber-Stephen Management Pool LLC. |
OPTION EXERCISES AND STOCK VESTED
The following table sets forth information concerning stock options exercised and stock awards vested for our named executive officers during our fiscal year ended September 30, 2020.
| Stock Awards | ||||||||
| Name |
Number of Shares Acquired on Vesting (#) |
Value Realized on Vesting ($) |
||||||
| Hans-Jürgen Herr |
17 | (1) | 18,139 | (2) | ||||
| Michael Jacobs |
2.9 | (1) | 3,094 | (2) | ||||
| (1) | This amount reflects the number of Unit Interests (as described in more detail under “—Long-Term Incentive Compensation” above) earned on September 30, 2020 in respect of an award granted under the LTIP in respect of the performance period beginning on October 1, 2017 and ending on September 30, 2020 (the “2018 LTIP Award”). |
| (2) | This amount reflects the value of the Unit Interests earned in respect of the 2018 LTIP Award, with the value determined as of September 30, 2020 in accordance with the methodology described under “—Long-Term Incentive Compensation.” Pursuant to elections made by Messrs. Herr and Jacobs, (i) Mr. Herr’s Unit Interests will be cashed out on October 1, 2027 based on their value at that time and (ii) Mr. Jacobs’ Unit Interests will be cashed out in equal installments on September 30, 2022, September 30, 2023, September 30, 2024 and September 30, 2025, in each case based on their value at that time. As described under “—Long-Term Incentive Compensation”, in connection with this offering, these Unit Interests will be restructured to settle in our Class A common stock. |
NONQUALIFIED DEFERRED COMPENSATION AND PENSION BENEFITS
The following table contains information with respect to the participation of our named executive officers in the Company’s unfunded cash deferred compensation plans that provide for the deferral of compensation on a basis that is not tax-qualified, as of the end of our fiscal year ended September 30, 2020. None of our named executive officers received pension benefits during our fiscal year ended September 30, 2020.
| Name |
Executive Contributions in Last fiscal year ($)(1) |
Aggregate Earnings in Last fiscal year ($) |
Aggregate Withdrawals/ Distributions ($)(2) |
Aggregate Balance at Last FYE ($)(3) |
||||||||||||
| Hans-Jürgen Herr |
18,139 | — | 941,812 | 72,660 | ||||||||||||
| Michael Jacobs |
3,094 | — | 3,806 | 11,487 | ||||||||||||
191
Table of Contents
| (1) | As noted under “Option Exercises and Stock Vested,” amounts in this column reflect the value of the Unit Interests earned in respect of the 2018 LTIP Awards, with the value determined as of September 30, 2020 in accordance with the methodology described under “—Long-Term Incentive Compensation.” Pursuant to elections made by Messrs. Herr and Jacobs, (i) Mr. Herr’s Unit Interests will be cashed out on October 1, 2027 based on their value at that time and (ii) Mr. Jacobs’ Unit Interests will be cashed out in equal installments on September 30, 2022, September 30, 2023, September 30, 2024 and September 30, 2025, in each case based on their value at that time. As described under “—Long-Term Incentive Compensation”, in connection with this offering, these Unit Interests will be restructured to settle in our Class A common stock. |
| (2) | Amounts in this column reflect Unit Interests that were cashed out during 2020. |
| (3) | Amounts in this column reflect the value of outstanding earned Unit Interests as of September 30, 2020, as determined in accordance with the methodology described under “—Long-Term Incentive Compensation.” |
Narrative Description to Nonqualified Deferred Compensation and Pension Benefits Table
Unit Interests that are earned under the LTIP are cashed out, at the election of the holder, either (i) in four equal annual installments beginning on the second anniversary following the end of performance period in respect of which the Unit Interests were earned or (ii) in a lump sum on the tenth anniversary of the first day of the performance period in respect of which the Unit Interests were earned. Notwithstanding the foregoing, (i) upon a change of control (as defined in the LTIP), the Unit Interests will be cashed out within thirty days following such change in control, (ii) upon a termination due to death or disability, the Unit Interests will be cashed out on October 1 next following such death or disability, (iii) upon a termination for any other reason other than for cause (as defined in the applicable award agreement), the Unit Interests will be cashed out on the first anniversary following such termination and (iv) upon a termination for cause (or if the Company determines that the holder could have been terminated for cause) or the holder’s breach of any restrictive covenants, the Unit Interests will be forfeited.
POTENTIAL PAYMENTS UPON TERMINATION OR CHANGE IN CONTROL
The below table sets forth information regarding contractual payments that would be made to our named executive officers upon the occurrence of certain termination and/or change in control events. In estimating the value of such payments, the table assumes that the named executive officer’s employment was terminated (or, in Mr. Herr’s case, notice of termination was given) and/or the applicable change in control occurred, in each case on September 30, 2020.
| Triggering Event | ||||||||||||||||
| Name |
Termination Without Cause and/or Resignation For Good Reason ($)(1) |
Termination Without Cause and/or Resignation For Good Reason Following a Change in Control ($) |
Termination Due to Death or Disability ($) |
Change in Control ($) |
||||||||||||
| Chris Scherzinger |
2,160,000 | 1,615,000 | (2) | — | 52,220,444 | (3) | ||||||||||
| William Horton |
924,000 | — | — | 17,967,437 | (3) | |||||||||||
| Hans-Jürgen Herr |
1,649,600 | — | 773,784 | (4) | 373,450 | (5) | ||||||||||
| Troy Shay |
954,890 | — | — | 18,312,319 | (3) | |||||||||||
| Michael Jacobs |
618,890 | — | — | 9,722,951 | (5) | |||||||||||
192
Table of Contents
| (1) | Amounts in this column reflect the following amounts, which are payable upon a termination without cause or (other than for Mr. Herr) a resignation for good reason: |
Mr. Scherzinger: (i) $1,440,000 in salary continuation, payable over 24 months and (ii) $720,000, reflecting a target bonus for the year of termination.
Mr. Horton: (i) $462,000 in salary continuation, payable over 12 months and (ii) $462,000, reflecting a target bonus for the year of termination.
Mr. Herr: Two times base salary and bonus, calculated on the basis of the average of salary and bonus payments made to him in the last three calendar years prior to calendar year 2020. This amount is paid in EUR, and therefore this amount has been converted from EUR to USD by using the exchange rate of 1.1724, which was in effect as of September 30, 2020.
Mr. Shay: (i) $472,000 in salary continuation, payable over 12 months, (ii) $472,000, reflecting a target bonus for the year of termination and (iii) $10,890, reflecting the estimated subsidy associated with 12 months of continued health benefits at active employee rates.
Mr. Jacobs: (i) $380,000 in salary continuation, payable over 12 months, (ii) $228,000, reflecting a target bonus for the year of termination and (iii) $10,890, reflecting the estimated subsidy associated with 12 months of continued health benefits at active employee rates.
| (2) | This amount reflects the following amounts, which are payable upon a termination without cause or a resignation for good reason within 24 months following a change in control: (i) a lump sum amount of $1,440,000, which equals two years of base salary and (ii) $175,000, reflecting the annual bonus that Mr. Scherzinger earned in respect of 2019 performance. |
| (3) | This amount reflects the value of outstanding and unvested Profits Units held as of September 30, 2020 (the “Change in Control Profits Units Value”), which will become fully vested upon a sale transaction (as defined below), subject to continued employment through the date of such transaction. There is no public market for the Profits Units, and therefore this amount is based on an initial public offering price of $16.00 per share (the midpoint of the estimated initial public offering price range set forth on the cover page of this prospectus). |
| (4) | This amount reflects the pro-rated retention bonus that Mr. Herr (or his beneficiaries) would be entitled to upon a termination due to death or disability under the Retention Agreement. This amount would be paid in EUR, and therefore for purposes of this table, it has been converted from EUR to USD by using the exchange rate of 1.1724, which was in effect as of September 30, 2020. |
| (5) | This amount includes the following: |
Mr. Herr: (i) $183,524, which represents the value of the Unit Interests that would have been earned upon a change of control (as defined below) under the LTIP in respect of the performance period beginning on October 1, 2018 and ending on September 30, 2021 assuming target performance and (ii) $189,926, which represents the value of the Unit Interests that would have been earned upon a change of control under the LTIP in respect of the performance period beginning on October 1, 2019 and ending on September 30, 2022 assuming target performance, in each case as determined in accordance with the valuation methodology described under “—Long-Term Incentive Compensation.” Performance with respect to the foregoing Unit Interests was tracking at or below target as of September 30, 2020.
Mr. Jacobs: (i) $9,640,792 in respect of the Change in Control Profits Units Value and (ii) (x) $82,159, which represents the value of the Unit Interests that would have been earned upon a change of control under the LTIP in respect of the performance period beginning on October 1, 2018 and ending on September 30, 2021 assuming target performance and (y) $88,561, which represents the value of the Unit Interests that would have been earned upon a change of control under the LTIP in respect of the performance period beginning on October 1,
193
Table of Contents
2019 and ending on September 30, 2022 assuming target performance, in each case as determined in accordance with the valuation methodology described under “—Long-Term Incentive Compensation.” Performance with respect to the foregoing Unit Interests was tracking at or below target as of September 30, 2020.
Narrative Disclosure to the Potential Payments Upon Termination or Change in Control Table
Severance Benefits Under Employment Arrangements
Chris Scherzinger
Pursuant to the Scherzinger Agreement, if Mr. Scherzinger’s employment is terminated by the Company without cause or by Mr. Scherzinger for good reason (each as defined in the Scherzinger Agreement) (a “Non-CIC Termination”), Mr. Scherzinger will be entitled to receive, subject to his execution of a general release of claims, (i) 24 months of salary continuation and (ii) a lump sum pro rata target annual bonus for the year of termination. In addition, if Mr. Scherzinger’s employment is terminated by the Company without cause or by Mr. Scherzinger for good reason within 24 months following a change in control (as defined in below) (a “CIC Termination”), Mr. Scherzinger will be entitled to receive, subject to his execution of a general release of claims, (i) a lump sum payment equal to 24 months of base salary and (ii) an amount equal to the annual bonus that he earned for the year prior to the year of termination. A “change in control” is generally defined as (i) a merger or consolidation resulting in a change in control of more than 50% of the voting securities of Weber-Stephen Products LLC, (ii) a sale of all or substantially all of the assets of Weber-Stephen Products LLC, (iii) any person or group becoming beneficial owners of more than 50% of the voting securities of Weber-Stephen Products LLC or (iv) a change to a majority of the board of managers of Weber-Stephen Products LLC within a one-year period (to the extent not nominated by the existing board of managers).
Pursuant to Mr. Scherzinger’s New Employment Agreement (as defined above), Mr. Scherzinger’s severance protections will remain the same, except that (i) upon a Non-CIC Termination or a CIC Termination, Mr. Scherzinger will also receive 12 months of continued participation in the Company’s health plan at active employee rates, (ii) upon a CIC Termination, (x) rather than receiving an amount equal to the annual bonus that he earned for the year prior to the year of termination, Mr. Scherzinger will receive an amount equal to the greater of that amount and his target annual bonus and (y) Mr. Scherzinger will receive full vesting of any equity awards (including target vesting for any performance-based equity awards) and (iii) for purposes of a CIC Termination, a change in control will be as defined under the Incentive Plan.
Hans-Jürgen Herr
Pursuant to the Herr Agreement, if Mr. Herr’s employment is terminated by the Company without cause, Mr. Herr will be entitled to receive a lump sum payment equal to two times base salary and bonus, calculated on the basis of the average of salary and bonus payments made in the last three calendar years prior to the delivery of the notice of termination.
In addition, pursuant to the Retention Agreement, if Mr. Herr’s employment is terminated due to death or disability, he (or his beneficiaries) will be entitled to the second retention bonus of 1,320,000 EUR that is otherwise payable thereunder on September 30, 2022, pro-rated based on the number of days that he was employed during the period from September 1, 2019 through September 1, 2023.
William Horton, Troy Shay and Michael Jacobs
The Horton Term Sheet, the Shay Term Sheet and the Jacobs Term Sheet each provide that if the applicable named executive officer is terminated by the Company without cause or by the
194
Table of Contents
applicable named executive officer for good reason (each as defined in the applicable term sheet), then such named executive officer will be entitled to receive, subject to his execution of a general release of claims, (i) 12 months of salary continuation, (ii) a lump sum pro rata target annual bonus for the year of termination and (iii) other than for Mr. Horton, 12 months of continued participation in the Company’s health plan at active employee rates.
Pursuant to their New Employment Agreements, each of Messrs. Horton, Shay and Jacobs’ severance protections will be expanded to include CIC Termination (as defined above) severance protections substantially consistent with those applicable to Mr. Scherzinger, except that the base salary component will be equal to 12 months of base salary rather 24 months of base salary. Mr. Horton’s severance protections will be further amended to include, upon a Non-CIC Termination or a CIC Termination, 12 months of continued participation in the Company’s health plan at active employee rates.
Accelerated Vesting of Profits Units
Each of the Profits Unit agreements with our named executive officers provide that upon a sale transaction (as defined below), any outstanding and unvested Profits Units will become fully vested, subject to the applicable named executive officer’s continued employment through the date of such transaction. A “sale transaction” is generally defined as a transaction or series of related transactions that results in any person or group acquiring a 50% or greater equity percentage of Weber-Stephen Products LLC.
Accelerated Vesting of Unit Interests
Each of the LTIP award agreements with our named executive officers provide that upon a change of control (as defined below), any outstanding and unvested Unit Interests will vest as determined by the compensation committee of our board in its sole discretion based on performance through the date of the change of control. A “change of control” is generally defined as (i) a merger or consolidation resulting in a change of control of more than 50% of the voting securities of Weber-Stephen Products LLC, (ii) a sale of all or substantially all of the assets of Weber-Stephen Products LLC, (iii) any person or group becoming beneficial owners of more than 50% of the voting securities of Weber-Stephen Products LLC or (iv) a change to a majority of the board of managers of Weber-Stephen Products LLC within a one-year period (to the extent not nominated by the existing board of managers).
195
Table of Contents
DIRECTOR COMPENSATION
2020 Director Compensation
The table below sets forth information concerning the compensation earned by each of our non-employee board members and our Executive Chairman, James Stephen, during our fiscal year ended September 30, 2020. Compensation for our non-employee board members during our fiscal year ended September 30, 2020 consisted of (i) an annual cash retainer of $125,000, payable in quarterly installments and (ii) $1,500 for each compensation committee meeting or audit committee meeting, as applicable, attended by members of those committees. Mr. Stephen, who is an employee of the Company, was paid a salary and a bonus under the AICP in respect of his board service and general business leadership. Members of our board were also eligible for reimbursement for reasonable travel and other out-of-pocket expenses.
| Name |
Fees Earned or Paid in Cash ($) |
Non-Equity Incentive Plan Compensation ($) |
Total ($) |
|||||||||
| James Stephen |
628,500 | 683,338 | 1,311,838 | |||||||||
| Leonard Gryn |
128,000 | — | 128,000 | |||||||||
| Susan Congalton |
131,000 | — | 131,000 | |||||||||
| Michael Schoeb |
125,000 | — | 125,000 | |||||||||
| Martin McCourt |
128,000 | — | 128,000 | |||||||||
| Karel Czanderna |
131,000 | — | 131,000 | |||||||||
| Elliott Hill(1) |
15,625 | — | 15,625 | |||||||||
| (1) | Mr. Hill joined our board as a non-employee director in August 2020 and, as such, served in that capacity only for a portion of our fiscal year ended September 30, 2020. |
New Director Compensation Policy
In connection with this offering, our board of directors has approved the adoption of a non-employee director compensation policy pursuant to which each of our non-employee directors will be eligible to receive annual compensation for their service on our board of directors. The non-employee directors will be eligible to receive an annual cash retainer of $75,000, plus an additional annual cash retainer as follows: board chair: $50,000; audit committee chair: $25,000; audit committee member: $10,000; compensation committee chair: $15,000; and compensation committee member: $7,500.
The non-employee directors will also be eligible to receive the following equity-based compensation in the form of restricted stock units with respect to shares of our Class A common stock granted pursuant to the Incentive Plan:
| • | an initial grant made in connection with this offering with a value at grant of $125,000, vesting upon the earlier of (i) one year following the grant date and (ii) the time of our annual stockholder meeting that occurs during the 2022 fiscal year (collectively, the “Director IPO Awards”); and |
| • | an annual grant with a value at grant of $125,000, to be made on or about the date of our annual stockholder meeting, beginning with the annual meeting that occurs during the 2022 fiscal year, and vesting upon the earlier of (i) one year following the grant date and (ii) the subsequent annual meeting. |
196
Table of Contents
CERTAIN RELATIONSHIPS AND RELATED PARTY TRANSACTIONS
We describe below transactions and series of similar transactions, during our last three fiscal years or currently proposed, to which we were or will be a participant, in which:
| • | the amounts involved exceeded or will exceed (i) $120,000; and |
| • | any of our directors or executive officers (in each case, including their immediate family members) or beneficial holders of more than 5% of any class of our voting securities had or will have a direct or indirect material interest. |
Other than as described below, there have not been, nor are there any currently proposed, transactions or series of similar transactions meeting this criteria to which we have been or will be a participant other than compensation arrangements, which are described where required under “Executive compensation.”
Reorganization Agreement
In connection with the Reorganization Transactions, we have entered into a reorganization agreement and related agreements with Weber-Stephen Products LLC and each of the Pre-IPO LLC Members, which will effect the Reorganization Transactions.
The table below sets forth the consideration in LLC Units and Class B common stock to be received by our directors, officers and 5% equity holders in the Reorganization Transactions:
| Name |
Class B common stock and LLC Units to be issued in the Reorganization Transactions |
|||
| Directors and executive officers |
||||
| Chris M. Scherzinger |
— | |||
| Hans-Jürgen Herr |
— | |||
| William J. Horton |
— | |||
| Michael G. Jacobs |
— | |||
| Mary A. Sagripanti |
— | |||
| Troy J. Shay |
— | |||
| Kelly D. Rainko |
741,706 | |||
| Susan T. Congalton |
— | |||
| Elliott Hill |
— | |||
| Martin McCourt |
— | |||
| Melinda R. Rich |
— | |||
| James C. Stephen |
— | |||
| Magesvaran Suranjan |
— | |||
| 5% Beneficial Owners and WSP Management Pool, LLC |
||||
| Byron D. Trott |
12,281,255 | |||
| BDT Capital Partners, LLC |
136,010,194 | |||
| WSP Investment, LLC |
34,555,793 | |||
| MAD Private Family Trust Company |
11,278,285 | |||
| WSP Management Pool, LLC(1) |
7,472,882 | |||
| (1) | WSP Management Pool, LLC is an entity owned by members of our management and certain of our current and former directors. |
197
Table of Contents
Amended LLC Agreement
In connection with the Reorganization Transactions, Weber Inc., Weber HoldCo LLC and each of the Pre-IPO LLC Members will enter into the Amended LLC Agreement. Following the Reorganization Transactions, and in accordance with the terms of the Amended LLC Agreement, we will operate our business through Weber-Stephen Products LLC, a wholly owned subsidiary of Weber HoldCo LLC. Pursuant to the terms of the Amended LLC Agreement, so long as the Pre-IPO LLC Members continue to own any LLC Units or securities redeemable or exchangeable into shares of our Class A common stock, we will not, without the prior written consent of such holders, engage in any business activity other than the management and ownership of Weber HoldCo LLC or own any assets other than securities of Weber HoldCo LLC and/or any cash or other property or assets distributed by or otherwise received from Weber HoldCo LLC, unless we determine in good faith that such actions or ownership are in the best interest of Weber HoldCo LLC.
As the sole managing member of Weber HoldCo LLC, we will have control over all of the affairs and decision making of Weber-Stephen Products LLC. As such, through our officers and directors, we will be responsible for all operational and administrative decisions of Weber-Stephen Products LLC and the day-to-day management of Weber-Stephen Products LLC’s business. We will fund any dividends to our stockholders by causing Weber-Stephen Products LLC to make distributions to the Pre-IPO LLC Members and us via Weber HoldCo LLC, subject to the limitations imposed by our debt agreements. See “Dividend Policy.”
The holders of LLC Units will generally incur U.S. federal, state and local income taxes on their proportionate share of any net taxable income of Weber-Stephen Products LLC, via Weber HoldCo LLC. Net profits and net losses of Weber-Stephen Products LLC will generally be allocated to its members pro rata in accordance with the percentages of their respective ownership of LLC Units, though certain non-pro rata adjustments will be made to reflect tax depreciation, amortization and other allocations. The Amended LLC Agreement will provide for pro rata cash distributions to the holders of LLC Units for purposes of funding their tax obligations in respect of the taxable income of Weber-Stephen Products LLC that is allocated to them. Generally, these tax distributions will be computed based on Weber-Stephen Products LLC’s estimate of the net taxable income of Weber-Stephen Products LLC allocable to each holder of LLC Units multiplied by an assumed tax rate equal to the highest effective marginal combined U.S. federal, state and local income tax rate prescribed for an individual or corporate resident of Illinois (taking into account the non-deductibility of certain expenses and the character of our income).
Except as otherwise determined by us, if at any time we issue a share of our Class A common stock, the net proceeds received by us with respect to such share, if any, shall be concurrently invested in Weber HoldCo LLC and Weber HoldCo LLC shall issue to us one LLC Unit (unless such share was issued by us solely to fund the purchase of an LLC Unit from a holder of LLC Units (upon an election by us to exchange such LLC Unit in lieu of redemption following a redemption request by such holder of LLC Units in which case such net proceeds shall instead be transferred to the selling holder of LLC Units as consideration for such purchase, and Weber HoldCo LLC will not issue an additional LLC Unit to us)). Similarly, except as otherwise determined by us, (i) Weber HoldCo LLC will not issue any additional LLC Units to us unless we issue or sell an equal number of shares of our Class A common stock, and (ii) should Weber HoldCo LLC issue any additional LLC Units to the Pre-IPO LLC Members or any other person, we will issue an equal number of shares of our Class B common stock to such Pre-IPO LLC Members or any other person. Conversely, if at any time any shares of our Class A common stock are redeemed, purchased or otherwise acquired, Weber HoldCo LLC will redeem, purchase or otherwise acquire an equal number of LLC Units held by us, upon the same terms and for the same price per security, as the shares of our Class A common stock are redeemed, purchased or otherwise acquired. In addition, Weber HoldCo LLC will not effect any subdivision (by
198
Table of Contents
any unit split, unit distribution, reclassification, reorganization, recapitalization or otherwise) or combination (by reverse unit split, reclassification, reorganization, recapitalization or otherwise) of the LLC Units unless it is accompanied by substantively identical subdivision or combination, as applicable, of each class of our common stock, and we will not effect any subdivision or combination of any class of our common stock unless it is accompanied by a substantively identical subdivision or combination, as applicable, of the LLC Units.
Under the Amended LLC Agreement, the holders of LLC Units (other than us) will have the right, from and after the completion of this offering (subject to the terms of the Amended LLC Agreement), to require Weber HoldCo LLC to redeem all or a portion of their LLC Units for, at our election, newly issued shares of Class A common stock on a one-for-one basis or a cash payment equal to the volume weighted average market price of one share of our Class A common stock for each LLC Unit redeemed (subject to customary adjustments, including for stock splits, stock dividends and reclassifications). If we decide to make a cash payment, the holder of an LLC Unit has the option to rescind its redemption request within a specified time period. Upon the exercise of the redemption right, the redeeming member will surrender its LLC Units to Weber HoldCo LLC for cancellation. The Amended LLC Agreement requires that we contribute cash or shares of our Class A common stock to Weber HoldCo LLC in exchange for an amount of newly issued LLC Units in Weber HoldCo LLC that will be issued to us equal to the number of LLC Units redeemed from the holders of LLC Units. Weber HoldCo LLC will then distribute the cash or shares of our Class A common stock to such holder of an LLC Unit to complete the redemption. In the event of a redemption request by a holder of an LLC Unit, we may, at our option, effect a direct exchange of cash or Class A common stock for LLC Units in lieu of such a redemption. Whether by redemption or exchange, we are obligated to ensure that at all times the number of LLC Units that we or our wholly owned subsidiaries own equals the number of shares of Class A common stock issued by us (subject to certain exceptions for treasury shares and shares underlying certain convertible or exchangeable securities). Shares of Class B common stock will be cancelled on a one-for-one basis if we, following a redemption request of a holder of an LLC Unit, redeem or exchange LLC Units of such holder of an LLC Unit pursuant to the terms of the Amended LLC Agreement.
The Amended LLC Agreement provides that, in the event that a tender offer, share exchange offer, issuer bid, take-over bid, recapitalization or similar transaction with respect to our Class A common stock is proposed by us or our stockholders and approved by our board of directors or is otherwise consented to or approved by our board of directors, the holders of LLC Units will be permitted to participate in such offer by delivery of a notice of redemption or exchange that is effective immediately prior to the consummation of such offer. In the case of any such offer proposed by us, we are obligated to use our reasonable best efforts to enable and permit the holders of LLC Units to participate in such offer to the same extent or on an economically equivalent basis as the holders of shares of our Class A common stock without discrimination. In addition, we are obligated to use our reasonable best efforts to ensure that the holders of LLC Units may participate in each such offer without being required to redeem or exchange LLC Units.
Subject to certain exceptions, Weber HoldCo LLC will indemnify all of its members and their officers and other related parties, against all losses or expenses arising from claims or other legal proceedings in which such person (in its capacity as such) may be involved or become subject to in connection with Weber-Stephen Products LLC’s business or affairs or the Amended LLC Agreement or any related document.
Weber-Stephen Products LLC may be dissolved upon (i) the determination by us to dissolve Weber-Stephen Products LLC or (ii) any other event which would cause the dissolution of Weber-Stephen Products LLC under the Delaware Limited Liability Company Act, unless Weber-Stephen Products LLC is continued in accordance with the Delaware Limited Liability Company Act. Upon
199
Table of Contents
dissolution, Weber-Stephen Products LLC will be liquidated and the proceeds from any liquidation will be applied and distributed in the following manner: (a) first, to creditors (including creditors who are members or affiliates of members) in satisfaction of all of Weber-Stephen Products LLC’s liabilities (whether by payment or by making reasonable provision for payment of such liabilities, including the setting up of any reasonably necessary reserves) and (b) second, to the members in proportion to their vested LLC Units.
Tax Receivable Agreement
As described under “Organizational Structure,” Acquisitions by Weber Inc. of LLC Units from Pre-IPO LLC Members in connection with this offering and future taxable redemptions or exchanges by the Pre-IPO LLC Members of LLC Units and corresponding number of shares of Class B common stock for shares of our Class A common stock or cash, as well as other transactions described herein, are expected to result in tax basis adjustments to the assets of Weber-Stephen Products LLC to us and thus produce favorable tax attributes. These tax attributes would not be available to us in the absence of those transactions. The anticipated tax basis adjustments are expected to reduce the amount of tax that we would otherwise be required to pay in the future.
We intend to enter into the Tax Receivable Agreement with the Pre-IPO LLC Members that will provide for the payment by us to the Pre-IPO LLC Members of 85% of the amount of cash savings, if any, in U.S. federal, state and local income tax or franchise tax that we actually realize as a result of (i) Weber Inc.’s allocable share of certain existing tax basis in tangible and intangible assets related to certain transactions that resulted in a step-up in Weber HoldCo LLC’s tax basis, (ii) any increase in tax basis in Weber HoldCo LLC’s consolidated assets resulting from (a) acquisitions by Weber Inc. of LLC Units from the Pre-IPO LLC Members in connection with this offering, (b) the acquisition of LLC Units from the Pre-IPO LLC Members using the net proceeds from any future offering, (c) redemptions or exchanges by the Pre-IPO LLC Members of LLC Units and the corresponding number of shares of Class B common stock for shares of our Class A common stock or cash or (d) payments under the Tax Receivable Agreement, and (iii) tax benefits related to imputed interest resulting from payments made under the Tax Receivable Agreement.
We expect that, as a result of the existing tax basis and increases in the tax basis of the tangible and intangible assets of Weber HoldCo LLC attributable to the redeemed or exchanged LLC Units, the payments that we may make to the existing Pre-IPO LLC Members could be substantial. For example, if we acquired all of the LLC Units of the Pre-IPO LLC Members in taxable transactions as of this offering, based on an initial public offering price of $16.00 per share (the midpoint of the estimated initial public offering price range set forth on the cover page of this prospectus) and on certain assumptions, including that (i) there are no material changes in relevant tax law and (ii) we earn sufficient taxable income in each year to realize on a current basis all tax benefits that are subject to the Tax Receivable Agreement, we expect that the resulting reduction in tax payments for us, as determined for purposes of the Tax Receivable Agreement, would aggregate to approximately $1,404.2 million, substantially all of which would be realized over the next 15 years, and we would be required to pay the Pre-IPO LLC Members 85% of such amount, or $1,193.6 million, over the same period. The actual increases in tax basis with respect to future taxable redemptions, exchanges or purchases of LLC Units, as well as the amount and timing of any payments we are required to make under the Tax Receivable Agreement in respect of the acquisition of LLC Units from Pre-IPO LLC Members in connection with this offering or future taxable redemptions, exchanges or purchases of LLC Units, may differ materially from the amounts set forth above because the potential future reductions in our tax payments, as determined for purposes of the Tax Receivable Agreement, and the payments we will be required to make under the Tax Receivable Agreement, will each depend on a number of factors, including the market value of our Class A common stock at the time of redemption or exchange, the prevailing federal tax rates applicable to us over the life of the Tax Receivable
200
Table of Contents
Agreement (as well as the assumed combined state and local tax rate), the amount and timing of the taxable income that we generate in the future and the extent to which future redemptions, exchanges or purchases of LLC Units are taxable transactions.
Payments under the Tax Receivable Agreement are not conditioned on the Pre-IPO LLC Members’ continued ownership of us. There may be a material negative effect on our liquidity if, as described below, the payments under the Tax Receivable Agreement exceed the actual benefits we receive in respect of the tax attributes subject to the Tax Receivable Agreement and/or distributions to us by Weber HoldCo LLC are not sufficient to permit us to make payments under the Tax Receivable Agreement.
In addition, although we are not aware of any issue that would cause the IRS to challenge the existing tax basis, tax basis increases or other benefits arising under the Tax Receivable Agreement, the Pre-IPO LLC Members will not reimburse us for any payments previously made if such tax basis increases or other tax benefits are subsequently disallowed, except that any excess payments made to the Pre-IPO LLC Members will be netted against future payments otherwise to be made under the Tax Receivable Agreement, if any, after our determination of such excess. As a result, in such circumstances we could make payments to the Pre-IPO LLC Members under the Tax Receivable Agreement that are greater than our actual cash tax savings and may not be able to recoup those payments, which could negatively impact our liquidity.
In addition, the Tax Receivable Agreement provides that, upon certain mergers, asset sales or other forms of business combination or certain other changes of control, our or our successor’s obligations with respect to tax benefits would be based on certain assumptions, including that we or our successor would have sufficient taxable income to fully utilize the benefits arising from the increased tax deductions and tax basis and other benefits covered by the Tax Receivable Agreement. As a result, upon a change of control, we could be required to make payments under the Tax Receivable Agreement that are greater than or less than the specified percentage of our actual cash tax savings, which could negatively impact our liquidity.
This provision of the Tax Receivable Agreement may result in situations where the Pre-IPO LLC Members have interests that differ from or are in addition to those of our other stockholders. In addition, we could be required to make payments under the Tax Receivable Agreement that are substantial and in excess of our, or a potential acquirer’s, actual cash savings in income tax.
Finally, because we are a holding company with no operations of our own, our ability to make payments under the Tax Receivable Agreement is dependent on the ability of Weber-Stephen Products LLC to make distributions to us. To the extent that we are unable to make payments under the Tax Receivable Agreement for any reason, such payments will be deferred and will accrue interest until paid at a rate of LIBOR plus 400 basis points.
Our obligations under the Tax Receivable Agreement will also apply with respect to any person who is issued LLC Units in the future and who becomes a party to the Tax Receivable Agreement.
Registration Rights Agreement
Prior to the consummation of this offering, we will enter into a Registration Rights Agreement, or the Registration Rights Agreement, with the Pre-IPO LLC Members and the former Blocker equityholders.
At any time after expiration or waiver of the lock-up for this offering, subject to several exceptions, including underwriter cutbacks and our right to defer a demand registration under certain
201
Table of Contents
circumstances, the Pre-IPO LLC Members and Blocker equityholders may require that we register for public resale under the Securities Act all shares of common stock constituting registrable securities that they request be registered at any time following this offering so long as the securities requested to be registered in each registration statement have an aggregate estimated market value of least $25.0 million. If we become eligible to register the sale of our securities on Form S-3 under the Securities Act, which will not be until at least twelve months after the date of this prospectus, the Pre-IPO LLC Members have the right to require us to register the sale of the registrable securities held by them on Form S-3, subject to offering size and other restrictions. If we propose to register any of our securities under the Securities Act for our own account or the account of any other holder (excluding any registration related to an employee benefit plan or a corporate reorganization or other Rule 145 transaction), the Pre-IPO LLC Members are entitled to notice of such registration and to request that we include registrable securities for resale on such registration statement, and we are required, subject to certain exceptions, to include such registrable securities in such registration statement. We will undertake in the Registration Rights Agreement to use our reasonable best efforts to file a shelf registration statement on Form S-3 to permit the resale of the shares of Class A common stock held by the Pre-IPO LLC Members. The Registration Rights Agreement does not contemplate the payment of penalties or liquidated damages to the Pre-IPO LLC Members party thereto as a result of a failure to register, or delays with respect to the registration of, the registrable securities.
In connection with the transfer of their registrable securities, the parties to the Registration Rights Agreement may assign certain of their respective rights under the Registration Rights Agreement under certain circumstances. In connection with the registrations described above, we will indemnify any selling stockholders and we will bear all fees, costs and expenses (except underwriting discounts and spreads).
Stockholders Agreement
At the closing of this offering, we will enter into the Stockholders Agreement with each of the Pre-IPO LLC Members, which will provide that, for so long as the Substantial Ownership Requirement is met, approval by the Pre-IPO LLC Members will be required for certain corporate actions. These actions include: (1) change of control transactions, including mergers or amalgamations, consolidations or a sale of all or substantially all assets; (2) any dissolution, liquidation or reorganization, including filing for bankruptcy; and (3) any changes to the strategic direction or scope of our principal business or that of Weber HoldCo LLC. Furthermore, the Stockholders Agreement will provide that, until the Majority Ownership Requirement is no longer met, Pre-IPO LLC Members will be able to designate a majority of the nominees for election to our board of directors, including the nominee for election to serve as Chair of our board of directors. If Pre-IPO LLC Members beneficially own less than 50% of the aggregate number of outstanding shares of our common stock, such designation rights will be proportionately reduced—for example, if the size of our board of directors is nine members, Pre-IPO LLC Members may designate: four nominees, if they beneficially own between 40% and 50% of the aggregate number of outstanding shares of our common stock; three nominees, if they beneficially own between 30% and 40% of the aggregate number of outstanding shares of our common stock; two nominees, if they beneficially own between 20% and 30% of the aggregate number of outstanding shares of our common stock; and one nominee, if they beneficially own between 10% and 20% of the aggregate number of outstanding shares of our common stock.
Indemnification Agreements
We expect to enter into an indemnification agreement with each of our executive officers and directors that provides, in general, that we will indemnify them to the fullest extent permitted by law in connection with their service to us or on our behalf. See “Management—Indemnification of officers and directors.”
202
Table of Contents
Purchases of Ownership Interests from Existing Holders
The table below sets forth the number of LLC Units expected to be purchased from our directors, officers and 5% equity holders at a price equal to the initial public offering price of our Class A common stock minus underwriting discounts, using a portion of the proceeds of this offering
| Name |
Number of LLC Units |
|||
| Directors and executive officers |
||||
| Chris M. Scherzinger |
— | |||
| Hans-Jürgen Herr |
— | |||
| William J. Horton |
— | |||
| Michael G. Jacobs |
— | |||
| Mary A. Sagripanti |
— | |||
| Troy J. Shay |
— | |||
| Kelly D. Rainko |
99,648 | |||
| Susan T. Congalton |
— | |||
| Elliott Hill |
— | |||
| Martin McCourt |
— | |||
| Melinda R. Rich |
— | |||
| James C. Stephen |
— | |||
| Magesvaran Suranjan |
— | |||
| 5% Beneficial Owners and WSP Management Pool, LLC |
||||
| Byron D. Trott |
— | |||
| BDT Capital Partners, LLC |
18,272,972 | |||
| WSP Investment, LLC |
4,642,572 | |||
| MAD Private Family Trust Company |
3,165,225 | |||
| WSP Management Pool, LLC(1) |
269,075 | |||
| (1) | WSP Management Pool, LLC is an entity owned by members of our management and certain of our current and former directors. |
In April 2021, Weber-Stephen Products LLC entered into and consummated, using available cash and borrowings under our Secured Credit Facility, a series of equity repurchase agreements to repurchase common units of Weber-Stephen Products LLC from the Stephen family for $188,702,165. Weber-Stephen Products LLC also issued a special distribution to its equityholders in an aggregate amount of $261,297,835 using available cash and borrowings under our Secured Credit Facility.
Transactions with Related Parties
We lease certain manufacturing and office facilities in the United States from entities owned or controlled by the Stephen family, one of our principal equityholders, which amounted to rental expense of $953,000 for each of the fiscal years ended September 30, 2018, 2019 and 2020, operating lease assets of $0 and $4,111,000 at September 30, 2019 and 2020, respectively, and non-current operating lease liabilities of $0 and $4,139,000 at September 30, 2019 and 2020, respectively.
We have a royalty agreement with entities owned or controlled by the Stephen family in connection with the Weber Grill Restaurant chain, one of our principal equityholders for the use of our trademark. Royalty revenue under this agreement was $693,000, $699,000 and $386,000 for the fiscal years ended September 30, 2018, 2019 and 2020, respectively. We had a royalty receivable of $149,000 and $220,000 from this related party at September 30, 2019 and 2020, respectively.
In fiscal year 2019, we entered into a series of transactions with June, which resulted in prepaid royalties of $4,600,000 and $10,044,000 as of September 30, 2019, and 2020, respectively, and royalty expense of $0 and $1,291,000 for the fiscal years ended September 30, 2019 and 2020, respectively.
203
Table of Contents
We employ Robert Stephen, brother of James C. Stephen, one of our Directors, as Director of Engineering. He earned $284,312, $293,643 and $494,807 in total compensation for the fiscal years ended September 30, 2018, 2019 and 2020, respectively.
Transactions with Executive Officers and Directors
On April 23, 2018, we provided a loan of $4,600,000 to Chris Scherzinger, our Chief Executive Officer, to finance the purchase of equity interests in Weber-Stephen Products LLC. The loan was repaid in full on May 17, 2021.
On August 1, 2018, we provided a loan of $960,000 to William Horton, our Chief Financial Officer, to finance the purchase of equity interests in Weber-Stephen Products LLC. The loan was repaid in full on May 17, 2021.
On January 1, 2019, we provided a loan of $400,000 to Michael Jacobs, our Chief Supply Chain Officer, to finance the purchase of equity interests in Weber-Stephen Products LLC. The loan was repaid in full on May 17, 2021.
On October 1, 2020, we provided a loan of $450,000 to Michael Jacobs, our Chief Supply Chain Officer, to finance the purchase of equity interests in Weber-Stephen Products LLC. The loan was repaid in full on May 17, 2021.
On August 1, 2018, we provided a loan of $960,000 to Troy Shay, our President and Chief Commercial Officer, to finance the purchase of equity interests in Weber-Stephen Products LLC. The loan was repaid in full on May 17, 2021.
Related Party Transactions Policies and Procedures
Upon the consummation of this offering, we will adopt a written related person transaction policy, or the policy, which will set forth our policy with respect to the review, approval, ratification and disclosure of all related person transactions by our Audit Committee. In accordance with the policy, our Audit Committee will have overall responsibility for implementation of and compliance with the policy.
For purposes of the policy, a “related person transaction” is a transaction, arrangement or relationship (or any series of similar transactions, arrangements or relationships) in which we were, are or will be a participant and the amount involved exceeded, exceeds or will exceed the lesser of (i) $120,000 and (ii) 1% of the average of our total assets at year end for the last two completed fiscal years, and in which any related person (as defined in the policy) had, has or will have a direct or indirect material interest. A “related person transaction” does not include any employment relationship or transaction involving an executive officer and any related compensation resulting solely from that employment relationship that has been reviewed and approved by our board of directors.
The policy will require that notice of a proposed related person transaction be provided to our legal department prior to entry into such transaction. If our legal department determines that such transaction is a related person transaction, the proposed transaction will be submitted to our Audit Committee for consideration at its next meeting. Under the policy, our Audit Committee may approve only those related person transactions that are in, or not inconsistent with, our best interests. In the event that we become aware of a related person transaction that has not been previously reviewed, approved or ratified under the policy and that is ongoing or is completed, the transaction will be submitted to the Audit Committee so that it may determine whether to ratify, rescind or terminate the related person transaction.
204
Table of Contents
The policy will also provide that the Audit Committee review certain previously approved or ratified related person transactions that are ongoing to determine whether the related person transaction remains in our best interests and the best interests of our stockholders. Additionally, we will make periodic inquiries of directors and executive officers with respect to any potential related person transaction of which they may be a party or of which they may be aware.
205
Table of Contents
The following tables set forth information regarding the beneficial ownership of our common stock as of July 10, 2021 (i) as adjusted to give effect to the Reorganization Transactions, but prior to this offering, and (ii) as adjusted to give effect to the Reorganization Transactions, this offering and the purchase of LLC Units from certain Pre-IPO LLC Members as described in “Use of Proceeds” by:
| • | each person or group whom we know to own beneficially more than 5% of our common stock; |
| • | each of the directors and named executive officers individually; and |
| • | all directors and executive officers as a group. |
The numbers of shares of common stock beneficially owned, percentages of beneficial ownership and percentages of combined voting power before this offering that are set forth below are based on the number of shares of Class A common stock and Class B common stock to be issued and outstanding prior to this offering after giving effect to the Reorganization Transactions. See “Organizational Structure.” The numbers of shares of common stock beneficially owned, percentages of beneficial ownership and percentages of combined voting power after this offering that are set forth below are based on the number of shares of Class A common stock and Class B common stock to be issued and outstanding immediately after this offering.
In connection with this offering, we will issue to each Pre-IPO LLC Member one share of Class B common stock for each LLC Unit such Pre-IPO LLC Member beneficially owns immediately prior to the consummation of this offering. Shares of Class B common stock will be cancelled on a one-for-one basis if we, following a redemption request of a Pre-IPO LLC Member, redeem or exchange LLC Units of such Pre-IPO LLC Member pursuant to the terms of the Amended LLC Agreement. See “Certain Relationships and Related Party Transactions—Amended LLC Agreement.” As a result, the number of shares of Class B common stock listed in the tables below correlates to the number of LLC Units each Pre-IPO LLC Member will beneficially own immediately after this offering. The number of shares of Class A common stock listed in the tables below represents the Class A common stock that will be issued in connection with this offering.
In accordance with the rules of the SEC, beneficial ownership includes voting or investment power with respect to securities and includes the shares issuable pursuant to stock options that are exercisable within 60 days of July 10, 2021. The number of shares of Class A common stock outstanding after this offering includes 46,875,000 shares of common stock being offered for sale by us in this offering. Unless otherwise indicated, the address for each listed stockholder is: c/o 1415 S. Roselle Road, Palatine Illinois 33607. To our knowledge, except as indicated in the footnotes to this table and pursuant to applicable community property laws, the persons named in the table have sole voting and investment power with respect to all shares of common stock.
The following table assumes the underwriters’ option to purchase additional shares of Class A common stock is not exercised.
206
Table of Contents
| Class A common stock owned(1) | Class B common stock owned(2) | Combined voting power(3) |
||||||||||||||||||||||||||||||||||||||
| Before this offering |
After this offering |
Before this offering |
After this offering |
Before this offering |
After this offering |
|||||||||||||||||||||||||||||||||||
| Name of beneficial owner |
Number | Percentage | Number | Percentage | Number | Percentage | Number | Percentage | Percentage | Percentage | ||||||||||||||||||||||||||||||
| Directors and executive officers |
||||||||||||||||||||||||||||||||||||||||
| Chris M. Scherzinger(4) |
— | — | — | — | — | — | — | — | — | — | ||||||||||||||||||||||||||||||
| Hans-Jürgen Herr(4) |
— | — | — | — | — | — | — | — | — | — | ||||||||||||||||||||||||||||||
| William J. Horton(4) |
— | — | — | — | — | — | — | — | — | — | ||||||||||||||||||||||||||||||
| Michael G. Jacobs(4) |
— | — | — | — | — | — | — | — | — | — | ||||||||||||||||||||||||||||||
| Mary A. Sagripanti(4) |
— | — | — | — | — | — | — | — | — | — | ||||||||||||||||||||||||||||||
| Troy J. Shay(4) |
— | — | — | — | — | — | — | — | — | — | ||||||||||||||||||||||||||||||
| Kelly D. Rainko |
153,242 | * | 135,092 | * | 841,354 | * | 741,706 | * | * | * | ||||||||||||||||||||||||||||||
| Elliott Hill(4) |
— | — | — | — | — | — | — | — | — | — | ||||||||||||||||||||||||||||||
| Martin McCourt(4) |
— | — | — | — | — | — | — | — | — | — | ||||||||||||||||||||||||||||||
| Melinda R. Rich |
— | — | — | — | — | — | — | — | — | — | ||||||||||||||||||||||||||||||
| James C. Stephen |
— | — | — | — | — | — | — | — | — | — | ||||||||||||||||||||||||||||||
| 5% Beneficial Owners and WSP Management Pool, LLC |
||||||||||||||||||||||||||||||||||||||||
| Byron D. Trott(5) |
2,236,875 | 6.9 | % | 2,236,875 | 3.0 | % | 12,281,255 | 5.2 | % | 12,281,255 | 5.9 | % | 5.4 | % | 5.1 | % | ||||||||||||||||||||||||
| BDT Capital Partners, LLC(6) |
25,811,687 | 79.8 | % | 22,754,605 | 30.2 | % | 154,283,166 | 65.1 | % | 136,010,194 | 64.9 | % | 66.9 | % | 55.7 | % | ||||||||||||||||||||||||
| WSP Investment, LLC(7) |
— | — | — | — | 39,198,365 | 16.5 | % | 34,555,793 | 16.5 | % | 14.6 | % | 12.1 | % | ||||||||||||||||||||||||||
| MAD Private Family Trust Company(8) |
2,630,703 | 8.1 | % | 2,054,197 | 2.7 | % | 14,443,510 | 6.1 | % | 11,278,285 | 5.4 | % | 6.3 | % | 4.7 | % | ||||||||||||||||||||||||
| WSP Management Pool, LLC(9) |
— | — | — | — | 7,741,957 | 3.3 | % | 7,472,882 | 3.6 | % | 2.9 | % | 2.6 | % | ||||||||||||||||||||||||||
The following table assumes the underwriters’ option to purchase additional shares of Class A common stock is exercised in full.
| Class A common stock owned(1) | Class B common stock owned(2) | Combined voting power(3) |
||||||||||||||||||||||||||||||||||||||
| Before this offering |
After this offering |
Before this offering |
After this offering |
Before this offering |
After this offering |
|||||||||||||||||||||||||||||||||||
| Name of beneficial owner |
Number | Percentage | Number | Percentage | Number | Percentage | Number | Percentage | Percentage | Percentage | ||||||||||||||||||||||||||||||
| Directors and executive officers |
||||||||||||||||||||||||||||||||||||||||
| Chris M. Scherzinger(4) |
— | — | — | — | — | — | — | — | — | — | ||||||||||||||||||||||||||||||
| Hans-Jürgen Herr(4) |
— | — | — | — | — | — | — | — | — | — | ||||||||||||||||||||||||||||||
| William J. Horton(4) |
— | — | — | — | — | — | — | — | — | — | ||||||||||||||||||||||||||||||
| Michael G. Jacobs(4) |
— | — | — | — | — | — | — | — | — | — | ||||||||||||||||||||||||||||||
| Mary A. Sagripanti(4) |
— | — | — | — | — | — | — | — | — | — | ||||||||||||||||||||||||||||||
| Troy J. Shay(4) |
— | — | — | — | — | — | — | — | — | — | ||||||||||||||||||||||||||||||
| Kelly D. Rainko |
153,242 | * | 131,008 | * | 841,354 | * | 719,285 | * | * | * | ||||||||||||||||||||||||||||||
| Elliott Hill(4) |
— | — | — | — | — | — | — | — | — | — | ||||||||||||||||||||||||||||||
| Martin McCourt(4) |
— | — | — | — | — | — | — | — | — | — | ||||||||||||||||||||||||||||||
| Melinda R. Rich |
— | — | — | — | — | — | — | — | — | — | ||||||||||||||||||||||||||||||
| James C. Stephen |
— | — | — | — | — | — | — | — | — | — | ||||||||||||||||||||||||||||||
| 5% Beneficial Owners and WSP Management Pool, LLC |
||||||||||||||||||||||||||||||||||||||||
| Byron D. Trott(5) |
2,236,875 | 6.9 | % | 2,177,266 | 2.7 | % | 12,281,255 | 5.2 | % | 11,953,978 | 5.9 | % | 5.4 | % | 5.0 | % | ||||||||||||||||||||||||
| BDT Capital Partners, LLC(6) |
25,811,687 | 79.8 | % | 22,066,762 | 27.1 | % | 154,283,166 | 65.1 | % | 131,898,775 | 64.8 | % | 66.9 | % | 54.0 | % | ||||||||||||||||||||||||
| WSP Investment, LLC(7) |
— | — | — | — | 39,198,365 | 16.5 | % | 33,511,214 | 16.5 | % | 14.6 | % | 11.8 | % | ||||||||||||||||||||||||||
| MAD Private Family Trust Company(8) |
2,630,703 | 8.1 | % | 1,984,093 | 2.4 | % | 14,443,510 | 6.1 | % | 10,893,387 | 5.4 | % | 6.3 | % | 4.5 | % | ||||||||||||||||||||||||
| WSP Management Pool, LLC(9) |
— | — | — | — | 7,741,957 | 3.3 | % | 7,412,340 | 3.6 | % | 2.9 | % | 2.6 | % | ||||||||||||||||||||||||||
207
Table of Contents
| * | Less than 1% |
| (1) | On a fully exchanged and converted basis. Subject to the terms of the Amended LLC Agreement, LLC Units are redeemable or exchangeable for shares of our Class A common stock on a one-for-one basis. Shares of Class B common stock will be cancelled on a one-for-one basis if we redeem or exchange LLC Units pursuant to the terms of the Amended LLC Agreement. Beneficial ownership of shares of our Class A common stock reflected in this table does not include beneficial ownership of shares of our Class A common stock for which such LLC Units may be redeemed or exchanged. |
| (2) | On a fully exchanged and converted basis. The Pre-IPO LLC Members hold all of the issued and outstanding shares of our Class B common stock. |
| (3) | Represents percentage of voting power of the Class A common stock and Class B common stock held by such persons voting together as a single class. Each holder of Class A common stock and Class B common stock is entitled to one vote per share on all matters submitted to our stockholders for a vote. See “Description of Capital Stock—Common stock.” |
| (4) | Excludes shares held indirectly through WSP Management Pool, LLC. |
| (5) | Represents shares owned by Byron D. Trott and his spouse Tina Trott. Mr. Trott’s address is c/o BDT Capital Partners, LLC, 401 North Michigan Avenue, Suite 3100, Chicago IL 60611. |
| (6) | Represents shares owned by funds managed by BDT Capital Partners, LLC (collectively, the “BDT Funds”). The managing member of BDT Capital Partners, LLC (“BDTCP”) is BDTP GP, LLC, of which Byron D.Trott is the sole member. Each of BDTP GP, LLC and Mr. Trott may be deemed to have indirect voting and investment control over the shares held by BDTCP. The address for BDTCP, BDTP GP, LLC, Mr. Trott and each BDT Fund is BDT Capital Partners, LLC, 401 North Michigan Avenue, Suite 3100, Chicago, IL 60611. |
| (7) | Voting and dispositive power over shares held by the WSP Investment, LLC is exercised by an investment committee consisting of three members. Each member has one vote, and the approval of a majority is required to approve an action. Under the so-called "rule of three" if voting and dispositive decisions regarding an entity’s securities are made by three or more individuals, and voting or dispositive decisions require the approval of a majority of those individuals, then none of the individuals is deemed a beneficial owner of the entity’s securities. The address of WSP Investment, LLC is 14 North Peoria Street, Suite 2E, Chicago, IL 60607. |
| (8) | Represents shares owned indirectly by certain trusts for the benefit of charity and members of Byron D. Trott’s family (the “MAD Family Trusts”) for which MAD Private Family Trust Company LLC holds voting and dispositive power. MAD Private Family Trust Company LLC exercises such voting and dispositive power through an investment committee consisting of three members. Each member has one vote, and the approval of a majority is required to approve an action. Under the so-called “rule of three,” if voting and dispositive decisions regarding an entity’s securities are made by three or more individuals, and voting or dispositive decisions require the approval of a majority of those individuals, then none of the individuals is deemed a beneficial owner of the entity’s securities. The address of MAD Private Family Trust Company LLC and each MAD Family Trust is 8805 Tamiami Trail N STE 356, Naples, FL 34108. |
| (9) | Represents shares owned by WSP Management Pool, LLC, an entity owned by members of our management and certain of our current and former directors. Voting and dispositive power over shares held WSP Management Pool, LLC is exercised by an investment committee consisting of Chris M. Scherzinger, Troy J. Shay and William J. Horton. Each member has one vote, and the approval of a majority is required to approve an action. Under the so-called “rule of three,” if voting and dispositive decisions regarding an entity’s securities are made by three or more individuals, and voting or dispositive decisions require the approval of a majority of those individuals, then none of the individuals is deemed a beneficial owner of the entity’s securities. The address of WSP Management Pool, LLC is 1415 S. Roselle Road, Palatine, IL 60067. Ownership of Management Pool LLC as of the closing of this offering is indicated in the following table: |
| WSP Management Pool, LLC Equityholder |
Percentage of ownership |
|||
| Chris M. Scherzinger |
3 | % | ||
| Hans-Jürgen Herr |
12 | % | ||
| William J. Horton |
— | |||
| Michael G. Jacobs |
— | |||
| Mary A. Sagripanti |
— | |||
| Troy J. Shay |
— | |||
| Elliott Hill |
1 | % | ||
| Martin McCourt |
1 | % | ||
208
Table of Contents
In connection with this offering, we will amend and restate our certificate of incorporation and our bylaws. The following is a description of the material terms of, and is qualified in its entirety by, our certificate of incorporation and bylaws, each of which will be in effect upon the consummation of this offering, the forms of which are filed as exhibits to the registration statement of which this prospectus forms a part. Under “Description of Capital Stock,” “we,” “us,” “our” and “our company” refer to Weber Inc.
Upon the consummation of this offering, our authorized capital stock will consist of 6,000,000,000 shares of capital stock, consisting of 3,000,000,000 shares of Class A common stock, par value $0.001 per share, 1,500,000,000 shares of Class B common stock, par value $0.00001 per share, and 1,500,000,000 shares of preferred stock. Unless our board of directors determines otherwise, we will issue all shares of our capital stock in uncertificated form.
Common Stock
Class A Common Stock
Holders of shares of our Class A common stock are entitled to one vote for each share held of record on all matters on which stockholders are entitled to vote generally, including the election or removal of directors. The holders of our Class A common stock do not have cumulative voting rights in the election of directors.
Holders of shares of our Class A common stock are entitled to receive dividends when and if declared by our board of directors out of funds legally available therefor, subject to any statutory or contractual restrictions on the payment of dividends and to any restrictions on the payment of dividends imposed by the terms of any outstanding preferred stock.
Upon our liquidation, dissolution or winding up and after payment in full of all amounts required to be paid to creditors and to the holders of preferred stock having liquidation preferences, if any, the holders of shares of our Class A common stock will be entitled to receive pro rata our remaining assets available for distribution.
All shares of our Class A common stock that will be outstanding at the time of the completion of the offering will be fully paid and non-assessable. The Class A common stock will not be subject to further calls or assessments by us. The rights powers and privileges of our Class A common stock will be subject to those of the holders of any shares of our preferred stock or any other series or class of stock we may authorize and issue in the future.
Class B Common Stock
Each share of Class B common stock will entitle its holder to one vote per share on all matters submitted to a vote of our stockholders. For purposes of calculating the Substantial Ownership Requirement and the Majority Ownership Requirement, shares of Class A common stock and Class B common stock held by any estate, trust, partnership or limited liability company or other similar entity of which any holder of LLC Units is a trustee, partner, member or similar party will be considered held by such holder of LLC Units. If at any time the ratio at which LLC Units are redeemable or exchangeable for shares of our Class A common stock changes from one-for-one as described under “Certain Relationships and Related Party Transactions—Amended LLC Agreement,” the number of votes to which Class B common stockholders are entitled will be adjusted accordingly. The holders of our Class B common stock do not have cumulative voting rights in the election of directors.
209
Table of Contents
Except for transfers to us pursuant to the Amended LLC Agreement or to certain permitted transferees, the holders of LLC Units are not permitted to sell, transfer or otherwise dispose of any LLC Units or shares of Class B common stock. Holders of shares of our Class B common stock will vote together with holders of our Class A common stock as a single class on all matters on which stockholders are entitled to vote generally, except as otherwise required by law.
Holders of our Class B common stock do not have any right to receive dividends or to receive a distribution upon a liquidation or winding up of Weber Inc.
Pursuant to the Stockholders Agreement, for so long as the Substantial Ownership Requirement is met the approval of the Pre-IPO LLC Members is required for certain corporate actions. These transactions include (1) change of control transactions, including mergers or amalgamations, consolidations or a sale of all or substantially all assets; (2) dissolution, liquidation or reorganization, including filing for bankruptcy; and (3) changes to the strategic direction or scope of our principal business or that of Weber HoldCo LLC. Furthermore, the Stockholders Agreement will provide that, until the Majority Ownership Requirement is no longer met, Pre-IPO LLC Members will be able to designate a majority of the nominees for election to our board of directors, including the nominee for election to serve as Chair of our board of directors. If Pre-IPO LLC Members beneficially own less than 50% of the aggregate number of outstanding shares of our common stock, such designation rights will be proportionately reduced—for example, if the size of our board of directors is nine members, Pre-IPO LLC Members may designate: four nominees, if they beneficially own between 40% and 50% of the aggregate number of outstanding shares of our common stock; three nominees, if they beneficially own between 30% and 40% of the aggregate number of outstanding shares of our common stock; two nominees, if they beneficially own between 20% and 30% of the aggregate number of outstanding shares of our common stock; and one nominee, if they beneficially own between 10% and 20% of the aggregate number of outstanding shares of our common stock.
Preferred Stock
No shares of preferred stock will be issued or outstanding immediately after the offering contemplated by this prospectus. Our certificate of incorporation authorizes our board of directors to establish one or more series of preferred stock (including convertible preferred stock). Unless required by law or any stock exchange, the authorized shares of preferred stock will be available for issuance without further action by holders of our common stock. Our board of directors is able to determine, with respect to any series of preferred stock, the powers (including voting powers), preferences and relative, participating, optional or other special rights, and the qualifications, limitations or restrictions thereof, including, without limitation:
| • | the designation of the series; |
| • | the number of shares of the series, which our board of directors may, except where otherwise provided in the preferred stock designation, increase (but not above the total number of authorized shares of the class) or decrease (but not below the number of shares then outstanding); |
| • | whether dividends, if any, will be cumulative or non-cumulative and the dividend rate of the series; |
| • | the dates at which dividends, if any, will be payable; |
| • | the redemption rights and price or prices, if any, for shares of the series; |
| • | the terms and amounts of any sinking fund provided for the purchase or redemption of shares of the series; |
210
Table of Contents
| • | the amounts payable on shares of the series in the event of any voluntary or involuntary liquidation, dissolution or winding-up of the affairs of our company; |
| • | whether the shares of the series will be convertible into shares of any other class or series, or any other security, of our company or any other entity, and, if so, the specification of the other class or series or other security, the conversion price or prices or rate or rates, any rate adjustments, the date or dates as of which the shares will be convertible and all other terms and conditions upon which the conversion may be made; |
| • | restrictions on the issuance of shares of the same series or of any other class or series; and |
| • | the voting rights, if any, of the holders of the series. |
We could issue a series of preferred stock that could, depending on the terms of the series, impede or discourage an acquisition attempt or other transaction that some, or a majority, of the holders of our common stock might believe to be in their best interests or in which the holders of our common stock might receive a premium over the market price of the shares of common stock. Additionally, the issuance of preferred stock may adversely affect the holders of our common stock by restricting dividends on the common stock, diluting the voting power of the common stock or subordinating the liquidation rights of the common stock. As a result of these or other factors, the issuance of preferred stock could have an adverse impact on the market price of our common stock.
Authorized but Unissued Capital Stock
Delaware law does not require stockholder approval for any issuance of authorized shares. However, the listing requirements of the NYSE, which would apply so long as the shares of Class A common stock remains listed on the NYSE, require stockholder approval of certain issuances equal to or exceeding 20% of the then outstanding voting power or the then-outstanding number of shares of Class A common stock (we believe the position of the NYSE is that the calculation in this latter case treats as outstanding shares of Class A common stock issuable upon redemption or exchange of outstanding LLC Units not held by Weber Inc.). These additional shares of Class A common stock may be used for a variety of corporate purposes, including future public offerings, to raise additional capital or to facilitate acquisitions.
Our board of directors may generally issue shares of one or more series of preferred stock on terms designed to discourage, delay or prevent a change of control of the Company or the removal of our management. Moreover, our authorized but unissued shares of preferred stock will be available for future issuances in one or more series without stockholder approval and could be utilized for a variety of corporate purposes, including future offerings to raise additional capital, to facilitate acquisitions and employee benefit plans.
One of the effects of the existence of unissued and unreserved common stock or preferred stock may be to enable our board of directors to issue shares to persons friendly to current management, which issuance could render more difficult or discourage an attempt to obtain control of our company by means of a merger, tender offer, proxy contest or otherwise, and thereby protect the continuity of our management and possibly deprive the stockholders of opportunities to sell their shares at prices higher than prevailing market prices.
Dividends
The DGCL permits a corporation to declare and pay dividends out of “surplus” or, if there is no “surplus,” out of its net profits for the fiscal year in which the dividend is declared and/or the preceding fiscal year. “Surplus” is defined as the excess of the net assets of the corporation over the amount
211
Table of Contents
determined to be the capital of the corporation by its board of directors. The capital of the corporation is typically calculated to be (and cannot be less than) the aggregate par value of all issued shares of capital stock. Net assets equals the fair value of the total assets minus total liabilities. The DGCL also provides that dividends may not be paid out of net profits if, after the payment of the dividend, remaining capital would be less than the capital represented by the outstanding stock of all classes having a preference upon the distribution of assets. Declaration and payment of any dividend will be subject to the discretion of our board of directors.
Stockholder Meetings
Our certificate of incorporation and our bylaws provide that annual stockholder meetings will be held at a date, time and place, if any, as exclusively selected by our board of directors. Our bylaws provide that special meetings of the stockholders may be called only by or at the direction of the board of directors, the Chair or Vice Chair of our board or the chief executive officer or, until the time that the Majority Ownership Requirement is no longer met, at the request of holders of a majority of the total voting power of our outstanding shares of common stock, voting together as a single class. To the extent permitted under applicable law, we may conduct meetings by remote communications, including by webcast.
Transferability, Redemption and Exchange
Upon the completion of this offering, there will be 284,946,464 LLC Units outstanding. There are no limitations in the Amended LLC Agreement on the number of LLC Units issuable in the future and we are not required to own a majority of LLC Units. Under the Amended LLC Agreement, the holders of LLC Units will have the right, from and after the completion of this offering (subject to the terms of the Amended LLC Agreement), to require Weber-Stephen Products LLC to redeem all or a portion of their LLC Units for, at our election, newly issued shares of Class A common stock on a one-for-one basis or a cash payment equal to the volume weighted average market price of one share of our Class A common stock for each LLC Unit redeemed (subject to customary adjustments, including for stock splits, stock dividends and reclassifications) in accordance with the terms of the Amended LLC Agreement. Additionally, in the event of a redemption request by a holder of LLC Units, we may, at our option, effect a direct exchange of cash or Class A common stock for LLC Units in lieu of such a redemption. Shares of Class B common stock will be cancelled on a one-for-one basis if we, following a redemption request of a holder of LLC Units, redeem or exchange LLC Units of such holder of LLC Units pursuant to the terms of the Amended LLC Agreement. See “Certain Relationships and Related Party Transactions—Amended LLC Agreement.”
Except for transfers to us pursuant to the Amended LLC Agreement or to certain permitted transferees, the holders of LLC Units are not permitted to sell, transfer or otherwise dispose of any LLC Units or shares of Class B common stock.
Other Provisions
Neither the Class A common stock nor the Class B common stock has any preemptive or other subscription rights.
There will be no redemption or sinking fund provisions applicable to the Class A common stock or Class B common stock. Further, our Stockholders Agreement will provide that, until the Substantial Ownership Requirement is no longer met, any redemption, repurchase or other acquisition of ownership interests (other than in connection with terms of equity compensation plans, subject to certain specified exceptions) must be approved by the Pre-IPO LLC Members.
212
Table of Contents
At such time when no LLC Units remain redeemable or exchangeable for shares of our Class A common stock, our Class B common stock will be cancelled.
Corporate Opportunity
Pursuant to our certificate of incorporation, we will waive, on behalf of ourselves and our subsidiaries, to the maximum extent permitted by law, the application of the doctrine of corporate opportunity or any other analogous doctrine, with respect to the Pre-IPO LLC Members and our directors who are not employed by us or our subsidiaries, and their respective affiliates. Our certificate of incorporation will provide that, to the fullest extent permitted by law, none of BDT Capital Partners, LLC or any of its affiliates or any director who is not employed by us (including any non-employee director who serves as one of our officers in both his director and officer capacities) or his or her affiliates will have any duty (i) to refrain from engaging in a corporate opportunity in the same or similar lines of business in which we or our affiliates now engage or propose to engage, (ii) present such opportunity to us before otherwise engaging in it or offering it to another entity, unless such opportunity was offered to any of our directors in his or her capacity as our director, or (iii) refrain otherwise competing, directly or indirectly, with us or our subsidiaries. See “Risk Factors—The doctrine of “corporate opportunity” will not apply with respect to the Pre-IPO LLC Members and our directors who are not employed by us or our subsidiaries, and their respective affiliates.”
Certain Certificate of Incorporation, Bylaws and Statutory Provisions
The provisions of our certificate of incorporation and bylaws and of the DGCL summarized below may have an anti-takeover effect and may delay, defer or prevent a tender offer or takeover attempt that you might consider in your best interest, including an attempt that might result in your receipt of a premium over the market price for your shares of Class A common stock.
Anti-Takeover Effects of Our Certificate of Incorporation, Stockholders Agreement and Bylaws
Our certificate of incorporation and bylaws will contain certain provisions that are intended to enhance the likelihood of continuity and stability in the composition of our board of directors and that may have the effect of delaying, deferring or preventing a future takeover or change in control of our company unless such takeover or change in control is approved by our board of directors. These provisions include:
No cumulative voting. Under Delaware law, the right to vote cumulatively does not exist unless the certificate of incorporation specifically authorizes cumulative voting. Our certificate of incorporation does not authorize cumulative voting. Therefore, stockholders holding a majority in voting power of the shares of our common stock entitled to vote generally in the election of directors will be able to elect all our directors.
Election and removal of directors. Our certificate of incorporation will provide that our board shall consist of not less than five nor more than 13 directors. Our certificate of incorporation will also provide that, subject to the rights granted to one or more series of preferred stock then outstanding, any vacancies on our board may be nominated by the Chair and will be filled only by the affirmative vote of a majority of the remaining directors, even if less than a quorum. The Stockholders Agreement will provide that, until the Majority Ownership Requirement is no longer met, the Pre-IPO LLC Members may designate a majority of the nominees for election to our board of directors, including the nominee for election to serve as Chair to our board of directors. If Pre-IPO LLC Members beneficially own less than 50% of the aggregate number of outstanding shares of our common stock, such designation rights will be proportionately reduced—for example, if the size of our board of directors is nine
213
Table of Contents
members, Pre-IPO LLC Members may designate: four nominees, if they beneficially own between 40% and 50% of the aggregate number of outstanding shares of our common stock; three nominees, if they beneficially own between 30% and 40% of the aggregate number of outstanding shares of our common stock; two nominees, if they beneficially own between 20% and 30% of the aggregate number of outstanding shares of our common stock; and one nominee, if they beneficially own between 10% and 20% of the aggregate number of outstanding shares of our common stock.
In addition, our certificate of incorporation will provide that our board of directors will be divided into three classes of directors, with each class as equal in number as possible, serving staggered three-year terms. Following the time when the Majority Ownership Requirement is no longer met, and subject to obtaining any required stockholder votes, directors may only be removed for cause and by the affirmative vote of holders of 75% of the total voting power of our outstanding shares of common stock, voting together as a single class. This requirement of a super-majority vote to remove directors for cause could enable a minority of our stockholders to exercise veto power over any such removal. Prior to such time, directors may be removed with or without cause by the affirmative vote of the holders of a majority of the total voting power of our outstanding shares of common stock.
Action by written consent; special meetings of stockholders. Our certificate of incorporation will provide that, following the time that the Majority Ownership Requirement is no longer met, stockholder action can be taken only at an annual or special meeting of stockholders and cannot be taken by written consent in lieu of a meeting. Our certificate of incorporation and bylaws will also provide that, subject to any special rights of the holders as required by law, special meetings of the stockholders can only be called by or at the direction of the board of directors, the Chair or Vice Chair of our board or the chief executive officer or, until the time that the Majority Ownership Requirement is no longer met, at the request of holders of a majority of the total voting power of our outstanding shares of common stock, voting together as a single class. Except as described above, stockholders are not permitted to call a special meeting or to require the board of directors to call a special meeting.
Advance notice procedures. Our bylaws will establish an advance notice procedure for stockholder proposals to be brought before an annual meeting of our stockholders, including proposed nominations of persons for election to the board of directors. Stockholders at an annual meeting will only be able to consider proposals or nominations specified in the notice of meeting or brought before the meeting by or at the direction of the board of directors or by a stockholder who was a stockholder of record on the record date for the meeting, who is entitled to vote at the meeting and who has given our Secretary timely written notice, in proper form, of the stockholder’s intention to bring that business before the meeting. Although the bylaws will not give our board of directors the power to approve or disapprove stockholder nominations of candidates or proposals regarding other business to be conducted at a special or annual meeting, the bylaws may have the effect of precluding the conduct of certain business at a meeting if the proper procedures are not followed or may discourage or deter a potential acquirer from conducting a solicitation of proxies to elect its own slate of directors or otherwise attempting to obtain control of our company.
Super-majority approval requirements. The DGCL generally provides that the affirmative vote of the holders of a majority of the total voting power of the shares entitled to vote on any matter is required to amend a corporation’s certificate of incorporation or bylaws, unless either a corporation’s certificate of incorporation or bylaws require a greater percentage. Our Stockholders Agreement will provide that, until the Substantial Ownership Requirement is no longer met, any amendment to our certificate of incorporation or bylaws must be approved by the Pre-IPO LLC Members. Our certificate of incorporation and bylaws will provide that, following the time that the Majority Ownership Requirement is no longer met, the affirmative vote of holders of 75% of the total voting power of our outstanding common stock eligible to vote in the election of directors, voting together as a single class, will be required to amend, alter, change or repeal specified provisions, including those relating to actions by
214
Table of Contents
written consent of stockholders, calling of special meetings of stockholders, election and removal of directors, business combinations and amendment of our certificate of incorporation and bylaws. This requirement of a super-majority vote to approve amendments to our certificate of incorporation and bylaws could enable a minority of our stockholders to exercise veto power over any such amendments.
Authorized but unissued shares. The authorized but unissued shares of common stock and preferred stock are available for future issuance without stockholder approval, subject to any limitations imposed by the listing rules of the NYSE. The existence of authorized but unissued and unreserved common stock and preferred stock could make more difficult or discourage an attempt to obtain control of us by means of a proxy contest, tender offer, merger or otherwise. See “—Preferred stock” and “—Authorized but unissued capital stock” above.
Business combinations with interested stockholders. In general, Section 203 of the DGCL prohibits a publicly held Delaware corporation from engaging in a business combination, such as a merger, with a person or group owning 15% or more of the corporation’s voting stock for a period of three years following the date the person became an interested stockholder, unless (with certain exceptions) the business combination or the transaction in which the person became an interested stockholder is approved in a prescribed manner. We have expressly elected not to be governed by the “business combination” provisions of Section 203 of the DGCL, until after the Majority Ownership Requirement is no longer met. At that time, such election shall be automatically withdrawn and we will thereafter be governed by the “business combination” provisions of Section 203 of the DGCL. Further, our Stockholders Agreement will provide that, until the Majority Ownership Requirement is no longer met, any business combination resulting in a merger, consolidation or sale of all, or substantially all, of our assets, and any acquisition or disposition of any asset or business having consideration in excess of % of our total assets, must be approved by the Pre-IPO LLC Members.
Exclusive Forum Provision. Our certificate of incorporation will require, to the fullest extent permitted by law, that (i) any derivative action or proceeding brought on our behalf, (ii) any action asserting a claim of breach of a fiduciary duty owed by any of our directors, officers or stockholders to us or our stockholders, (iii) any action asserting a claim against us arising pursuant to any provision of the DGCL or our certificate of incorporation or our bylaws or (iv) any action asserting a claim against us governed by the internal affairs doctrine will have to be brought in a state court located within the state of Delaware (or if no state court of the State of Delaware has jurisdiction, the federal district court for the District of Delaware), in all cases subject to the court’s having personal jurisdiction over the indispensable parties named as defendants. Additionally, our certificate of incorporation will state that the foregoing provision will not apply to claims arising under the Securities Act, the Exchange Act or other federal securities laws for which there is exclusive federal or concurrent federal and state jurisdiction. Unless we consent in writing to the selection of an alternative forum, the federal district courts of the United States of America shall be the exclusive forum for the resolution of any complaint asserting a cause of action arising under the Securities Act. The exclusive forum provisions may limit a stockholder’s ability to bring a claim in a judicial forum that it finds favorable for disputes with us or any of our directors, officers or stockholders, which may discourage lawsuits with respect to such claims.
Directors’ Liability; Indemnification of Directors and Officers
Our certificate of incorporation will limit the liability of our directors to the fullest extent permitted by the DCGL and provides that we will provide them with customary indemnification. We expect to enter into customary indemnification agreements with each of our executive officers and directors that provide them, in general, with customary indemnification in connection with their service to us or on our behalf.
215
Table of Contents
Transfer Agent and Registrar
The transfer agent and registrar for our Class A common stock will be American Stock Transfer and Trust Company, LLC.
Securities Exchange
We have applied to have our Class A common stock approved for listing on the NYSE under the symbol “WEBR.” Prior to this offering, there has been no public market for our common stock.
216
Table of Contents
MATERIAL U.S. FEDERAL TAX CONSIDERATIONS FOR NON-U.S. HOLDERS OF COMMON STOCK
The following is a general discussion of the material U.S. federal income and estate tax consequences of the purchase, ownership and disposition of shares of our Class A common stock by a “non-U.S. holder.” A “non-U.S. holder” is a beneficial owner of a share of our Class A common stock that is, for U.S. federal income tax purposes:
| • | a non-resident alien individual, other than a former citizen or resident of the United States subject to U.S. tax as an expatriate, |
| • | a foreign corporation, or |
| • | a foreign estate or trust. |
If a partnership or other pass-through entity (including an entity or arrangement treated as a partnership or other type of pass-through entity for U.S. federal income tax purposes) owns our Class A common stock, the tax treatment of a partner or beneficial owner of the entity may depend upon the status of the partner or beneficial owner, the activities of the entity and certain determinations made at the partner or beneficial owner level. Partners and beneficial owners in partnerships or other pass-through entities that own our Class A common stock should consult their own tax advisors as to the particular U.S. federal income and estate tax consequences applicable to them.
This discussion is based on the Code and administrative pronouncements, judicial decisions and final, temporary and proposed Treasury regulations, changes to any of which subsequent to the date of this prospectus may affect the tax consequences described herein (possibly with retroactive effect). This discussion does not address all aspects of U.S. federal income and estate taxation that may be relevant to non-U.S. holders in light of their particular circumstances and does not address any U.S. federal gift, alternative minimum tax or Medicare contribution tax considerations or any tax consequences arising under the laws of any state, local or foreign jurisdiction. Prospective holders are urged to consult their tax advisors with respect to the particular tax consequences to them of owning and disposing of our Class A common stock, including the consequences under the laws of any state, local or non-U.S. jurisdiction.
Dividends
To the extent that we make a distribution of cash or other property in respect of our Class A common stock, other than certain pro rata distributions of our Class A common stock, the distribution generally will be treated as a dividend for U.S. federal income tax purposes to the extent it is paid out of our current or accumulated earnings and profits (as determined under U.S. federal income tax principles). Any portion of a distribution that exceeds our current and accumulated earnings and profits generally will be treated first as a tax-free return of capital that reduces the adjusted tax basis of a non-U.S. holder’s Class A common stock, and to the extent the amount of the distribution exceeds a non-U.S. holder’s adjusted tax basis in our Class A common stock, the excess will be treated as gain from the disposition of our Class A common stock (the tax treatment of which is discussed below under “—Gain on disposition of Class A common stock”).
Dividends paid to a non-U.S. holder generally will be subject to U.S. federal withholding tax at a 30% rate, or a reduced rate specified by an applicable income tax treaty, subject to the discussion of FATCA (as defined below) withholding taxes below. In order to obtain a reduced rate of withholding under an applicable income tax treaty, a non-U.S. holder generally will be required to provide a properly executed IRS Form W-8BEN or IRS Form W-8BEN-E, as applicable, certifying its entitlement to benefits under the treaty.
217
Table of Contents
Dividends paid to a non-U.S. holder that are effectively connected with the non-U.S. holder’s conduct of a trade or business within the United States (and, if required by an applicable income tax treaty, are attributable to a permanent establishment or fixed base maintained by the non-U.S. holder in the United States) will not be subject to U.S. federal withholding tax if the non-U.S. holder provides a properly executed IRS Form W-8ECI. Instead, the effectively connected dividend income will generally be subject to regular U.S. income tax as if the non-U.S. holder were a United States person as defined under the Code. A non-U.S. holder that is treated as a corporation for U.S. federal income tax purposes receiving effectively connected dividend income may also be subject to an additional “branch profits tax” imposed at a rate of 30% (or a lower treaty rate) on its effectively connected earnings and profits (subject to certain adjustments).
A non-U.S. holder eligible for a reduced rate of U.S. federal withholding tax pursuant to an income tax treaty may obtain a refund of any excess amounts withheld by timely filing an appropriate claim for refund with the IRS.
Gain on disposition of Class A common stock
Subject to the discussions of backup withholding and FATCA withholding tax below, a non-U.S. holder generally will not be subject to U.S. federal income tax on gain realized on a sale or other disposition of Class A common stock unless:
| • | the gain is effectively connected with the conduct of a trade or business of the non-U.S. holder in the United States (and, if required by an applicable tax treaty, the gain is attributable to a permanent establishment or fixed base maintained by the non-U.S. holder in the United States), in which case the gain will be subject to U.S. federal income tax generally in the same manner as effectively connected dividend income as described above; |
| • | the non-U.S. holder is an individual present in the United States for 183 days or more in the taxable year of disposition and certain other conditions are met, in which case the gain (net of certain U.S.-source losses) generally will be subject to U.S. federal income tax at a rate of 30% (or a lower treaty rate); or |
| • | we are or have been a “United States real property holding corporation” (as described below) at any time within the five-year period preceding the disposition or the non-U.S. holder’s holding period, whichever period is shorter, and either (i) our Class A common stock is not regularly traded on an established securities market prior to the beginning of the calendar year in which the sale or disposition occurs or (ii) the non-U.S. holder has owned or is deemed to have owned, at any time within the five-year period preceding the disposition or the non-U.S. holder’s holding period, whichever period is shorter, more than 5% of our Class A common stock. |
We will be a United States real property holding corporation at any time that the fair market value of our “United States real property interests,” as defined in the Code and applicable Treasury regulations, equals or exceeds 50% of the aggregate fair market value of our worldwide real property interests and our other assets used or held for use in a trade or business (all as determined for U.S. federal income tax purposes). We believe that we are not, and do not anticipate becoming in the foreseeable future, a United States real property holding corporation.
Information reporting and backup withholding
Distributions paid to a non-U.S. holder and the amount of any tax withheld with respect to such distributions generally will be reported to the IRS. Copies of the information returns reporting such distributions and any withholding may also be made available to the tax authorities in the country in which the non-U.S. holder resides under the provisions of an applicable income tax treaty.
218
Table of Contents
A non-U.S. holder will not be subject to backup withholding on dividends received if such holder certifies under penalty of perjury that it is a non-U.S. holder (and the payor does not have actual knowledge or reason to know that such holder is a United States person as defined under the Code), or such holder otherwise establishes an exemption.
Information reporting and, depending on the circumstances, backup withholding will apply to the proceeds of a sale or other disposition of our Class A common stock made within the United States or conducted through certain U.S.-related financial intermediaries, unless the non-U.S. holder complies with certification procedures to establish that it is not a United States person in order to avoid information reporting and backup withholding. The certification procedures required to claim a reduced rate of withholding under a treaty will generally satisfy the certification requirements necessary to avoid backup withholding as well.
Backup withholding is not an additional tax and the amount of any backup withholding from a payment to a non-U.S. holder will be allowed as a credit against the non-U.S. holder’s U.S. federal income tax liability and may entitle the non-U.S. holder to a refund, provided that the required information is furnished to the IRS in a timely manner.
FATCA withholding tax
Under Sections 1471 through 1474 of the Code (such Sections commonly referred to as “FATCA”), payments of dividends on and the gross proceeds of dispositions of our Class A common stock paid to (i) a “foreign financial institution” (as specifically defined in the Code) or (ii) a “non-financial foreign entity” (as specifically defined in the Code) will be subject to a withholding tax (separate and apart from, but without duplication of, the withholding tax described above) at a rate of 30%, unless various U.S. information reporting and due diligence requirements (generally relating to ownership by United States persons of interests in or accounts with those entities) have been satisfied or an exemption from these rules applies. Under proposed Treasury regulations promulgated by the Treasury Department on December 13, 2018, which state that taxpayers may rely on the proposed Treasury regulations until final Treasury regulations are issued, this withholding tax will not apply to the gross proceeds from the sale or disposition of our Class A common stock. An intergovernmental agreement between the United States and an applicable foreign country may modify these requirements. If a dividend payment is both subject to withholding under FATCA and subject to the withholding tax discussed above under “—Dividends,” the withholding under FATCA may be credited against, and therefore reduce, such other withholding tax. Non-U.S. holders should consult their tax advisors regarding the possible implications of this withholding tax on their investment in our Class A common stock.
Federal estate tax
Individual non-U.S. holders (as specifically defined for U.S. federal estate tax purposes) and entities the property of which is potentially includible in such an individual’s gross estate for U.S. federal estate tax purposes (for example, a trust funded by such an individual and with respect to which the individual has retained certain interests or powers) should note that our Class A common stock will be treated as U.S. situs property subject to U.S. federal estate tax, unless an applicable estate tax treaty provides otherwise.
219
Table of Contents
SHARES ELIGIBLE FOR FUTURE SALE
Prior to this offering, there has been no public market for our Class A common stock. We cannot make any prediction as to the effect, if any, that sales of Class A common stock or the availability of Class A common stock for future sales will have on the market price of our Class A common stock. The market price of our Class A common stock could decline because of the sale of a large number of shares of our Class A common stock or the perception that such sales could occur in the future. These factors could also make it more difficult to raise funds through future offerings of Class A common stock. See “Risk Factors—Risks relating to ownership of our Class A common stock—If a substantial number of shares become available for sale and are sold in a short period of time, the market price of our Class A common stock could decline.”
Sale of Restricted Shares
Upon the consummation of this offering, we will have 75,373,197 shares of Class A common stock outstanding (or 81,542,982 shares if the underwriters exercise their option to purchase additional shares of Class A common stock in full). Of these shares, 46,875,000 shares sold in this offering (or 53,906,250 shares if the underwriters exercise their option to purchase additional shares of Class A common stock in full) will be freely tradable, without further restriction or registration under the Securities Act, except any shares held by our “affiliates,” as that term is defined in Rule 144 under the Securities Act. In the absence of registration under the Securities Act, shares held by affiliates may only be sold in compliance with the limitations of Rule 144 described below or another exemption from the registration requirements of the Securities Act. As defined in Rule 144, an affiliate of an issuer is a person that directly, or indirectly through one or more intermediaries, controls, is controlled by or is under common control with the issuer.
In addition, upon the consummation of the offering, the Pre-IPO LLC Members will own an aggregate of 209,573,267 LLC Units and all of the 209,573,267 shares of our Class B common stock. The Pre-IPO LLC Members, from time to time following the offering may require Weber HoldCo LLC to redeem or exchange all or a portion of their LLC Units for newly issued shares of Class A common stock on a one-for-one basis. Shares of our Class B common stock will be cancelled on a one-for-one basis if we, following a redemption request of a Pre-IPO LLC Member, redeem or exchange LLC Units of such Pre-IPO LLC Member pursuant to the terms of the Amended LLC Agreement. Shares of our Class A common stock issuable to the Pre-IPO LLC Members upon a redemption or exchange of LLC Units would be considered “restricted securities,” as that term is defined under Rule 144 and would also be subject to the “lock-up” period noted below.
Restricted securities may be sold in the public market only if they qualify for an exemption from registration under Rule 144 under the Securities Act, which is summarized below, or any other applicable exemption under the Securities Act, or pursuant to a registration statement that is effective under the Securities Act. Immediately following the consummation of this offering, the holders of approximately 209,573,267 shares of our Class B common stock (on an assumed as-exchanged basis) and holders of 28,498,197 shares of our Class A common stock issued in the Reorganization Transactions will be entitled to dispose of their shares following the expiration of an initial 180-day underwriter “lock-up” period subject to the volume and other restrictions of Rule 144. The representatives of the underwriters are entitled to waive these lock-up provisions at their discretion prior to the expiration dates of such lock-up agreements.
220
Table of Contents
Rule 144
In general, a person who has beneficially owned restricted shares of our common stock for at least six months would be entitled to sell such securities, provided that (i) such person is not deemed to have been one of our affiliates at the time of, or at any time during the 90 days preceding, the sale and (ii) we are subject to the Exchange Act periodic reporting requirements for at least 90 days before the sale. Persons who have beneficially owned restricted shares of our common stock for at least six months but who are our affiliates at the time of, or any time during the 90 days preceding, the sale, would be subject to additional restrictions, by which such person would be entitled to sell within any three-month period only a number of securities that does not exceed the greater of the following:
| • | 1% of the number of shares of our Class A common stock then outstanding, which will equal approximately 753,732 shares immediately after this offering (or approximately 815,430 shares if the underwriters exercise their purchase option in full); or |
| • | the average weekly trading volume of our common stock on the NYSE during the four calendar weeks preceding the filing of a notice on Form 144 with respect to the sale; |
provided, in each case, that we are subject to the Exchange Act periodic reporting requirements for at least 90 days before the sale. Such sales both by affiliates and by non-affiliates must also comply with the manner of sale and notice provisions of Rule 144 to the extent applicable.
Lock-up Agreements
Our executive officers, directors and significant stockholders have agreed that, for a period of 180 days from the date of this prospectus, they will not, without the prior written consent of the representatives of the underwriters, dispose of or hedge any shares of our common stock or any securities convertible into or exchangeable for our common stock (including LLC Units) subject to certain exceptions (including dispositions in connection with the Reorganization Transactions).
Immediately following the consummation of this offering, stockholders subject to lock-up agreements will hold 238,071,464 shares of our Class A common stock (assuming the Pre-IPO LLC Members redeem or exchange all their LLC Units for shares of our Class A common stock), representing approximately 84% of our then-outstanding shares of Class A common stock (or 231,040,214 shares of Class A common stock, representing approximately 81% of our then-outstanding shares of Class A common stock if the underwriters exercise their option to purchase additional shares of Class A common stock in full and giving effect to the use of the net proceeds therefrom).
We have agreed, subject to certain exceptions, not to issue, sell or otherwise dispose of any shares of our Class A common stock or any securities convertible into or exchangeable for our Class A common stock (including LLC Units) during the 180-day period following the date of this prospectus.
Registration Rights
Our Registration Rights Agreement grants registration rights to the Pre-IPO LLC members and Blocker equityholders. See “Certain Relationships and Related Party Transactions—Registration Rights Agreement.”
221
Table of Contents
We and the underwriters named below have entered into an underwriting agreement with respect to the shares of Class A common stock being offered. Subject to certain conditions, each underwriter has severally agreed to purchase the number of shares of Class A common stock indicated in the following table. Goldman Sachs & Co. LLC, BofA Securities, Inc. and J.P. Morgan Securities LLC are the representatives of the underwriters.
| Underwriters |
Number of Shares |
|||
| Goldman Sachs & Co. LLC |
||||
| BofA Securities, Inc. |
||||
| J.P. Morgan Securities LLC |
||||
| BMO Capital Markets Corp. |
||||
| Citigroup Global Markets Inc. |
||||
| UBS Securities LLC |
||||
| Wells Fargo Securities, LLC |
||||
| KeyBanc Capital Markets Inc. |
||||
| Academy Securities, Inc. |
||||
| Cabrera Capital Markets LLC |
||||
| Siebert Williams Shank & Co., LLC |
||||
| Telsey Advisory Group LLC |
||||
|
|
|
|||
| Total |
46,875,000 | |||
|
|
|
|||
The underwriters are committed to take and pay for all of the shares being offered, if any are taken, other than the shares covered by the option described below unless and until this option is exercised.
The underwriters have an option to buy up to an additional 7,031,250 shares of Class A common stock from us to cover sales by the underwriters of a greater number of shares than the total number set forth in the table above. They may exercise that option for 30 days. If any shares are purchased pursuant to this option, the underwriters will severally purchase shares in approximately the same proportion as set forth in the table above.
The following table shows the per share and total underwriting discounts and commissions to be paid to the underwriters by us. Such amounts are shown assuming both no exercise and full exercise of the underwriters’ option to purchase 7,031,250 additional shares of Class A common stock.
| No Exercise | Full Exercise | |||||||
| Per Share |
$ | $ | ||||||
| Total |
$ | $ | ||||||
Shares of Class A common stock sold by the underwriters to the public will initially be offered at the initial public offering price set forth on the cover of this prospectus. Any shares sold by the underwriters to securities dealers may be sold at a discount of up to $ per share from the initial public offering price. After the initial offering of the shares, the representatives may change the offering price and the other selling terms. The offering of the shares by the underwriters is subject to receipt and acceptance and subject to the underwriters’ right to reject any order in whole or in part.
Subject to certain exceptions described below, we and all of our officers, directors and holders of substantially all of the LLC Units will agree or have agreed with the underwriters, without the prior written consent of the representatives, for a period of 180 days after the date of this prospectus (the “Lock-Up Period”), not to (i) offer, sell, contract to sell, pledge, grant any option to purchase, make any
222
Table of Contents
short sale or otherwise transfer or dispose of, directly or indirectly, or file with the SEC a registration statement under the Securities Act relating to, any Class A common stock, or any options or warrants to purchase shares of Securities or any Class A common stock that are convertible into or exchangeable for, or that represent the right to receive, securities, or publicly disclose the intention to make any offer, sale, pledge, disposition or filing or (ii) enter into any swap or other agreement that transfers, in whole or in part, any of the economic consequences of ownership of any such securities, see “Shares Eligible for Future Sale” for a discussion of certain transfer restrictions.
The lockup and market standoff restrictions on our executive officers, directors, and other record holders set forth above are subject to certain exceptions, including with respect to (1) transfers (i) as bona fide gifts, including to charitable organizations, or by will, other testamentary document or intestacy, (ii) to any trust, partnership, limited liability company or other entity for the direct benefit of the holder, (iii) to any immediate family member, other dependent or any investment fund or other entity controlled or managed by the holder, (iv) to another corporation, partnership, limited liability company, trust or other business entity that is an affiliate, (a) transfers to another corporation, partnership, limited liability company, trust or other business entity that is an affiliate of the holder or (b) distributions of the holder’s securities or derivative instruments to limited partners, limited liability company members, stockholders or subsidiaries of the holder, (v) to the extent necessary to fund the payment of taxes due with respect to the vesting of restricted stock, stock options or similar rights to purchase securities pursuant to the our equity incentive, (vi) to us from a current or former employee upon death, disability or termination of employment or to us pursuant to any contractual arrangement that provides us with a right to purchase lock-up securities, (vii) by operation of law, including pursuant to an order of a court or a regulatory authority, (viii) pursuant to a bona fide third-party tender offer, merger, consolidation or other similar transaction approved by our board of directors involving a change of control, provided that if such transaction is not completed, all such securities would remain subject to the restrictions set forth above, (ix) transfers to certain third-party pledgees in bona fide transactions as collateral to secure obligations pursuant to lending or other arrangements with such pledgees, provided that each such pledgee will, upon any foreclosure on such pledged collateral, execute a lock-up agreement with respect to the remaining portion of the Lock-Up Period or (x) to us pursuant to the call or put provisions of existing employment agreements and equity grant documents; (2) the delivery of securities or derivative instruments to us or our subsidiaries for cancellation as payment for (i) the exercise price of any options granted in the ordinary course pursuant to any of our current or future employee or director share option, incentive or benefit plans or (ii) the withholding taxes due upon the exercise of any such option or the vesting of any restricted securities granted under any such plan, with any securities received as contemplated by any transaction described in this item (2); and the establishment of trading plans pursuant to rule 10b5-1 under the Exchange Act.
The lockup and market standoff restrictions set forth above with respect to us are subject to certain exceptions, including with respect to (1) the shares to be sold hereunder; (2) shares issued pursuant to employee stock option, profits interests, long term incentive plan or other incentive plans existing on, or upon the conversion or exchange of convertible or exchangeable securities outstanding as of, the date of this prospectus; (3) the issuance by us of Class A common stock, options to purchase shares of Class A common stock, including nonqualified stock options and incentive stock options, and other equity incentive compensation, including restricted stock or restricted stock units, stock appreciation rights, dividend equivalents and stockbased awards, pursuant to equity plans, (4) any shares of Class A common stock issued upon the exercise of options, the settlement of restricted stock units, the conversion of profits interests units into Class A common stock or other equity-based compensation described in clause (3); (5) the filing of a registration statement on Form S-8 in connection with the registration of securities granted or to be granted under our equity compensation plans; (6) the distribution of Class A common stock, Class B common stock and LLC Units in connection with the Reorganization Transactions; and (7) the issuance of up to 10% of the outstanding shares of Class A common stock (assuming all outstanding LLC Units are exchanged for
223
Table of Contents
newly issued shares of Class A common stock on a one-to-one basis) or any such substantially similar securities in connection with the acquisition of, a joint venture with or a merger with, another company, provided that each recipient of such shares pursuant to this clause (7) shall, on or prior to such issuance, execute a lock-up agreement with respect to the remaining portion of the Lock-Up Period.
Prior to the offering, there has been no public market for the shares. The initial public offering price has been negotiated among the company and the representatives. Among the factors to be considered in determining the initial public offering price of the shares, in addition to prevailing market conditions, will be the company’s historical performance, estimates of the business potential and earnings prospects of the company, an assessment of the company’s management and the consideration of the above factors in relation to market valuation of companies in related businesses.
We have applied to list our Class A common stock on the NYSE under the symbol “WEBR.”
In connection with the offering, the underwriters may purchase and sell shares of Class A common stock in the open market. These transactions may include short sales, stabilizing transactions and purchases to cover positions created by short sales. Short sales involve the sale by the underwriters of a greater number of shares than they are required to purchase in the offering, and a short position represents the amount of such sales that have not been covered by subsequent purchases. A “covered short position” is a short position that is not greater than the amount of additional shares for which the underwriters’ option described above may be exercised. The underwriters may cover any covered short position by either exercising their option to purchase additional shares or purchasing shares in the open market. In determining the source of shares to cover the covered short position, the underwriters will consider, among other things, the price of shares available for purchase in the open market as compared to the price at which they may purchase additional shares pursuant to the option described above. “Naked” short sales are any short sales that create a short position greater than the amount of additional shares for which the option described above may be exercised. The underwriters must cover any such naked short position by purchasing shares in the open market. A naked short position is more likely to be created if the underwriters are concerned that there may be downward pressure on the price of the common stock in the open market after pricing that could adversely affect investors who purchase in the offering. Stabilizing transactions consist of various bids for or purchases of common stock made by the underwriters in the open market prior to the completion of the offering.
The underwriters may also impose a penalty bid. This occurs when a particular underwriter repays to the underwriters a portion of the underwriting discount received by it because the representatives have repurchased shares sold by or for the account of such underwriter in stabilizing or short covering transactions.
Purchases to cover a short position and stabilizing transactions, as well as other purchases by the underwriters for their own accounts, may have the effect of preventing or retarding a decline in the market price of Class A common stock, and together with the imposition of the penalty bid, may stabilize, maintain or otherwise affect the market price of Class A common stock. As a result, the price of shares of Class A common stock may be higher than the price that otherwise might exist in the open market. The underwriters are not required to engage in these activities and may end any of these activities at any time. These transactions may be effected on NYSE, in the over-the-counter market or otherwise.
We estimate that our share of the total expenses of the offering, excluding underwriting discounts and commissions, will be approximately $17.4 million. We have also agreed to reimburse the underwriters for certain FINRA-related expenses incurred by them in connection with the offering, in an amount not to exceed $35,000.
224
Table of Contents
We have agreed to indemnify the several underwriters against certain liabilities, including liabilities under the Securities Act of 1933.
The underwriters and their respective affiliates are full service financial institutions engaged in various activities, which may include sales and trading, commercial and investment banking, advisory, investment management, investment research, principal investment, hedging, market making, brokerage and other financial and non-financial activities and services. Certain of the underwriters and their respective affiliates have provided, and may in the future provide, a variety of these services to us and to persons and entities with relationships with us, for which they received or will receive customary fees and expenses. In addition, affiliates of certain of the underwriters may be lenders under our Secured Credit Facility and as a result, may receive a portion from the net proceeds from this offering. See “Use of Proceeds.”
In the ordinary course of their various business activities, the underwriters and their respective affiliates, officers, directors and employees may purchase, sell or hold a broad array of investments and actively traded securities, derivatives, loans, commodities, currencies, credit default swaps and other financial instruments for their own account and for the accounts of their customers, and such investment and trading activities may involve or relate to assets, securities and/or instruments of ours (directly, as collateral securing other obligations or otherwise) and/or persons and entities with relationships with us. The underwriters and their respective affiliates may also communicate independent investment recommendations, market color or trading ideas and/or publish or express independent research views in respect of such assets, securities or instruments and may at any time hold, or recommend to clients that they should acquire, long and/or short positions in such assets, securities and instruments.
Selling Restrictions
European Economic Area
In relation to each Member State of the European Economic Area (each a “Relevant State”), no shares of Class A common stock have been offered or will be offered pursuant to the offering to the public in that Relevant State prior to the publication of a prospectus in relation to the shares which has been approved by the competent authority in that Relevant State or, where appropriate, approved in another Relevant State and notified to the competent authority in that Relevant State, all in accordance with the Prospectus Regulation, except that offers of shares may be made to the public in that Relevant State at any time under the following exemptions under the Prospectus Regulation:
| (a) | to any legal entity which is a qualified investor as defined under the Prospectus Regulation; |
| (b) | to fewer than 150 natural or legal persons (other than qualified investors as defined under the Prospectus Regulation), subject to obtaining the prior consent of the representatives for any such offer; or |
| (c) | in any other circumstances falling within Article 1(4) of the Prospectus Regulation, |
provided that no such offer of Shares shall require the company or any Bookrunner to publish a prospectus pursuant to Article 3 of the Prospectus Regulation or supplement a prospectus pursuant to Article 23 of the Prospectus Regulation.
For the purposes of this provision, the expression an “offer to the public” in relation to any Shares in any Relevant State means the communication in any form and by any means of sufficient information on the terms of the offer and any Shares to be offered so as to enable an investor to decide to purchase or subscribe for any Shares, and the expression “Prospectus Regulation” means Regulation (EU) 2017/1129.
225
Table of Contents
United Kingdom
In relation to the United Kingdom, no shares of Class A common stock have been offered or will be offered pursuant to this offering to the public in the United Kingdom prior to the publication of a prospectus in relation to the shares that either (i) has been approved by the Financial Conduct Authority, or (ii) is to be treated as if it had been approved by the Financial Conduct Authority in accordance with the transitional provision in Regulation 74 of the Prospectus (Amendment, etc.) (EU Exit) Regulations 2019, except that offers of shares may be made to the public in the United Kingdom at any time under the following exemptions under the UK Prospectus Regulation:
| (a) | to any legal entity which is a qualified investor as defined in Article 2 of the UK Prospectus Regulation; |
| (b) | to fewer than 150 natural or legal persons (other than qualified investors as defined in Article 2 of the UK Prospectus Regulation), subject to obtaining the prior consent of the representatives for any such offer; or |
| (c) | in any other circumstances falling within section 86 of the Financial Services and Markets Act 2000, as amended (the “FSMA”), |
provided that no such offer of Shares shall require the issuer or any underwriter to publish a prospectus pursuant to section 85 of the FSMA or supplement a prospectus pursuant to Article 23 of the UK Prospectus Regulation.
For the purposes of this provision, the expression an “offer to the public” in relation to any Shares in the United Kingdom means the communication in any form and by any means of sufficient information on the terms of the offer and any Shares to be offered so as to enable an investor to decide to purchase or subscribe for any Shares, and the expression “UK Prospectus Regulation” means Regulation (EU) 2017/1129 as it forms part of domestic law by virtue of the European Union (Withdrawal) Act 2018.
Canada
The securities may be sold in Canada only to purchasers purchasing, or deemed to be purchasing, as principal that are accredited investors, as defined in National Instrument 45-106 Prospectus Exemptions or subsection 73.3(1) of the Securities Act (Ontario), and are permitted clients, as defined in National Instrument 31-103 Registration Requirements, Exemptions, and Ongoing Registrant Obligations. Any resale of the securities must be made in accordance with an exemption form, or in a transaction not subject to, the prospectus requirements of applicable securities laws.
Securities legislation in certain provinces or territories of Canada may provide a purchaser with remedies for rescission or damages if this offering memorandum (including any amendment thereto) contains a misrepresentation, provided that the remedies for rescission or damages are exercised by the purchaser within the time limit prescribed by the securities legislation of the purchaser’s province or territory. The purchaser should refer to any applicable provisions of the securities legislation of the purchaser’s province or territory of these rights or consult with a legal advisor.
Pursuant to section 3A.3 of National Instrument 33-105 Underwriting Conflicts (NI 33-105), the underwriters are not required to comply with the disclosure requirements of NI 33-105 regarding underwriter conflicts of interest in connection with this offering.
Hong Kong
The shares may not be offered or sold in Hong Kong by means of any document other than (i) in circumstances which do not constitute an offer to the public within the meaning of the Companies
226
Table of Contents
(Winding Up and Miscellaneous Provisions) Ordinance (Cap. 32 of the Laws of Hong Kong) (“Companies (Winding Up and Miscellaneous Provisions) Ordinance”) or which do not constitute an invitation to the public within the meaning of the Securities and Futures Ordinance (Cap. 571 of the Laws of Hong Kong) (“Securities and Futures Ordinance”), or (ii) to “professional investors” as defined in the Securities and Futures Ordinance and any rules made thereunder, or (iii) in other circumstances which do not result in the document being a “prospectus” as defined in the Companies (Winding Up and Miscellaneous Provisions) Ordinance, and no advertisement, invitation or document relating to the shares may be issued or may be in the possession of any person for the purpose of issue (in each case whether in Hong Kong or elsewhere), which is directed at, or the contents of which are likely to be accessed or read by, the public in Hong Kong (except if permitted to do so under the securities laws of Hong Kong) other than with respect to shares which are or are intended to be disposed of only to persons outside Hong Kong or only to “professional investors” in Hong Kong as defined in the Securities and Futures Ordinance and any rules made thereunder.
Singapore
This prospectus has not been registered as a prospectus with the Monetary Authority of Singapore. Accordingly, this prospectus and any other document or material in connection with the offer or sale, or invitation for subscription or purchase, of the shares may not be circulated or distributed, nor may the shares be offered or sold, or be made the subject of an invitation for subscription or purchase, whether directly or indirectly, to persons in Singapore other than (i) to an institutional investor (as defined under Section 4A of the Securities and Futures Act, Chapter 289 of Singapore (the “SFA”)) under Section 274 of the SFA, (ii) to a relevant person (as defined in Section 275(2) of the SFA) pursuant to Section 275(1) of the SFA, or any person pursuant to Section 275(1A) of the SFA, and in accordance with the conditions specified in Section 275 of the SFA or (iii) otherwise pursuant to, and in accordance with the conditions of, any other applicable provision of the SFA, in each case subject to conditions set forth in the SFA.
Where the shares are subscribed or purchased under Section 275 of the SFA by a relevant person which is a corporation (which is not an accredited investor (as defined in Section 4A of the SFA)) the sole business of which is to hold investments and the entire share capital of which is owned by one or more individuals, each of whom is an accredited investor, the securities (as defined in Section 239(1) of the SFA) of that corporation shall not be transferable for six months after that corporation has acquired the shares under Section 275 of the SFA except: (1) to an institutional investor under Section 274 of the SFA or to a relevant person (as defined in Section 275(2) of the SFA), (2) where such transfer arises from an offer in that corporation’s securities pursuant to Section 275(1A) of the SFA, (3) where no consideration is or will be given for the transfer, (4) where the transfer is by operation of law, (5) as specified in Section 276(7) of the SFA, or (6) as specified in Regulation 32 of the Securities and Futures (Offers of Investments) (Shares and Debentures) Regulations 2005 of Singapore (“Regulation 32”).
Where the shares are subscribed or purchased under Section 275 of the SFA by a relevant person which is a trust (where the trustee is not an accredited investor (as defined in Section 4A of the SFA)) whose sole purpose is to hold investments and each beneficiary of the trust is an accredited investor, the beneficiaries’ rights and interest (howsoever described) in that trust shall not be transferable for six months after that trust has acquired the shares under Section 275 of the SFA except: (1) to an institutional investor under Section 274 of the SFA or to a relevant person (as defined in Section 275(2) of the SFA), (2) where such transfer arises from an offer that is made on terms that such rights or interest are acquired at a consideration of not less than $200,000 (or its equivalent in a foreign currency) for each transaction (whether such amount is to be paid for in cash or by exchange of securities or other assets), (3) where no consideration is or will be given for the transfer, (4) where the transfer is by operation of law, (5) as specified in Section 276(7) of the SFA, or (6) as specified in Regulation 32.
227
Table of Contents
Japan
The securities have not been and will not be registered under the Financial Instruments and Exchange Act of Japan (Act No. 25 of 1948, as amended), or the FIEA. The securities may not be offered or sold, directly or indirectly, in Japan or to or for the benefit of any resident of Japan (including any person resident in Japan or any corporation or other entity organized under the laws of Japan) or to others for reoffering or resale, directly or indirectly, in Japan or to or for the benefit of any resident of Japan, except pursuant to an exemption from the registration requirements of the FIEA and otherwise in compliance with any relevant laws and regulations of Japan.
228
Table of Contents
The validity of the issuance of the shares of Class A common stock offered hereby will be passed upon for Weber Inc. by Davis Polk & Wardwell LLP, New York, New York. Certain legal matters in connection with this offering will be passed upon for the underwriters by Simpson Thacher & Bartlett LLP, New York, New York.
The financial statement of Weber Inc. as of April 1, 2021 appearing in this prospectus and Registration Statement has been audited by Ernst & Young LLP, independent registered public accounting firm, as set forth in their report thereon appearing elsewhere herein, and is included in reliance upon such report given on the authority of such firm as experts in accounting and auditing.
The consolidated financial statements of Weber-Stephen Products LLC as of September 30, 2020 and 2019, and for each of the three years in the period ended September 30, 2020 appearing in this prospectus and Registration Statement have been audited by Ernst & Young LLP, independent registered public accounting firm, as set forth in their report thereon appearing elsewhere herein, and are included in reliance upon such report given on the authority of such firm as experts in accounting and auditing.
229
Table of Contents
WHERE YOU CAN FIND MORE INFORMATION
We have filed with the SEC a registration statement on Form S-1 under the Securities Act with respect to the Class A common stock offered hereby. This prospectus does not contain all of the information set forth in the registration statement and the exhibits and schedules thereto. For further information with respect to the Company and our Class A common stock, reference is made to the registration statement and the exhibits and any schedules filed therewith. Statements contained in this prospectus as to the contents of any contract or other document referred to are not necessarily complete and in each instance, if such contract or document is filed as an exhibit, reference is made to the copy of such contract or other document filed as an exhibit to the registration statement, each statement being qualified in all respects by such reference. The SEC maintains an internet site at www.sec.gov, from which interested persons can electronically access the registration statement, including the exhibits and any schedules thereto.
As a result of the offering, we will be required to file periodic reports and other information with the SEC. We also maintain a website at www.weber.com. Our website and the information contained therein or connected thereto shall not be deemed to be incorporated into this prospectus or the registration statement of which it forms a part.
230
Table of Contents
INDEX TO CONSOLIDATED FINANCIAL STATEMENTS
Audited Consolidated Financial Statements
Fiscal Years Ended September 30, 2018, 2019 and 2020
Contents
| Weber Inc. |
||||
| F-2 | ||||
| F-3 | ||||
| F-4 | ||||
| Weber-Stephen Products LLC |
||||
| F-5 | ||||
| F-7 | ||||
| F-8 | ||||
| F-9 | ||||
| Consolidated Statements of Changes in Members’ Equity (Deficit) |
F-10 | |||
| F-11 | ||||
| F-12 | ||||
Unaudited Consolidated Financial Statements
Six Months Ended March 31, 2020 and March 31, 2021
Weber-Stephen Products LLC
F-1
Table of Contents
Report of Independent Registered Public Accounting Firm
To the Shareholder and the Board of Directors of Weber Inc.
Opinion on the Financial Statement
We have audited the accompanying balance sheet of Weber Inc. (the Company) as of April 1, 2021, and the related notes (collectively referred to as the “financial statement”). In our opinion, the financial statement presents fairly, in all material respects, the financial position of the Company at April 1, 2021, in conformity with U.S. generally accepted accounting principles.
Basis for Opinion
The financial statement is the responsibility of the Company’s management. Our responsibility is to express an opinion on the Company’s financial statement based on our audit. We are a public accounting firm registered with the Public Company Accounting Oversight Board (United States) (PCAOB) and are required to be independent with respect to the Company in accordance with the U.S. federal securities laws and the applicable rules and regulations of the Securities and Exchange Commission and the PCAOB.
We conducted our audit in accordance with the standards of the PCAOB. Those standards require that we plan and perform the audit to obtain reasonable assurance about whether the financial statement is free of material misstatement, whether due to error or fraud. The Company is not required to have, nor were we engaged to perform, an audit of its internal control over financial reporting. As part of our audit we are required to obtain an understanding of internal control over financial reporting but not for the purpose of expressing an opinion on the effectiveness of the Company’s internal control over financial reporting. Accordingly, we express no such opinion.
Our audit included performing procedures to assess the risks of material misstatement of the financial statement, whether due to error or fraud, and performing procedures that respond to those risks. Such procedures included examining, on a test basis, evidence regarding the amounts and disclosures in the financial statement. Our audit also included evaluating the accounting principles used and significant estimates made by management, as well as evaluating the overall presentation of the financial statement. We believe that our audit provides a reasonable basis for our opinion.
Critical Audit Matters
Critical audit matters are matters arising from the current period audit of the financial statement that were communicated or required to be communicated to the audit committee and that: (1) relate to accounts or disclosures that are material to the financial statement and (2) involved our especially challenging, subjective or complex judgments. We determined that there are no critical audit matters.
/s/ Ernst & Young LLP
We have served as the Company’s auditor since 2021.
Chicago, IL
May 10, 2021
F-2
Table of Contents
Balance Sheet
As of April 1, 2021
| Assets |
||||
| Cash |
$ | 0 | ||
|
|
|
|||
| Total assets |
$ | 0 | ||
|
|
|
|||
| Commitments and contingencies |
||||
| Stockholders’ equity |
||||
| Common stock, $0.01 par value per share, 1,000 shares authorized |
$ | 0 | ||
|
|
|
|||
| Total stockholders’ equity |
$ | 0 | ||
|
|
|
|||
The accompanying notes are an integral part of the financial statement.
F-3
Table of Contents
Notes to Financial Statement
1. Organization
Weber Inc. (the “Company”) was formed as a Delaware corporation on April 1, 2021. The Company was formed for the purpose of completing a public offering and related transactions in order to carry on the business of Weber HoldCo LLC and its subsidiaries (“Topco LLC”). As the manager of Topco LLC, the Company is expected to operate and control all of the business and affairs of Topco LLC, and through Topco LLC, continue to conduct the business now conducted by these subsidiaries.
2. Basis of Presentation and Significant Accounting Policies
The financial statement has been prepared in accordance with accounting principles generally accepted in the United States of America (“GAAP”). Separate statements of income, comprehensive income, changes in stockholder’s equity, and cash flows have not been presented because there have been no activities in this entity as of April 1, 2021.
Use of Estimates
The preparation of consolidated financial statements in conformity with U.S. GAAP requires management to make estimates and assumptions that affect the amounts reported in the consolidated financial statements and accompanying notes. Actual results could differ from those estimates. The effect of the change in the estimates will be recognized in the current period of the change.
3. Common Stock
On April 1, 2021, the Company was authorized to issue 1,000 shares of common stock, par value $0.01 per share.
4. Subsequent Events
The Company has evaluated subsequent events through the date of the report of the Independent Registered Public Accounting Firm. The Company has concluded that no subsequent event has occurred that requires disclosure.
F-4
Table of Contents
Report of Independent Registered Public Accounting Firm
To the Members and the Board of Directors of Weber-Stephen Products LLC
Opinion on the Financial Statements
We have audited the accompanying consolidated balance sheets of Weber-Stephen Products LLC (the Company) as of September 30, 2020 and 2019, the related consolidated statements of income, comprehensive income, changes in members’ equity (deficit) and cash flows for each of the three years in the period ended September 30, 2020, and the related notes (collectively referred to as the “consolidated financial statements”). In our opinion, the consolidated financial statements present fairly, in all material respects, the financial position of the Company at September 30, 2020 and 2019, and the results of its operations and its cash flows for each of the three years in the period ended September 30, 2020, in conformity with U.S. generally accepted accounting principles.
Adoption of New Accounting Standard
As discussed in Note 1 to the consolidated financial statements, the Company changed its method of accounting for leases as of October 1, 2019.
Basis for Opinion
These financial statements are the responsibility of the Company’s management. Our responsibility is to express an opinion on the Company’s financial statements based on our audits. We are a public accounting firm registered with the Public Company Accounting Oversight Board (United States) (PCAOB) and are required to be independent with respect to the Company in accordance with the U.S. federal securities laws and the applicable rules and regulations of the Securities and Exchange Commission and the PCAOB.
We conducted our audits in accordance with the standards of the PCAOB. Those standards require that we plan and perform the audit to obtain reasonable assurance about whether the financial statements are free of material misstatement, whether due to error or fraud. The Company is not required to have, nor were we engaged to perform, an audit of its internal control over financial reporting. As part of our audits we are required to obtain an understanding of internal control over financial reporting but not for the purpose of expressing an opinion on the effectiveness of the Company’s internal control over financial reporting. Accordingly, we express no such opinion.
Our audits included performing procedures to assess the risks of material misstatement of the financial statements, whether due to error or fraud, and performing procedures that respond to those risks. Such procedures included examining, on a test basis, evidence regarding the amounts and disclosures in the financial statements. Our audits also included evaluating the accounting principles used and significant estimates made by management, as well as evaluating the overall presentation of the financial statements. We believe that our audits provide a reasonable basis for our opinion.
Critical Audit Matter
The critical audit matter communicated below is a matter arising from the current period audit of the financial statements that was communicated or required to be communicated to the audit committee and that: (1) relates to accounts or disclosures that are material to the financial statements and (2) involved our especially challenging, subjective, or complex judgments. The communication of the critical audit matter does not alter in any way our opinion on the consolidated financial statements, taken as a whole, and we are not, by communicating the critical audit matter below, providing a separate opinion on the critical audit matter or on the account or disclosure to which it relates.
F-5
Table of Contents
Accrued Warranties
| Description of the Matter | At September 30, 2020, accrued warranties were $21.9 million. As discussed in Note 1 and 9 to the consolidated financial statements, the Company offers warranties on most of its products. The specific terms and conditions of the warranties offered by the Company vary depending upon the product sold. The Company estimates the costs that may be incurred under its warranty plans and the period for which claims are honored, and records a liability in the amount of such costs at the time product revenue is recognized. Factors that affect the Company’s warranty liability include the number of units sold, the type of products sold, historical and anticipated rates of warranty claims, the warranty period and cost per claim. The Company periodically assesses the adequacy of its recorded warranty liabilities and adjusts the amounts as necessary.
Auditing the product warranty liability was complex due to the judgmental nature of the warranty loss experience assumptions, including the estimated product failure rate, the estimated cost of product replacement, and the period for which warranty claims are honored. In particular, it is possible that future product failure rates may not be reflective of historical product failure rates, or that a product quality issue has not yet been identified as of the financial statement date. Additionally, the cost of product replacement could differ from estimates due to fluctuations in the replacement cost of the product. | |
| How We Addressed the Matter in Our Audit | To test the accrued product warranty liability, our audit procedures included, among others, evaluating the methodologies and assumptions used by the Company to estimate these liabilities as well as the completeness and accuracy of the underlying data used in the estimation process. We evaluated the assumptions used by management and compared them to historical trends, evaluated the change in estimated accruals from the prior periods, and assessed the historical accuracy of the Company’s estimates. We utilized actuarial specialists in evaluating the Company’s methodology and calculations of accrued warranty used to estimate warranty expense for a sample of the Company’s products. These specialist procedures also included producing an independent corroborative range of reasonable estimates of the Company’s unpaid warranty liabilities as of September 30, 2020. | |
/s/ Ernst & Young LLP
We have served as the Company’s auditor since 1971.
Chicago, Illinois
May 10, 2021
F-6
Table of Contents
Consolidated Balance Sheets
(in thousands, except unit data)
| September 30, | ||||||||
| 2019 | 2020 | |||||||
| Assets |
||||||||
| Current assets: |
||||||||
| Cash and cash equivalents |
$ | 44,665 | $ | 123,792 | ||||
| Accounts receivable, less allowance for doubtful accounts of $2,858 and $3,262 at September 30, 2019 and 2020, respectively(1) |
94,339 | 130,885 | ||||||
| Inventories, net |
185,380 | 233,327 | ||||||
| Prepaid expenses and other current assets(2) |
17,147 | 33,880 | ||||||
|
|
|
|
|
|||||
| Total current assets |
341,531 | 521,884 | ||||||
| Property, equipment and leasehold improvements, net |
147,328 | 108,252 | ||||||
| Operating lease right-of-use assets(3) |
— | 48,937 | ||||||
| Other long-term assets |
35,899 | 33,961 | ||||||
| Trademarks, net |
346,502 | 343,965 | ||||||
| Other intangible assets, net |
60,568 | 51,866 | ||||||
| Goodwill |
29,783 | 30,570 | ||||||
|
|
|
|
|
|||||
| Total assets |
$ | 961,611 | $ | 1,139,435 | ||||
|
|
|
|
|
|||||
| Liabilities and members’ equity (deficit) |
||||||||
| Current liabilities: |
||||||||
| Trade accounts payable |
$ | 105,194 | $ | 298,078 | ||||
| Accrued expenses |
84,251 | 133,868 | ||||||
| Income taxes payable |
3,190 | 8,151 | ||||||
| Current portion of long-term debt and other borrowings |
231,075 | 36,250 | ||||||
| Current portion of long-term financing obligation |
2,700 | 514 | ||||||
|
|
|
|
|
|||||
| Total current liabilities |
426,410 | 476,861 | ||||||
| Long-term debt, less current portion |
594,035 | 575,659 | ||||||
| Long-term financing obligation, less current portion |
23,807 | 38,986 | ||||||
| Non-current operating lease liabilities(4) |
— | 37,986 | ||||||
| Other long-term liabilities |
39,119 | 53,491 | ||||||
|
|
|
|
|
|||||
| Total liabilities |
1,083,371 | 1,182,983 | ||||||
| Commitments and Contingencies (Note 9) |
||||||||
| Members’ deficit, 551,732 and 551,774 common units authorized, issued and outstanding as of September 30, 2019 and 2020, respectively |
(1,427 | ) | (1,216 | ) | ||||
| Accumulated other comprehensive loss |
(72,261 | ) | (68,580 | ) | ||||
| Retained (deficit) earnings |
(48,072 | ) | 26,248 | |||||
|
|
|
|
|
|||||
| Total members’ deficit |
(121,760 | ) | (43,548 | ) | ||||
|
|
|
|
|
|||||
| Total liabilities and members’ deficit |
$ | 961,611 | $ | 1,139,435 | ||||
|
|
|
|
|
|||||
| (1) | Includes related party royalty receivables of $149 and $220 at September 30, 2019 and 2020, respectively (see Note 11). |
| (2) | Includes related party prepaid royalties of $4,600 and $10,044 at September 30, 2019 and 2020, respectively (see Note 11). |
| (3) | Includes related party operating lease assets of $4,111 at September 30, 2020 (see Note 11). |
| (4) | Includes related party operating lease liabilities of $4,139 at September 30, 2020 (see Note 11). |
The accompanying notes are an integral part of these consolidated financial statements.
F-7
Table of Contents
Consolidated Statements of Income
(in thousands, except unit and per unit data)
| Fiscal Years Ended September 30, | ||||||||||||
| 2018 | 2019 | 2020 | ||||||||||
| Net sales(1) |
$ | 1,340,032 | $ | 1,296,210 | $ | 1,525,260 | ||||||
| Cost of goods sold(2) |
759,786 | 793,536 | 915,586 | |||||||||
|
|
|
|
|
|
|
|||||||
| Gross profit |
580,246 | 502,674 | 609,674 | |||||||||
| Operating expenses: |
||||||||||||
| Selling, general and administrative(3)(4) |
397,444 | 369,651 | 444,975 | |||||||||
| Amortization of intangible assets |
11,786 | 13,586 | 13,235 | |||||||||
| Impairment of assets |
— | 12,568 | — | |||||||||
|
|
|
|
|
|
|
|||||||
| Income from operations |
171,016 | 106,869 | 151,464 | |||||||||
| Foreign currency loss (gain) |
7,118 | (1,837 | ) | 5,081 | ||||||||
| Interest income(5) |
(1,594 | ) | (1,153 | ) | (1,270 | ) | ||||||
| Interest expense |
34,609 | 45,170 | 40,357 | |||||||||
|
|
|
|
|
|
|
|||||||
| Income before taxes |
130,883 | 64,689 | 107,296 | |||||||||
| Income taxes |
17,588 | 13,544 | 13,812 | |||||||||
| Loss from investments in unconsolidated affiliates |
— | 1,025 | 4,604 | |||||||||
|
|
|
|
|
|
|
|||||||
| Net income |
113,295 | 50,120 | 88,880 | |||||||||
| Earnings allocated to participating securities |
(738 | ) | (320 | ) | (473 | ) | ||||||
|
|
|
|
|
|
|
|||||||
| Net income attributable to common members |
$ | 112,557 | $ | 49,800 | $ | 88,407 | ||||||
|
|
|
|
|
|
|
|||||||
| Net income per common unit |
||||||||||||
| Basic |
$ | 193.53 | $ | 87.95 | $ | 160.23 | ||||||
| Diluted |
$ | 193.53 | $ | 87.95 | $ | 160.23 | ||||||
| Weighted average common units outstanding |
||||||||||||
| Basic |
581,616 | 566,223 | 551,763 | |||||||||
| Diluted |
581,616 | 566,223 | 551,763 | |||||||||
| (1) | Includes related party royalty revenue of $693, $699 and $386 for the fiscal years ended September 30, 2018, 2019 and 2020, respectively. |
| (2) | Includes related party rental expense of $718 for each of the fiscal years ended September 30, 2018, 2019 and 2020. |
| (3) | Includes related party rental expense of $235 for each of the fiscal years ended September 30, 2018, 2019 and 2020. |
| (4) | Includes related party royalty expense of $0, $0 and $1,291 for the fiscal years ended September 30, 2018, 2019 and 2020. |
| (5) | Includes related party interest income of $116, $66 and $56 for the fiscal years ended September 30, 2018, 2019 and 2020, respectively. |
The accompanying notes are an integral part of these consolidated financial statements.
F-8
Table of Contents
WEBER-STEPHEN PRODUCTS LLC
Consolidated Statements of Comprehensive Income
(in thousands)
| Fiscal Years Ended September 30, | ||||||||||||
| 2018 | 2019 | 2020 | ||||||||||
| Net income |
$ | 113,295 | $ | 50,120 | $ | 88,880 | ||||||
| Other comprehensive income (loss): |
||||||||||||
| Foreign currency translation adjustments |
(9,097 | ) | (14,179 | ) | 19,956 | |||||||
| Gain (loss) on derivative instruments |
5,949 | (31,879 | ) | (16,275 | ) | |||||||
|
|
|
|
|
|
|
|||||||
| Comprehensive income |
$ | 110,147 | $ | 4,062 | $ | 92,561 | ||||||
|
|
|
|
|
|
|
|||||||
The accompanying notes are an integral part of these consolidated financial statements.
F-9
Table of Contents
Consolidated Statements of Changes in Members’ Equity (Deficit)
(in thousands, except unit data)
| Accumulated Other Comprehensive Income (Loss) |
||||||||||||||||||||||||||||
| Units | Capital Contributions |
Notes Receivable From Members |
Cumulative Translation Adjustments |
Unrealized Gain (Loss) on Derivative Instruments |
Retained Earnings (Deficit) |
Total | ||||||||||||||||||||||
| Balance at September 30, 2017 |
585,677 | $ | 295,153 | $ | (8,332 | ) | $ | (25,135 | ) | $ | 2,080 | $ | 86,042 | $ | 349,808 | |||||||||||||
| Capital contributions |
394 | 1,280 | (800 | ) | — | — | — | 480 | ||||||||||||||||||||
| Repurchase of members’ interest |
(5,631 | ) | (7,000 | ) | — | — | — | (4,253 | ) | (11,253 | ) | |||||||||||||||||
| Interest income on notes receivable |
— | — | (425 | ) | — | — | — | (425 | ) | |||||||||||||||||||
| Notes receivable repayments |
— | — | 7,427 | — | — | — | 7,427 | |||||||||||||||||||||
| Net income |
— | — | — | — | — | 113,295 | 113,295 | |||||||||||||||||||||
| Foreign currency translation adjustments |
— | — | — | (9,097 | ) | — | — | (9,097 | ) | |||||||||||||||||||
| Gain on derivative instruments |
— | — | — | — | 6,154 | — | 6,154 | |||||||||||||||||||||
| Unit based compensation |
— | 2,287 | — | — | — | — | 2,287 | |||||||||||||||||||||
| Reclassification of realized gain on derivative instruments to net income |
— | — | — | — | (205 | ) | — | (205 | ) | |||||||||||||||||||
| Members’ distributions |
— | (267,307 | ) | — | — | — | (195,084 | ) | (462,391 | ) | ||||||||||||||||||
|
|
|
|
|
|
|
|
|
|
|
|
|
|
|
|||||||||||||||
| Balance at September 30, 2018 |
580,440 | $ | 24,413 | $ | (2,130 | ) | $ | (34,232 | ) | $ | 8,029 | $ | — | $ | (3,920 | ) | ||||||||||||
| Capital contributions |
200 | 600 | (50 | ) | — | — | — | 550 | ||||||||||||||||||||
| Repurchase of members’ interest |
(28,908 | ) | (23,274 | ) | — | — | — | (64,431 | ) | (87,705 | ) | |||||||||||||||||
| Interest income on notes receivable |
— | — | (66 | ) | — | — | — | (66 | ) | |||||||||||||||||||
| Notes receivable repayments |
— | — | 819 | — | — | — | 819 | |||||||||||||||||||||
| Net income |
— | — | — | — | — | 50,120 | 50,120 | |||||||||||||||||||||
| Foreign currency translation adjustments |
— | — | — | (14,179 | ) | — | — | (14,179 | ) | |||||||||||||||||||
| Loss on derivative instruments |
— | — | — | — | (30,507 | ) | — | (30,507 | ) | |||||||||||||||||||
| Unit based compensation |
— | 158 | — | — | — | — | 158 | |||||||||||||||||||||
| Reclassification of realized gain on derivative instruments to net income |
— | — | — | — | (1,372 | ) | — | (1,372 | ) | |||||||||||||||||||
| Members’ distributions |
— | (1,897 | ) | — | — | — | (33,761 | ) | (35,658 | ) | ||||||||||||||||||
|
|
|
|
|
|
|
|
|
|
|
|
|
|
|
|||||||||||||||
| Balance at September 30, 2019 |
551,732 | $ | — | $ | (1,427 | ) | $ | (48,411 | ) | $ | (23,850 | ) | $ | (48,072 | ) | $ | (121,760 | ) | ||||||||||
| Capital contributions |
42 | 125 | — | — | — | — | 125 | |||||||||||||||||||||
| Interest income on notes receivable |
— | — | (56 | ) | — | — | — | (56 | ) | |||||||||||||||||||
| Net income |
— | — | — | — | — | 88,880 | 88,880 | |||||||||||||||||||||
| Foreign currency translation adjustments |
— | — | — | 19,956 | — | — | 19,956 | |||||||||||||||||||||
| Loss on derivative instruments |
— | — | — | — | (20,679 | ) | — | (20,679 | ) | |||||||||||||||||||
| Unit based compensation |
— | 142 | — | — | — | — | 142 | |||||||||||||||||||||
| Reclassification of realized loss on derivative instruments to net income |
— | — | — | — | 4,404 | — | 4,404 | |||||||||||||||||||||
| Application of ASC 842 |
— | — | — | — | — | 2,482 | 2,482 | |||||||||||||||||||||
| Members’ distributions |
— | — | — | — | — | (17,042 | ) | (17,042 | ) | |||||||||||||||||||
|
|
|
|
|
|
|
|
|
|
|
|
|
|
|
|||||||||||||||
| Balance at September 30, 2020 |
551,774 | $ | 267 | $ | (1,483 | ) | $ | (28,455 | ) | $ | (40,125 | ) | $ | 26,248 | $ | (43,548 | ) | |||||||||||
|
|
|
|
|
|
|
|
|
|
|
|
|
|
|
|||||||||||||||
The accompanying notes are an integral part of these consolidated financial statements.
F-10
Table of Contents
Consolidated Statements of Cash Flows
(in thousands)
| Fiscal Years Ended September 30, |
||||||||||||
| 2018 | 2019 | 2020 | ||||||||||
| Operating activities |
||||||||||||
| Net income |
$ | 113,295 | $ | 50,120 | $ | 88,880 | ||||||
| Adjustments to reconcile net income to net cash provided by operating activities: |
||||||||||||
| Provisions for depreciation |
36,831 | 32,731 | 29,112 | |||||||||
| Provision for amortization of intangible assets |
11,786 | 13,586 | 13,235 | |||||||||
| Provision for amortization of deferred financing costs |
1,750 | 2,022 | 2,935 | |||||||||
| Management incentive plan compensation, net of forfeitures |
(3,377 | ) | (1,604 | ) | 4,372 | |||||||
| Loss from investments in unconsolidated affiliates |
— | 1,025 | 4,604 | |||||||||
| Impairment of assets |
— | 12,568 | — | |||||||||
| Unit based compensation |
2,287 | 158 | 142 | |||||||||
| Changes in operating assets and liabilities: |
||||||||||||
| Accounts receivable |
633 | (20,755 | ) | (25,511 | ) | |||||||
| Inventories |
(60,674 | ) | 84,805 | (44,179 | ) | |||||||
| Prepaid expenses and other current assets |
1,528 | 4,196 | (16,711 | ) | ||||||||
| Trade accounts payable |
10,543 | (41,769 | ) | 196,213 | ||||||||
| Accrued expenses |
1,931 | (3,274 | ) | 52,115 | ||||||||
| Income taxes payable |
1,523 | 481 | 4,193 | |||||||||
| Other |
(7,408 | ) | (7,822 | ) | (4,222 | ) | ||||||
|
|
|
|
|
|
|
|||||||
| Net cash provided by operating activities |
110,648 | 126,468 | 305,178 | |||||||||
| Investing activities |
||||||||||||
| Proceeds from disposal of property, equipment and leasehold improvements |
1,825 | 19 | 7,207 | |||||||||
| Additions to property, equipment and leasehold improvements |
(34,904 | ) | (25,507 | ) | (29,414 | ) | ||||||
| Payments for investments |
— | (41,769 | ) | — | ||||||||
|
|
|
|
|
|
|
|||||||
| Net cash used in investing activities |
(33,079 | ) | (67,257 | ) | (22,207 | ) | ||||||
| Financing activities |
||||||||||||
| Payments for deferred financing costs |
(5,157 | ) | (1,671 | ) | (3,233 | ) | ||||||
| Payment for the acquired Q Grill Trademark |
— | — | (18,000 | ) | ||||||||
| Payments under agreement with iDevices |
(2,136 | ) | (2,188 | ) | (1,640 | ) | ||||||
| Proceeds from contribution of capital, net |
7,907 | 1,369 | 125 | |||||||||
| Repurchase of members’ interests |
(11,253 | ) | (87,705 | ) | — | |||||||
| Members’ distributions |
(462,391 | ) | (35,658 | ) | (17,042 | ) | ||||||
| Proceeds from long-term debt borrowings |
320,000 | — | — | |||||||||
| Proceeds from financing obligation (Note 4) |
— | — | 39,500 | |||||||||
| Borrowings from revolving credit facility |
749,390 | 735,865 | 497,462 | |||||||||
| Payments on revolving credit facility |
(686,706 | ) | (621,849 | ) | (674,162 | ) | ||||||
| Payments of long-term debt |
(111,250 | ) | (36,250 | ) | (33,550 | ) | ||||||
| Service on financing obligation (Note 4) |
(2,583 | ) | (2,641 | ) | (2,700 | ) | ||||||
|
|
|
|
|
|
|
|||||||
| Net cash used in financing activities |
(204,179 | ) | (50,728 | ) | (213,240 | ) | ||||||
| Effect of exchange rate changes on cash and cash equivalents |
5,854 | 851 | 9,396 | |||||||||
|
|
|
|
|
|
|
|||||||
| Increase (decrease) in cash and cash equivalents |
(120,756 | ) | 9,334 | 79,127 | ||||||||
| Cash and cash equivalents at beginning of year |
156,087 | 35,331 | 44,665 | |||||||||
|
|
|
|
|
|
|
|||||||
| Cash and cash equivalents at end of year |
$ | 35,331 | $ | 44,665 | $ | 123,792 | ||||||
|
|
|
|
|
|
|
|||||||
| Supplemental disclosures of cash flow information: |
||||||||||||
| Cash paid for interest |
$ | 32,564 | $ | 39,988 | $ | 43,095 | ||||||
| Cash paid for income taxes, net of refunds of $926, $490 and $730, respectively |
$ | 14,464 | $ | 13,788 | $ | 10,295 | ||||||
| Supplemental disclosures of non-cash investing and financing information: |
||||||||||||
| Property and equipment included in accounts payable and accrued expenses |
$ | 8,997 | $ | 7,708 | $ | 5,517 | ||||||
The accompanying notes are an integral part of these consolidated financial statements.
F-11
Table of Contents
Notes to Consolidated Financial Statements
(All Amounts in Thousands of U.S. Dollars Unless Otherwise Indicated)
1. Basis of Presentation and Significant Accounting Policies
The accompanying consolidated financial statements of Weber-Stephen Products LLC (“Weber” or the “Company”) were prepared in accordance with generally accepted accounting principles (“GAAP”) in the United States (“U.S.”).
Organization
The Company is primarily a manufacturer and distributor of gas and charcoal grills and related accessories, which are sold in North America, Europe, Australia and other locations throughout the world.
Principles of Consolidation
The consolidated financial statements include the accounts and operations of the Company and its wholly owned subsidiaries. All significant intercompany accounts and transactions have been eliminated in consolidation.
Fiscal Year
The Company’s fiscal year runs from October 1 through September 30. All references to years are to fiscal years unless otherwise stated.
Use of Estimates
The preparation of consolidated financial statements in conformity with U.S. GAAP requires management to make estimates and assumptions that affect the amounts reported in the consolidated financial statements and accompanying notes. Actual results could differ from those estimates. The effect of the change in the estimates will be recognized in the current period of the change.
Cash and Cash Equivalents
The Company considers all investments with initial maturities of three months or less to be cash equivalents. The Company maintains its cash and cash equivalents in accounts with major financial institutions in the U.S. and in countries where the Company’s subsidiaries operate, in the form of demand deposits and money market accounts. Deposits in these institutions may exceed amounts of insurance provided on such accounts. The Company has not experienced any losses on its deposits of cash and cash equivalents.
Revenue Recognition
In May 2014, the Financial Accounting Standards Board (“FASB”) issued Accounting Standards Update (“ASU”) 2014-09, Revenue from Contracts with Customers (Topic 606), which outlines a single comprehensive five-step model for entities to use in accounting for revenue arising from contracts with customers. The Company adopted this standard on October 1, 2018, using the modified retrospective approach with no material impact on the Company’s consolidated financial statements. The revenue recognition policy as a result of adoption is described below.
F-12
Table of Contents
WEBER-STEPHEN PRODUCTS LLC
Notes to Consolidated Financial Statements (continued)
(All Amounts in Thousands of U.S. Dollars Unless Otherwise Indicated)
Revenue transactions associated with the sale of grills and related accessories comprise a single performance obligation, which consists of the transfer of products to customers at a point in time. Substantially all of the Company’s revenues relate to the sales of grills and accessories.
The Company satisfies the performance obligation and records revenues for grills and accessories when control has passed to the customer, based on the terms of sale. Transfer of control passes to customers at a point in time, that point in time generally being upon shipment or upon delivery of the performance obligation, depending on the written sales terms with the customer.
The Company’s purchase orders from customers for specific products represent its contracts and include all key terms and conditions related to the sale of products. For all sales, no significant uncertainty exists surrounding the customers’ obligation to pay for grills and accessories. Customers’ obligations to pay are generally under normal commercial terms, with payment terms typically being 30-60 days upon completion of the performance obligation. As payment terms are less than one year from the satisfaction of performance obligation, our sales do not include any significant financing components. Consideration promised in the Company’s contracts with customers is variable due to anticipated reductions, such as cash discounts and customer incentives (volume rebates and advertising programs). The transaction price is determined based upon the invoiced sales price, less anticipated reductions. The cost of these discounts and incentives are estimated at the inception of the contract based on the Company’s annual incentive programs with customers and recognized as a reduction to revenue at the time of sale. Subsequent adjustments to discounts or incentive programs are recognized to revenue in the period the adjustment is determinable.
The Company offers warranties on most of its products, which are considered assurance type warranties and, therefore, are not accounted for as a separate performance obligation.
The Company has elected to account for shipping and handling activities as a fulfillment cost. Accordingly, all shipping and handling activity costs are recognized as Selling, general and administrative at the time the related revenue is recognized. The Company recognized shipping and handling activity costs of $110,884, $102,068 and $116,303 for the fiscal years ended September 30, 2018, 2019 and 2020, respectively. Amounts invoiced to customers for shipping and handling are recorded in Net sales. Any taxes collected on behalf of government authorities are excluded from Net sales.
Accounts Receivable
Accounts receivable consist primarily of amounts due to the Company from its normal business activities. An allowance for doubtful accounts is maintained at a level management believes is sufficient to cover potential credit losses based on past collection history and specific risks identified among uncollected accounts. The Company does not require collateral from its customers. Accounts receivable are charged against the allowance for doubtful accounts when it is determined that the receivable will not be collected.
F-13
Table of Contents
WEBER-STEPHEN PRODUCTS LLC
Notes to Consolidated Financial Statements (continued)
(All Amounts in Thousands of U.S. Dollars Unless Otherwise Indicated)
The Company’s allowance for doubtful accounts is as follows:
| Balance at September 30, 2017 |
$ | 2,007 | ||
| Charges (credits) to the provision, net |
1,191 | |||
| Accounts written off, net of recoveries |
(299 | ) | ||
|
|
|
|||
| Balance at September 30, 2018 |
2,899 | |||
| Charges (credits) to the provision, net |
625 | |||
| Accounts written off, net of recoveries |
(666 | ) | ||
|
|
|
|||
| Balance at September 30, 2019 |
2,858 | |||
| Charges (credits) to the provision, net |
1,112 | |||
| Accounts written off, net of recoveries |
(708 | ) | ||
|
|
|
|||
| Balance at September 30, 2020 |
$ | 3,262 | ||
|
|
|
Inventories
Inventories include finished products and work-in-process and materials associated with production and are valued at the lower of cost or market (net realizable value) using the first-in, first-out method. In evaluating net realizable value, appropriate consideration is given to obsolescence, excessive inventory levels, product deterioration and other factors.
The inventory balance as of September 30, 2019 and 2020 is as follows:
| September 30, | ||||||||
| 2019 | 2020 | |||||||
| Work-in-process and materials |
$ | 33,879 | $ | 33,343 | ||||
| Finished products |
151,501 | 199,984 | ||||||
|
|
|
|
|
|||||
| Total Inventories, net |
$ | 185,380 | $ | 233,327 | ||||
|
|
|
|
|
|||||
Property, Equipment and Leasehold Improvements
The Company provides for depreciation and amortization of buildings, equipment and leasehold improvements using the straight-line method over their estimated useful lives. The estimated useful life for leasehold improvements, buildings and equipment and computer software are as follows:
| Estimated Useful Life | ||
| Leasehold improvements |
Lesser of remaining lease term or useful life of the asset | |
| Buildings |
10-40 years | |
| Equipment and computer software |
3-15 years |
Maintenance and repair costs are charged to expense as incurred. Major overhauls that extend the useful lives of existing assets are capitalized.
During the fiscal year ended September 30, 2020, the Company determined that one of its manufacturing sites was considered to be assets held for sale, since the asset group is currently being marketed for sale and all the criteria to be classified as held for sale under Accounting Standards Codification (“ASC”) 360, Property, Plant and Equipment—Impairment or Disposal of Long-Lived Assets, have been met. The related buildings and its content were vacated and the Company no
F-14
Table of Contents
WEBER-STEPHEN PRODUCTS LLC
Notes to Consolidated Financial Statements (continued)
(All Amounts in Thousands of U.S. Dollars Unless Otherwise Indicated)
longer required these assets for its future operations. The carrying value of these assets was $8,297 as of September 30, 2020. Assets held for sale are measured at the lower of their carrying value or the fair value less cost to sell. The Company estimated fair value by obtaining third-party broker valuations and determined that the fair value of this asset group exceeds its carrying value.
Goodwill and Other Intangibles
Finite-lived intangible assets, which primarily consist of trademarks, customer lists and patents, are stated at historical cost and amortized using the straight-line method (which reflects the pattern of how the assets’ economic benefits are consumed) over the assets’ estimated useful lives which range from 15 to 20 years for trademarks and customers lists, and 10 to 14 years for patents.
The Company performs reviews for impairment of intangible assets subject to amortization whenever adverse events or circumstances indicate that the carrying value of an asset may not be recoverable. Important factors that may trigger an impairment review include but are not limited to:
| • | significant underperformance relative to expected historical or projected future operating results; |
| • | significant changes in the manner of use of the acquired assets or the strategy for the overall business; |
| • | significant negative industry or economic trends; and |
| • | significant decline in the Company’s estimated enterprise value relative to carrying value. |
When indicators of impairment are present, the Company evaluates the carrying value of the intangible assets subject to amortization in relation to the operating performance and future undiscounted cash flows of the underlying assets. The Company adjusts the net book value of the intangible assets subject to amortization to fair value if the sum of the expected future cash flows is less than book value.
The Company evaluates indefinite-lived intangible assets and goodwill for possible impairment at least annually or whenever events or changes in circumstances indicate that the carrying amount of such assets may not be recoverable.
An intangible asset with an indefinite life (a major trademark) is evaluated for possible impairment by first making a qualitative evaluation about the likelihood of impairment to determine whether it should then calculate the fair value of the asset compared to the carrying value.
Goodwill is recorded when the purchase price paid for an acquisition exceeds the estimated fair value of the net identified tangible and intangible assets acquired. The Company performs an annual impairment review of goodwill on July 1 each fiscal year, or more frequently if indicators of potential impairment of its goodwill exist, to determine whether the carrying value of the recorded goodwill is impaired. When assessing goodwill for impairment, the Company considers (i) the amount of excess fair value over the carrying value of each reporting unit, (ii) the period of time since a reporting unit’s last quantitative test and (iii) other factors to determine whether or not to first perform a qualitative test. When performing a qualitative test, the Company assesses numerous factors to determine whether it is
F-15
Table of Contents
WEBER-STEPHEN PRODUCTS LLC
Notes to Consolidated Financial Statements (continued)
(All Amounts in Thousands of U.S. Dollars Unless Otherwise Indicated)
more likely than not that the fair value of its reporting units are less than their respective carrying values. Examples of qualitative factors that the Company assesses include its financial performance, market and competitive factors in its industry and other events specific to its reporting units. If the Company concludes that it is more likely than not that the fair value of a reporting unit is less than its carrying value, the Company performs a quantitative impairment test by comparing reporting unit carrying values to estimated fair values. See Note 2 for further information.
Warranty
The Company offers warranties on most of its products. The specific terms and conditions of the warranties offered by the Company vary depending upon the product sold. The Company estimates the costs that may be incurred under its warranty plans and the period for which claims are honored, and records a liability in the amount of such costs at the time product revenue is recognized. Factors that affect the Company’s warranty liability include the number of units sold, the type of products sold, historical and anticipated rates of warranty claims and cost per claim. The Company periodically assesses the adequacy of its recorded warranty liabilities and adjusts the amounts as necessary.
Deferred Financing Costs
Deferred financing costs are amortized over the term of the related debt. The carrying value of the deferred financing costs was $7,474, $7,124 and $7,422 as of September 30, 2018, 2019 and 2020, respectively. Deferred financing costs related to long-term debt are reflected as a direct reduction of the carrying value of the related debt. Amortization expense of deferred financing costs was $1,750, $2,022 and $2,935 for the fiscal years ended September 30, 2018, 2019 and 2020, respectively, and was recorded in Interest expense.
Foreign Currency Transactions and Translation
Gains or losses on foreign currency transactions during the fiscal year have been included in the accompanying consolidated statements of income. The functional currencies of the Company’s foreign subsidiaries are primarily the respective local currencies. Accordingly, assets and liabilities of foreign affiliates are translated at current exchange rates, and operations accounts are translated at the average rates during the period. Related translation adjustments are reported as a component of comprehensive income.
Income Taxes
In the U.S., the Company, a limited liability company (LLC), is taxed as a partnership under the Internal Revenue Code. The Company’s income is included in the members’ income tax returns. Accordingly, the Company generally is not subject to federal or certain state income taxes. The Company has operations that are subject to income and other similar taxes in foreign countries. A valuation allowance is provided to offset deferred tax assets if, based on available evidence, it is more likely than not that some or all of the deferred tax assets will not be realized.
In accordance with ASC 740, Income Taxes, the Company evaluated the technical merits of its income tax positions and has established income tax reserves for uncertain tax positions for the fiscal years ended September 30, 2018, 2019 and 2020. See Note 8 for further information.
F-16
Table of Contents
WEBER-STEPHEN PRODUCTS LLC
Notes to Consolidated Financial Statements (continued)
(All Amounts in Thousands of U.S. Dollars Unless Otherwise Indicated)
The Company’s practice is to recognize interest and penalties related to income tax matters in Income taxes in the accompanying consolidated statements of income. For the fiscal years ended September 30, 2018, 2019 and 2020, there were no significant interest or penalties related to uncertain income tax positions that were recognized in the accompanying consolidated statements of income.
Derivative Instruments
During the fiscal years ended September 30, 2018, 2019 and 2020, the Company used interest rate swap contracts to reduce its exposure to fluctuations in interest rates. During the fiscal years ended September 30, 2019 and 2020, the Company also entered into foreign currency forward contracts to reduce its exposure to fluctuations in foreign currency denominated sales and the respective cash flows impacting Gross profit. When entered into, these financial instruments are designated as cash flow hedges of underlying exposures.
During the fiscal year ended September 30, 2020, the Company entered into commodity index contracts to reduce its exposure to fluctuations in cash flows relating to the purchases of aluminum and steel-based components and raw materials impacting Gross profit.
Cash flows related to the settlement of derivative instruments designated as cash flow hedges are classified within operating activities. Changes in the fair value of a derivative that is designated as a cash flow hedge, to the extent that the hedge is effective, are recorded in accumulated other comprehensive income/(loss) and reclassified to earnings when the hedged item affects earnings.
Using derivative instruments means assuming counterparty credit risk. Counterparty credit risk relates to the loss the Company could incur if a counterparty were to default on a derivative contract. The Company deals with only investment-grade counterparties and monitors the overall credit risk and exposure to individual counterparties. The Company did not experience any nonperformance by a counterparty during the fiscal years ended September 30, 2018, 2019 or 2020. The Company did not require, nor did it post, collateral or security on such contracts.
See Note 7 for further information.
Income (Loss) Per Unit
Basic income (loss) per unit is computed using the weighted-average number of outstanding common units during the period. Diluted income (loss) per unit is computed using the weighted-average number of outstanding common units and, when dilutive, potential common units outstanding during the period. For purposes of the diluted net income (loss) per unit calculation, common units issued in exchange for notes receivable with limited recourse provisions are considered to be potentially dilutive securities. See Note 17 for further information. Basic and diluted net income (loss) per unit attributable to common members is presented in conformity with the two-class method required for participating securities as vested awards under the Management Incentive Compensation Plan are considered to be participating securities. The two-class method determines net income (loss) per unit for common and participating securities according to dividends declared or accumulated and participation rights in undistributed income (loss). The two-class method requires income (loss) available to common members for the period to be allocated between common and participating securities based upon their respective rights to share in undistributed income (loss) as if all income (loss) for the period had been distributed.
F-17
Table of Contents
WEBER-STEPHEN PRODUCTS LLC
Notes to Consolidated Financial Statements (continued)
(All Amounts in Thousands of U.S. Dollars Unless Otherwise Indicated)
Advertising Costs
The Company expenses advertising costs upon the first display of the advertisement and includes advertising expenses in Selling, general and administrative expenses in our consolidated statements of income. The Company incurred advertising expenses of $60,532, $53,774 and $68,726 for the fiscal years ended September 30, 2018, 2019 and 2020, respectively.
Research and Development Costs
Research and development costs are charged to expense as incurred and included in Selling, general and administrative expenses in our consolidated statements of income. The Company incurred research and development expenses of $11,586, $12,557 and $18,249 for the fiscal years ended September 30, 2018, 2019 and 2020, respectively.
New Accounting Pronouncements Recently Adopted
In February 2016, the FASB issued ASU 2016-02, Leases (Topic 842), which requires lessees to recognize a right-of-use asset and lease liability for virtually all leases (except short-term leases that have a duration of 12 months or less). The new standard also requires increased disclosures to help financial statement users better understand the amount, timing, and uncertainty of cash flows arising from leases. Subsequently, the FASB has issued various ASUs to provide further clarification around certain aspects of ASC 842, Leases. Effective October 1, 2019, the Company adopted ASU 2016-02 using the optional transition method of applying the new lease standard and have recognized right-of-use assets, lease liabilities, and any cumulative-effect adjustments to the opening balance of retained earnings as of the effective date. Prior period amounts were not adjusted and will continue to be reported under the accounting standards in effect for those periods.
Upon adoption of the new standard on October 1, 2019, the Company elected the package of practical expedients provided under the guidance. The practical expedient package applies to leases commenced prior to adoption of the new standard and permits companies not to reassess prior conclusions about whether existing or expired contracts are or contain a lease, the lease classification, and any initial direct costs for any existing leases. The Company has elected to combine the lease and non-lease components within the contract for all asset classes. Therefore, all fixed payments associated with the lease are included in the right-of-use asset and the lease liability. The Company has elected to exclude leases with a lease term of 12 months or less from the consolidated balance sheet recognition requirements of ASC 842. No right-of-use asset or lease liability will be recognized for these short-term leases. See Note 4 for more information.
The adoption of the new standard had a material impact to our consolidated balance sheet due to the capitalization of right-of-use assets and lease liabilities associated with our current operating leases in which the Company is the lessee. Adoption of the new standard resulted in the recording of additional lease assets and lease liabilities of $50,271 and $51,072, respectively, with the difference between the right-of-use asset and the lease liabilities primarily due to the existing deferred rent liability balance as of the adoption date. The adoption of the new standard did not have a material impact on the consolidated statement of income, on the consolidated statement of comprehensive income, on the consolidated statement of changes in members’ equity (deficit) or on the consolidated statement of cash flows for the year ended September 30, 2020, compared to what would have been reported in accordance with ASC 840.
F-18
Table of Contents
WEBER-STEPHEN PRODUCTS LLC
Notes to Consolidated Financial Statements (continued)
(All Amounts in Thousands of U.S. Dollars Unless Otherwise Indicated)
Prior to the adoption of ASC 842, as a result of the Company’s involvement during the construction period of the United States Distribution Facility, whereby the Company had certain indemnification obligations related to the construction, the Company was considered, for accounting purposes only, the owner of the construction project under build-to-suit lease accounting and accordingly, the Company accounted for the United States Distribution Facility as a financing arrangement. As of September 30, 2019, $30,695 of the build-to-suit lease asset and $33,177 of the financing obligation was included on the consolidated balance sheets. Upon the adoption of ASC 842, this lease was classified as an operating lease, where the Company derecognized its build-to-suit asset and related liabilities, and recognized an operating right-of-use asset and lease liability. See Note 4 for further information.
In May 2014, the FASB issued ASU 2014-09, Revenue from Contracts with Customers (Topic 606), which outlines a single comprehensive five-step model for entities to use in accounting for revenue arising from contracts with customers. This new standard also requires entities to disclose certain quantitative and qualitative information regarding the nature, amount, timing and uncertainty of qualifying revenue and cash flows from customers. This update was effective for the Company’s reporting periods beginning after December 15, 2018. Entities have the option of using a full retrospective or a modified retrospective approach to adopt the new standard. The Company adopted the standard as of October 1, 2018 using a modified retrospective approach. The Company evaluated its contracts with customers in accordance with the five-step model and determined the adoption of this standard did not have a material impact on the Company’s consolidated financial statements for its fiscal year 2019.
For periods prior to adoption, revenue was realized or realizable and earned when (a) persuasive evidence of an arrangement existed, (b) shipment had occurred, (c) the seller’s price to the buyer was fixed and determinable, and (d) collectability was reasonably assured. Provisions for certain rebates and sales incentives are provided for as reductions in determining net revenues in the same period the related revenues are recorded.
In August 2017, the FASB issued ASU 2017-12, Derivatives and Hedging (Topic 815), Targeted Improvements to Accounting for Hedging Activities. The new guidance amends the hedge accounting model in ASC 815 to better portray the economic results of an entity’s risk management activities in its financial statements and simplifies the application of hedge accounting in certain situations. The ASU eliminates the requirement to separately measure and report hedge ineffectiveness. The Company early adopted this ASU effective October 1, 2017. The adoption of this ASU did not have a material impact on our consolidated financial statements.
In January 2017, the FASB issued ASU 2017-04, Intangibles—Goodwill and Other (Topic 350): Simplifying the Test for Goodwill Impairment. ASU 2017-04 simplifies the goodwill impairment test, eliminating the requirement for an entity to determine the fair value of its assets and liabilities at the impairment testing date following the procedure that would be required in determining the fair value of assets acquired and liabilities assumed in a business combination. Instead, an entity will be required to perform its annual, or interim, goodwill impairment test by comparing the fair value of a reporting unit with its carrying amount. An entity will be required to recognize an impairment charge for the amount by which the carrying amount exceeds the reporting unit’s fair value; however, the loss recognized should not exceed the total amount of goodwill allocated to the reporting unit. The Company early adopted this ASU effective October 1, 2018. The adoption of this ASU did not have a material impact on our consolidated financial statements.
F-19
Table of Contents
WEBER-STEPHEN PRODUCTS LLC
Notes to Consolidated Financial Statements (continued)
(All Amounts in Thousands of U.S. Dollars Unless Otherwise Indicated)
In March 2020, the FASB issued ASU 2020-04, “Reference Rate Reform (Topic 848): Facilitation of the Effects of Reference Rate Reform on Financial Reporting”. This ASU provides temporary optional expedients and exceptions to the GAAP guidance on contract modifications and hedge accounting to ease the financial reporting burdens related to the expected market transition from the London Interbank Offered Rate (“LIBOR”) and other interbank offered rates to alternative reference rates. This ASU is effective for all entities beginning as of its date of effectiveness, March 12, 2020. The guidance is temporary and can be applied through December 31, 2022. The guidance has not impacted the consolidated financial statements to date. The Company will continue to monitor the impact of the ASU on our consolidated financial statements in the future.
New Accounting Pronouncements Issued but Not Yet Adopted
In June 2016, the FASB issued ASU 2016-13, Financial Instruments—Credit Losses (Topic 326): Measurement of Credit Losses on Financial Instruments, which will require entities to measure all expected credit losses for financial instruments held at the reporting date based on historical experience, current conditions and reasonable supportable forecasts. This replaces the existing incurred loss model and is applicable to the measurement of credit losses on financial instruments measured at amortized cost and also applies to some off-balance sheet credit exposures. The ASU is effective for annual and interim reporting periods beginning after December 15, 2019, with early adoption permitted. The Company is currently evaluating the impact of implementation of this ASU on our consolidated financial statements.
In August 2018, the FASB issued ASU 2018-15, Customer’s Accounting for Implementation Costs Incurred in a Cloud Computing Arrangement that is a Service Contract. ASU 2018-15 requires implementation costs incurred by customers in cloud computing arrangements to be deferred over the noncancelable term of the cloud-computing arrangements plus any optional renewal periods (1) that are reasonably certain to be exercised by the customer or (2) for which exercise of the renewal option is controlled by the cloud service provider. The effective date of this pronouncement for public entities is for fiscal years beginning after December 15, 2019, and interim periods within those fiscal years. For all other entities, including emerging growth companies, the standard is effective for years beginning after December 15, 2020, and interim periods within annual periods beginning after December 15, 2021. Early adoption is permitted. The standard can be adopted either using the prospective or retrospective transition approach. The Company is currently evaluating the impact of implementation of this ASU on our consolidated financial statements.
F-20
Table of Contents
WEBER-STEPHEN PRODUCTS LLC
Notes to Consolidated Financial Statements (continued)
(All Amounts in Thousands of U.S. Dollars Unless Otherwise Indicated)
2. Goodwill and Other Intangibles
The Company’s goodwill consists of the following:
| Americas | EMEA | APAC | Corporate/Other | Total | ||||||||||||||||
| Balance as of September 30, 2018 |
$ | 19,219 | $ | 10,615 | $ | 635 | $ | 12,568 | $ | 43,037 | ||||||||||
| Impairment |
— | — | — | (12,568 | ) | (12,568 | ) | |||||||||||||
| Foreign exchange and other adjustments |
— | (644 | ) | (42 | ) | — | (686 | ) | ||||||||||||
|
|
|
|
|
|
|
|
|
|
|
|||||||||||
| Balance as of September 30, 2019 |
$ | 19,219 | $ | 9,971 | $ | 593 | — | 29,783 | ||||||||||||
| Foreign exchange and other adjustments |
— | 751 | 36 | — | 787 | |||||||||||||||
|
|
|
|
|
|
|
|
|
|
|
|||||||||||
| Balance as of September 30, 2020 |
$ | 19,219 | $ | 10,722 | $ | 629 | $ | — | $ | 30,570 | ||||||||||
|
|
|
|
|
|
|
|
|
|
|
|||||||||||
| Accumulated impairment losses |
$ | — | $ | — | $ | — | $ | (12,568 | ) | $ | (12,568 | ) | ||||||||
|
|
|
|
|
|
|
|
|
|
|
|||||||||||
As part of its annual goodwill impairment test for the fiscal year ended September 30, 2019, the Company identified indicators of impairment related to its iGrill reporting unit. The Company performed a quantitative impairment test utilizing a discounted cash flow method to estimate the fair value of the iGrill reporting unit and compared this fair value to the reporting unit’s carrying value. The most significant estimates and assumptions inherent in the preparation of the discounted cash flow model were the enterprise value based on the estimate of future net cash flows the reporting unit was expected to generate over a forecasted period, and an estimate of the present value of cash flows beyond that period, which is referred to as the terminal value. The Company estimated future sales growth using a number of critical factors, including among others, our nature and our history, financial and economic conditions affecting us, our industry and the general company, past results and our current operations and future prospects. Forecasts of future operations were based, in part, on operating results and expectations as to future market conditions.
The fair value was less than the carrying value of the iGrill reporting unit, and as a result, the Company recognized a non-cash impairment loss of $12,568 on the iGrill goodwill. Subsequent to the impairment, no goodwill remained in the iGrill reporting unit. No impairment was noted on all other intangible assets related to the iGrill reporting unit. Post impairment, the Company no longer views iGrill as a separate reporting unit. The corresponding goodwill and impairment are included within the Corporate/Other category for illustrative purposes.
During the fiscal year ended September 30, 2020, the Company performed a qualitative assessment of its goodwill and indefinite-lived intangible assets and noted no impairment. The Company did not identify any indicators of impairment for other intangible assets subject to amortization during the fiscal year ended September 30, 2020.
F-21
Table of Contents
WEBER-STEPHEN PRODUCTS LLC
Notes to Consolidated Financial Statements (continued)
(All Amounts in Thousands of U.S. Dollars Unless Otherwise Indicated)
The Company’s intangible assets consist of the following:
| September 30, 2019 | ||||||||||||
| Gross Carrying Amount |
Accumulated Amortization |
Net Book Value |
||||||||||
| Trademark—Weber |
$ | 310,000 | $ | — | $ | 310,000 | ||||||
| Trademarks—Other |
38,900 | (2,398 | ) | 36,502 | ||||||||
|
|
|
|
|
|
|
|||||||
| Trademarks, net |
348,900 | (2,398 | ) | 346,502 | ||||||||
| Customer lists |
89,392 | (40,888 | ) | 48,504 | ||||||||
| Patents |
49,428 | (41,299 | ) | 8,129 | ||||||||
| Internally developed software |
5,700 | (5,225 | ) | 475 | ||||||||
| In-process research and development |
4,500 | (1,200 | ) | 3,300 | ||||||||
| Non-compete agreement |
600 | (440 | ) | 160 | ||||||||
|
|
|
|
|
|
|
|||||||
| Other intangible assets, net |
149,620 | (89,052 | ) | 60,568 | ||||||||
|
|
|
|
|
|
|
|||||||
| Total |
$ | 498,520 | $ | (91,450 | ) | $ | 407,070 | |||||
|
|
|
|
|
|
|
|||||||
| September 30, 2020 | ||||||||||||
| Gross Carrying Amount |
Accumulated Amortization |
Net Book Value |
||||||||||
| Trademark—Weber |
$ | 310,000 | $ | — | $ | 310,000 | ||||||
| Trademarks—Other |
38,900 | (4,935 | ) | 33,965 | ||||||||
|
|
|
|
|
|
|
|||||||
| Trademarks, net |
348,900 | (4,935 | ) | 343,965 | ||||||||
| Customer lists |
91,388 | (45,684 | ) | 45,704 | ||||||||
| Patents |
49,428 | (46,156 | ) | 3,272 | ||||||||
| Internally developed software |
5,700 | (5,700 | ) | — | ||||||||
| In-process research and development |
4,500 | (1,650 | ) | 2,850 | ||||||||
| Non-compete agreement |
600 | (560 | ) | 40 | ||||||||
|
|
|
|
|
|
|
|||||||
| Other intangible assets, net |
151,616 | (99,750 | ) | 51,866 | ||||||||
|
|
|
|
|
|
|
|||||||
| Total |
$ | 500,516 | $ | (104,685 | ) | $ | 395,831 | |||||
|
|
|
|
|
|
|
|||||||
During 2019, the Company acquired all rights to the trademark and intellectual property related to the Q Grill, originally licensed by the Company under previously issued license arrangements, in exchange for consideration of $35,500. The Company recorded an intangible asset for the acquisition of this trademark, and all license and royalty arrangements previously entered into were terminated upon execution of this arrangement. Payments for the acquired trademark were made in two installments, with the first payment of $17,500 made during the fiscal year ended September 30, 2019 and the second payment of $18,000 made during the fiscal year ended September 30, 2020. The Company began amortizing this asset after the execution of the agreement on a straight-line basis using an estimated useful life of 15 years.
The Company’s indefinite-lived intangible assets consist of Trademark—Weber.
F-22
Table of Contents
WEBER-STEPHEN PRODUCTS LLC
Notes to Consolidated Financial Statements (continued)
(All Amounts in Thousands of U.S. Dollars Unless Otherwise Indicated)
As of September 30, 2020, the remaining weighted-average amortization periods of the intangible assets subject to amortization are as follows:
| Weighted- Average Years |
||||
| Trademarks—Other |
13.5 | |||
| Customer lists |
10.2 | |||
| Patents |
0.8 | |||
| In-process research and development |
6.3 | |||
| Non-compete agreement |
0.3 | |||
The Company expects to record the following amortization expense on intangible assets for each of the next five years and thereafter:
| 2021 |
$ | 9,057 | ||
| 2022 |
8,040 | |||
| 2023 |
8,035 | |||
| 2024 |
8,030 | |||
| 2025 |
8,030 | |||
| Thereafter |
44,639 | |||
|
|
|
|||
| Total |
$ | 85,831 | ||
|
|
|
Total amortization expense for the Company’s intangible assets was $11,786, $13,586 and $13,235 for the fiscal years ended September 30, 2018, 2019 and 2020, respectively.
3. Property, Equipment and Leasehold Improvements
Property, equipment and leasehold improvements, net consists of the following:
| September 30, | ||||||||
| 2019 | 2020 | |||||||
| Land |
$ | 12,498 | $ | 12,530 | ||||
| Buildings |
89,000 | 52,985 | ||||||
| Computer equipment and software |
55,973 | 66,166 | ||||||
| Equipment |
207,413 | 209,033 | ||||||
| Leasehold improvements |
16,211 | 17,264 | ||||||
|
Construction-in-progress |
4,841 | 8,075 | ||||||
|
|
|
|
|
|||||
| 385,936 | 366,053 | |||||||
| Accumulated depreciation and amortization |
(238,608 | ) | (257,801 | ) | ||||
|
|
|
|
|
|||||
| Total |
$ | 147,328 | $ | 108,252 | ||||
|
|
|
|
|
|||||
Depreciation and amortization expense amounted to $36,831, $32,731 and $29,112 for the fiscal years ended September 30, 2018, 2019 and 2020, respectively.
4. Leases
The Company has various operating lease agreements related to machinery and equipment, vehicles, IT assets, office equipment, real estate, and other assets with terms of up to 18 years,
F-23
Table of Contents
WEBER-STEPHEN PRODUCTS LLC
Notes to Consolidated Financial Statements (continued)
(All Amounts in Thousands of U.S. Dollars Unless Otherwise Indicated)
inclusive of renewal options the Company is reasonably certain of exercising. The Company does not have any finance leases. Operating lease right-of-use assets and operating lease liabilities are recognized based on the present value of the future lease payments over the lease term. The operating lease right-of-use asset also reflects accrued and prepaid lease expense resulting from the straight-line accounting under prior accounting methods, which is now being amortized over the remaining life of the lease.
Our lease payments are largely fixed. Variable lease payments exist in circumstances such as our payments for a proportionate share of real estate taxes, insurance, common area maintenance, and other operating costs. Variable lease payments are expensed as incurred. Some of our leases include options to extend the lease term. If the Company is reasonably certain to exercise an option to extend a lease, the extension period is included as part of the right-of-use asset and the lease liability. Some of our leases include an option to early terminate the lease. Our leases with an early termination option generally involve a termination payment and therefore the Company is not reasonably certain to terminate them early. As such, our lease term generally does not reflect early termination of our leases. Our leases do not contain any material residual value guarantees or restrictive restrictions or covenants that restrict us from incurring other financial obligations.
At the inception of our contracts the Company determines if the contract is or contains a lease. A contract is or contains a lease if it conveys the right to control the use of an identified asset for a period of time in exchange for consideration. The discount rate for leases is based on our secured incremental borrowing rate since the rate implicit in the lease is not readily determinable. The Company has a significant lease that has not yet commenced. See European Manufacturing Facility discussion below.
The Company participated in lease transactions with related parties. See Note 11 for further information.
The following table presents supplemental balance sheet information:
| Supplemental balance sheet information |
Classification |
September 30, 2020 |
||||
| Operating lease right-of-use assets |
Operating lease right-of-use assets | $ | 48,937 | |||
| Current operating lease liabilities |
Accrued expenses | $ | 11,741 | |||
| Non-current operating lease liabilities |
Non-current operating lease liabilities | $ | 37,986 | |||
The following table presents lease cost:
| Lease cost |
Classification |
Fiscal Year Ended September 30, 2020 |
||||
| Operating lease cost |
Selling, general and administrative | $ | 12,739 | |||
| Operating lease cost |
Cost of goods sold | $ | 1,138 | |||
| Short-term lease cost |
Selling, general and administrative | $ | 476 | |||
| Variable lease cost |
Selling, general and administrative | $ | 3,232 | |||
|
|
|
|||||
| Total lease costs |
$ | 17,585 | ||||
F-24
Table of Contents
WEBER-STEPHEN PRODUCTS LLC
Notes to Consolidated Financial Statements (continued)
(All Amounts in Thousands of U.S. Dollars Unless Otherwise Indicated)
For the fiscal year ended September 30, 2020, cash payments for operating leases were $14,453 and the non-cash portion of operating lease expense was $13,877.
The following table presents lease terms and discount rates:
| September 30, 2020 | ||
| Weighted average remaining lease term |
5.2 years | |
| Weighted average discount rates |
3.46% |
At September 30, 2020, future lease payments under operating leases and leases with related parties were as follows:
| Maturity of Lease Liabilities |
||||
| 2021 |
$ | 13,267 | ||
| 2022 |
11,482 | |||
| 2023 |
8,808 | |||
| 2024 |
7,914 | |||
| 2025 |
5,876 | |||
| After 2025 |
7,294 | |||
|
|
|
|||
| Total lease payments |
54,641 | |||
| Less: Effect of discounting to net present value |
4,914 | |||
|
|
|
|||
| Present value of lease liabilities |
$ | 49,727 | ||
|
|
|
|||
The following table presents supplemental cash flow information related to our leases:
| Supplemental Cash Flow |
September 30, 2020 | |||
| Right-of-use assets obtained in exchange for new operating lease liabilities: |
$ | 9,146 | ||
Sale-Leaseback Assets and Liabilities
Sale-leasebacks are assessed to determine whether a sale has occurred under ASC 606. If a sale is determined not to have occurred, the underlying “sold” assets are not derecognized and a financing liability is established in the amount of cash received. At such time that the lease expires, the assets are then derecognized along with the financing liability, with a gain or loss recognized on disposal for the difference between the two amounts, if any.
F-25
Table of Contents
WEBER-STEPHEN PRODUCTS LLC
Notes to Consolidated Financial Statements (continued)
(All Amounts in Thousands of U.S. Dollars Unless Otherwise Indicated)
The assets and liabilities relating to sale-leaseback transactions are as follows:
| September 30, 2019 |
September 30, 2020 |
|||||||
| U.S. Distribution Facility |
U.S. Manufacturing Facility |
|||||||
| Land |
$ | — | $ | 1,580 | ||||
| Buildings |
41,187 | 29,464 | ||||||
| Accumulated depreciation |
(7,045 | ) | (8,091 | ) | ||||
|
|
|
|
|
|||||
| Carrying value of net assets |
$ | 34,142 | $ | 22,953 | ||||
|
|
|
|
|
|||||
| Current portion of financing obligation |
$ | 2,700 | $ | 514 | ||||
| Long-term financing obligation |
23,807 | 38,986 | ||||||
|
|
|
|
|
|||||
| Total financing obligation |
$ | 26,507 | $ | 39,500 | ||||
|
|
|
|
|
|||||
U.S. Distribution Facility
During the fiscal year ended September 30, 2014, the Company entered into a lease agreement for a distribution facility, which was constructed by the landlord during the fiscal years ended September 30, 2014 and 2015. Lease payments commenced during the fiscal year ended September 30, 2015 when the Company took occupancy of the building.
The lease term is 12 years and started on the commencement date, which was defined as 90 days subsequent to the substantial completion of the facility. The annual cash rental payments due under the lease agreement in the first year were $2,853 and increase each year by approximately 2.25% through the end of the lease term. This lease also requires the Company to pay real estate taxes and maintenance costs on the facility. In addition, the Company has an option to extend the lease term for two additional periods of five years each, with annual cash rental payments increasing by 2.25% through the end of the extension periods. The Company also has an option to purchase the facility and land from the landlord during the lease term. The purchase price would be based on a fair market value as defined in the lease, with a minimum purchase price requirement of $69.00 per square foot.
As part of the lease agreement, the Company has agreed to indemnify and hold the landlord and its agents harmless from and against any claims or damages resulting from any act or willful misconduct of the Company or its agents on the leased premises, excluding acts or injury caused directly by the negligence or willful misconduct of the landlord or its agents. In accordance with ASC 840, as the Company has provided indemnities to parties other than only the landlord, the Company is considered the owner of the building.
During the fiscal year ended September 30, 2015, the building was completed by the landlord and, upon completion, the Company concluded that the lease did not qualify for sale-leaseback treatment. As a result, the Company capitalized the remaining cost of the building at its completion for a total cost of $37,740 and recorded a corresponding liability as a Long-term financing obligation. The Company also capitalized $3,447 for certain improvements to the building paid for by the Company.
F-26
Table of Contents
WEBER-STEPHEN PRODUCTS LLC
Notes to Consolidated Financial Statements (continued)
(All Amounts in Thousands of U.S. Dollars Unless Otherwise Indicated)
Upon transition to ASC 842, the Company derecognized existing assets and liabilities that were recognized solely as a result of being deemed the accounting owner of the asset under construction under the build to suit guidance in ASC 840. Accordingly, the Company derecognized construction assets of $30,695 and financing obligations of $33,177. The Company recorded an operating right-of-use asset of $21,624 and an operating lease liability of $22,090 upon transition.
U.S. Manufacturing Facility
On September 30, 2020, the Company entered into a sale-leaseback transaction with a third party, whereby the Company sold its U.S. Manufacturing Facility for proceeds of $39,500. As of September 30, 2020, the land and building had a net carrying value of $22,953. The Company leased the facility for a term of 15 years with options to extend the lease for four additional periods of five years each. The annual cash rental payments due under the lease agreement in the first year are $2,332 and increase each year by 2.25% through the end of the lease term.
Under the provisions of ASC 842, Leases, the Company determined that indicators of control transfer were not met, as the Company has an option to renew the lease for substantially all of the remaining economic life of the facility, and as such, the sale of the facility does not qualify for sale-leaseback treatment. The Company further determined that the land would have been classified as a finance lease, and as such also did not transfer control. The Company accounted for the sale of the facility and land as a failed sale in accordance with ASC 842, accounting for the transaction as a financing arrangement. The financing method resulted in the cash proceeds of $39,500 being offset by a financing obligation liability. The Company allocates the lease payments as amortization of the financing obligation. The assets sold were recorded in Property, equipment and leasehold improvements, net with continued depreciation over their estimated useful life.
Europe Manufacturing Facility
During the fiscal year ended September 30, 2020, the Company acquired land in Poland for $6,002 as part of plans to develop a manufacturing facility in Europe. The land acquisition included a commitment to the municipality to spend approximately $30,256 in the form of capital investment. The Company subsequently sold the land and entered into a lease agreement with the owner of the land (landlord), who committed to build a manufacturing facility on the property for the Company’s use. The construction and development of the facility by the landlord is anticipated to satisfy the commitment to the municipality upon completion, which is expected to be in the fiscal year ended September 30, 2021. The sale of the land qualified as a successful sale and leaseback, as the Company successfully transferred control to the landlord at the time of sale. The Company further determined that the Company does not control the asset under construction, and is therefore not deemed the accounting owner of the asset under construction.
The lease term is 15 years and will commence upon completion of the facility, which is expected during the fiscal year ended September 30, 2021. Upon commencement, the Company will record a right-of-use asset and a lease liability. In addition, the Company has options to extend the lease term for five-year periods as allowed by local laws and regulatory requirements. The annual cash rental payments due under the lease agreement in the first year will be $2,424 and will increase each year by the increase in the Harmonized Index of Consumer Prices or 1.25%, whichever is lower, through the end of the lease term. This lease also requires the Company to pay real estate taxes and maintenance
F-27
Table of Contents
WEBER-STEPHEN PRODUCTS LLC
Notes to Consolidated Financial Statements (continued)
(All Amounts in Thousands of U.S. Dollars Unless Otherwise Indicated)
costs on the facility. No lease payments were made to the landlord during the fiscal year ended September 30, 2020.
Disclosures Related to Periods Prior to Adoption of ASC 842
The following table presents future minimum lease payment obligations under our non-cancelable operating leases and leases with related parties (See Note 11) as of September 30, 2019, prior to the adoption of ASC 842:
| 2019 | ||||
| 2020 |
$ | 11,255 | ||
| 2021 |
8,808 | |||
| 2022 |
5,705 | |||
| 2023 |
3,427 | |||
| 2024 and thereafter |
6,795 | |||
|
|
|
|||
| Total |
$ | 35,990 | ||
|
|
|
|||
Rental expense for all operating leases was $11,881 and $12,410 for the fiscal years ended September 30, 2018 and 2019.
5. Investments
During the fiscal year ended September 30, 2019, the Company executed an agreement with June Life, Inc. (“June”), a smart appliance and technology company, to purchase $23,000 of June’s preferred stock and $1,269 of June’s common stock. The common stock investment represents 6% of the total outstanding common stock of June, and the total combined equity investment represents less than 20% of the voting interest in June.
The Company also entered into a license and development agreement with June to license certain software and other technology owned by June and adapt this technology to certain products of the Company. The license and development agreement includes provisions for the Company to pay June royalties at varying rates based on the quantities and type of product sold containing the licensed technology. As of September 30, 2019 and 2020, the Company had recorded prepaid royalties of $4,600 and $10,044, respectively. Upon the sale of products using the specified technology within the arrangement, the Company amortizes its prepaid royalty expenses into its operating results. Royalty expense of $0 and $1,291 was recognized under this agreement for the fiscal years ended September 30, 2019 and 2020, respectively.
The Company determined it had significant influence over June due to the substantial impact of the license and development agreement on June’s operating results and cash flows. As a result, the Company has accounted for the common stock investment in June as an equity method investment and records its share of June’s earnings or losses. The Company computed the difference between the fair value of June’s net assets and the carrying value of those net assets in June’s financial statements (“basis differences”). The basis differences primarily relate to the fair value of intangible assets. The basis differences are amortized over the remaining life of the assets or liabilities to which they relate and are recognized as an adjustment to the equity in earnings of June in the Company’s consolidated statements of income. As of September 30, 2019 and 2020, the Company recorded an equity method
F-28
Table of Contents
WEBER-STEPHEN PRODUCTS LLC
Notes to Consolidated Financial Statements (continued)
(All Amounts in Thousands of U.S. Dollars Unless Otherwise Indicated)
loss of $1,025 and $4,604, respectively with an offsetting reduction in its investment in June. The carrying value of the equity method investment in June was $243 and $0 as of September 30, 2019 and 2020, respectively, and is recorded in Other long-term assets. The Company has elected to apply the measurement alternative for the preferred stock investment as there is not a readily determinable fair value associated with the investment. In accordance with the alternative, the Company measures the investment at cost, less impairment, adjusted by observable price changes. In fiscal year 2020, a portion of the June equity method losses were allocated to the preferred stock investment as the cost basis in the common stock investment had been reduced to zero. The carrying value of the preferred stock investment in June was $23,000 and $18,639 as of September 30, 2019 and 2020, respectively, and is recorded in Other long-term assets.
6. Debt
Long-term debt consists of the following:
| September 30, | ||||||||
| 2019 | 2020 | |||||||
| Unsecured Term Loan with principal payments due on June 30 each year; interest at LIBOR plus 2.25%; final balance due on maturity date of December 20, 2022 |
$ | 652,500 | $ | 616,250 | ||||
| Less deferred financing costs |
(4,090 | ) | (4,341 | ) | ||||
| Less current portion |
(54,375 | ) | (36,250 | ) | ||||
|
|
|
|
|
|||||
| $ | 594,035 | $ | 575,659 | |||||
|
|
|
|
|
|||||
Aggregate maturities of long-term debt as of September 30, 2020, as amended, are as follows:
| 2021 |
$ | 36,250 | ||
| 2022 |
36,250 | |||
| 2023 |
543,750 | |||
|
|
|
|||
| Total |
$ | 616,250 | ||
|
|
|
The Company has a Senior Credit Facility (the “Senior Facility”) with a syndicate of financial institutions to allow for borrowings of up to $1,150,000 with a due date of December 20, 2022.
The Senior Facility includes an unsecured revolving credit facility, which provides for borrowings to a maximum commitment of $425,000. The revolving credit facility provides for up to $15,000 for the issuance of standby and commercial letters of credit, of which standby letters of credit of $575 and $6,053 are outstanding at September 30, 2019 and 2020, respectively. The revolving credit facility also provides for $10,000 for swingline loans and up to $50,000 for multicurrency borrowings that reduce the amount of available borrowings. Available borrowings under the revolving credit facility as of September 30, 2019 and 2020 were $247,725 and $418,947, respectively. Due to the seasonality of its business, the Company incurs borrowings on its revolving credit facility throughout the year, with the balance generally at its lowest levels at or near the Company’s fiscal year-end. The borrowings under the revolving credit facility peaked at $386,789 and $409,931 for the fiscal years ended September 30, 2019 and 2020, respectively. The borrowings outstanding under these facilities as of September 30, 2019 and 2020 were $176,700 and $0, respectively, and are included in Current portion of long-term
F-29
Table of Contents
WEBER-STEPHEN PRODUCTS LLC
Notes to Consolidated Financial Statements (continued)
(All Amounts in Thousands of U.S. Dollars Unless Otherwise Indicated)
debt and other borrowings. The weighted average interest rate related to the Company’s revolving credit facilities for the fiscal years ended September 30, 2018, 2019 and 2020 was 3.60%, 4.61% and 3.54%, respectively.
The Senior Facility also includes a $725,000 unsecured Term Loan. Principal payments on this Term Loan commenced on June 30, 2018, and are payable annually on June 30 at scheduled amounts, with the balance due at maturity. The Company paid financing fees of $5,157 in the fiscal year ended September 30, 2018 related to the Senior Facility. The balance of the unsecured Term Loan was $652,500 and $616,250 as of September 30, 2019 and 2020, respectively.
At the Company’s election, the Senior Facility interest rate will be based on either: (i) LIBOR for the relevant currency borrowed, plus an applicable margin; or (ii) a base determined by reference to the highest of: (a) the prime rate, (b) the federal funds effective rate plus 0.5%, or (c) the LIBOR applicable for an interest period of one month plus 1.0%, plus an applicable margin. Interest is payable on the last business day of March, June, September and December during the term of the agreement for floating rate borrowings or on the last business day of fixed rated borrowings of one, two, three or six month terms.
The Senior Facility contains certain restrictive covenants relating to, among other things, limitations on indebtedness, transactions with affiliates, sales of assets, acquisitions, and members’ distributions, in addition to certain financial covenants relating to average leverage ratio and interest coverage ratio. On April 8, 2019, the Senior Facility was amended to allow for repurchases of members’ interests and to modify certain financial covenants. On March 20, 2020, the Senior Facility was again amended to include pledging the Company’s U.S.-based assets, including its interests in significant foreign subsidiaries but excluding real estate, against the Senior Facility and to modify certain financial covenants. This amendment also included modifications to the maturity principal payment schedule.
The Company evaluated the amendments executed during the fiscal years ended September 30, 2019 and 2020 and determined that the debt qualified for modification accounting in accordance with ASC 470-50, Debt. Under modification accounting, the financing fees paid of $1,671 and $3,233 during the fiscal years ended September 30, 2019 and 2020, respectively, were recorded as deferred financing costs in the accompanying consolidated balance sheets and are amortized over the remaining life of the Senior Facility.
The Company also has uncommitted foreign currency revolver and overdraft facilities available for its European operations in the amounts of $49,055 and $52,749 as of September 30, 2019 and 2020, respectively. There were no borrowings outstanding under these facilities as of September 30, 2019 or 2020. These facilities are unsecured.
At September 30, 2020, the Company was in compliance with each of the financial covenants of the Senior Facility.
Interest paid for the fiscal years ended September 30, 2018, 2019 and 2020 amounted to $32,564, $39,988 and $43,095, respectively.
F-30
Table of Contents
WEBER-STEPHEN PRODUCTS LLC
Notes to Consolidated Financial Statements (continued)
(All Amounts in Thousands of U.S. Dollars Unless Otherwise Indicated)
7. Derivative Instruments
Interest Rate Swap Contracts
The Company purchases interest rate swap contracts to minimize the effect of fluctuating variable interest rates under the Senior Facility on Interest expense within its reported operating results. As cash flow hedges, the interest rate swaps are revalued at current market rates, with the changes in valuation reflected directly in Other comprehensive income (loss). The gains or losses on the interest rate swaps reported in Accumulated other comprehensive income (loss) in members’ equity are reclassified into Interest expense in the periods in which the monthly interest settlement is paid on the interest rate swap.
See Note 12 for further information.
The notional values of the Company’s outstanding interest rate swap contracts were as follows:
| September 30, | ||||||||
| 2019 | 2020 | |||||||
| Interest rate swap contracts |
$ | 410,000 | $ | 410,000 | ||||
Foreign Currency Forward Contracts
The Company enters into foreign currency forward contracts to minimize the effect of fluctuating variable foreign currency denominated cash flows impacting gross profit within its reported operating results. As cash flow hedges, the forward contracts are revalued at current foreign exchange rates with the changes in the valuation reflected directly in Accumulated other comprehensive income (loss). The gains or losses on the forward contracts reported in Accumulated other comprehensive income (loss) in members’ equity are reclassified into Cost of goods sold in the period or periods in which the foreign currency denominated sale of inventory is made to a third party.
The notional values of the Company’s outstanding foreign currency forward contracts were as follows:
| September 30, | ||||||||
| 2019 | 2020 | |||||||
| Foreign currency forward contracts |
$ | — | $ | 5,730 | ||||
See Note 12 for further information.
Cash Flow Hedges Impact on the Consolidated Statements of Comprehensive Income
| Gain (loss) recognized in other comprehensive income (loss) was: |
Fiscal Years Ended September 30, | |||||||||||
| 2018 | 2019 | 2020 | ||||||||||
| Interest rate swap contracts |
$ | 6,154 | $ | (30,690 | ) | $ | (20,490 | ) | ||||
| Foreign currency forward contracts |
— | 183 | (189 | ) | ||||||||
|
|
|
|
|
|
|
|||||||
| Total gain (loss) recognized in statements of comprehensive income |
$ | 6,154 | $ | (30,507 | ) | $ | (20,679 | ) | ||||
|
|
|
|
|
|
|
|||||||
F-31
Table of Contents
WEBER-STEPHEN PRODUCTS LLC
Notes to Consolidated Financial Statements (continued)
(All Amounts in Thousands of U.S. Dollars Unless Otherwise Indicated)
Cash Flow Hedges Impact on the Consolidated Statements of Income
Gain (loss) reclassified from Accumulated other comprehensive income (loss) into the consolidated statements of income was:
| Fiscal Years Ended September 30, | ||||||||||||
| 2018 | 2019 | 2020 | ||||||||||
| Interest rate swap contracts |
$ | 205 | $ | 1,189 | $ | (4,347 | ) | |||||
| Foreign currency forward contracts |
— | 183 | (57 | ) | ||||||||
|
|
|
|
|
|
|
|||||||
| Total gain (loss) recognized in statements of income |
$ | 205 | $ | 1,372 | $ | (4,404 | ) | |||||
|
|
|
|
|
|
|
|||||||
Interest rate swap contracts and foreign currency forward contracts were reclassified from Accumulated other comprehensive income (loss) into interest expense and Cost of goods sold, respectively, in the consolidated statements of income.
As of September 30, 2020, the Company estimates that it will recognize approximately $10,107 of losses associated with the above contracts in net income within the next 12 months.
Commodity Index Contracts
The Company enters into commodity index contracts to minimize the effect of fluctuating variable costs relating to the purchases of aluminum and steel-based components and raw materials. The commodity index contracts are accounted for as financial instruments and the Company did not apply hedge accounting.
As financial instruments, the commodity index hedges are revalued at current commodity index rates with the changes in the valuation reflected directly in Cost of goods sold. The Company recorded a corresponding loss on the change in fair market value as follows:
| Fiscal Years Ended September 30, | ||||||||||||
| 2018 | 2019 | 2020 | ||||||||||
| Cost of goods sold |
$ | — | $ | — | $ | 101 | ||||||
See Note 12 for further information.
8. Income Taxes
The Company and a number of its subsidiaries are treated as flow-through entities for federal income tax purposes. The income or loss generated by these entities are not taxed at the LLC level. As required by U.S. tax law, income or loss generated by the LLC flows through to various partners of the LLC. As such, the Company’s income tax provision consists solely of the activities of its taxable subsidiaries.
F-32
Table of Contents
WEBER-STEPHEN PRODUCTS LLC
Notes to Consolidated Financial Statements (continued)
(All Amounts in Thousands of U.S. Dollars Unless Otherwise Indicated)
The components of income before income taxes were as follows:
| Fiscal Years Ended September 30, | ||||||||||||
| 2018 | 2019 | 2020 | ||||||||||
| U.S. |
$ | 80,198 | $ | 36,665 | $ | 80,229 | ||||||
| Foreign |
50,685 | 28,024 | 27,067 | |||||||||
|
|
|
|
|
|
|
|||||||
| Total |
$ | 130,883 | $ | 64,689 | $ | 107,296 | ||||||
|
|
|
|
|
|
|
|||||||
On December 22, 2017, the Tax Cuts and Jobs Act of 2017 (the “Act”) was signed into law, making significant changes to the Internal Revenue Code. Changes included, but were not limited to, a corporate tax rate decrease from 35% to 21% effective for tax years beginning after December 31, 2017, the transition of U.S. international taxation from a worldwide tax system to a territorial system, and a one-time transition tax on the mandatory deemed repatriation of cumulative foreign earnings as of December 31, 2017. As Weber-Stephen Products LLC is a partnership for federal income tax purposes, and not taxed at the entity level, the Act had no impact on the Company’s U.S. federal tax provision.
Significant components of income tax expense (benefit) were as follows:
| Fiscal Years Ended September 30, | ||||||||||||
| 2018 | 2019 | 2020 | ||||||||||
| Current |
||||||||||||
| U.S. Federal |
$ | — | $ | — | $ | — | ||||||
| State & Local |
231 | 119 | 153 | |||||||||
| Foreign |
17,088 | 13,615 | 13,214 | |||||||||
|
|
|
|
|
|
|
|||||||
| Total current income tax expense |
17,319 | 13,734 | 13,367 | |||||||||
|
|
|
|
|
|
|
|||||||
| Deferred |
||||||||||||
| U.S. Federal |
— | — | — | |||||||||
| State & Local |
— | — | — | |||||||||
| Foreign |
269 | (190 | ) | 445 | ||||||||
|
|
|
|
|
|
|
|||||||
| Total deferred income tax expense (benefit) |
269 | (190 | ) | 445 | ||||||||
|
|
|
|
|
|
|
|||||||
| Total |
$ | 17,588 | $ | 13,544 | $ | 13,812 | ||||||
|
|
|
|
|
|
|
|||||||
A reconciliation of income taxes computed at the U.S. federal statutory income tax rate of 21% to our income tax expense (benefit) was as follows:
| Fiscal Years Ended September 30, | ||||||||||||
| 2018 | 2019 | 2020 | ||||||||||
| At U.S. Federal statutory tax rate |
21.0 | % | 21.0 | % | 21.0 | % | ||||||
| State income taxes |
0.2 | % | 0.2 | % | 0.1 | % | ||||||
| Foreign rate differential |
2.4 | % | 3.0 | % | 1.8 | % | ||||||
| Pass-through income |
(12.9 | %) | (11.9 | %) | (15.7 | %) | ||||||
| Change in valuation allowance |
0.1 | % | 2.3 | % | (0.8 | %) | ||||||
| Tax settlement |
0.0 | % | 0.0 | % | 2.9 | % | ||||||
| Net uncertain tax positions |
0.7 | % | 6.5 | % | 1.2 | % | ||||||
| Other |
1.9 | % | (0.2 | %) | 2.4 | % | ||||||
|
|
|
|
|
|
|
|||||||
| Total |
13.4 | % | 20.9 | % | 12.9 | % | ||||||
|
|
|
|
|
|
|
|||||||
F-33
Table of Contents
WEBER-STEPHEN PRODUCTS LLC
Notes to Consolidated Financial Statements (continued)
(All Amounts in Thousands of U.S. Dollars Unless Otherwise Indicated)
The Company’s deferred tax assets (liabilities) consisted of the following:
| September 30, | ||||||||
| 2019 | 2020 | |||||||
| Deferred tax assets |
||||||||
| Net operating loss |
$ | 10,677 | $ | 9,741 | ||||
| Operating lease liability |
— | 4,971 | ||||||
| Other |
1,138 | 1,152 | ||||||
|
|
|
|
|
|||||
| Total deferred tax assets |
11,815 | 15,864 | ||||||
|
|
|
|
|
|||||
| Valuation allowance |
(10,645 | ) | (9,749 | ) | ||||
|
|
|
|
|
|||||
| Total deferred tax assets net of valuation allowance |
1,170 | 6,115 | ||||||
|
|
|
|
|
|||||
| Deferred tax liabilities |
||||||||
| Right-of-Use Asset |
— | (4,971 | ) | |||||
| Other |
(271 | ) | (664 | ) | ||||
|
|
|
|
|
|||||
| Total deferred tax liabilities |
(271 | ) | (5,635 | ) | ||||
|
|
|
|
|
|||||
| Net deferred tax assets |
$ | 899 | $ | 480 | ||||
|
|
|
|
|
|||||
Net deferred tax assets are recorded within Other long-term assets.
The change in our valuation allowance during the year ended September 30, 2020 is primarily attributable to changes in our net deferred tax assets.
At September 30, 2020, the Company had foreign net operating losses of approximately $60,404, which will begin to expire in 2021.
As of September 30, 2020, the Company is not indefinitely reinvested on undistributed earnings from its foreign operations. Due to the Company’s structure, the foreign operations do not qualify for the indefinite reinvestment exceptions under ASC 740-30 as the earnings from the foreign operations are subject to U.S. taxation to the partners of Weber-Stephen Products LLC. The Company’s intent is to only make distributions from non-U.S. operations in the future when they can be made with an immaterial tax cost.
Unrecognized Tax Benefits
The Company’s unrecognized tax benefits are as follows:
| September 30, | ||||||||||||
| 2018 | 2019 | 2020 | ||||||||||
| Balance at beginning of the year |
$ | — | $ | 875 | $ | 5,053 | ||||||
| Increase associated with tax positions taken during the current year |
875 | 4,178 | 1,279 | |||||||||
|
|
|
|
|
|
|
|||||||
| Balance at end of the year |
$ | 875 | $ | 5,053 | $ | 6,332 | ||||||
|
|
|
|
|
|
|
|||||||
Included in the balance of unrecognized tax benefits as of September 30, 2019 and September 30, 2020, are $815 and $2,461, respectively, of tax benefits that, if recognized, would affect the effective tax rate.
F-34
Table of Contents
WEBER-STEPHEN PRODUCTS LLC
Notes to Consolidated Financial Statements (continued)
(All Amounts in Thousands of U.S. Dollars Unless Otherwise Indicated)
The Company’s policy is to include interest and penalties related to gross unrecognized tax benefits in income tax expense. There was no interest expense or penalties accrued for the years ended September 30, 2018, 2019 and 2020.
The Company is currently subject to routine income tax examinations for U.S. federal and foreign jurisdictions for tax years 2013 and forward, and for U.S. state jurisdictions for tax years 2011 and forward. Currently, the Company is under audit in the following major foreign jurisdictions presented below:
| Tax Years | ||
| Denmark |
2013-2016 | |
| France |
2015-2017 | |
| Germany |
2019 | |
| Sweden |
2013-2016 |
9. Commitments and Contingencies
Warranty
The following is an analysis of product warranty reserves and charges against those reserves:
| Balance at September 30, 2017 |
$ | 17,561 | ||
| Accrual for warranties issued |
6,041 | |||
| Warranty settlements made |
(4,480 | ) | ||
|
|
|
|||
| Balance at September 30, 2018 |
19,122 | |||
| Accrual for warranties issued |
4,731 | |||
| Warranty settlements made |
(4,338 | ) | ||
|
|
|
|||
| Balance at September 30, 2019 |
19,515 | |||
| Accrual for warranties issued |
8,128 | |||
| Warranty settlements made |
(5,734 | ) | ||
|
|
|
|||
| Balance at September 30, 2020 |
$ | 21,909 | ||
|
|
|
The balance of warranty reserves recorded in Other long-term liabilities was $16,040 and $17,995 as of September 30, 2019 and 2020, respectively, with the remaining current balance of $3,475 and $3,914 recorded in Accrued expenses as of September 30, 2019 and 2020, respectively.
Contingent Consideration
As part of the 2016 acquisition of all aspects of the business related to iGrill and Kitchen Thermometer products from iDevices, LLC (“iDevices”), the Company has future cash payments due to iDevices in conjunction with an earn-out and development agreement. Under this agreement, the Company must pay iDevices a minimum of $8,000, and then additional royalty payments at fixed rates on iGrill and Kitchen Thermometer products sold for a total of 10 years or up to $15,000, whichever comes first. Under the terms of the earn-out and development agreement, the Company paid $2,188 and $1,640 for the fiscal years ended September 30, 2019 and 2020, respectively. The fair value of the contingent consideration liability was $1,610 and $700 at September 30, 2019 and 2020,
F-35
Table of Contents
WEBER-STEPHEN PRODUCTS LLC
Notes to Consolidated Financial Statements (continued)
(All Amounts in Thousands of U.S. Dollars Unless Otherwise Indicated)
respectively. The fair value of these estimated future cash payments was based on valuation methods and management’s best estimates as of the date of acquisition and was recorded as a contingent consideration liability in Other long-term liabilities in the accompanying consolidated balance sheets.
Legal Proceedings
The Company is subject to a variety of investigations, claims, suits and other legal proceedings that arise from time to time in the ordinary course of business including, but not limited to, intellectual property, employment, tort, and breach of contract matters. The Company currently believes that the outcomes of such proceedings, individually and in the aggregate, will not have a material adverse impact on its business, cash flows, consolidated financial position or results of operations. Any legal proceedings are subject to inherent uncertainties, and management’s view of these matters and their potential effects may change in the future.
10. Employee Benefit Plans
Profit-Sharing Plan
The Company had a profit-sharing plan covering all full-time employees. Any person employed by the Company who had completed one continuous year of employment, as defined by the plan, on September 30 of any year became a participant. The amount of the Company’s annual contribution was determined by the Board of Directors. The allocation of the Company’s contribution was based upon the relationship of a participant’s years of service and annual compensation to the total years of service and compensation of all participants at the end of the fiscal year. The Company’s contribution for the fiscal years ended September 30, 2018, 2019 and 2020 was $250, $104 and $0, respectively.
Effective March 1, 2019, the profit-sharing plan merged into the Company’s defined contribution plan. All of the net assets of the profit-sharing plan of approximately $5,839 were transferred into the Company’s defined contribution plan as a result of the merger.
Defined Contribution Plan
The Company has a defined contribution plan covering substantially all employees who have completed two months of employment. Prior to the merger of the profit-sharing plan and the defined contribution plan, the defined contribution plan only covered nonunion employees. The Company provides a matching contribution based on a defined percentage of the participant’s contribution and union status. The Company’s contribution for the fiscal years ended September 30, 2018, 2019 and 2020 was $1,180, $1,242 and $1,586, respectively.
11. Related Parties
Periodically, the Company engages in transactions with related parties, which include entities that are owned in whole or in part by certain owners or employees of the Company.
Rental expense for certain manufacturing and office facilities in the U.S., which were leased from related parties and charged against operations, amounted to $953 for each of the fiscal years ended September 30, 2018, 2019 and 2020.
F-36
Table of Contents
WEBER-STEPHEN PRODUCTS LLC
Notes to Consolidated Financial Statements (continued)
(All Amounts in Thousands of U.S. Dollars Unless Otherwise Indicated)
The Company adopted ASC 842 in fiscal year 2020. In connection with the manufacturing and office facilities located in the U.S., the Company had related party operating right-of-use assets of $4,111 at September 30, 2020. Additionally, the Company had related party non-current operating lease liabilities of $4,139 at September 30, 2020.
The Company has a royalty agreement with a related party for the use of the Company’s trademark. Royalty revenue from this agreement was $693, $699 and $386 for the fiscal years ended September 30, 2018, 2019 and 2020, respectively. The Company had a royalty receivable of $149 and $220 from this related party at September 30, 2019 and 2020, respectively.
As described in Note 5, the Company entered into a series of transactions with June during the fiscal year ended September 30, 2019. As of September 30, 2019 and 2020, the Company recorded prepaid royalties of $4,600 and $10,044, respectively. For the fiscal years ended September 30, 2019 and 2020, the Company recorded royalty expense of $0 and $1,291, respectively.
The Company has notes receivable due from members, including interest, of $8,627 and $9,284 at September 30, 2019 and 2020, respectively. See Note 17 for further information.
12. Fair Value of Financial Instruments
With respect to financial assets and liabilities, fair value is defined as the exchange price that would be received for an asset, or paid to transfer a liability (an exit price), in the principal or most advantageous market for the asset or liability in an orderly transaction between market participants on the measurement date. Valuation techniques used to measure fair value must maximize the use of observable inputs and minimize the use of unobservable inputs. A fair value hierarchy has been established based on three levels of inputs, of which the first two are considered observable and the last unobservable.
| • | Level 1—Quoted prices in active markets for identical assets or liabilities. These are typically obtained from real-time quotes for transactions in active exchange markets involving identical assets. |
| • | Level 2—Inputs other than quoted prices included within Level 1 that are observable for the asset or liability, either directly or indirectly. These are typically obtained from readily available pricing sources for comparable instruments. |
| • | Level 3—Unobservable inputs, where there is little or no market activity for the asset or liability. These inputs reflect the reporting entity’s own assumptions of the data that market participants would use in pricing the asset or liability based on the best information available in the circumstances. |
The Company had interest rate swap contracts held with financial institutions as of September 30, 2019 and 2020, classified as Level 2 financial instruments, which are valued using observable underlying interest rates and market-determined risk premiums at the reporting date.
The Company had foreign currency forward contracts held with financial institutions as of September 30, 2020, classified as Level 2 financial instruments, which are valued using observable forward foreign exchange rates at the reporting date.
F-37
Table of Contents
WEBER-STEPHEN PRODUCTS LLC
Notes to Consolidated Financial Statements (continued)
(All Amounts in Thousands of U.S. Dollars Unless Otherwise Indicated)
The Company had commodity index contracts held with financial institutions as of September 30, 2020, classified as Level 2 financial instruments, which are valued using observable commodity index rates at the reporting date.
The Company had a contingent consideration liability as of September 30, 2019 and 2020, classified as a Level 3 instrument, in conjunction with its fiscal year ended September 30, 2016 acquisition of all aspects of the business related to iGrill and Kitchen Thermometer products from iDevices. The fair value of these estimated future cash payments was determined based on valuation methods and estimates of future cash flows. See Note 9 for further details.
The fair value of financial assets and liabilities measured on a recurring basis was as follows:
| September 30, 2019 |
Level 1 | Level 2 | Level 3 | |||||||||||||
| Other long-term assets: |
||||||||||||||||
| Interest rate swap contracts |
$ | 91 | $ | — | $ | 91 | $ | — | ||||||||
|
|
|
|
|
|
|
|
|
|||||||||
| Total |
$ | 91 | $ | — | $ | 91 | $ | — | ||||||||
|
|
|
|
|
|
|
|
|
|||||||||
| Accrued expenses: |
||||||||||||||||
| Interest rate swap contracts |
$ | 5,743 | $ | — | $ | 5,743 | $ | — | ||||||||
|
|
|
|
|
|
|
|
|
|||||||||
| Total |
$ | 5,743 | $ | — | $ | 5,743 | $ | — | ||||||||
|
|
|
|
|
|
|
|
|
|||||||||
| Other long-term liabilities: |
||||||||||||||||
| Interest rate swap contracts |
$ | 16,220 | $ | — | $ | 16,220 | $ | — | ||||||||
| Contingent consideration |
1,610 | — | — | 1,610 | ||||||||||||
|
|
|
|
|
|
|
|
|
|||||||||
| Total |
$ | 17,830 | $ | — | $ | 16,220 | $ | 1,610 | ||||||||
|
|
|
|
|
|
|
|
|
|||||||||
| September 30, 2020 |
Level 1 | Level 2 | Level 3 | |||||||||||||
| Accrued expenses: |
||||||||||||||||
| Foreign currency forward contracts |
$ | 223 | $ | — | $ | 223 | $ | — | ||||||||
| Commodity index contracts |
73 | — | 73 | — | ||||||||||||
| Interest rate swap contracts |
9,324 | — | 9,324 | — | ||||||||||||
|
|
|
|
|
|
|
|
|
|||||||||
| Total |
$ | 9,620 | $ | — | $ | 9,620 | $ | — | ||||||||
|
|
|
|
|
|
|
|
|
|||||||||
| Other long-term liabilities: |
||||||||||||||||
| Interest rate swap contracts |
$ | 27,296 | $ | — | $ | 27,296 | $ | — | ||||||||
| Commodity index contracts |
28 | — | 28 | — | ||||||||||||
| Contingent consideration |
700 | — | — | 700 | ||||||||||||
|
|
|
|
|
|
|
|
|
|||||||||
| Total |
$ | 28,024 | $ | — | $ | 27,324 | $ | 700 | ||||||||
|
|
|
|
|
|
|
|
|
|||||||||
F-38
Table of Contents
WEBER-STEPHEN PRODUCTS LLC
Notes to Consolidated Financial Statements (continued)
(All Amounts in Thousands of U.S. Dollars Unless Otherwise Indicated)
The table below sets forth a summary of changes in fair value of the contingent consideration using Level 3 assumptions:
| Balance at September 30, 2018 |
$ | 5,043 | ||
| Royalty payments |
(2,188 | ) | ||
| Fair value adjustment |
(1,245 | ) | ||
|
|
|
|||
| Balance at September 30, 2019 |
1,610 | |||
| Royalty payments |
(1,640 | ) | ||
| Fair value adjustment |
730 | |||
|
|
|
|||
| Balance at September 30, 2020 |
$ | 700 | ||
|
|
|
The carrying amounts reported in the Company’s accompanying consolidated balance sheets for cash and cash equivalents, accounts receivable, and trade accounts payable approximate their fair values due to the short-term nature of these instruments. The carrying amounts reported in the Company’s accompanying consolidated balance sheets for variable rate, revolving loan facilities also approximate fair values. The fair value of the fixed rate debt is not readily determinable, because the information is not available.
13. Management Incentive Compensation Plan
Since the fiscal year ended September 30, 2011, the Company has issued individual Management Incentive Compensation Plan (“LTIP” or the “Plan”) agreements. The Plan authorizes the grant of awards to certain key officers or employees of the Company and its subsidiaries. These awards (the “Awards”) each represent a contractual right to payment of compensation in the future based on a calculated value as defined in the Plan.
The Awards are not units of the Company’s common stock, and a recipient of the Awards does not receive any ownership interest in the Company, member voting rights, or other incidents of ownership.
The Awards are granted to participants based upon the achievement of performance goals and factors, as defined in the individual Plan agreements during the respective performance periods. The performance periods under the Plan vary from two to three years. The Awards are fully vested at the completion of the performance period if the performance goals are achieved. Upon vesting, the Awards represent a contractual right of payment for the value of the Awards. The Awards will be paid on their maturity date, unless an acceptable event occurs under the terms of the Plan prior to the maturity date that allows for earlier payment.
In certain circumstances, the Awards may be immediately vested upon the participant’s death or disability or a change of control in the Company. If a participant’s employment or relationship with the Company is terminated for reasons other than for cause, then any vested Awards will be paid to the participant upon termination, subject to certain holding periods.
The Company uses the terms and calculations as outlined in the Plan as its method for determining the intrinsic value of the Awards in accordance with its election under ASC 718, Compensation—Stock Compensation. The Company uses the straight-line method of recognizing the
F-39
Table of Contents
WEBER-STEPHEN PRODUCTS LLC
Notes to Consolidated Financial Statements (continued)
(All Amounts in Thousands of U.S. Dollars Unless Otherwise Indicated)
value of the compensation expense relating to the Awards. The compensation expense (including adjustment of the liability to its intrinsic value) from the Awards is recognized over the vesting period of each grant or award if it is deemed probable that the performance goals will be achieved. Once vested, the liability related to the Awards is adjusted as changes in its intrinsic value are experienced.
Forfeitures are estimated at the time of grant and revised, if necessary, in subsequent periods if actual forfeitures differ from those estimates in order to derive the Company’s best estimate of the Awards that will ultimately vest. Forfeitures represent only the unvested portion of a surrendered Award and are typically estimated based on historical experience.
During the fiscal years ended September 30, 2019 and 2020, the Company granted new Awards under the Plan covering three-year performance periods. For the fiscal 2019 Awards, the performance period is from fiscal 2019 through fiscal 2021, with the Awards being fully vested by September 30, 2021 if the performance goals are achieved. For the fiscal 2020 Awards, the performance period is from fiscal 2020 through fiscal 2022, with the Awards being fully vested by September 30, 2022 if the performance goals are achieved. The payment of these Awards can occur under either an installment method, where the participant receives the value of their awards in four equal, annual installments beginning with the second anniversary of the last day of the performance period, or in a lump sum on the tenth anniversary of the last day of the performance period, unless an acceptable event occurs under the terms of the Plan which allows for earlier payment.
Under the Plan, the Company had previously issued Awards covering a performance period of fiscal 2018 through fiscal 2020, a performance period of fiscal 2017 through fiscal 2019, and a performance period of fiscal 2016 through fiscal 2018. These Awards were fully vested as of September 30, 2020. The payment of the value of these Awards can occur under either an installment method, as described above, or on the tenth anniversary of the last day of the performance period. The payment method is at the election of the Award recipient.
The Company had also previously issued Awards covering a performance period of fiscal 2014 through fiscal 2015. In addition, the Company had previously issued Awards covering a performance period of fiscal 2011 through fiscal 2013. These awards were fully vested as of September 30, 2020. The payment of the value of these respective Awards occurs on the seventh anniversary of the last day of the performance period unless an acceptable event occurs under the terms of the Plan that allows for earlier payments.
In prior fiscal periods, certain participants in the Plan left the Company. In accordance with the terms of the Plan, these participants received their vested benefits with their departure after fulfilling a required holding period. A total of $150, $467 and $1,067 was paid out under the Plan during the fiscal years ended September 30, 2018, 2019 and 2020, respectively.
Under the Plan, participants holding vested awards are entitled to receive cash payments on a pro rata basis in relation to any payments made to the holders of the Company’s common units paid in a general distribution. During the fiscal year ended September 30, 2018, participants received cash payment of $2,153 in conjunction with the payment of general distributions. During the fiscal years ended September 30, 2019 and 2020, participants received no cash payments as a result of a general distribution.
F-40
Table of Contents
WEBER-STEPHEN PRODUCTS LLC
Notes to Consolidated Financial Statements (continued)
(All Amounts in Thousands of U.S. Dollars Unless Otherwise Indicated)
The Company had actual forfeitures in the amount of $1,776, $0 and $65 for the fiscal years ended September 30, 2018, 2019 and 2020, respectively.
The Company recorded a reduction to compensation expense, due to a decrease in the value of awards and the impact of forfeitures, of $3,377 for the fiscal year ended September 30, 2018, related to the Plan, a reduction to compensation expense, due to a decrease in the value of the awards, of $1,604 for the fiscal year ended September 30, 2019 and additional compensation expense, due to an increase in the value of the awards, of $4,372 for the fiscal year ended September 30, 2020. The total liability related to the Plan was $3,782 and $7,021 as of September 30, 2019 and 2020, respectively. As of September 30, 2020, the current portion of this liability is $2,851 and is included in Accrued expenses to reflect the expected payout of these Awards during the next twelve months. The remaining liability is included in Other long-term liabilities. As of September 30, 2020, the Company had not yet recognized compensation cost on unvested awards of $3,854, with a weighted average remaining recognition period of 1.4 years.
14. Profits Interest Plan
During the fiscal years 2018, 2019 and 2020, the Company granted profits interest units with vesting periods ranging from one to five years to certain key employees in consideration for their services to or for the benefit of the Company. These units will entitle the employees to participate in distributions upon liquidation events after the Company has met certain financial thresholds. No payments were required from the employees to acquire the profits interests. These profits interest units do not carry any voting rights, cannot be converted into common units and are settled in cash. The value of these awards in fiscal years 2019 and 2020 was de minimis. Adjustments to the intrinsic value of these profits interest units, based on valuation techniques and management’s best estimates, will be recognized as compensation expense in future reporting periods with the offset to Other long-term liabilities in accordance with its election under ASC 718, Compensation—Stock Compensation.
15. Segments
The Company has three operating segments, Americas, which consists of Canada, Chile, Mexico and the United States; the European, Middle East and African regions (“EMEA”); and the Asia-Pacific region (“APAC”), which includes Australia and New Zealand. The Company’s reportable segments consist of Americas, EMEA and APAC. Corporate/Other is not an operating segment and includes unallocated corporate and certain supply chain expenses and assets (consisting primarily of cash, land, buildings and equipment, certain intangible assets (trademark) and deferred tax assets), inter-segment eliminations and other adjustments to segment results necessary for the presentation of consolidated financial results in accordance with GAAP. Internal revenue transactions between the Company’s segments are immaterial. Each operating segment derives its revenues from the provision of gas, pellet and charcoal grills and related accessories to customers.
The Company’s CODM is the Chief Executive Officer (“CEO”). The CEO reviews financial information presented on a consolidated basis, accompanied by disaggregated information about the Company’s revenue and profitability, for purposes of making operating decisions, assessing financial performance and allocating resources. The CODM receives discrete financial information by segment.
The CODM reviews adjusted income from operations as the key segment measure of performance. Adjusted income from operations is defined as income from operations adjusted for
F-41
Table of Contents
WEBER-STEPHEN PRODUCTS LLC
Notes to Consolidated Financial Statements (continued)
(All Amounts in Thousands of U.S. Dollars Unless Otherwise Indicated)
unallocated net expenses, non-cash stock compensation / LTIP expense, and impairment costs. Adjusted income from operations excludes interest income, interest expense, income taxes, and loss from investments in unconsolidated affiliates.
The information below summarizes key financial performance measures by reportable segment for fiscal years 2018, 2019 and 2020:
| Fiscal Year Ended September 30, 2018 |
||||||||||||||||||||
| Americas | EMEA | APAC | Corporate/ Other |
Total | ||||||||||||||||
| Net sales |
$ | 704,337 | $ | 530,494 | $ | 105,201 | $ | — | $ | 1,340,032 | ||||||||||
| Adjusted income from operations(1) |
$ | 176,431 | $ | 116,609 | $ | 21,265 | $ | (151,497 | ) | $ | 162,808 | |||||||||
| Depreciation and amortization |
$ | 2,007 | $ | 4,480 | $ | 771 | $ | 41,359 | $ | 48,617 | ||||||||||
| Capital expenditures |
$ | 1,302 | $ | 2,825 | $ | 2,058 | $ | 28,719 | $ | 34,904 | ||||||||||
| (1) | Adjusted income from operations for each reportable segment includes cost of goods sold transfer price allocations and distribution allocations from Corporate/Other. Corporate/Other includes unallocated corporate and certain supply chain expenses, inter-segment eliminations and other adjustments, including business and operational transformation costs. |
| Fiscal Year Ended September 30, 2019 |
||||||||||||||||||||
| Americas | EMEA | APAC | Corporate/Other | Total | ||||||||||||||||
| Net sales |
$ | 715,153 | $ | 483,914 | $ | 97,143 | $ | — | $ | 1,296,210 | ||||||||||
| Adjusted income from operations(1) |
$ | 133,663 | $ | 109,903 | $ | 20,386 | $ | (144,124 | ) | $ | 119,828 | |||||||||
| Depreciation and amortization |
$ | 2,021 | $ | 3,257 | $ | 1,098 | $ | 39,941 | $ | 46,317 | ||||||||||
| Segment assets(2) |
$ | 75,356 | $ | 71,542 | $ | 38,482 | $ | — | $ | 185,380 | ||||||||||
| Capital expenditures |
$ | 227 | $ | 1,002 | $ | 1,234 | $ | 23,044 | $ | 25,507 | ||||||||||
| (1) | Adjusted income from operations for each reportable segment includes cost of goods sold transfer price allocations and distribution allocations from Corporate/Other. Corporate/Other includes unallocated corporate and certain supply chain expenses, inter-segment eliminations and other adjustments, including business and operational transformation costs. |
| (2) | Inventory is the only segment asset reviewed by the CODM. See the reconciliations to consolidated total assets below. |
| Fiscal Year Ended September 30, 2020 |
||||||||||||||||||||
| Americas | EMEA | APAC | Corporate/Other | Total | ||||||||||||||||
| Net sales |
$ | 880,618 | $ | 541,567 | $ | 103,075 | $ | — | $ | 1,525,260 | ||||||||||
| Adjusted income from operations(1) |
$ | 178,079 | $ | 136,547 | $ | 23,369 | $ | (187,098 | ) | $ | 150,897 | |||||||||
| Depreciation and amortization |
$ | 690 | $ | 1,993 | $ | 1,225 | $ | 38,439 | $ | 42,347 | ||||||||||
| Segment assets(2) |
$ | 120,351 | $ | 77,477 | $ | 35,499 | $ | — | $ | 233,327 | ||||||||||
| Capital expenditures |
$ | 39 | $ | 6,961 | $ | 1,742 | $ | 20,672 | $ | 29,414 | ||||||||||
| (1) | Adjusted income from operations for each reportable segment includes cost of goods sold transfer price allocations and distribution allocations from Corporate/Other. Corporate/Other includes unallocated corporate and certain supply chain expenses, inter-segment eliminations and other adjustments, including business and operational transformation costs and COVID-19 costs. |
| (2) | Inventory is the only segment asset reviewed by the CODM. See the reconciliations to consolidated total assets below. |
F-42
Table of Contents
WEBER-STEPHEN PRODUCTS LLC
Notes to Consolidated Financial Statements (continued)
(All Amounts in Thousands of U.S. Dollars Unless Otherwise Indicated)
Reconciliations
The information below provides a reconciliation of adjusted income from operations to income before taxes:
| Fiscal Years Ended September 30, | ||||||||||||
| 2018 | 2019 | 2020 | ||||||||||
| Segment adjusted income from operations |
||||||||||||
| Americas |
$ | 176,431 | $ | 133,663 | $ | 178,079 | ||||||
| EMEA |
116,609 | 109,903 | 136,547 | |||||||||
| APAC |
21,265 | 20,386 | 23,369 | |||||||||
|
|
|
|
|
|
|
|||||||
| Segment adjusted income from operations for reportable segments |
314,305 | 263,952 | 337,995 | |||||||||
| Unallocated net expenses |
(151,497 | ) | (144,124 | ) | (187,098 | ) | ||||||
| Adjustments to income before taxes |
||||||||||||
| Non-cash stock compensation / LTIP expense |
1,090 | 1,446 | (4,514 | ) | ||||||||
| Impairment costs(1) |
— | (12,568 | ) | — | ||||||||
| Interest income |
1,594 | 1,153 | 1,270 | |||||||||
| Interest expense |
(34,609 | ) | (45,170 | ) | (40,357 | ) | ||||||
|
|
|
|
|
|
|
|||||||
| Income before taxes |
$ | 130,883 | $ | 64,689 | $ | 107,296 | ||||||
|
|
|
|
|
|
|
|||||||
| (1) | As part of the fiscal year 2019 annual goodwill impairment test, the Company recognized a non-cash impairment loss of $12,568 on the iGrill goodwill. |
The information below provides a reconciliation of segment assets to total consolidated assets:
| September 30, 2019 | ||||||||||||||||||||
| Americas | EMEA | APAC | Corporate/Other | Total | ||||||||||||||||
| Segment assets |
$ | 75,356 | $ | 71,542 | $ | 38,482 | $ | — | $ | 185,380 | ||||||||||
| All other(1) |
$ | 776,231 | ||||||||||||||||||
|
|
|
|||||||||||||||||||
| Total assets |
$ | 961,611 | ||||||||||||||||||
|
|
|
|||||||||||||||||||
| (1) | “All other” consists of assets that are not reviewed by the CODM at a segment level : cash and cash equivalents; account receivable; prepaid expenses and other current assets; property, equipment and leasehold improvements, net; operating lease right-of-use assets; other long-term assets; trademarks, net; other intangible assets, net; and goodwill. |
| September 30, 2020 | ||||||||||||||||||||
| Americas | EMEA | APAC | Corporate/Other | Total | ||||||||||||||||
| Segment assets |
$ | 120,351 | $ | 77,477 | $ | 35,499 | $ | — | $ | 233,327 | ||||||||||
| All other(1) |
$ | 906,108 | ||||||||||||||||||
|
|
|
|||||||||||||||||||
| Total assets |
$ | 1,139,435 | ||||||||||||||||||
|
|
|
|||||||||||||||||||
| (1) | “All other” consists of assets that are not reviewed by the CODM at a segment level : cash and cash equivalents; account receivable; prepaid expenses and other current assets; property, equipment and leasehold improvements, net; operating lease right-of-use assets; other long-term assets; trademarks, net; other intangible assets, net; and goodwill. |
F-43
Table of Contents
WEBER-STEPHEN PRODUCTS LLC
Notes to Consolidated Financial Statements (continued)
(All Amounts in Thousands of U.S. Dollars Unless Otherwise Indicated)
Entity-Wide Information
The information below summarizes net sales by geographic area:
| Fiscal Years Ended September 30, |
||||||||||||
| 2018 | 2019 | 2020 | ||||||||||
| United States |
$ | 631,722 | $ | 647,703 | $ | 803,368 | ||||||
| Germany |
191,864 | 173,872 | 194,535 | |||||||||
| All other |
516,446 | 474,635 | 527,357 | |||||||||
|
|
|
|
|
|
|
|||||||
| Total |
$ | 1,340,032 | $ | 1,296,210 | $ | 1,525,260 | ||||||
|
|
|
|
|
|
|
|||||||
Net sales are attributed based on the location where the sale originates.
The information below summarizes right-of-use assets and property, equipment and leasehold improvements, net by geographic area:
| September 30, | ||||||||
| 2019 | 2020 | |||||||
| United States |
$ | 132,810 | $ | 123,901 | ||||
| All other |
14,518 | 33,288 | ||||||
|
|
|
|
|
|||||
| Total |
$ | 147,328 | $ | 157,189 | ||||
|
|
|
|
|
|||||
Major Customers
The Company had two major customers, located within the Americas segment, which accounted for 15% and 11%, 14% and 13%, and 16% and 11% of Net sales for the fiscal year ended September 30, 2018, 2019 and 2020, respectively. The Company’s two major customers accounted for 11% and 4% and 19% and 8% of accounts receivable at September 30, 2019 and 2020, respectively.
16. Income Per Unit
The computation of net income per unit is as follows:
| Fiscal Years Ended September 30, | ||||||||||||
| (in thousands, except unit and per unit data) |
2018 | 2019 | 2020 | |||||||||
| Net income |
$ | 113,295 | $ | 50,120 | $ | 88,880 | ||||||
| Less: Net earnings allocated to participating securities |
(738 | ) | (320 | ) | (473 | ) | ||||||
|
|
|
|
|
|
|
|||||||
| Net income attributable to common members |
$ | 112,557 | $ | 49,800 | $ | 88,407 | ||||||
| Units used in computation: |
||||||||||||
| Weighted-average common units outstanding(1) |
581,616 | 566,223 | 551,763 | |||||||||
| Basic and diluted net income per unit |
$ | 193.53 | $ | 87.95 | $ | 160.23 | ||||||
| (1) | Amount excludes 2,004, 2,138 and 2,263 Weber common units issued in exchange for partial-recourse notes in the fiscal years ended September 30, 2018, 2019 and 2020, respectively. See Note 17 for further information. |
F-44
Table of Contents
WEBER-STEPHEN PRODUCTS LLC
Notes to Consolidated Financial Statements (continued)
(All Amounts in Thousands of U.S. Dollars Unless Otherwise Indicated)
Anti-dilutive securities excluded from diluted weighted-average common units outstanding totaled 2,004, 2,138 and 2,263 units exchanged for partial-recourse notes in the fiscal years ended September 30, 2018, 2019 and 2020, respectively.
17. Member Notes
In fiscal years 2018, 2019 and 2020, certain employees of the Company purchased common units in exchange for a capital contribution of $7,800, $1,000 and $500, respectively. In conjunction with the units purchased, the Company entered into notes receivable with certain individuals in fiscal years 2018, 2019 and 2020 with face values of $7,320, $450 and $375, respectively.
In fiscal years 2018, 2019 and 2020, $6,520, $6,920 and $7,295 of the issued member notes receivable, respectively, limit the recourse provisions of the Company to 50% should the value of the common units not be sufficient to satisfy the repayment of the member notes. In accordance with ASC 718, these member notes shall be accounted for as nonrecourse in their entirety as the limited recourse provisions of the member notes are not aligned with a corresponding percentage of the underlying common units. Therefore, the member notes are accounted for as if they were a stock option grant and no receivable for amounts due under the notes are recorded on the Company’s consolidated balance sheet. As there is no requisite service period associated with the notes, unit-based compensation expense related to this award is being recognized upon issuance of the note based on the grant-date fair value of the award, which was determined using the Black-Scholes option-pricing model. Unit based compensation recognized in relation to the notes amounted to $2,287, $158 and $142 for the fiscal years ended September 30, 2018, 2019 and 2020, respectively.
All member notes bear interest at 2% to 4% per annum, dependent upon the specific rate terms in the notes. Interest on member notes is compounded annually. Interest on full recourse member notes is recognized in Interest income in the accompanying consolidated statements of income. Interest on partial recourse member notes will be recognized in members’ equity as cash payments are made to the Company.
The total amount due from members on the notes receivable, including interest, was $8,627 and $9,284 as of September 30, 2019 and 2020, respectively. The notes receivable and the related accrued interest for full recourse notes of $1,427 and $1,483 as of September 30, 2019 and 2020, respectively, are reflected as reductions of members’ equity in the accompanying consolidated statements of changes in members’ equity (deficit). The notes receivable outstanding and the related accrued interest for partial recourse notes are not reflected in the accompanying consolidated financial statements, as they are accounted for as nonrecourse in their entirety. They will be recognized in members’ equity in the accompanying consolidated statements of changes in members’ equity (deficit) when cash payments on these notes receivable and related accrued interest are made to the Company.
Effective January 1, 2015, the individuals holding these member notes, along with other individuals, assigned their common units of the Company to Weber-Stephen Management Pool LLC (“MPLLC”). The sole purpose of MPLLC is to hold such common units. As a result of this transaction, the relative ownership interests in the Company held by those individuals did not change and the member notes remain as due to the Company. Common unit purchases in fiscal years 2018, 2019 and 2020 were transacted through MPLLC.
F-45
Table of Contents
WEBER-STEPHEN PRODUCTS LLC
Notes to Consolidated Financial Statements (continued)
(All Amounts in Thousands of U.S. Dollars Unless Otherwise Indicated)
18. Accrued Expenses
Accrued expenses consisted of the following:
| September 30, | ||||||||
| 2019 | 2020 | |||||||
| Accrued payroll and employee benefits |
$ | 16,811 | $ | 52,041 | ||||
| Accrued interest |
11,066 | 8,083 | ||||||
| Q Grill trademark purchase accrual |
18,000 | — | ||||||
| Current portion of derivative instruments |
5,743 | 9,620 | ||||||
| Other(1) |
32,631 | 64,124 | ||||||
|
|
|
|
|
|||||
| Total |
$ | 84,251 | $ | 133,868 | ||||
|
|
|
|
|
|||||
| (1) | Other includes items for accruals such as commissions, freight and distribution costs and taxes. |
19. Subsequent Events
The Company has evaluated subsequent events through May 10, 2021, the date that the Company’s consolidated financial statements were issued. Subsequent events are events or transactions that occur after the consolidated balance sheet date but before the consolidated financial statements are issued.
Subsequent events can be one of two types: recognized or non-recognized. Recognized subsequent events are events or transactions that provide additional evidence about conditions that existed at the date of the consolidated balance sheet, including estimates inherent in the process of preparing financial statements. Non-recognized subsequent events are events that provide evidence about conditions that did not exist at the date of the consolidated balance sheet, but arose before the consolidated financial statements were issued.
On October 30, 2020, the Company entered into a new credit facility arrangement with a term loan of $1,250,000 and a revolving credit facility with a maximum commitment of $300,000. The Senior Facility and the foreign currency revolver and overdraft facilities for the Company’s European operations were retired in conjunction with the new credit facility.
On December 30, 2020, the Company disposed of one of its manufacturing sites that had been classified as assets held for sale as of September 30, 2020 (see Note 1), for net cash proceeds of $13,540, which resulted in a gain of $5,185.
On January 12, 2021, the Company acquired all of the outstanding stock of June for $108,035 in cash. The purpose of the acquisition was to advance the Company’s strategy of revolutionizing the outdoor cooking experience through digital products, services and experiences that make grilling more dynamic and exciting.
The Company expects to account for this transaction as a business combination. The initial accounting, including the identification and allocation of consideration to assets acquired, is not complete given the proximity of the acquisition to the issuance date of these consolidated financial statements.
F-46
Table of Contents
WEBER-STEPHEN PRODUCTS LLC
Notes to Consolidated Financial Statements (continued)
(All Amounts in Thousands of U.S. Dollars Unless Otherwise Indicated)
On April 1, 2021, the Company acquired substantially all of the assets of R. McDonald Co. Pty. Ltd., a sales and marketing company headquartered in Australia, for approximately $29,295 in cash and $14,229 in equity. As part of the acquisition, the Company reacquired R. McDonald’s exclusive rights to sell and market Weber products in Australia and New Zealand. The Company has not completed the accounting for this transaction given the proximity of the acquisition to the issuance date of these consolidated financial statements.
In April 2021, the Company repurchased certain members’ units for $188,702, and issued a special dividend to members in an aggregate amount of $261,298.
There were no other significant recognized or non-recognized subsequent events through May 10, 2021.
F-47
Table of Contents
Condensed Consolidated Balance Sheets
(in thousands, except unit data)
| September 30, 2020 |
March 31, 2021 |
|||||||
| (unaudited) | ||||||||
| Assets |
||||||||
| Current assets: |
||||||||
| Cash and cash equivalents |
$ | 123,792 | $ | 379,939 | ||||
| Accounts receivable, less allowance of $3,262 and $2,468 at September 30, 2020 and March 31, 2021, respectively(1) |
130,885 | 483,953 | ||||||
| Inventories, net |
233,327 | 334,404 | ||||||
| Prepaid expenses and other current assets(2) |
33,880 | 41,300 | ||||||
|
|
|
|
|
|||||
| Total current assets |
521,884 | 1,239,596 | ||||||
| Property, equipment and leasehold improvements, net |
108,252 | 104,616 | ||||||
| Operating lease right-of-use assets(3) |
48,937 | 44,048 | ||||||
| Other long-term assets |
33,961 | 47,214 | ||||||
| Trademarks, net |
343,965 | 359,515 | ||||||
| Other intangible assets, net |
51,866 | 139,500 | ||||||
| Goodwill |
30,570 | 91,708 | ||||||
|
|
|
|
|
|||||
| Total assets |
$ | 1,139,435 | $ | 2,026,197 | ||||
|
|
|
|
|
|||||
| Liabilities and members’ equity (deficit) |
||||||||
| Current liabilities: |
||||||||
| Trade accounts payable |
$ | 298,078 | $ | 384,071 | ||||
| Accrued expenses(4) |
133,868 | 174,762 | ||||||
| Income taxes payable |
8,151 | 6,846 | ||||||
| Current portion of long-term debt and other borrowings |
36,250 | 12,500 | ||||||
| Current portion of long-term financing obligation |
514 | 552 | ||||||
|
|
|
|
|
|||||
| Total current liabilities |
476,861 | 578,731 | ||||||
| Long-term debt, less current portion |
575,659 | 1,210,560 | ||||||
| Long-term financing obligation, less current portion |
38,986 | 38,694 | ||||||
| Non-current operating lease liabilities(5) |
37,986 | 33,445 | ||||||
| Other long-term liabilities |
53,491 | 138,053 | ||||||
|
|
|
|
|
|||||
| Total liabilities |
1,182,983 | 1,999,483 | ||||||
| Commitments and Contingencies (Note 9) |
||||||||
| Members’ deficit, 551,774 and 551,842 common units authorized, issued and outstanding as of September 30, 2020 and March 31, 2021, respectively |
(1,216 | ) | (538 | ) | ||||
| Accumulated other comprehensive loss |
(68,580 | ) | (42,623 | ) | ||||
| Retained earnings |
26,248 | 69,875 | ||||||
|
|
|
|
|
|||||
| Total members’ (deficit) equity |
(43,548 | ) | 26,714 | |||||
|
|
|
|
|
|||||
| Total liabilities and members’ (deficit) equity |
$ | 1,139,435 | $ | 2,026,197 | ||||
|
|
|
|
|
|||||
| (1) | Includes related party royalty receivables of $220 and $166 at September 30, 2020 and March 31, 2021, respectively (see Note 10). |
| (2) | Includes related party prepaid royalties of $10,044 and $0 at September 30, 2020 and March 31, 2021, respectively (see Note 10). |
| (3) | Includes related party operating lease assets of $4,111 and $3,636 at September 30, 2020 and March 31, 2021, respectively (see Note 10). |
| (4) | Includes related party operating lease liabilities of $0 and $1,110 at September 30, 2020 and March 31, 2021, respectively (see Note 10). |
| (5) | Includes related party operating lease liabilities of $4,139 and $2,536 at September 30, 2020 and March 31, 2021, respectively (see Note 10). |
The accompanying notes are an integral part of these unaudited condensed consolidated financial statements.
F-48
Table of Contents
Condensed Consolidated Statements of Income
(in thousands, except unit and per unit data)
(unaudited)
| Six Months Ended March 31, | ||||||||
| 2020 | 2021 | |||||||
| Net sales(1) |
$ | 596,376 | $ | 963,309 | ||||
| Cost of goods sold(2) |
358,417 | 542,782 | ||||||
|
|
|
|
|
|||||
| Gross profit |
237,959 | 420,527 | ||||||
| Operating expenses: |
||||||||
| Selling, general and administrative(3)(4) |
174,718 | 297,986 | ||||||
| Amortization of intangible assets |
6,855 | 6,864 | ||||||
| Gain on disposal of assets held for sale |
— | (5,185 | ) | |||||
|
|
|
|
|
|||||
| Income from operations |
56,386 | 120,862 | ||||||
| Foreign currency loss (gain) |
6,033 | (14 | ) | |||||
| Interest income(5) |
(701 | ) | (425 | ) | ||||
| Interest expense |
21,111 | 32,174 | ||||||
| Loss from early extinguishment of debt |
— | 5,448 | ||||||
|
|
|
|
|
|||||
| Income before taxes |
29,943 | 83,679 | ||||||
| Income taxes |
3,558 | 15,389 | ||||||
| Loss (gain) from investments in unconsolidated affiliates |
2,778 | (5,505 | ) | |||||
|
|
|
|
|
|||||
| Net income |
23,607 | 73,795 | ||||||
| Earnings allocated to participating securities |
(234 | ) | (610 | ) | ||||
|
|
|
|
|
|||||
| Net income attributable to common members |
$ | 23,373 | $ | 73,185 | ||||
|
|
|
|
|
|||||
| Net income per common unit |
||||||||
| Basic |
$ | 42.36 | $ | 132.62 | ||||
| Diluted |
$ | 42.36 | $ | 132.62 | ||||
| Weighted average common units outstanding |
||||||||
| Basic |
551,753 | 551,836 | ||||||
| Diluted |
551,753 | 551,836 | ||||||
| (1) | Includes related party royalty revenue of $282 and $(54) for the six months ended March 31, 2020 and 2021, respectively (see Note 10). |
| (2) | Includes related party rental expense of $359 and $392 for the six months ended March 31, 2020 and 2021, respectively (see Note 10). |
| (3) | Includes related party rental expense of $117 and $128 for the six months ended March 31, 2020 and 2021, respectively (see Note 10). |
| (4) | Includes related party royalty expense of $1,103 and $268 for the six months ended March 31, 2020 and 2021, respectively (see Note 10). |
| (5) | Includes related party interest income of $28 and $29 for the six months ended March 31, 2020 and 2021, respectively (see Note 10). |
The accompanying notes are an integral part of these unaudited condensed consolidated financial statements.
F-49
Table of Contents
Condensed Consolidated Statements of Comprehensive Income
(in thousands)
(unaudited)
| Six Months Ended March 31, | ||||||||
| 2020 | 2021 | |||||||
| Net income |
$ | 23,607 | $ | 73,795 | ||||
| Other comprehensive income (loss): |
||||||||
| Foreign currency translation adjustments |
(380 | ) | 2,364 | |||||
| (Loss) gain on derivative instruments |
(16,016 | ) | 23,593 | |||||
|
|
|
|
|
|||||
| Comprehensive income |
$ | 7,211 | $ | 99,752 | ||||
|
|
|
|
|
|||||
The accompanying notes are an integral part of these unaudited condensed consolidated financial statements.
F-50
Table of Contents
Condensed Consolidated Statements of Changes in Members’ Equity (Deficit)
(in thousands, except unit data)
(unaudited)
| Accumulated Other Comprehensive Income (Loss) |
||||||||||||||||||||||||||||
| Units | Capital Contributions |
Notes Receivable From Members |
Cumulative Translation Adjustments |
Unrealized Gain (Loss) on Derivative Instruments |
Retained Earnings (Deficit) |
Total | ||||||||||||||||||||||
| Balance at September 30, 2019 |
551,732 | $ | — | $ | (1,427 | ) | $ | (48,411 | ) | $ | (23,850 | ) | $ | (48,072 | ) | $ | (121,760 | ) | ||||||||||
| Capital contributions |
42 | 125 | — | — | — | — | 125 | |||||||||||||||||||||
| Interest income on notes receivable |
— | — | (28 | ) | — | — | — | (28 | ) | |||||||||||||||||||
| Net income |
— | — | — | — | — | 23,607 | 23,607 | |||||||||||||||||||||
| Foreign currency translation adjustments |
— | — | — | (380 | ) | — | — | (380 | ) | |||||||||||||||||||
| Loss on derivative instruments |
— | — | — | — | (16,764 | ) | — | (16,764 | ) | |||||||||||||||||||
| Unit based compensation |
— | 142 | — | — | — | — | 142 | |||||||||||||||||||||
| Reclassification of realized loss on derivative instruments to net income |
— | — | — | — | 748 | — | 748 | |||||||||||||||||||||
| Application of ASC 842 |
— | — | — | — | — | 2,482 | 2,482 | |||||||||||||||||||||
| Members’ distributions |
— | (125 | ) | — | — | — | (1,923 | ) | (2,048 | ) | ||||||||||||||||||
|
|
|
|
|
|
|
|
|
|
|
|
|
|
|
|||||||||||||||
| Balance at March 31, 2020 |
551,774 | $ | 142 | $ | (1,455 | ) | $ | (48,791 | ) | $ | (39,866 | ) | $ | (23,906 | ) | $ | (113,876 | ) | ||||||||||
|
|
|
|
|
|
|
|
|
|
|
|
|
|
|
|||||||||||||||
| Balance at September 30, 2020 |
551,774 | $ | 267 | $ | (1,483 | ) | $ | (28,455 | ) | $ | (40,125 | ) | $ | 26,248 | $ | (43,548 | ) | |||||||||||
| Capital contributions |
68 | 225 | (100 | ) | — | — | — | 125 | ||||||||||||||||||||
| Interest income on notes receivable |
— | — | (29 | ) | — | — | — | (29 | ) | |||||||||||||||||||
| Notes receivable repayments |
— | — | 152 | — | — | — | 152 | |||||||||||||||||||||
| Net income |
— | — | — | — | — | 73,795 | 73,795 | |||||||||||||||||||||
| Foreign currency translation adjustments |
— | — | — | 2,364 | — | — | 2,364 | |||||||||||||||||||||
| Gain on derivative instruments |
— | — | — | — | 18,348 | — | 18,348 | |||||||||||||||||||||
| Unit based compensation |
— | 430 | — | — | — | — | 430 | |||||||||||||||||||||
| Reclassification of realized loss on derivative instruments to net income |
— | — | — | — | 5,245 | — | 5,245 | |||||||||||||||||||||
| Members’ distributions |
— | — | — | — | — | (30,168 | ) | (30,168 | ) | |||||||||||||||||||
|
|
|
|
|
|
|
|
|
|
|
|
|
|
|
|||||||||||||||
| Balance at March 31, 2021 |
551,842 | $ | 922 | $ | (1,460 | ) | $ | (26,091 | ) | $ | (16,532 | ) | $ | 69,875 | $ | 26,714 | ||||||||||||
|
|
|
|
|
|
|
|
|
|
|
|
|
|
|
|||||||||||||||
The accompanying notes are an integral part of these unaudited condensed consolidated financial statements.
F-51
Table of Contents
Condensed Consolidated Statements of Cash Flows
(in thousands)
(unaudited)
| Six Months Ended March 31, |
||||||||
| 2020 | 2021 | |||||||
| Operating activities |
||||||||
| Net income |
$ | 23,607 | $ | 73,795 | ||||
| Adjustments to reconcile net income to net cash provided by operating activities: |
||||||||
| Provision for depreciation |
14,617 | 13,464 | ||||||
| Provision for amortization of intangible assets |
6,855 | 6,864 | ||||||
| Provision for amortization of deferred financing costs |
1,223 | 1,858 | ||||||
| Management incentive plan compensation, net of forfeitures |
750 | 2,014 | ||||||
| Loss (gain) from investments in unconsolidated affiliates |
2,778 | (5,505 | ) | |||||
| Gain on disposal of assets held for sale |
— | (5,185 | ) | |||||
| Unit based compensation |
142 | 30,465 | ||||||
| Loss from early extinguishment of debt |
— | 5,448 | ||||||
| Changes in operating assets and liabilities: |
||||||||
| Accounts receivable |
(300,321 | ) | (353,754 | ) | ||||
| Inventories |
(124,437 | ) | (99,255 | ) | ||||
| Prepaid expenses and other current assets |
(18,904 | ) | 11,655 | |||||
| Trade accounts payable |
176,723 | 83,812 | ||||||
| Accrued expenses |
4,359 | 29,365 | ||||||
| Income taxes payable |
(1,454 | ) | 5,139 | |||||
| Other |
2,027 | (14,829 | ) | |||||
|
|
|
|
|
|||||
| Net cash used in operating activities |
(212,035 | ) | (214,649 | ) | ||||
| Investing activities |
||||||||
| Proceeds from disposal of property, equipment and leasehold improvements |
38 | 14,028 | ||||||
| Additions to property, equipment and leasehold improvements |
(18,264 | ) | (17,354 | ) | ||||
| Business combinations, net of cash acquired |
— | (102,239 | ) | |||||
|
|
|
|
|
|||||
| Net cash used in investing activities |
(18,226 | ) | (105,565 | ) | ||||
| Financing activities |
||||||||
| Proceeds from issuance of long-term debt |
— | 1,250,000 | ||||||
| Payments for deferred financing costs |
(3,233 | ) | (26,654 | ) | ||||
| Payments under agreement with iDevices |
(1,434 | ) | (119 | ) | ||||
| Interest rate swap settlement payments |
— | (2,441 | ) | |||||
| Proceeds from contribution of capital, net |
125 | 277 | ||||||
| Members’ distributions |
(2,048 | ) | (30,168 | ) | ||||
| Borrowings from revolving credit facility |
413,221 | — | ||||||
| Payments on revolving credit facility |
(153,801 | ) | — | |||||
| Payments of long-term debt |
— | (619,375 | ) | |||||
| Service on financing obligation |
— | (254 | ) | |||||
|
|
|
|
|
|||||
| Net cash provided by financing activities |
252,830 | 571,266 | ||||||
| Effect of exchange rate changes on cash and cash equivalents |
4,851 | 5,095 | ||||||
|
|
|
|
|
|||||
| Increase in cash and cash equivalents |
27,420 | 256,147 | ||||||
| Cash and cash equivalents at beginning of period |
44,665 | 123,792 | ||||||
|
|
|
|
|
|||||
| Cash and cash equivalents at end of period |
$ | 72,085 | $ | 379,939 | ||||
|
|
|
|
|
|||||
| Supplemental disclosures of cash flow information: |
||||||||
| Cash paid for interest |
$ | 24,864 | $ | 27,556 | ||||
| Cash paid for income taxes, net of refunds of $507 and $603, respectively |
$ | 6,121 | $ | 15,977 | ||||
| Supplemental disclosures of non-cash investing and financing information: |
||||||||
| Property and equipment included in accounts payable and accrued expenses |
$ | 5,176 | $ | 6,402 | ||||
| Deferred offering costs in accrued expenses |
$ | — | $ | 388 | ||||
| Settlement of existing relationship through business combination |
$ | — | $ | 9,776 | ||||
The accompanying notes are an integral part of these unaudited condensed consolidated financial statements.
F-52
Table of Contents
Notes to Condensed Consolidated Financial Statements
(All Amounts in Thousands of U.S. Dollars Unless Otherwise Indicated)
(unaudited)
1. Basis of Presentation and Significant Accounting Policies
The accompanying condensed consolidated financial statements of Weber-Stephen Products LLC (“Weber” or the “Company”) were prepared in accordance with generally accepted accounting principles (“GAAP”) in the United States (“U.S.”). In the opinion of management, the interim financial data includes all adjustments, consisting only of normal recurring adjustments, necessary to present a fair statement of the results for the interim periods.
Organization
The Company is primarily a manufacturer and distributor of gas and charcoal grills and related accessories, which are sold in North America, Europe, Australia and other locations throughout the world.
Principles of Consolidation
The condensed consolidated financial statements include the accounts and operations of the Company and its wholly owned subsidiaries. All significant intercompany accounts and transactions have been eliminated in consolidation.
Fiscal Year
The Company’s fiscal year runs from October 1 through September 30. All references to years are to fiscal years unless otherwise stated.
Use of Estimates
The preparation of condensed consolidated financial statements in conformity with U.S. GAAP requires management to make estimates and assumptions that affect the amounts reported in the condensed consolidated financial statements and accompanying notes. Actual results could differ from those estimates. The effect of the change in the estimates will be recognized in the current period of the change.
Seasonality
Although the Company generally has demand for its products throughout the year, the Company’s sales have historically experienced some seasonality. The Company has typically experienced its highest level of sales of its products in the second and third fiscal quarters as retailers across North America and Europe changeover their floor sets, build inventory and fulfill consumer demand for outdoor cooking products. Sales are typically lower during the first and fourth fiscal quarters, with the exception of the Australia/New Zealand business which is counter seasonal to the balance of the business.
Revenue Recognition
Revenue transactions associated with the sale of grills and related accessories comprise a single performance obligation, which consists of the transfer of products to customers at a point in time. Substantially all of the Company’s revenues relate to the sales of grills and accessories.
F-53
Table of Contents
WEBER-STEPHEN PRODUCTS LLC
Notes to Condensed Consolidated Financial Statements (continued)
(All Amounts in Thousands of U.S. Dollars Unless Otherwise Indicated)
(unaudited)
The Company satisfies the performance obligation and records revenues for grills and accessories when control has passed to the customer, based on the terms of sale. Transfer of control passes to customers at a point in time, that point in time generally being upon shipment or upon delivery of the performance obligation, depending on the written sales terms with the customer.
The Company’s purchase orders from customers for specific products represent its contracts and include all key terms and conditions related to the sale of products. For all sales, no significant uncertainty exists surrounding the customers’ obligation to pay for grills and accessories. Customers’ obligations to pay are generally under normal commercial terms, with payment terms typically being 30-60 days upon completion of the performance obligation. As payment terms are less than one year from the satisfaction of performance obligation, our sales do not include any significant financing components. Consideration promised in the Company’s contracts with certain customers is variable due to anticipated reductions, such as cash discounts and customer incentives (volume rebates and advertising programs). The transaction price is determined based upon the invoiced sales price, less anticipated reductions. The cost of these discounts and incentives are estimated at the inception of the contract based on the Company’s annual incentive programs with customers and recognized as a reduction to revenue at the time of sale. Subsequent adjustments to discounts or incentive programs are recognized to revenue in the period the adjustment is determinable.
The Company offers warranties on most of its products, which are considered assurance type warranties and, therefore, are not accounted for as a separate performance obligation.
The Company has elected to account for shipping and handling activities as a fulfillment cost. Accordingly, all shipping and handling activity costs are recognized as Selling, general and administrative expenses at the time the related revenue is recognized. The Company recognized shipping and handling activity costs of $46,372 and $73,900 for the six months ended March 31, 2020 and 2021, respectively. Amounts invoiced to customers for shipping and handling are recorded in Net sales. Any taxes collected on behalf of government authorities are excluded from Net sales.
Accounts Receivable
Accounts receivable consist primarily of amounts due to the Company from its normal business activities, offset by an allowance for expected credit losses. The Company estimates its expected credit losses based on historical experience, the aging of accounts receivable, consideration of current economic conditions and its expectations of future economic conditions. Additionally, the Company establishes customer-specific allowances for known at-risk accounts. The Company does not require collateral from its customers. Accounts receivable are written off when it is determined that the receivable will not be collected.
F-54
Table of Contents
WEBER-STEPHEN PRODUCTS LLC
Notes to Condensed Consolidated Financial Statements (continued)
(All Amounts in Thousands of U.S. Dollars Unless Otherwise Indicated)
(unaudited)
The Company’s allowances are as follows:
| Balance at September 30, 2019 |
$ | 2,858 | ||
| Charges (credits) to the provision, net |
673 | |||
| Accounts written off, net of recoveries |
(160 | ) | ||
|
|
|
|||
| Balance at March 31, 2020 |
$ | 3,371 | ||
|
|
|
|||
| Balance at September 30, 2020 |
$ | 3,262 | ||
| Charges (credits) to the provision, net |
114 | |||
| Accounts written off, net of recoveries |
(908 | ) | ||
|
|
|
|||
| Balance at March 31, 2021 |
$ | 2,468 | ||
|
|
|
Inventories
Inventories include finished products and work-in-process and materials associated with production and are valued at the lower of cost or market (net realizable value) using the first-in, first-out method. In evaluating net realizable value, appropriate consideration is given to obsolescence, excessive inventory levels, product deterioration and other factors.
The components of inventory are as follows:
| September 30, 2020 |
March 31, 2021 (unaudited) |
|||||||
| Work-in-process and materials |
$ | 33,343 | $ | 35,285 | ||||
| Finished products |
199,984 | 299,119 | ||||||
|
|
|
|
|
|||||
| Total Inventories, net |
$ | 233,327 | $ | 334,404 | ||||
|
|
|
|
|
|||||
Property, Equipment and Leasehold Improvements
During the fiscal year ended September 30, 2020, the Company determined that one of its manufacturing sites was considered to be assets held for sale, since the asset group was being marketed for sale and all the criteria to be classified as held for sale under Accounting Standards Codification (“ASC”) 360, Property, Plant and Equipment—Impairment or Disposal of Long-Lived Assets, had been met. The related buildings and its content were vacated and the Company no longer required these assets for its future operations. The carrying value of these assets was $8,297 as of September 30, 2020 and was recorded within Property, equipment and leasehold improvements, net. Assets held for sale are measured at the lower of their carrying value or the fair value less cost to sell. On December 30, 2020, the Company disposed of this manufacturing site, for net cash proceeds of $13,540, which resulted in a gain of $5,185.
Warranty
The Company offers warranties on most of its products. The specific terms and conditions of the warranties offered by the Company vary depending upon the product sold. The Company estimates the costs that may be incurred under its warranty plans and the period for which claims are honored, and records a liability in the amount of such costs at the time product revenue is recognized. Factors
F-55
Table of Contents
WEBER-STEPHEN PRODUCTS LLC
Notes to Condensed Consolidated Financial Statements (continued)
(All Amounts in Thousands of U.S. Dollars Unless Otherwise Indicated)
(unaudited)
that affect the Company’s warranty liability include the number of units sold, the type of products sold, historical and anticipated rates of warranty claims and cost per claim. The Company periodically assesses the adequacy of its recorded warranty liabilities and adjusts the amounts as necessary.
Deferred Financing Costs
Deferred financing costs are amortized over the term of the related debt. The carrying value of the deferred financing costs was $7,422 and $26,768 as of September 30, 2020 and March 31, 2021, respectively. Deferred financing costs related to long-term debt are reflected as a direct reduction of the carrying value of the related debt. Amortization expense of deferred financing costs was $1,223 and $1,858 for the six months ended March 31, 2020 and 2021, respectively, and was recorded in Interest expense.
Deferred Offering Costs
The Company capitalizes certain legal, accounting and other third-party fees that are directly associated with in-process equity financings as deferred offering costs until such financings are consummated. After consummation of an equity financing, these costs are recorded in members’ equity (deficit) as a reduction of equity generated as a result of the offering. Should the in-process equity financing be abandoned, the deferred offering costs will be expensed immediately as a charge to operating expenses in the condensed consolidated statements of income. The Company had $0 and $388 of deferred offering costs recorded within Prepaid expenses and other current assets as of September 30, 2020 and March 31, 2021, respectively.
Income Taxes
In the U.S., the Company, a limited liability company (LLC), is taxed as a partnership under the Internal Revenue Code. The Company’s income is included in the members’ income tax returns. Accordingly, the Company generally is not subject to federal or certain state income taxes. The Company has operations that are subject to income and other similar taxes in foreign countries. A valuation allowance is provided to offset deferred tax assets if, based on available evidence, it is more likely than not that some or all of the deferred tax assets will not be realized.
In accordance with ASC 740, Income Taxes, the Company evaluated the technical merits of its income tax positions and has established income tax reserves for uncertain tax positions for the six months ended March 31, 2020 and 2021. See Note 8 for further information.
The Company’s practice is to recognize interest and penalties related to income tax matters in Income taxes in the accompanying condensed consolidated statements of income. For the six months ended March 31, 2020 and 2021, there were no significant interest or penalties related to uncertain income tax positions that were recognized in the accompanying condensed consolidated statements of income.
Derivative Instruments
During the six months ended March 31, 2020 and 2021, the Company used interest rate swap contracts to reduce its exposure to fluctuations in interest rates. During the six months ended March 31, 2020 and 2021, the Company also entered into foreign currency forward contracts to reduce
F-56
Table of Contents
WEBER-STEPHEN PRODUCTS LLC
Notes to Condensed Consolidated Financial Statements (continued)
(All Amounts in Thousands of U.S. Dollars Unless Otherwise Indicated)
(unaudited)
its exposure to fluctuations in foreign currency denominated sales and the respective cash flows impacting Gross profit. When entered, these financial instruments are designated as cash flow hedges of underlying exposures and de-designated when the foreign currency denominated sale of inventory is made to a third party. The gains or losses from changes in the fair value of foreign exchange contracts de-designated as cash flow hedges are recorded in Foreign currency loss (gain).
During the six months ended March 31, 2021, the Company used commodity index contracts to reduce its exposure to fluctuations in cash flows relating to the purchases of aluminum and steel-based components and raw materials impacting Gross profit.
Cash flows related to the settlement of derivative instruments designated as cash flow hedges are classified within operating activities. Changes in the fair value of a derivative that is designated as a cash flow hedge, to the extent that the hedge is effective, are recorded in accumulated other comprehensive income (loss) and reclassified to earnings when the hedged item affects earnings.
Using derivative instruments means assuming counterparty credit risk. Counterparty credit risk relates to the loss the Company could incur if a counterparty were to default on a derivative contract. The Company deals with only investment-grade counterparties and monitors the overall credit risk and exposure to individual counterparties. The Company did not experience any nonperformance by a counterparty during the six months ended March 31, 2020 or 2021. The Company did not require, nor did it post, collateral or security on such contracts.
See Note 7 for further information.
Business Combinations
The Company uses its best estimates and assumptions to assign fair value to the tangible and intangible assets acquired and liabilities assumed at the acquisition date. The Company’s estimates are inherently uncertain and subject to refinement. During the measurement period, which may be up to one year from the acquisition date, the Company may record adjustments to the fair value of these tangible and intangible assets acquired and liabilities assumed, with the corresponding offset to goodwill. The Company continues to collect information and reevaluates these estimates and assumptions quarterly and records any adjustments to the Company’s preliminary estimates to goodwill provided that the Company is within the measurement period. Upon the conclusion of the measurement period or final determination of the fair value of assets acquired or liabilities assumed, whichever comes first, any subsequent adjustments are recorded to the Company’s condensed consolidated statements of income.
In the event that the Company acquires an entity in which the Company previously held an investment in an unconsolidated affiliate, the difference between the fair value of the shares as of the date of the acquisition and the carrying value of the investment is recorded as a gain or loss and recorded within Loss (gain) from investments in unconsolidated affiliates.
Income (Loss) Per Unit
Basic income (loss) per unit is computed using the weighted-average number of outstanding common units during the period. Diluted income (loss) per unit is computed using the weighted-average number of outstanding common units and, when dilutive, potential common units outstanding
F-57
Table of Contents
WEBER-STEPHEN PRODUCTS LLC
Notes to Condensed Consolidated Financial Statements (continued)
(All Amounts in Thousands of U.S. Dollars Unless Otherwise Indicated)
(unaudited)
during the period. For purposes of the diluted net income (loss) per unit calculation, common units issued in exchange for notes receivable with limited recourse provisions are considered to be potentially dilutive securities. See Note 15 for further information. Basic and diluted net income (loss) per unit attributable to common members is presented in conformity with the two-class method required for participating securities as vested awards under the Management Incentive Compensation Plan are considered to be participating securities. The two-class method determines net income (loss) per unit for common and participating securities according to dividends declared or accumulated and participation rights in undistributed income (loss). The two-class method requires income (loss) available to common members for the period to be allocated between common and participating securities based upon their respective rights to share in undistributed income (loss) as if all income (loss) for the period had been distributed.
Unit Based Compensation
As described within the Change in Accounting Principle section below, in anticipation of becoming a public company, the Company changed its methodology for valuing the profits interest units and Management Incentive Compensation Plan (“LTIP”) awards from the intrinsic value methodology to fair value during the quarter ended March 31, 2021. Both the LTIP awards and the profits interest units are liability classified. The awards are re-measured to their fair values at each reporting date with changes in the fair value recognized in compensation expense until settlement or cancellation. Compensation expense associated with the awards is recognized over the service period of the awards based on the graded-vesting method. The Company accounts for forfeitures as they occur.
The value of the LTIP awards is based on achievement of performance metrics established by the Compensation Committee of the Board of Directors. The value of the awards at the end of each reporting period is dependent upon the Company’s estimates of the underlying performance measures. As the units issued are based on performance metrics, the expense is adjusted for the ultimate number of units expected to be issued as of the end of each reporting period.
The fair value of the profits interest units is estimated using the Black-Scholes option-pricing valuation model. The determination of fair value using an option-pricing model is affected by the Company’s enterprise value as well as assumptions pertaining to several variables, including expected volatility, the expected term of the unit and the risk-free rate of interest. In the option-pricing model for the Company’s profits interest units, expected volatility is based on an analysis of reported data for a group of guideline publicly-traded companies. For this analysis, the Company selects companies with comparable characteristics including enterprise value, risk profiles, and with historical share price information sufficient to meet the expected life of the units. The Company determines expected volatility using an average of the historical volatilities of the guideline group of companies. The Company expects to continue to apply this process until such time as it has adequate historical data regarding volatility. The expected term of the unit is based on expected exercise patterns of unit holders and the risk-free rate of interest is based on U.S. Treasury yields.
Advertising Costs
The Company expenses advertising costs upon the first display of the advertisement and includes advertising expenses in Selling, general and administrative expenses in the condensed
F-58
Table of Contents
WEBER-STEPHEN PRODUCTS LLC
Notes to Condensed Consolidated Financial Statements (continued)
(All Amounts in Thousands of U.S. Dollars Unless Otherwise Indicated)
(unaudited)
consolidated statements of income. The Company incurred advertising expenses of $20,395 and $35,500 for the six months ended March 31, 2020 and 2021, respectively.
Research and Development Costs
Research and development costs are charged to expense as incurred and included in Selling, general and administrative expenses in the condensed consolidated statements of income. The Company incurred research and development expenses of $7,308 and $10,198 for the six months ended March 31, 2020 and 2021, respectively.
Change in Accounting Principle
Profits interest units and Management Incentive Compensation Plan (“LTIP”) awards historically were accounted for as liability compensatory awards under ASC 710, Compensation—General, and valued using the intrinsic value method, as permitted by ASC 718, Compensation—Stock Compensation, for nonpublic entities. In anticipation of becoming a public company, as defined in ASC 718, the Company changed its methodology for valuing the profits interest units and LTIP awards during the quarter ended March 31, 2021. While the profits interests units and LTIP awards will continue to be re-measured at each quarterly reporting date, the profits interests units and LTIP awards are required to be accounted for prospectively at fair value using a fair value pricing model, such as Black-Scholes. The effect of the change increased the profits interest liability by $23,089, which was the difference in compensation costs measured using the intrinsic value method and the fair value method. The LTIP awards were not impacted by the change in valuation methods due to the nature of the grant terms and underlying calculation.
New Accounting Pronouncements Recently Adopted
In March 2020, the FASB issued ASU 2020-04, Reference Rate Reform (Topic 848): Facilitation of the Effects of Reference Rate Reform on Financial Reporting. This ASU provides temporary optional expedients and exceptions to the GAAP guidance on contract modifications and hedge accounting to ease the financial reporting burdens related to the expected market transition from the London Interbank Offered Rate (“LIBOR”) and other interbank offered rates to alternative reference rates. This ASU is effective for all entities beginning as of its date of effectiveness, March 12, 2020. The guidance is temporary and can be applied through December 31, 2022. The guidance has not impacted the condensed consolidated financial statements to date. The Company will continue to monitor the impact of the ASU on our condensed consolidated financial statements in the future.
In December 2019, the FASB issued ASU 2019-12, Income Taxes (Topic 740): Simplifying the Accounting for Income Taxes. ASU 2019-12 intended to simplify various aspects of accounting for income taxes. The Company elected to early adopt ASU 2019-12 effective October 1, 2019. Certain components of this guidance were adopted on a prospective basis with the remaining components adopted on a modified retrospective basis. The adoption did not have a material impact on the Company’s condensed consolidated financial statements.
In August 2018, the FASB issued ASU 2018-15, Customer’s Accounting for Implementation Costs Incurred in a Cloud Computing Arrangement that is a Service Contract. ASU 2018-15 requires
F-59
Table of Contents
WEBER-STEPHEN PRODUCTS LLC
Notes to Condensed Consolidated Financial Statements (continued)
(All Amounts in Thousands of U.S. Dollars Unless Otherwise Indicated)
(unaudited)
implementation costs incurred by customers in cloud computing arrangements to be deferred over the noncancelable term of the cloud-computing arrangements plus any optional renewal periods (1) that are reasonably certain to be exercised by the customer or (2) for which exercise of the renewal option is controlled by the cloud service provider. The Company adopted this ASU effective October 1, 2020 using the prospective approach. The adoption of this ASU did not have a material impact on the Company’s condensed consolidated financial statements.
In August 2018, the FASB issued ASU 2018-13, Fair Value Measurement (Topic 820): Disclosure Framework—Changes to the Disclosure Requirements for Fair Value Measurement. ASU 2018-13 requires entities to disclose changes in unrealized gains and losses for the period included in other comprehensive income for recurring Level 3 fair value measurements and the range and weighted average of significant unobservable inputs used to develop Level 3 fair value measurements. Amendments in this guidance also require disclosure of transfers into and out of Level 3 of the fair value hierarchy, purchases and issues of Level 3 assets and liabilities, and clarify that the measurement uncertainty disclosure is as of the reporting date. The guidance removes requirements to disclose the amounts and reasons for transfers between Level 1 and Level 2, policy for timing between of transfers between levels, and the valuation processes for Level 3 fair value measurements. The updated guidance is effective for fiscal years, and interim periods within those fiscal years, beginning after December 15, 2019. The Company adopted the provisions of this ASU effective October 1, 2020. The adoption of this ASU did not have a material impact on the Company’s condensed consolidated financial statements.
In June 2016, the FASB issued ASU 2016-13, Financial Instruments—Credit Losses (Topic 326): Measurement of Credit Losses on Financial Instruments, which will require entities to measure all expected credit losses for financial instruments held at the reporting date based on historical experience, current conditions and reasonable supportable forecasts. This replaces the existing incurred loss model and is applicable to the measurement of credit losses on financial instruments measured at amortized cost and also applies to some off-balance sheet credit exposures. The Company adopted this ASU effective October 1, 2020. The adoption of this ASU did not have a material impact on the Company’s condensed consolidated financial statements.
New Accounting Pronouncements Issued but Not Yet Adopted
No recent accounting pronouncements were issued by the FASB that are believed by management to have a material impact on the Company’s future financial statements.
F-60
Table of Contents
WEBER-STEPHEN PRODUCTS LLC
Notes to Condensed Consolidated Financial Statements (continued)
(All Amounts in Thousands of U.S. Dollars Unless Otherwise Indicated)
(unaudited)
2. Goodwill and Other Intangibles
The Company’s goodwill consists of the following:
| Americas | EMEA | APAC | Total | |||||||||||||
| Balance as of September 30, 2019 |
$ | 19,219 | $ | 9,971 | $ | 593 | $ | 29,783 | ||||||||
| Foreign exchange |
— | 121 | (54 | ) | 67 | |||||||||||
|
|
|
|
|
|
|
|
|
|||||||||
| Balance as of March 31, 2020 |
$ | 19,219 | $ | 10,092 | $ | 539 | $ | 29,850 | ||||||||
|
|
|
|
|
|
|
|
|
|||||||||
| Balance as of September 30, 2020 |
$ | 19,219 | $ | 10,722 | $ | 629 | $ | 30,570 | ||||||||
| Acquisitions |
61,091 | — | — | 61,091 | ||||||||||||
| Foreign exchange |
— | 9 | 38 | 47 | ||||||||||||
|
|
|
|
|
|
|
|
|
|||||||||
| Balance as of March 31, 2021 |
$ | 80,310 | $ | 10,731 | $ | 667 | $ | 91,708 | ||||||||
|
|
|
|
|
|
|
|
|
|||||||||
The Company’s intangible assets consist of the following:
| September 30, 2020 | ||||||||||||
| Gross Carrying Amount |
Accumulated Amortization |
Net Book Value |
||||||||||
| Trademark—Weber |
$ | 310,000 | $ | — | $ | 310,000 | ||||||
| Trademarks—Other |
38,900 | (4,935 | ) | 33,965 | ||||||||
|
|
|
|
|
|
|
|||||||
| Trademarks, net |
348,900 | (4,935 | ) | 343,965 | ||||||||
|
|
|
|
|
|
|
|||||||
| Customer lists |
91,388 | (45,684 | ) | 45,704 | ||||||||
| Patents |
49,428 | (46,156 | ) | 3,272 | ||||||||
| Internally developed software |
5,700 | (5,700 | ) | — | ||||||||
| In-process research and development |
4,500 | (1,650 | ) | 2,850 | ||||||||
| Non-compete agreement |
600 | (560 | ) | 40 | ||||||||
|
|
|
|
|
|
|
|||||||
| Other intangible assets, net |
151,616 | (99,750 | ) | 51,866 | ||||||||
|
|
|
|
|
|
|
|||||||
| Total |
$ | 500,516 | $ | (104,685 | ) | $ | 395,831 | |||||
|
|
|
|
|
|
|
|||||||
| March 31, 2021 (unaudited) |
||||||||||||
| Gross Carrying Amount |
Accumulated Amortization |
Net Book Value |
||||||||||
| Trademark—Weber |
$ | 310,000 | $ | — | $ | 310,000 | ||||||
| Trademarks—Other |
55,900 | (6,385 | ) | 49,515 | ||||||||
|
|
|
|
|
|
|
|||||||
| Trademarks, net |
365,900 | (6,385 | ) | 359,515 | ||||||||
|
|
|
|
|
|
|
|||||||
| Customer lists |
91,736 | (48,083 | ) | 43,653 | ||||||||
| Patents |
49,428 | (47,261 | ) | 2,167 | ||||||||
| In-process research and development |
4,500 | (1,875 | ) | 2,625 | ||||||||
| Developed technology |
87,000 | (1,239 | ) | 85,761 | ||||||||
| Non-compete agreement |
6,300 | (1,006 | ) | 5,294 | ||||||||
|
|
|
|
|
|
|
|||||||
| Other intangible assets, net |
238,964 | (99,464 | ) | 139,500 | ||||||||
|
|
|
|
|
|
|
|||||||
| Total |
$ | 604,864 | $ | (105,849 | ) | $ | 499,015 | |||||
|
|
|
|
|
|
|
|||||||
F-61
Table of Contents
WEBER-STEPHEN PRODUCTS LLC
Notes to Condensed Consolidated Financial Statements (continued)
(All Amounts in Thousands of U.S. Dollars Unless Otherwise Indicated)
(unaudited)
During 2019, the Company acquired all rights to the trademark and intellectual property related to the Q Grill, originally licensed by the Company under previously issued license arrangements, in exchange for consideration of $35,500. The Company recorded an intangible asset for the acquisition of this trademark, and all license and royalty arrangements previously entered into were terminated upon execution of this arrangement. Payments for the acquired trademark were made in two installments, with the first payment of $17,500 made during the fiscal year ended September 30, 2019 and the second payment of $18,000 made during the fiscal year ended September 30, 2020. The Company began amortizing this asset after the execution of the agreement on a straight-line basis using an estimated useful life of 15 years.
The Company’s indefinite-lived intangible assets consist of Trademark—Weber.
As of March 31, 2021, the remaining weighted-average amortization periods of the intangible assets subject to amortization are as follows:
| Weighted- Average Years |
||||
| Trademarks—Other |
16.6 | |||
| Customer lists |
9.8 | |||
| Patents |
7.9 | |||
| In-process research and development |
5.8 | |||
| Developed technology |
14.8 | |||
| Non-compete agreement |
2.8 | |||
The Company expects to record the following amortization expense on intangible assets for each of the next five years and thereafter:
| Remaining period of 2021 |
$ | 8,295 | ||
| 2022 |
16,590 | |||
| 2023 |
16,585 | |||
| 2024 |
15,224 | |||
| 2025 |
14,680 | |||
| Thereafter |
117,641 | |||
|
|
|
|||
| Total |
$ | 189,015 | ||
|
|
|
Total amortization expense for the Company’s intangible assets was $6,855 and $6,864 for the six months ended March 31, 2020 and 2021, respectively.
F-62
Table of Contents
WEBER-STEPHEN PRODUCTS LLC
Notes to Condensed Consolidated Financial Statements (continued)
(All Amounts in Thousands of U.S. Dollars Unless Otherwise Indicated)
(unaudited)
3. Property, Equipment and Leasehold Improvements
Property, equipment and leasehold improvements, net consists of the following:
| September 30, 2020 |
March 31, 2021 (unaudited) |
|||||||
| Land |
$ | 12,530 | $ | 6,453 | ||||
| Buildings |
52,985 | 44,382 | ||||||
| Computer equipment and software |
66,166 | 70,659 | ||||||
| Equipment |
209,033 | 196,391 | ||||||
| Leasehold improvements |
17,264 | 12,746 | ||||||
|
Construction-in-progress |
8,075 | 15,316 | ||||||
|
|
|
|
|
|||||
| 366,053 | 345,947 | |||||||
| Accumulated depreciation and amortization |
(257,801 | ) | (241,331 | ) | ||||
|
|
|
|
|
|||||
| Total |
$ | 108,252 | $ | 104,616 | ||||
|
|
|
|
|
|||||
Depreciation and amortization expense amounted to $14,617 and $13,464 for the six months ended March 31, 2020 and 2021, respectively.
4. Acquisition
June Acquisition
On January 12, 2021, the Company acquired all of the remaining outstanding stock of June Life, Inc. (“June”), a smart appliance and technology company. The purpose of the acquisition was primarily to advance consumer experiences through the use of embedded technology in its products and higher quality digital products.
The preliminary composition of the purchase price recorded for June was as follows:
| Cash |
$ | 108,285 | ||
| Fair value of equity interest |
24,144 | |||
| Settlement of existing contractual relationship |
9,776 | |||
|
|
|
|||
| Total |
$ | 142,205 | ||
|
|
|
Prior to the acquisition, the Company held an existing equity interest in June, which was historically accounted for as an equity method investment. Upon completion of the merger agreement, June became a wholly-owned subsidiary of the Company. At the time of acquisition, the fair value of the existing equity interest totaled $24,144. See Note 5 for further details.
The June license and development agreement, discussed within Note 5, was deemed to be a contractual preexisting relationship. As a result of the business combination, the Company recorded this arrangement as consideration at its January 12, 2021 fair value, which resulted in an increase in goodwill of $9,776.
F-63
Table of Contents
WEBER-STEPHEN PRODUCTS LLC
Notes to Condensed Consolidated Financial Statements (continued)
(All Amounts in Thousands of U.S. Dollars Unless Otherwise Indicated)
(unaudited)
The results of operations for June have been included in the condensed consolidated statements of income since the acquisition date, which were not material. June operations are reflected within the Americas reportable segment. Actual and pro forma revenue and results of operations for the acquisition have not been presented because they do not have a material impact to the Company’s net sales and results of operations, either individually or in aggregate.
The March 31, 2021 condensed consolidated balance sheet includes the assets and liabilities of June, which have been measured at fair value as of the acquisition date. The Company believes that the information provides a reasonable basis for estimating the fair values of the acquired assets and assumed liabilities, but the potential for measurement period adjustments exists based on the Company’s continuing review of matters related to the acquisition. The primary areas that remain preliminary relate to the fair values of intangible assets acquired and their estimated useful lives, valuation of deferred taxes and residual goodwill. The Company expects to finalize the valuation as soon as practicable, but not later than one year from the acquisition date.
The preliminary allocation of purchase price recorded for June was as follows:
| Cash |
$ | 6,046 | ||
| Inventory |
480 | |||
| Accounts receivable |
85 | |||
| Prepaid expenses and other current assets |
617 | |||
| Property and equipment |
104 | |||
| Intangibles |
109,700 | |||
| Goodwill |
61,091 | |||
| Accounts payable |
(870 | ) | ||
| Accrued expenses |
(3,954 | ) | ||
| Other long-term liabilities |
(31,094 | ) | ||
|
|
|
|||
| Total |
$ | 142,205 | ||
|
|
|
The above fair values of assets acquired and liabilities are preliminary and are based on the information that was available as of the reporting date.
The goodwill of $61,091 represents the future economic benefits expected to arise from other intangible assets acquired that do not qualify for separate recognition, including an experienced workforce and expected future synergies.
The Company recognized $31,094 of deferred tax liabilities due to the acquisition of June. The deferred tax liabilities have been recorded in Other long-term liabilities in the accompanying condensed consolidated balance sheets.
F-64
Table of Contents
WEBER-STEPHEN PRODUCTS LLC
Notes to Condensed Consolidated Financial Statements (continued)
(All Amounts in Thousands of U.S. Dollars Unless Otherwise Indicated)
(unaudited)
The amounts, based on preliminary valuations and subject to final adjustment, allocated to intangible assets are as follows:
| Gross Carrying Amount |
||||
| Trade names and trademarks |
$ | 17,000 | ||
| Developed software / patented technology |
87,000 | |||
| Non-competition / restrictive covenant agreements |
5,700 | |||
|
|
|
|||
| Total |
$ | 109,700 | ||
|
|
|
|||
Developed software/patented technology were valued using the multi-period excess earnings method (“MPEEM”). Intangible assets consisting of trade names and trademarks and non-competition/restrictive covenant agreements were valued using the relief from royalty (“RFR”) method and lost income method, respectively. In many cases, the determination of fair values required estimates about discount rates, future expected cash flows and other future events that are judgmental and subject to change.
As a result of the acquisition, the Company recognized $1,187 of acquisition-related costs which are included in Selling, general and administrative expenses on the Company’s condensed consolidated statements of income.
5. Investments
During the fiscal year ended September 30, 2019, the Company executed an agreement with June to purchase $23,000 of June’s preferred stock and $1,269 of June’s common stock. The common stock investment represents 6% of the total outstanding common stock of June, and the total combined equity investment represents less than 20% of the voting interest in June.
The Company also entered into a license and development agreement with June to license certain software and other technology owned by June and adapt this technology to certain products of the Company. The license and development agreement includes provisions for the Company to pay June royalties at varying rates based on the quantities and type of product sold containing the licensed technology. As of September 30, 2020 and March 31, 2021, the Company had recorded prepaid royalties of $10,044 and $0, respectively. Upon the sale of products using the specified technology within the arrangement, the Company amortizes its prepaid royalty expenses into its operating results. Royalty expense of $1,103 and $268 was recognized under this agreement for the six months ended March 31, 2020 and 2021, respectively.
Prior to the acquisition of June, the Company determined it had significant influence over June due to the substantial impact of the license and development agreement on June’s operating results and cash flows. As a result, the Company has accounted for the common stock investment in June as an equity method investment and recorded its share of June’s earnings or losses. The Company computed the difference between the fair value of June’s net assets and the carrying value of those net assets in June’s financial statements (“basis differences”). The basis differences primarily related to the fair value of intangible assets. The basis differences were amortized over the remaining life of the assets or liabilities to which they relate and recognized as an adjustment to the equity in earnings of June in the Company’s condensed consolidated statements of income.
F-65
Table of Contents
WEBER-STEPHEN PRODUCTS LLC
Notes to Condensed Consolidated Financial Statements (continued)
(All Amounts in Thousands of U.S. Dollars Unless Otherwise Indicated)
(unaudited)
During the six months ended March 31, 2020 and 2021, the Company recorded an equity method loss of $2,778 and $1,405, respectively, with an offsetting reduction in its investment in June. During the six months ended March 31, 2020 and 2021, June equity method losses were allocated to the preferred stock investment as the cost basis in the common stock investment had been reduced to zero during the six months ended March 31, 2020. The carrying value of the preferred stock investment in June was $18,639 as of September 30, 2020 and was recorded in Other long-term assets. As described in Note 4, on January 12, 2021, the Company acquired the remaining equity interest in June and fully consolidated the entity. At acquisition, the Company remeasured the fair value of its existing equity interest, which exceeded the carrying amount of the investment and resulted in a pre-tax gain of $6,910. The gain offset with the equity method loss of $1,405 was recorded within Loss (gain) from investments in unconsolidated affiliates during the six months ended March 31, 2021. The Company calculated the fair value of its existing equity interest based on the per share prices paid to the sellers of common stock share and preferred stock on acquisition.
6. Debt
Long-term debt consists of the following:
| September 30, 2020 |
March 31, 2021 (unaudited) |
|||||||
| Secured Credit Facility Term Loan, due October 2027 |
$ | — | $ | 1,246,875 | ||||
| Senior Facility term loan, due December 2022 |
616,250 | — | ||||||
|
|
|
|
|
|||||
| Total borrowings |
616,250 | 1,246,875 | ||||||
| Deferred financing costs |
(4,341 | ) | (17,897 | ) | ||||
| Original issue discount |
— | (5,918 | ) | |||||
|
|
|
|
|
|||||
| Total debt |
611,909 | 1,223,060 | ||||||
| Less: current portion of long-term debt and other borrowings |
(36,250 | ) | (12,500 | ) | ||||
|
|
|
|
|
|||||
| Total long-term debt |
$ | 575,659 | $ | 1,210,560 | ||||
|
|
|
|
|
|||||
Aggregate maturities of long-term debt as of March 31, 2021, are as follows:
| Remaining period of 2021 |
$ | 6,250 | ||
| 2022 |
12,500 | |||
| 2023 |
12,500 | |||
| 2024 |
12,500 | |||
| 2025 |
12,500 | |||
| Thereafter |
1,190,625 | |||
|
|
|
|||
| Total |
$ | 1,246,875 | ||
|
|
|
F-66
Table of Contents
WEBER-STEPHEN PRODUCTS LLC
Notes to Condensed Consolidated Financial Statements (continued)
(All Amounts in Thousands of U.S. Dollars Unless Otherwise Indicated)
(unaudited)
Secured Credit Facility
On October 30, 2020, the Company retired its existing senior credit facility (“Senior Facility”) and entered into a new credit facility (the “Secured Credit Facility”) with a syndicate of financial institutions and investors. The Secured Credit Facility includes an initial term loan (“Term Loan”) of $1,250,000 and a revolving credit facility (“Revolving Loan”) with a maximum commitment of $300,000. The proceeds from the Term Loan were used, in part, to pay off the outstanding balance of $616,250 on the Senior Facility. Under the Secured Credit Facility, the Company’s U.S.-based assets, excluding real estate, are pledged as collateral, including its interests in certain foreign subsidiaries.
In connection with the Secured Credit Facility, the Company paid financing costs totaling $26,654, of which $25,154 related to the Term Loan and $1,500 related to the Revolving Loan, during the six months ended March 31, 2021. The Term Loan costs included an original issue discount of $6,250. The financing costs and original issue discount were recorded as deferred financing costs in the condensed consolidated balance sheets and are amortized over the remaining lives of the respective borrowing.
Under extinguishment accounting, the Company recorded a $5,448 Loss from early extinguishment of debt in the condensed consolidated statements of income, representing a write-off of unamortized deferred financing costs. This loss consisted of $4,173 related to the Senior Facility term loan and $1,275 related to Senior Facility revolving loan.
The Term Loan matures on October 30, 2027. Principal payments on the Term Loan commenced on March 31, 2021, and are payable quarterly at scheduled amounts, with the balance due at maturity. At the Company’s option, the Term Loan interest rate is based on either (i) London Interbank Offered Rate (“LIBOR”) for the relevant interest period, adjusted for statutory reserve requirements (subject to a floor of 0.75%), plus an applicable margin or (ii) a base rate equal to the highest of (a) the rate of interest publicly announced from time to time by the administrative agent as its “prime rate”, (b) the federal funds effective rate plus 0.50% and (c) adjusted LIBOR for an interest period of one month plus 1.00% (subject to a floor of 0.00% per annum), in each case, plus an applicable margin. As of March 31, 2021, the interest rate on the Term Loan was LIBOR plus 3.25%. Interest is payable on the last business day of the month for the relevant interest period selected.
The Revolving Loan matures on October 30, 2025, and it provides for borrowings of a maximum commitment of $300,000 and up to $30,000 for the issuance of standby and commercial letters of credit. The Revolving Loan also provides for $25,000 for swingline loans and no sub-limit for multicurrency borrowings that reduce the amount of available borrowings. The proceeds of any borrowings made under the Revolving Loan can be used to finance working capital needs, member distributions, acquisitions, capital expenditures and for other general purposes. As of March 31, 2021, the Revolving Loan had borrowings outstanding of $0 and letters of credit issued of $6,382, leaving $293,618 of available borrowing capacity. Commitment fees are based on the unused portion of the Revolving Loan at a rate of 0.30%, which can fluctuate based on the average leverage ratio.
Borrowings under the Revolving Loan bear interest at a rate equal to, at the Company’s option, either (i) LIBOR for the relevant interest period, adjusted for statutory reserve requirements (subject to a floor of 0.00% per annum), plus an applicable margin or (ii) a base rate equal to the highest of (a) the rate of interest publicly announced from time to time by the administrative agent as its “prime rate”, (b)
F-67
Table of Contents
WEBER-STEPHEN PRODUCTS LLC
Notes to Condensed Consolidated Financial Statements (continued)
(All Amounts in Thousands of U.S. Dollars Unless Otherwise Indicated)
(unaudited)
the federal funds effective rate plus 0.50% and (c) adjusted LIBOR for an interest period of one month plus 1.00% (subject to a floor of 0.00% per annum), in each case, plus an applicable margin. The applicable margin can fluctuate based on the average leverage ratio, as defined in the Secured Credit Facility. Interest is payable in March, June, September and December during the term of the agreement on the last business day of the calendar quarter. There were no borrowings on the Revolving Loan at any point during the six months ended March 31, 2021.
The Secured Credit Facility contains certain restrictive covenants relating to, among other things, limitations on indebtedness, transactions with affiliates, sales of assets, acquisitions, and members’ distributions. In addition, above a certain borrowing level, there is a financial covenant relating to the Company’s average leverage ratio. As of March 31, 2021, the Company was in compliance with all debt covenants.
Senior Facility
Prior to the retirement of the Senior Facility described above, borrowings under the Senior Facility’s revolving line of credit bore interest at a rate equal to, at the Company’s option, either: (i) LIBOR for the relevant currency borrowed, plus an applicable margin; or (ii) a base determined by reference to the highest of: (a) the prime rate, (b) the federal funds effective rate plus 0.5%, or (c) the LIBOR applicable for an interest period of one month plus 1.0%, plus an applicable margin. As of September 30, 2020, the interest rate on the term loan under the Senior Facility was LIBOR plus 2.25%. The weighted average interest rate for revolving credit facility borrowings under the Senior Facility for the six months ended March 31, 2020 was 3.86%.
Interest paid for the six months ended March 31, 2020 and 2021 amounted to $24,864 and $27,556, respectively.
7. Derivative Instruments
Interest Rate Swap Contracts
The Company uses interest rate swap contracts to minimize the effect of fluctuating variable interest rates under the Senior Facility and the Secured Credit Facility on Interest expense within its reported operating results. As cash flow hedges, the interest rate swaps are revalued at current market rates, with the changes in valuation reflected directly in Other comprehensive income (loss). The gains or losses on the interest rate swaps reported in Accumulated other comprehensive income (loss) in members’ equity are reclassified into Interest expense in the periods in which the monthly interest settlement is paid on the interest rate swap.
See Note 11 for further information.
The notional values of the Company’s outstanding interest rate swap contracts were as follows:
| September 30, 2020 |
March 31, 2021 (unaudited) |
|||||||
| Interest rate swap contracts |
$ | 410,000 | $ | 1,220,000 | ||||
F-68
Table of Contents
WEBER-STEPHEN PRODUCTS LLC
Notes to Condensed Consolidated Financial Statements (continued)
(All Amounts in Thousands of U.S. Dollars Unless Otherwise Indicated)
(unaudited)
During the six months ended March 31, 2021, the Company completed a series of transactions to amend and extend certain interest rate swap agreements by an additional three years. These interest rate swap transactions consisted of the following during the six months ended March 31, 2021: (i) $360,000 of the interest rate swaps presented in the table above were de-designated as cash flow hedges, (ii) the Company entered into a $360,000 pay-variable received-fixed interest rate swap which was designed to economically offset the terms of the $360,000 of swaps in (i) and which are not designated as cash flow hedges, and (iii) the Company entered into a $500,000 new pay-fixed interest rate swap with an extended maturity. The new pay-fixed interest rate swaps is considered a hybrid instrument with a financing component and an embedded at-market derivative that was designated as a cash flow hedge (see discussion of cash flow presentation below).
At the time of the de-designation of the above $360,000 in interest rate swaps, there was approximately $38,249 of unrealized losses recorded in Accumulated other comprehensive income (loss). This amount will be amortized to interest expense through the remaining term of the original de-designated swaps unless it becomes probable that the cash flows originally hedged will not occur, in which case the proportionate amount of the loss will be recorded to interest expense at that time. The $360,000 of interest rate swaps de-designated as cash flows hedges and the $360,000 of offsetting swaps will be marked to market with changes in fair value recognized, along with the fixed and variable payments on these swaps, in interest expense which are expected to nearly offset each other. The Company will present the derivatives on a gross basis on the balance sheet.
The new pay-fixed interest rate swap is a hybrid instrument in accordance with ASC 815, Derivatives and Hedging, consisting of a financing component and an embedded at-market derivative. The financing component is accounted for at amortized cost over the life of the swap while the embedded at-market derivative is accounted for at fair value on the balance sheet and designated as a cash flow hedge. This new $500,000 swap is indexed to one-month LIBOR and is net settled on a monthly basis with the counterparty for the difference between the fixed rate of 2.2025% and the variable rate based upon one-month LIBOR (subject to a floor of 0.75%) as applied to the notional amount of the swap. In connection with the transactions discussed above, no cash was exchanged between the Company and the counterparty. The liability of the terminated interest rate swaps as well as the inception value of the receive-fixed interest rate swap was blended into the new pay-fixed interest rate swap. Cash settlements related to interest rate contracts will generally be classified as operating activities on the condensed consolidated statements of cash flows. The cash flows related to the portion of the hybrid instrument treated as debt are classified as financing activities in the condensed consolidated statements of cash flows while the portion treated as an at-market derivative is classified as operating activities.
Foreign Currency Forward Contracts
The Company enters into foreign currency forward contracts to minimize the effect of fluctuating variable foreign currency denominated cash flows impacting gross profit within its reported operating results. As cash flow hedges, the forward contracts are revalued at current foreign exchange rates with the changes in the valuation reflected directly in Accumulated other comprehensive income (loss). The gains or losses on the forward contracts reported in Accumulated other comprehensive income (loss) in members’ equity are reclassified into Cost of goods sold in the period or periods in which the foreign currency denominated sale of inventory is made to a third party and the contracts are de-designated. The gains or losses from changes in the fair value of foreign exchange contracts de-designated as
F-69
Table of Contents
WEBER-STEPHEN PRODUCTS LLC
Notes to Condensed Consolidated Financial Statements (continued)
(All Amounts in Thousands of U.S. Dollars Unless Otherwise Indicated)
(unaudited)
cash flow hedges are recorded in Foreign currency loss (gain). The Company also enters into foreign currency forward contracts that economically hedge its risk on foreign currency denominated receivables. The gains or losses from changes in fair value on these contracts are recorded in Foreign currency loss (gain).
The notional values of the Company’s outstanding foreign currency forward contracts were as follows:
| September 30, 2020 |
March 31, 2021 (unaudited) |
|||||||
| Foreign currency forward contracts |
$ | 5,730 | $ | 99,705 | ||||
See Note 11 for further information.
Cash Flow Hedges Impact on the Condensed Consolidated Statements of Comprehensive Income
For derivatives designated as cash flow hedges, the (loss) gain recognized in other comprehensive income (loss) was:
| Six Months Ended March 31, | ||||||||
| 2020 | 2021 | |||||||
| Interest rate swap contracts |
$ | (16,707 | ) | $ | 18,465 | |||
| Foreign currency forward contracts |
(57 | ) | (117 | ) | ||||
|
|
|
|
|
|||||
| Total (loss) gain recognized |
$ | (16,764 | ) | $ | 18,348 | |||
|
|
|
|
|
|||||
Cash Flow Hedges Impact on the Condensed Consolidated Statements of Income
For derivatives designated as cash flow hedges, the loss reclassified from Accumulated other comprehensive income (loss) into the condensed consolidated statements of income was:
| Six Months Ended March 31, | ||||||||
| 2020 | 2021 | |||||||
| Interest rate swap contracts |
$ | (691 | ) | $ | (5,113 | ) | ||
| Foreign currency forward contracts |
(57 | ) | (132 | ) | ||||
|
|
|
|
|
|||||
| Total loss recognized |
$ | (748 | ) | $ | (5,245 | ) | ||
|
|
|
|
|
|||||
For derivatives de-designated as cash flow hedges and economic hedges on foreign currency denominated receivables, the gain recognized directly into Foreign currency loss (gain) in the condensed consolidated statements of income was:
| Six Months Ended March 31, | ||||||||
| 2020 | 2021 | |||||||
| Foreign currency forward contracts |
$ | 2,316 | $ | 917 | ||||
F-70
Table of Contents
WEBER-STEPHEN PRODUCTS LLC
Notes to Condensed Consolidated Financial Statements (continued)
(All Amounts in Thousands of U.S. Dollars Unless Otherwise Indicated)
(unaudited)
As of March 31, 2021, the Company estimates that it will recognize approximately $10,778 of losses associated with the above contracts in net income within the next 12 months.
Commodity Index Contracts
The Company enters into commodity index contracts to minimize the effect of fluctuating variable costs relating to the purchases of aluminum and steel-based components and raw materials. The commodity index contracts are accounted for as financial instruments and the Company did not apply hedge accounting. The Company did not enter into commodity index contracts during the six months ended March 31, 2020.
As financial instruments, the commodity index hedges are revalued at current commodity index rates with the changes in the valuation reflected directly in Cost of goods sold. The Company recorded a corresponding gain on the change in fair market value as follows:
| Six Months Ended March 31, | ||||||||
| 2020 | 2021 | |||||||
| Commodity index contracts |
$ | — | $ | (5,591 | ) | |||
See Note 11 for further information.
8. Income Taxes
For the six months ended March 31, 2021, the Company recognized tax expense of $15,389 on income before tax of $83,679. The Company’s effective tax rate of 18.4% was more favorable than the statutory rate due to nontaxable U.S. flow-through income and a discrete benefit of $1,115 for the release of valuation allowances on the Company’s United Kingdom and South Africa deferred tax assets. This benefit was partially offset by foreign taxes owed by foreign subsidiaries.
For the six months ended March 30, 2020, the Company recognized tax expense of $3,558 on income before taxes of $29,943. The Company’s effective tax rate of 11.9% was more favorable than the statutory rate due to nontaxable U.S. flow-through income. This benefit was partially offset by foreign taxes owed by foreign subsidiaries.
F-71
Table of Contents
WEBER-STEPHEN PRODUCTS LLC
Notes to Condensed Consolidated Financial Statements (continued)
(All Amounts in Thousands of U.S. Dollars Unless Otherwise Indicated)
(unaudited)
9. Commitments and Contingencies
Warranty
The following is an analysis of product warranty reserves and charges against those reserves:
| Balance at September 30, 2019 |
$ | 19,515 | ||
| Accrual for warranties issued |
3,187 | |||
| Warranty settlements made |
(1,500 | ) | ||
|
|
|
|||
| Balance at March 31, 2020 |
$ | 21,202 | ||
|
|
|
|||
| Balance at September 30, 2020 |
$ | 21,909 | ||
| Accrual for warranties issued |
5,141 | |||
| Acquired June warranty reserve |
759 | |||
| Warranty settlements made |
(3,235 | ) | ||
|
|
|
|||
| Balance at March 31, 2021 |
$ | 24,574 | ||
|
|
|
The balance of warranty reserves recorded in Other long-term liabilities was $17,995 and $19,584 as of September 30, 2020 and March 31, 2021, respectively. The remaining current balances of $3,914 and $4,990 as of September 30, 2020 and March 31, 2021, respectively, were recorded in Accrued expenses.
Contingent Consideration
As part of the 2016 acquisition of all aspects of the business related to iGrill and Kitchen Thermometer products from iDevices, LLC (“iDevices”), the Company has future cash payments due to iDevices in conjunction with an earn-out and development agreement. Under this agreement, the Company must pay iDevices a minimum of $8,000, and then additional royalty payments at fixed rates on iGrill and Kitchen Thermometer products sold for a total of 10 years or up to $15,000, whichever comes first. Under the terms of the earn-out and development agreement, the Company paid $1,434 and $119 for the six months ended March 31, 2020 and 2021, respectively. The fair value of the contingent consideration liability was $700 and $581 at September 30, 2020 and March 31, 2021, respectively. The fair value of these estimated future cash payments was based on valuation methods and management’s best estimates as of the date of acquisition and was recorded as a contingent consideration liability in Other long-term liabilities in the accompanying condensed consolidated balance sheets.
Legal Proceedings
The Company is subject to a variety of investigations, claims, suits and other legal proceedings that arise from time to time in the ordinary course of business including, but not limited to, intellectual property, employment, tort, and breach of contract matters. The Company currently believes that the outcomes of such proceedings, individually and in the aggregate, will not have a material adverse impact on its business, cash flows, financial position or results of operations. Any legal proceedings are subject to inherent uncertainties, and management’s view of these matters and their potential effects may change in the future.
F-72
Table of Contents
WEBER-STEPHEN PRODUCTS LLC
Notes to Condensed Consolidated Financial Statements (continued)
(All Amounts in Thousands of U.S. Dollars Unless Otherwise Indicated)
(unaudited)
10. Related Parties
Periodically, the Company engages in transactions with related parties, which include entities that are owned in whole or in part by certain owners or employees of the Company.
Rental expense for certain manufacturing and office facilities in the U.S., which were leased from related parties and charged against operations, amounted to $476 and $520 for the six months ended March 31, 2020 and 2021, respectively.
The Company adopted ASC 842 in fiscal year 2020. In connection with the manufacturing and office facilities located in the U.S., the Company had related party operating right-of-use assets of $4,111 and $3,636 at September 30, 2020 and March 31, 2021, respectively. Additionally, the Company had related party current operating lease liabilities of $0 and $1,110 and related party non-current operating lease liabilities of $4,139 and $2,536 at September 30, 2020 and March 31, 2021, respectively.
The Company has a royalty agreement with a related party for the use of the Company’s trademark. Royalty revenue from this agreement was $282 and $(54) for the six months ended March 31, 2020 and 2021, respectively. Fiscal 2021 royalty revenues reflect the impact of a retroactive discount totaling $110, which was granted to the related party as a COVID-19 concession. The Company had a royalty receivable of $220 and $166 from this related party at September 30, 2020 and March 31, 2021, respectively.
As described in Note 5, the Company entered into a series of transactions with June during the fiscal year ended September 30, 2019. As of September 30, 2020 and March 31, 2021, the Company recorded prepaid royalties of $10,044 and $0, respectively. For the six months ended March 31, 2020 and 2021, the Company recorded royalty expense of $1,103 and $268, respectively. As a result of the acquisition described in Note 4, June has become a wholly-owned subsidiary of the Company and is consolidated in its financial statements. As such, the Company will no longer record related party transactions with June.
The Company has notes receivable due from members, including interest, of $9,284 and $10,415 at September 30, 2020 and March 31, 2021, respectively. Related party interest income associated with the full recourse member notes was $28 and $29 for the six months ended March 31, 2020 and 2021, respectively. See Note 16 for further information.
11. Fair Value of Financial Instruments
With respect to financial assets and liabilities, fair value is defined as the exchange price that would be received for an asset, or paid to transfer a liability (an exit price), in the principal or most advantageous market for the asset or liability in an orderly transaction between market participants on the measurement date. Valuation techniques used to measure fair value must maximize the use of observable inputs and minimize the use of unobservable inputs. A fair value hierarchy has been established based on three levels of inputs, of which the first two are considered observable and the last unobservable.
| • | Level 1—Quoted prices in active markets for identical assets or liabilities. These are typically obtained from real-time quotes for transactions in active exchange markets involving identical assets. |
F-73
Table of Contents
WEBER-STEPHEN PRODUCTS LLC
Notes to Condensed Consolidated Financial Statements (continued)
(All Amounts in Thousands of U.S. Dollars Unless Otherwise Indicated)
(unaudited)
| • | Level 2—Inputs other than quoted prices included within Level 1 that are observable for the asset or liability, either directly or indirectly. These are typically obtained from readily available pricing sources for comparable instruments. |
| • | Level 3—Unobservable inputs, where there is little or no market activity for the asset or liability. These inputs reflect the reporting entity’s own assumptions of the data that market participants would use in pricing the asset or liability based on the best information available in the circumstances. |
The Company had interest rate swap contracts held with financial institutions as of September 30, 2020 and March 31, 2021, classified as Level 2 financial instruments, which are valued using observable underlying interest rates and market-determined risk premiums at the reporting date.
The Company had foreign currency forward contracts held with financial institutions as of September 30, 2020 and March 31, 2021, classified as Level 2 financial instruments, which are valued using observable forward foreign exchange rates at the reporting date.
The Company had commodity index contracts held with financial institutions as of September 30, 2020 and March 31, 2021, classified as Level 2 financial instruments, which are valued using observable commodity index rates at the reporting date.
The Company had a contingent consideration liability as of September 30, 2020 and March 31, 2021, classified as a Level 3 instrument, in conjunction with its fiscal year ended September 30, 2016 acquisition of all aspects of the business related to iGrill and Kitchen Thermometer products from iDevices. The fair value of these estimated future cash payments was determined based on valuation methods and estimates of future cash flows. See Note 9 for further details.
The fair value of financial assets and liabilities measured on a recurring basis was as follows:
| September 30, 2020 |
Level 1 | Level 2 | Level 3 | |||||||||||||
| Accrued expenses: |
||||||||||||||||
| Foreign currency forward contracts |
$ | 223 | $ | — | $ | 223 | $ | — | ||||||||
| Commodity index contracts |
73 | — | 73 | — | ||||||||||||
| Interest rate swap contracts |
9,324 | — | 9,324 | — | ||||||||||||
|
|
|
|
|
|
|
|
|
|||||||||
| Total |
$ | 9,620 | $ | — | $ | 9,620 | $ | — | ||||||||
|
|
|
|
|
|
|
|
|
|||||||||
| Other long-term liabilities: |
||||||||||||||||
| Interest rate swap contracts |
$ | 27,296 | $ | — | $ | 27,296 | $ | — | ||||||||
| Commodity index contracts |
28 | — | 28 | — | ||||||||||||
| Contingent consideration |
700 | — | — | 700 | ||||||||||||
|
|
|
|
|
|
|
|
|
|||||||||
| Total |
$ | 28,024 | $ | — | $ | 27,324 | $ | 700 | ||||||||
|
|
|
|
|
|
|
|
|
|||||||||
F-74
Table of Contents
WEBER-STEPHEN PRODUCTS LLC
Notes to Condensed Consolidated Financial Statements (continued)
(All Amounts in Thousands of U.S. Dollars Unless Otherwise Indicated)
(unaudited)
| March 31, 2021 (unaudited) |
Level 1 | Level 2 | Level 3 | |||||||||||||
| Prepaid expenses and other current assets: |
||||||||||||||||
| Foreign currency forward contracts |
$ | 1,751 | $ | — | $ | 1,751 | $ | — | ||||||||
| Commodity index contracts |
4,864 | — | 4,864 | — | ||||||||||||
| Interest rate swap contracts |
9,003 | — | 9,003 | — | ||||||||||||
|
|
|
|
|
|
|
|
|
|||||||||
| Total |
$ | 15,618 | $ | — | $ | 15,618 | $ | — | ||||||||
|
|
|
|
|
|
|
|
|
|||||||||
| Other long term assets: |
||||||||||||||||
| Interest rate swap contracts |
$ | 37,668 | $ | — | $ | 37,668 | $ | — | ||||||||
|
|
|
|
|
|
|
|
|
|||||||||
| Total |
$ | 37,668 | $ | — | $ | 37,668 | $ | — | ||||||||
|
|
|
|
|
|
|
|
|
|||||||||
| Accrued expenses: |
||||||||||||||||
| Interest rate swap contracts |
$ | 14,695 | $ | — | $ | 14,695 | — | |||||||||
|
|
|
|
|
|
|
|
|
|||||||||
| Total |
$ | 14,695 | $ | — | $ | 14,695 | $ | — | ||||||||
|
|
|
|
|
|
|
|
|
|||||||||
| Other long-term liabilities: |
||||||||||||||||
| Interest rate swap contracts |
$ | 46,512 | $ | — | $ | 46,512 | $ | — | ||||||||
| Contingent consideration |
581 | — | — | 581 | ||||||||||||
|
|
|
|
|
|
|
|
|
|||||||||
| Total |
$ | 47,093 | $ | — | $ | 46,512 | $ | 581 | ||||||||
|
|
|
|
|
|
|
|
|
|||||||||
The table below sets forth a summary of changes in fair value of the contingent consideration using Level 3 assumptions:
| Balance at September 30, 2019 |
$ | 1,610 | ||
| Royalty payments |
(1,434 | ) | ||
| Fair value adjustment |
730 | |||
|
|
|
|||
| Balance at March 31, 2020 |
$ | 906 | ||
|
|
|
|||
| Balance at September 30, 2020 |
$ | 700 | ||
| Royalty payments |
(119 | ) | ||
|
|
|
|||
| Balance at March 31, 2021 |
$ | 581 | ||
|
|
|
The carrying amounts reported in the Company’s accompanying condensed consolidated balance sheets for cash and cash equivalents, accounts receivable, and trade accounts payable approximate their fair values due to the short-term nature of these instruments. The carrying amounts reported in the Company’s accompanying condensed consolidated balance sheets for variable rate, revolving loan facilities also approximate fair values. The fair value of the fixed rate debt is not readily determinable, because the information is not available.
12. Management Incentive Compensation Plan
Since the fiscal year ended September 30, 2011, the Company has issued individual Management Incentive Compensation Plan (“LTIP” or the “Plan”) agreements. The Plan authorizes the grant of awards to certain key officers or employees of the Company and its subsidiaries. These
F-75
Table of Contents
WEBER-STEPHEN PRODUCTS LLC
Notes to Condensed Consolidated Financial Statements (continued)
(All Amounts in Thousands of U.S. Dollars Unless Otherwise Indicated)
(unaudited)
awards (the “Awards”) each represent a contractual right to payment of compensation in the future based on a calculated value as defined in the Plan.
The Awards are not units of the Company’s common stock, and a recipient of the Awards does not receive any ownership interest in the Company, member voting rights, or other incidents of ownership.
A total of $950 and $2,630 was paid out under the Plan during the six months ended March 31, 2020 and 2021, respectively.
Under the Plan, participants holding vested awards are entitled to receive cash payments on a pro rata basis in relation to any payments made to the holders of the Company’s common units paid in a general distribution. During the six months ended March 31, 2020 and March 31, 2021, respectively, participants received no cash payments as a result of a general distribution.
The Company had actual forfeitures in the amount of $0 and $201 for the six months ended March 31, 2020 and 2021, respectively.
The Company recorded additional compensation expense, due to an increase in the value of the awards, of $750 and $2,212 for the six months ended March 31, 2020 and 2021, respectively. The total liability related to the Plan was $7,021 and $6,402 as of September 30, 2020 and March 31, 2021, respectively. As of March 31, 2021, the current portion of this liability is $198 and is included in Accrued expenses to reflect the expected payout of these Awards during the next twelve months. The remaining liability is included in Other long-term liabilities. As of March 31, 2021, the Company had not yet recognized compensation cost on unvested awards of $6,057, with a weighted average remaining recognition period of 2 years.
13. Profits Interest Plan (amounts in thousands, except unit and per unit data)
The Company grants profits interest units with vesting periods ranging from one to five years to certain key employees in consideration for their services to or for the benefit of the Company. The profits interest units generally vest in three concurring installment periods of one to five years, in each case subject to the applicable holder’s continued employment through the applicable vesting date, provided that upon a termination for cause or a breach of restrictive covenants, all profits interest units held by the applicable holder will be forfeited.
The profits interest units are granted in three separate tranches, each of which is subject to a different distribution threshold. The tranches are subject to distribution thresholds that exceed the implied equity value of the Company at the time of grant, which were established in order to incentivize higher levels of performance. One third of the profits interest units have a distribution threshold of $2,000,000, one third of the profits interest units have a distribution threshold of $2,500,000, and one third of the profits interest units have a distribution threshold of $3,000,000. The weighted average distribution threshold for units outstanding as of September 30, 2020 and March 31, 2021 was $4,317 per unit. The profits interest units do not require the payment of an exercise price, but since they are economically similar to stock options they are treated as an instrument with an option like feature.
The units do not carry any voting rights, cannot be converted into common units and are settled in cash upon a liquidation event or a unitholder’s departure from the Company. A total of 24,638 total
F-76
Table of Contents
WEBER-STEPHEN PRODUCTS LLC
Notes to Condensed Consolidated Financial Statements (continued)
(All Amounts in Thousands of U.S. Dollars Unless Otherwise Indicated)
(unaudited)
units were outstanding as of September 30, 2020 and March 31, 2021. During the six months ended March 31, 2021 there were no additional units granted, vested or exercised. The aggregate intrinsic value of all units outstanding was zero and $9,993 as of September 30, 2020 and March 31, 2021, respectively. None of the profits interest units had vested as of March 31, 2021.
The associated liability and unit-based compensation for units granted under the Profits Interest Plan is determined using the Black-Scholes option pricing model. See Note 1 for discussion of the change in accounting principle regarding the valuation of the profit interest units. The weighted-average assumptions used to estimate the fair value of the profits interest units outstanding as of March 31, 2021 are as follows:
| Six Months Ended March 31, 2021 |
||||
| Fair value per unit |
$ | 1,669 | ||
| Expected term (in years) |
2.76 | |||
| Risk-free interest rate |
0.07 – 0.64 | % | ||
| Expected volatility |
44.5 | % | ||
| Expected dividend yield |
— | |||
The total fair value of outstanding units as of September 30, 2020 and March 31, 2021 was $0 and $43,155, respectively, of which $30,034 was recognized as compensation expense within Selling, general and administrative expenses during the six months ended March 31, 2021. As of March, 31 2021, there was $13,121 of total unrecognized compensation cost related to non-vested profits interest units. The remaining unrecognized compensation cost is expected to be recognized over a weighted-average period of 1.7 years.
14. Segments
The Company has three operating segments, Americas, which consists of Canada, Chile, Mexico and the United States; the European, Middle East and African regions (“EMEA”); and the Asia-Pacific region (“APAC”), which includes Australia and New Zealand. The Company’s reportable segments consist of Americas, EMEA and APAC. Corporate/Other is not an operating segment and includes unallocated corporate and certain supply chain expenses and assets (consisting primarily of cash, land, buildings and equipment, certain intangible assets (trademark) and deferred tax assets), inter-segment eliminations and other adjustments to segment results necessary for the presentation of condensed consolidated financial results in accordance with GAAP. Internal revenue transactions between the Company’s segments are immaterial. Each operating segment derives its revenues from the provision of gas, pellet and charcoal grills and related accessories to customers.
The Company’s CODM is the Chief Executive Officer (“CEO”). The CEO reviews financial information presented on a consolidated basis, accompanied by disaggregated information about the Company’s revenue and profitability, for purposes of making operating decisions, assessing financial performance and allocating resources. The CODM receives discrete financial information by segment.
The CODM reviews adjusted income from operations as the key segment measure of performance. Adjusted income from operations is defined as income from operations adjusted for unallocated net expenses, non-cash stock compensation / LTIP and profits interest expense, impairment costs, and gain on disposal of assets held for sale. Adjusted income from operations excludes interest income, interest expense, loss from early extinguishment of debt, income taxes, and loss (gain) from investments in unconsolidated affiliates.
F-77
Table of Contents
WEBER-STEPHEN PRODUCTS LLC
Notes to Condensed Consolidated Financial Statements (continued)
(All Amounts in Thousands of U.S. Dollars Unless Otherwise Indicated)
(unaudited)
The information below summarizes key financial performance measures by reportable segment for the six months ended March 31, 2020 and 2021:
| Six Months Ended March 31, 2020 |
||||||||||||||||||||
| Americas | EMEA | APAC | Corporate/Other | Total | ||||||||||||||||
| Net sales |
$ | 334,860 | $ | 207,203 | $ | 54,313 | $ | — | $ | 596,376 | ||||||||||
| Adjusted income from operations(1) |
$ | 68,929 | $ | 45,740 | $ | 12,288 | $ | (75,712 | ) | $ | 51,245 | |||||||||
| Depreciation and amortization |
$ | 352 | $ | 1,081 | $ | 541 | $ | 19,498 | $ | 21,472 | ||||||||||
| Capital expenditures |
$ | 39 | $ | 5,724 | $ | 536 | $ | 11,965 | $ | 18,264 | ||||||||||
| (1) | Adjusted income from operations for each reportable segment includes cost of goods sold transfer price allocations and distribution allocations from Corporate/Other. Corporate/Other includes unallocated corporate and certain supply chain expenses, inter-segment eliminations and other adjustments, including business and operational transformation costs and COVID-19 costs. |
| Six Months Ended March 31, 2021 |
||||||||||||||||||||
| Americas | EMEA | APAC | Corporate/Other | Total | ||||||||||||||||
| Net sales |
$ | 552,209 | $ | 311,326 | $ | 99,774 | $ | — | $ | 963,309 | ||||||||||
| Adjusted income from operations(1) |
$ | 117,041 | $ | 98,136 | $ | 26,974 | $ | (93,981) | $ | 148,170 | ||||||||||
| Depreciation and amortization |
$ | 2,143 | $ | 870 | $ | 727 | $ | 16,588 | $ | 20,328 | ||||||||||
| Capital expenditures |
$ | 157 | $ | 3,120 | $ | 659 | $ | 13,418 | $ | 17,354 | ||||||||||
| (1) | Adjusted income from operations for each reportable segment includes cost of goods sold transfer price allocations and distribution allocations from Corporate/Other. Corporate/Other includes unallocated corporate and certain supply chain expenses, inter-segment eliminations and other adjustments, including business and operational transformation costs, debt refinancing and IPO costs and COVID-19 costs. |
Reconciliations
The information below provides a reconciliation of adjusted income from operations to income before taxes:
| Six Months Ended March 31, | ||||||||
| 2020 | 2021 | |||||||
| Segment adjusted income from operations |
||||||||
| Americas |
$ | 68,929 | $ | 117,041 | ||||
| EMEA |
45,740 | 98,136 | ||||||
| APAC |
12,288 | 26,974 | ||||||
|
|
|
|
|
|||||
| Segment adjusted income from operations for reportable segments |
126,957 | 242,151 | ||||||
| Unallocated net expenses |
(75,712 | ) | (93,981 | ) | ||||
| Adjustments to income before taxes |
||||||||
| Non-cash stock compensation / LTIP and profits interest expense |
(892 | ) | (32,479 | ) | ||||
| Gain on disposal of assets held for sale |
— | 5,185 | ||||||
| Interest income |
701 | 425 | ||||||
| Interest expense |
(21,111 | ) | (32,174 | ) | ||||
| Loss from early extinguishment of debt |
— | (5,448 | ) | |||||
|
|
|
|
|
|||||
| Income before taxes |
$ | 29,943 | $ | 83,679 | ||||
|
|
|
|
|
|||||
F-78
Table of Contents
WEBER-STEPHEN PRODUCTS LLC
Notes to Condensed Consolidated Financial Statements (continued)
(All Amounts in Thousands of U.S. Dollars Unless Otherwise Indicated)
(unaudited)
The information below provides a reconciliation of segment assets to total consolidated assets:
| September 30, 2020 | ||||||||||||||||||||
| Americas | EMEA | APAC | Corporate/Other | Total | ||||||||||||||||
| Segment assets(1) |
$ | 120,351 | $ | 77,477 | $ | 35,499 | $ | — | $ | 233,327 | ||||||||||
| All other(2) |
$ | 906,108 | ||||||||||||||||||
|
|
|
|||||||||||||||||||
| Total assets |
$ | 1,139,435 | ||||||||||||||||||
|
|
|
|||||||||||||||||||
| (1) | Inventory is the only segment asset reviewed by the CODM. |
| (2) | “All other” consists of assets that are not reviewed by the CODM at a segment level : cash and cash equivalents; accounts receivable; prepaid expenses and other current assets; property, equipment and leasehold improvements, net; operating lease right-of-use assets; other long-term assets; trademarks, net; other intangible assets, net; and goodwill. |
| March 31, 2021 | ||||||||||||||||||||
| Americas | EMEA | APAC | Corporate/Other | Total | ||||||||||||||||
| Segment assets(1) |
$ | 132,103 | $ | 168,819 | $ | 33,482 | $ | — | $ | 334,404 | ||||||||||
| All other(2) |
$ | 1,691,793 | ||||||||||||||||||
|
|
|
|||||||||||||||||||
| Total assets |
$ | 2,026,197 | ||||||||||||||||||
|
|
|
|||||||||||||||||||
| (1) | Inventory is the only segment asset reviewed by the CODM. |
| (2) | “All other” consists of assets that are not reviewed by the CODM at a segment level : cash and cash equivalents; accounts receivable; prepaid expenses and other current assets; property, equipment and leasehold improvements, net; operating lease right-of-use assets; other long-term assets; trademarks, net; other intangible assets, net; and goodwill. |
15. Income Per Unit
The computation of net income per unit is as follows:
| Six Months Ended March 31, | ||||||||
| (in thousands, except unit and per unit data) |
2020 | 2021 | ||||||
| Net income |
$ | 23,607 | $ | 73,795 | ||||
| Less: Net earnings allocated to participating securities |
(234 | ) | (610 | ) | ||||
|
|
|
|
|
|||||
| Net income attributable to common members |
$ | 23,373 | $ | 73,185 | ||||
| Units used in computation: |
||||||||
| Weighted-average common units outstanding(1) |
551,753 | 551,836 | ||||||
| Basic and diluted net income per unit |
$ | 42.36 | $ | 132.62 | ||||
| (1) | Amount excludes 2,263 and 2,573 Weber common units issued in exchange for partial-recourse notes in the six months ended March 31, 2020 and 2021, respectively. See Note 16 for further information. |
Anti-dilutive securities excluded from diluted weighted-average common units outstanding totaled 2,263 and 2,573 units exchanged for partial-recourse notes in the six months ended March 31, 2020 and 2021, respectively.
F-79
Table of Contents
WEBER-STEPHEN PRODUCTS LLC
Notes to Condensed Consolidated Financial Statements (continued)
(All Amounts in Thousands of U.S. Dollars Unless Otherwise Indicated)
(unaudited)
16. Member Notes
During the six months ended March 31, 2020 and 2021, certain employees of the Company purchased common units in exchange for a capital contribution of $500 and $1,250 respectively. In conjunction with the units purchased, the Company entered into notes receivable with certain individuals during the six months ended March 31, 2020 and 2021 with face values of $375 and $650, respectively.
For the six months ended March 31, 2020 and 2021, $7,295 and $8,320 of the issued member notes receivable, respectively, limit the recourse provisions of the Company to 50% should the value of the common units not be sufficient to satisfy the repayment of the member notes. In accordance with ASC 718, these member notes shall be accounted for as nonrecourse in their entirety as the limited recourse provisions of the member notes are not aligned with a corresponding percentage of the underlying common units. Therefore, the member notes are accounted for as if they were a stock option grant and no receivable for amounts due under the notes are recorded on the Company’s condensed consolidated balance sheet. As there is no requisite service period associated with the notes, unit-based compensation expense related to this award is being recognized upon issuance of the note based on the grant-date fair value of the award, which was determined using the Black-Scholes option-pricing model. Unit based compensation recognized in relation to the notes amounted to $142 and $430 for the six months ended March 31, 2020 and 2021, respectively.
All member notes bear interest at 2% to 4% per annum, dependent upon the specific rate terms in the notes. Interest on member notes is compounded annually. Interest on full recourse member notes is recognized in Interest income in the accompanying condensed consolidated statements of income. Interest on partial recourse member notes will be recognized in members’ equity as cash payments are made to the Company.
The total amount due from members on the notes receivable, including interest, was $9,284 and $10,415 as of September 30, 2020 and March 31, 2021, respectively. The notes receivable and the related accrued interest for full recourse notes of $1,483 and $1,460 as of September 30, 2020 and March 31, 2021, respectively, are reflected as reductions of members’ equity in the accompanying condensed consolidated statements of changes in members’ equity (deficit). The notes receivable outstanding and the related accrued interest for partial recourse notes are not reflected in the accompanying condensed consolidated financial statements, as they are accounted for as nonrecourse in their entirety. They will be recognized in members’ equity in the accompanying condensed consolidated statements of changes in members’ equity (deficit) when cash payments on these notes receivable and related accrued interest are made to the Company.
Effective January 1, 2015, the individuals holding these member notes, along with other individuals, assigned their common units of the Company to Weber-Stephen Management Pool LLC (“MPLLC”). The sole purpose of MPLLC is to hold such common units. As a result of this transaction, the relative ownership interests in the Company held by those individuals did not change and the member notes remain as due to the Company. Common unit purchases during the six months ended March 31, 2020 and 2021 were transacted through MPLLC.
F-80
Table of Contents
WEBER-STEPHEN PRODUCTS LLC
Notes to Condensed Consolidated Financial Statements (continued)
(All Amounts in Thousands of U.S. Dollars Unless Otherwise Indicated)
(unaudited)
17. Subsequent Events
The Company has evaluated subsequent events through June 23, 2021, the date that the Company’s condensed consolidated financial statements were issued. Subsequent events are events or transactions that occur after the condensed consolidated balance sheet date but before the condensed consolidated financial statements are issued.
Subsequent events can be one of two types: recognized or non-recognized. Recognized subsequent events are events or transactions that provide additional evidence about conditions that existed at the date of the condensed consolidated balance sheet, including estimates inherent in the process of preparing financial statements. Non-recognized subsequent events are events that provide evidence about conditions that did not exist at the date of the condensed consolidated balance sheet, but arose before the condensed consolidated financial statements were issued.
On April 1, 2021, the Company acquired substantially all of the assets of R. McDonald Co. Pty. Ltd., a sales and marketing company headquartered in Australia, for approximately $29,295 in cash and $14,229 in equity. As part of the acquisition, the Company reacquired R. McDonald’s exclusive rights to sell and market Weber products in Australia and New Zealand. The Company has not completed the accounting for this transaction given the proximity of the acquisition to the issuance date of these condensed consolidated financial statements.
In April 2021, the Company repurchased certain members’ units for $188,702, and issued a special dividend to members in an aggregate amount of $261,298.
In May 2021, we received $8,403 from certain borrowers of member notes to pay down the outstanding balance of partial recourse member notes and $491 to pay down the outstanding balance of full recourse member notes. As partial recourse notes are not reflected in the accompanying condensed consolidated financial statements per Note 16 above, the paydown of the partial recourse notes will be accounted for as an equity issuance in May.
There were no other significant recognized or non-recognized subsequent events through June 23, 2021.
F-81
Table of Contents

46,875,000 shares
Class A common stock
Weber Inc.
Preliminary Prospectus
Goldman Sachs & Co. LLC
BofA Securities
J.P. Morgan
BMO Capital Markets
Citigroup
UBS Investment Bank
Wells Fargo Securities
KeyBanc Capital Markets
Academy Securities
Cabrera Capital Markets LLC
Siebert Williams Shank
Telsey Advisory Group
, 2021
Until , 2021, all dealers that buy, sell or trade our Class A common stock, whether or not participating in this offering, may be required to deliver a prospectus. This is in addition to the dealers’ obligation to deliver a prospectus when acting as underwriters and with respect to their unsold allotments or subscriptions.
Table of Contents
PART II
Information Not Required in the Prospectus
Item 13. Other Expenses of Issuance and Distribution
| Amount to be paid |
||||
| SEC registration fee |
$ | 99,980 | ||
| FINRA filing fee |
137,961 | |||
| NYSE listing fee |
25,000 | |||
| Transfer agent’s fees |
7,500 | |||
| Printing and engraving expenses |
50,000 | |||
| Legal fees and expenses |
3,150,000 | |||
| Accounting fees and expenses |
11,007,000 | |||
| Miscellaneous |
2,890,469 | |||
|
|
|
|||
| Total |
$ | 17,367,910 | ||
|
|
|
|||
Each of the amounts set forth above, other than the SEC registration fee and the FINRA filing fee, is an estimate.
Item 14. Indemnification of Directors and Officers
Section 145 of the Delaware General Corporation Law, or DGCL, provides that a corporation may indemnify directors and officers as well as other employees and individuals against expenses (including attorneys’ fees), judgments, fines and amounts paid in settlement actually and reasonably incurred by such person in connection with any threatened, pending or completed actions, suits or proceedings in which such person is made a party by reason of such person being or having been a director, officer, employee or agent to the Registrant. The DGCL provides that Section 145 is not exclusive of other rights to which those seeking indemnification may be entitled under any bylaw, agreement, vote of stockholders or disinterested directors or otherwise. The Registrant’s bylaws provide for indemnification by the Registrant of its directors, officers and employees to the fullest extent permitted by the DGCL. The Registrant has entered into indemnification agreements with each of its current directors and executive officers to provide these directors and executive officers additional contractual assurances regarding the scope of the indemnification set forth in the Registrant’s certificate of incorporation and bylaws and to provide additional procedural protections. There is no pending litigation or proceeding involving a director or executive officer of the Registrant for which indemnification is sought.
Section 102(b)(7) of the DGCL permits a corporation to provide in its certificate of incorporation that a director of the corporation shall not be personally liable to the corporation or its stockholders for monetary damages for breach of fiduciary duty as a director, except for liability (i) for any breach of the director’s duty of loyalty to the corporation or its stockholders, (ii) for acts or omissions not in good faith or which involve intentional misconduct or a knowing violation of law, (iii) for unlawful payments of dividends or unlawful stock purchases, redemptions or other distributions, or (iv) for any transaction from which the director derived an improper personal benefit. The Registrant’s certificate of incorporation provides for such limitation of liability.
The Registrant maintains standard policies of insurance under which coverage is provided (a) to its directors and officers against loss rising from claims made by reason of breach of duty or other wrongful act, and (b) to the Registrant with respect to payments which may be made by the Registrant to such officers and directors pursuant to the above indemnification provision or otherwise as a matter of law.
II-1
Table of Contents
The proposed form of underwriting agreement filed as Exhibit 1.1 to this registration statement provides for indemnification of directors and officers of the Registrant by the underwriters against certain liabilities.
Item 15. Recent Sales of Unregistered Securities
The following list sets forth information regarding all securities sold or issued by the predecessors, including to the registrant, in the three years preceding the date of this registration statement. No underwriters were involved in these sales. There was no general solicitation of investors or advertising, and we did not pay or give, directly or indirectly, any commission or other remuneration, in connection with the offering of these shares. In each of the transactions described below, the recipients of the securities represented their intention to acquire the securities for investment only and not with a view to or for sale in connection with any distribution thereof, and appropriate legends were affixed to the securities issued in these transactions.
(a) Equity interests in Weber-Stephen Products LLC
Since January 1, 2018, Weber-Stephen Products LLC has issued 6,009 equity units of Weber-Stephen Products LLC to its employees, directors and entities owned or controlled by its employees and directors for an aggregate purchase price of $24,082,750.
On April 1, 2021, Weber-Stephen Products LLC issued 2,899 equity units of Weber-Stephen Products LLC to 1478 Chicago Pty. Ltd., an entity under common ownership with R. McDonald Co. Pty. Ltd., in connection with Weber’s acquisition of substantially all of the assets of R. McDonald Co. Pty. Ltd.
(b) LLC Units
Following the effectiveness of this registration statement, Weber HoldCo LLC expects to issue 269,321,463 LLC Units in connection with the transactions that we refer to as the Reorganization Transactions. These LLC Units will be issued to a limited number of investors, all of which have sufficient knowledge and experience in financial and business matters to make them capable of evaluating the merits and risks of the prospective investment.
(c) Class A common stock
Following the effectiveness of this registration statement, we expect to issue 32,326,931 shares of our Class A common stock in connection with the transactions that we refer to as the Reorganization Transactions. These shares will be issued to a limited number of investors, all of which have sufficient knowledge and experience in financial and business matters to make them capable of evaluating the merits and risks of the prospective investment.
(d) Class B common stock
Following the effectiveness of this registration statement, we expect to issue 269,321,463 shares of our Class B common stock in connection with the transactions that we refer to as the Reorganization Transactions. These shares will be issued to a limited number of investors, all of which have sufficient knowledge and experience in financial and business matters to make them capable of evaluating the merits and risks of the prospective investment.
The offers, sales and issuances of the securities described in (a), (b), (c) and (d) above were exempt from registration under the Securities Act of 1933 in reliance upon Section 4(a)(2) of the
II-2
Table of Contents
Securities Act as transactions by an issuer not involving any public offering. The recipients in each of these transactions acquired the securities for investment only and not with a view to or for sale in connection with any distribution thereof.
Item 16. Exhibits and Financial Statement Schedules
(a) The following exhibits are filed as part of this Registration Statement:
Exhibit Index
II-3
Table of Contents
| * | Previously filed |
| † | Management contract or compensatory plan or arrangement. |
(b) No financial statement schedules are provided because the information called for is not required or is shown either in the financial statements or the notes hereto.
Item 17. Undertakings
The undersigned Registrant hereby undertakes:
| (1) | The undersigned Registrant hereby undertakes to provide to the underwriter at the closing specified in the underwriting agreement certificates in such denominations and registered in such names as required by the underwriter to permit prompt delivery to each purchaser. |
| (2) | Insofar as indemnification for liabilities arising under the Securities Act of 1933 may be permitted to directors, officers and controlling persons of the Registrant pursuant to the provisions referenced in Item 14 of this registration statement, or otherwise, the Registrant has been advised that in the opinion of the Securities and Exchange Commission such indemnification is against public policy as expressed in the Securities Act of 1933 and is, therefore, unenforceable. In the event that a claim for indemnification against such liabilities (other than the payment by the Registrant of expenses incurred or paid by a director, officer, or controlling person of the Registrant in the successful defense of any action, suit or proceeding) is asserted by such director, officer or controlling person in connection with the securities being registered hereunder, the Registrant will, unless in the opinion of its counsel the matter has been settled by controlling precedent, submit to a court of appropriate jurisdiction the question of whether such indemnification by it is against public policy as expressed in the Act and will be governed by the final adjudication of such issue. |
| (3) | The undersigned Registrant hereby undertakes that: |
| (a) | for purposes of determining any liability under the Securities Act of 1933, the information omitted from the form of prospectus filed as part of this registration statement in reliance upon Rule 430A and contained in a form of prospectus filed by the Registrant pursuant to Rule 424(b)(1) or (4) or 497(h) under the Securities Act of 1933 shall be deemed to be part of this registration statement as of the time it was declared effective. |
| (b) | for the purpose of determining any liability under the Securities Act of 1933, each post-effective amendment that contains a form of prospectus shall be deemed to be a new registration statement relating to the securities offered therein, and the offering of such securities at that time shall be deemed to be the initial bona fide offering thereof. |
II-4
Table of Contents
Pursuant to the requirements of the Securities Act of 1933, the Registrant has duly caused this registration statement to be signed on its behalf by the undersigned, thereunto duly authorized, in Palatine, Illinois on the 27th day of July, 2021.
| Weber Inc. | ||||
| By: | /s/ Chris M. Scherzinger | |||
| Name: | Chris M. Scherzinger | |||
| Title: | Chief Executive Officer | |||
The undersigned directors of Weber Inc. hereby appoint each of Chris M. Scherzinger and William J. Horton as attorney-in-fact for the undersigned, with full power of substitution and resubstitution, for and in the name, place and stead of the undersigned, to sign and file with the Securities and Exchange Commission under the Securities Act of 1933 any and all amendments (including post-effective amendments) and exhibits to this registration statement on Form S-1 (or any other registration statement for the same offering that is to be effective upon filing pursuant to Rule 462(b) under the Securities Act of 1933) and any and all applications and other documents to be filed with the Securities and Exchange Commission pertaining to the registration of the securities covered hereby, with full power and authority to do and perform any and all acts and things whatsoever requisite and necessary or desirable, hereby ratifying and confirming all that said attorney-in-fact, or his substitute or substitutes, may lawfully do or cause to be done by virtue hereof.
Pursuant to the requirements of the Securities Act of 1933, as amended, this registration statement has been signed by the following persons in the capacities and on the dates indicated:
| Signature |
Title |
Date | ||
| /s/ Chris M. Scherzinger |
Chief Executive Officer, Director (principal executive officer)
|
July 27, 2021 | ||
| Chris M. Scherzinger | ||||
| * |
Chief Financial Officer (principal financial officer)
|
July 27, 2021 | ||
| William J. Horton | ||||
| * |
Global Controller, (principal accounting officer) |
July 27, 2021 | ||
| Marla Kilpatrick | ||||
| * Kelly D. Rainko |
Director, Chair of the Board | July 27, 2021 | ||
| /s/ Susan T. Congalton Susan T. Congalton |
Director | July 27, 2021 | ||
| * Elliott Hill |
Director | July 27, 2021 | ||
| * Martin McCourt |
Director | July 27, 2021 | ||
II-5
Table of Contents
| Signature |
Title |
Date | ||
| * Melinda R. Rich |
Director | July 27, 2021 | ||
| * James C. Stephen |
Director | July 27, 2021 | ||
| /s/ Magesvaran Suranjan Magesvaran Suranjan |
Director | July 27, 2021 | ||
| *By: | /s/ Chris M. Scherzinger | |
| Chris M. Scherzinger | ||
| Attorney-in-Fact |
II-6