Attached files
| file | filename |
|---|---|
| EX-99.3 - EX-99.3 - INFINITY PHARMACEUTICALS, INC. | a72721datapressrelease.htm |
| EX-99.1 - EX-99.1 - INFINITY PHARMACEUTICALS, INC. | a72721earningspressrelease.htm |
| 8-K - 8-K - INFINITY PHARMACEUTICALS, INC. | infi-20210727.htm |
Eganelisib Re-Programming Macrophages To Develop Best-In-Class Next-Generation Immunotherapies July 27, 2021
2 Cautionary Note Regarding Forward-Looking Statements This presentation contains forward-looking statements and information of Infinity Pharmaceuticals, Inc. (“we,” “us,” “our,” “Infinity” or the “Company”) within the meaning of The Private Securities Litigation Reform Act of 1995. All statements other than statements of historical facts contained in this presentation, are forward-looking statements. We often use words such as “anticipate,” “believe,” “estimate,” “expect,” “intend,” “may,” “plan,” “predict,” “project,” “target,” “milestone,” “goal,” “potential,” “will,” “would,” “could,” “should,” “continue,” and other words and terms of similar meaning to help identify forward-looking statements, although not all forward-looking statements contain these identifying words. You also can identify these forward- looking statements by the fact that they do not relate strictly to historical or current facts. Such forward-looking statements include those regarding the company’s expectations about: the therapeutic potential of PI3K-gamma selective inhibition and eganelisib, alone and in combination with other therapies; clinical trial plans, progress and enrollment projections; plans to present data; planning for a registration-enabling study in urothelial cancer and triple negative breast cancer; and the company’s ability to execute on its strategic plans. Such statements are subject to numerous important factors, risks and uncertainties that may cause actual events or results to differ materially from the company’s current expectations. For example, there can be no guarantee that eganelisib will successfully complete necessary preclinical and clinical development phases or that any positive developments with eganelisib will result in stock price appreciation. Management’s expectations and, therefore, any forward-looking statements in this presentation, could also be affected by risks and uncertainties relating to a number of other factors, including the following: Infinity’s results of clinical trials and preclinical studies, including subsequent analysis of existing data and new data received from ongoing and future studies; Infinity’s ability to obtain, maintain and enforce patent and other intellectual property protection for eganelisib; the content and timing of decisions made by the U.S. FDA and other regulatory authorities; Infinity’s ability to obtain and maintain requisite regulatory approvals and to enroll patients in its clinical trials; unplanned cash requirements and expenditures; and development of agents by Infinity's competitors for diseases in which Infinity is currently developing or intends to develop eganelisib. These and other risks which may impact management’s expectations are described in greater detail under the caption “Risk Factors” included in Infinity’s annual report and quarterly reports filed with the Securities and Exchange Commission (SEC), and other filings filed by Infinity with the SEC, available on the SEC’s website at www.sec.gov. Any forward-looking statements contained in this presentation speak only as of the date hereof, and Infinity expressly disclaims any obligation to update any forward-looking statements, whether as a result of new information, future events or otherwise. Infinity regularly uses its website to post information regarding its business, product development programs and governance.
3 Today’s Agenda MARIO-275 Overall Survival Results and Next Steps Brian Schwartz, MD, Consulting Chief Physician, Infinity Pharmaceuticals Q&A Discussion Erika Hamilton, MD; Brian Schwartz, MD; Adelene Perkins Eganelisib: Macrophage Reprogramming Therapeutic Candidate to Address High Unmet Medical Needs Adelene Perkins, Chair & CEO, Infinity Pharmaceuticals MARIO-3 Initial Durability & Early Look at PFS Erika Hamilton, MD, Medical Oncologist & MARIO-3 Lead Investigator, Tennessee Oncology
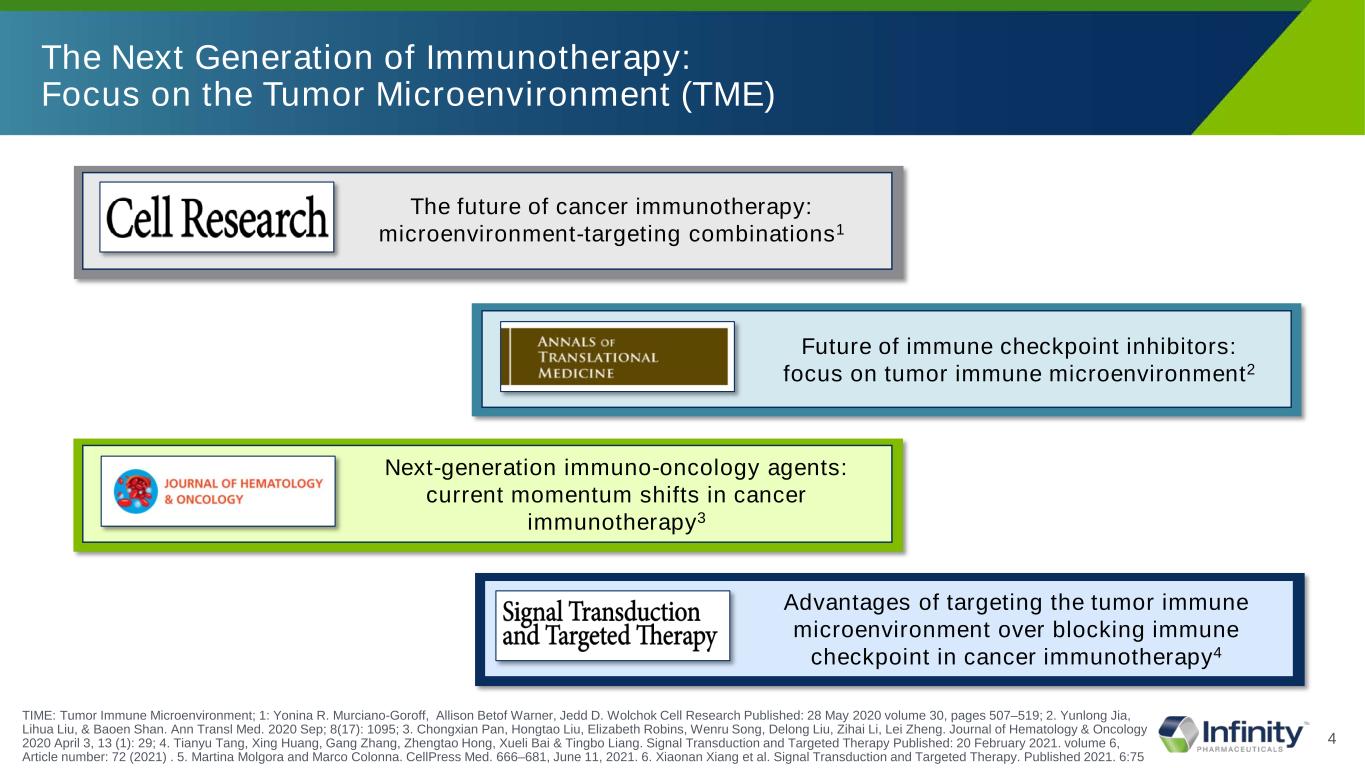
4 The Next Generation of Immunotherapy: Focus on the Tumor Microenvironment (TME) The future of cancer immunotherapy: microenvironment-targeting combinations1 Future of immune checkpoint inhibitors: focus on tumor immune microenvironment2 Next-generation immuno-oncology agents: current momentum shifts in cancer immunotherapy3 Advantages of targeting the tumor immune microenvironment over blocking immune checkpoint in cancer immunotherapy4 TIME: Tumor Immune Microenvironment; 1: Yonina R. Murciano-Goroff, Allison Betof Warner, Jedd D. Wolchok Cell Research Published: 28 May 2020 volume 30, pages 507–519; 2. Yunlong Jia, Lihua Liu, & Baoen Shan. Ann Transl Med. 2020 Sep; 8(17): 1095; 3. Chongxian Pan, Hongtao Liu, Elizabeth Robins, Wenru Song, Delong Liu, Zihai Li, Lei Zheng. Journal of Hematology & Oncology 2020 April 3, 13 (1): 29; 4. Tianyu Tang, Xing Huang, Gang Zhang, Zhengtao Hong, Xueli Bai & Tingbo Liang. Signal Transduction and Targeted Therapy Published: 20 February 2021. volume 6, Article number: 72 (2021) . 5. Martina Molgora and Marco Colonna. CellPress Med. 666–681, June 11, 2021. 6. Xiaonan Xiang et al. Signal Transduction and Targeted Therapy. Published 2021. 6:75
5 Macrophages in the TME Are Compelling Targets for the Next Generation of Immunotherapy TIME: Tumor Immune Microenvironment; 1: Yonina R. Murciano-Goroff, Allison Betof Warner, Jedd D. Wolchok Cell Research Published: 28 May 2020 volume 30, pages 507–519; 2. Yunlong Jia, Lihua Liu, & Baoen Shan. Ann Transl Med. 2020 Sep; 8(17): 1095; 3. Chongxian Pan, Hongtao Liu, Elizabeth Robins, Wenru Song, Delong Liu, Zihai Li, Lei Zheng. Journal of Hematology & Oncology 2020 April 3, 13 (1): 29; 4. Tianyu Tang, Xing Huang, Gang Zhang, Zhengtao Hong, Xueli Bai & Tingbo Liang. Signal Transduction and Targeted Therapy Published: 20 February 2021. volume 6, Article number: 72 (2021) . 5. Martina Molgora and Marco Colonna. CellPress Med. 666–681, June 11, 2021. 6. Xiaonan Xiang et al. Signal Transduction and Targeted Therapy. Published 2021. 6:75
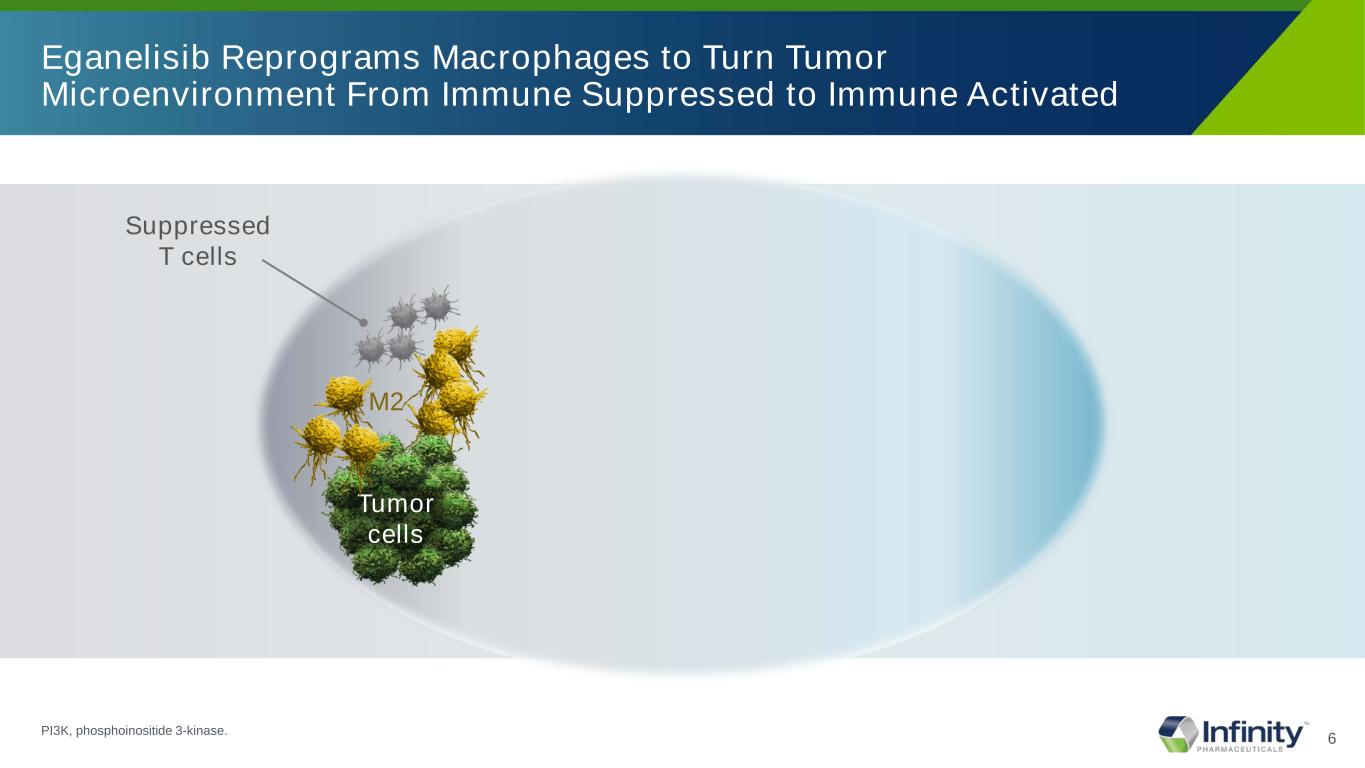
6 Eganelisib Reprograms Macrophages to Turn Tumor Microenvironment From Immune Suppressed to Immune Activated Suppressed T cells M2 Tumor cells PI3K, phosphoinositide 3-kinase.
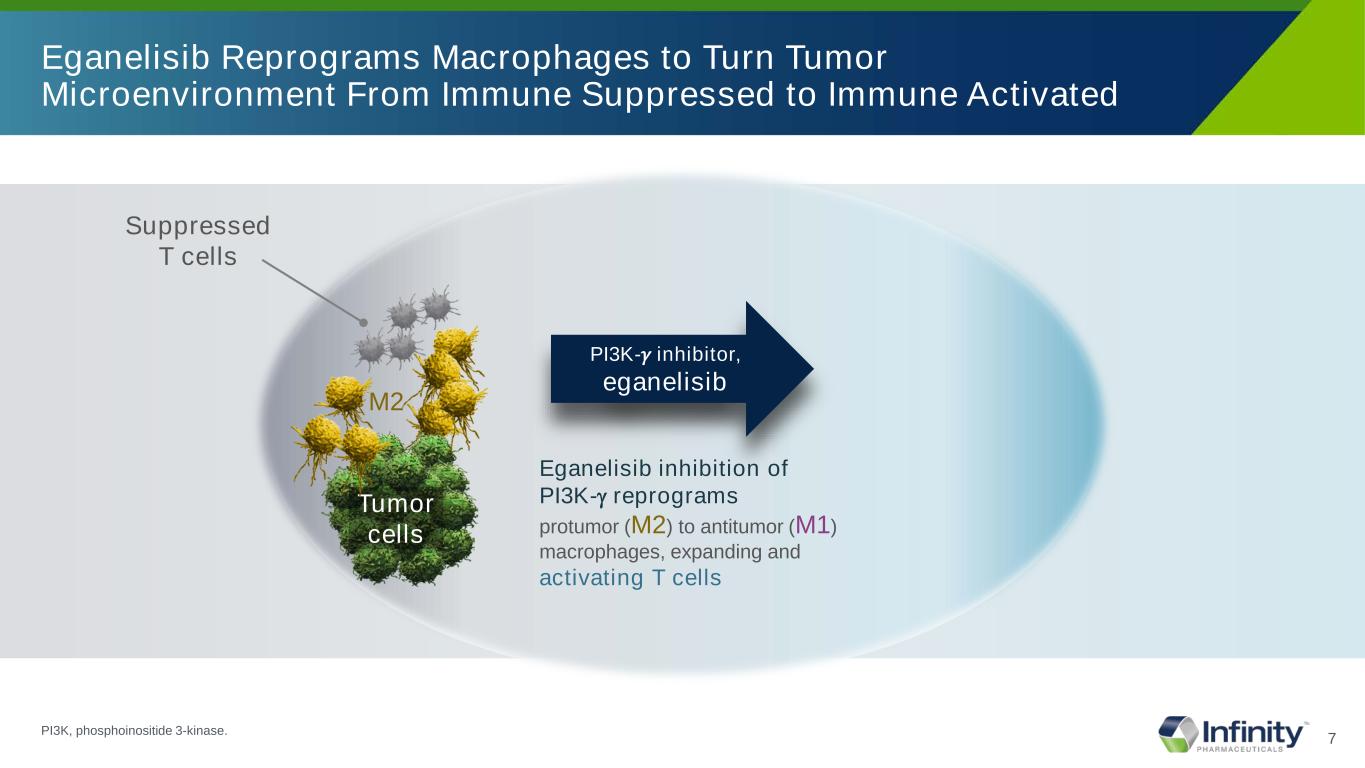
7 Eganelisib Reprograms Macrophages to Turn Tumor Microenvironment From Immune Suppressed to Immune Activated Suppressed T cells M2 Tumor cells Eganelisib inhibition of PI3K-γ reprograms protumor (M2) to antitumor (M1) macrophages, expanding and activating T cells PI3K-𝛾𝛾 inhibitor, eganelisib PI3K, phosphoinositide 3-kinase.
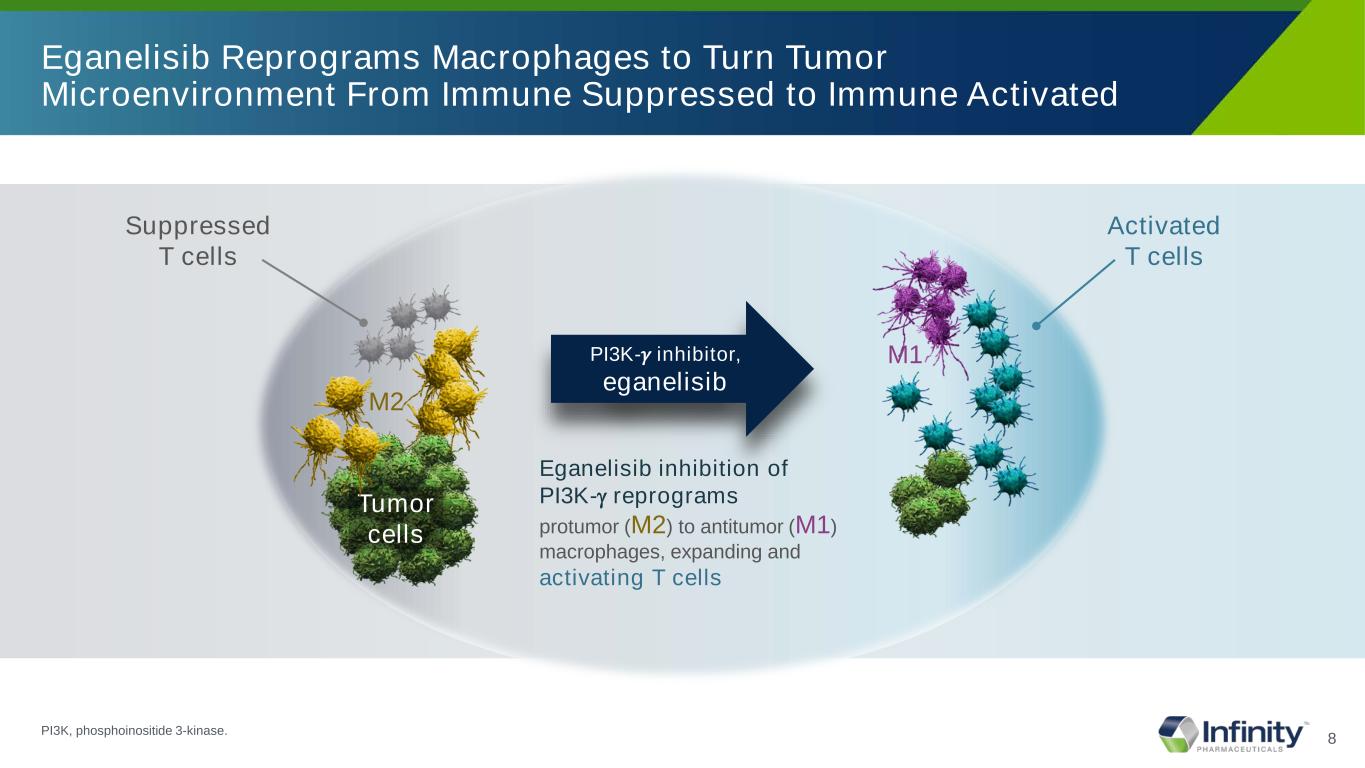
8 Eganelisib Reprograms Macrophages to Turn Tumor Microenvironment From Immune Suppressed to Immune Activated Suppressed T cells M2 Tumor cells Eganelisib inhibition of PI3K-γ reprograms protumor (M2) to antitumor (M1) macrophages, expanding and activating T cells PI3K-𝛾𝛾 inhibitor, eganelisib M1 Activated T cells PI3K, phosphoinositide 3-kinase.
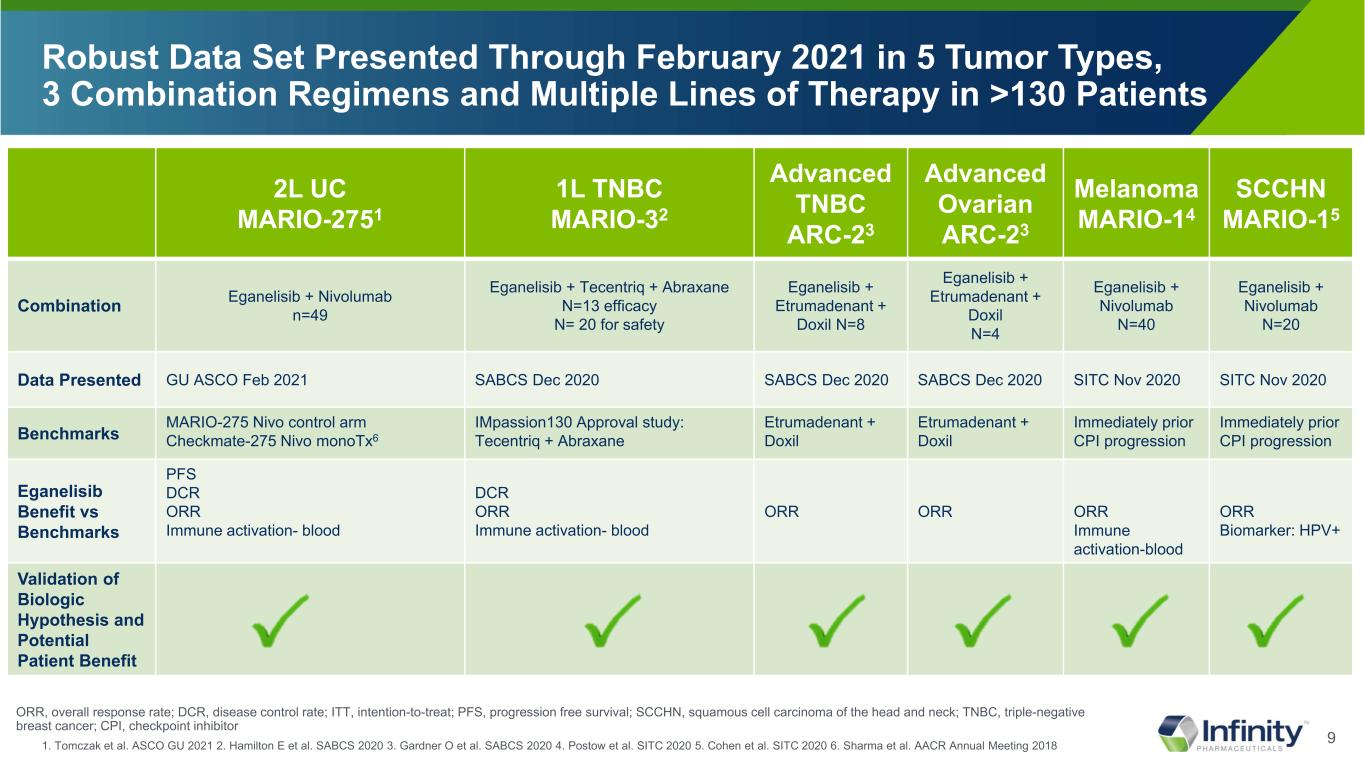
9 2L UC MARIO-2751 1L TNBC MARIO-32 Advanced TNBC ARC-23 Advanced Ovarian ARC-23 Melanoma MARIO-14 SCCHN MARIO-15 Combination Eganelisib + Nivolumab n=49 Eganelisib + Tecentriq + Abraxane N=13 efficacy N= 20 for safety Eganelisib + Etrumadenant + Doxil N=8 Eganelisib + Etrumadenant + Doxil N=4 Eganelisib + Nivolumab N=40 Eganelisib + Nivolumab N=20 Data Presented GU ASCO Feb 2021 SABCS Dec 2020 SABCS Dec 2020 SABCS Dec 2020 SITC Nov 2020 SITC Nov 2020 Benchmarks MARIO-275 Nivo control arm Checkmate-275 Nivo monoTx6 IMpassion130 Approval study: Tecentriq + Abraxane Etrumadenant + Doxil Etrumadenant + Doxil Immediately prior CPI progression Immediately prior CPI progression Eganelisib Benefit vs Benchmarks PFS DCR ORR Immune activation- blood DCR ORR Immune activation- blood ORR ORR ORR Immune activation-blood ORR Biomarker: HPV+ Validation of Biologic Hypothesis and Potential Patient Benefit Robust Data Set Presented Through February 2021 in 5 Tumor Types, 3 Combination Regimens and Multiple Lines of Therapy in >130 Patients 1. Tomczak et al. ASCO GU 2021 2. Hamilton E et al. SABCS 2020 3. Gardner O et al. SABCS 2020 4. Postow et al. SITC 2020 5. Cohen et al. SITC 2020 6. Sharma et al. AACR Annual Meeting 2018 ORR, overall response rate; DCR, disease control rate; ITT, intention-to-treat; PFS, progression free survival; SCCHN, squamous cell carcinoma of the head and neck; TNBC, triple-negative breast cancer; CPI, checkpoint inhibitor
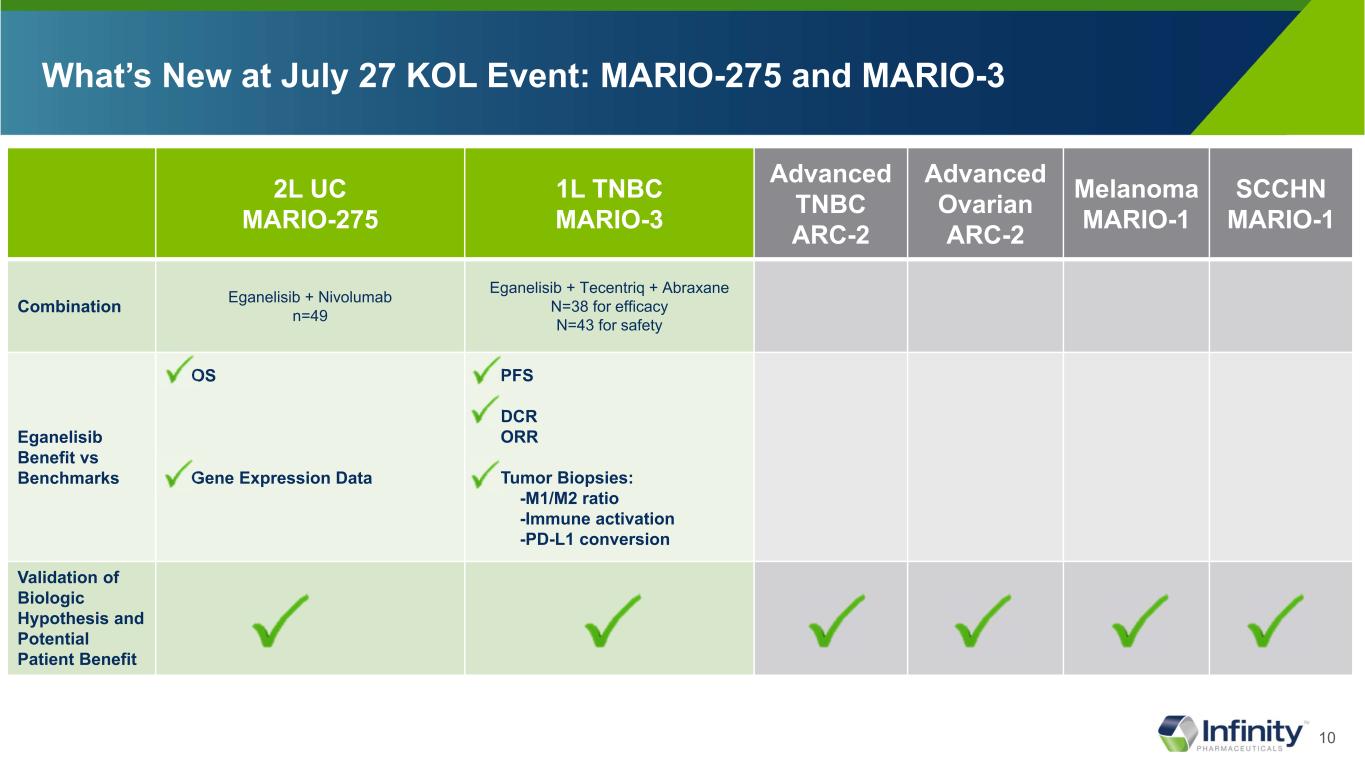
10 What’s New at July 27 KOL Event: MARIO-275 and MARIO-3 2L UC MARIO-275 1L TNBC MARIO-3 Advanced TNBC ARC-2 Advanced Ovarian ARC-2 Melanoma MARIO-1 SCCHN MARIO-1 Combination Eganelisib + Nivolumab n=49 Eganelisib + Tecentriq + Abraxane N=38 for efficacy N=43 for safety Eganelisib Benefit vs Benchmarks OS Gene Expression Data PFS DCR ORR Tumor Biopsies: -M1/M2 ratio -Immune activation -PD-L1 conversion Validation of Biologic Hypothesis and Potential Patient Benefit

11 Infinity Value Proposition: Data Suggest Eganelisib Could Be An Important Treatment Option for Patients in Need of Better Therapies • Validation of Biologic Hypothesis For Re-Programming Macrophages in TME • Data Demonstrate Prolonged PFS and OS • Several Attractive Options For Potential Registrational Trials and Follow-on Studies in UC and TNBC • Findings Suggest Opportunity For Expansion Beyond Existing Trials and Settings
12 MARIO-275 2L Metastatic Urothelial Cancer
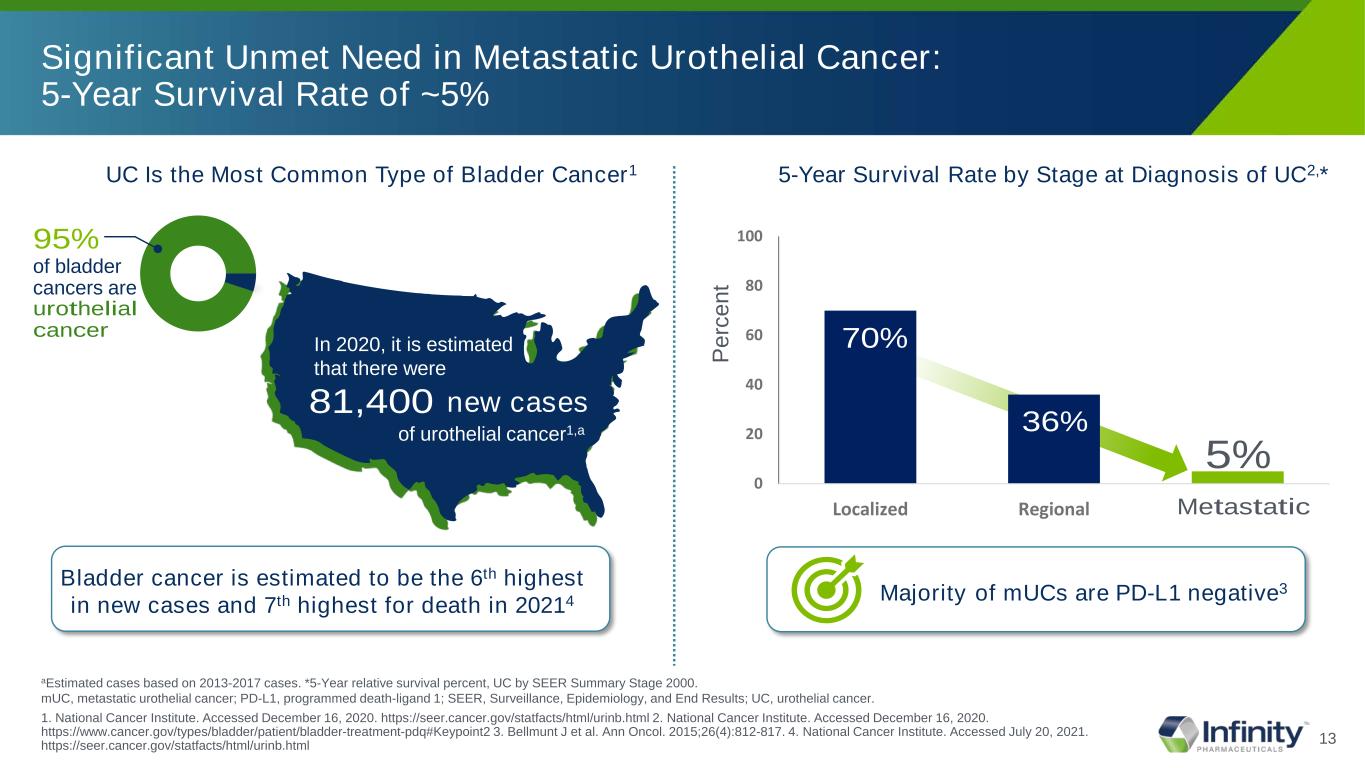
13 Significant Unmet Need in Metastatic Urothelial Cancer: 5-Year Survival Rate of ~5% aEstimated cases based on 2013-2017 cases. *5-Year relative survival percent, UC by SEER Summary Stage 2000. mUC, metastatic urothelial cancer; PD-L1, programmed death-ligand 1; SEER, Surveillance, Epidemiology, and End Results; UC, urothelial cancer. 1. National Cancer Institute. Accessed December 16, 2020. https://seer.cancer.gov/statfacts/html/urinb.html 2. National Cancer Institute. Accessed December 16, 2020. https://www.cancer.gov/types/bladder/patient/bladder-treatment-pdq#Keypoint2 3. Bellmunt J et al. National Cancer Institute. Accessed July 20, 2021. Ann Oncol. 2015;26(4):812-817. 4. https://seer.cancer.gov/statfacts/html/urinb.html Majority of mUCs are PD-L1 negative3 In 2020, it is estimated that there were 81,400 of urothelial cancer1,a new cases UC Is the Most Common Type of Bladder Cancer1 95% of bladder cancers are urothelial cancer 5-Year Survival Rate by Stage at Diagnosis of UC2,* Pe rc en t 5% 0 20 40 60 80 100 Localized Regional MetastaticMet tatic 36% 70% Bladder cancer is estimated to be the 6th highest in new cases and 7th highest for death in 20214
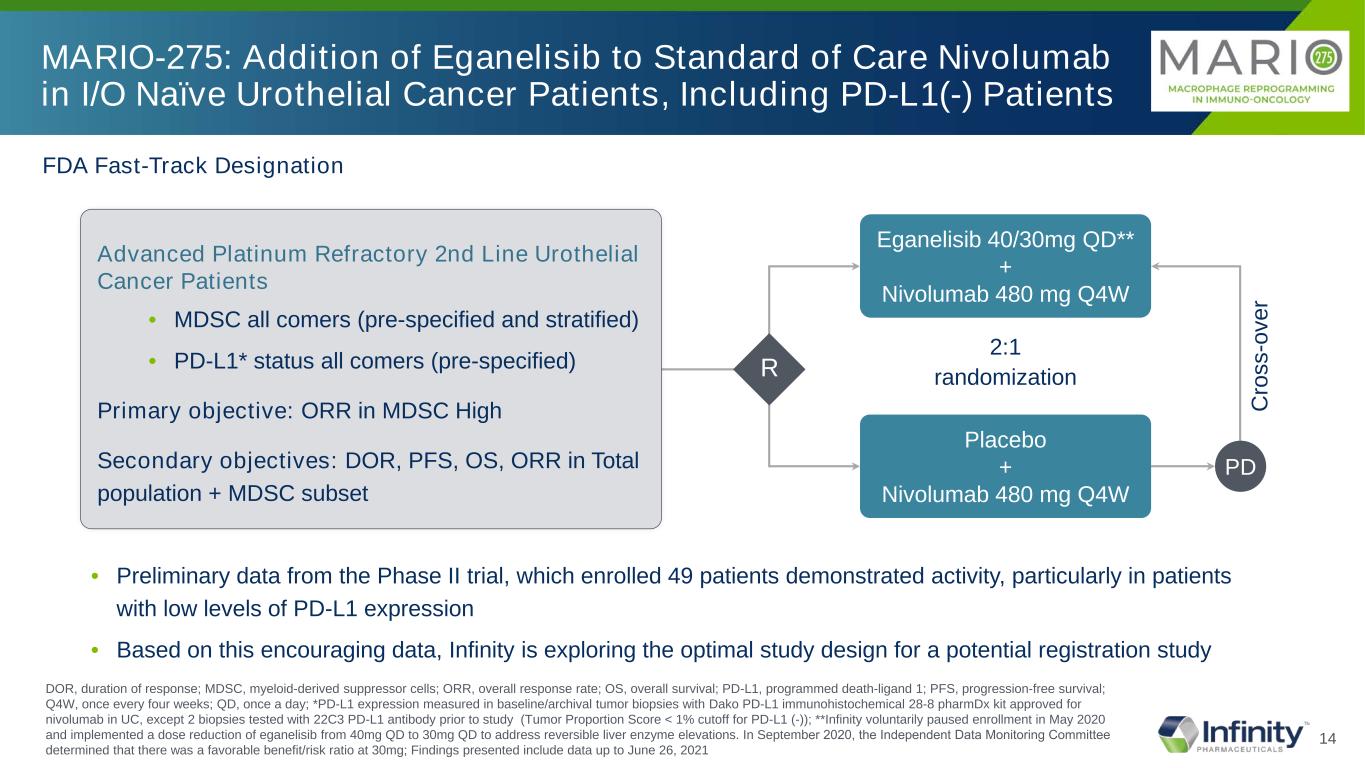
14 FDA Fast-Track Designation Eganelisib 40/30mg QD** + Nivolumab 480 mg Q4W Placebo + Nivolumab 480 mg Q4W Advanced Platinum Refractory 2nd Line Urothelial Cancer Patients • MDSC all comers (pre-specified and stratified) • PD-L1* status all comers (pre-specified) Primary objective: ORR in MDSC High Secondary objectives: DOR, PFS, OS, ORR in Total population + MDSC subset MARIO-275: Addition of Eganelisib to Standard of Care Nivolumab in I/O Naïve Urothelial Cancer Patients, Including PD-L1(-) Patients C ro ss -o ve r R • Preliminary data from the Phase II trial, which enrolled 49 patients demonstrated activity, particularly in patients with low levels of PD-L1 expression • Based on this encouraging data, Infinity is exploring the optimal study design for a potential registration study PD DOR, duration of response; MDSC, myeloid-derived suppressor cells; ORR, overall response rate; OS, overall survival; PD-L1, programmed death-ligand 1; PFS, progression-free survival; Q4W, once every four weeks; QD, once a day; *PD-L1 expression measured in baseline/archival tumor biopsies with Dako PD-L1 immunohistochemical 28-8 pharmDx kit approved for nivolumab in UC, except 2 biopsies tested with 22C3 PD-L1 antibody prior to study (Tumor Proportion Score < 1% cutoff for PD-L1 (-)); **Infinity voluntarily paused enrollment in May 2020 and implemented a dose reduction of eganelisib from 40mg QD to 30mg QD to address reversible liver enzyme elevations. In September 2020, the Independent Data Monitoring Committee determined that there was a favorable benefit/risk ratio at 30mg; Findings presented include data up to June 26, 2021 2:1 randomization
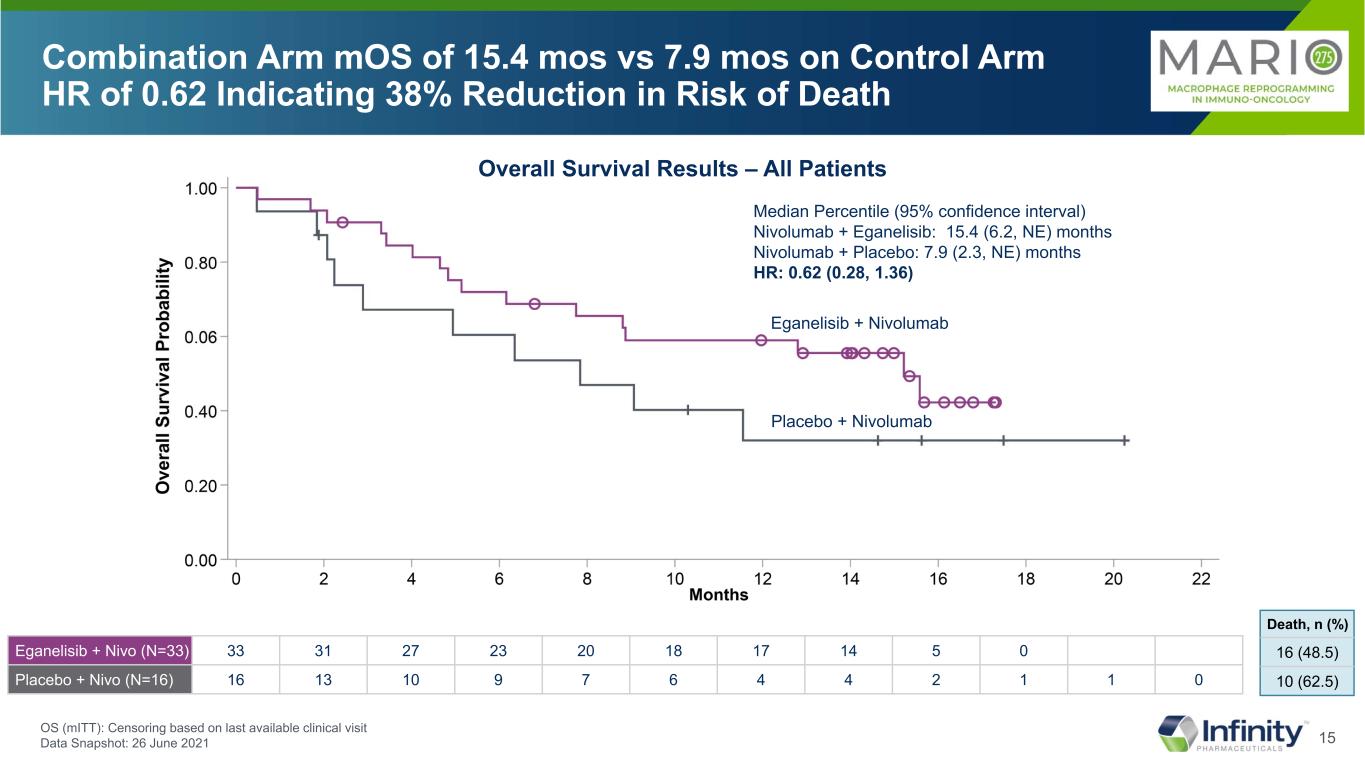
15 Combination Arm mOS of 15.4 mos vs 7.9 mos on Control Arm HR of 0.62 Indicating 38% Reduction in Risk of Death Eganelisib + Nivolumab Median Percentile (95% confidence interval) Nivolumab + Eganelisib: 15.4 (6.2, NE) months Nivolumab + Placebo: 7.9 (2.3, NE) months HR: 0.62 (0.28, 1.36) Placebo + Nivolumab Eganelisib + Nivo (N=33) 33 31 27 23 20 18 17 14 5 0 Placebo + Nivo (N=16) 16 13 10 9 7 6 4 4 2 1 1 0 16 (48.5) 10 (62.5) Death, n (%) Overall Survival Results – All Patients OS (mITT): Censoring based on last available clinical visit Data Snapshot: 26 June 2021
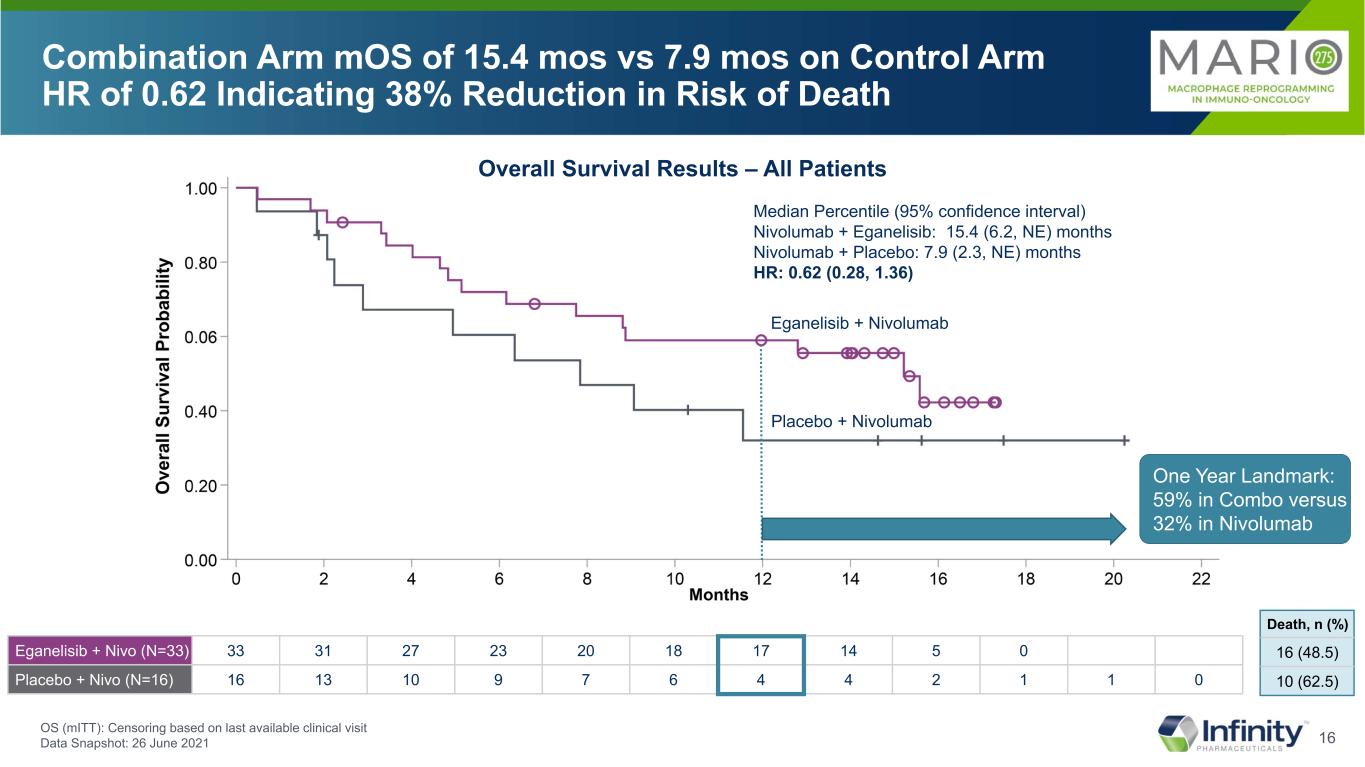
16 Eganelisib + Nivo (N=33) 33 31 27 23 20 18 17 14 5 0 Placebo + Nivo (N=16) 16 13 10 9 7 6 4 4 2 1 1 0 Combination Arm mOS of 15.4 mos vs 7.9 mos on Control Arm HR of 0.62 Indicating 38% Reduction in Risk of Death OS (mITT): Censoring based on last available clinical visit Data Snapshot: 26 June 2021 Eganelisib + Nivolumab Median Percentile (95% confidence interval) Nivolumab + Eganelisib: 15.4 (6.2, NE) months Nivolumab + Placebo: 7.9 (2.3, NE) months HR: 0.62 (0.28, 1.36) One Year Landmark: 59% in Combo versus 32% in Nivolumab Placebo + Nivolumab 16 (48.5) 10 (62.5) Death, n (%) Overall Survival Results – All Patients
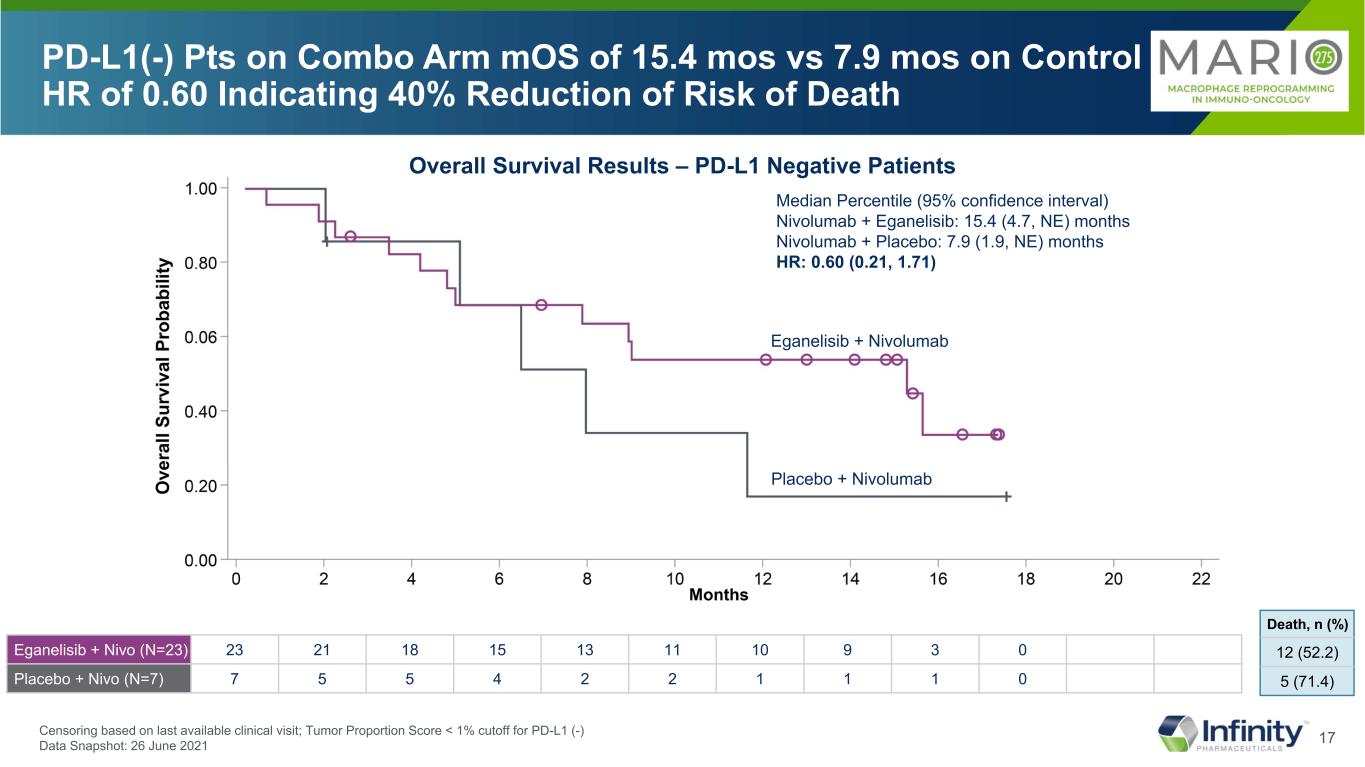
17 Median Percentile (95% confidence interval) Nivolumab + Eganelisib: 15.4 (4.7, NE) months Nivolumab + Placebo: 7.9 (1.9, NE) months HR: 0.60 (0.21, 1.71) PD-L1(-) Pts on Combo Arm mOS of 15.4 mos vs 7.9 mos on Control HR of 0.60 Indicating 40% Reduction of Risk of Death Overall Survival Results – PD-L1 Negative Patients Eganelisib + Nivolumab Placebo + Nivolumab 12 (52.2) 5 (71.4) Death, n (%) Censoring based on last available clinical visit; Tumor Proportion Score < 1% cutoff for PD-L1 (-) Data Snapshot: 26 June 2021 Eganelisib + Nivo (N=23) 23 21 18 15 13 11 10 9 3 0 Placebo + Nivo (N=7) 7 5 5 4 2 2 1 1 1 0
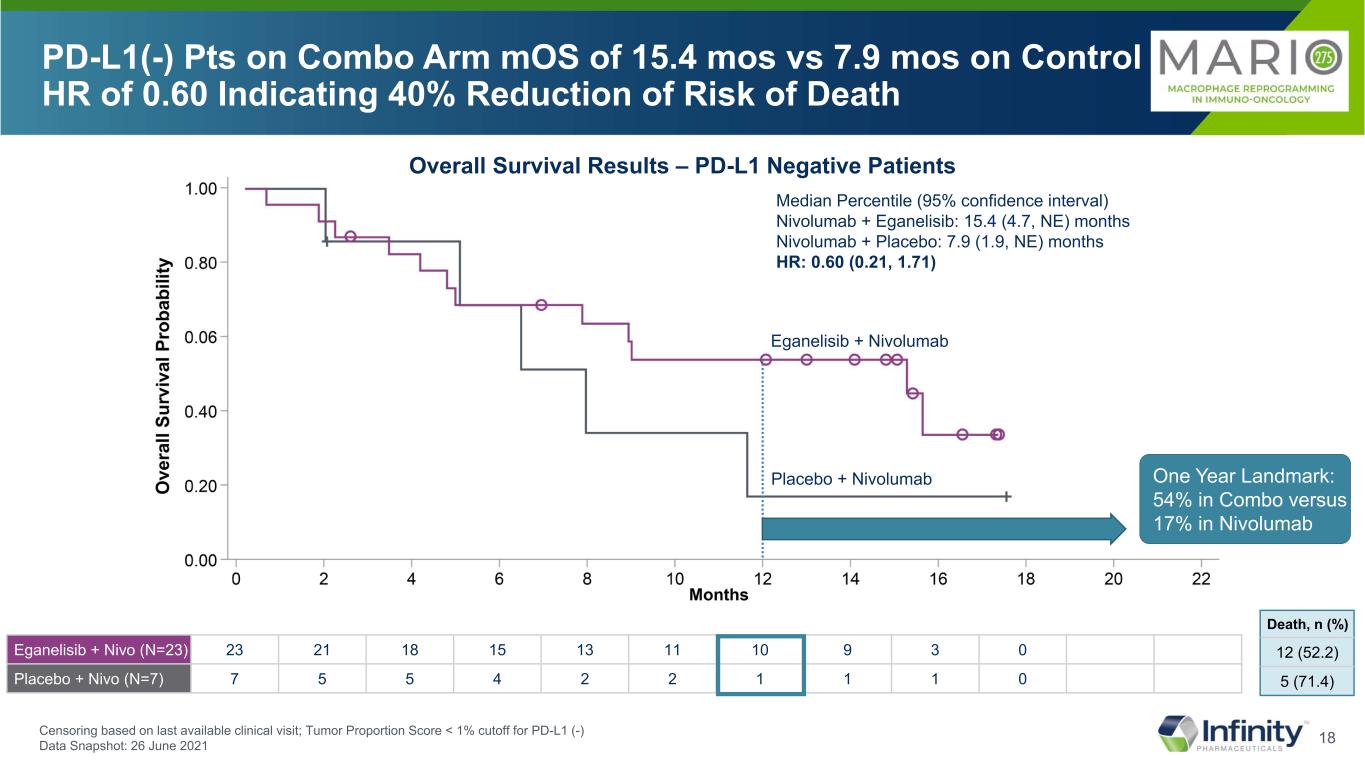
18 Eganelisib + Nivo (N=23) 23 21 18 15 13 11 10 9 3 0 Placebo + Nivo (N=7) 7 5 5 4 2 2 1 1 1 0 Median Percentile (95% confidence interval) Nivolumab + Eganelisib: 15.4 (4.7, NE) months Nivolumab + Placebo: 7.9 (1.9, NE) months HR: 0.60 (0.21, 1.71) PD-L1(-) Pts on Combo Arm mOS of 15.4 mos vs 7.9 mos on Control HR of 0.60 Indicating 40% Reduction of Risk of Death Overall Survival Results – PD-L1 Negative Patients Censoring based on last available clinical visit; Tumor Proportion Score < 1% cutoff for PD-L1 (-) Data Snapshot: 26 June 2021 One Year Landmark: 54% in Combo versus 17% in Nivolumab Eganelisib + Nivolumab Placebo + Nivolumab 12 (52.2) 5 (71.4) Death, n (%)
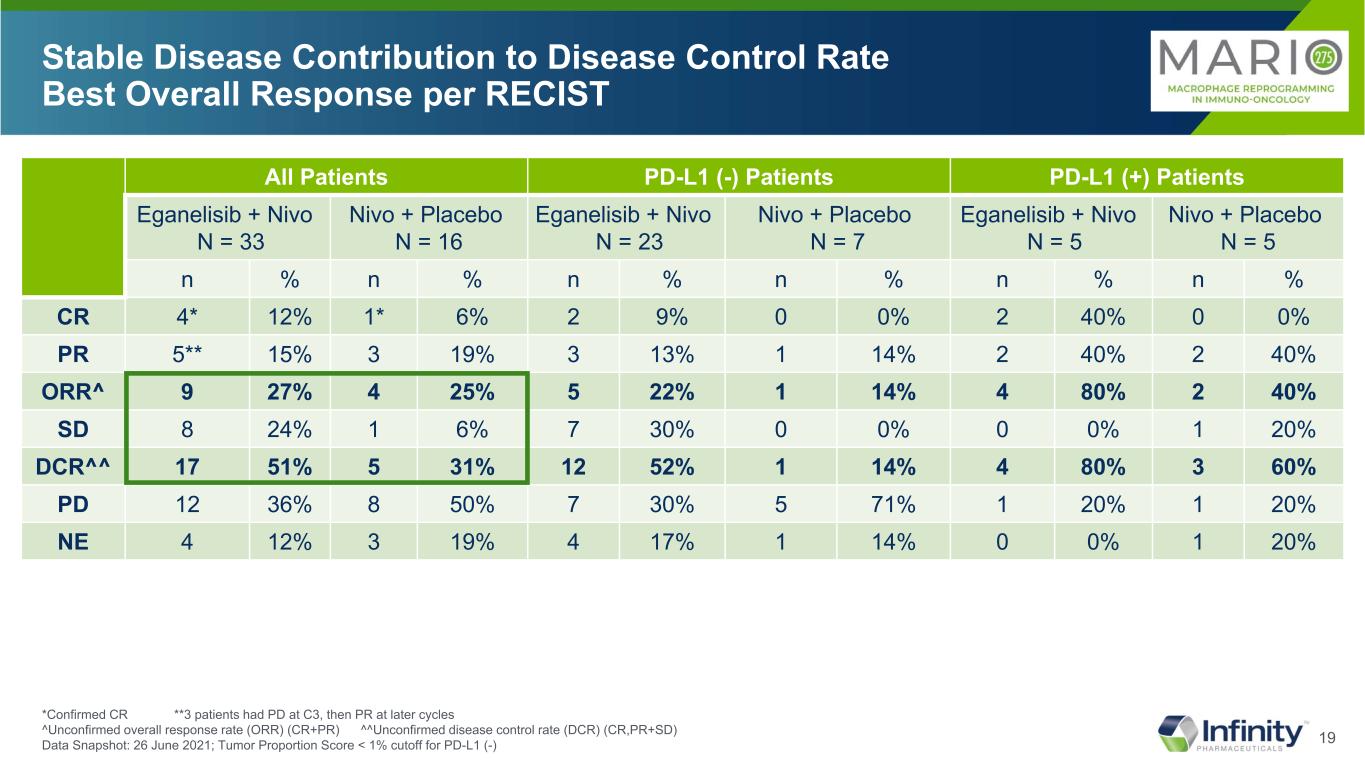
19 Stable Disease Contribution to Disease Control Rate Best Overall Response per RECIST All Patients PD-L1 (-) Patients PD-L1 (+) Patients Eganelisib + Nivo N = 33 Nivo + Placebo N = 16 Eganelisib + Nivo N = 23 Nivo + Placebo N = 7 Eganelisib + Nivo N = 5 Nivo + Placebo N = 5 n % n % n % n % n % n % CR 4* 12% 1* 6% 2 9% 0 0% 2 40% 0 0% PR 5** 15% 3 19% 3 13% 1 14% 2 40% 2 40% ORR^ 9 27% 4 25% 5 22% 1 14% 4 80% 2 40% SD 8 24% 1 6% 7 30% 0 0% 0 0% 1 20% DCR^^ 17 51% 5 31% 12 52% 1 14% 4 80% 3 60% PD 12 36% 8 50% 7 30% 5 71% 1 20% 1 20% NE 4 12% 3 19% 4 17% 1 14% 0 0% 1 20% *Confirmed CR **3 patients had PD at C3, then PR at later cycles ^Unconfirmed overall response rate (ORR) (CR+PR) ^^Unconfirmed disease control rate (DCR) (CR,PR+SD) Data Snapshot: 26 June 2021; Tumor Proportion Score < 1% cutoff for PD-L1 (-)
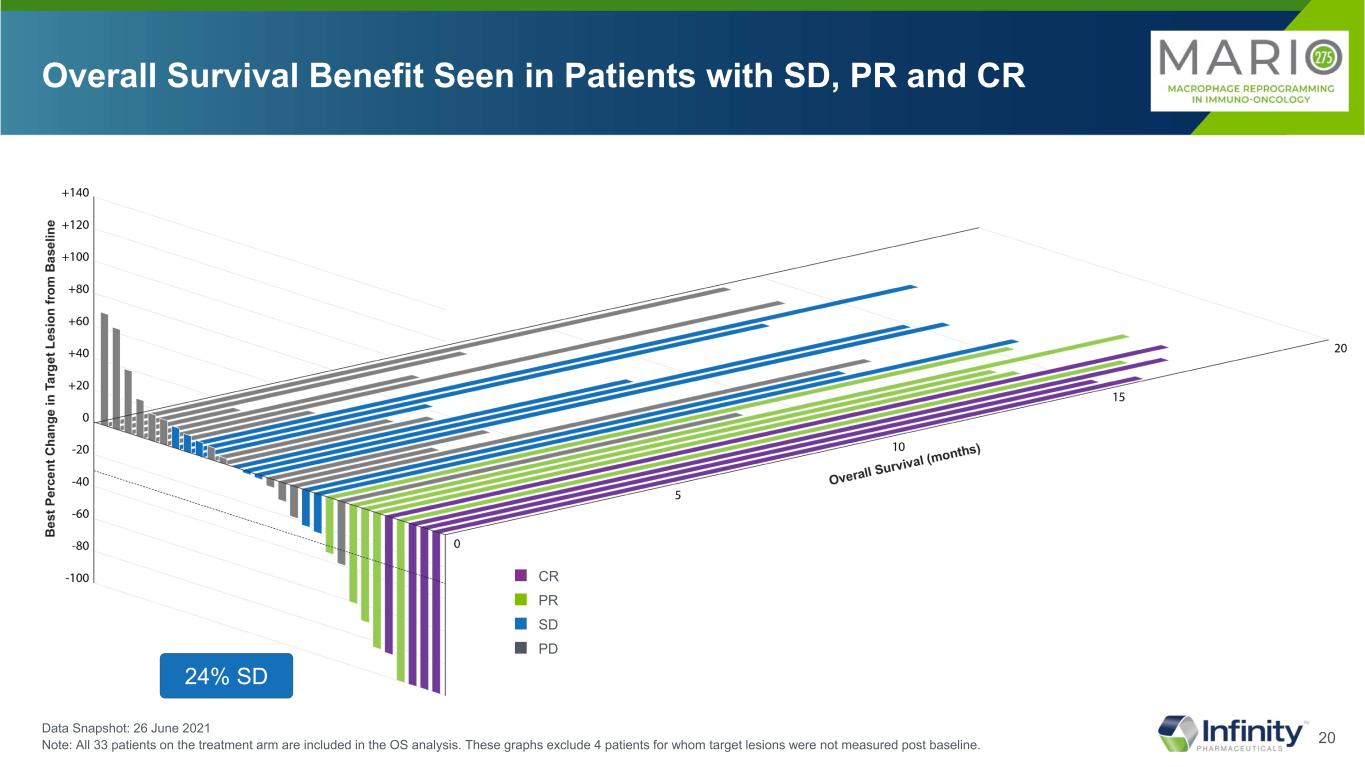
20 Overall Survival Benefit Seen in Patients with SD, PR and CR Data Snapshot: 26 June 2021 Note: All 33 patients on the treatment arm are included in the OS analysis. These graphs exclude 4 patients for whom target lesions were not measured post baseline. ■ CR ■ PR ■ SD ■ PD 24% SD
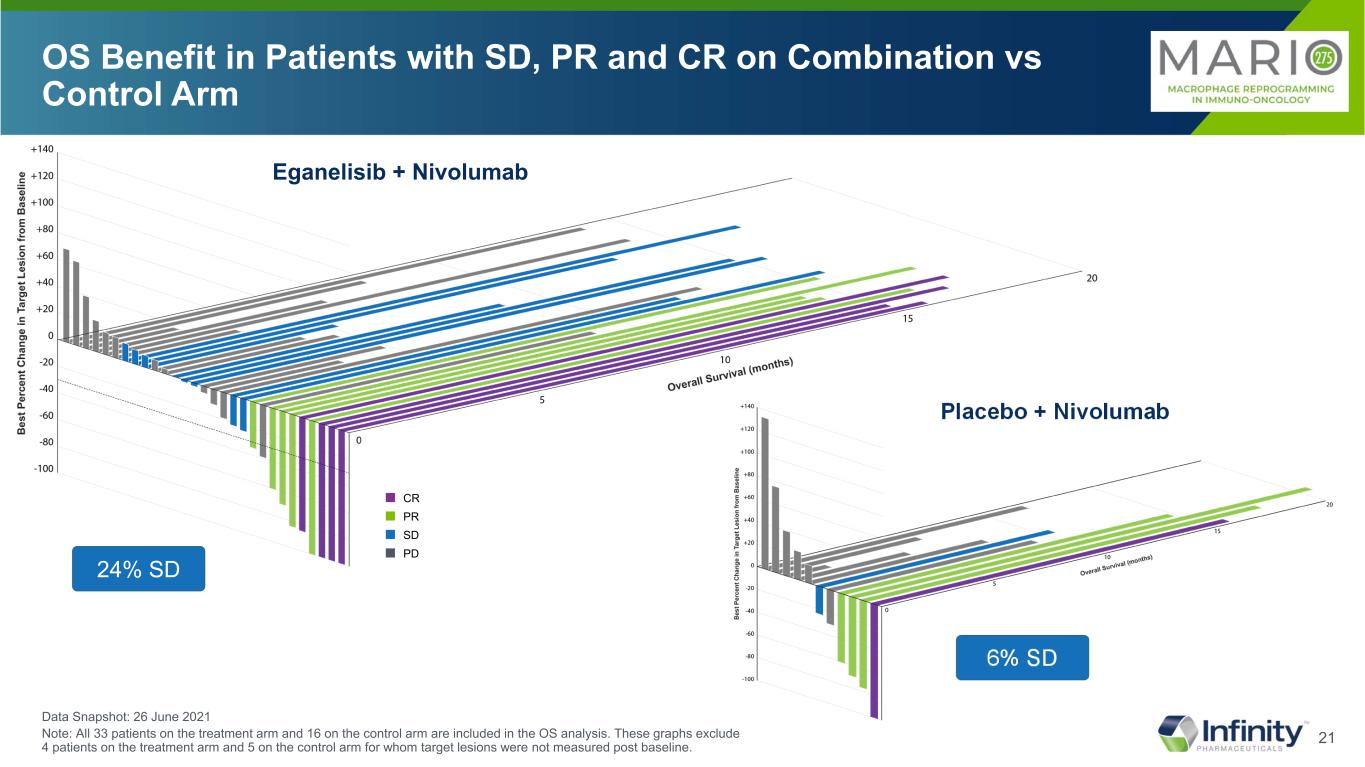
21 OS Benefit in Patients with SD, PR and CR on Combination vs Control Arm 24% SD 6% SD Data Snapshot: 26 June 2021 Note: All 33 patients on the treatment arm and 16 on the control arm are included in the OS analysis. These graphs exclude 4 patients on the treatment arm and 5 on the control arm for whom target lesions were not measured post baseline. Eganelisib + Nivolumab Placebo + Nivolumab ■ CR ■ PR ■ SD ■ PD
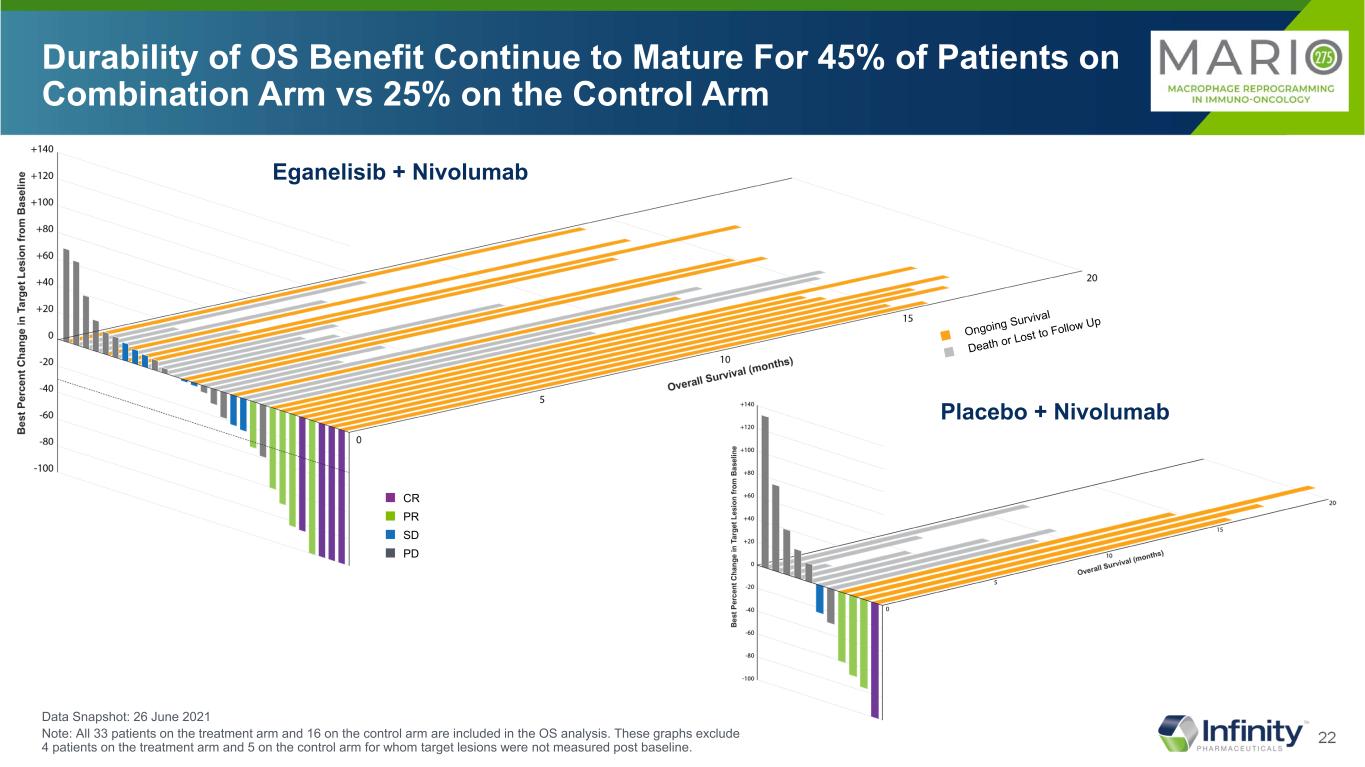
22 Durability of OS Benefit Continue to Mature For 45% of Patients on Combination Arm vs 25% on the Control Arm Eganelisib + Nivolumab Placebo + Nivolumab ■ CR ■ PR ■ SD ■ PD Data Snapshot: 26 June 2021 Note: All 33 patients on the treatment arm and 16 on the control arm are included in the OS analysis. These graphs exclude 4 patients on the treatment arm and 5 on the control arm for whom target lesions were not measured post baseline.
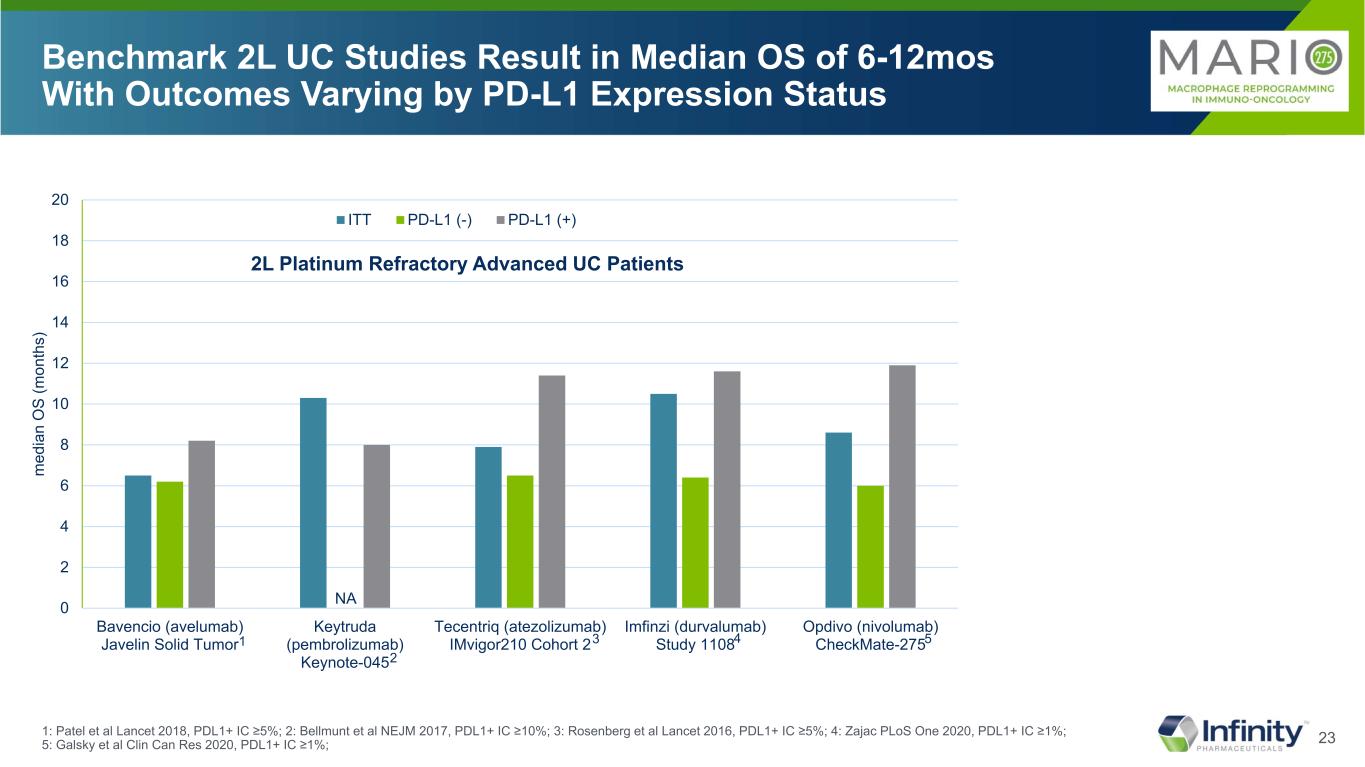
23 Benchmark 2L UC Studies Result in Median OS of 6-12mos With Outcomes Varying by PD-L1 Expression Status 1: Patel et al Lancet 2018, PDL1+ IC ≥5%; 2: Bellmunt et al NEJM 2017, PDL1+ IC ≥10%; 3: Rosenberg et al Lancet 2016, PDL1+ IC ≥5%; 4: Zajac PLoS One 2020, PDL1+ IC ≥1%; 5: Galsky et al Clin Can Res 2020, PDL1+ IC ≥1%; 2L Platinum Refractory Advanced UC Patients NA 1 2 3 4 5 0 2 4 6 8 10 12 14 16 18 20 Bavencio (avelumab) Javelin Solid Tumor Keytruda (pembrolizumab) Keynote-045 Tecentriq (atezolizumab) IMvigor210 Cohort 2 Imfinzi (durvalumab) Study 1108 Opdivo (nivolumab) CheckMate-275 m ed ia n O S (m on th s) ITT PD-L1 (-) PD-L1 (+)
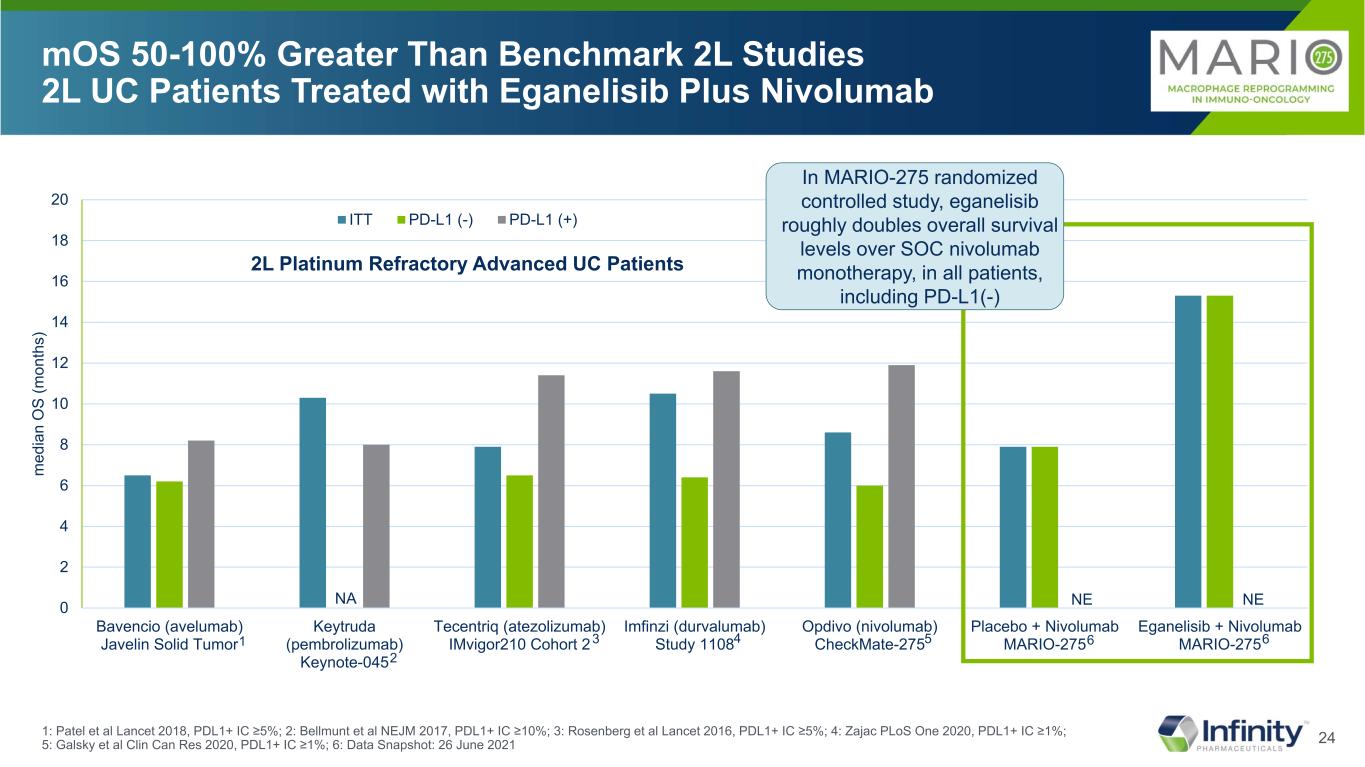
24 0 2 4 6 8 10 12 14 16 18 20 Bavencio (avelumab) Javelin Solid Tumor Keytruda (pembrolizumab) Keynote-045 Tecentriq (atezolizumab) IMvigor210 Cohort 2 Imfinzi (durvalumab) Study 1108 Opdivo (nivolumab) CheckMate-275 Placebo + Nivolumab MARIO-275 Eganelisib + Nivolumab MARIO-275 m ed ia n O S (m on th s) ITT PD-L1 (-) PD-L1 (+) NE mOS 50-100% Greater Than Benchmark 2L Studies 2L UC Patients Treated with Eganelisib Plus Nivolumab 2L Platinum Refractory Advanced UC Patients NA NE 1: Patel et al Lancet 2018, PDL1+ IC ≥5%; 2: Bellmunt et al NEJM 2017, PDL1+ IC ≥10%; 3: Rosenberg et al Lancet 2016, PDL1+ IC ≥5%; 4: Zajac PLoS One 2020, PDL1+ IC ≥1%; 5: Galsky et al Clin Can Res 2020, PDL1+ IC ≥1%; 6: Data Snapshot: 26 June 2021 1 2 3 4 5 In MARIO-275 randomized controlled study, eganelisib roughly doubles overall survival levels over SOC nivolumab monotherapy, in all patients, including PD-L1(-) 6 6
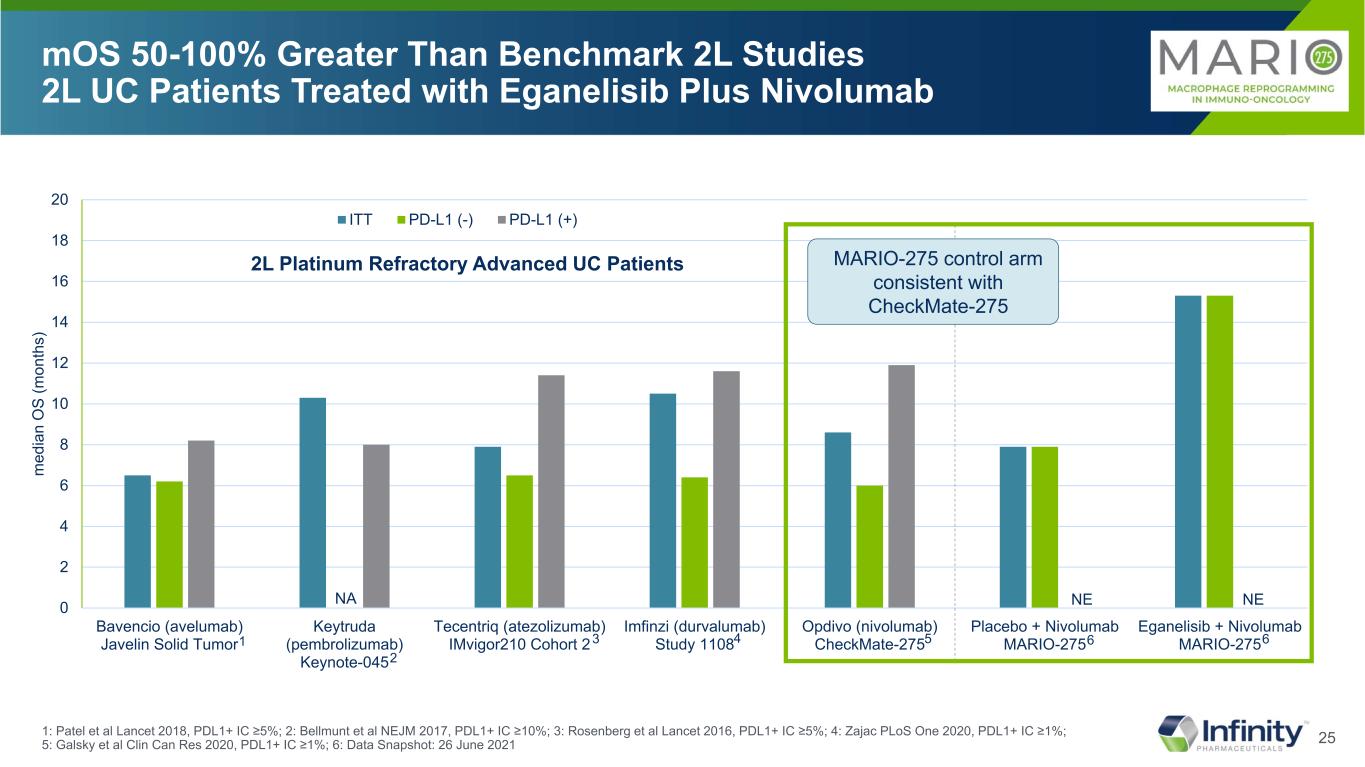
25 0 2 4 6 8 10 12 14 16 18 20 Bavencio (avelumab) Javelin Solid Tumor Keytruda (pembrolizumab) Keynote-045 Tecentriq (atezolizumab) IMvigor210 Cohort 2 Imfinzi (durvalumab) Study 1108 Opdivo (nivolumab) CheckMate-275 Placebo + Nivolumab MARIO-275 Eganelisib + Nivolumab MARIO-275 m ed ia n O S (m on th s) ITT PD-L1 (-) PD-L1 (+) NE mOS 50-100% Greater Than Benchmark 2L Studies 2L UC Patients Treated with Eganelisib Plus Nivolumab 1: Patel et al Lancet 2018, PDL1+ IC ≥5%; 2: Bellmunt et al NEJM 2017, PDL1+ IC ≥10%; 3: Rosenberg et al Lancet 2016, PDL1+ IC ≥5%; 4: Zajac PLoS One 2020, PDL1+ IC ≥1%; 5: Galsky et al Clin Can Res 2020, PDL1+ IC ≥1%; 6: Data Snapshot: 26 June 2021 MARIO-275 control arm consistent with CheckMate-275 2L Platinum Refractory Advanced UC Patients NA NE 1 2 3 4 5 6 6
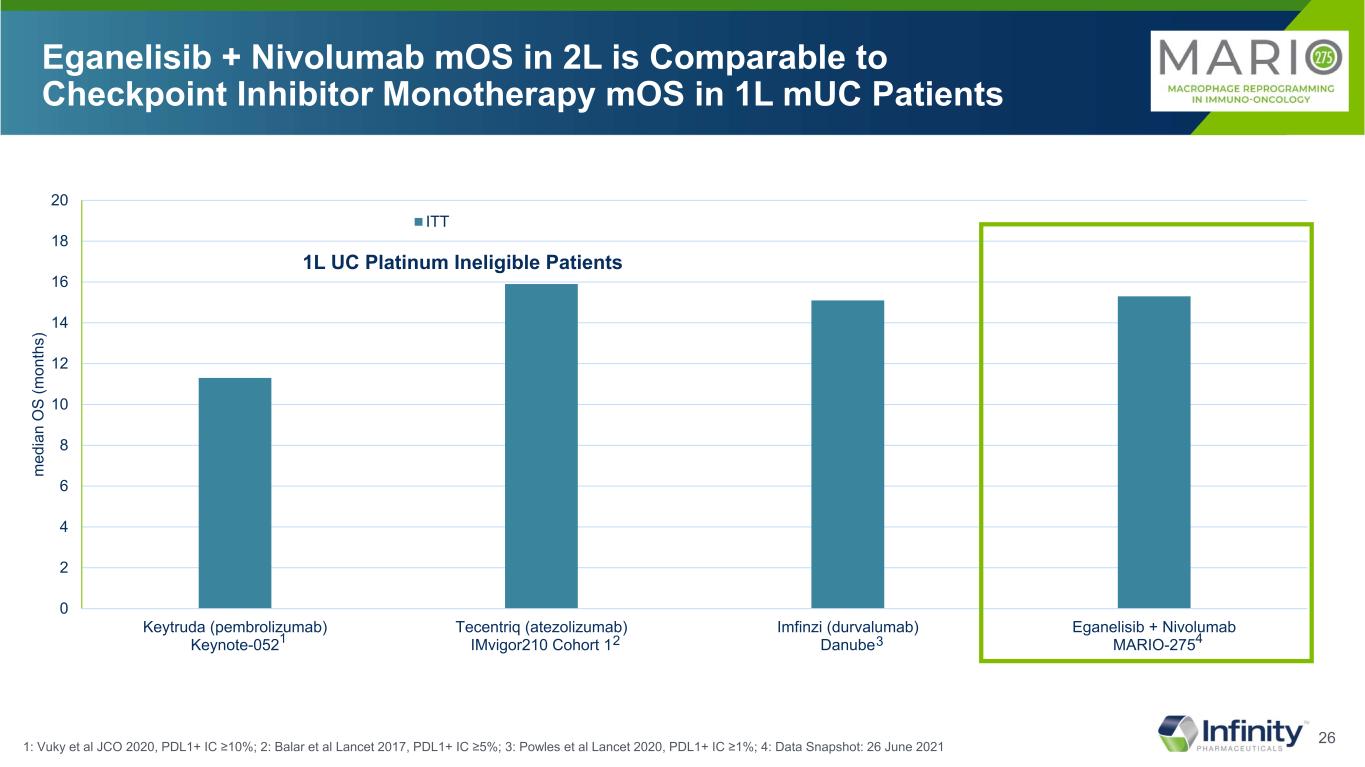
26 0 2 4 6 8 10 12 14 16 18 20 Keytruda (pembrolizumab) Keynote-052 Tecentriq (atezolizumab) IMvigor210 Cohort 1 Imfinzi (durvalumab) Danube Eganelisib + Nivolumab MARIO-275 m ed ia n O S (m on th s) ITT Eganelisib + Nivolumab mOS in 2L is Comparable to Checkpoint Inhibitor Monotherapy mOS in 1L mUC Patients 1: Vuky et al JCO 2020, PDL1+ IC ≥10%; 2: Balar et al Lancet 2017, PDL1+ IC ≥5%; 3: Powles et al Lancet 2020, PDL1+ IC ≥1%; 4: Data Snapshot: 26 June 2021 1L UC Platinum Ineligible Patients 1 2 3 4
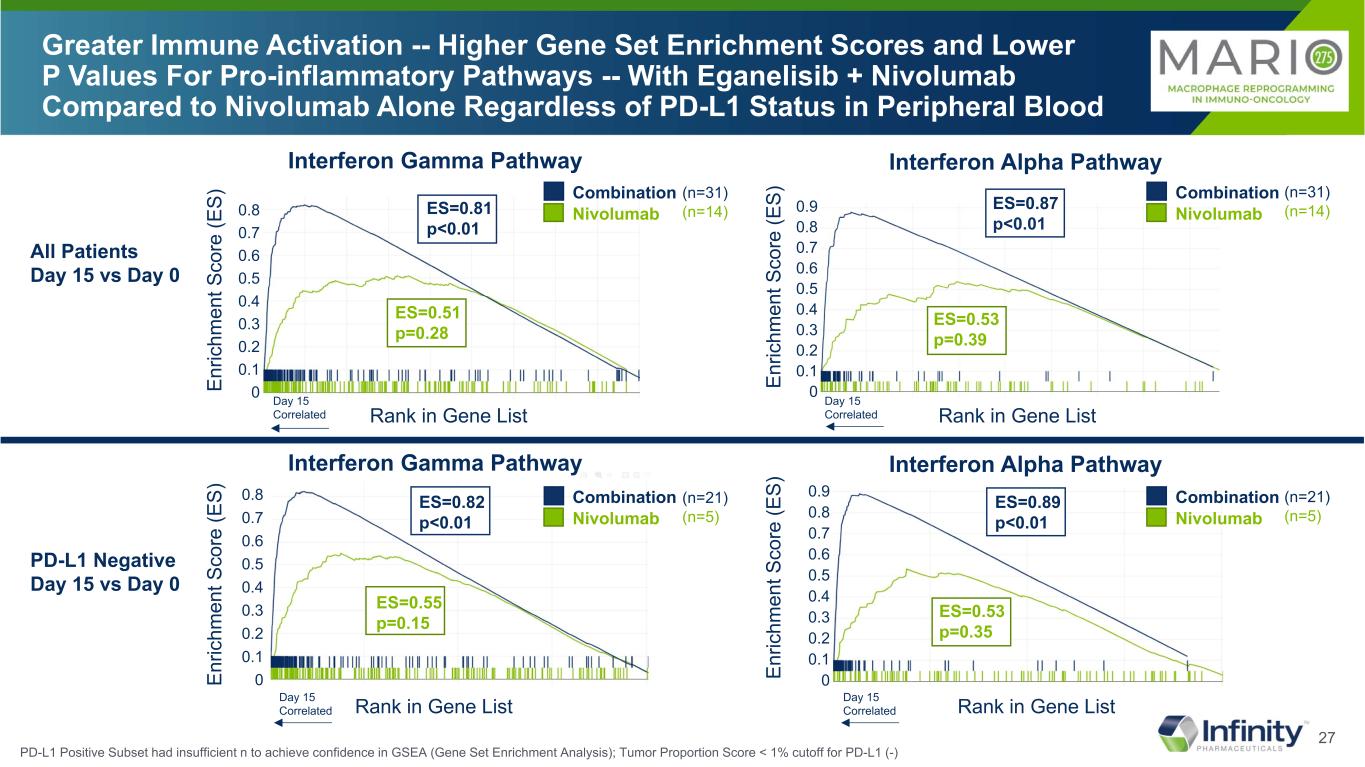
27 0.8 0.7 0.6 0.5 0.4 0.3 0.2 0.1 0 0.8 0.7 0.6 0.5 0.4 0.3 0.2 0.1 0 0.90.8 0.7 0.6 0.5 0.4 0.3 0.2 0.1 0 Greater Immune Activation -- Higher Gene Set Enrichment Scores and Lower P Values For Pro-inflammatory Pathways -- With Eganelisib + Nivolumab Compared to Nivolumab Alone Regardless of PD-L1 Status in Peripheral Blood Interferon Gamma Pathway En ric hm en t S co re (E S) En ric hm en t S co re (E S) En ric hm en t S co re (E S) En ric hm en t S co re (E S) Interferon Alpha Pathway ES=0.81 p<0.01 ES=0.87 p<0.01 ES=0.53 p=0.39 ES=0.51 p=0.28 All Patients Day 15 vs Day 0 PD-L1 Negative Day 15 vs Day 0 0.8 0.7 0.6 0.5 0.4 0.3 0.2 0.1 0 0.9 Rank in Gene List Rank in Gene List Day 15 Correlated Day 15 Correlated ES=0.82 p<0.01 ES=0.55 p=0.15 ES=0.89 p<0.01 ES=0.53 p=0.35 Rank in Gene ListDay 15 Correlated Rank in Gene ListDay 15 Correlated Combination Nivolumab Combination Nivolumab Combination Nivolumab Combination Nivolumab Interferon Gamma Pathway Interferon Alpha Pathway (n=31) (n=14) (n=31) (n=14) (n=21) (n=5) (n=21) (n=5) PD-L1 Positive Subset had insufficient n to achieve confidence in GSEA (Gene Set Enrichment Analysis); Tumor Proportion Score < 1% cutoff for PD-L1 (-)
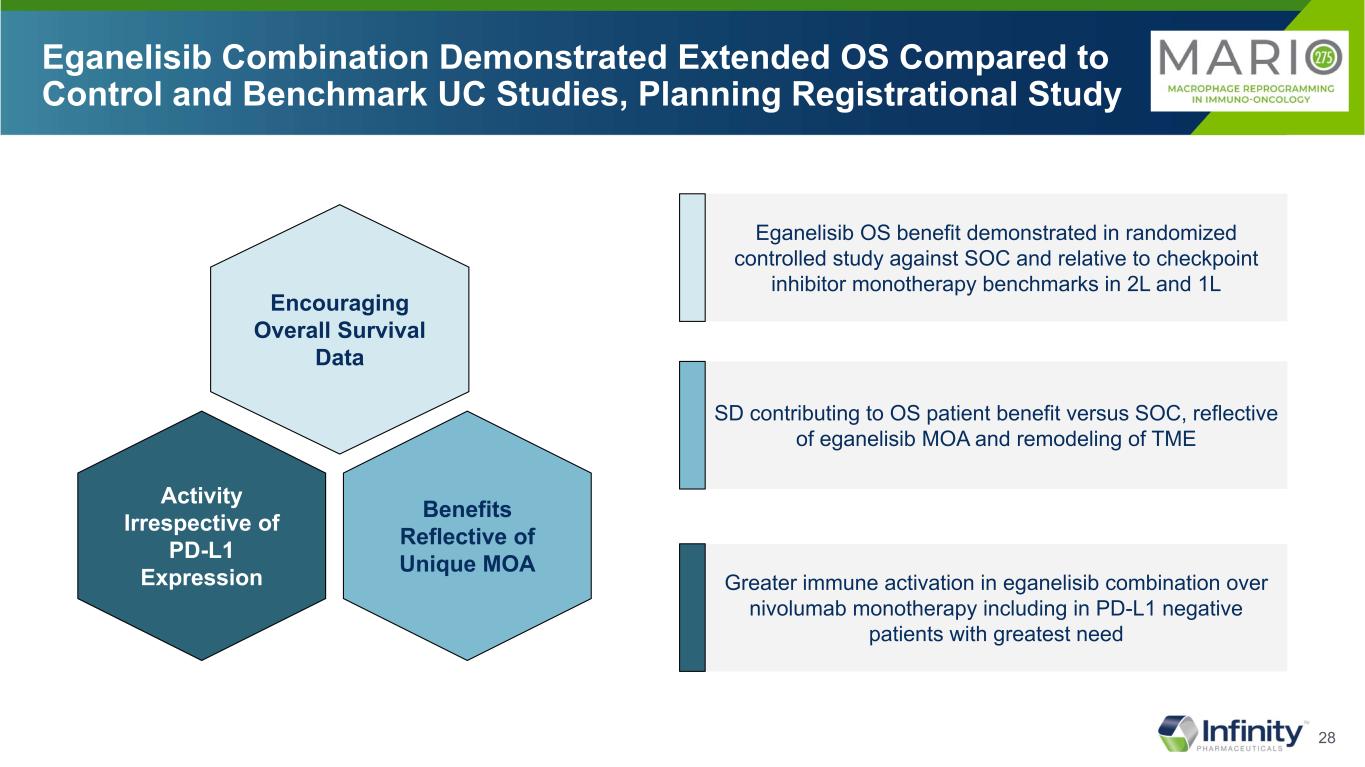
28 Eganelisib Combination Demonstrated Extended OS Compared to Control and Benchmark UC Studies, Planning Registrational Study Benefits Reflective of Unique MOA Activity Irrespective of PD-L1 Expression Encouraging Overall Survival Data Eganelisib OS benefit demonstrated in randomized controlled study against SOC and relative to checkpoint inhibitor monotherapy benchmarks in 2L and 1L SD contributing to OS patient benefit versus SOC, reflective of eganelisib MOA and remodeling of TME Greater immune activation in eganelisib combination over nivolumab monotherapy including in PD-L1 negative patients with greatest need
29 MARIO-3 1L Metastatic TNBC

30 Metastatic TNBC and PD-L1 Negative TNBC are Associated with Poor Prognosis and 5-year Survival Rate of 12% aEstimated cases based on 2013-2017 cases. †5-Year relative survival percent, TNBC by SEER Summary Stage 2000. ‡PD-L1–stained tumor-infiltrating immune cells; positive PD-L1 threshold of 0.01 (≥1% of tumor area). 1. National Cancer Institute. Accessed November 24, 2020. https://seer.cancer.gov/statfacts/html/breast-subtypes.html 2. American Cancer Society. Accessed November 24, 2020. https://www.cancer.org/cancer/breast-cancer/understanding-a-breast-cancer-diagnosis/types-of-breast-cancer/triple-negative.html 3. National Cancer Institute. Accessed November 23, 2020. https://seer.cancer.gov/statfacts/html/breast-subtypes.html 4. Davis AA, Patel VG. J Immunother Cancer. 2019;7(1):278. 5. Matikas A et al. Clin Cancer Res. 2019;25(18):5717-5726. (ie, negative for ER, PR, and HER2) 15% of breast cancer is triple negative2 PD-L1 negative cancers are associated with poor prognosis4 ≈ 60% of TNBCs are PD-L1 negative5,‡ 5-year survival rate by stage at diagnosis of TNBC3,† 91 % 65 % 0 20 40 60 80 100 Localized Regional Distant Pe rc en t Metastatic 12% In 2020, it is estimated that there will be 276,480 new cases of breast cancer in women1,a Advanced TNBC and PD-L1 Negative TNBC Are Both Associated With Poor Prognosis
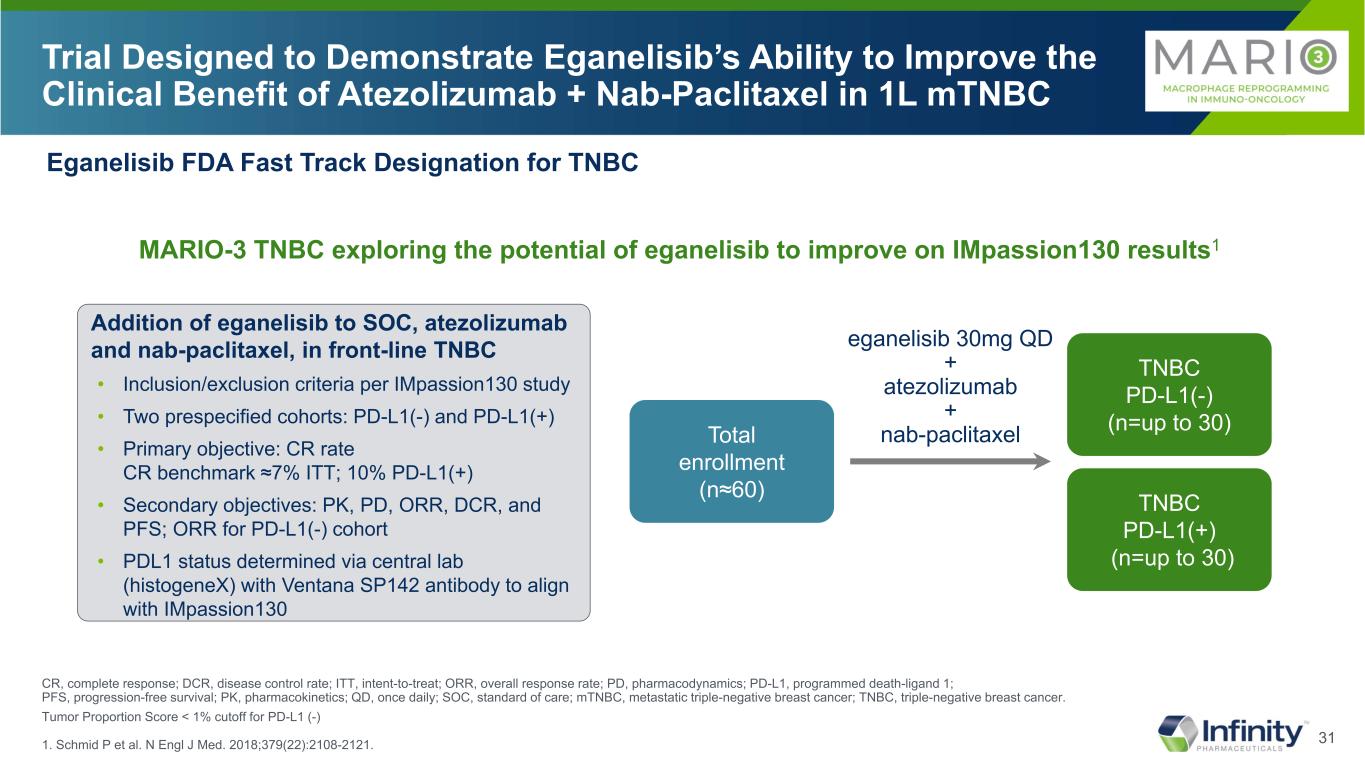
31 Trial Designed to Demonstrate Eganelisib’s Ability to Improve the Clinical Benefit of Atezolizumab + Nab-Paclitaxel in 1L mTNBC CR, complete response; DCR, disease control rate; ITT, intent-to-treat; ORR, overall response rate; PD, pharmacodynamics; PD-L1, programmed death-ligand 1; PFS, progression-free survival; PK, pharmacokinetics; QD, once daily; SOC, standard of care; mTNBC, metastatic triple-negative breast cancer; TNBC, triple-negative breast cancer. Tumor Proportion Score < 1% cutoff for PD-L1 (-) 1. Schmid P et al. N Engl J Med. 2018;379(22):2108-2121. Eganelisib FDA Fast Track Designation for TNBC MARIO-3 TNBC exploring the potential of eganelisib to improve on IMpassion130 results1 Addition of eganelisib to SOC, atezolizumab and nab-paclitaxel, in front-line TNBC • Inclusion/exclusion criteria per IMpassion130 study • Two prespecified cohorts: PD-L1(-) and PD-L1(+) • Primary objective: CR rate CR benchmark ≈7% ITT; 10% PD-L1(+) • Secondary objectives: PK, PD, ORR, DCR, and PFS; ORR for PD-L1(-) cohort • PDL1 status determined via central lab (histogeneX) with Ventana SP142 antibody to align with IMpassion130 Total enrollment (n≈60) TNBC PD-L1(-) (n=up to 30) TNBC PD-L1(+) (n=up to 30) eganelisib 30mg QD + atezolizumab + nab-paclitaxel
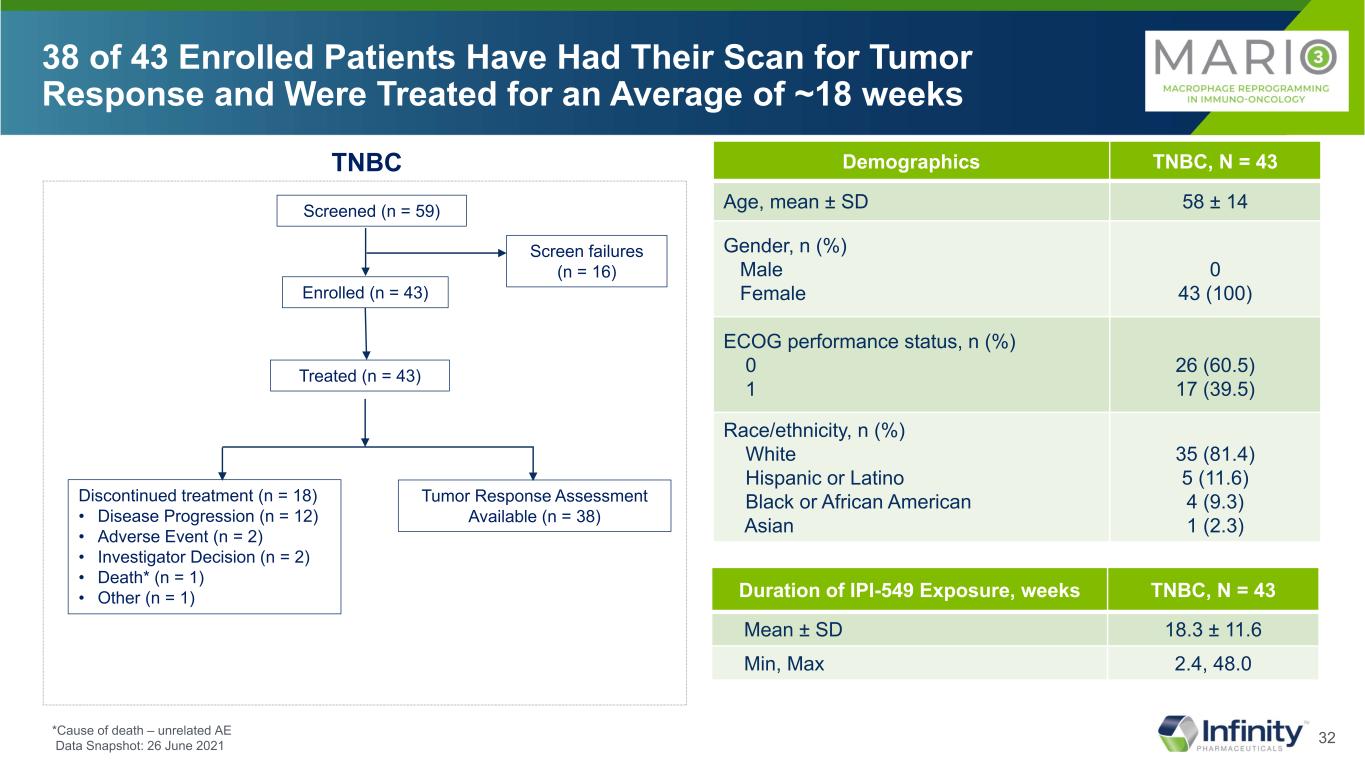
32 38 of 43 Enrolled Patients Have Had Their Scan for Tumor Response and Were Treated for an Average of ~18 weeks Screened (n = 59) Enrolled (n = 43) Screen failures (n = 16) Treated (n = 43) Discontinued treatment (n = 18) • Disease Progression (n = 12) • Adverse Event (n = 2) • Investigator Decision (n = 2) • Death* (n = 1) • Other (n = 1) Tumor Response Assessment Available (n = 38) TNBC Duration of IPI-549 Exposure, weeks TNBC, N = 43 Mean ± SD 18.3 ± 11.6 Min, Max 2.4, 48.0 Demographics TNBC, N = 43 Age, mean ± SD 58 ± 14 Gender, n (%) Male Female 0 43 (100) ECOG performance status, n (%) 0 1 26 (60.5) 17 (39.5) Race/ethnicity, n (%) White Hispanic or Latino Black or African American Asian 35 (81.4) 5 (11.6) 4 (9.3) 1 (2.3) *Cause of death – unrelated AE Data Snapshot: 26 June 2021
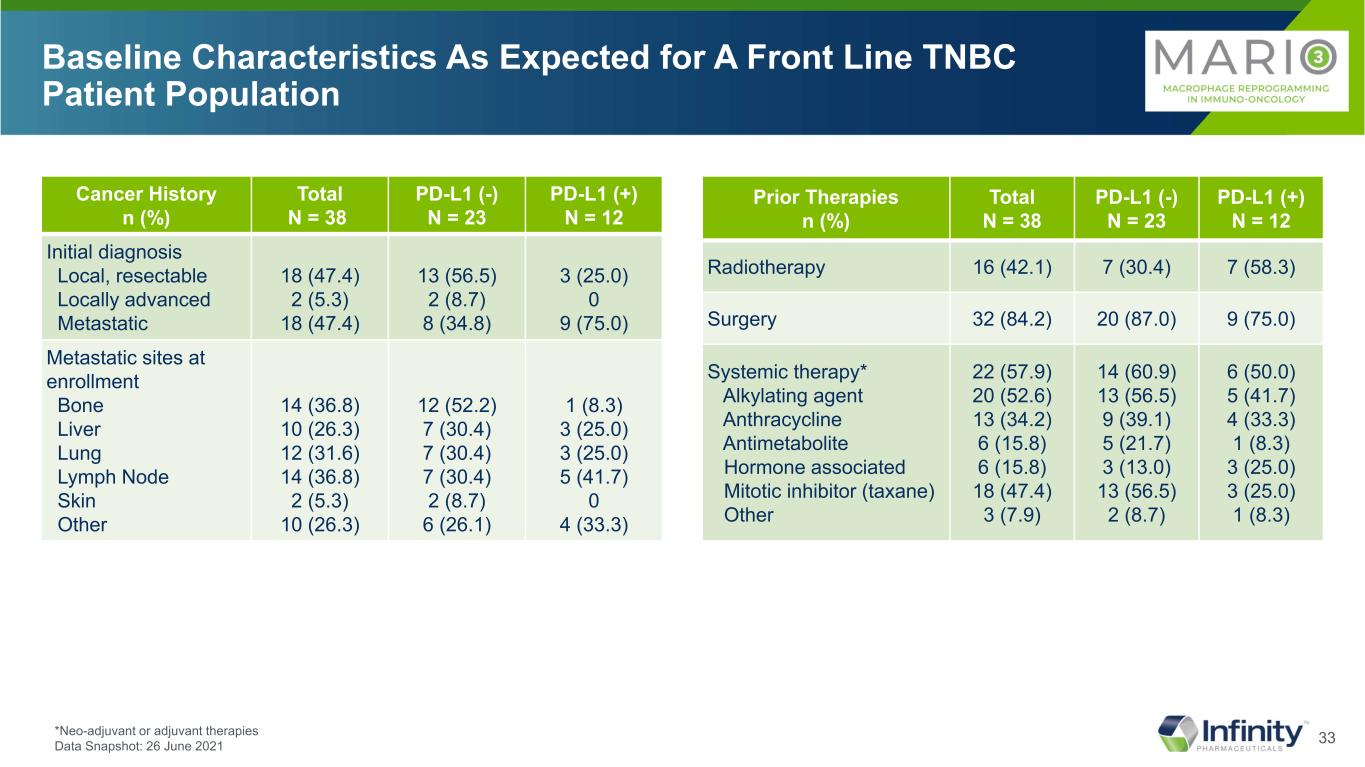
33 Baseline Characteristics As Expected for A Front Line TNBC Patient Population *Neo-adjuvant or adjuvant therapies Data Snapshot: 26 June 2021 Prior Therapies n (%) Total N = 38 PD-L1 (-) N = 23 PD-L1 (+) N = 12 Radiotherapy 16 (42.1) 7 (30.4) 7 (58.3) Surgery 32 (84.2) 20 (87.0) 9 (75.0) Systemic therapy* Alkylating agent Anthracycline Antimetabolite Hormone associated Mitotic inhibitor (taxane) Other 22 (57.9) 20 (52.6) 13 (34.2) 6 (15.8) 6 (15.8) 18 (47.4) 3 (7.9) 14 (60.9) 13 (56.5) 9 (39.1) 5 (21.7) 3 (13.0) 13 (56.5) 2 (8.7) 6 (50.0) 5 (41.7) 4 (33.3) 1 (8.3) 3 (25.0) 3 (25.0) 1 (8.3) Cancer History n (%) Total N = 38 PD-L1 (-) N = 23 PD-L1 (+) N = 12 Initial diagnosis Local, resectable Locally advanced Metastatic 18 (47.4) 2 (5.3) 18 (47.4) 13 (56.5) 2 (8.7) 8 (34.8) 3 (25.0) 0 9 (75.0) Metastatic sites at enrollment Bone Liver Lung Lymph Node Skin Other 14 (36.8) 10 (26.3) 12 (31.6) 14 (36.8) 2 (5.3) 10 (26.3) 12 (52.2) 7 (30.4) 7 (30.4) 7 (30.4) 2 (8.7) 6 (26.1) 1 (8.3) 3 (25.0) 3 (25.0) 5 (41.7) 0 4 (33.3)

34 No New or Additive Safety Signals Were Observed, Safety Profile Consistent with Expectations for Three From Component Drugs Most Common TEAEs in ≥25% of All Treated Patients (N=43) Preferred Term TEAE (All) Eganelisib-related TEAE (All) TEAE (≥ Gr. 3) Eganelisib-related TEAE (≥ Gr. 3) Nausea 22 (51.2) 14 (32.6) 0 0 Fatigue 21 (48.8) 17 (39.5) 3 (7.0) 1 (2.3) Alopecia 14 (32.6) 3 (7.0) 0 0 Diarrhea 14 (32.6) 11 (25.6) 3 (7.0) 1 (2.3) Rash maculo-papular 13 (30.2) 11 (25.6) 4 (9.3) 4 (9.3) Alanine aminotransferase increased* 12 (27.9) 9 (20.9) 8 (18.6) 8 (18.6) Aspartate aminotransferase increased 11 (25.6) 10 (23.3) 6 (14.0) 6 (14.0) Presented in descending order of All Causality in TEAE *1 Grade 4 For Hepatic AE No Hy’s Law and No Grade 5 Data Snapshot: 26 June 2021
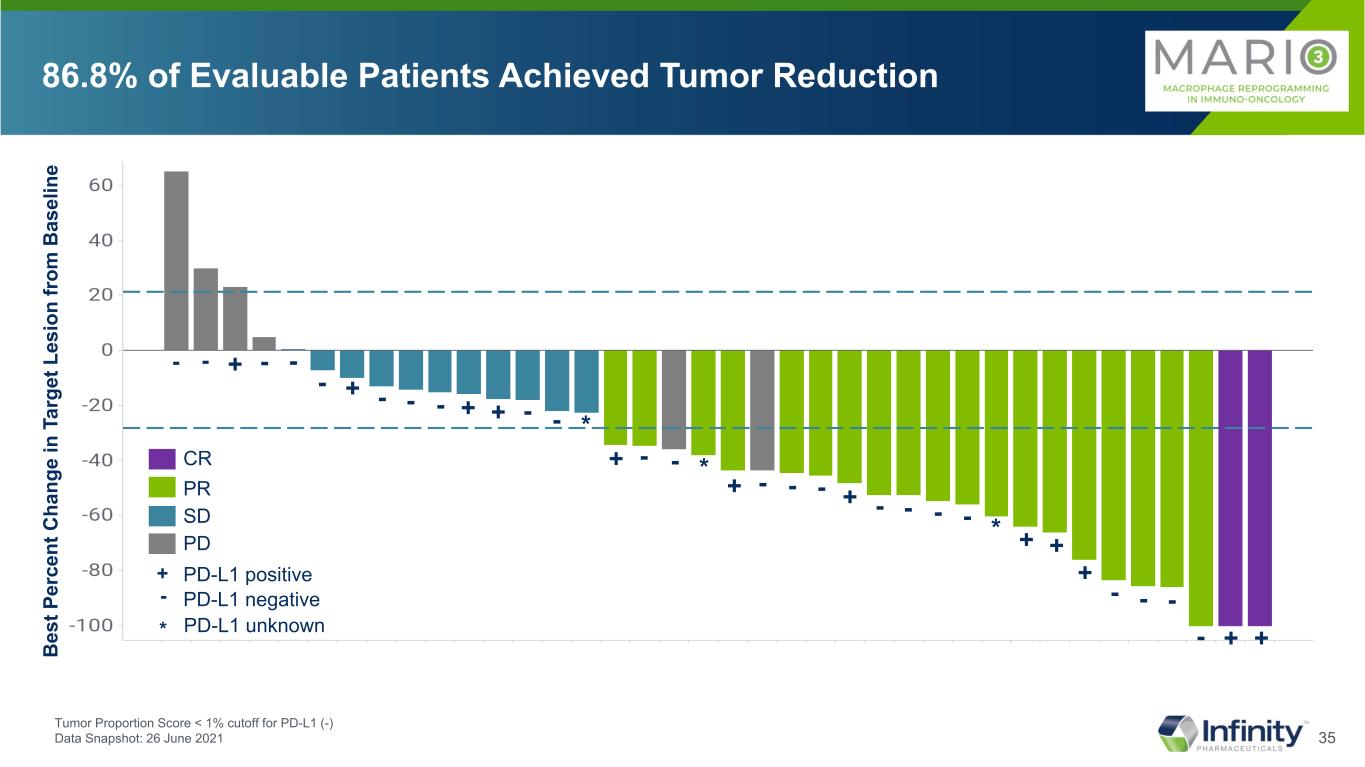
35 86.8% of Evaluable Patients Achieved Tumor Reduction B es t P er ce nt C ha ng e in T ar ge t L es io n fr om B as el in e PR SD PD CR PD-L1 positive PD-L1 negative + - + - + + + + - - -- - - - - - - - - + + + - - + - - - - + +- - - + - Tumor Proportion Score < 1% cutoff for PD-L1 (-) Data Snapshot: 26 June 2021 * * * PD-L1 unknown*
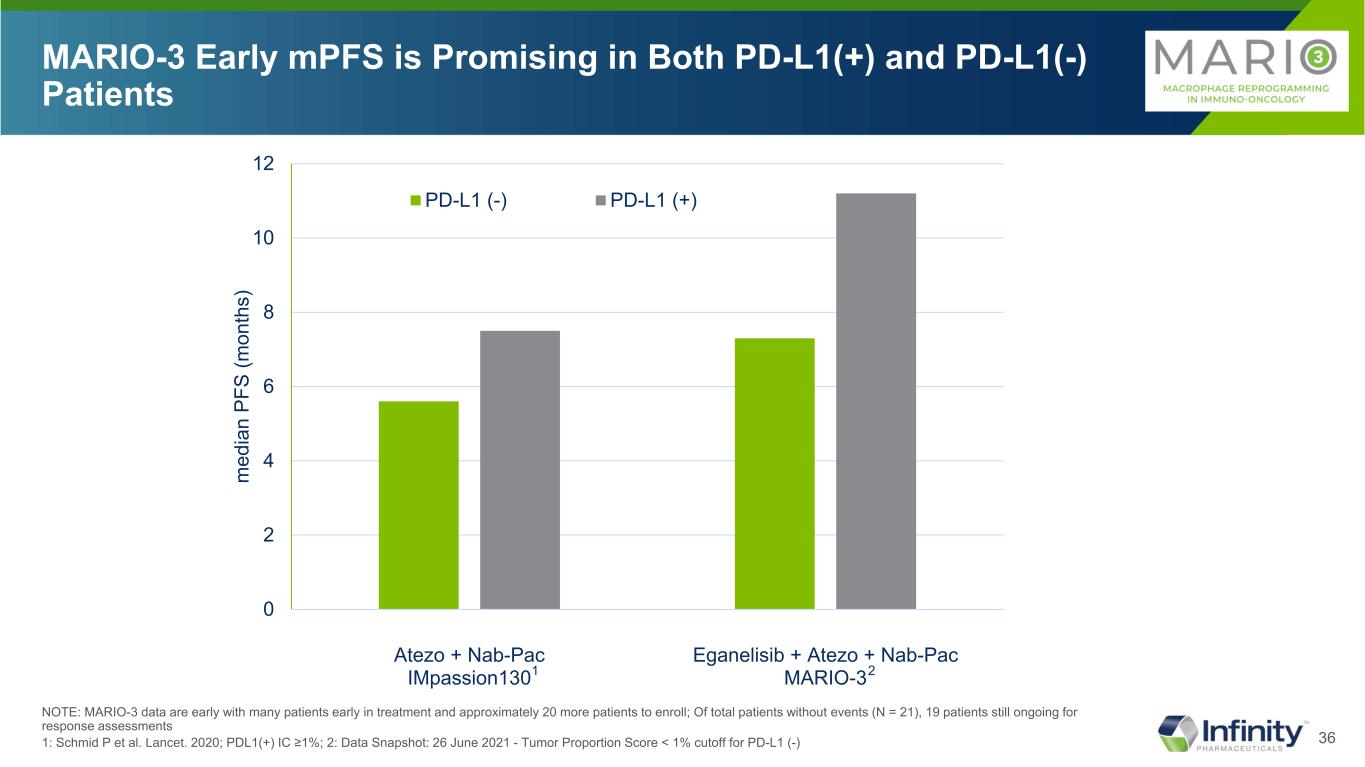
36 MARIO-3 Early mPFS is Promising in Both PD-L1(+) and PD-L1(-) Patients NOTE: MARIO-3 data are early with many patients early in treatment and approximately 20 more patients to enroll; Of total patients without events (N = 21), 19 patients still ongoing for response assessments 1: Schmid P et al. Lancet. 2020; PDL1(+) IC ≥1%; 2: Data Snapshot: 26 June 2021 - Tumor Proportion Score < 1% cutoff for PD-L1 (-) 0 2 4 6 8 10 12 Atezo + Nab-Pac IMpassion130 Eganelisib + Atezo + Nab-Pac MARIO-3 m ed ia n PF S (m on th s) PD-L1 (-) PD-L1 (+) 1 2
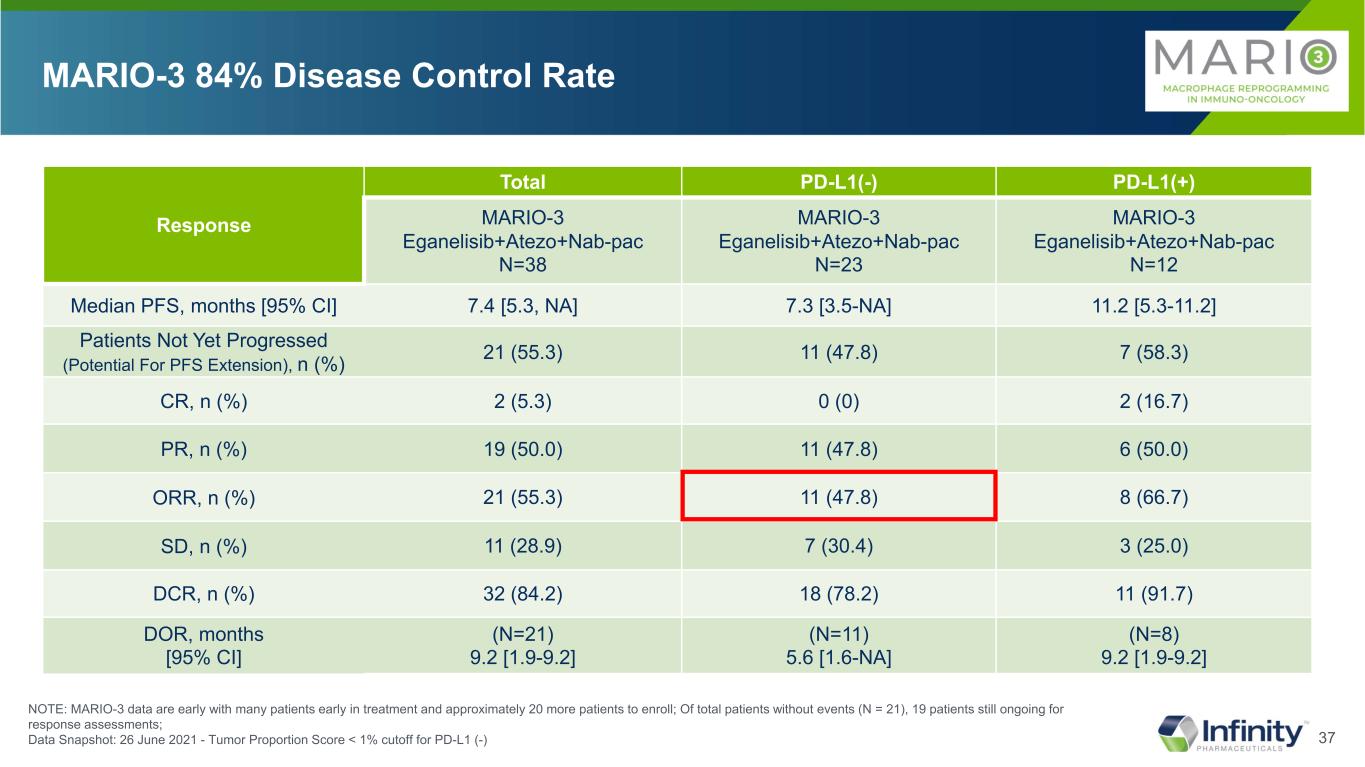
37 Response Total PD-L1(-) PD-L1(+) MARIO-3 Eganelisib+Atezo+Nab-pac N=38 MARIO-3 Eganelisib+Atezo+Nab-pac N=23 MARIO-3 Eganelisib+Atezo+Nab-pac N=12 Median PFS, months [95% CI] 7.4 [5.3, NA] 7.3 [3.5-NA] 11.2 [5.3-11.2] Patients Not Yet Progressed (Potential For PFS Extension), n (%) 21 (55.3) 11 (47.8) 7 (58.3) CR, n (%) 2 (5.3) 0 (0) 2 (16.7) PR, n (%) 19 (50.0) 11 (47.8) 6 (50.0) ORR, n (%) 21 (55.3) 11 (47.8) 8 (66.7) SD, n (%) 11 (28.9) 7 (30.4) 3 (25.0) DCR, n (%) 32 (84.2) 18 (78.2) 11 (91.7) DOR, months [95% CI] (N=21) 9.2 [1.9-9.2] (N=11) 5.6 [1.6-NA] (N=8) 9.2 [1.9-9.2] MARIO-3 84% Disease Control Rate NOTE: MARIO-3 data are early with many patients early in treatment and approximately 20 more patients to enroll; Of total patients without events (N = 21), 19 patients still ongoing for response assessments; Data Snapshot: 26 June 2021 - Tumor Proportion Score < 1% cutoff for PD-L1 (-)
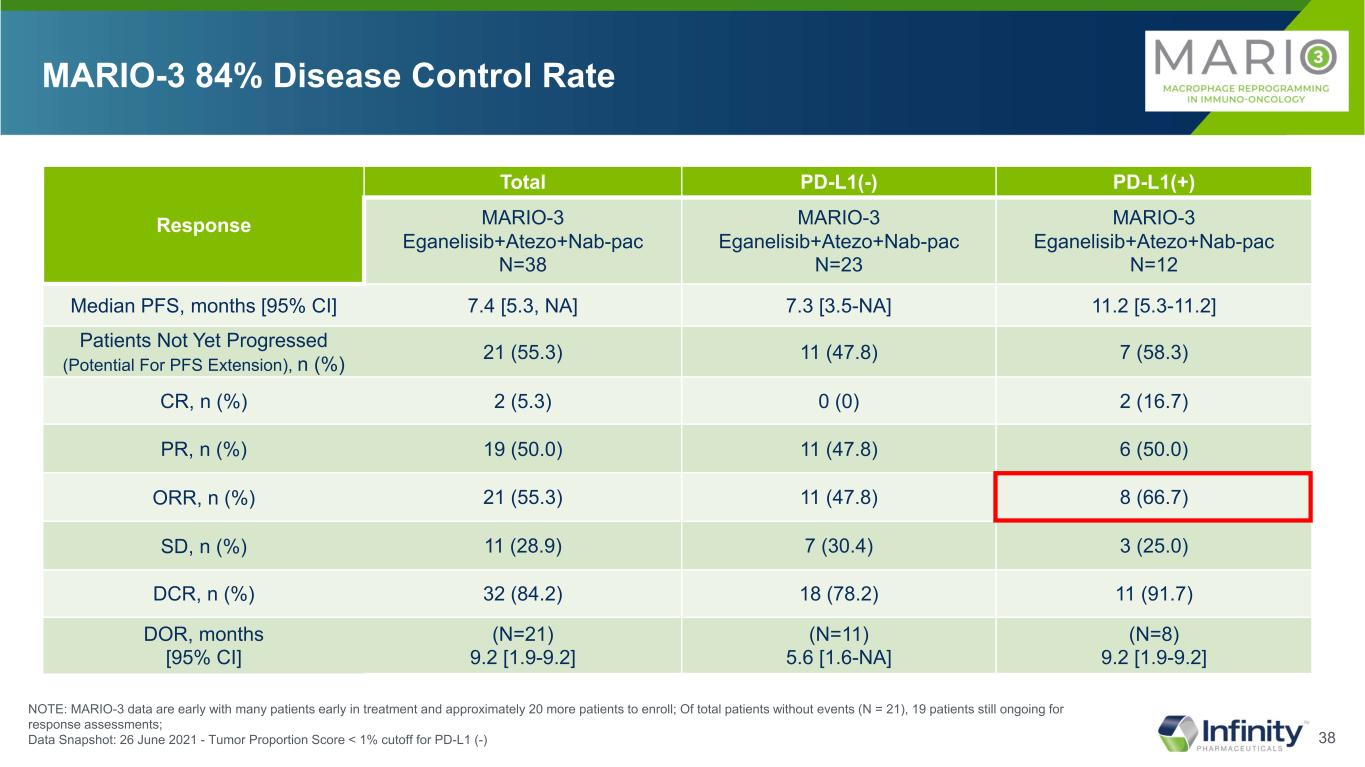
38 Response Total PD-L1(-) PD-L1(+) MARIO-3 Eganelisib+Atezo+Nab-pac N=38 MARIO-3 Eganelisib+Atezo+Nab-pac N=23 MARIO-3 Eganelisib+Atezo+Nab-pac N=12 Median PFS, months [95% CI] 7.4 [5.3, NA] 7.3 [3.5-NA] 11.2 [5.3-11.2] Patients Not Yet Progressed (Potential For PFS Extension), n (%) 21 (55.3) 11 (47.8) 7 (58.3) CR, n (%) 2 (5.3) 0 (0) 2 (16.7) PR, n (%) 19 (50.0) 11 (47.8) 6 (50.0) ORR, n (%) 21 (55.3) 11 (47.8) 8 (66.7) SD, n (%) 11 (28.9) 7 (30.4) 3 (25.0) DCR, n (%) 32 (84.2) 18 (78.2) 11 (91.7) DOR, months [95% CI] (N=21) 9.2 [1.9-9.2] (N=11) 5.6 [1.6-NA] (N=8) 9.2 [1.9-9.2] MARIO-3 84% Disease Control Rate NOTE: MARIO-3 data are early with many patients early in treatment and approximately 20 more patients to enroll; Of total patients without events (N = 21), 19 patients still ongoing for response assessments; Data Snapshot: 26 June 2021 - Tumor Proportion Score < 1% cutoff for PD-L1 (-)

39 Response Total PD-L1(-) PD-L1(+) MARIO-3 Eganelisib+Atezo+Nab-pac N=38 MARIO-3 Eganelisib+Atezo+Nab-pac N=23 MARIO-3 Eganelisib+Atezo+Nab-pac N=12 Median PFS, months [95% CI] 7.4 [5.3, NA] 7.3 [3.5-NA] 11.2 [5.3-11.2] Patients Not Yet Progressed (Potential For PFS Extension), n (%) 21 (55.3) 11 (47.8) 7 (58.3) CR, n (%) 2 (5.3) 0 (0) 2 (16.7) PR, n (%) 19 (50.0) 11 (47.8) 6 (50.0) ORR, n (%) 21 (55.3) 11 (47.8) 8 (66.7) SD, n (%) 11 (28.9) 7 (30.4) 3 (25.0) DCR, n (%) 32 (84.2) 18 (78.2) 11 (91.7) DOR, months [95% CI] (N=21) 9.2 [1.9-9.2] (N=11) 5.6 [1.6-NA] (N=8) 9.2 [1.9-9.2] MARIO-3 84% Disease Control Rate NOTE: MARIO-3 data are early with many patients early in treatment and approximately 20 more patients to enroll; Of total patients without events (N = 21), 19 patients still ongoing for response assessments; Data Snapshot: 26 June 2021 - Tumor Proportion Score < 1% cutoff for PD-L1 (-)
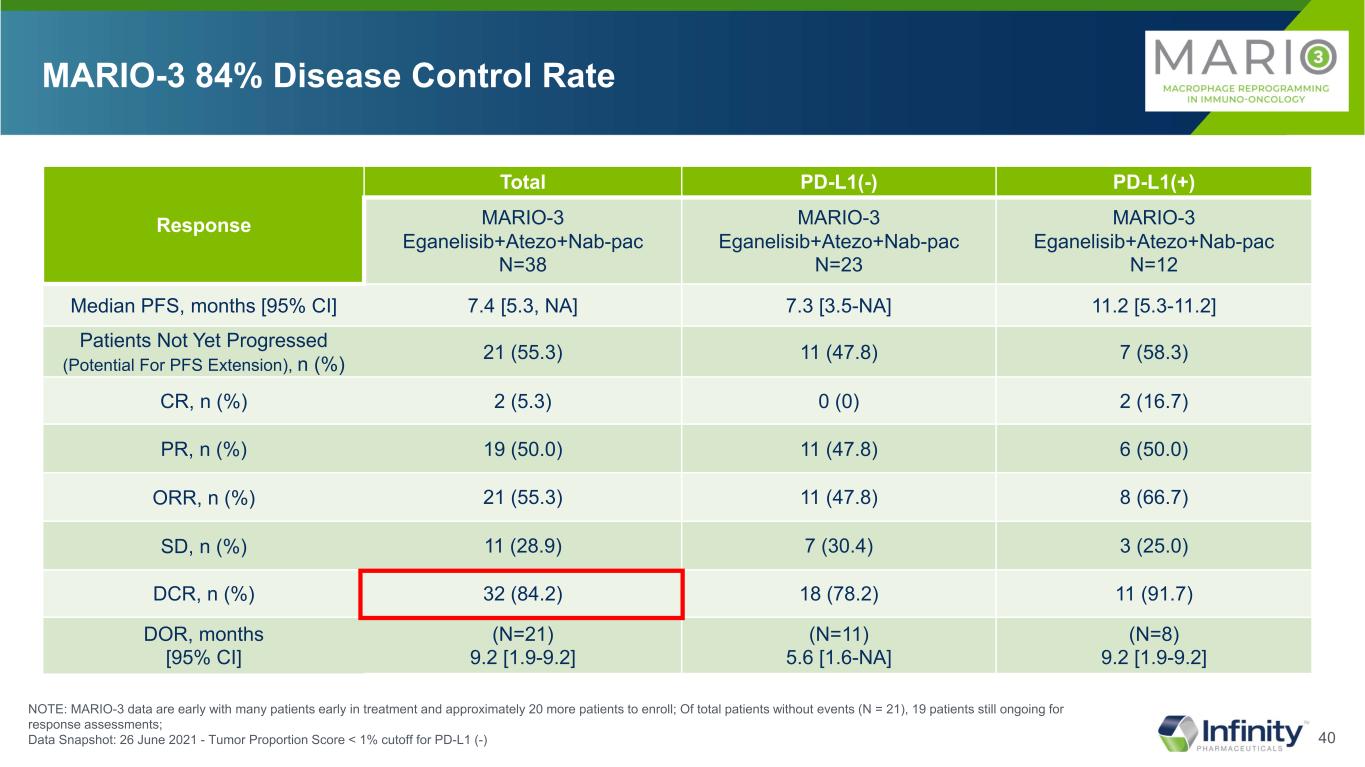
40 Response Total PD-L1(-) PD-L1(+) MARIO-3 Eganelisib+Atezo+Nab-pac N=38 MARIO-3 Eganelisib+Atezo+Nab-pac N=23 MARIO-3 Eganelisib+Atezo+Nab-pac N=12 Median PFS, months [95% CI] 7.4 [5.3, NA] 7.3 [3.5-NA] 11.2 [5.3-11.2] Patients Not Yet Progressed (Potential For PFS Extension), n (%) 21 (55.3) 11 (47.8) 7 (58.3) CR, n (%) 2 (5.3) 0 (0) 2 (16.7) PR, n (%) 19 (50.0) 11 (47.8) 6 (50.0) ORR, n (%) 21 (55.3) 11 (47.8) 8 (66.7) SD, n (%) 11 (28.9) 7 (30.4) 3 (25.0) DCR, n (%) 32 (84.2) 18 (78.2) 11 (91.7) DOR, months [95% CI] (N=21) 9.2 [1.9-9.2] (N=11) 5.6 [1.6-NA] (N=8) 9.2 [1.9-9.2] MARIO-3 84% Disease Control Rate NOTE: MARIO-3 data are early with many patients early in treatment and approximately 20 more patients to enroll; Of total patients without events (N = 21), 19 patients still ongoing for response assessments; Data Snapshot: 26 June 2021 - Tumor Proportion Score < 1% cutoff for PD-L1 (-)
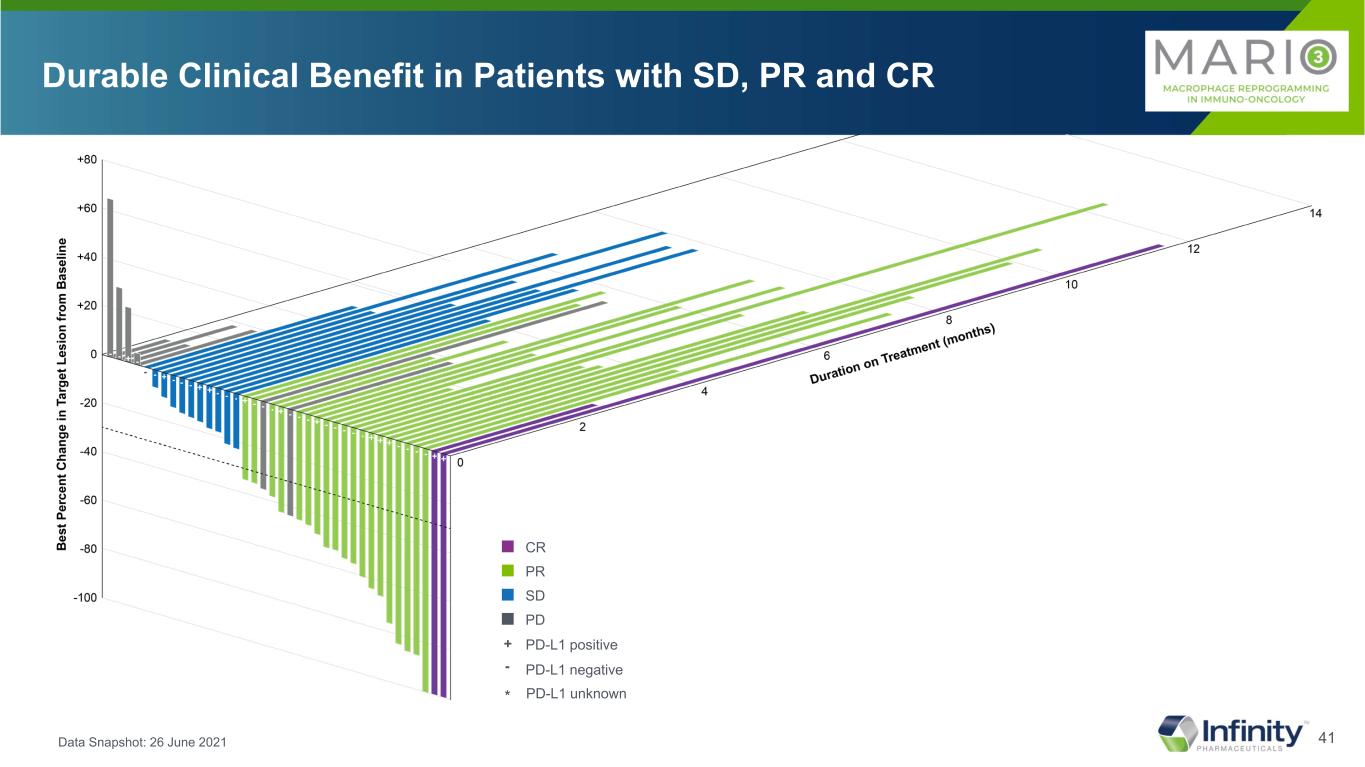
41 ■ CR ■ PR ■ SD ■ PD Durable Clinical Benefit in Patients with SD, PR and CR Data Snapshot: 26 June 2021 * * * PD-L1 positive PD-L1 negative + - PD-L1 unknown*
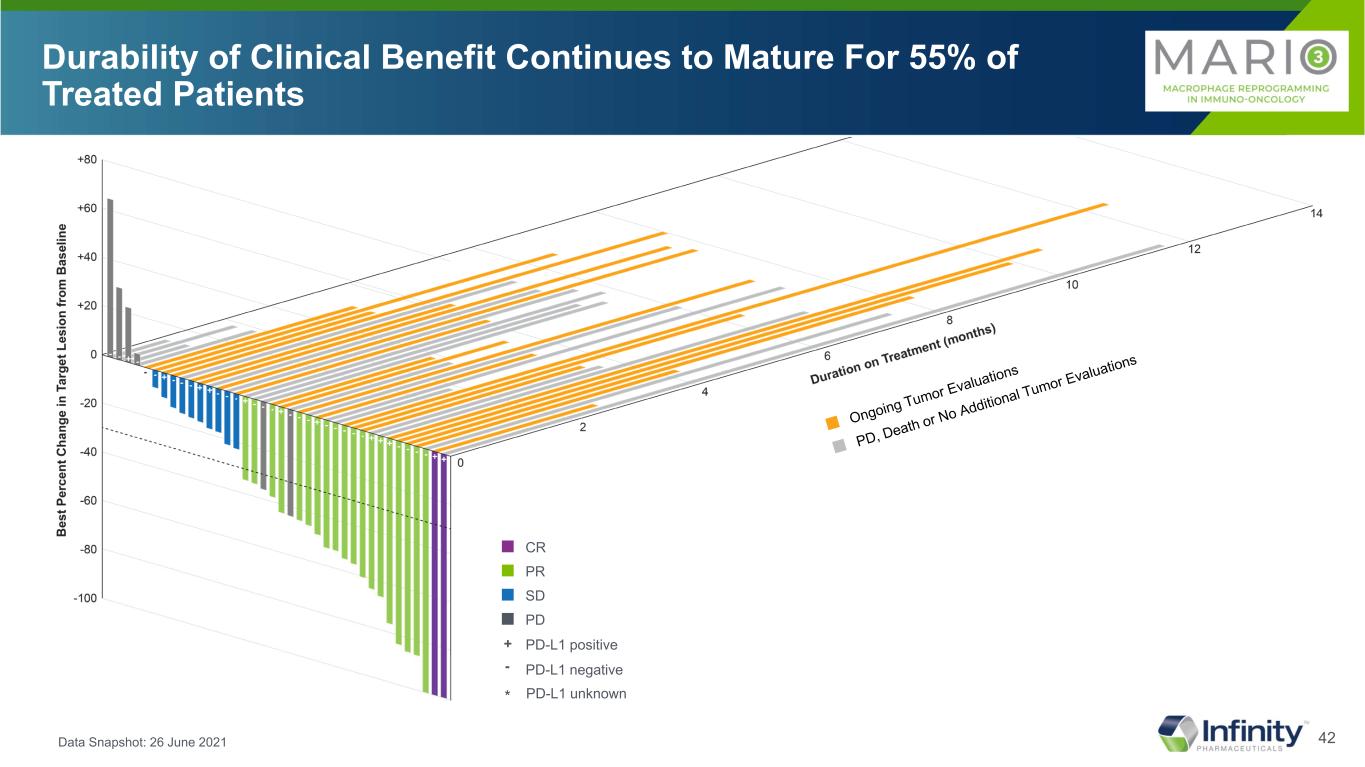
42 Durability of Clinical Benefit Continues to Mature For 55% of Treated Patients Data Snapshot: 26 June 2021 * * * ■ CR ■ PR ■ SD ■ PD PD-L1 positive PD-L1 negative + - PD-L1 unknown*

43 CD8 T Cells Activated T Cell Tumor M2 HLADR+ M1Tumor Reduced Immune Suppression and Increased Immune Activation Day 0 2 mo PD-L1(-) Patient with PR Patient Ongoing Over 10 Months Tumor Proportion Score < 1% cutoff for PD-L1 (-)
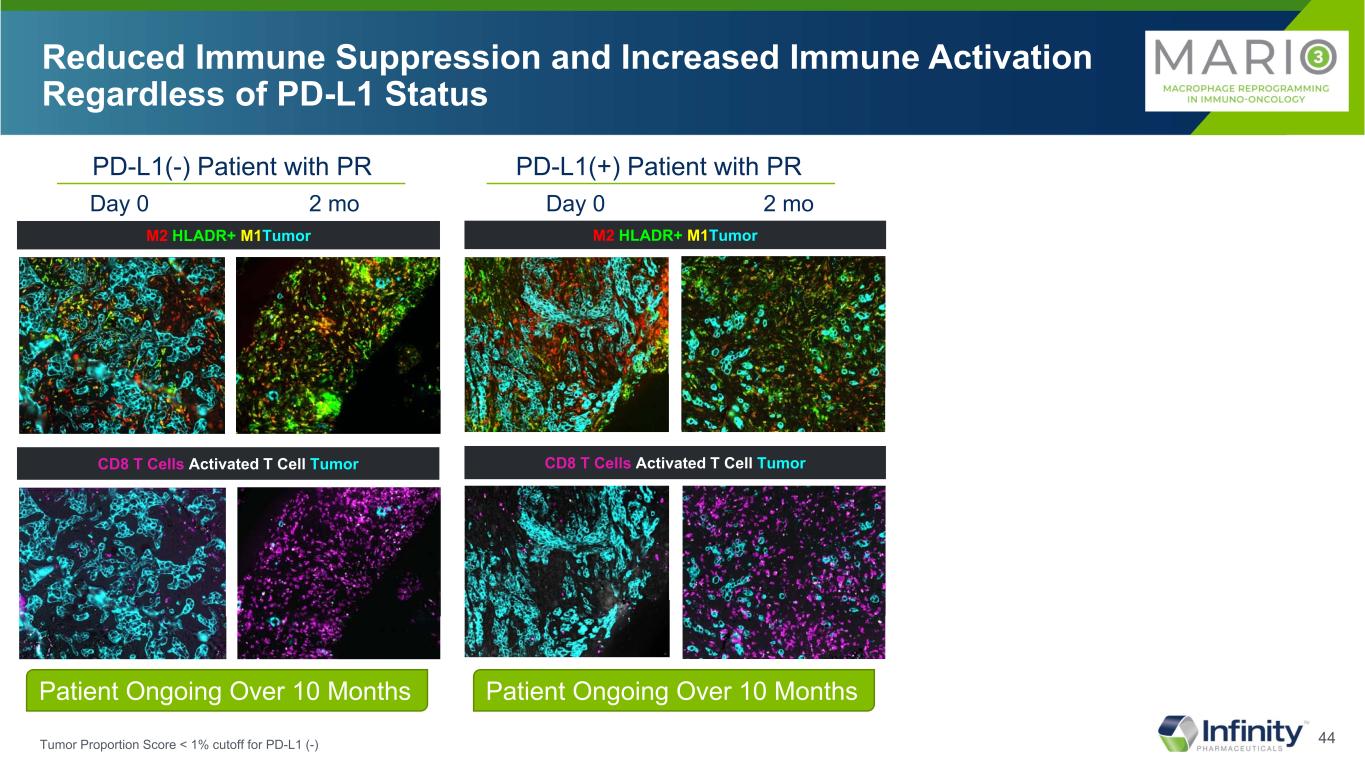
44 CD8 T Cells Activated T Cell TumorCD8 T Cells Activated T Cell Tumor M2 HLADR+ M1TumorM2 HLADR+ M1Tumor Reduced Immune Suppression and Increased Immune Activation Regardless of PD-L1 Status Day 0 2 mo Day 0 2 mo PD-L1(-) Patient with PR PD-L1(+) Patient with PR Patient Ongoing Over 10 Months Patient Ongoing Over 10 Months Tumor Proportion Score < 1% cutoff for PD-L1 (-)
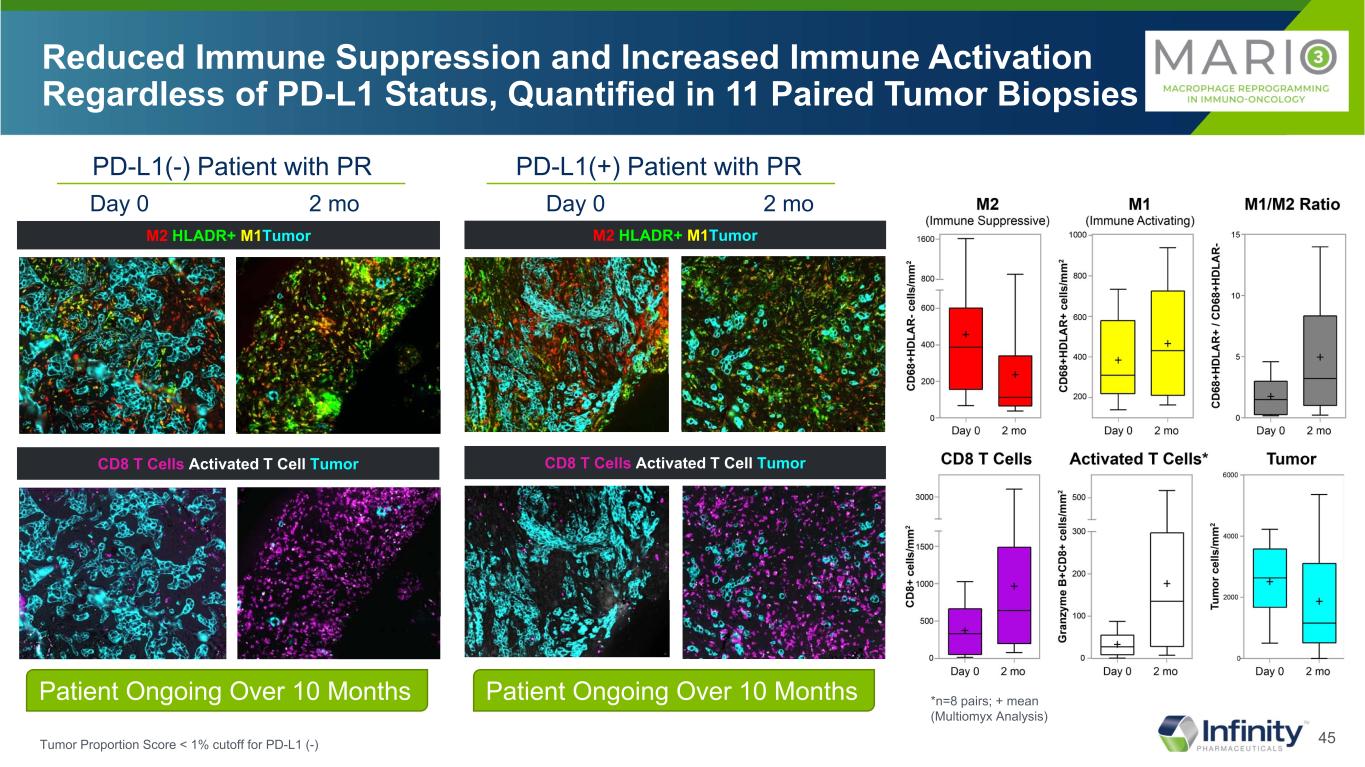
45 CD8 T Cells Activated T Cell TumorCD8 T Cells Activated T Cell Tumor M2 HLADR+ M1TumorM2 HLADR+ M1Tumor Reduced Immune Suppression and Increased Immune Activation Regardless of PD-L1 Status, Quantified in 11 Paired Tumor Biopsies *n=8 pairs; + mean (Multiomyx Analysis) Day 0 2 mo Day 0 2 mo PD-L1(-) Patient with PR PD-L1(+) Patient with PR Patient Ongoing Over 10 Months Patient Ongoing Over 10 Months Tumor Proportion Score < 1% cutoff for PD-L1 (-)

46*conversion from PD-L1(-) to PD-L1(+) (> 1% cutoff , SP142 IHC) Conversion of Patients from PD-L1(-) to PD-L1(+) and Increase in PD-L1 Expression in PD-L1(+) Patients in 11 Paired Tumor Biopsies 0 1 2 3 4 5 6 7 8 9 10 11 12 13 14 15 1 2 3 4 5 6 7 8 PD-L1(-) at Baseline PD-L1(+) at Baseline Baseline 2 months 0 1 2 3 4 5 6 7 8 9 10 11 12 13 14 15 9 10 11 1% PD-L1 cutoff 1% PD-L1 cutoff * * * * % tu m or a re a co ve re d by P D -L 1+ im m un e ce lls % tu m or a re a co ve re d by P D -L 1+ im m un e ce lls Patient Patient *
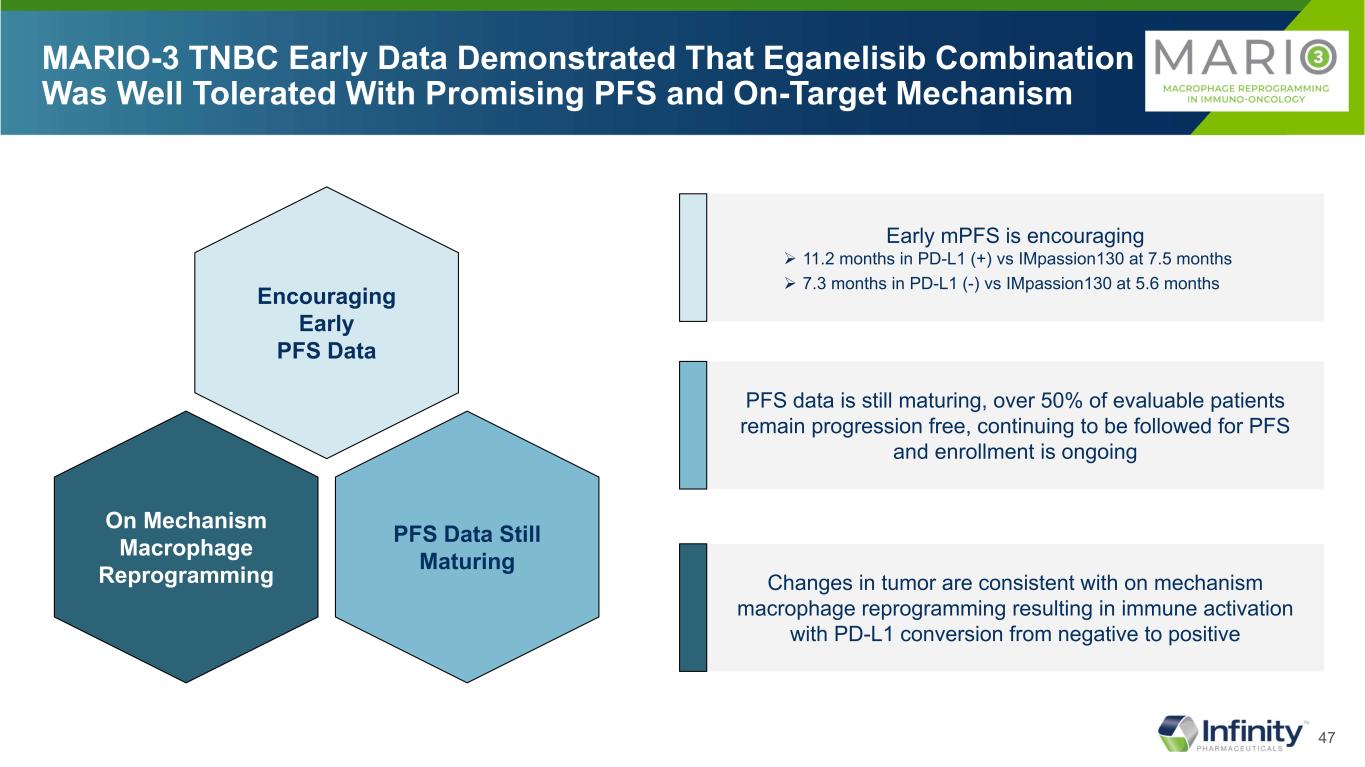
47 MARIO-3 TNBC Early Data Demonstrated That Eganelisib Combination Was Well Tolerated With Promising PFS and On-Target Mechanism PFS Data Still Maturing On Mechanism Macrophage Reprogramming Encouraging Early PFS Data Early mPFS is encouraging 11.2 months in PD-L1 (+) vs IMpassion130 at 7.5 months 7.3 months in PD-L1 (-) vs IMpassion130 at 5.6 months PFS data is still maturing, over 50% of evaluable patients remain progression free, continuing to be followed for PFS and enrollment is ongoing Changes in tumor are consistent with on mechanism macrophage reprogramming resulting in immune activation with PD-L1 conversion from negative to positive
48 Eganelisib demonstrated: • Progression free survival and overall survival patient benefit benchmarked against SOC, likely primary endpoints for registrational studies • Tumor reductions in majority of patients and strong disease control rate correlating with PFS and OS • On mechanism reduction in immune suppression and increase in immune activation regardless of PD-L1 status, including conversion of PD-L1(-) to PD-L1(+) Compelling Eganelisib Results Demonstrated On Mechanism Patient Benefit Across UC and TNBC Tumors Regardless of PD-L1 Status
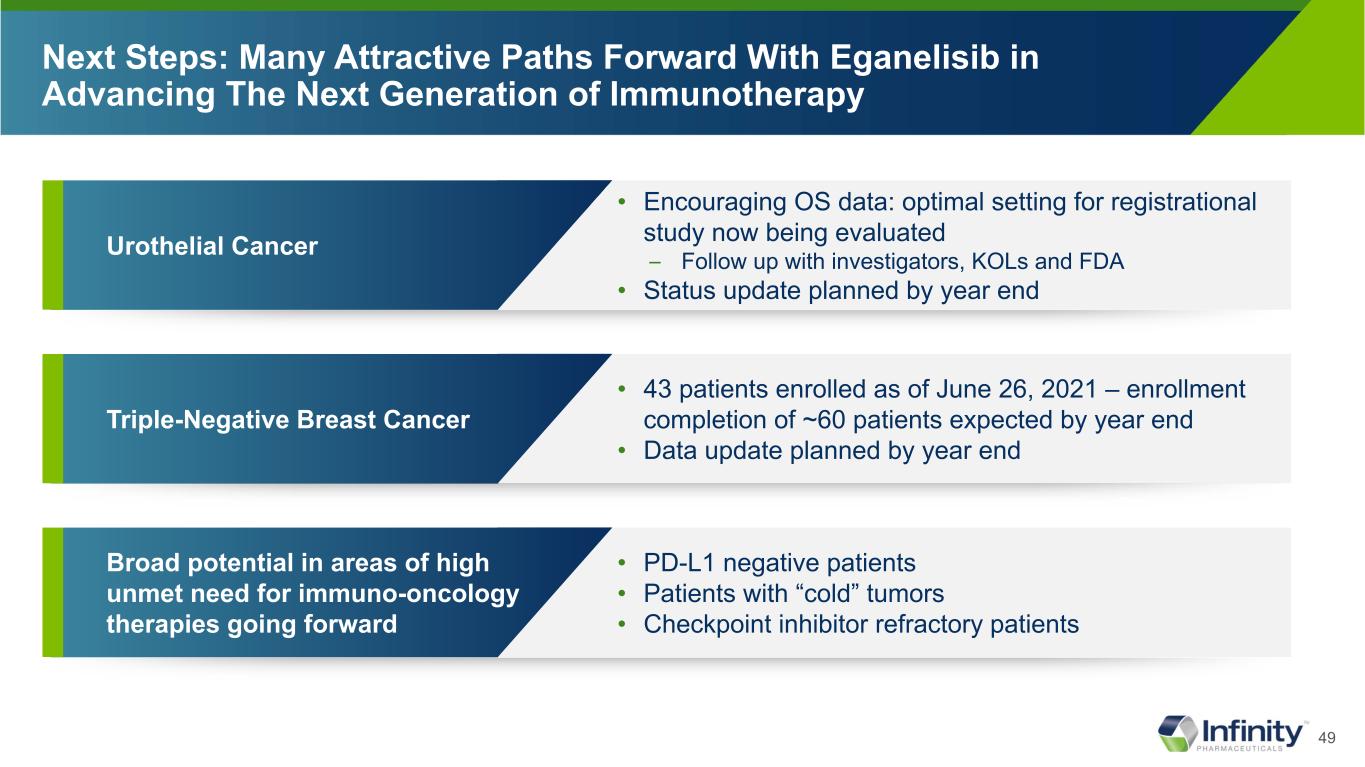
49 Next Steps: Many Attractive Paths Forward With Eganelisib in Advancing The Next Generation of Immunotherapy Broad potential in areas of high unmet need for immuno-oncology therapies going forward • PD-L1 negative patients • Patients with “cold” tumors • Checkpoint inhibitor refractory patients Triple-Negative Breast Cancer • 43 patients enrolled as of June 26, 2021 – enrollment completion of ~60 patients expected by year end • Data update planned by year end Urothelial Cancer • Encouraging OS data: optimal setting for registrational study now being evaluated – Follow up with investigators, KOLs and FDA • Status update planned by year end

Q&A Discussion

Thank You
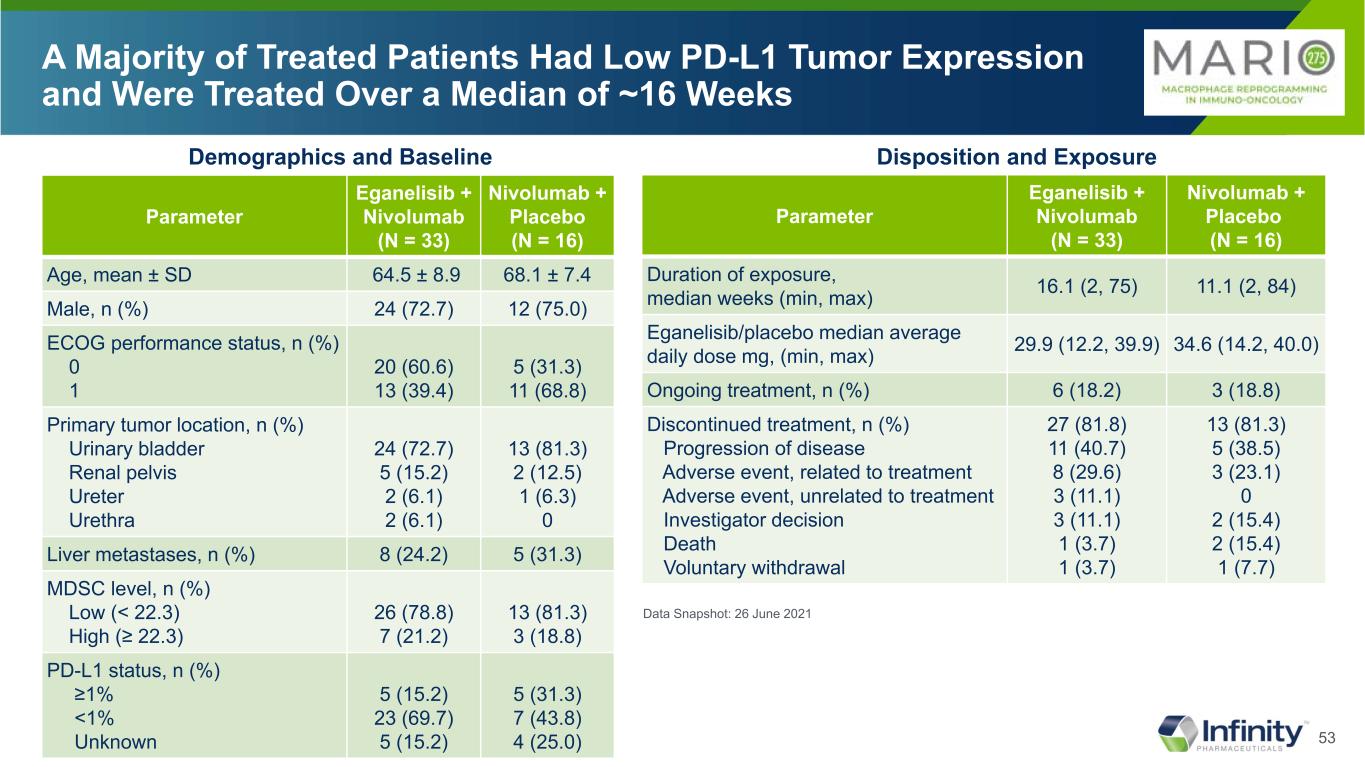
53 A Majority of Treated Patients Had Low PD-L1 Tumor Expression and Were Treated Over a Median of ~16 Weeks Parameter Eganelisib + Nivolumab (N = 33) Nivolumab + Placebo (N = 16) Age, mean ± SD 64.5 ± 8.9 68.1 ± 7.4 Male, n (%) 24 (72.7) 12 (75.0) ECOG performance status, n (%) 0 1 20 (60.6) 13 (39.4) 5 (31.3) 11 (68.8) Primary tumor location, n (%) Urinary bladder Renal pelvis Ureter Urethra 24 (72.7) 5 (15.2) 2 (6.1) 2 (6.1) 13 (81.3) 2 (12.5) 1 (6.3) 0 Liver metastases, n (%) 8 (24.2) 5 (31.3) MDSC level, n (%) Low (< 22.3) High (≥ 22.3) 26 (78.8) 7 (21.2) 13 (81.3) 3 (18.8) PD-L1 status, n (%) ≥1% <1% Unknown 5 (15.2) 23 (69.7) 5 (15.2) 5 (31.3) 7 (43.8) 4 (25.0) Data Snapshot: 26 June 2021 Parameter Eganelisib + Nivolumab (N = 33) Nivolumab + Placebo (N = 16) Duration of exposure, median weeks (min, max) 16.1 (2, 75) 11.1 (2, 84) Eganelisib/placebo median average daily dose mg, (min, max) 29.9 (12.2, 39.9) 34.6 (14.2, 40.0) Ongoing treatment, n (%) 6 (18.2) 3 (18.8) Discontinued treatment, n (%) Progression of disease Adverse event, related to treatment Adverse event, unrelated to treatment Investigator decision Death Voluntary withdrawal 27 (81.8) 11 (40.7) 8 (29.6) 3 (11.1) 3 (11.1) 1 (3.7) 1 (3.7) 13 (81.3) 5 (38.5) 3 (23.1) 0 2 (15.4) 2 (15.4) 1 (7.7) Disposition and ExposureDemographics and Baseline
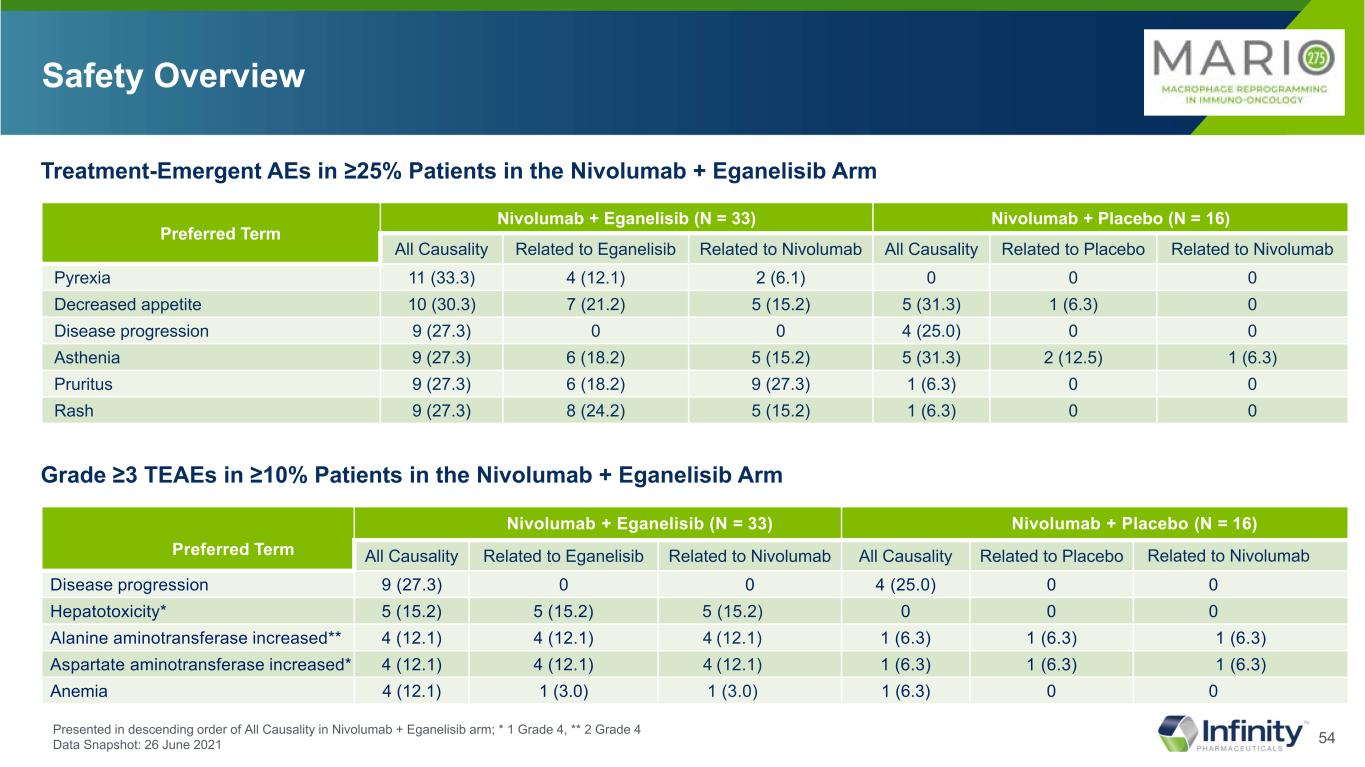
54 Safety Overview Preferred Term Nivolumab + Eganelisib (N = 33) Nivolumab + Placebo (N = 16) All Causality Related to Eganelisib Related to Nivolumab All Causality Related to Placebo Related to Nivolumab Pyrexia 11 (33.3) 4 (12.1) 2 (6.1) 0 0 0 Decreased appetite 10 (30.3) 7 (21.2) 5 (15.2) 5 (31.3) 1 (6.3) 0 Disease progression 9 (27.3) 0 0 4 (25.0) 0 0 Asthenia 9 (27.3) 6 (18.2) 5 (15.2) 5 (31.3) 2 (12.5) 1 (6.3) Pruritus 9 (27.3) 6 (18.2) 9 (27.3) 1 (6.3) 0 0 Rash 9 (27.3) 8 (24.2) 5 (15.2) 1 (6.3) 0 0 Treatment-Emergent AEs in ≥25% Patients in the Nivolumab + Eganelisib Arm Presented in descending order of All Causality in Nivolumab + Eganelisib arm; * 1 Grade 4, ** 2 Grade 4 Data Snapshot: 26 June 2021 Preferred Term Nivolumab + Eganelisib (N = 33) Nivolumab + Placebo (N = 16) All Causality Related to Eganelisib Related to Nivolumab All Causality Related to Placebo Related to Nivolumab Disease progression 9 (27.3) 0 0 4 (25.0) 0 0 Hepatotoxicity* 5 (15.2) 5 (15.2) 5 (15.2) 0 0 0 Alanine aminotransferase increased** 4 (12.1) 4 (12.1) 4 (12.1) 1 (6.3) 1 (6.3) 1 (6.3) Aspartate aminotransferase increased* 4 (12.1) 4 (12.1) 4 (12.1) 1 (6.3) 1 (6.3) 1 (6.3) Anemia 4 (12.1) 1 (3.0) 1 (3.0) 1 (6.3) 0 0 Grade ≥3 TEAEs in ≥10% Patients in the Nivolumab + Eganelisib Arm
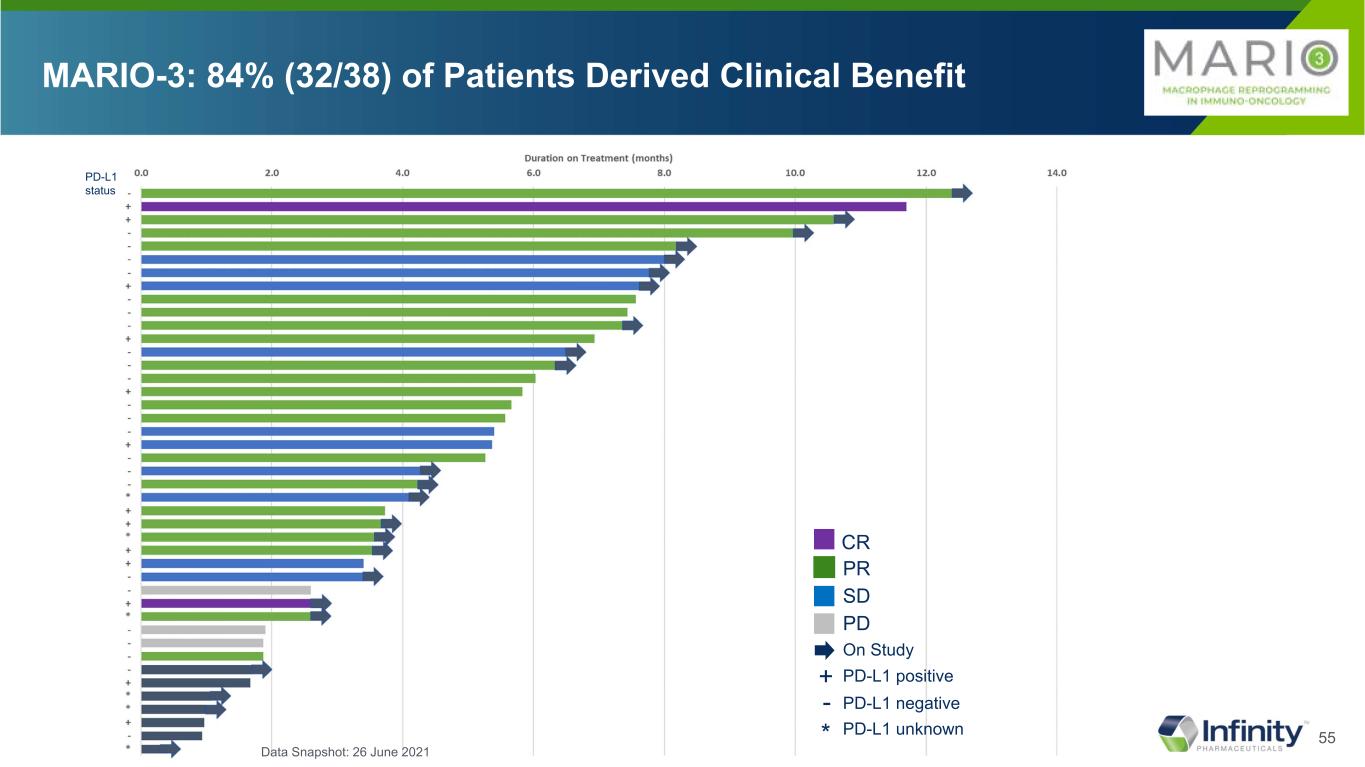
55 MARIO-3: 84% (32/38) of Patients Derived Clinical Benefit PR SD PD CR On Study PD-L1 positive+ PD-L1 negative- PD-L1 unknown* PD-L1 status Data Snapshot: 26 June 2021
