Attached files
| file | filename |
|---|---|
| 8-K - 8-K - FIRST BUSEY CORP /NV/ | buse-20210727x8k.htm |
| EX-99.1 - EX-99.1 - FIRST BUSEY CORP /NV/ | buse-20210727xex99d1.htm |
Exhibit 99.2
| July 27, 2021 2Q21 QUARTERLY EARNINGS SUPPLEMENT |
| Special Note Concerning Forward-Looking Statements Statements made in this document, other than those concerning historical financial information, may be considered forward-looking statements within the meaning of the Private Securities Litigation Reform Act of 1995 with respect to the financial condition, results of operations, plans, objectives, future performance and business of the Company. Forward-looking statements, which may be based upon beliefs, expectations and assumptions of the Company’s management and on information currently available to management, are generally identifiable by the use of words such as “believe,” “expect,” “anticipate,” “plan,” “intend,” “estimate,” “may,” “will,” “would,” “could,” “should” or other similar expressions. Additionally, all statements in this document, including forward-looking statements, speak only as of the date they are made, and the Company undertakes no obligation to update any statement in light of new information or future events. A number of factors, many of which are beyond the Company’s ability to control or predict, could cause actual results to differ materially from those in the Company’s forward-looking statements. These factors include, among others, the following: (i) the strength of the local, state, national and international economy (including the impact of the current presidential administration); (ii) the economic impact of any future terrorist threats or attacks, widespread disease or pandemics (including the COVID-19 pandemic), or other adverse external events that could cause economic deterioration or instability in credit markets; (iii) changes in state and federal laws, regulations and governmental policies concerning the Company’s general business; (iv) changes in accounting policies and practices, including FASB’s CECL impairment standards; (v) changes in interest rates and prepayment rates of the Company’s assets (including the impact of The London Inter-bank Offered Rate phase-out); (vi) increased competition in the financial services sector and the inability to attract new customers; (vii) changes in technology and the ability to develop and maintain secure and reliable electronic systems; (viii) the loss of key executives or associates; (ix) changes in consumer spending; (x) unexpected results of current and/or future acquisitions, which may include failure to realize the anticipated benefits of any acquisition and the possibility that transaction costs may be greater than anticipated; (xi) unexpected outcomes of existing or new litigation involving the Company; and (xii) the economic impact of exceptional weather occurrences such as tornadoes, hurricanes, floods, and blizzards. These risks and uncertainties should be considered in evaluating forward-looking statements and undue reliance should not be placed on such statements. Additional information concerning the Company and its business, including additional factors that could materially affect its financial results, is included in the Company’s filings with the Securities and Exchange Commission. |
| Non-GAAP Financial Measures This document contains financial information determined other than in accordance with accounting principles generally accepted in the United States of America (“GAAP”). Management uses these “non-GAAP” measures in its analysis of the Company’s performance. Management also believes that these non-GAAP financial measures allow for better comparability of period to period operating performance. Additionally, the Company believes this information is utilized by regulators and market analysts to evaluate a company’s financial condition, and therefore, such information is useful to investors. These disclosures should not be viewed as a substitute for operating results determined in accordance with GAAP, nor are they necessarily comparable to non-GAAP performance measures that may be presented by other companies. A reconciliation of the non-GAAP measures used in this document to the most directly comparable GAAP measures is provided beginning on page 36 of this document. For more details on the Company’s non-GAAP measures, refer to the Company’s Quarterly Report on Form 10-Q for the quarter ended March 31, 2021. |
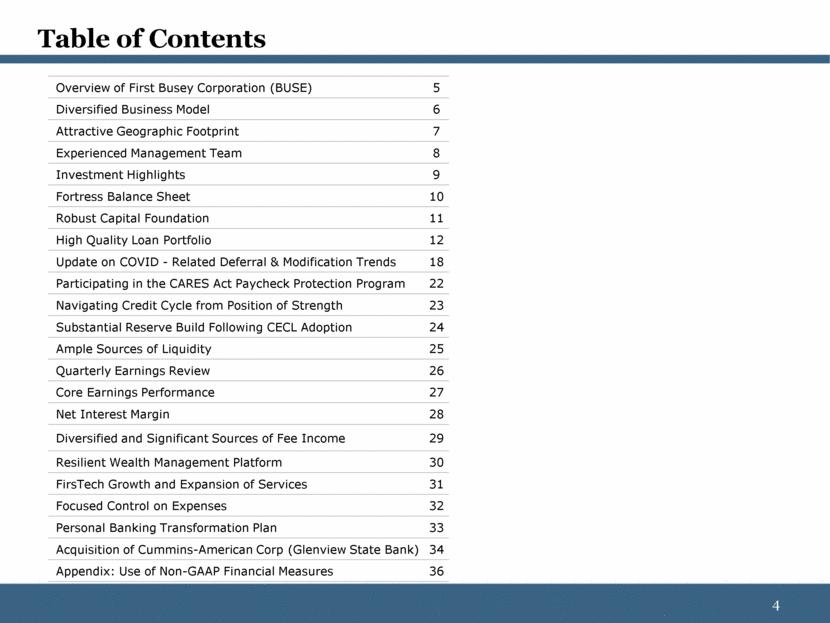
| Table of Contents Overview of First Busey Corporation (BUSE) 5 Diversified Business Model 6 Attractive Geographic Footprint 7 Experienced Management Team 8 Investment Highlights 9 Fortress Balance Sheet 10 Robust Capital Foundation 11 High Quality Loan Portfolio 12 Update on COVID - Related Deferral & Modification Trends 18 Participating in the CARES Act Paycheck Protection Program 22 Navigating Credit Cycle from Position of Strength 23 Substantial Reserve Build Following CECL Adoption 24 Ample Sources of Liquidity 25 Quarterly Earnings Review 26 Core Earnings Performance 27 Net Interest Margin 28 Diversified and Significant Sources of Fee Income 29 Resilient Wealth Management Platform 30 FirsTech Growth and Expansion of Services 31 Focused Control on Expenses 32 Personal Banking Transformation Plan 33 Acquisition of Cummins-American Corp (Glenview State Bank) 34 Appendix: Use of Non-GAAP Financial Measures 36 |
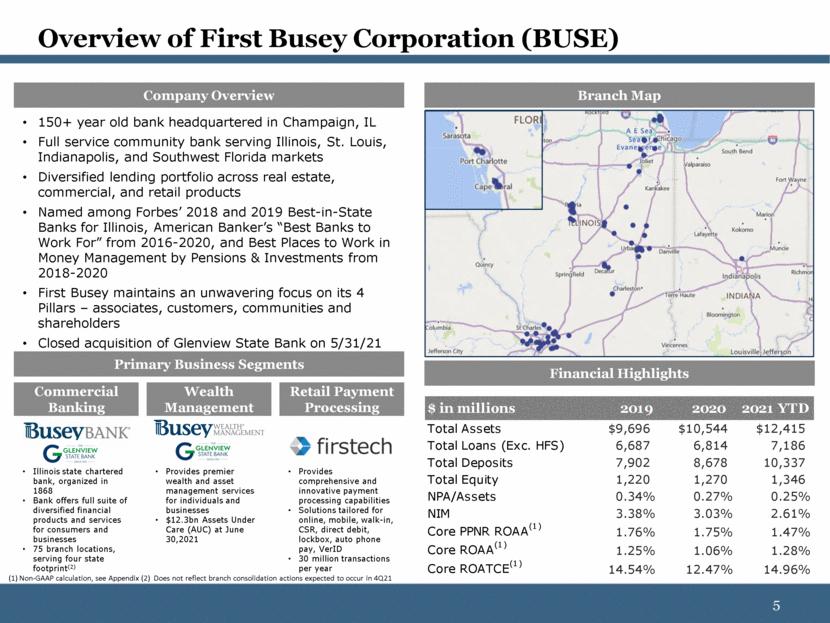
| Overview of First Busey Corporation (BUSE) Company Overview Branch Map Primary Business Segments Financial Highlights Commercial Banking Wealth Management Retail Payment Processing Illinois state chartered bank, organized in 1868 Bank offers full suite of diversified financial products and services for consumers and businesses 75 branch locations, serving four state footprint(2) Provides premier wealth and asset management services for individuals and businesses $12.3bn Assets Under Care (AUC) at June 30,2021 Provides comprehensive and innovative payment processing capabilities Solutions tailored for online, mobile, walk-in, CSR, direct debit, lockbox, auto phone pay, VerID 30 million transactions per year 150+ year old bank headquartered in Champaign, IL Full service community bank serving Illinois, St. Louis, Indianapolis, and Southwest Florida markets Diversified lending portfolio across real estate, commercial, and retail products Named among Forbes’ 2018 and 2019 Best-in-State Banks for Illinois, American Banker’s “Best Banks to Work For” from 2016-2020, and Best Places to Work in Money Management by Pensions & Investments from 2018-2020 First Busey maintains an unwavering focus on its 4 Pillars – associates, customers, communities and shareholders Closed acquisition of Glenview State Bank on 5/31/21 (1) Non-GAAP calculation, see Appendix (2) Does not reflect branch consolidation actions expected to occur in 4Q21 $ in millions 2019 2020 2021 YTD Total Assets $9,696 $10,544 $12,415 Total Loans (Exc. HFS) 6,687 6,814 7,186 Total Deposits 7,902 8,678 10,337 Total Equity 1,220 1,270 1,346 NPA/Assets 0.34% 0.27% 0.25% NIM 3.38% 3.03% 2.61% Core PPNR ROAA (1) 1.76% 1.75% 1.47% Core ROAA (1) 1.25% 1.06% 1.28% Core ROATCE (1) 14.54% 12.47% 14.96% |
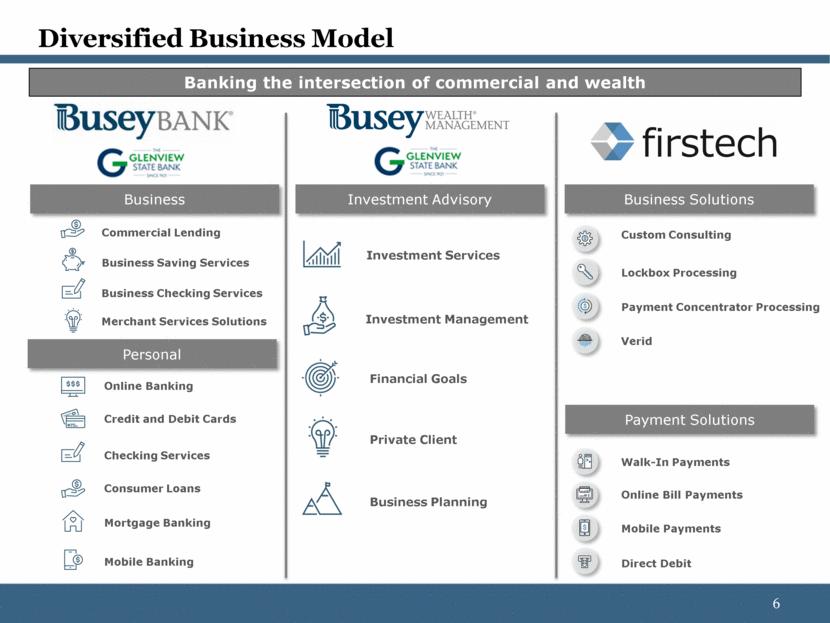
| Online Banking Credit and Debit Cards Checking Services Consumer Loans Commercial Lending Business Saving Services Personal Business Mortgage Banking Mobile Banking Diversified Business Model Investment Services Investment Management Financial Goals Private Client Business Planning Business Checking Services Merchant Services Solutions Custom Consulting Lockbox Processing Payment Concentrator Processing Verid Walk-In Payments Online Bill Payments Mobile Payments Direct Debit Business Solutions Payment Solutions Investment Advisory Banking the intersection of commercial and wealth |
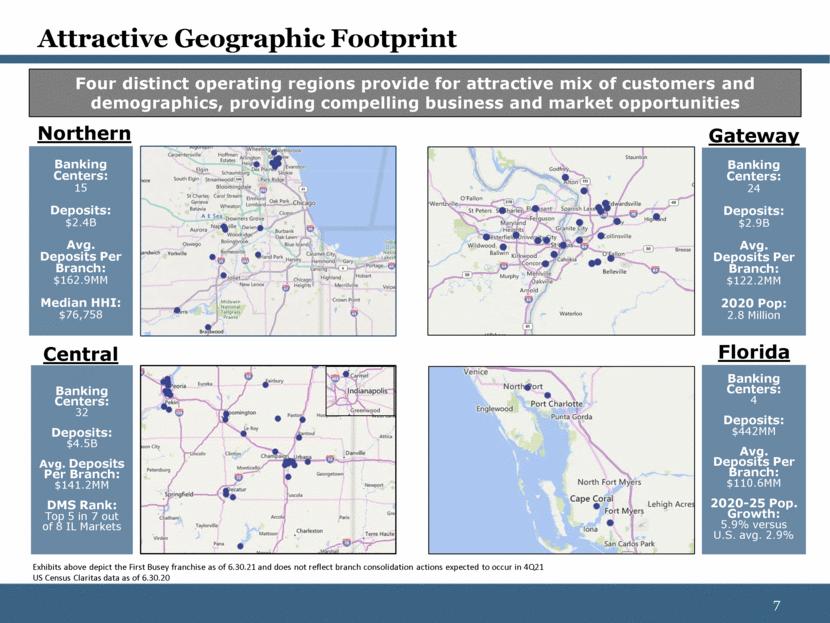
| Attractive Geographic Footprint Four distinct operating regions provide for attractive mix of customers and demographics, providing compelling business and market opportunities Northern Gateway Central Florida Banking Centers: 15 Deposits: $2.4B Avg. Deposits Per Branch: $162.9MM Median HHI: $76,758 Banking Centers: 24 Deposits: $2.9B Avg. Deposits Per Branch: $122.2MM 2020 Pop: 2.8 Million Banking Centers: 32 Deposits: $4.5B Avg. Deposits Per Branch: $141.2MM DMS Rank: Top 5 in 7 out of 8 IL Markets Banking Centers: 4 Deposits: $442MM Avg. Deposits Per Branch: $110.6MM 2020-25 Pop. Growth: 5.9% versus U.S. avg. 2.9% US Census Claritas data as of 6.30.20 Exhibits above depict the First Busey franchise as of 6.30.21 and does not reflect branch consolidation actions expected to occur in 4Q21 |
| Experienced Management Team Van A. Dukeman Chairman, President & Chief Executive Officer, First Busey Corporation Robin N. Elliott President & CEO, Busey Bank Jeffrey D. Jones EVP & CFO Robert F. Plecki, Jr. EVP, Chief Banking Officer John J. Powers EVP & General Counsel Monica L. Bowe EVP & Chief Risk Officer Has served as President & CEO of First Busey since 2007. Mr. Dukeman was President & CEO of Main Street Trust from 1998 until its merger with First Busey in 2007. In addition to his role as President & CEO, Mr. Dukeman became Chairman of the Holding Company Board effective July 22, 2020. Mr. Dukeman’s 40 years of diverse financial services experience and extensive board involvement throughout his career brings a conservative operating philosophy and a management style that focus on Busey’s associates, customers, communities and shareholders. Joined Busey in 2006 and led various finance functions prior to serving as CFO/COO and now Bank President/CEO. Mr. Elliott has played instrumental roles in executing various strategic and growth initiatives. Before joining Busey, Mr. Elliott worked for various national public accounting firms, including Ernst & Young. Joined Busey in August 2019, bringing his nearly 20 years of investment banking and financial services experience to Busey. Mr. Jones previously served as Managing Director and Co-Head of Financial Institutions at Stephens Inc. Mr. Jones began his career in the Banking Supervision and Regulation division of the Federal Reserve. Joined Busey in 1984 and has served in the role of Chief Credit Officer or Chief Banking Officer of First Busey since 2010 as well as serving as the Chair of Credit Committees. Mr. Plecki previously served as President & CEO of Busey Wealth Management, COO, and EVP of the Florida and Champaign market. Prior to the 2007 merger with First Busey, Bob served in various management roles at Main Street Trust. Highly experienced board with nearly 150 years of combined director experience Management aligned with shareholders (insider ownership of 7.2%) Amy L. Randolph Chief of Staff & EVP of Pillar Relations |
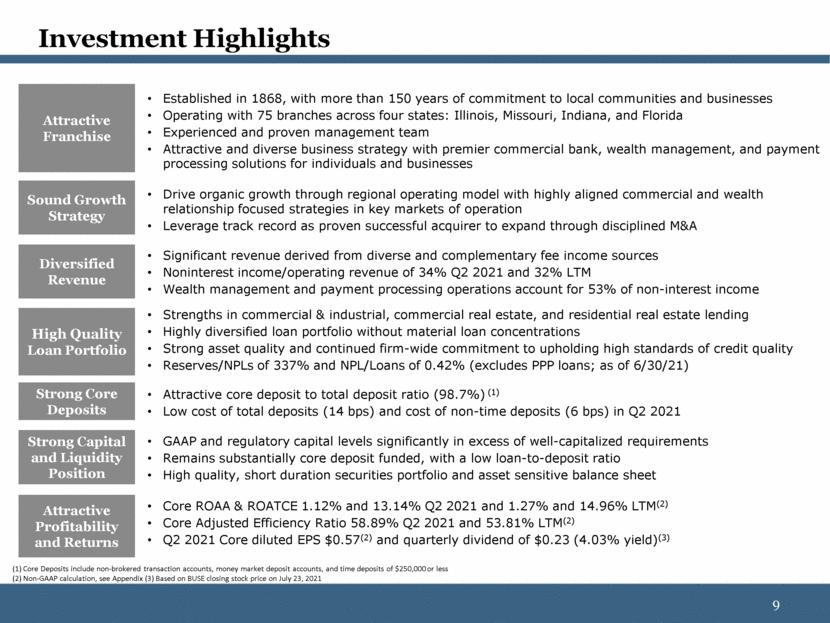
| Investment Highlights Established in 1868, with more than 150 years of commitment to local communities and businesses Operating with 75 branches across four states: Illinois, Missouri, Indiana, and Florida Experienced and proven management team Attractive and diverse business strategy with premier commercial bank, wealth management, and payment processing solutions for individuals and businesses Attractive Franchise Sound Growth Strategy Strong Core Deposits Strong Capital and Liquidity Position High Quality Loan Portfolio Diversified Revenue Drive organic growth through regional operating model with highly aligned commercial and wealth relationship focused strategies in key markets of operation Leverage track record as proven successful acquirer to expand through disciplined M&A Attractive core deposit to total deposit ratio (98.7%) (1) Low cost of total deposits (14 bps) and cost of non-time deposits (6 bps) in Q2 2021 Strengths in commercial & industrial, commercial real estate, and residential real estate lending Highly diversified loan portfolio without material loan concentrations Strong asset quality and continued firm-wide commitment to upholding high standards of credit quality Reserves/NPLs of 337% and NPL/Loans of 0.42% (excludes PPP loans; as of 6/30/21) Significant revenue derived from diverse and complementary fee income sources Noninterest income/operating revenue of 34% Q2 2021 and 32% LTM Wealth management and payment processing operations account for 53% of non-interest income GAAP and regulatory capital levels significantly in excess of well-capitalized requirements Remains substantially core deposit funded, with a low loan-to-deposit ratio High quality, short duration securities portfolio and asset sensitive balance sheet (1) Core Deposits include non-brokered transaction accounts, money market deposit accounts, and time deposits of $250,000 or less (2) Non-GAAP calculation, see Appendix (3) Based on BUSE closing stock price on July 23, 2021 Attractive Profitability and Returns Core ROAA & ROATCE 1.12% and 13.14% Q2 2021 and 1.27% and 14.96% LTM(2) Core Adjusted Efficiency Ratio 58.89% Q2 2021 and 53.81% LTM(2) Q2 2021 Core diluted EPS $0.57(2) and quarterly dividend of $0.23 (4.03% yield)(3) |
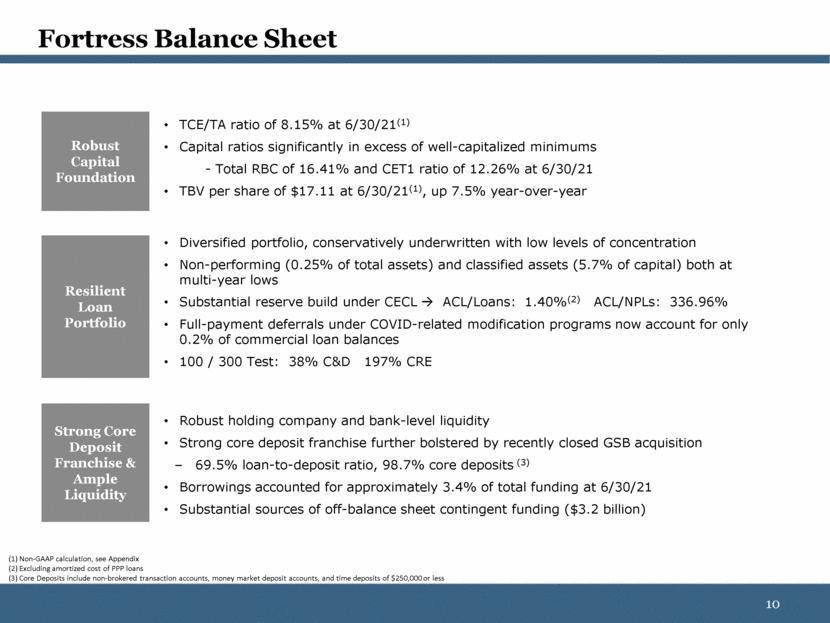
| TCE/TA ratio of 8.15% at 6/30/21(1) Capital ratios significantly in excess of well-capitalized minimums - Total RBC of 16.41% and CET1 ratio of 12.26% at 6/30/21 TBV per share of $17.11 at 6/30/21(1), up 7.5% year-over-year Diversified portfolio, conservatively underwritten with low levels of concentration Non-performing (0.25% of total assets) and classified assets (5.7% of capital) both at multi-year lows Substantial reserve build under CECL ACL/Loans: 1.40%(2) ACL/NPLs: 336.96% Full-payment deferrals under COVID-related modification programs now account for only 0.2% of commercial loan balances 100 / 300 Test: 38% C&D 197% CRE Robust holding company and bank-level liquidity Strong core deposit franchise further bolstered by recently closed GSB acquisition 69.5% loan-to-deposit ratio, 98.7% core deposits (3) Borrowings accounted for approximately 3.4% of total funding at 6/30/21 Substantial sources of off-balance sheet contingent funding ($3.2 billion) Fortress Balance Sheet (1) Non-GAAP calculation, see Appendix (2) Excluding amortized cost of PPP loans (3) Core Deposits include non-brokered transaction accounts, money market deposit accounts, and time deposits of $250,000 or less Robust Capital Foundation Resilient Loan Portfolio Strong Core Deposit Franchise & Ample Liquidity |
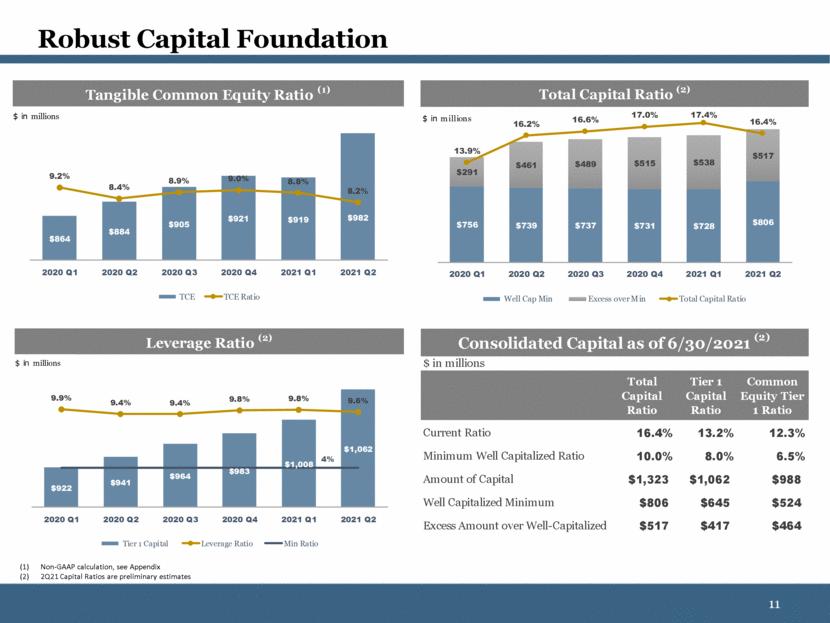
| Robust Capital Foundation Non-GAAP calculation, see Appendix 2Q21 Capital Ratios are preliminary estimates Leverage Ratio (2) $922 $941 $964 $983 $1,008 $1,062 9.9% 9.4% 9.4% 9.8% 9.8% 9.6% 4% 2020 Q1 2020 Q2 2020 Q3 2020 Q4 2021 Q1 2021 Q2 Tier 1 Capital Leverage Ratio Min Ratio $ in millions ($ in millions) Tangible Common Equity Ratio (1) $864 $884 $905 $921 $919 $982 9.2% 8.4% 8.9% 9.0% 8.8% 8.2% 2020 Q1 2020 Q2 2020 Q3 2020 Q4 2021 Q1 2021 Q2 TCE TCE Ratio $ in millions Total Capital Ratio (2) $ in millions $756 $739 $737 $731 $728 $806 $291 $461 $489 $515 $538 $517 13.9% 16.2% 16.6% 17.0% 17.4% 16.4% 2020 Q1 2020 Q2 2020 Q3 2020 Q4 2021 Q1 2021 Q2 Well Cap Min Excess over Min Total Capital Ratio $ in millions $ in millions Current Ratio 16.4% 13.2% 12.3% Minimum Well Capitalized Ratio 10.0% 8.0% 6.5% Amount of Capital $1,323 $1,062 $988 Well Capitalized Minimum $806 $645 $524 Excess Amount over Well-Capitalized Min $517 $417 $464 Total Capital Ratio Tier 1 Capital Ratio Common Equity Tier 1 Ratio Consolidated Capital as of 6/30/2021 (2) |
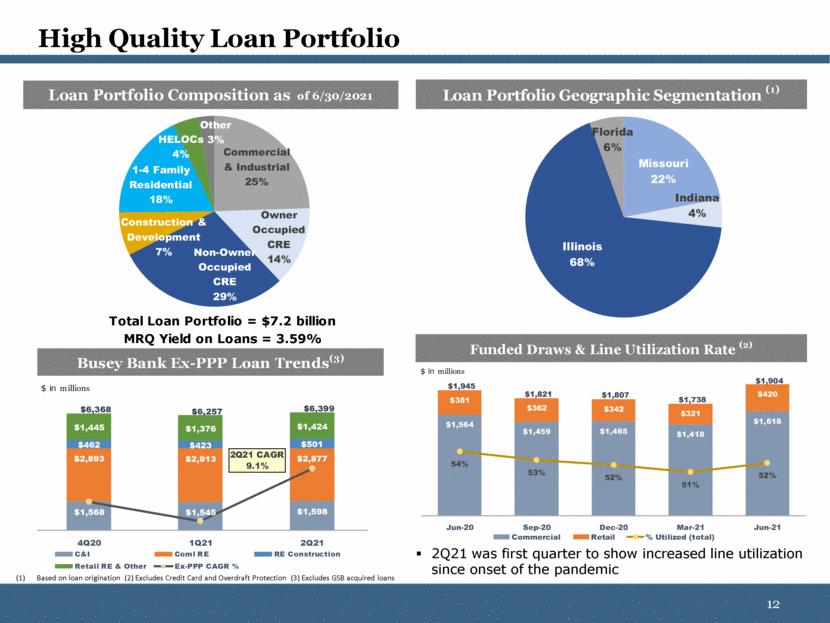
| High Quality Loan Portfolio Based on loan origination (2) Excludes Credit Card and Overdraft Protection (3) Excludes GSB acquired loans 2Q21 was first quarter to show increased line utilization since onset of the pandemic Loan Portfolio Geographic Segmentation (1) Missouri 22% Indiana 4% Illinois 68% Florida 6% MRQ Yield on Loans = 3.59% Total Loan Portfolio = $7.2 billion Loan Portfolio Composition as of 6/30/2021 Commercial & Industrial 25% Owner Occupied CRE 14% Non - Owner Occupied CRE 29% Construction & Development 7% 1 - 4 Family Residential 18% HELOCs 4% Other 3% Funded Draws & Line Utilization Rate (2) $1,564 $1,459 $1,465 $1,418 $1,618 $381 $362 $342 $321 $420 $1,945 $1,821 $1,807 $1,738 $1,904 54% 53% 52% 51% 52% $1 $501 $1,001 $1,501 $2,001 Jun-20 Sep-20 Dec-20 Mar-21 Jun-21 Commercial Retail % Utilized (total) $ in millions Busey Bank Ex-PPP Loan Trends (3) $1,568 $1,545 $1,598 $2,893 $2,913 $2,877 $462 $423 $501 $1,445 $1,376 $1,424 $6,368 $6,257 $6,399 4Q20 1Q21 2Q21 C&I Coml RE RE Construction Retail RE & Other Ex-PPP CAGR % $ in millions 2Q21 CAGR 9.1% |
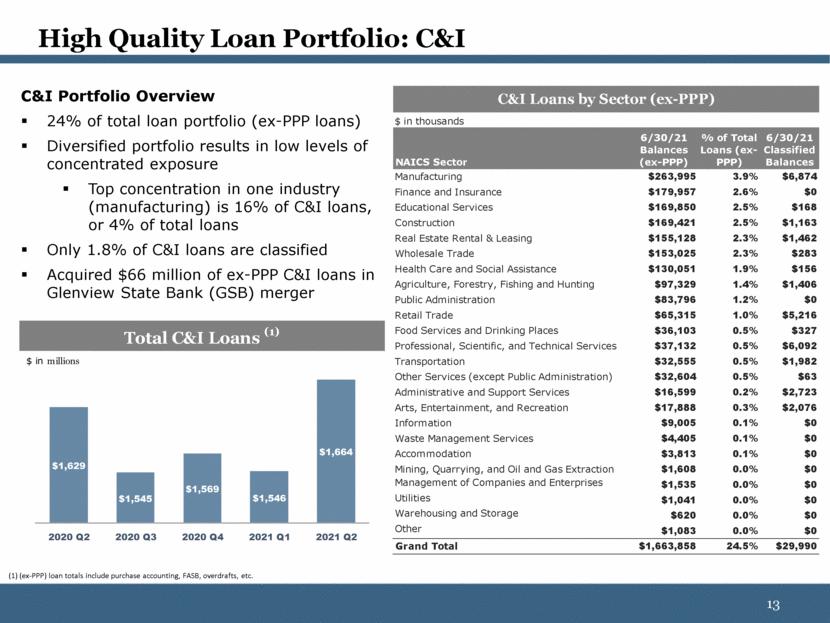
| High Quality Loan Portfolio: C&I C&I Portfolio Overview 24% of total loan portfolio (ex-PPP loans) Diversified portfolio results in low levels of concentrated exposure Top concentration in one industry (manufacturing) is 16% of C&I loans, or 4% of total loans Only 1.8% of C&I loans are classified Acquired $66 million of ex-PPP C&I loans in Glenview State Bank (GSB) merger (1) (ex-PPP) loan totals include purchase accounting, FASB, overdrafts, etc. Total C&I Loans (1) $1,629 $1,545 $1,569 $1,546 $1,664 2020 Q2 2020 Q3 2020 Q4 2021 Q1 2021 Q2 $ in millions $ in thousands NAICS Sector 6/30/21 Balances (ex-PPP) % of Total Loans (ex- PPP) 6/30/21 Classified Balances Manufacturing $263,995 3.9% $6,874 Finance and Insurance $179,957 2.6% $0 Educational Services $169,850 2.5% $168 Construction $169,421 2.5% $1,163 Real Estate Rental & Leasing $155,128 2.3% $1,462 Wholesale Trade $153,025 2.3% $283 Health Care and Social Assistance $130,051 1.9% $156 Agriculture, Forestry, Fishing and Hunting $97,329 1.4% $1,406 Public Administration $83,796 1.2% $0 Retail Trade $65,315 1.0% $5,216 Food Services and Drinking Places $36,103 0.5% $327 Professional, Scientific, and Technical Services $37,132 0.5% $6,092 Transportation $32,555 0.5% $1,982 Other Services (except Public Administration) $32,604 0.5% $63 Administrative and Support Services $16,599 0.2% $2,723 Arts, Entertainment, and Recreation $17,888 0.3% $2,076 Information $9,005 0.1% $0 Waste Management Services $4,405 0.1% $0 Accommodation $3,813 0.1% $0 Mining, Quarrying, and Oil and Gas Extraction $1,608 0.0% $0 Management of Companies and Enterprises $1,535 0.0% $0 Utilities $1,041 0.0% $0 Warehousing and Storage $620 0.0% $0 Other $1,083 0.0% $0 Grand Total $1,663,858 24.5% $29,990 C&I Loans by Sector (ex-PPP) |
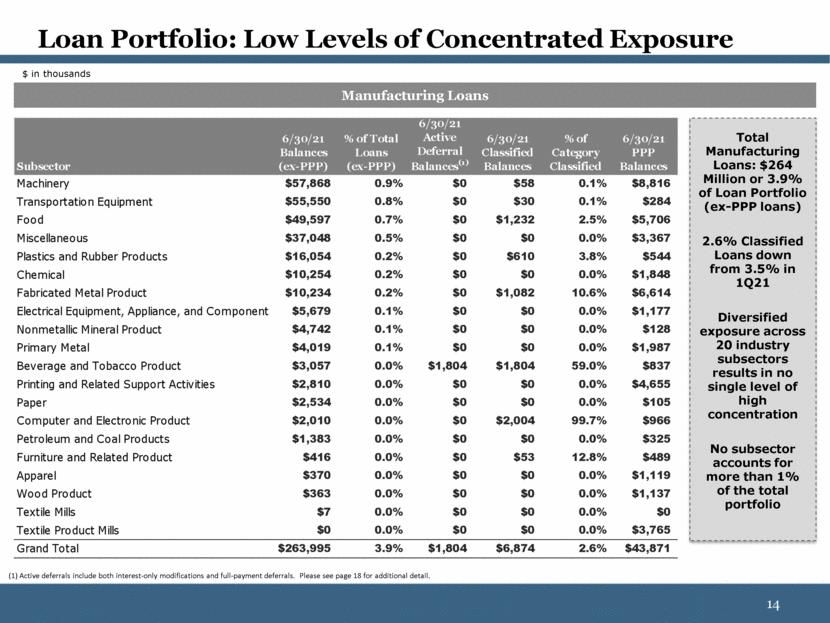
| Loan Portfolio: Low Levels of Concentrated Exposure Manufacturing Loans Total Manufacturing Loans: $264 Million or 3.9% of Loan Portfolio (ex-PPP loans) 2.6% Classified Loans down from 3.5% in 1Q21 Diversified exposure across 20 industry subsectors results in no single level of high concentration No subsector accounts for more than 1% of the total portfolio $ in thousands (1) Active deferrals include both interest-only modifications and full-payment deferrals. Please see page 18 for additional detail. Subsector 6/30/21 Balances (ex-PPP) % of Total Loans (ex-PPP) 6/30/21 Active Deferral Balances (1) 6/30/21 Classified Balances % of Category Classified 6/30/21 PPP Balances Machinery $57,868 0.9% $0 $58 0.1% $8,816 Transportation Equipment $55,550 0.8% $0 $30 0.1% $284 Food $49,597 0.7% $0 $1,232 2.5% $5,706 Miscellaneous $37,048 0.5% $0 $0 0.0% $3,367 Plastics and Rubber Products $16,054 0.2% $0 $610 3.8% $544 Chemical $10,254 0.2% $0 $0 0.0% $1,848 Fabricated Metal Product $10,234 0.2% $0 $1,082 10.6% $6,614 Electrical Equipment, Appliance, and Component $5,679 0.1% $0 $0 0.0% $1,177 Nonmetallic Mineral Product $4,742 0.1% $0 $0 0.0% $128 Primary Metal $4,019 0.1% $0 $0 0.0% $1,987 Beverage and Tobacco Product $3,057 0.0% $1,804 $1,804 59.0% $837 Printing and Related Support Activities $2,810 0.0% $0 $0 0.0% $4,655 Paper $2,534 0.0% $0 $0 0.0% $105 Computer and Electronic Product $2,010 0.0% $0 $2,004 99.7% $966 Petroleum and Coal Products $1,383 0.0% $0 $0 0.0% $325 Furniture and Related Product $416 0.0% $0 $53 12.8% $489 Apparel $370 0.0% $0 $0 0.0% $1,119 Wood Product $363 0.0% $0 $0 0.0% $1,137 Textile Mills $7 0.0% $0 $0 0.0% $0 Textile Product Mills $0 0.0% $0 $0 0.0% $3,765 Grand Total $263,995 3.9% $1,804 $6,874 2.6% $43,871 |
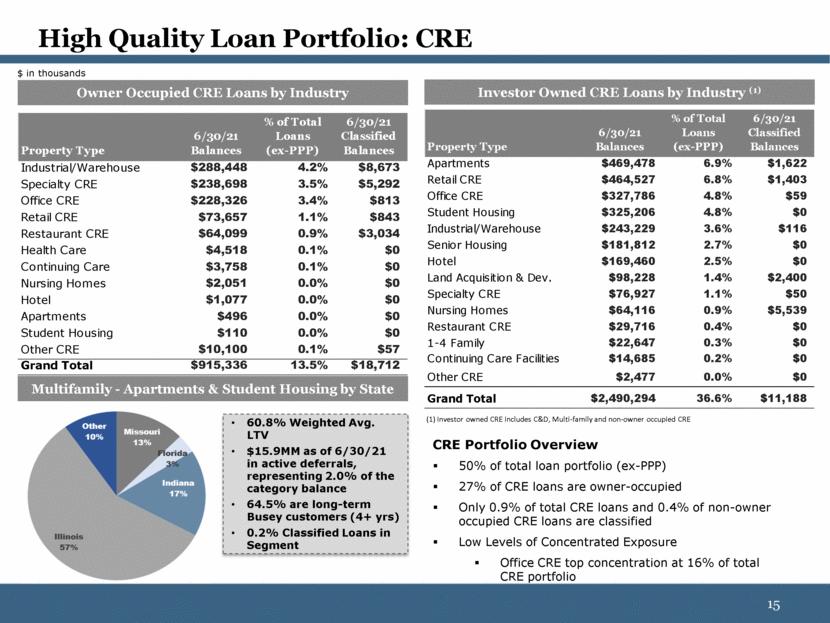
| High Quality Loan Portfolio: CRE CRE Portfolio Overview 50% of total loan portfolio (ex-PPP) 27% of CRE loans are owner-occupied Only 0.9% of total CRE loans and 0.4% of non-owner occupied CRE loans are classified Low Levels of Concentrated Exposure Office CRE top concentration at 16% of total CRE portfolio Investor Owned CRE Loans by Industry (1) Owner Occupied CRE Loans by Industry Multifamily - Apartments & Student Housing by State $ in thousands 60.8% Weighted Avg. LTV $15.9MM as of 6/30/21 in active deferrals, representing 2.0% of the category balance 64.5% are long-term Busey customers (4+ yrs) 0.2% Classified Loans in Segment (1) Investor owned CRE includes C&D, Multi-family and non-owner occupied CRE Property Type 6/30/21 Balances % of Total Loans (ex-PPP) 6/30/21 Classified Balances Industrial/Warehouse $288,448 4.2% $8,673 Specialty CRE $238,698 3.5% $5,292 Office CRE $228,326 3.4% $813 Retail CRE $73,657 1.1% $843 Restaurant CRE $64,099 0.9% $3,034 Health Care $4,518 0.1% $0 Continuing Care $3,758 0.1% $0 Nursing Homes $2,051 0.0% $0 Hotel $1,077 0.0% $0 Apartments $496 0.0% $0 Student Housing $110 0.0% $0 Other CRE $10,100 0.1% $57 Grand Total $915,336 13.5% $18,712 Property Type 6/30/21 Balances % of Total Loans (ex-PPP) 6/30/21 Classified Balances Apartments $469,478 6.9% $1,622 Retail CRE $464,527 6.8% $1,403 Office CRE $327,786 4.8% $59 Student Housing $325,206 4.8% $0 Industrial/Warehouse $243,229 3.6% $116 Senior Housing $181,812 2.7% $0 Hotel $169,460 2.5% $0 Land Acquisition & Dev. $98,228 1.4% $2,400 Specialty CRE $76,927 1.1% $50 Nursing Homes $64,116 0.9% $5,539 Restaurant CRE $29,716 0.4% $0 1-4 Family $22,647 0.3% $0 Continuing Care Facilities $14,685 0.2% $0 Other CRE $2,477 0.0% $0 Grand Total $2,490,294 36.6% $11,188 |
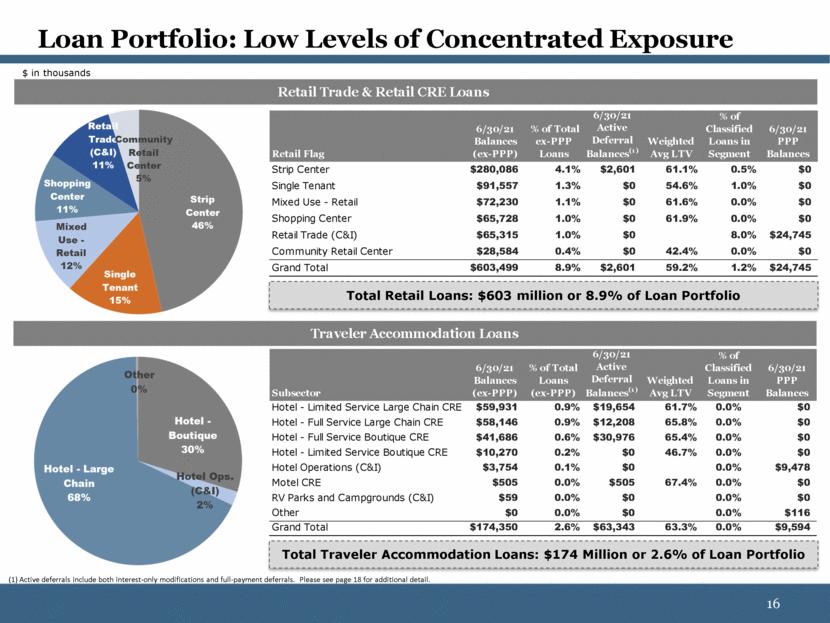
| Loan Portfolio: Low Levels of Concentrated Exposure Total Retail Loans: $603 million or 8.9% of Loan Portfolio Total Traveler Accommodation Loans: $174 Million or 2.6% of Loan Portfolio $ in thousands (1) Active deferrals include both interest-only modifications and full-payment deferrals. Please see page 18 for additional detail. Retail Trade & Retail CRE Loans Traveler Accommodation Loans Retail Flag 6/30/21 Balances (ex-PPP) % of Total ex-PPP Loans 6/30/21 Active Deferral Balances (1) Weighted Avg LTV % of Classified Loans in Segment 6/30/21 PPP Balances Strip Center $280,086 4.1% $2,601 61.1% 0.5% $0 Single Tenant $91,557 1.3% $0 54.6% 1.0% $0 Mixed Use - Retail $72,230 1.1% $0 61.6% 0.0% $0 Shopping Center $65,728 1.0% $0 61.9% 0.0% $0 Retail Trade (C&I) $65,315 1.0% $0 8.0% $24,745 Community Retail Center $28,584 0.4% $0 42.4% 0.0% $0 Grand Total $603,499 8.9% $2,601 59.2% 1.2% $24,745 Subsector 6/30/21 Balances (ex-PPP) % of Total Loans (ex-PPP) 6/30/21 Active Deferral Balances (1) Weighted Avg LTV % of Classified Loans in Segment 6/30/21 PPP Balances Hotel - Limited Service Large Chain CRE $59,931 0.9% $19,654 61.7% 0.0% $0 Hotel - Full Service Large Chain CRE $58,146 0.9% $12,208 65.8% 0.0% $0 Hotel - Full Service Boutique CRE $41,686 0.6% $30,976 65.4% 0.0% $0 Hotel - Limited Service Boutique CRE $10,270 0.2% $0 46.7% 0.0% $0 Hotel Operations (C&I) $3,754 0.1% $0 0.0% $9,478 Motel CRE $505 0.0% $505 67.4% 0.0% $0 RV Parks and Campgrounds (C&I) $59 0.0% $0 0.0% $0 Other $0 0.0% $0 0.0% $116 Grand Total $174,350 2.6% $63,343 63.3% 0.0% $9,594 |
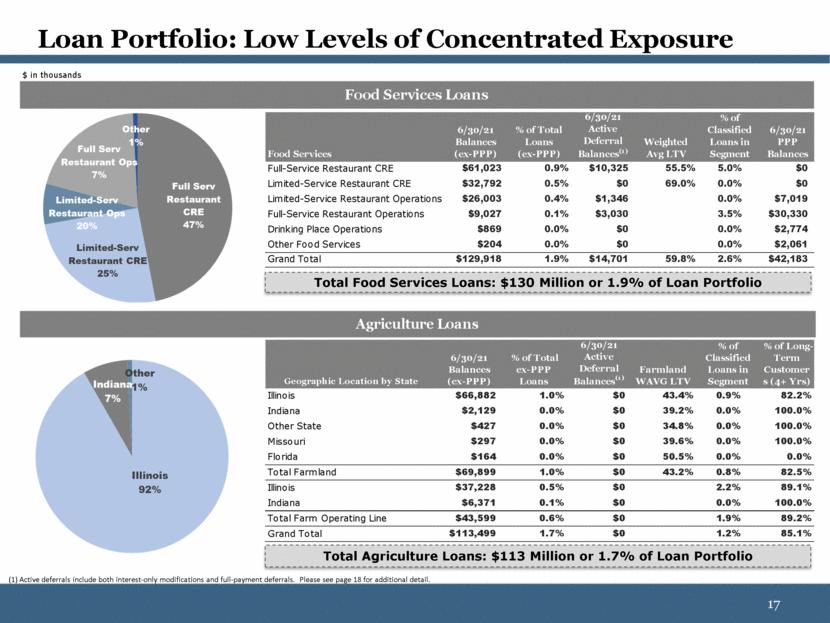
| Loan Portfolio: Low Levels of Concentrated Exposure Total Food Services Loans: $130 Million or 1.9% of Loan Portfolio $ in thousands Total Agriculture Loans: $113 Million or 1.7% of Loan Portfolio (1) Active deferrals include both interest-only modifications and full-payment deferrals. Please see page 18 for additional detail. Agriculture Loans Food Services Loans Food Services 6/30/21 Balances (ex-PPP) % of Total Loans (ex-PPP) 6/30/21 Active Deferral Balances (1) Weighted Avg LTV % of Classified Loans in Segment 6/30/21 PPP Balances Full-Service Restaurant CRE $61,023 0.9% $10,325 55.5% 5.0% $0 Limited-Service Restaurant CRE $32,792 0.5% $0 69.0% 0.0% $0 Limited-Service Restaurant Operations $26,003 0.4% $1,346 0.0% $7,019 Full-Service Restaurant Operations $9,027 0.1% $3,030 3.5% $30,330 Drinking Place Operations $869 0.0% $0 0.0% $2,774 Other Food Services $204 0.0% $0 0.0% $2,061 Grand Total $129,918 1.9% $14,701 59.8% 2.6% $42,183 Geographic Location by State 6/30/21 Balances (ex-PPP) % of Total ex-PPP Loans 6/30/21 Active Deferral Balances (1) Farmland WAVG LTV % of Classified Loans in Segment % of Long- Term Customer s (4+ Yrs) Illinois $66,882 1.0% $0 43.4% 0.9% 82.2% Indiana $2,129 0.0% $0 39.2% 0.0% 100.0% Other State $427 0.0% $0 34.8% 0.0% 100.0% Missouri $297 0.0% $0 39.6% 0.0% 100.0% Florida $164 0.0% $0 50.5% 0.0% 0.0% Total Farmland $69,899 1.0% $0 43.2% 0.8% 82.5% Illinois $37,228 0.5% $0 2.2% 89.1% Indiana $6,371 0.1% $0 0.0% 100.0% Total Farm Operating Line $43,599 0.6% $0 1.9% 89.2% Grand Total $113,499 1.7% $0 1.2% 85.1% |
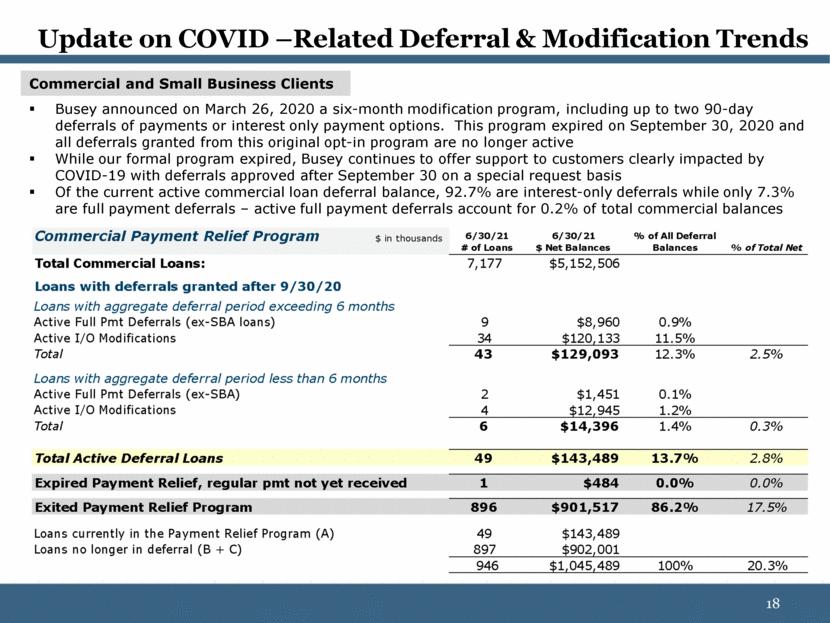
| Update on COVID –Related Deferral & Modification Trends Commercial and Small Business Clients Busey announced on March 26, 2020 a six-month modification program, including up to two 90-day deferrals of payments or interest only payment options. This program expired on September 30, 2020 and all deferrals granted from this original opt-in program are no longer active While our formal program expired, Busey continues to offer support to customers clearly impacted by COVID-19 with deferrals approved after September 30 on a special request basis Of the current active commercial loan deferral balance, 92.7% are interest-only deferrals while only 7.3% are full payment deferrals – active full payment deferrals account for 0.2% of total commercial balances Commercial Payment Relief Program $ in thousands 6/30/21 # of Loans 6/30/21 $ Net Balances % of All Deferral Balances % of Total Net Total Commercial Loans: 7,177 $5,152,506 Loans with deferrals granted after 9/30/20 Loans with aggregate deferral period exceeding 6 months Active Full Pmt Deferrals (ex-SBA loans) 9 $8,960 0.9% Active I/O Modifications 34 $120,133 11.5% Total 43 $129,093 12.3% 2.5% Loans with aggregate deferral period less than 6 months Active Full Pmt Deferrals (ex-SBA) 2 $1,451 0.1% Active I/O Modifications 4 $12,945 1.2% Total 6 $14,396 1.4% 0.3% Total Active Deferral Loans 49 $143,489 13.7% 2.8% Expired Payment Relief, regular pmt not yet received 1 $484 0.0% 0.0% Exited Payment Relief Program 896 $901,517 86.2% 17.5% Loans currently in the Payment Relief Program (A) 49 $143,489 Loans no longer in deferral (B + C) 897 $902,001 946 $1,045,489 100% 20.3% |
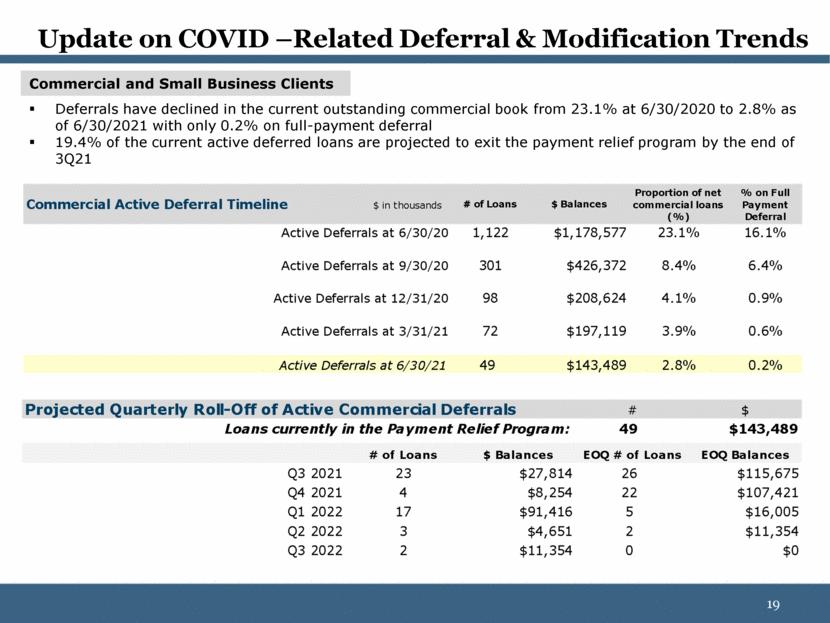
| Update on COVID –Related Deferral & Modification Trends Commercial and Small Business Clients Deferrals have declined in the current outstanding commercial book from 23.1% at 6/30/2020 to 2.8% as of 6/30/2021 with only 0.2% on full-payment deferral 19.4% of the current active deferred loans are projected to exit the payment relief program by the end of 3Q21 Projected Quarterly Roll-Off of Active Commercial Deferrals # $ 49 $143,489 # of Loans $ Balances EOQ # of Loans EOQ Balances Q3 2021 23 $27,814 26 $115,675 Q4 2021 4 $8,254 22 $107,421 Q1 2022 17 $91,416 5 $16,005 Q2 2022 3 $4,651 2 $11,354 Q3 2022 2 $11,354 0 $0 Loans currently in the Payment Relief Program: Commercial Active Deferral Timeline $ in thousands # of Loans $ Balances Proportion of net commercial loans (%) % on Full Payment Deferral Active Deferrals at 6/30/20 1,122 $1,178,577 23.1% 16.1% Active Deferrals at 9/30/20 301 $426,372 8.4% 6.4% Active Deferrals at 12/31/20 98 $208,624 4.1% 0.9% Active Deferrals at 3/31/21 72 $197,119 3.9% 0.6% Active Deferrals at 6/30/21 49 $143,489 2.8% 0.2% |
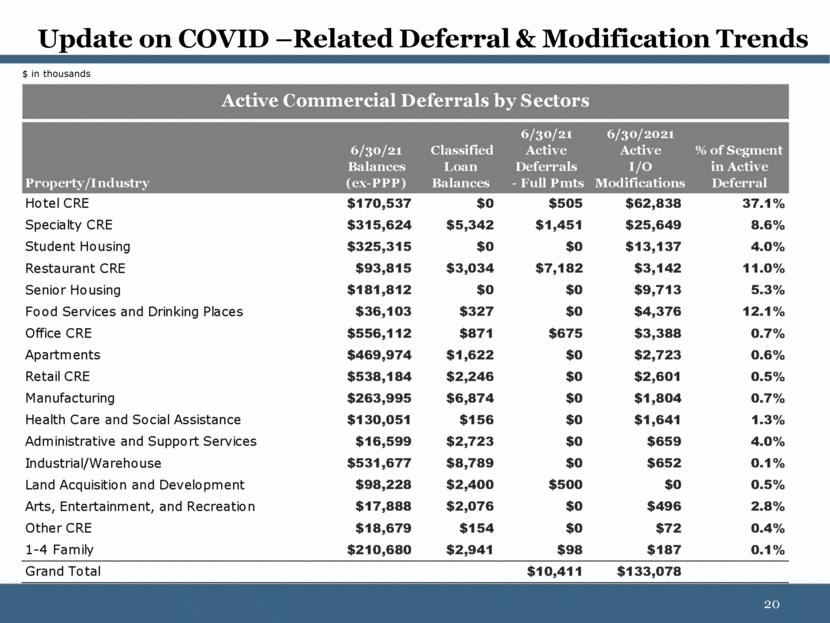
| Update on COVID –Related Deferral & Modification Trends $ in thousands Property/Industry 6/30/21 Balances (ex-PPP) Classified Loan Balances 6/30/21 Active Deferrals - Full Pmts 6/30/2021 Active I/O Modifications % of Segment in Active Deferral Hotel CRE $170,537 $0 $505 $62,838 37.1% Specialty CRE $315,624 $5,342 $1,451 $25,649 8.6% Student Housing $325,315 $0 $0 $13,137 4.0% Restaurant CRE $93,815 $3,034 $7,182 $3,142 11.0% Senior Housing $181,812 $0 $0 $9,713 5.3% Food Services and Drinking Places $36,103 $327 $0 $4,376 12.1% Office CRE $556,112 $871 $675 $3,388 0.7% Apartments $469,974 $1,622 $0 $2,723 0.6% Retail CRE $538,184 $2,246 $0 $2,601 0.5% Manufacturing $263,995 $6,874 $0 $1,804 0.7% Health Care and Social Assistance $130,051 $156 $0 $1,641 1.3% Administrative and Support Services $16,599 $2,723 $0 $659 4.0% Industrial/Warehouse $531,677 $8,789 $0 $652 0.1% Land Acquisition and Development $98,228 $2,400 $500 $0 0.5% Arts, Entertainment, and Recreation $17,888 $2,076 $0 $496 2.8% Other CRE $18,679 $154 $0 $72 0.4% 1-4 Family $210,680 $2,941 $98 $187 0.1% Grand Total $10,411 $133,078 Active Commercial Deferrals by Sectors |
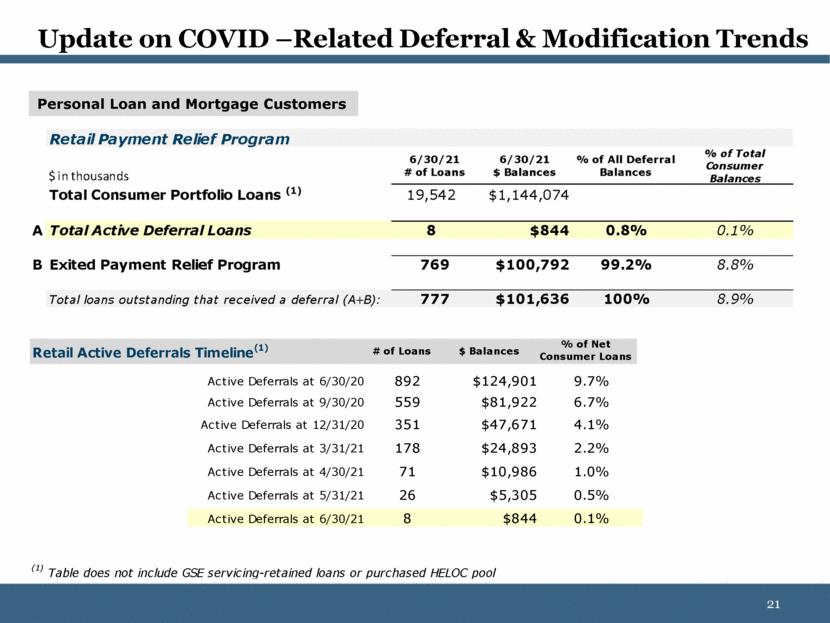
| Update on COVID –Related Deferral & Modification Trends Personal Loan and Mortgage Customers Retail Payment Relief Program $ in thousands 6/30/21 # of Loans 6/30/21 $ Balances % of All Deferral Balances % of Total Consumer Balances Total Consumer Portfolio Loans (1) 19,542 $1,144,074 A Total Active Deferral Loans 8 $844 0.8% 0.1% B Exited Payment Relief Program 769 $100,792 99.2% 8.8% Total loans outstanding that received a deferral (A+B): 777 $101,636 100% 8.9% Retail Active Deferrals Timeline (1) # of Loans $ Balances % of Net Consumer Loans Active Deferrals at 6/30/20 892 $124,901 9.7% Active Deferrals at 9/30/20 559 $81,922 6.7% Active Deferrals at 12/31/20 351 $47,671 4.1% Active Deferrals at 3/31/21 178 $24,893 2.2% Active Deferrals at 4/30/21 71 $10,986 1.0% Active Deferrals at 5/31/21 26 $5,305 0.5% Active Deferrals at 6/30/21 8 $844 0.1% (1) Table does not include GSE servicing-retained loans or purchased HELOC pool |
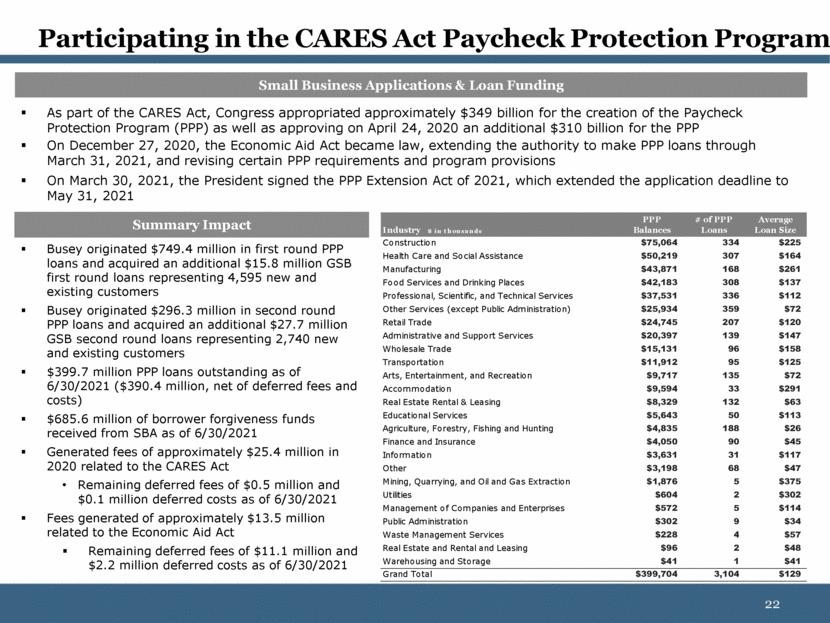
| As part of the CARES Act, Congress appropriated approximately $349 billion for the creation of the Paycheck Protection Program (PPP) as well as approving on April 24, 2020 an additional $310 billion for the PPP On December 27, 2020, the Economic Aid Act became law, extending the authority to make PPP loans through March 31, 2021, and revising certain PPP requirements and program provisions On March 30, 2021, the President signed the PPP Extension Act of 2021, which extended the application deadline to May 31, 2021 Busey originated $749.4 million in first round PPP loans and acquired an additional $15.8 million GSB first round loans representing 4,595 new and existing customers Busey originated $296.3 million in second round PPP loans and acquired an additional $27.7 million GSB second round loans representing 2,740 new and existing customers $399.7 million PPP loans outstanding as of 6/30/2021 ($390.4 million, net of deferred fees and costs) $685.6 million of borrower forgiveness funds received from SBA as of 6/30/2021 Generated fees of approximately $25.4 million in 2020 related to the CARES Act Remaining deferred fees of $0.5 million and $0.1 million deferred costs as of 6/30/2021 Fees generated of approximately $13.5 million related to the Economic Aid Act Remaining deferred fees of $11.1 million and $2.2 million deferred costs as of 6/30/2021 Participating in the CARES Act Paycheck Protection Program Summary Impact Small Business Applications & Loan Funding Industry $ in thousands PPP Balances # of PPP Loans Average Loan Size Construction $75,064 334 $225 Health Care and Social Assistance $50,219 307 $164 Manufacturing $43,871 168 $261 Food Services and Drinking Places $42,183 308 $137 Professional, Scientific, and Technical Services $37,531 336 $112 Other Services (except Public Administration) $25,934 359 $72 Retail Trade $24,745 207 $120 Administrative and Support Services $20,397 139 $147 Wholesale Trade $15,131 96 $158 Transportation $11,912 95 $125 Arts, Entertainment, and Recreation $9,717 135 $72 Accommodation $9,594 33 $291 Real Estate Rental & Leasing $8,329 132 $63 Educational Services $5,643 50 $113 Agriculture, Forestry, Fishing and Hunting $4,835 188 $26 Finance and Insurance $4,050 90 $45 Information $3,631 31 $117 Other $3,198 68 $47 Mining, Quarrying, and Oil and Gas Extraction $1,876 5 $375 Utilities $604 2 $302 Management of Companies and Enterprises $572 5 $114 Public Administration $302 9 $34 Waste Management Services $228 4 $57 Real Estate and Rental and Leasing $96 2 $48 Warehousing and Storage $41 1 $41 Grand Total $399,704 3,104 $129 |
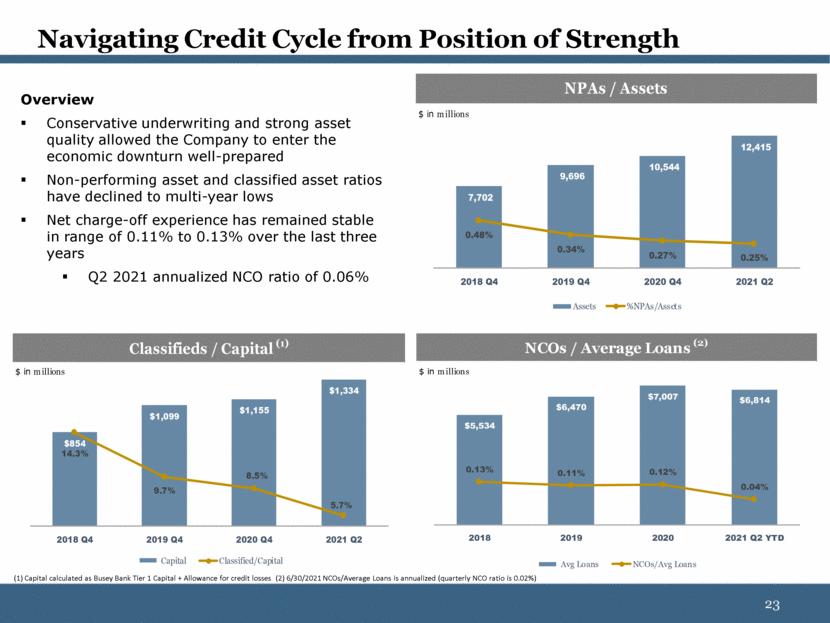
| Navigating Credit Cycle from Position of Strength Overview Conservative underwriting and strong asset quality allowed the Company to enter the economic downturn well-prepared Non-performing asset and classified asset ratios have declined to multi-year lows Net charge-off experience has remained stable in range of 0.11% to 0.13% over the last three years Q2 2021 annualized NCO ratio of 0.06% (1) Capital calculated as Busey Bank Tier 1 Capital + Allowance for credit losses (2) 6/30/2021 NCOs/Average Loans is annualized (quarterly NCO ratio is 0.02%) NPAs / Assets 7,702 9,696 10,544 12,415 0.48% 0.34% 0.27% 0.25% 2018 Q4 2019 Q4 2020 Q4 2021 Q2 Assets %NPAs/Assets $ in millions ($ in millions) NCOs / Average Loans (2) $5,534 $6,470 $7,007 $6,814 0.13% 0.11% 0.12% 0.04% 2018 2019 2020 2021 Q2 YTD Avg Loans NCOs/Avg Loans $ in millions Classifieds / Capital (1) $854 $1,099 $1,155 $1,334 14.3% 9.7% 8.5% 5.7% 2018 Q4 2019 Q4 2020 Q4 2021 Q2 Capital Classified/Capital $ in millions |
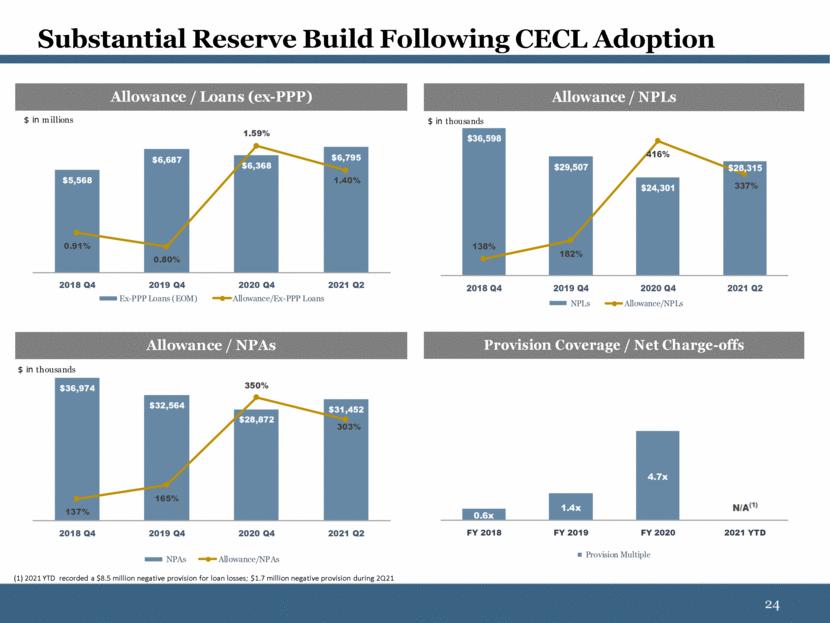
| Substantial Reserve Build Following CECL Adoption (1) 2021 YTD recorded a $8.5 million negative provision for loan losses; $1.7 million negative provision during 2Q21 Allowance / Loans (ex-PPP) $5,568 $6,687 $6,368 $6,795 0.91% 0.80% 1.59% 1.40% 2018 Q4 2019 Q4 2020 Q4 2021 Q2 Ex-PPP Loans (EOM) Allowance/Ex-PPP Loans $ in millions Allowance / NPLs $36,598 $29,507 $24,301 $28,315 138% 182% 416% 337% 2018 Q4 2019 Q4 2020 Q4 2021 Q2 NPLs Allowance/NPLs $ in thousands ($ in millions) Allowance / NPAs $36,974 $32,564 $28,872 $31,452 137% 165% 350% 303% 2018 Q4 2019 Q4 2020 Q4 2021 Q2 NPAs Allowance/NPAs $ in thousands Provision Coverage / Net Charge-offs 0.6x 1.4x 4.7x FY 2018 FY 2019 FY 2020 2021 YTD Provision Multiple |
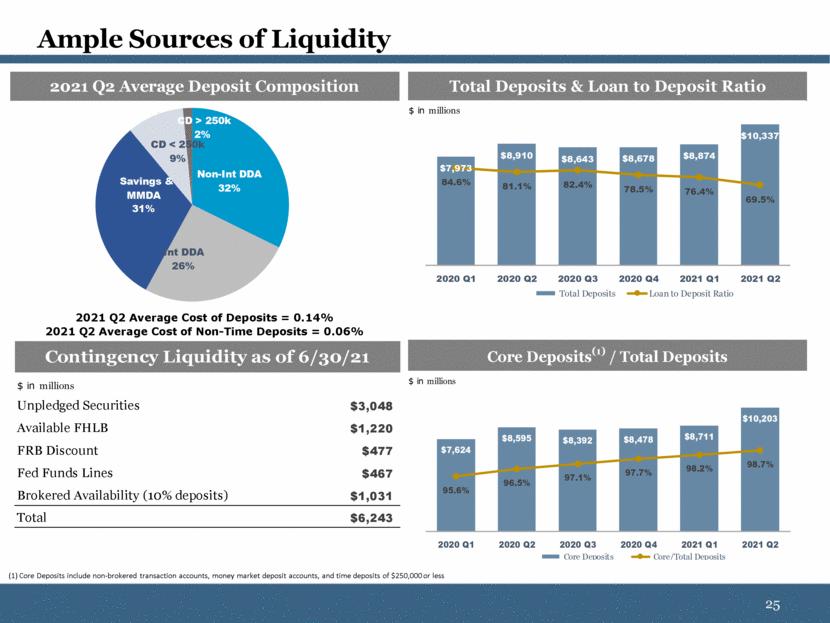
| Ample Sources of Liquidity (1) Core Deposits include non-brokered transaction accounts, money market deposit accounts, and time deposits of $250,000 or less 2021 Q2 Average Cost of Deposits = 0.14% 2021 Q2 Average Cost of Non-Time Deposits = 0.06% 2021 Q2 Average Deposit Composition Non - Int DDA 32% Int DDA 26% Savings & MMDA 31% CD < 250k 9% CD > 250k 2% Total Deposits & Loan to Deposit Ratio $7,973 $8,910 $8,643 $8,678 $8,874 $10,337 84.6% 81.1% 82.4% 78.5% 76.4% 69.5% 2020 Q1 2020 Q2 2020 Q3 2020 Q4 2021 Q1 2021 Q2 Total Deposits Loan to Deposit Ratio $ in millions ($ in millions) Core Deposits (1) / Total Deposits $7,624 $8,595 $8,392 $8,478 $8,711 $10,203 95.6% 96.5% 97.1% 97.7% 98.2% 98.7% 2020 Q1 2020 Q2 2020 Q3 2020 Q4 2021 Q1 2021 Q2 Core Deposits Core/Total Deposits $ in millions Unpledged Securities $3,048 Available FHLB $1,220 FRB Discount $477 Fed Funds Lines $467 Brokered Availability (10% deposits) $1,031 Total $6,243 Contingency Liquidity as of 6/30/21 $ in millions |
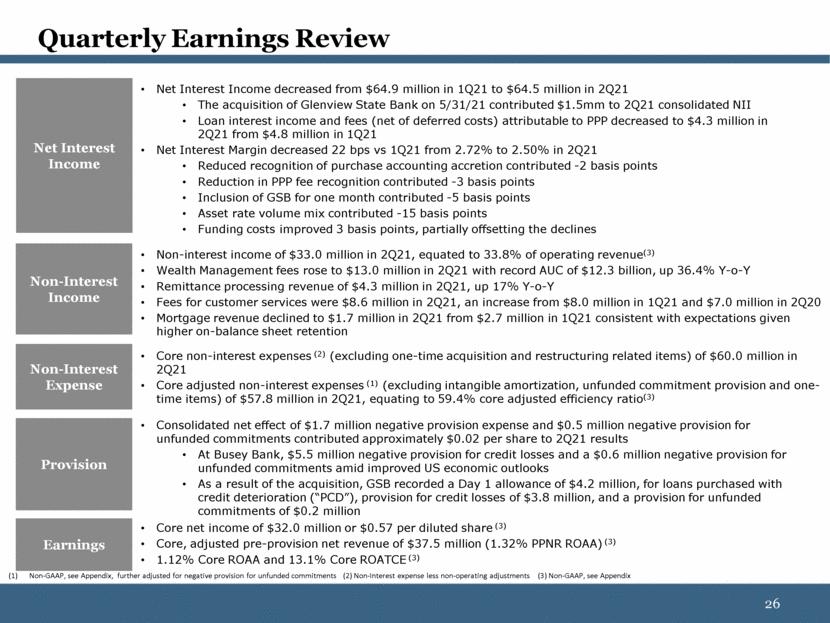
| Net Interest Income decreased from $64.9 million in 1Q21 to $64.5 million in 2Q21 The acquisition of Glenview State Bank on 5/31/21 contributed $1.5mm to 2Q21 consolidated NII Loan interest income and fees (net of deferred costs) attributable to PPP decreased to $4.3 million in 2Q21 from $4.8 million in 1Q21 Net Interest Margin decreased 22 bps vs 1Q21 from 2.72% to 2.50% in 2Q21 Reduced recognition of purchase accounting accretion contributed -2 basis points Reduction in PPP fee recognition contributed -3 basis points Inclusion of GSB for one month contributed -5 basis points Asset rate volume mix contributed -15 basis points Funding costs improved 3 basis points, partially offsetting the declines Non-Interest Expense Non-interest income of $33.0 million in 2Q21, equated to 33.8% of operating revenue(3) Wealth Management fees rose to $13.0 million in 2Q21 with record AUC of $12.3 billion, up 36.4% Y-o-Y Remittance processing revenue of $4.3 million in 2Q21, up 17% Y-o-Y Fees for customer services were $8.6 million in 2Q21, an increase from $8.0 million in 1Q21 and $7.0 million in 2Q20 Mortgage revenue declined to $1.7 million in 2Q21 from $2.7 million in 1Q21 consistent with expectations given higher on-balance sheet retention Core non-interest expenses (2) (excluding one-time acquisition and restructuring related items) of $60.0 million in 2Q21 Core adjusted non-interest expenses (1) (excluding intangible amortization, unfunded commitment provision and one-time items) of $57.8 million in 2Q21, equating to 59.4% core adjusted efficiency ratio(3) Core net income of $32.0 million or $0.57 per diluted share (3) Core, adjusted pre-provision net revenue of $37.5 million (1.32% PPNR ROAA) (3) 1.12% Core ROAA and 13.1% Core ROATCE (3) Earnings Non-Interest Income Net Interest Income Quarterly Earnings Review Provision Consolidated net effect of $1.7 million negative provision expense and $0.5 million negative provision for unfunded commitments contributed approximately $0.02 per share to 2Q21 results At Busey Bank, $5.5 million negative provision for credit losses and a $0.6 million negative provision for unfunded commitments amid improved US economic outlooks As a result of the acquisition, GSB recorded a Day 1 allowance of $4.2 million, for loans purchased with credit deterioration (“PCD”), provision for credit losses of $3.8 million, and a provision for unfunded commitments of $0.2 million Non-GAAP, see Appendix, further adjusted for negative provision for unfunded commitments (2) Non-Interest expense less non-operating adjustments (3) Non-GAAP, see Appendix |
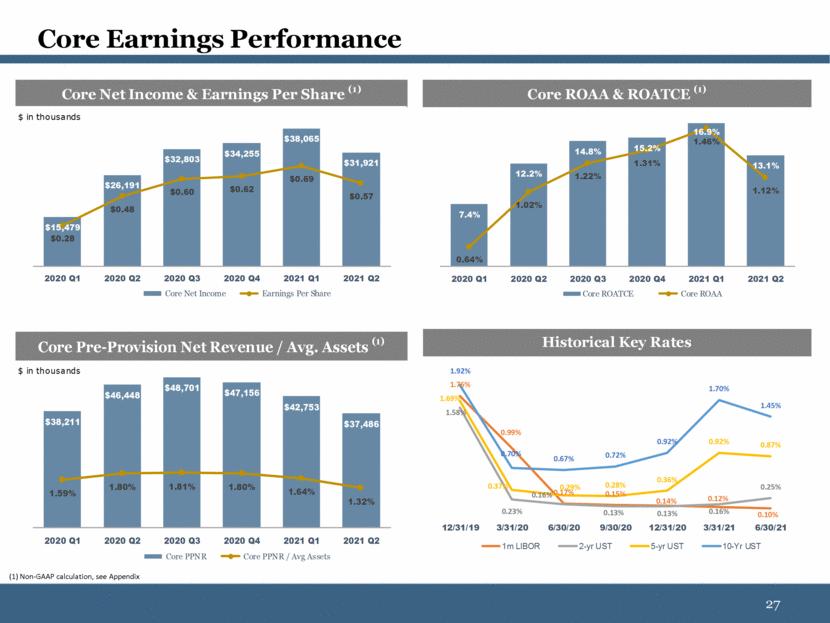
| Core Earnings Performance (1) Non-GAAP calculation, see Appendix Core ROAA & ROATCE (1) 7.4% 12.2% 14.8% 15.2% 16.9% 13.1% 0.64% 1.02% 1.22% 1.31% 1.46% 1.12% 2020 Q1 2020 Q2 2020 Q3 2020 Q4 2021 Q1 2021 Q2 Core ROATCE Core ROAA ($ in millions) Core Net Income & Earnings Per Share (1) $15,479 $26,191 $32,803 $34,255 $38,065 $31,921 $0.28 $0.48 $0.60 $0.62 $0.69 $0.57 2020 Q1 2020 Q2 2020 Q3 2020 Q4 2021 Q1 2021 Q2 Core Net Income Earnings Per Share $ in thousands Historical Key Rates 1.76% 0.99% 0.17% 0.15% 0.14% 0.12% 0.10% 1.58% 0.23% 0.16% 0.13% 0.13% 0.16% 0.25% 1.69% 0.37% 0.29% 0.28% 0.36% 0.92% 0.87% 1.92% 0.70% 0.67% 0.72% 0.92% 1.70% 1.45% 12/31/19 3/31/20 6/30/20 9/30/20 12/31/20 3/31/21 6/30/21 1m LIBOR 2-yr UST 5-yr UST 10-Yr UST ($ in millions) Core Pre-Provision Net Revenue / Avg. Assets (1) $38,211 $46,448 $48,701 $47,156 $42,753 $37,486 1.59% 1.80% 1.81% 1.80% 1.64% 1.32% 2020 Q1 2020 Q2 2020 Q3 2020 Q4 2021 Q1 2021 Q2 Core PPNR Core PPNR / Avg Assets $ in thousands |
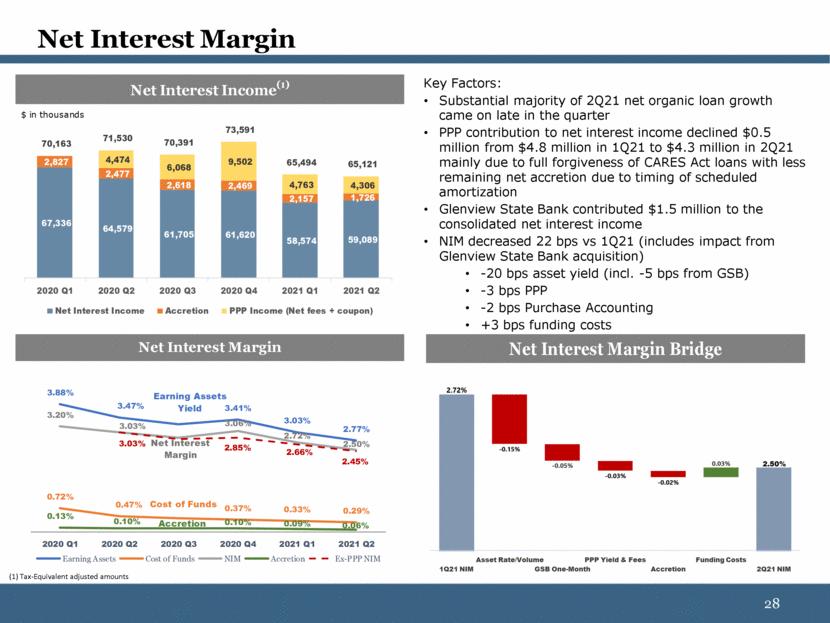
| Net Interest Margin Key Factors: Substantial majority of 2Q21 net organic loan growth came on late in the quarter PPP contribution to net interest income declined $0.5 million from $4.8 million in 1Q21 to $4.3 million in 2Q21 mainly due to full forgiveness of CARES Act loans with less remaining net accretion due to timing of scheduled amortization Glenview State Bank contributed $1.5 million to the consolidated net interest income NIM decreased 22 bps vs 1Q21 (includes impact from Glenview State Bank acquisition) -20 bps asset yield (incl. -5 bps from GSB) -3 bps PPP -2 bps Purchase Accounting +3 bps funding costs (1) Tax-Equivalent adjusted amounts Net Interest Margin 3.88% 3.47% 3.41% 3.03% 2.77% 0.72% 0.47% 0.37% 0.33% 0.29% 3.20% 3.03% 3.06% 2.72% 2.50% 0.13% 0.10% 0.10% 0.09% 0.06% 3.03% 2.85% 2.66% 2.45% 2020 Q1 2020 Q2 2020 Q3 2020 Q4 2021 Q1 2021 Q2 Earning Assets Cost of Funds NIM Accretion Ex-PPP NIM Earning Assets Yield Net Interest Margin Accretion Cost of Funds Net Interest Margin Bridge Net Interest Income (1) 67,336 64,579 61,705 61,620 58,574 59,089 2,827 2,477 2,618 2,469 2,157 1,726 4,474 6,068 9,502 4,763 4,306 70,163 71,530 70,391 73,591 65,494 65,121 2020 Q1 2020 Q2 2020 Q3 2020 Q4 2021 Q1 2021 Q2 Net Interest Income Accretion PPP Income (Net fees + coupon) $ in thousands |
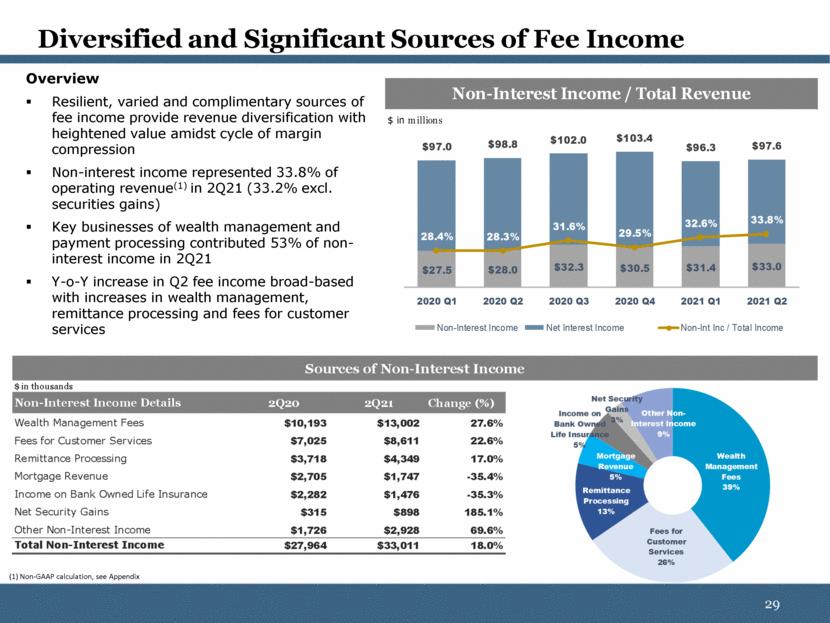
| Overview Resilient, varied and complimentary sources of fee income provide revenue diversification with heightened value amidst cycle of margin compression Non-interest income represented 33.8% of operating revenue(1) in 2Q21 (33.2% excl. securities gains) Key businesses of wealth management and payment processing contributed 53% of non-interest income in 2Q21 Y-o-Y increase in Q2 fee income broad-based with increases in wealth management, remittance processing and fees for customer services Diversified and Significant Sources of Fee Income (1) Non-GAAP calculation, see Appendix Non-Interest Income / Total Revenue $27.5 $28.0 $32.3 $30.5 $31.4 $33.0 $97.0 $98.8 $102.0 $103.4 $96.3 $97.6 28.4% 28.3% 31.6% 29.5% 32.6% 33.8% 2020 Q1 2020 Q2 2020 Q3 2020 Q4 2021 Q1 2021 Q2 Non-Interest Income Net Interest Income Non-Int Inc / Total Income $ in millions $ in thousands 2Q20 2Q21 Change (%) Wealth Management Fees $10,193 $13,002 27.6% Fees for Customer Services $7,025 $8,611 22.6% Remittance Processing $3,718 $4,349 17.0% Mortgage Revenue $2,705 $1,747 -35.4% Income on Bank Owned Life Insurance $2,282 $1,476 -35.3% Net Security Gains $315 $898 185.1% Other Non-Interest Income $1,726 $2,928 69.6% Total Non-Interest Income $27,964 $33,011 18.0% Non-Interest Income Details Sources of Non-Interest Income Wealth Management Fees 39% Fees for Customer Services 26% Remittance Processing 13% Mortgage Revenue 5% Income on Bank Owned Life Insurance 5% Net Security Gains 3% Other Non - Interest Income 9% |
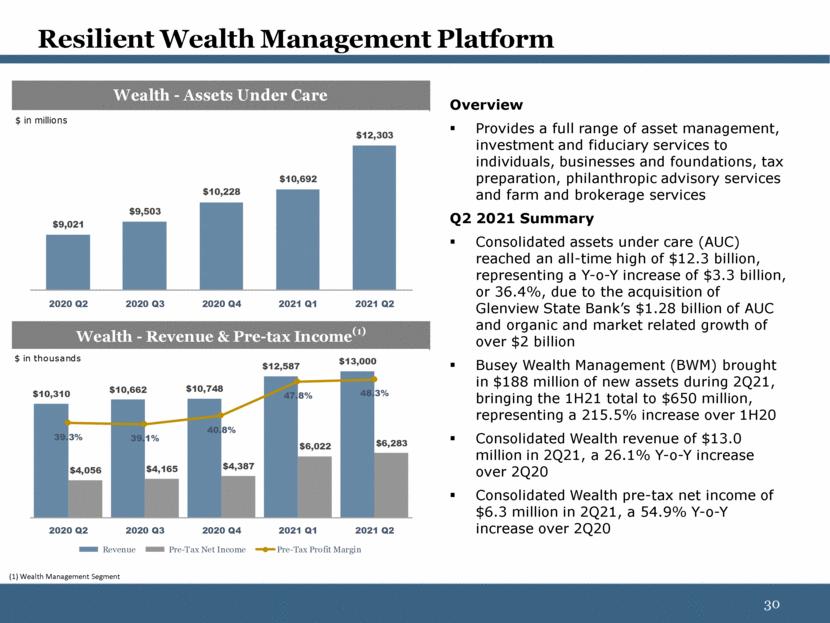
| Resilient Wealth Management Platform Overview Provides a full range of asset management, investment and fiduciary services to individuals, businesses and foundations, tax preparation, philanthropic advisory services and farm and brokerage services Q2 2021 Summary Consolidated assets under care (AUC) reached an all-time high of $12.3 billion, representing a Y-o-Y increase of $3.3 billion, or 36.4%, due to the acquisition of Glenview State Bank’s $1.28 billion of AUC and organic and market related growth of over $2 billion Busey Wealth Management (BWM) brought in $188 million of new assets during 2Q21, bringing the 1H21 total to $650 million, representing a 215.5% increase over 1H20 Consolidated Wealth revenue of $13.0 million in 2Q21, a 26.1% Y-o-Y increase over 2Q20 Consolidated Wealth pre-tax net income of $6.3 million in 2Q21, a 54.9% Y-o-Y increase over 2Q20 (1) Wealth Management Segment ($ in millions) Wealth - Assets Under Care $9,021 $9,503 $10,228 $10,692 $12,303 2020 Q2 2020 Q3 2020 Q4 2021 Q1 2021 Q2 $ in millions ($ in millions) Wealth - Revenue & Pre-tax Income (1) $10,310 $10,662 $10,748 $12,587 $13,000 $4,056 $4,165 $4,387 $6,022 $6,283 39.3% 39.1% 40.8% 47.8% 48.3% 2020 Q2 2020 Q3 2020 Q4 2021 Q1 2021 Q2 Revenue Pre-Tax Net Income Pre-Tax Profit Margin $ in thousands |
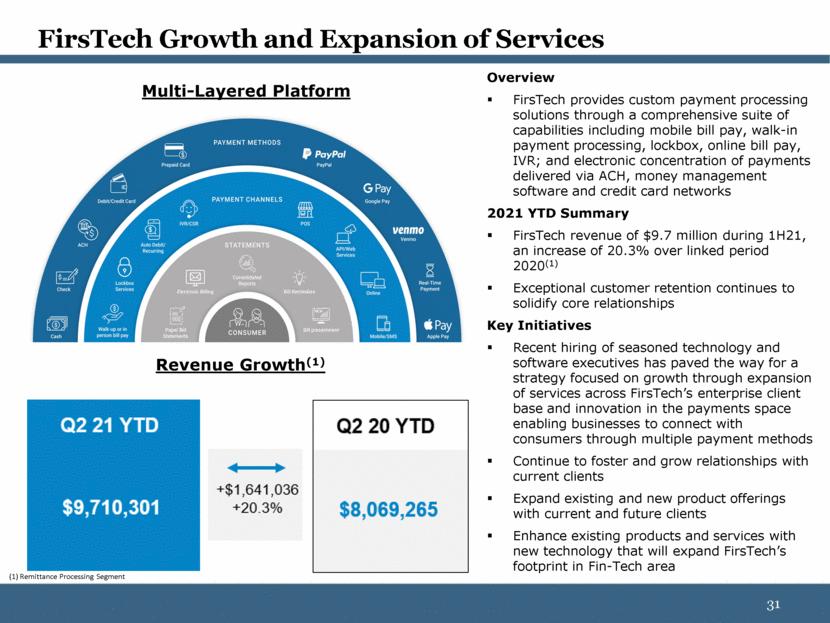
| FirsTech Growth and Expansion of Services Overview FirsTech provides custom payment processing solutions through a comprehensive suite of capabilities including mobile bill pay, walk-in payment processing, lockbox, online bill pay, IVR; and electronic concentration of payments delivered via ACH, money management software and credit card networks 2021 YTD Summary FirsTech revenue of $9.7 million during 1H21, an increase of 20.3% over linked period 2020(1) Exceptional customer retention continues to solidify core relationships Key Initiatives Recent hiring of seasoned technology and software executives has paved the way for a strategy focused on growth through expansion of services across FirsTech’s enterprise client base and innovation in the payments space enabling businesses to connect with consumers through multiple payment methods Continue to foster and grow relationships with current clients Expand existing and new product offerings with current and future clients Enhance existing products and services with new technology that will expand FirsTech’s footprint in Fin-Tech area Revenue Growth(1) Multi-Layered Platform (1) Remittance Processing Segment |
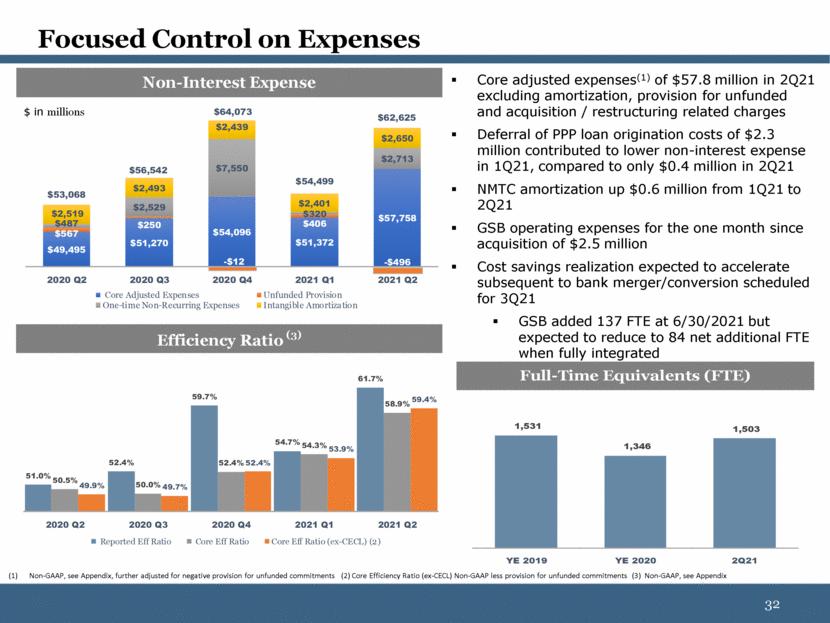
| Focused Control on Expenses Non-GAAP, see Appendix, further adjusted for negative provision for unfunded commitments (2) Core Efficiency Ratio (ex-CECL) Non-GAAP less provision for unfunded commitments (3) Non-GAAP, see Appendix Core adjusted expenses(1) of $57.8 million in 2Q21 excluding amortization, provision for unfunded and acquisition / restructuring related charges Deferral of PPP loan origination costs of $2.3 million contributed to lower non-interest expense in 1Q21, compared to only $0.4 million in 2Q21 NMTC amortization up $0.6 million from 1Q21 to 2Q21 GSB operating expenses for the one month since acquisition of $2.5 million Cost savings realization expected to accelerate subsequent to bank merger/conversion scheduled for 3Q21 GSB added 137 FTE at 6/30/2021 but expected to reduce to 84 net additional FTE when fully integrated $ in millions ($ in millions) Non-Interest Expense $49,495 $51,270 $54,096 $51,372 $57,758 $567 $250 $406 $487 $2,529 $7,550 $320 $2,713 $2,519 $2,493 $2,439 $2,401 $2,650 $53,068 $56,542 $64,073 $54,499 $62,625 2020 Q2 2020 Q3 2020 Q4 2021 Q1 2021 Q2 Core Adjusted Expenses Unfunded Provision One-time Non-Recurring Expenses Intangible Amortization - $12 - $496 ($ in millions) Full-Time Equivalents (FTE) 1,531 1,346 1,503 YE 2019 YE 2020 2Q21 ($ in millions) Efficiency Ratio (3) 51.0% 52.4% 59.7% 54.7% 61.7% 50.5% 50.0% 52.4% 54.3% 58.9% 49.9% 49.7% 52.4% 53.9% 59.4% 2020 Q2 2020 Q3 2020 Q4 2021 Q1 2021 Q2 Reported Eff Ratio Core Eff Ratio Core Eff Ratio (ex-CECL) (2) |
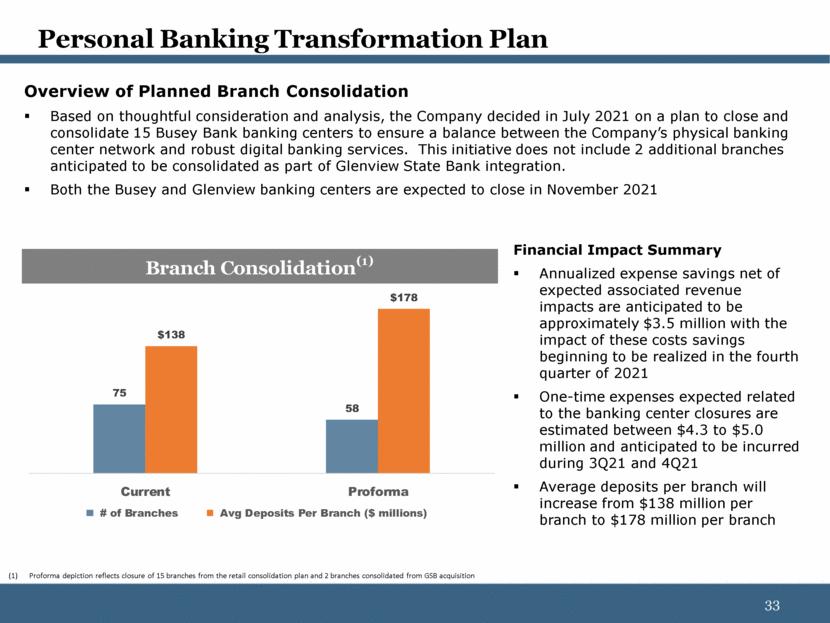
| Personal Banking Transformation Plan Financial Impact Summary Annualized expense savings net of expected associated revenue impacts are anticipated to be approximately $3.5 million with the impact of these costs savings beginning to be realized in the fourth quarter of 2021 One-time expenses expected related to the banking center closures are estimated between $4.3 to $5.0 million and anticipated to be incurred during 3Q21 and 4Q21 Average deposits per branch will increase from $138 million per branch to $178 million per branch Overview of Planned Branch Consolidation Based on thoughtful consideration and analysis, the Company decided in July 2021 on a plan to close and consolidate 15 Busey Bank banking centers to ensure a balance between the Company’s physical banking center network and robust digital banking services. This initiative does not include 2 additional branches anticipated to be consolidated as part of Glenview State Bank integration. Both the Busey and Glenview banking centers are expected to close in November 2021 Proforma depiction reflects closure of 15 branches from the retail consolidation plan and 2 branches consolidated from GSB acquisition ($ in millions) Branch Consolidation (1) 75 58 $138 $178 Current Proforma # of Branches Avg Deposits Per Branch ($ millions) |
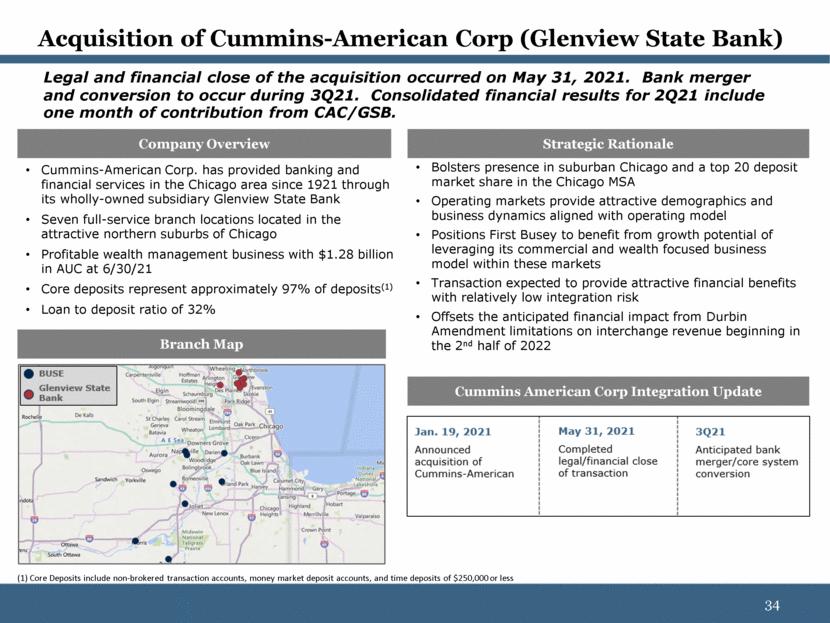
| Company Overview Acquisition of Cummins-American Corp (Glenview State Bank) Cummins-American Corp. has provided banking and financial services in the Chicago area since 1921 through its wholly-owned subsidiary Glenview State Bank Seven full-service branch locations located in the attractive northern suburbs of Chicago Profitable wealth management business with $1.28 billion in AUC at 6/30/21 Core deposits represent approximately 97% of deposits(1) Loan to deposit ratio of 32% Strategic Rationale Branch Map Bolsters presence in suburban Chicago and a top 20 deposit market share in the Chicago MSA Operating markets provide attractive demographics and business dynamics aligned with operating model Positions First Busey to benefit from growth potential of leveraging its commercial and wealth focused business model within these markets Transaction expected to provide attractive financial benefits with relatively low integration risk Offsets the anticipated financial impact from Durbin Amendment limitations on interchange revenue beginning in the 2nd half of 2022 Cummins American Corp Integration Update (1) Core Deposits include non-brokered transaction accounts, money market deposit accounts, and time deposits of $250,000 or less Legal and financial close of the acquisition occurred on May 31, 2021. Bank merger and conversion to occur during 3Q21. Consolidated financial results for 2Q21 include one month of contribution from CAC/GSB. |
| APPENDIX 35 |
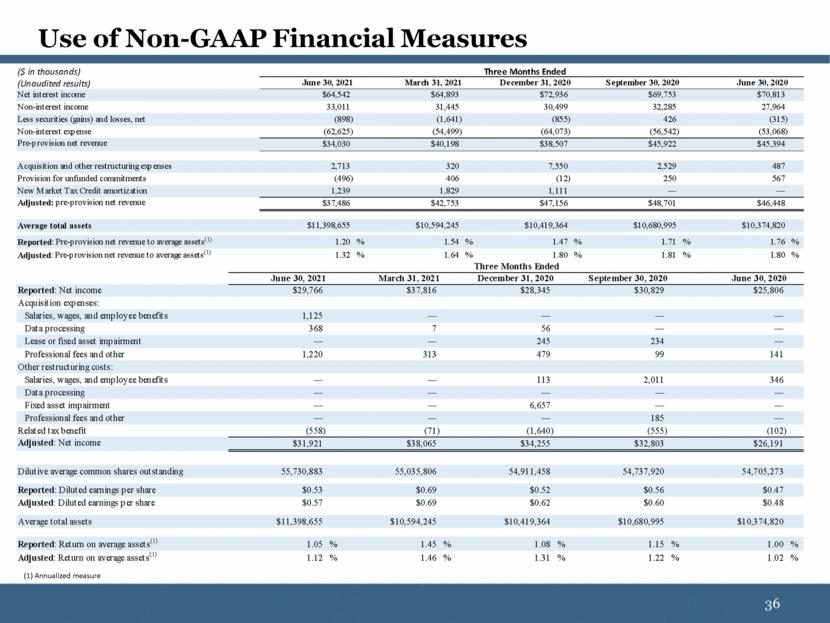
| Use of Non-GAAP Financial Measures (1) Annualized measure June 30, 2021 March 31, 2021 December 31, 2020 September 30, 2020 June 30, 2020 Reported : Net income $29,766 $37,816 $28,345 $30,829 $25,806 Acquisition expenses: Salaries, wages, and employee benefits 1,125 — — — — Data processing 368 7 56 — — Lease or fixed asset impairment — — 245 234 — Professional fees and other 1,220 313 479 99 141 Other restructuring costs: Salaries, wages, and employee benefits — — 113 2,011 346 Data processing — — — — — Fixed asset impairment — — 6,657 — — Professional fees and other — — — 185 — Related tax benefit (558) (71) (1,640) (555) (102) Adjusted : Net income $31,921 $38,065 $34,255 $32,803 $26,191 Dilutive average common shares outstanding 55,730,883 55,035,806 54,911,458 54,737,920 54,705,273 Reported : Diluted earnings per share $0.53 $0.69 $0.52 $0.56 $0.47 Adjusted : Diluted earnings per share $0.57 $0.69 $0.62 $0.60 $0.48 Average total assets $11,398,655 $10,594,245 $10,419,364 $10,680,995 $10,374,820 Reported : Return on average assets (1) 1.05 % 1.45 % 1.08 % 1.15 % 1.00 % Adjusted : Return on average assets (1) 1.12 % 1.46 % 1.31 % 1.22 % 1.02 % Three Months Ended ($ in thousands) (Unaudited results) June 30, 2021 March 31, 2021 December 31, 2020 September 30, 2020 June 30, 2020 Net interest income $64,542 $64,893 $72,936 $69,753 $70,813 Non-interest income 33,011 31,445 30,499 32,285 27,964 Less securities (gains) and losses, net (898) (1,641) (855) 426 (315) Non-interest expense (62,625) (54,499) (64,073) (56,542) (53,068) Pre-provision net revenue $34,030 $40,198 $38,507 $45,922 $45,394 Acquisition and other restructuring expenses 2,713 320 7,550 2,529 487 Provision for unfunded commitments (496) 406 (12) 250 567 New Market Tax Credit amortization 1,239 1,829 1,111 — — Adjusted: pre-provision net revenue $37,486 $42,753 $47,156 $48,701 $46,448 Average total assets $11,398,655 $10,594,245 $10,419,364 $10,680,995 $10,374,820 Reported : Pre-provision net revenue to average assets (1) 1.20 % 1.54 % 1.47 % 1.71 % 1.76 % Adjusted : Pre-provision net revenue to average assets (1) 1.32 % 1.64 % 1.80 % 1.81 % 1.80 % Three Months Ended |
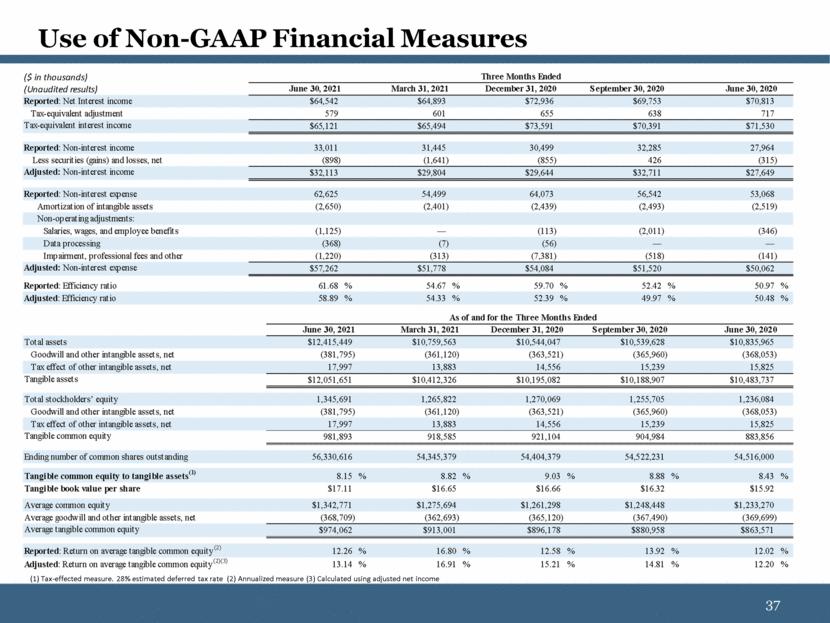
| Use of Non-GAAP Financial Measures (1) Tax-effected measure. 28% estimated deferred tax rate (2) Annualized measure (3) Calculated using adjusted net income ($ in thousands) (Unaudited results) June 30, 2021 March 31, 2021 December 31, 2020 September 30, 2020 June 30, 2020 Reported : Net Interest income $64,542 $64,893 $72,936 $69,753 $70,813 Tax-equivalent adjustment 579 601 655 638 717 Tax-equivalent interest income $65,121 $65,494 $73,591 $70,391 $71,530 Reported : Non-interest income 33,011 31,445 30,499 32,285 27,964 Less securities (gains) and losses, net (898) (1,641) (855) 426 (315) Adjusted: Non-interest income $32,113 $29,804 $29,644 $32,711 $27,649 Reported : Non-interest expense 62,625 54,499 64,073 56,542 53,068 Amortization of intangible assets (2,650) (2,401) (2,439) (2,493) (2,519) Non-operating adjustments: Salaries, wages, and employee benefits (1,125) — (113) (2,011) (346) Data processing (368) (7) (56) — — Impairment, professional fees and other (1,220) (313) (7,381) (518) (141) Adjusted: Non-interest expense $57,262 $51,778 $54,084 $51,520 $50,062 Reported : Efficiency ratio 61.68 % 54.67 % 59.70 % 52.42 % 50.97 % Adjusted : Efficiency ratio 58.89 % 54.33 % 52.39 % 49.97 % 50.48 % Three Months Ended June 30, 2021 March 31, 2021 December 31, 2020 September 30, 2020 June 30, 2020 Total assets $12,415,449 $10,759,563 $10,544,047 $10,539,628 $10,835,965 Goodwill and other intangible assets, net (381,795) (361,120) (363,521) (365,960) (368,053) Tax effect of other intangible assets, net 17,997 13,883 14,556 15,239 15,825 Tangible assets $12,051,651 $10,412,326 $10,195,082 $10,188,907 $10,483,737 Total stockholders’ equity 1,345,691 1,265,822 1,270,069 1,255,705 1,236,084 Goodwill and other intangible assets, net (381,795) (361,120) (363,521) (365,960) (368,053) Tax effect of other intangible assets, net 17,997 13,883 14,556 15,239 15,825 Tangible common equity 981,893 918,585 921,104 904,984 883,856 Ending number of common shares outstanding 56,330,616 54,345,379 54,404,379 54,522,231 54,516,000 Tangible common equity to tangible assets (1) 8.15 % 8.82 % 9.03 % 8.88 % 8.43 % Tangible book value per share $17.11 $16.65 $16.66 $16.32 $15.92 Average common equity $1,342,771 $1,275,694 $1,261,298 $1,248,448 $1,233,270 Average goodwill and other intangible assets, net (368,709) (362,693) (365,120) (367,490) (369,699) Average tangible common equity $974,062 $913,001 $896,178 $880,958 $863,571 Reported : Return on average tangible common equity (2) 12.26 % 16.80 % 12.58 % 13.92 % 12.02 % Adjusted : Return on average tangible common equity (2)(3) 13.14 % 16.91 % 15.21 % 14.81 % 12.20 % As of and for the Three Months Ended |