Attached files
| file | filename |
|---|---|
| 8-K - 8-K - Hilltop Holdings Inc. | hth-20210722x8k.htm |
Exhibit 99.1
| Hilltop Holdings Inc. Earnings Presentation Q2 2021 July 23, 2021 |
| Preface 2 Additional Information Corporate Headquarters 6565 Hillcrest Ave Dallas, TX 75205 Phone: 214-855-2177 www.hilltop-holdings.com Please Contact: Erik Yohe Phone: 214-525-4634 Email: eyohe@hilltop-holdings.com FORWARD-LOOKING STATEMENTS This presentation and statements made by representatives of Hilltop Holdings Inc. (“Hilltop” or the “Company”) during the course of this presentation include “forward- looking statements” within the meaning of the Private Securities Litigation Reform Act of 1995. These forward-looking statements involve known and unknown risks, uncertainties and other factors that may cause our actual results, performance or achievements to be materially different from any future results, performance or achievements anticipated in such statements. Forward-looking statements speak only as of the date they are made and, except as required by law, we do not assume any duty to update forward-looking statements. Such forward-looking statements include, but are not limited to, statements concerning such things as our outlook, our business strategy, our financial condition, our efforts to make strategic acquisitions, our revenue, our liquidity and sources of funding, market trends, operations and business, taxes, the impact of natural disasters or public health emergencies, such as the current coronavirus (“COVID-19”) global pandemic, information technology expenses, capital levels, mortgage servicing rights (“MSR”) assets, stock repurchases, dividend payments, expectations concerning mortgage loan origination volume, servicer advances and interest rate compression, expected levels of refinancing as a percentage of total loan origination volume, projected losses on mortgage loans originated, total expenses, anticipated changes in our revenue, earnings, or taxes, the effects of government regulation applicable to our operations, the appropriateness of, and changes in, our allowance for credit losses and provision for (reversal of) credit losses, future benchmark rates and economic growth, anticipated investment yields, expected accretion of discount on loans in future periods, the collectability of loans, cybersecurity incidents, cost savings expected from initiatives implemented and planned, including core system upgrades and cost reduction efforts, the outcome of litigation, and our other plans, objectives, strategies, expectations and intentions and other statements that are not statements of historical fact, and may be identified by words such as “anticipates,” “believes,” “building”, “could,” “estimates,” “expects,” “forecasts,” “goal,” “guidance”, “intends,” “may,” “might,” “outlook”, “plan,” “probable,” “projects,” “seeks,” “should,” “target,” “view” or “would” or the negative of these words and phrases or similar words or phrases. The following factors, among others, could cause actual results to differ from those set forth in the forward-looking statements: (i) the COVID-19 pandemic and the response of governmental authorities to the pandemic, which have had and may continue to have an adverse impact to the global economy and our business operations and performance; (ii) the credit risks of lending activities, including our ability to estimate credit losses and increases to the allowance for credit losses; (iii) the effects of changes in the level of, and trends in, loan delinquencies and write-offs; (iv) effectiveness of our data security controls in the face of cyber attacks; (v) changes in general economic, market and business conditions in areas or markets where we compete, including changes in the price of crude oil; (vi) risks associated with concentration in real estate related loans; (vii) changes in the interest rate environment and transitions away from LIBOR; (viii) the effects of our indebtedness on our ability to manage our business successfully, including the restrictions imposed by the indenture governing our indebtedness; (ix) changes in state and federal laws, regulations or policies affecting one or more of our business segments, including changes in regulatory fees, deposit insurance premiums, capital requirements and the Dodd-Frank Wall Street Reform and Consumer Protection Act; (x) cost and availability of capital; (xi) changes in key management; (xii) competition in our banking, broker-dealer and mortgage origination segments from other banks and financial institutions, as well as investment banking and financial advisory firms, mortgage bankers, asset-based non-bank lenders and government agencies; (xiii) legal and regulatory proceedings; (xiv) risks associated with merger and acquisition integration; and (xv) our ability to use excess capital in an effective manner. For further discussion of such factors, see the risk factors described in our most recent Annual Report on Form 10-K, and subsequent Quarterly Reports on Form 10-Q and other reports, that we have filed with the Securities and Exchange Commission. All forward-looking statements are qualified in their entirety by this cautionary statement. The information contained herein is preliminary and based on Company data available at the time of the earnings presentation. It speaks only as of the particular date or dates included in the accompanying slides. Hilltop Holdings does not undertake an obligation to, and disclaims any duty to, update any of the information herein. |
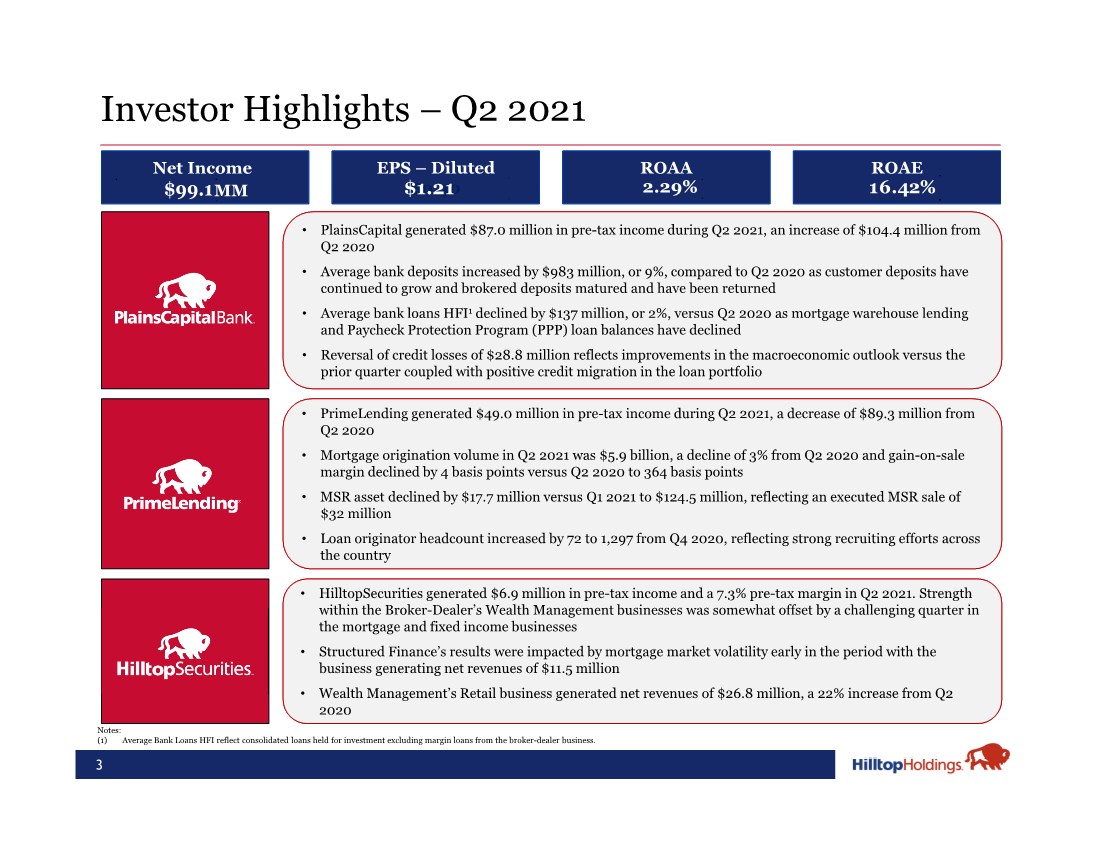
| Q2 2021 3 Investor Highlights – Notes: (1) Average Bank Loans HFI reflect consolidated loans held for investment excluding margin loans from the broker-dealer business. • PlainsCapital generated $87.0 million in pre-tax income during Q2 2021, an increase of $104.4 million from Q2 2020 • Average bank deposits increased by $983 million, or 9%, compared to Q2 2020 as customer deposits have continued to grow and brokered deposits matured and have been returned • Average bank loans HFI1 declined by $137 million, or 2%, versus Q2 2020 as mortgage warehouse lending and Paycheck Protection Program (PPP) loan balances have declined • Reversal of credit losses of $28.8 million reflects improvements in the macroeconomic outlook versus the prior quarter coupled with positive credit migration in the loan portfolio • PrimeLending generated $49.0 million in pre-tax income during Q2 2021, a decrease of $89.3 million from Q2 2020 • Mortgage origination volume in Q2 2021 was $5.9 billion, a decline of 3% from Q2 2020 and gain-on-sale margin declined by 4 basis points versus Q2 2020 to 364 basis points • MSR asset declined by $17.7 million versus Q1 2021 to $124.5 million, reflecting an executed MSR sale of $32 million • Loan originator headcount increased by 72 to 1,297 from Q4 2020, reflecting strong recruiting efforts across the country • HilltopSecurities generated $6.9 million in pre-tax income and a 7.3% pre-tax margin in Q2 2021. Strength within the Broker-Dealer’s Wealth Management businesses was somewhat offset by a challenging quarter in the mortgage and fixed income businesses • Structured Finance’s results were impacted by mortgage market volatility early in the period with the business generating net revenues of $11.5 million • Wealth Management’s Retail business generated net revenues of $26.8 million, a 22% increase from Q2 2020 ROAA .86% EPS – Diluted $0.30 ROAE 5.76% 16.42% $99.1 $1.21 2.29% Net Income MM |
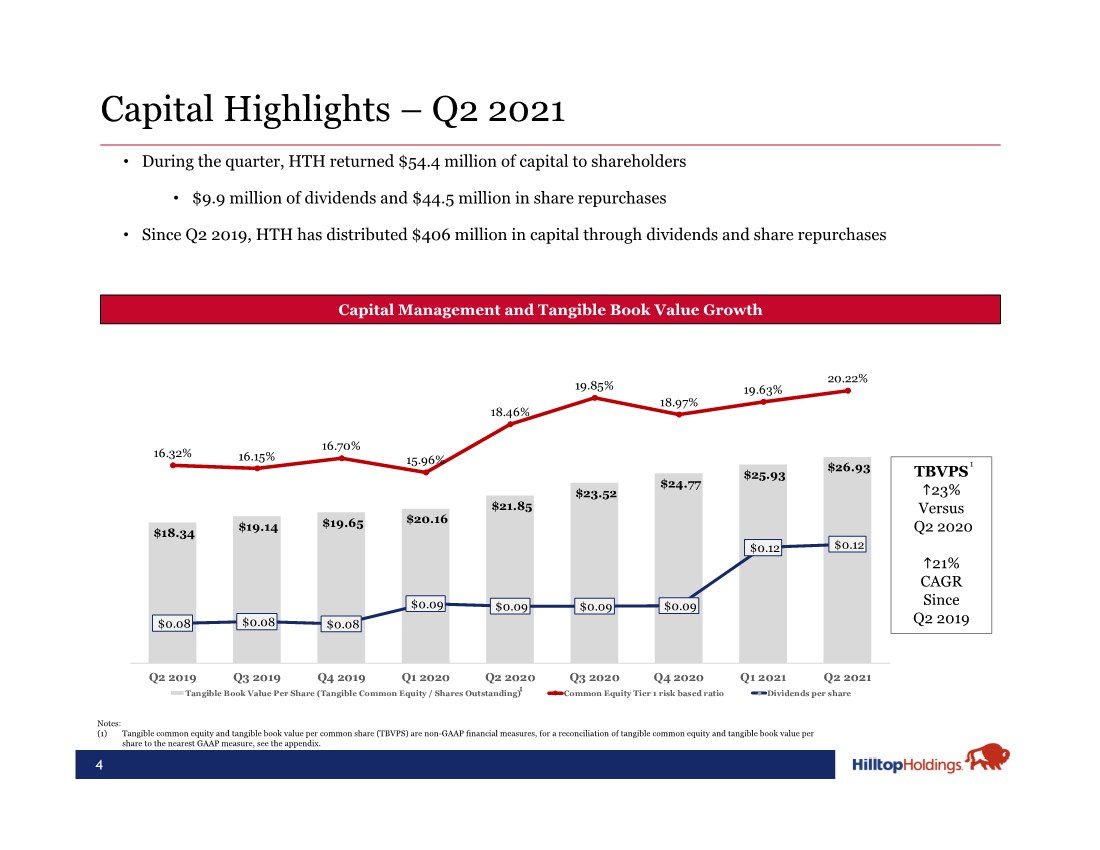
| Capital Highlights – Q2 2021 4 $18.34 $19.14 $19.65 $20.16 $21.85 $23.52 $24.77 $25.93 $26.93 16.32% 16.15% 16.70% 15.96% 18.46% 19.85% 18.97% 19.63% 20.22% $0.08 $0.08 $0.08 $0.09 $0.09 $0.09 $0.09 $0.12 $0.12 6.00% 8.00% 10.00% 12.00% 14.00% 16.00% 18.00% 20.00% 22.00% $‐ $5.00 $10.00 $15.00 $20.00 $25.00 $30.00 $35.00 $40.00 Q2 2019 Q3 2019 Q4 2019 Q1 2020 Q2 2020 Q3 2020 Q4 2020 Q1 2021 Q2 2021 Tangible Book Value Per Share (Tangible Common Equity / Shares Outstanding) Common Equity Tier 1 risk based ratio Dividends per share Capital Management and Tangible Book Value Growth TBVPS 23% Versus Q2 2020 21% CAGR Since Q2 2019 • During the quarter, HTH returned $54.4 million of capital to shareholders • $9.9 million of dividends and $44.5 million in share repurchases • Since Q2 2019, HTH has distributed $406 million in capital through dividends and share repurchases 1 1 Notes: (1) Tangible common equity and tangible book value per common share (TBVPS) are non-GAAP financial measures, for a reconciliation of tangible common equity and tangible book value per share to the nearest GAAP measure, see the appendix. |
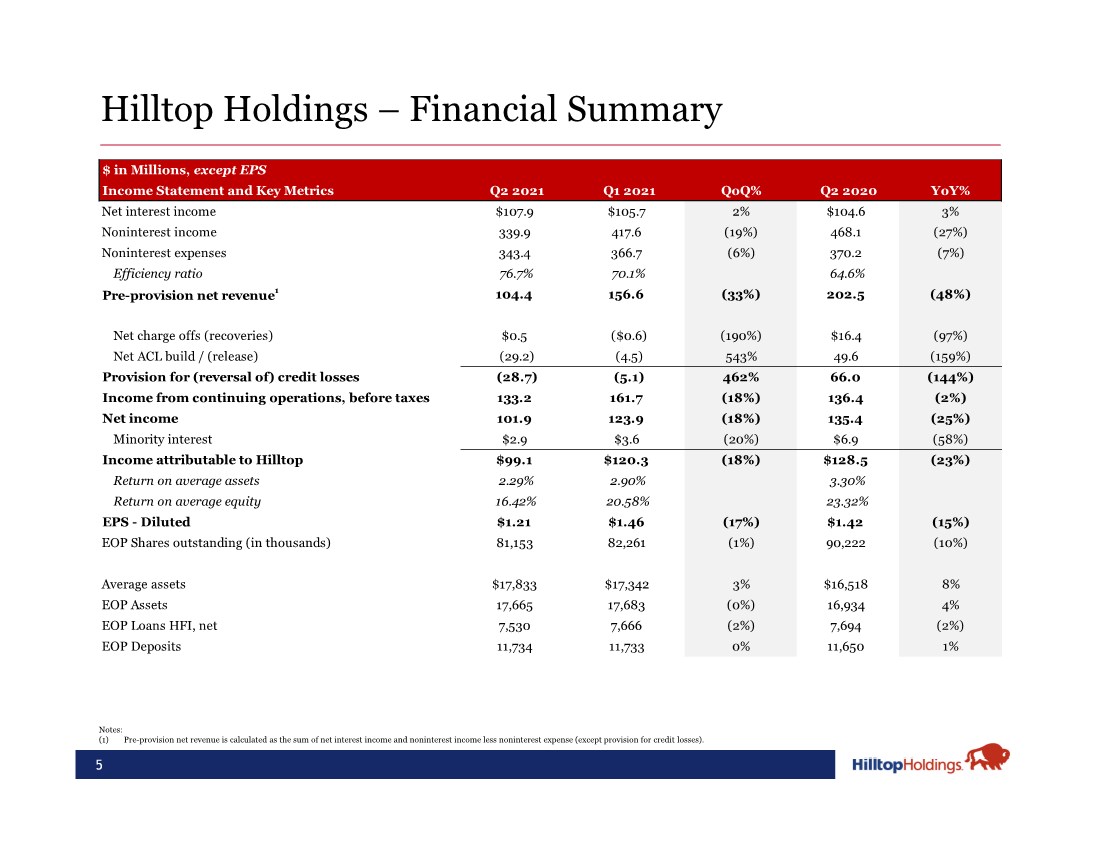
| 5 Hilltop Holdings – Financial Summary $ in Millions, except EPS Income Statement and Key Metrics Q2 2021 Q1 2021 QoQ% Q2 2020 YoY% Net interest income $107.9 $105.7 2% $104.6 3% Noninterest income 339.9 417.6 (19%) 468.1 (27%) Noninterest expenses 343.4 366.7 (6%) 370.2 (7%) Efficiency ratio 76.7% 70.1% 64.6% Pre-provision net revenue1 104.4 156.6 (33%) 202.5 (48%) Net charge offs (recoveries) $0.5 ($0.6) (190%) $16.4 (97%) Net ACL build / (release) (29.2) (4.5) 543% 49.6 (159%) Provision for (reversal of) credit losses (28.7) (5.1) 462% 66.0 (144%) Income from continuing operations, before taxes 133.2 161.7 (18%) 136.4 (2%) Net income 101.9 123.9 (18%) 135.4 (25%) Minority interest $2.9 $3.6 (20%) $6.9 (58%) Income attributable to Hilltop $99.1 $120.3 (18%) $128.5 (23%) Return on average assets 2.29% 2.90% 3.30% Return on average equity 16.42% 20.58% 23.32% EPS - Diluted $1.21 $1.46 (17%) $1.42 (15%) EOP Shares outstanding (in thousands) 81,153 82,261 (1%) 90,222 (10%) Average assets $17,833 $17,342 3% $16,518 8% EOP Assets 17,665 17,683 (0%) 16,934 4% EOP Loans HFI, net 7,530 7,666 (2%) 7,694 (2%) EOP Deposits 11,734 11,733 0% 11,650 1% Notes: (1) Pre-provision net revenue is calculated as the sum of net interest income and noninterest income less noninterest expense (except provision for credit losses). |
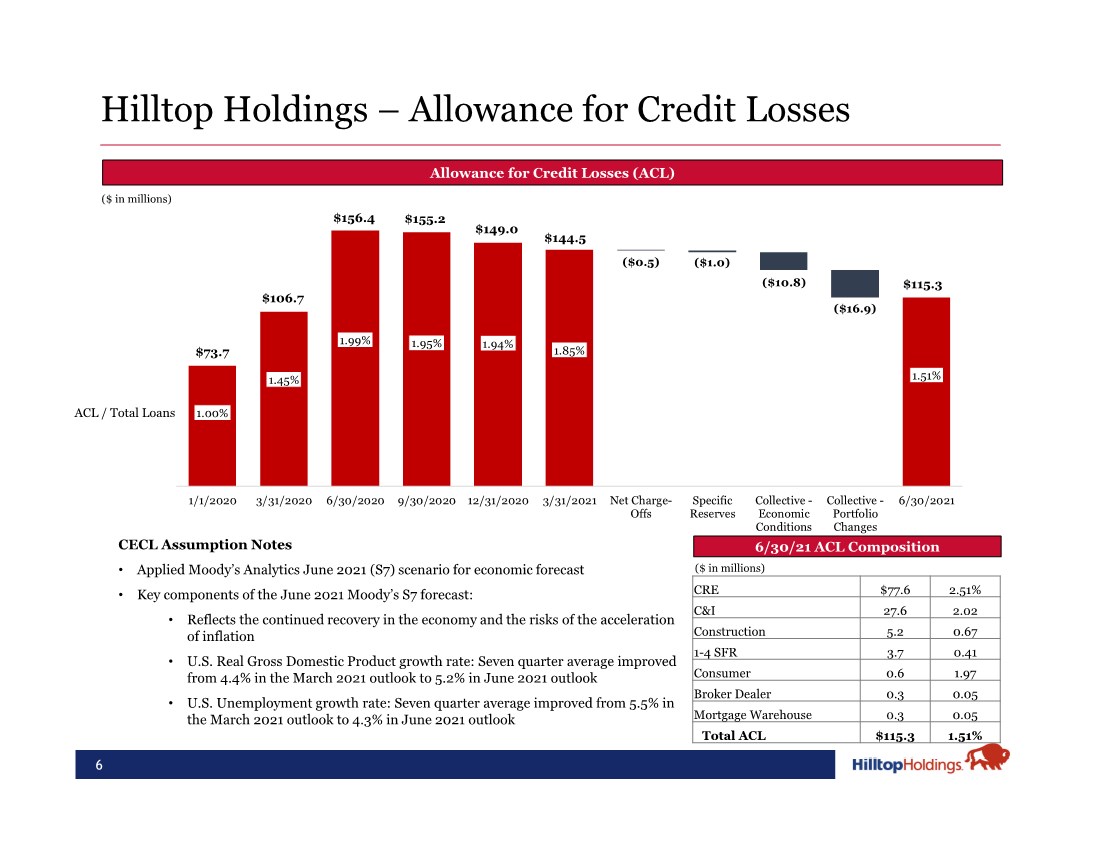
| 1.00% 1.45% 1.99% 1.95% 1.94% 1.85% 1.51% ($0.5) ($1.0) ($10.8) ($16.9) 0.00% 0.50% 1.00% 1.50% 2.00% 2.50% 3.00% 3.50% 4.00% $0.0 $20.0 $40.0 $60.0 $80.0 $100.0 $120.0 $140.0 $160.0 $180.0 1/1/2020 3/31/2020 6/30/2020 9/30/2020 12/31/2020 3/31/2021 Net Charge- Offs Specific Reserves Collective - Economic Conditions Collective - Portfolio Changes 6/30/2021 6 Hilltop Holdings – Allowance for Credit Losses Allowance for Credit Losses (ACL) 6/30/21 ACL Composition ($ in millions) CRE $77.6 2.51% C&I 27.6 2.02 Construction 5.2 0.67 1-4 SFR 3.7 0.41 Consumer 0.6 1.97 Broker Dealer 0.3 0.05 Mortgage Warehouse 0.3 0.05 Total ACL $115.3 1.51% ACL / Total Loans CECL Assumption Notes • Applied Moody’s Analytics June 2021 (S7) scenario for economic forecast • Key components of the June 2021 Moody’s S7 forecast: • Reflects the continued recovery in the economy and the risks of the acceleration of inflation • U.S. Real Gross Domestic Product growth rate: Seven quarter average improved from 4.4% in the March 2021 outlook to 5.2% in June 2021 outlook • U.S. Unemployment growth rate: Seven quarter average improved from 5.5% in the March 2021 outlook to 4.3% in June 2021 outlook $73.7 $106.7 $156.4 $155.2 $149.0 $144.5 $115.3 ($ in millions) |
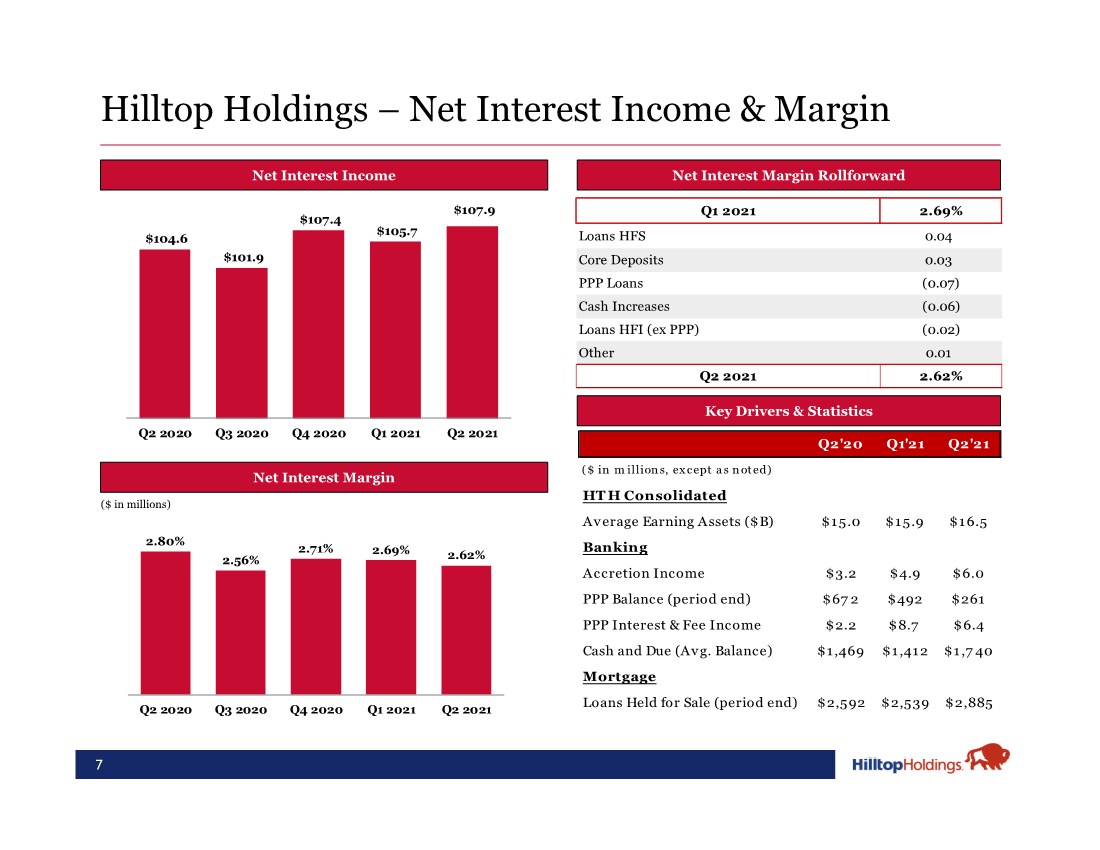
| 2.80% 2.56% 2.71% 2.69% 2.62% 1. 00% 1. 50% 2. 00% 2. 50% 3. 00% 3. 50% Q2 2020 Q3 2020 Q4 2020 Q1 2021 Q2 2021 7 Hilltop Holdings – Net Interest Income & Margin Net Interest Margin 2 Net Interest Margin Rollforward ($ in millions) Net Interest Income $104.6 $101.9 $107.4 $105.7 $107.9 $80. 0 $85. 0 $90. 0 $95. 0 $1 00. 0 $1 05. 0 $110 .0 Q2 2020 Q3 2020 Q4 2020 Q1 2021 Q2 2021 Q1 2021 2.69% Loans HFS 0.04 Core Deposits 0.03 PPP Loans (0.07) Cash Increases (0.06) Loans HFI (ex PPP) (0.02) Other 0.01 Q2 2021 2.62% Key Drivers & Statistics Q2'20 Q1'21 Q2'21 ($ in m illions, except as noted) HT H Consolidated Average Earning Assets ($B) $15.0 $15.9 $16.5 Banking Accretion Income $3.2 $4.9 $6.0 PPP Balance (period end) $67 2 $492 $261 PPP Interest & Fee Income $2.2 $8.7 $6.4 Cash and Due (Avg. Balance) $1,469 $1,412 $1,7 40 Mortgage Loans Held for Sale (period end) $2,592 $2,539 $2,885 |
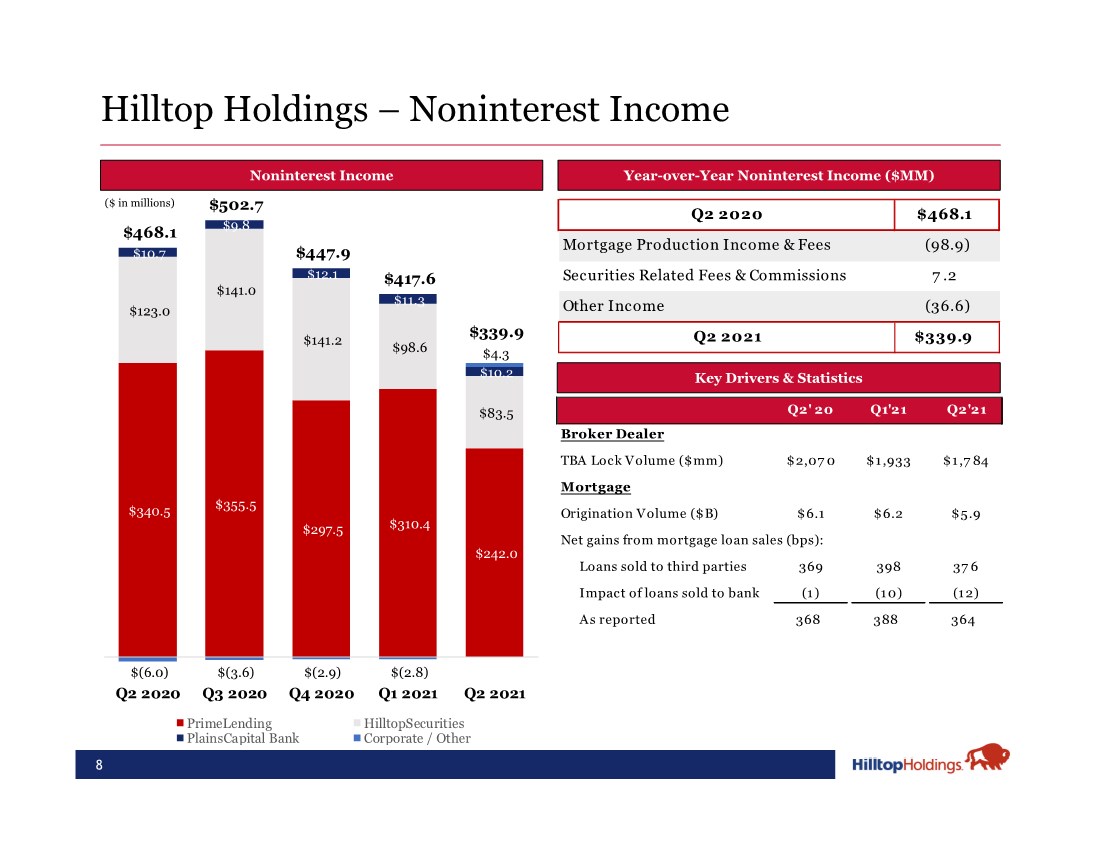
| $340.5 $355.5 $297.5 $310.4 $242.0 $123.0 $141.0 $141.2 $98.6 $83.5 $10.7 $9.8 $12.1 $11.3 $10.2 $(6.0) $(3.6) $(2.9) $(2.8) $4.3 $468.1 $502.7 $447.9 $417.6 $339.9 Q2 2020 Q3 2020 Q4 2020 Q1 2021 Q2 2021 PrimeLending HilltopSecurities PlainsCapital Bank Corporate / Other 8 Hilltop Holdings – Noninterest Income Year-over-Year Noninterest Income ($MM) Noninterest Income Key Drivers & Statistics ($ in millions) Q2 2020 $468.1 Mortgage Production Income & Fees (98.9) Securities Related Fees & Commissions 7 .2 Other Income (36.6) Q2 2021 $339.9 Q2' 20 Q1'21 Q2'21 Broker Dealer TBA Lock Volume ($mm) $2,07 0 $1,933 $1,7 84 Mortgage Origination Volume ($B) $6.1 $6.2 $5.9 Net gains from mortgage loan sales (bps): Loans sold to third parties 369 398 37 6 Impact of loans sold to bank (1) (10) (12) As reported 368 388 364 |
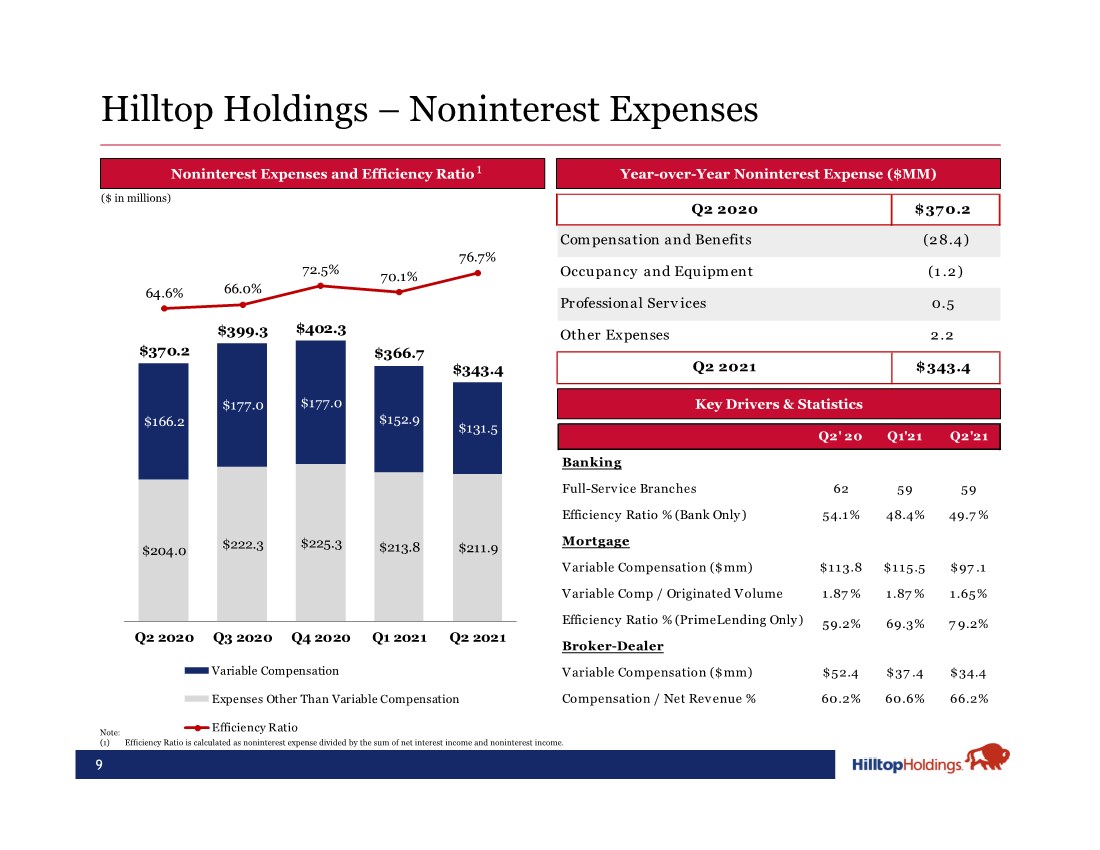
| $204.0 $222.3 $225.3 $213.8 $211.9 $166.2 $177.0 $177.0 $152.9 $131.5 $370.2 $399.3 $402.3 $366.7 $343.4 64.6% 66.0% 72.5% 70.1% 76.7% Q2 2020 Q3 2020 Q4 2020 Q1 2021 Q2 2021 Variable Compensation Expenses Other Than Variable Compensation Efficiency Ratio 9 Hilltop Holdings – Noninterest Expenses Year-over-Year Noninterest Expense ($MM) Noninterest Expenses and Efficiency Ratio Key Drivers & Statistics Note: (1) Efficiency Ratio is calculated as noninterest expense divided by the sum of net interest income and noninterest income. 1 ($ in millions) Q2 2020 $370.2 Compensation and Benefits (28.4) Occupancy and Equipment (1 .2) Professional Serv ices 0.5 Other Expenses 2.2 Q2 2021 $343.4 Q2' 20 Q1'21 Q2'21 Banking Full-Service Branches 62 59 59 Efficiency Ratio % (Bank Only) 54.1% 48.4% 49.7% Mortgage Variable Compensation ($mm) $113.8 $115.5 $97.1 Variable Comp / Originated Volume 1.87 % 1.87 % 1.65% Efficiency Ratio % (PrimeLending Only) 59.2% 69.3% 7 9.2% Broker-Dealer Variable Compensation ($mm) $52.4 $37 .4 $34.4 Compensation / Net Revenue % 60.2% 60.6% 66.2% |
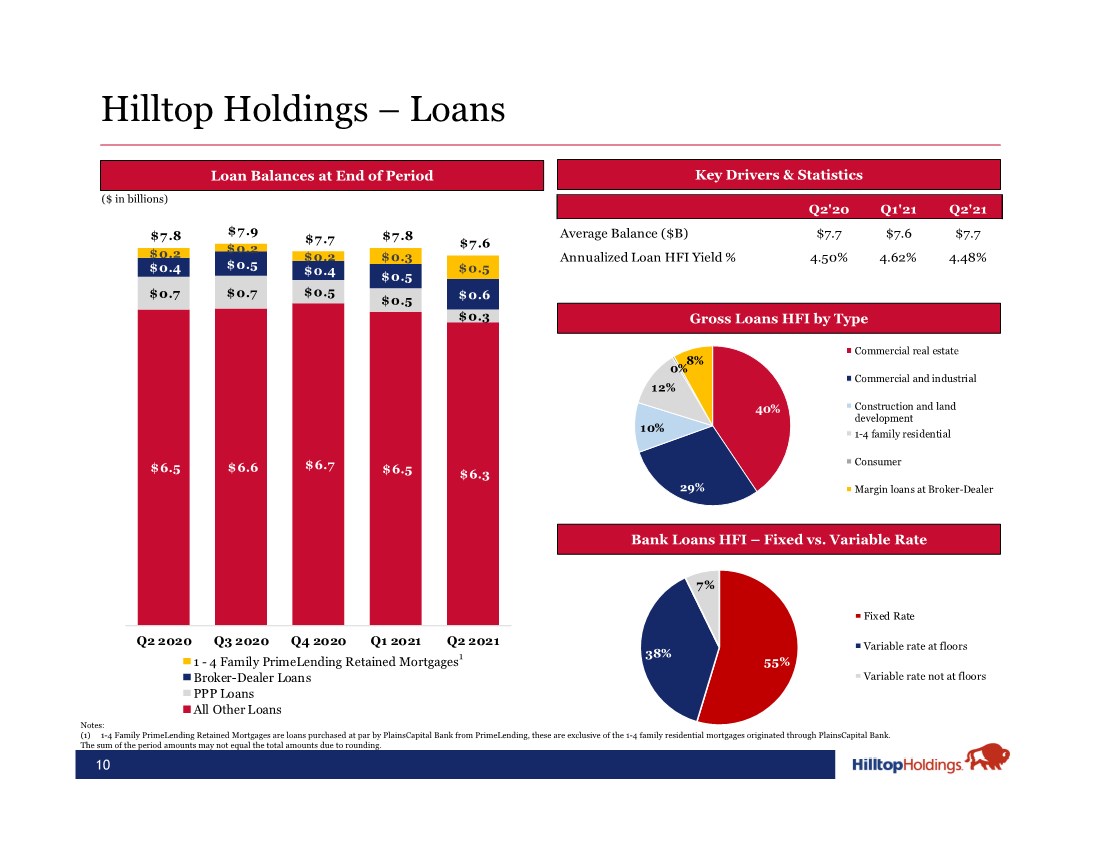
| 40% 29% 10% 12% 0%8% Commercial real estate Commercial and industrial Construction and land development 1-4 family residential Consumer Margin loans at Broker-Dealer $6.5 $6.6 $6.7 $6.5 $6.3 $0.7 $0.7 $0.5 $0.5 $0.3 $0.4 $0.5 $0.4 $0.5 $0.6 $0.2 $0.2 $0.2 $0.3 $0.5 $7.8 $7.9 $7.7 $7.8 $7.6 $‐ $1.0 $2.0 $3.0 $4.0 $5.0 $6.0 $7.0 $8.0 Q2 2020 Q3 2020 Q4 2020 Q1 2021 Q2 2021 1 - 4 Family PrimeLending Retained Mortgages Broker-Dealer Loans PPP Loans All Other Loans 10 Notes: (1) 1-4 Family PrimeLending Retained Mortgages are loans purchased at par by PlainsCapital Bank from PrimeLending, these are exclusive of the 1-4 family residential mortgages originated through PlainsCapital Bank. The sum of the period amounts may not equal the total amounts due to rounding. Loan Balances at End of Period Hilltop Holdings – Loans Key Drivers & Statistics Q2'20 Q1'21 Q2'21 Average Balance ($B) $7.7 $7.6 $7.7 Annualized Loan HFI Yield % 4.50% 4.62% 4.48% Gross Loans HFI by Type ($ in billions) Bank Loans HFI – Fixed vs. Variable Rate 55% 38% 7% Fixed Rate Variable rate at floors Variable rate not at floors 1 |
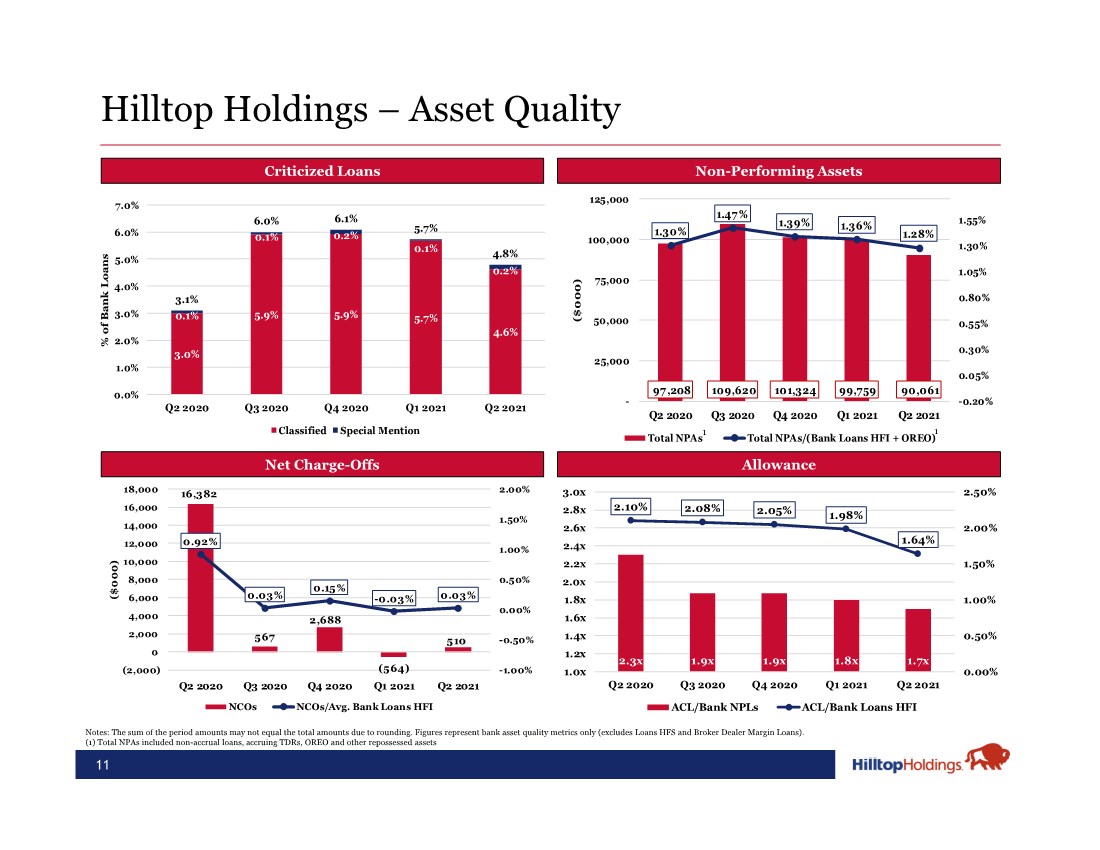
| 2.3x 1.9x 1.9x 1.8x 1.7x 2.10% 2.08% 2.05% 1.98% 1.64% 0.00% 0.50% 1.00% 1.50% 2.00% 2.50% 1.0x 1.2x 1.4x 1.6x 1.8x 2.0x 2.2x 2.4x 2.6x 2.8x 3.0x Q2 2020 Q3 2020 Q4 2020 Q1 2021 Q2 2021 ACL/Bank NPLs ACL/Bank Loans HFI 16,382 567 2,688 (564) 510 0.92% 0.03% 0.15% -0.03% 0.03% -1.00% -0.50% 0.00% 0.50% 1.00% 1.50% 2.00% (2,000) 0 2,000 4,000 6,000 8,000 10,000 12,000 14,000 16,000 18,000 Q2 2020 Q3 2020 Q4 2020 Q1 2021 Q2 2021 ($000) NCOs NCOs/Avg. Bank Loans HFI 3.0% 5.9% 5.9% 5.7% 4.6% 0.1% 0.1% 0.2% 0.1% 0.2% 3.1% 6.0% 6.1% 5.7% 4.8% 0.0% 1.0% 2.0% 3.0% 4.0% 5.0% 6.0% 7.0% Q2 2020 Q3 2020 Q4 2020 Q1 2021 Q2 2021 % of Bank Loans Classified Special Mention 97,208 109,620 101,324 99,759 90,061 1.30% 1.47 % 1.39% 1.36% 1.28% -0.20% 0.05% 0.30% 0.55% 0.80% 1.05% 1.30% 1.55% - 25,000 50,000 75,000 100,000 125,000 Q2 2020 Q3 2020 Q4 2020 Q1 2021 Q2 2021 ($000) Total NPAs Total NPAs/(Bank Loans HFI + OREO) 11 Hilltop Holdings – Asset Quality Criticized Loans Non-Performing Assets Notes: The sum of the period amounts may not equal the total amounts due to rounding. Figures represent bank asset quality metrics only (excludes Loans HFS and Broker Dealer Margin Loans). (1) Total NPAs included non-accrual loans, accruing TDRs, OREO and other repossessed assets Net Charge-Offs Allowance 1 1 |
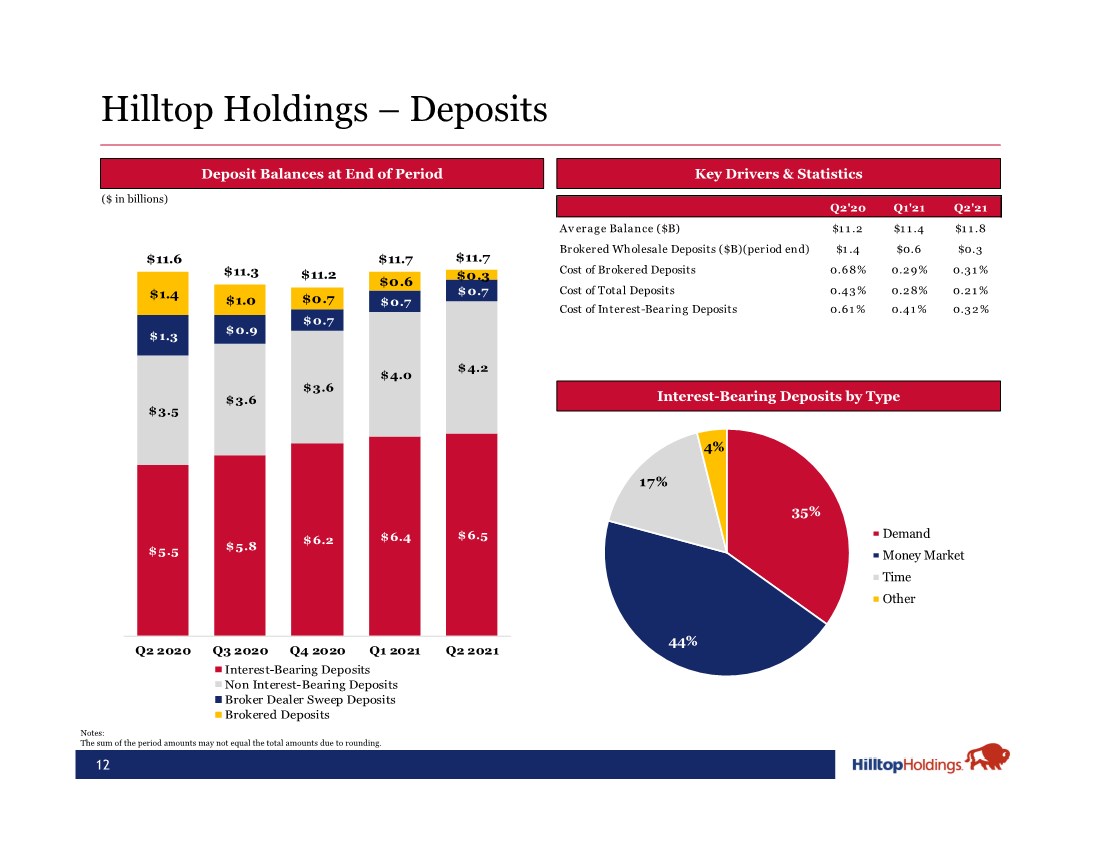
| 35% 44% 17% 4% Demand Money Market Time Other $5.5 $5.8 $6.2 $6.4 $6.5 $3.5 $3.6 $3.6 $4.0 $4.2 $1.3 $0.9 $0.7 $0.7 $0.7 $1.4 $1.0 $0.7 $0.6 $0.3 $11.6 $11.3 $11.2 $11.7 $11.7 Q2 2020 Q3 2020 Q4 2020 Q1 2021 Q2 2021 Interest-Bearing Deposits Non Interest-Bearing Deposits Broker Dealer Sweep Deposits Brokered Deposits 12 Notes: The sum of the period amounts may not equal the total amounts due to rounding. Deposit Balances at End of Period Hilltop Holdings – Deposits Key Drivers & Statistics Q2'20 Q1'21 Q2'21 Av erage Balance ($B) $1 1 .2 $1 1 .4 $1 1 .8 Brokered Wholesale Deposits ($B)(period end) $1 .4 $0.6 $0.3 Cost of Br okered Deposits 0.6 8% 0.2 9 % 0.3 1 % Cost of Total Deposits 0.43 % 0.28% 0.21 % Cost of Interest-Bearing Deposits 0.61 % 0.41 % 0.32% Interest-Bearing Deposits by Type ($ in billions) |
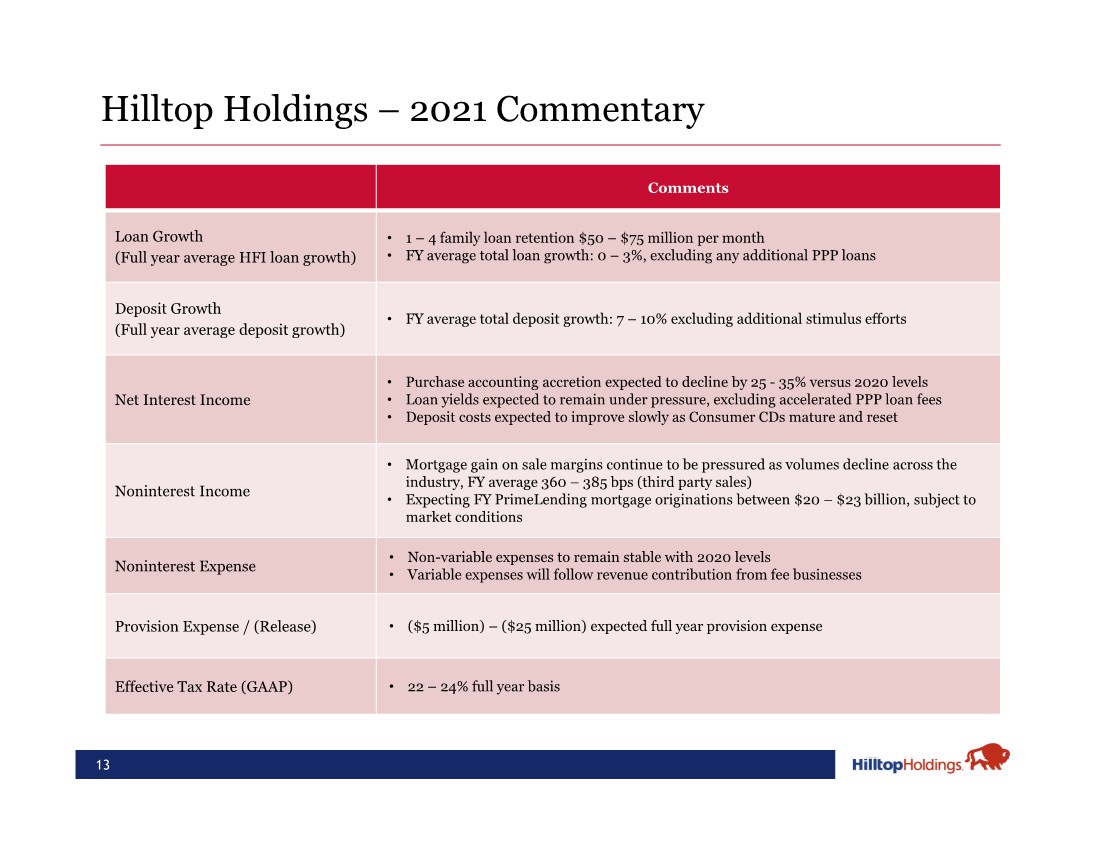
| 13 Hilltop Holdings – 2021 Commentary Comments Loan Growth (Full year average HFI loan growth) • 1 – 4 family loan retention $50 – $75 million per month • FY average total loan growth: 0 – 3%, excluding any additional PPP loans Deposit Growth (Full year average deposit growth) • FY average total deposit growth: 7 – 10% excluding additional stimulus efforts Net Interest Income • Purchase accounting accretion expected to decline by 25 - 35% versus 2020 levels • Loan yields expected to remain under pressure, excluding accelerated PPP loan fees • Deposit costs expected to improve slowly as Consumer CDs mature and reset Noninterest Income • Mortgage gain on sale margins continue to be pressured as volumes decline across the industry, FY average 360 – 385 bps (third party sales) • Expecting FY PrimeLending mortgage originations between $20 – $23 billion, subject to market conditions Noninterest Expense • Non-variable expenses to remain stable with 2020 levels • Variable expenses will follow revenue contribution from fee businesses Provision Expense / (Release) • ($5 million) – ($25 million) expected full year provision expense Effective Tax Rate (GAAP) • 22 – 24% full year basis |
| Questions? 14 |

| Appendix 15 |
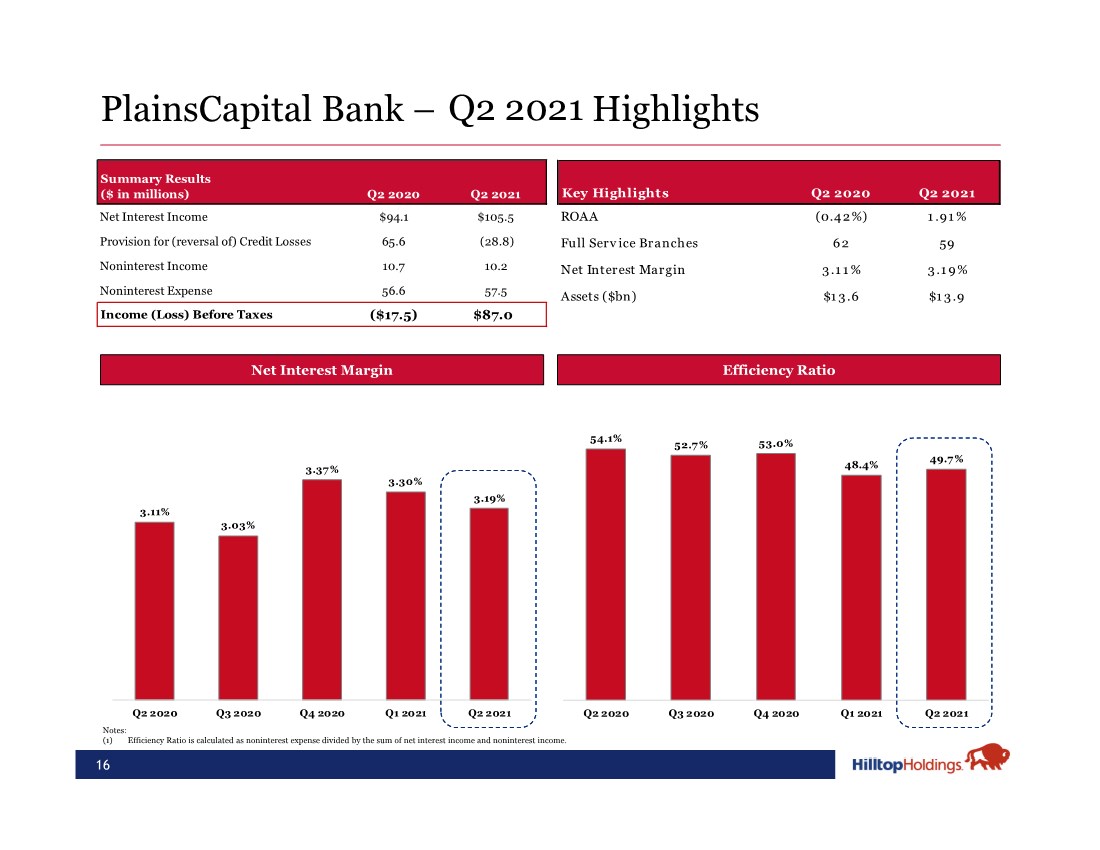
| 54.1% 52.7% 53.0% 48.4% 49.7% Q2 2020 Q3 2020 Q4 2020 Q1 2021 Q2 2021 3.11% 3.03% 3.37% 3.30% 3.19% Q2 2020 Q3 2020 Q4 2020 Q1 2021 Q2 2021 PlainsCapital Bank – Highlights Q2 2021 Key Highlights Q2 2020 Q2 2021 ROAA (0.42%) 1.91% Full Serv ice Branches 62 59 Net Interest Margin 3.11% 3.19% Assets ($bn) $1 3 .6 $1 3 .9 Summary Results ($ in millions) Q2 2020 Q2 2021 Net Interest Income $94.1 $105.5 Provision for (reversal of) Credit Losses 65.6 (28.8) Noninterest Income 10.7 10.2 Noninterest Expense 56.6 57.5 Income (Loss) Before Taxes ($17.5) $87.0 16 Efficiency Ratio Notes: (1) Efficiency Ratio is calculated as noninterest expense divided by the sum of net interest income and noninterest income. Net Interest Margin |
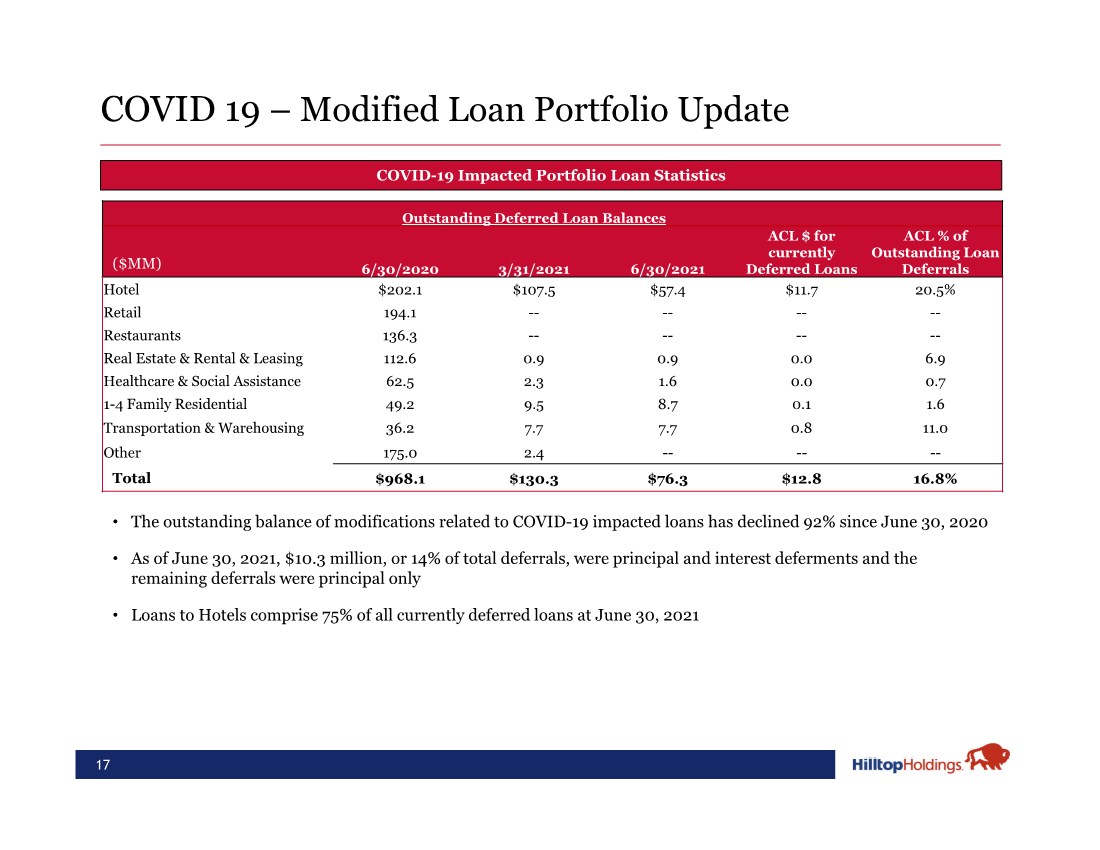
| 17 COVID 19 – Modified Loan Portfolio Update • The outstanding balance of modifications related to COVID-19 impacted loans has declined 92% since June 30, 2020 • As of June 30, 2021, $10.3 million, or 14% of total deferrals, were principal and interest deferments and the remaining deferrals were principal only • Loans to Hotels comprise 75% of all currently deferred loans at June 30, 2021 COVID-19 Impacted Portfolio Loan Statistics Outstanding Deferred Loan Balances ($MM) 6/30/2020 3/31/2021 6/30/2021 ACL $ for currently Deferred Loans ACL % of Outstanding Loan Deferrals Hotel $202.1 $107.5 $57.4 $11.7 20.5% Retail 194.1 -- -- -- -- Restaurants 136.3 -- -- -- -- Real Estate & Rental & Leasing 112.6 0.9 0.9 0.0 6.9 Healthcare & Social Assistance 62.5 2.3 1.6 0.0 0.7 1-4 Family Residential 49.2 9.5 8.7 0.1 1.6 Transportation & Warehousing 36.2 7.7 7.7 0.8 11.0 Other175.0 2.4------ Total $968.1 $130.3 $76.3 $12.8 16.8% |
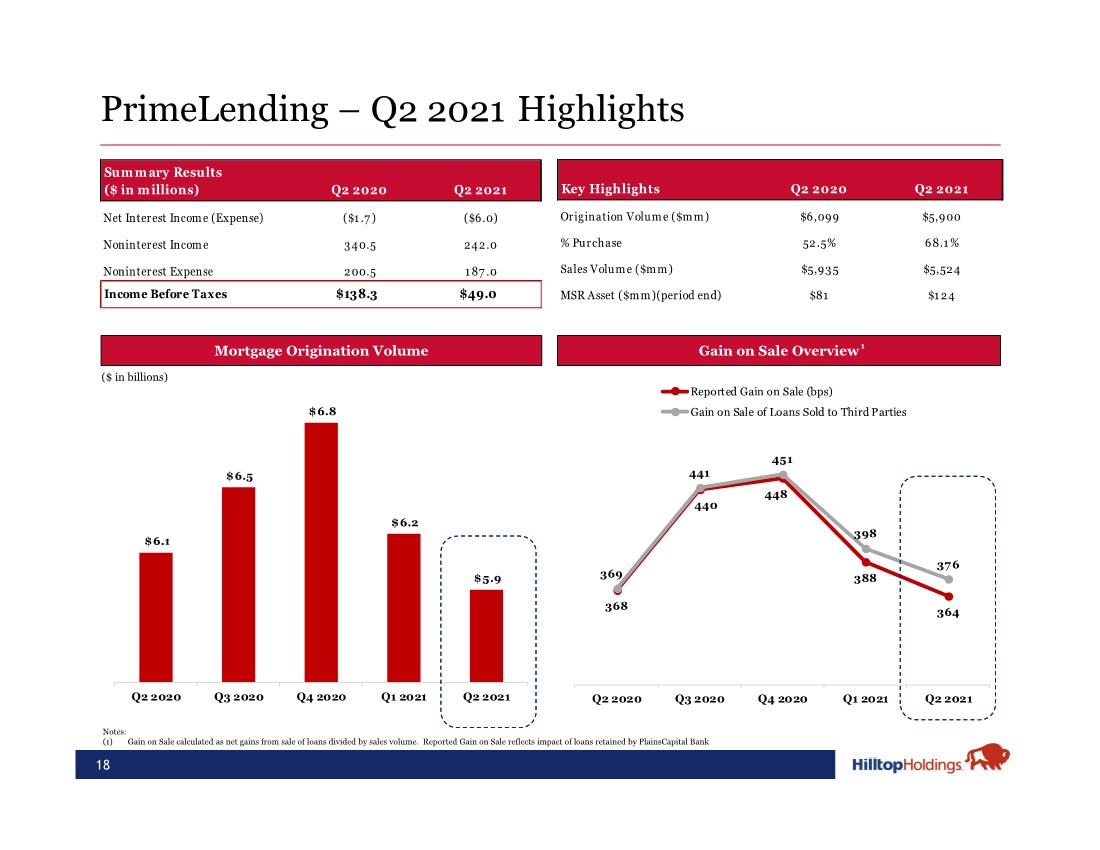
| Key Highlights Q2 2020 Q2 2021 Origination Volume ($mm) $6,099 $5,900 % Purchase 52.5% 68.1 % Sales Volume ($mm) $5,935 $5,524 MSR Asset ($mm)(period end) $81 $124 18 PrimeLending – Highlights Gain on Sale Overview Notes: (1) Gain on Sale calculated as net gains from sale of loans divided by sales volume. Reported Gain on Sale reflects impact of loans retained by PlainsCapital Bank Q2 2021 1 Sum m ary Results ($ in millions) Q2 2020 Q2 2021 Net In ter est Incom e (Ex pen se) ($1 .7 ) ($6 .0) Noninterest Income 340.5 242.0 Noninterest Expense 200.5 187.0 Income Before Taxes $138.3 $49.0 Mortgage Origination Volume $6.1 $6.5 $6.8 $6.2 $5.9 Q2 2020 Q3 2020 Q4 2020 Q1 2021 Q2 2021 368 440 448 388 364 369 441 451 398 376 Q2 2020 Q3 2020 Q4 2020 Q1 2021 Q2 2021 Reported Gain on Sale (bps) Gain on Sale of Loans Sold to Third Parties ($ in billions) |
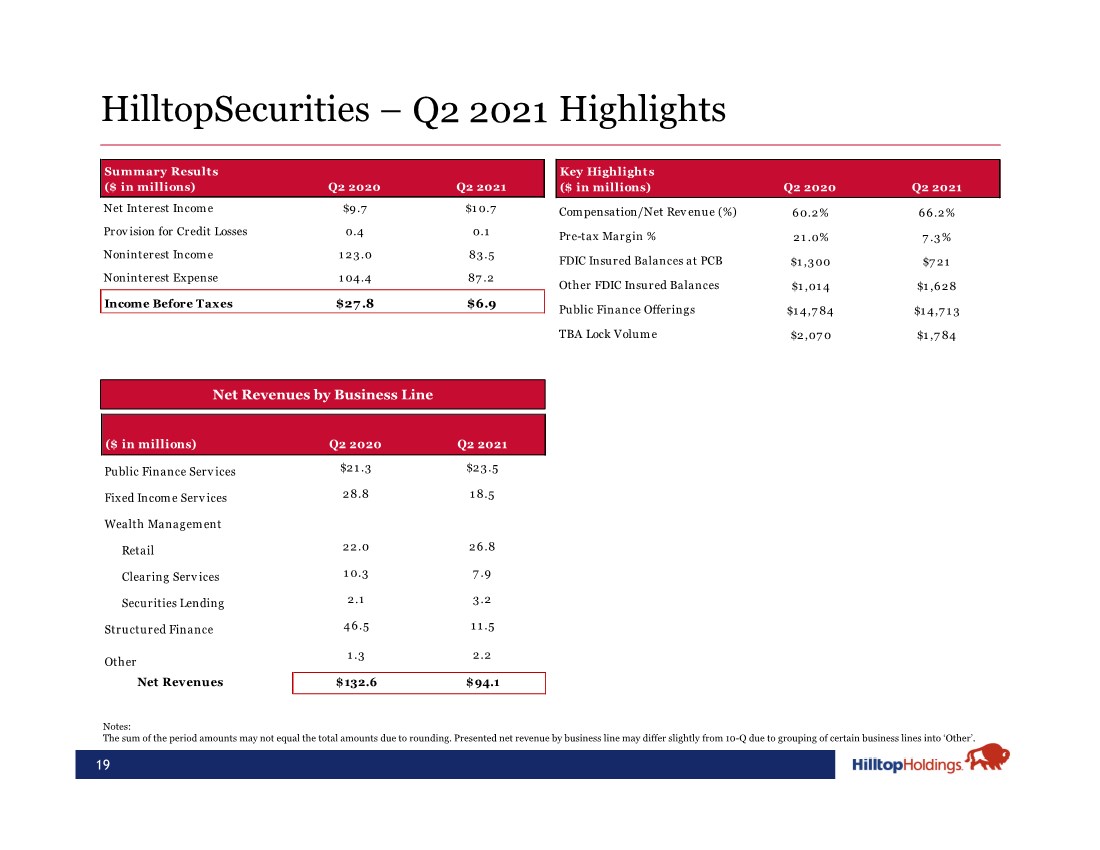
| HilltopSecurities – Highlights Q2 2021 Summary Results ($ in millions) Q2 2020 Q2 2021 Net Interest Income $9.7 $10.7 Provision for Credit Losses 0.4 0.1 Noninterest Income 123.0 83.5 Noninterest Expense 104.4 87.2 Income Before Taxes $27.8 $6.9 19 Notes: The sum of the period amounts may not equal the total amounts due to rounding. Presented net revenue by business line may differ slightly from 10-Q due to grouping of certain business lines into ‘Other’. Net Revenues by Business Line Key Highlights ($ in millions) Q2 2020 Q2 2021 Compensation/Net Rev enue (%) 60.2% 66.2% Pre-tax Margin % 21.0% 7.3% FDIC Insured Balances at PCB $1 ,3 00 $7 2 1 Other FDIC Insured Balances $1 ,01 4 $1 ,6 2 8 Public Finance Offerings $14,784 $14,713 TBA Lock Volume $2 ,07 0 $1 ,7 84 ($ in millions) Q2 2020 Q2 2021 Public Finance Serv ices $2 1 .3 $2 3 .5 Fixed Incom e Serv ices 28.8 18.5 Wealth Management Retail 22.0 26.8 Clearing Serv ices 10.3 7.9 Securities Lending 2.1 3.2 Structured Finance 46.5 11.5 Other 1.3 2.2 Net Revenues $132.6 $94.1 |
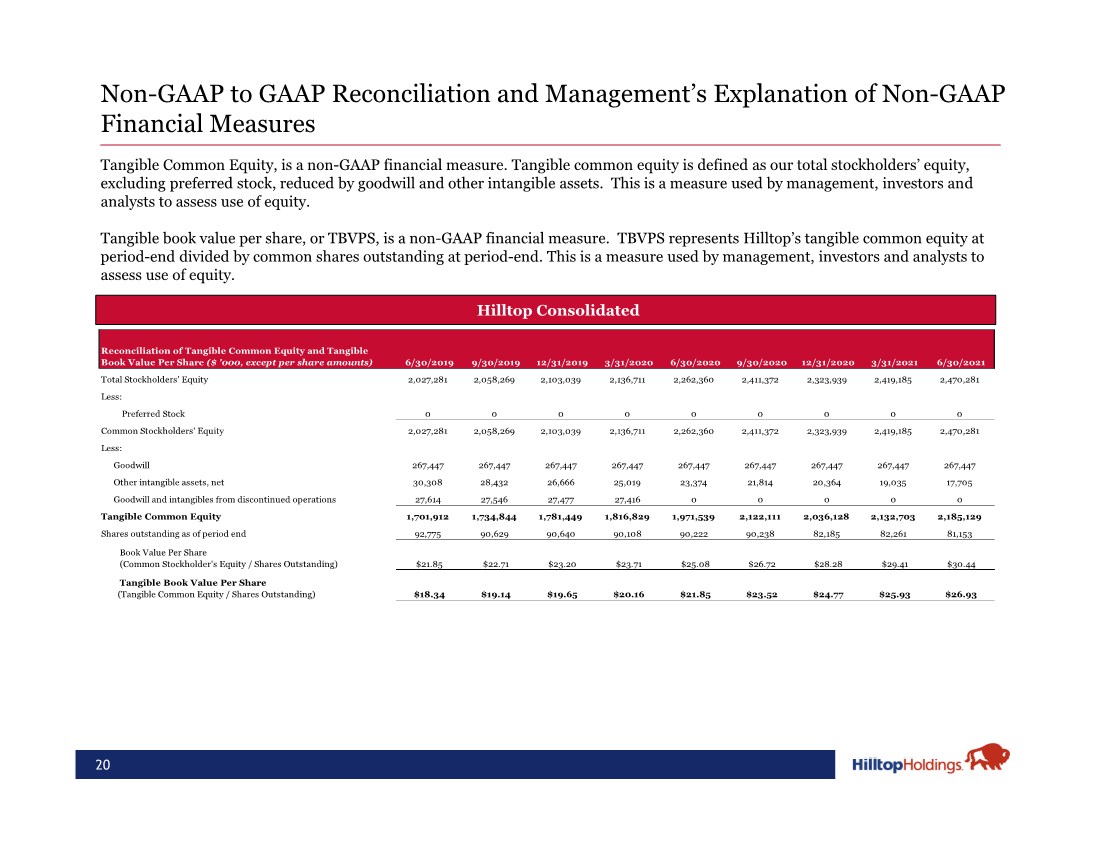
| 20 Non-GAAP to GAAP Reconciliation and Management’s Explanation of Non-GAAP Financial Measures • Hilltop Consolidated Tangible Common Equity, is a non-GAAP financial measure. Tangible common equity is defined as our total stockholders’ equity, excluding preferred stock, reduced by goodwill and other intangible assets. This is a measure used by management, investors and analysts to assess use of equity. Tangible book value per share, or TBVPS, is a non-GAAP financial measure. TBVPS represents Hilltop’s tangible common equity at period-end divided by common shares outstanding at period-end. This is a measure used by management, investors and analysts to assess use of equity. Reconciliation of Tangible Common Equity and Tangible Book Value Per Share ($ '000, except per share amounts) 6/30/2019 9/30/2019 12/31/2019 3/31/2020 6/30/2020 9/30/2020 12/31/2020 3/31/2021 6/30/2021 Total Stockholders' Equity 2,027,281 2,058,269 2,103,039 2,136,711 2,262,360 2,411,372 2,323,939 2,419,185 2,470,281 Less: Preferred Stock 0 0 0 0 0 0 0 0 0 Common Stockholders' Equity 2,027,281 2,058,269 2,103,039 2,136,711 2,262,360 2,411,372 2,323,939 2,419,185 2,470,281 Less: Goodwill 267,447 267,447 267,447 267,447 267,447 267,447 267,447 267,447 267,447 Other intangible assets, net 30,308 28,432 26,666 25,019 23,374 21,814 20,364 19,035 17,705 Goodwill and intangibles from discontinued operations 27,614 27,546 27,477 27,416 0 0 0 0 0 Tangible Common Equity 1,701,912 1,734,844 1,781,449 1,816,829 1,971,539 2,122,111 2,036,128 2,132,703 2,185,129 Shares outstanding as of period end 92,775 90,629 90,640 90,108 90,222 90,238 82,185 82,261 81,153 Book Value Per Share (Common Stockholder's Equity / Shares Outstanding) $21.85 $22.71 $23.20 $23.71 $25.08 $26.72 $28.28 $29.41 $30.44 Tangible Book Value Per Share (Tangible Common Equity / Shares Outstanding) $18.34 $19.14 $19.65 $20.16 $21.85 $23.52 $24.77 $25.93 $26.93 |