Attached files
| file | filename |
|---|---|
| EX-99.1 - EX-99.1 - SMARTFINANCIAL INC. | smbk-20210720xex99d1.htm |
| 8-K - 8-K - SMARTFINANCIAL INC. | smbk-20210720x8k.htm |
Exhibit 99.2
| INVESTOR CALL 2Q 2021 July 21, 2021, 10:00 a.m. Webcast: www.smartbank.com (Investor Relations) Audio Only: (888) 317-6003 Confirmation #: 5194560 Miller Welborn Chairman of the Board Billy Carroll President & CEO |

| Legal Disclaimer 2 Forward-Looking Statements This presentation may contain statements that are based on management’s current estimates or expectations of future events or future results, and that may be deemed to constitute forward- looking statements as defined under the Private Securities Litigation Reform Act of 1995. These statements, including statements regarding the effects of the COVID-19 pandemic on SmartFinancial’s business and financial results and conditions, are not historical in nature and can generally be identified by such words as “expect,” “anticipate,” “intend,” “plan,” “believe,” “seek,” “may,” “estimate,” and similar expressions. All forward-looking statements are subject to risks, uncertainties, and other factors that may cause the actual results of SmartFinancial to differ materially from future results expressed or implied by such forward-looking statements. Such risks, uncertainties, and other factors include, among others, (1) the risk of litigation and reputational risk associated with historic acquisition activity;(2) the risk that cost savings and revenue synergies from recently completed acquisitions may not be realized or may take longer than anticipated to realize;(3) disruption from recently completed acquisitions with customer, supplier, employee, or other business relationships;(4) our ability to successfully integrate the businesses acquired as part of previous acquisitions with the business of SmartBank;(5) risks related to the proposed acquisition of Sevier County Bancshares (“SCB”);(6) the risk that the anticipated benefits from the proposed acquisition of SCB may not be realized in the time frame anticipated;(7) changes in management’s plans for the future;(8) prevailing, or changes in, economic or political conditions, particularly in our market areas;(9) credit risk associated with our lending activities;(10) changes in interest rates, loan demand, real estate values, or competition; (11) changes in accounting principles, policies, or guidelines;(12) changes in applicable laws, rules, or regulations, including changes to statutes, regulations or regulatory policies or practices as a result of, or in response to, COVID-19;(13) adverse results from current or future litigation, regulatory examinations or other legal and/or regulatory actions, including as a result of the Company’s participation in and execution of government programs related to the COVID-19 pandemic;(14) the impact of the COVID-19 pandemic on the Company’s assets, business, cash flows, financial condition, liquidity, prospects and results of operations;(15) potential increases in the provision for loan losses resulting from the COVID-19 pandemic; and (16) other general competitive, economic, political, and market factors, including those affecting our business, operations, pricing, products, or services. These and other factors that could cause results to differ materially from those described in the forward-looking statements can be found in SmartFinancial’s most recent annual report on Form 10-K, quarterly reports on Form 10-Q, and current reports on Form 8-K, in each case filed with or furnished to the Securities and Exchange Commission (the “SEC”) and available on the SEC’s website (www.sec.gov). Undue reliance should not be placed on forward-looking statements. SmartFinancial disclaims any obligation to update or revise any forward-looking statements contained in this release, which speak only as of the date hereof, whether as a result of new information, future events, or otherwise. Non-GAAP Financial Measures Statements included in this presentation include Non-GAAP financial measures and should be read along with the accompanying tables, which provide a reconciliation of Non-GAAP financial measures to GAAP financial measures. SmartFinancial management uses several Non-GAAP financial measures, including:(i) operating earnings, (ii) operating return on average assets, (iii) operating return on average shareholder equity, (iv) return on average tangible common equity, (v) operating return on average tangible common equity, (vi) operating efficiency ratio;(vii) tangible common equity;(viii) average tangible common equity;(ix) tangible book value;(x) operating pre-tax pre-provision earnings;(xi) operating noninterest income;(xii) operating noninterest expense;(xiii) tangible assets; and ratios derived therefrom, in its analysis of the company's performance. Operating earnings excludes the following from net income: securities gains and losses, proceeds related to the termination of an Alabama Department of Economic and Community Affairs (“ADECA”) loan program, merger related and restructuring expenses, and the income tax effect of adjustments. Operating return on average assets is the annualized operating earnings (Non-GAAP) divided by average assets. Operating return on average shareholder equity is the annualized operating earnings (Non- GAAP) divided by average equity. Return on average tangible common equity is the annualized net income divided by average tangible common equity (Non-GAAP). Operating return on average tangible common equity is the annualized operating earnings (Non-GAAP) divided by average tangible common equity (Non- GAAP). The operating efficiency ratio includes an adjustment for taxable equivalent yields and excludes securities gains and losses and merger related and restructuring expenses from the efficiency ratio. Tangible common equity and average tangible common equity excludes goodwill and other intangible assets from shareholders’ equity and average shareholders’ equity. Tangible book value excludes goodwill and other intangible assets less shareholders’ equity divided by common shares outstanding. Operating pre-tax pre- provision earnings is net interest income plus operating noninterest income (Non-GAAP) less operating noninterest expense (Non-GAAP). Operating noninterest income excludes the following from noninterest income: securities gains and losses, proceeds related to the termination of the ADECA loan program. Operating noninterest expense excludes the following from noninterest expense: prior year adjustments to salaries, merger related and restructuring expenses and certain franchise tax true-up expenses. Tangible assets excludes goodwill and other intangibles from total assets. Management believes that Non-GAAP financial measures provide additional useful information that allows investors to evaluate the ongoing performance of the company and provide meaningful comparisons to its peers. Management believes these non-GAAP financial measures also enhance investors' ability to compare period-to-period financial results and allow investors and company management to view our operating results excluding the impact of items that are not reflective of the underlying operating performance. Non-GAAP financial measures should not be considered as an alternative to any measure of performance or financial condition as promulgated under GAAP, and investors should consider SmartFinancial's performance and financial condition as reported under GAAP and all other relevant information when assessing the performance or financial condition of the company. Non-GAAP financial measures have limitations as analytical tools, and investors should not consider them in isolation or as a substitute for analysis of the results or financial condition as reported under GAAP. |
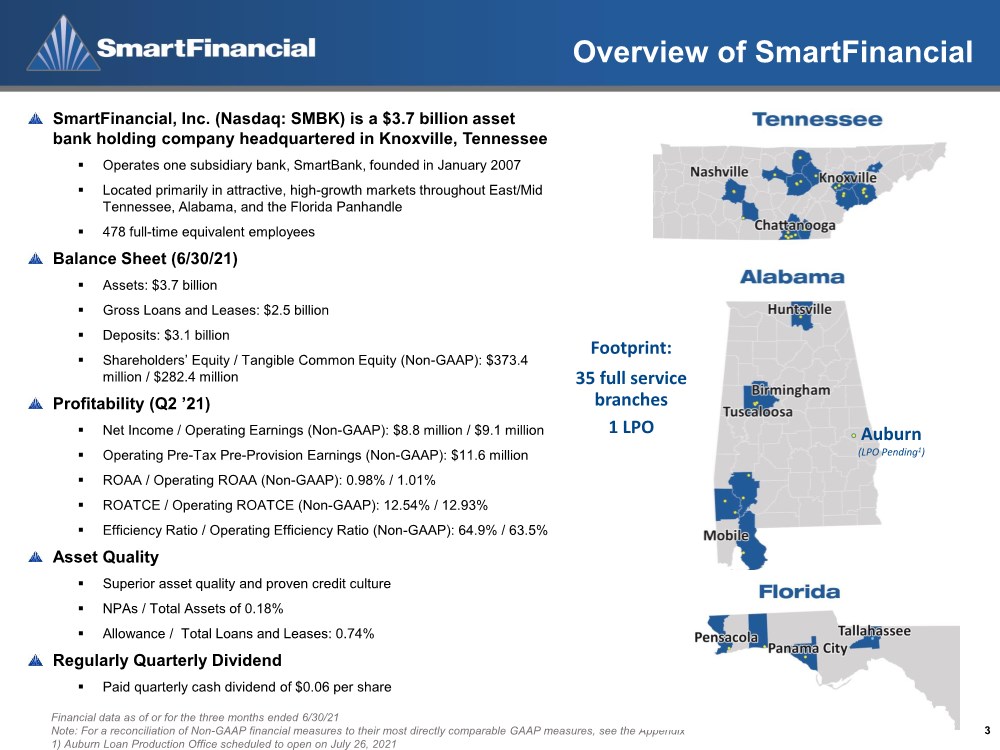
| Overview of SmartFinancial 3 Financial data as of or for the three months ended 6/30/21 Note: For a reconciliation of Non-GAAP financial measures to their most directly comparable GAAP measures, see the Appendix 1) Auburn Loan Production Office scheduled to open on July 26, 2021 SmartFinancial, Inc. (Nasdaq: SMBK) is a $3.7 billion asset bank holding company headquartered in Knoxville, Tennessee ▪ Operates one subsidiary bank, SmartBank, founded in January 2007 ▪ Located primarily in attractive, high-growth markets throughout East/Mid Tennessee, Alabama, and the Florida Panhandle ▪ 478 full-time equivalent employees Balance Sheet (6/30/21) ▪ Assets: $3.7 billion ▪ Gross Loans and Leases: $2.5 billion ▪ Deposits: $3.1 billion ▪ Shareholders’ Equity / Tangible Common Equity (Non-GAAP): $373.4 million / $282.4 million Profitability (Q2 ’21) ▪ Net Income / Operating Earnings (Non-GAAP): $8.8 million / $9.1 million ▪ Operating Pre-Tax Pre-Provision Earnings (Non-GAAP): $11.6 million ▪ ROAA / Operating ROAA (Non-GAAP): 0.98% / 1.01% ▪ ROATCE / Operating ROATCE (Non-GAAP): 12.54% / 12.93% ▪ Efficiency Ratio / Operating Efficiency Ratio (Non-GAAP): 64.9% / 63.5% Asset Quality ▪ Superior asset quality and proven credit culture ▪ NPAs / Total Assets of 0.18% ▪ Allowance / Total Loans and Leases: 0.74% Regularly Quarterly Dividend ▪ Paid quarterly cash dividend of $0.06 per share Footprint: 35 full service branches 1 LPO Auburn (LPO Pending1) |
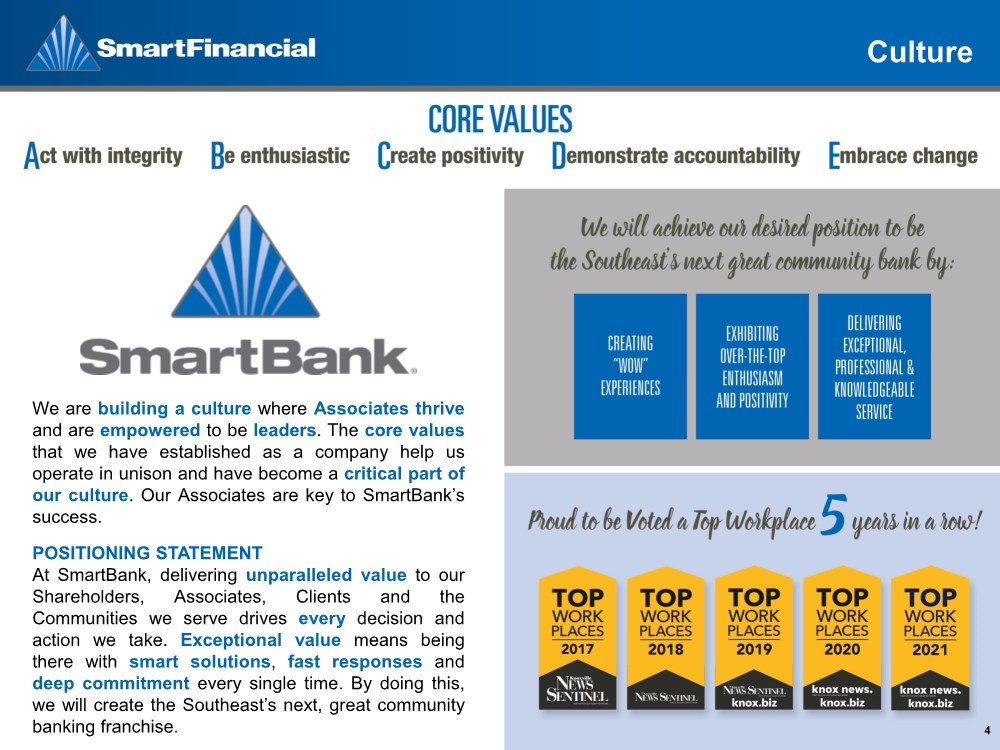
| Culture We are building a culture where Associates thrive and are empowered to be leaders. The core values that we have established as a company help us operate in unison and have become a critical part of our culture. Our Associates are key to SmartBank’s success. POSITIONING STATEMENT At SmartBank, delivering unparalleled value to our Shareholders, Associates, Clients and the Communities we serve drives every decision and action we take. Exceptional value means being there with smart solutions, fast responses and deep commitment every single time. By doing this, we will create the Southeast’s next, great community banking franchise. 4 |
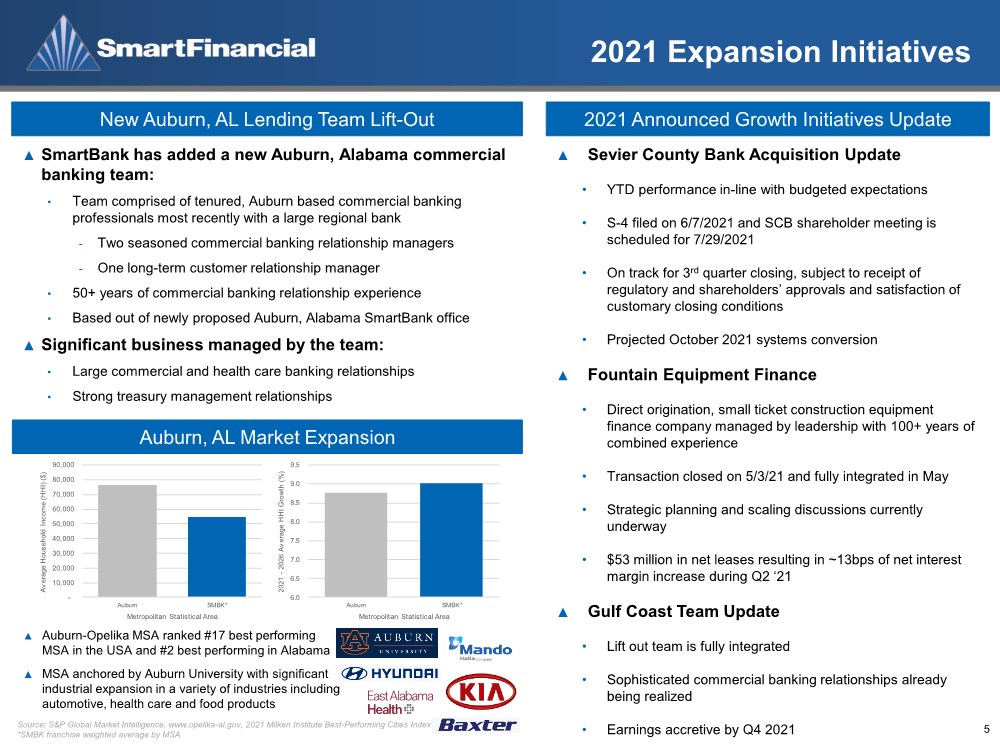
| 5 ▲ Sevier County Bank Acquisition Update • YTD performance in-line with budgeted expectations •S-4 filed on 6/7/2021 and SCB shareholder meeting is scheduled for 7/29/2021 • On track for 3rd quarter closing, subject to receipt of regulatory and shareholders’ approvals and satisfaction of customary closing conditions • Projected October 2021 systems conversion ▲ Fountain Equipment Finance • Direct origination, small ticket construction equipment finance company managed by leadership with 100+ years of combined experience • Transaction closed on 5/3/21 and fully integrated in May • Strategic planning and scaling discussions currently underway • $53 million in net leases resulting in ~13bps of net interest margin increase during Q2 ‘21 ▲ Gulf Coast Team Update • Lift out team is fully integrated • Sophisticated commercial banking relationships already being realized • Earnings accretive by Q4 2021 2021 Expansion Initiatives New Auburn, AL Lending Team Lift-Out 2021 Announced Growth Initiatives Update Auburn, AL Market Expansion ▲ SmartBank has added a new Auburn, Alabama commercial banking team: • Team comprised of tenured, Auburn based commercial banking professionals most recently with a large regional bank - Two seasoned commercial banking relationship managers - One long-term customer relationship manager • 50+ years of commercial banking relationship experience • Based out of newly proposed Auburn, Alabama SmartBank office ▲ Significant business managed by the team: • Large commercial and health care banking relationships • Strong treasury management relationships 6.0 6.5 7.0 7.5 8.0 8.5 9.0 9.5 Auburn SMBK* 2021 - 2026 Av erage HHI Growth (%) Metropolitan Statistical Area - 10,000 20,000 30,000 40,000 50,000 60,000 70,000 80,000 90,000 Auburn SMBK* Av erage Household Income (HHI) ($) Metropolitan Statistical Area ▲ Auburn-Opelika MSA ranked #17 best performing MSA in the USA and #2 best performing in Alabama ▲ MSA anchored by Auburn University with significant industrial expansion in a variety of industries including automotive, health care and food products Source: S&P Global Market Intelligence, www.opelika-al.gov, 2021 Milken Institute Best-Performing Cities Index *SMBK franchise weighted average by MSA |
| Diversified Revenue Stream 6 |
| Second Quarter Financial Highlights |

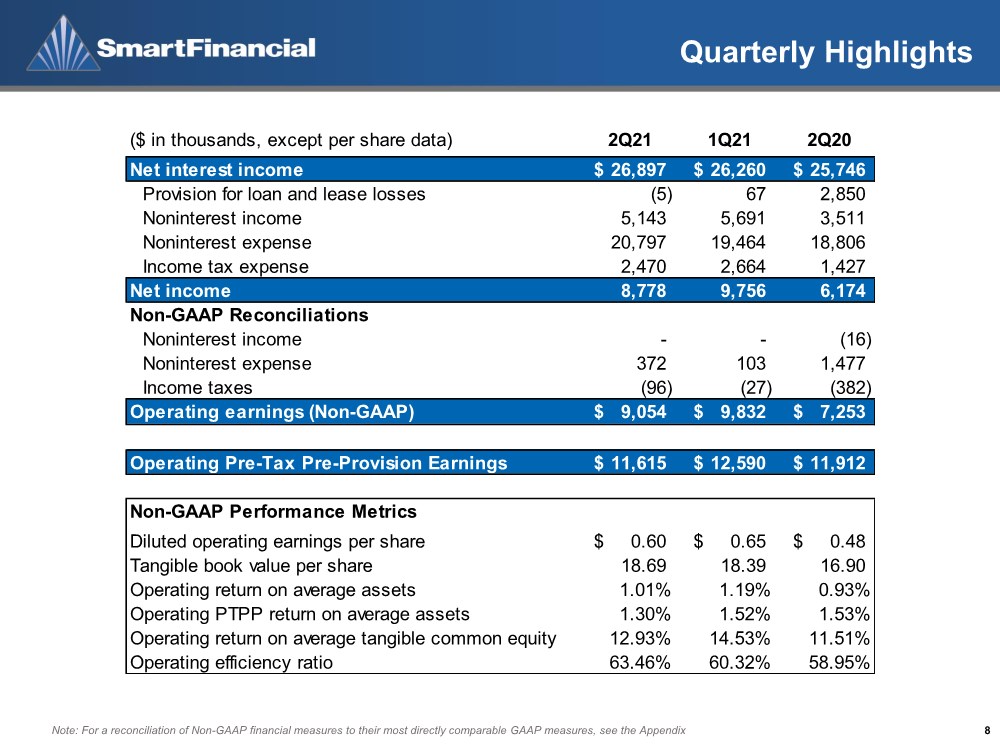
| Quarterly Highlights 8 Note: For a reconciliation of Non-GAAP financial measures to their most directly comparable GAAP measures, see the Appendix ($ in thousands, except per share data) 2Q21 1Q21 2Q20 Net interest income 26,897 $ 26,260 $ 25,746 $ Provision for loan and lease losses (5) 67 2,850 Noninterest income 5,143 5,691 3,511 Noninterest expense 20,797 19,464 18,806 Income tax expense 2,470 2,664 1,427 Net income 8,778 9,756 6,174 Non-GAAP Reconciliations Noninterest income - - (16) Noninterest expense 372 103 1,477 Income taxes (96) (27) (382) Operating earnings (Non-GAAP) 9,054 $ 9,832 $ 7,253 $ Operating Pre-Tax Pre-Provision Earnings 11,615 $ 12,590 $ 11,912 $ Non-GAAP Performance Metrics Diluted operating earnings per share 0.60 $ 0.65 $ 0.48 $ Tangible book value per share 18.69 18.39 16.90 Operating return on average assets 1.01% 1.19% 0.93% Operating PTPP return on average assets 1.30% 1.52% 1.53% Operating return on average tangible common equity 12.93% 14.53% 11.51% Operating efficiency ratio 63.46% 60.32% 58.95% |
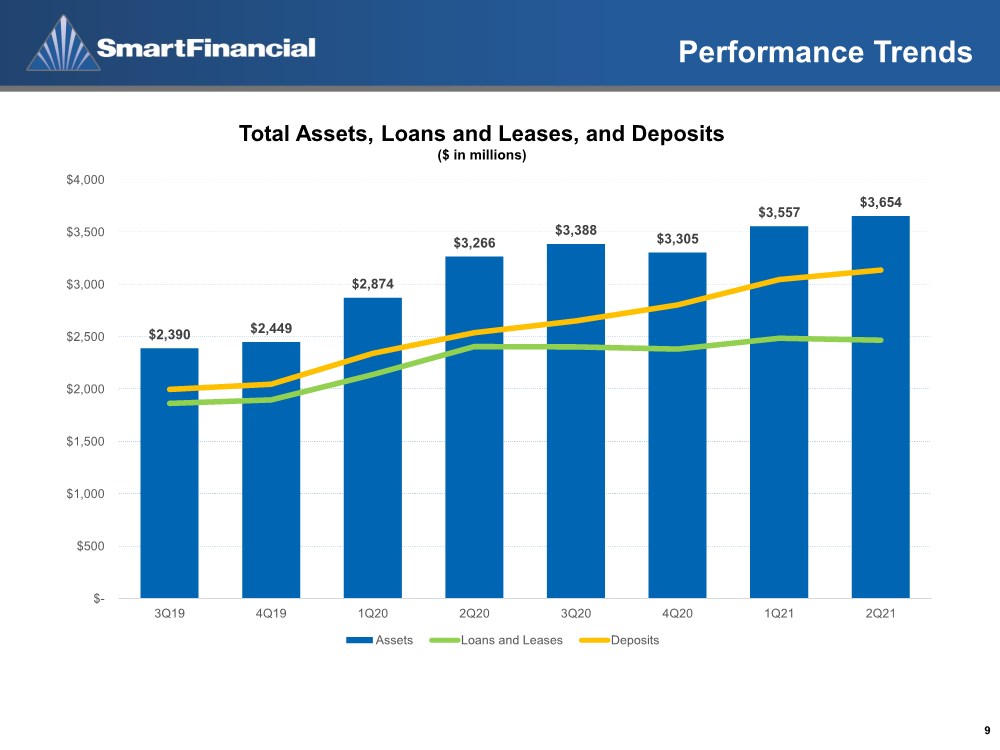
| Performance Trends 9 $2,390 $2,449 $2,874 $3,266 $3,388 $3,305 $3,557 $3,654 $- $500 $1,000 $1,500 $2,000 $2,500 $3,000 $3,500 $4,000 3Q19 4Q19 1Q20 2Q20 3Q20 4Q20 1Q21 2Q21 Assets Loans and Leases Deposits Total Assets, Loans and Leases, and Deposits ($ in millions) |
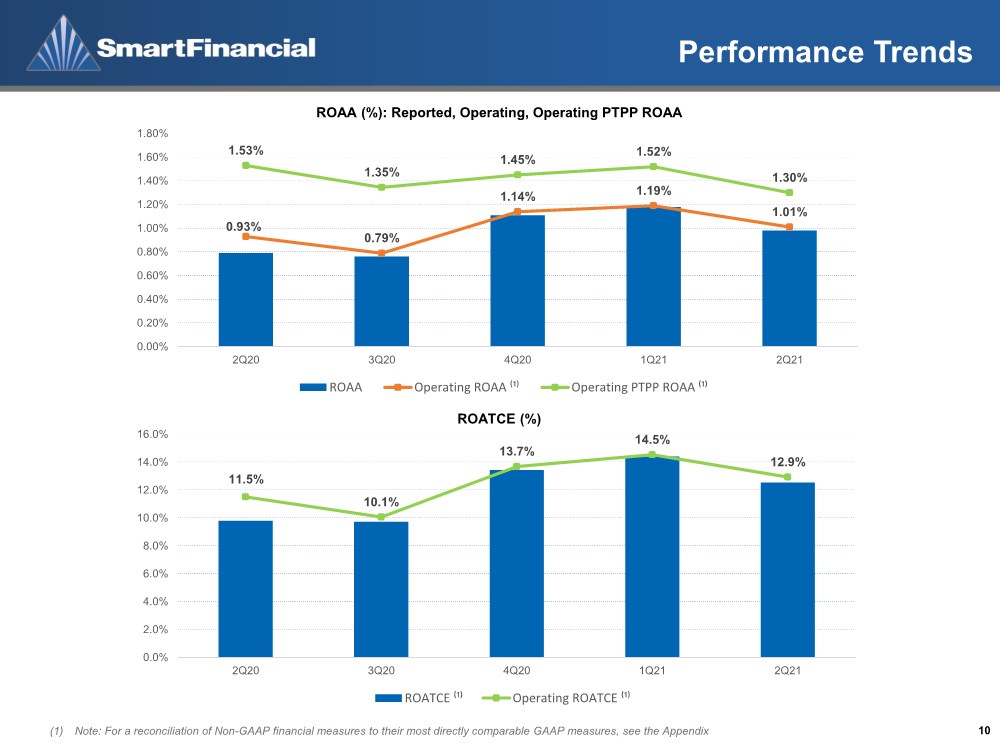
| Performance Trends 10 (1) Note: For a reconciliation of Non-GAAP financial measures to their most directly comparable GAAP measures, see the Appendix 0.93% 0.79% 1.14% 1.19% 1.01% 1.53% 1.35% 1.45% 1.52% 1.30% 0.00% 0.20% 0.40% 0.60% 0.80% 1.00% 1.20% 1.40% 1.60% 1.80% 2Q20 3Q20 4Q20 1Q21 2Q21 ROAA Operating ROAA ⁽¹⁾ Operating PTPP ROAA ⁽¹⁾ 11.5% 10.1% 13.7% 14.5% 12.9% 0.0% 2.0% 4.0% 6.0% 8.0% 10.0% 12.0% 14.0% 16.0% 2Q20 3Q20 4Q20 1Q21 2Q21 ROATCE ⁽¹⁾ Operating ROATCE ⁽¹⁾ ROAA (%): Reported, Operating, Operating PTPP ROAA ROATCE (%) |
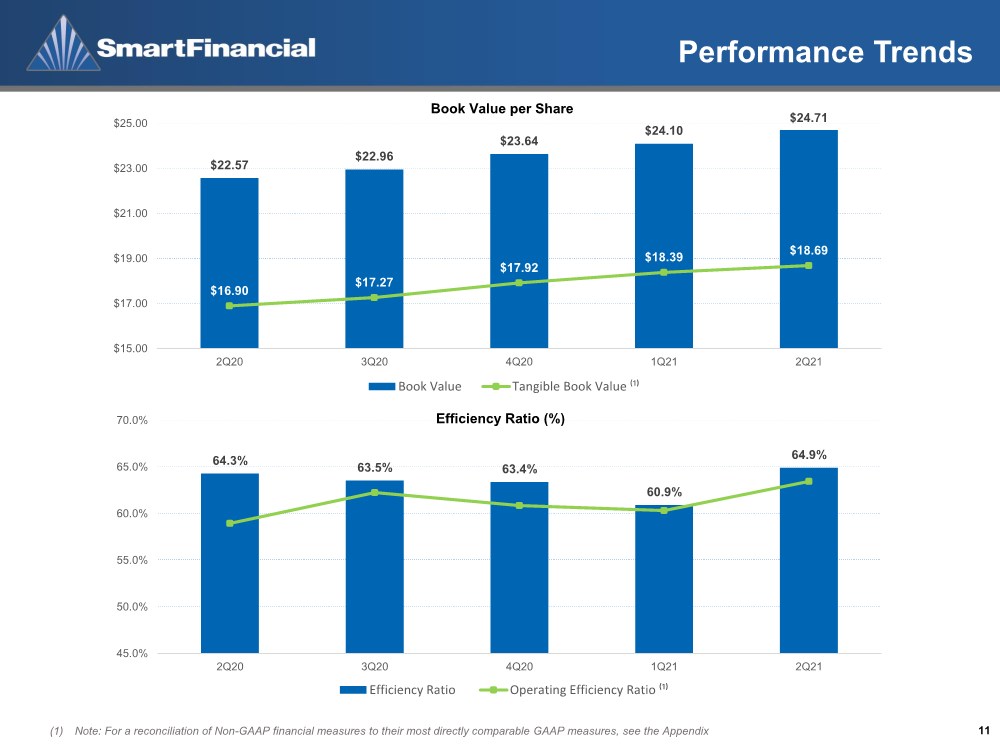
| Performance Trends 11 (1) Note: For a reconciliation of Non-GAAP financial measures to their most directly comparable GAAP measures, see the Appendix $22.57 $22.96 $23.64 $24.10 $24.71 $16.90 $17.27 $17.92 $18.39 $18.69 $15.00 $17.00 $19.00 $21.00 $23.00 $25.00 2Q20 3Q20 4Q20 1Q21 2Q21 Book Value Tangible Book Value ⁽¹⁾ 64.3% 63.5% 63.4% 60.9% 64.9% 45.0% 50.0% 55.0% 60.0% 65.0% 70.0% 2Q20 3Q20 4Q20 1Q21 2Q21 Efficiency Ratio Operating Efficiency Ratio ⁽¹⁾ Book Value per Share Efficiency Ratio (%) |
| 2Q20 C&I C&D CRE, OO CRE, NOO Consumer RE Leases & Other Noninterest Demand Interest-Bearing Demand Money Market and Savings Time Deposits 26% 12% 19% 23% 19% 1% 20% 12% 20% 27% 18% 3% 25% 19% 30% 26% 26% 22% 36% 16% $2.5 $2.4 $3.1 Balance Sheet / Margin Complexion 2Q20 2Q20 2Q21 2Q21 Deposit Composition ($ in billions) Loan Composition ($ in billions) 3.63% 3.39% 3.57% 3.48% 3.29% 4.87% 4.71% 4.72% 4.67% 4.52% 0.00% 1.00% 2.00% 3.00% 4.00% 5.00% 6.00% 2Q20 3Q20 4Q20 1Q21 2Q21 Net Interest Margin (FTE) Loan and Lease Yield Cost of Funds Interest Bearing Liabilities Net Interest Margin Select Average Yields and Rates 12 2Q21 1Q21 Change Loans and Leases, less accretion & PPP fees 4.06% 4.00% 0.06% Accretion 0.12% 0.27% (0.15%) PPP Fees 0.34% 0.40% (0.06%) Loans and Leases including fees 4.52% 4.67% (0.15%) Interest earning asset yields 3.65% 3.88% (0.23%) Total interest-bearing deposits 0.39% 0.44% (0.05%) Net interest margin (FTE) 3.29% 3.48% (0.19%) Cost of Total Deposits 0.29% 0.33% (0.04%) Cost of Funds 0.37% 0.41% (0.04%) |

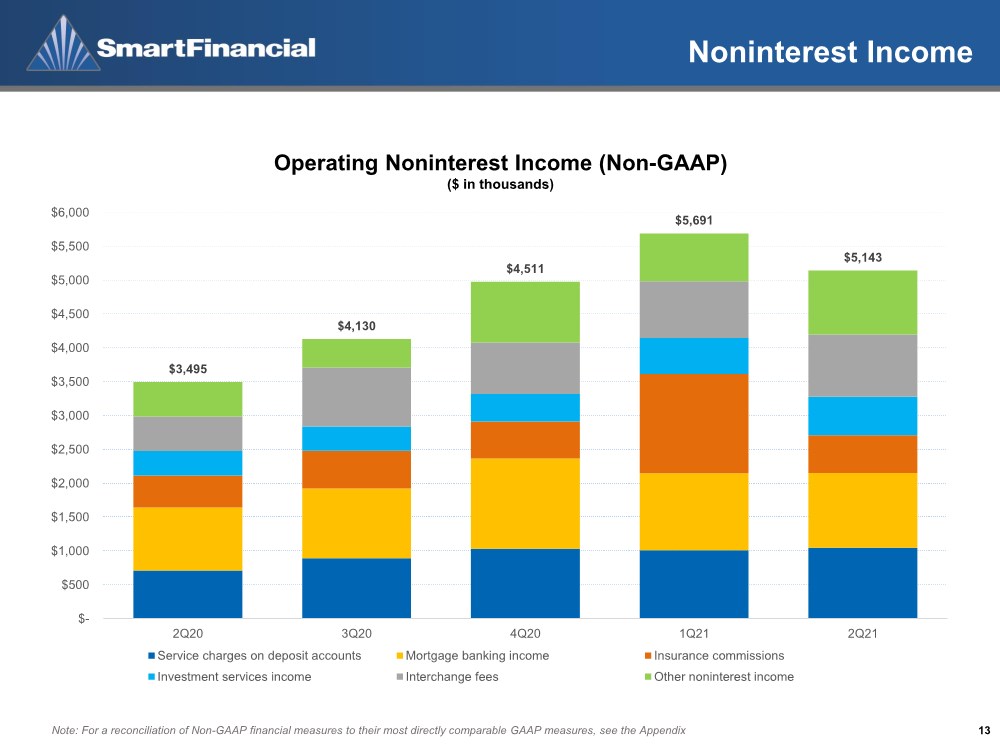
| Noninterest Income 13 Note: For a reconciliation of Non-GAAP financial measures to their most directly comparable GAAP measures, see the Appendix $3,495 $4,130 $4,511 $5,691 $5,143 $- $500 $1,000 $1,500 $2,000 $2,500 $3,000 $3,500 $4,000 $4,500 $5,000 $5,500 $6,000 2Q20 3Q20 4Q20 1Q21 2Q21 Service charges on deposit accounts Mortgage banking income Insurance commissions Investment services income Interchange fees Other noninterest income Operating Noninterest Income (Non-GAAP) ($ in thousands) |
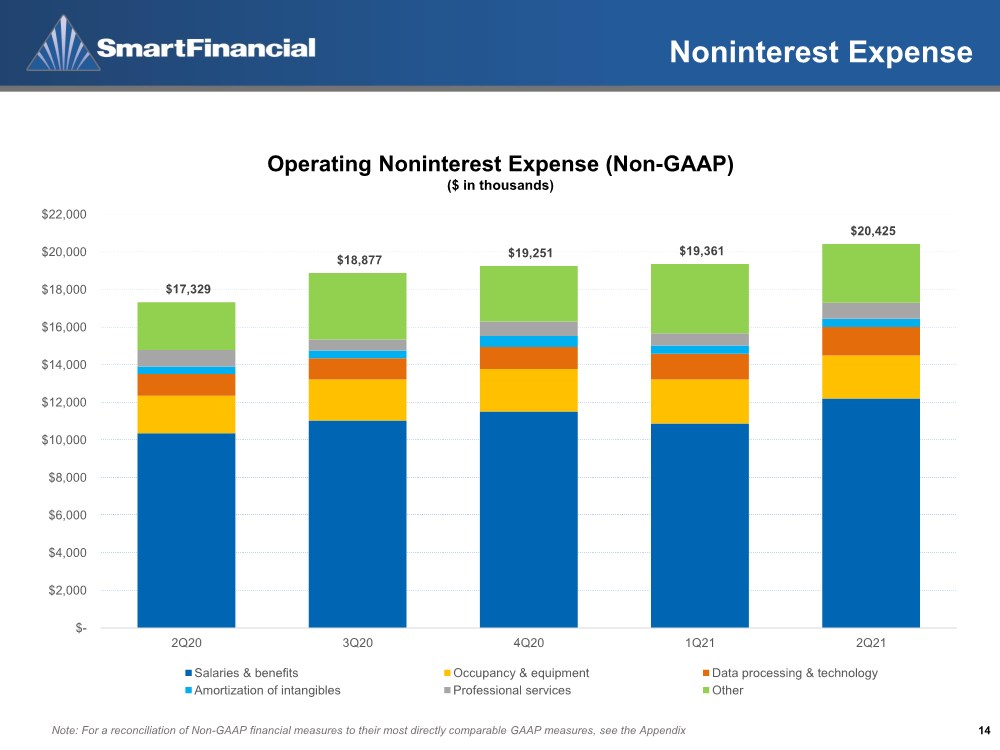
| Noninterest Expense 14 Note: For a reconciliation of Non-GAAP financial measures to their most directly comparable GAAP measures, see the Appendix Operating Noninterest Expense (Non-GAAP) ($ in thousands) $17,329 $18,877 $19,251 $19,361 $20,425 $- $2,000 $4,000 $6,000 $8,000 $10,000 $12,000 $14,000 $16,000 $18,000 $20,000 $22,000 2Q20 3Q20 4Q20 1Q21 2Q21 Salaries & benefits Occupancy & equipment Data processing & technology Amortization of intangibles Professional services Other |
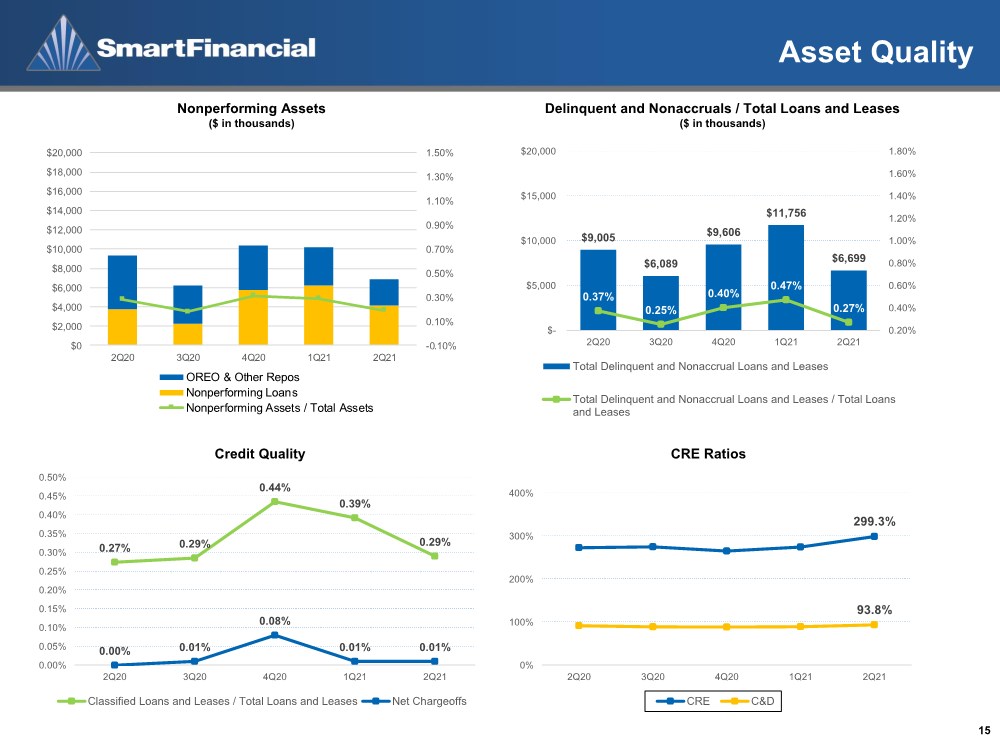
| Asset Quality 15 Credit Quality $9,005 $6,089 $9,606 $11,756 $6,699 0.37% 0.25% 0.40% 0.47% 0.27% 0.20% 0.40% 0.60% 0.80% 1.00% 1.20% 1.40% 1.60% 1.80% $- $5,000 $10,000 $15,000 $20,000 2Q20 3Q20 4Q20 1Q21 2Q21 Total Delinquent and Nonaccrual Loans and Leases Total Delinquent and Nonaccrual Loans and Leases / Total Loans and Leases Delinquent and Nonaccruals / Total Loans and Leases ($ in thousands) 0.27% 0.29% 0.44% 0.39% 0.29% 0.00% 0.01% 0.08% 0.01% 0.01% 0.00% 0.05% 0.10% 0.15% 0.20% 0.25% 0.30% 0.35% 0.40% 0.45% 0.50% 2Q20 3Q20 4Q20 1Q21 2Q21 Classified Loans and Leases / Total Loans and Leases Net Chargeoffs Nonperforming Assets ($ in thousands) 299.3% 93.8% 0% 100% 200% 300% 400% 2Q20 3Q20 4Q20 1Q21 2Q21 CRE C&D CRE Ratios -0.10% 0.10% 0.30% 0.50% 0.70% 0.90% 1.10% 1.30% 1.50% $0 $2,000 $4,000 $6,000 $8,000 $10,000 $12,000 $14,000 $16,000 $18,000 $20,000 2Q20 3Q20 4Q20 1Q21 2Q21 OREO & Other Repos Nonperforming Loans Nonperforming Assets / Total Assets |
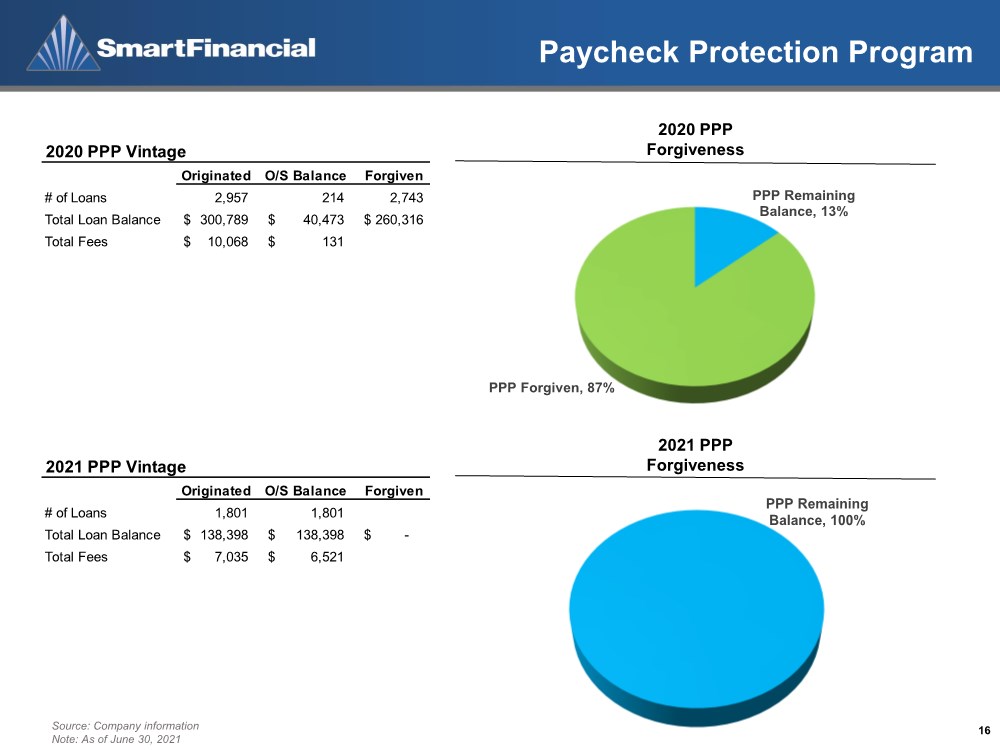
| PPP Remaining Balance, 13% PPP Forgiven, 87% Paycheck Protection Program 16 Source: Company information Note: As of June 30, 2021 2020 PPP Forgiveness 2021 PPP Forgiveness Originated O/S Balance Forgiven # of Loans 2,957 214 2,743 Total Loan Balance 300,789 $ 40,473 $ 260,316 $ Total Fees 10,068 $ 131 $ 2020 PPP Vintage Originated O/S Balance Forgiven # of Loans 1,801 1,801 Total Loan Balance 138,398 $ 138,398 $ - $ Total Fees 7,035 $ 6,521 $ 2021 PPP Vintage PPP Remaining Balance, 100% |
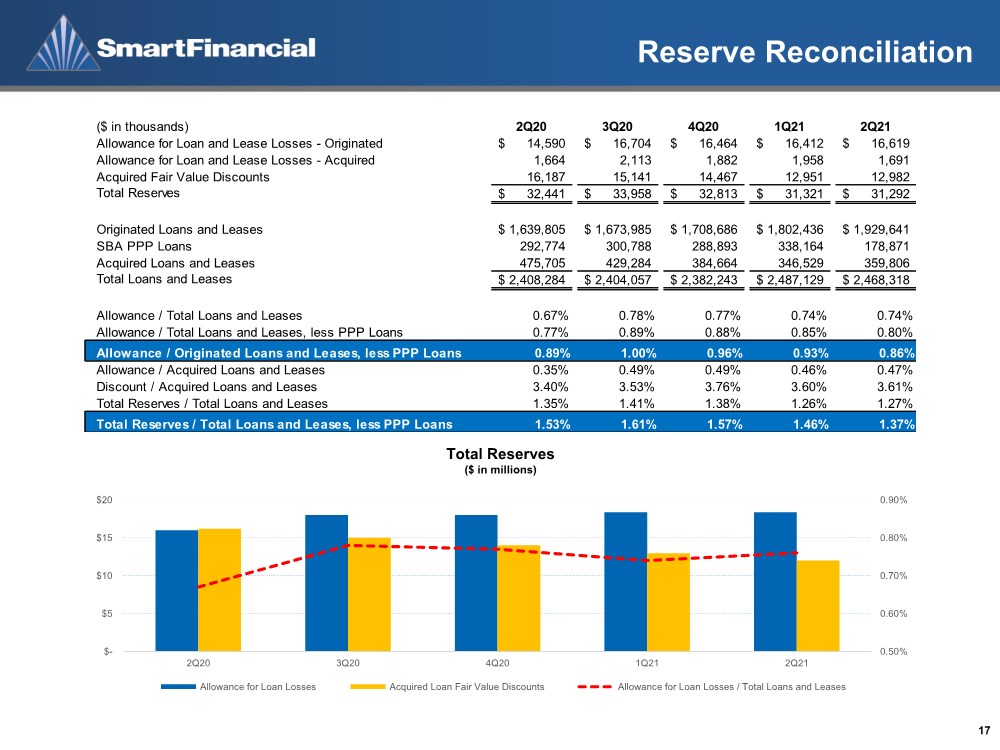
| Reserve Reconciliation 17 0.50% 0.60% 0.70% 0.80% 0.90% $- $5 $10 $15 $20 2Q20 3Q20 4Q20 1Q21 2Q21 Allowance for Loan Losses Acquired Loan Fair Value Discounts Allowance for Loan Losses / Total Loans and Leases Total Reserves ($ in millions) ($ in thousands) 2Q20 3Q20 4Q20 1Q21 2Q21 Allowance for Loan and Lease Losses - Originated 14,590 $ 16,704 $ 16,464 $ 16,412 $ 16,619 $ Allowance for Loan and Lease Losses - Acquired 1,664 2,113 1,882 1,958 1,691 Acquired Fair Value Discounts 16,187 15,141 14,467 12,951 12,982 Total Reserves 32,441 $ 33,958 $ 32,813 $ 31,321 $ 31,292 $ Originated Loans and Leases 1,639,805 $ 1,673,985 $ 1,708,686 $ 1,802,436 $ 1,929,641 $ SBA PPP Loans 292,774 300,788 288,893 338,164 178,871 Acquired Loans and Leases 475,705 429,284 384,664 346,529 359,806 Total Loans and Leases 2,408,284 $ 2,404,057 $ 2,382,243 $ 2,487,129 $ 2,468,318 $ Allowance / Total Loans and Leases 0.67% 0.78% 0.77% 0.74% 0.74% Allowance / Total Loans and Leases, less PPP Loans 0.77% 0.89% 0.88% 0.85% 0.80% Allowance / Originated Loans and Leases, less PPP Loans 0.89% 1.00% 0.96% 0.93% 0.86% Allowance / Acquired Loans and Leases 0.35% 0.49% 0.49% 0.46% 0.47% Discount / Acquired Loans and Leases 3.40% 3.53% 3.76% 3.60% 3.61% Total Reserves / Total Loans and Leases 1.35% 1.41% 1.38% 1.26% 1.27% Total Reserves / Total Loans and Leases, less PPP Loans 1.53% 1.61% 1.57% 1.46% 1.37% |
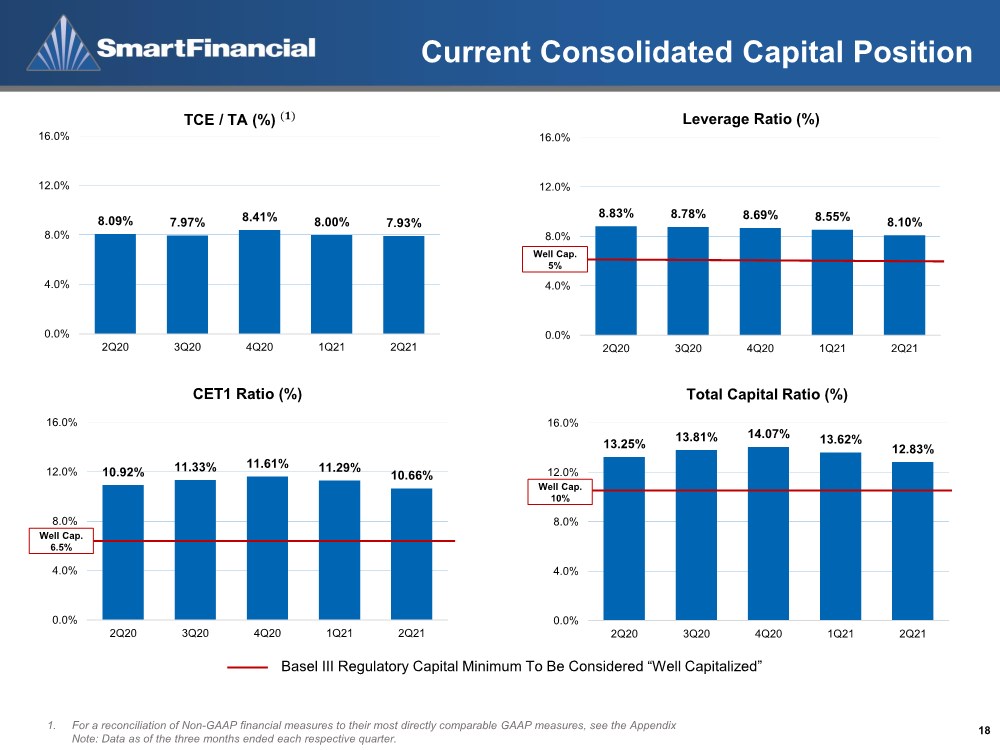
| Current Consolidated Capital Position 18 CET1 Ratio (%) Basel III Regulatory Capital Minimum To Be Considered “Well Capitalized” 1. For a reconciliation of Non-GAAP financial measures to their most directly comparable GAAP measures, see the Appendix Note: Data as of the three months ended each respective quarter. 8.09% 7.97% 8.41% 8.00% 7.93% 0.0% 4.0% 8.0% 12.0% 16.0% 2Q20 3Q20 4Q20 1Q21 2Q21 TCE / TA (%) (ퟏ) 8.83% 8.78% 8.69% 8.55% 8.10% 0.0% 4.0% 8.0% 12.0% 16.0% 2Q20 3Q20 4Q20 1Q21 2Q21 Leverage Ratio (%) Well Cap. 5% 10.92% 11.33% 11.61% 11.29% 10.66% 0.0% 4.0% 8.0% 12.0% 16.0% 2Q20 3Q20 4Q20 1Q21 2Q21 Well Cap. 6.5% 13.25% 13.81% 14.07% 13.62% 12.83% 0.0% 4.0% 8.0% 12.0% 16.0% 2Q20 3Q20 4Q20 1Q21 2Q21 Total Capital Ratio (%) Well Cap. 10% |
| Appendix |
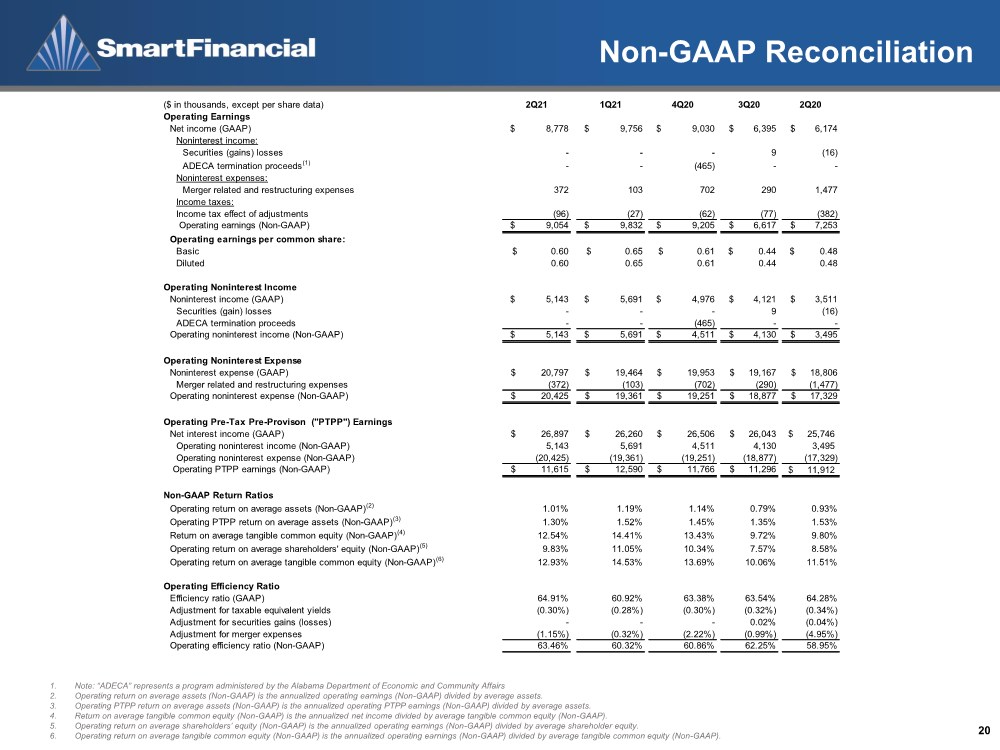
| Non-GAAP Reconciliation 20 1. Note: “ADECA” represents a program administered by the Alabama Department of Economic and Community Affairs 2. Operating return on average assets (Non-GAAP) is the annualized operating earnings (Non-GAAP) divided by average assets. 3. Operating PTPP return on average assets (Non-GAAP) is the annualized operating PTPP earnings (Non-GAAP) divided by average assets. 4. Return on average tangible common equity (Non-GAAP) is the annualized net income divided by average tangible common equity (Non-GAAP). 5. Operating return on average shareholders’ equity (Non-GAAP) is the annualized operating earnings (Non-GAAP) divided by average shareholder equity. 6. Operating return on average tangible common equity (Non-GAAP) is the annualized operating earnings (Non-GAAP) divided by average tangible common equity (Non-GAAP). ($ in thousands, except per share data) 2Q21 1Q21 4Q20 3Q20 2Q20 Operating Earnings Net income (GAAP) $ 8,778 $ 9,756 $ 9,030 $ 6,395 $ 6,174 Noninterest income: Securities (gains) losses - - - 9 (16) ADECA termination proceeds(1) - - (465) - - Noninterest expenses: Merger related and restructuring expenses 372 103 702 290 1,477 Income taxes: Income tax effect of adjustments (96) (27) (62) (77) (382) Operating earnings (Non-GAAP) $ 9,054 $ 9,832 $ 9,205 $ 6,617 $ 7,253 Operating earnings per common share: Basic $ 0.60 $ 0.65 $ 0.61 $ 0.44 $ 0.48 Diluted 0.60 0.65 0.61 0.44 0.48 Operating Noninterest Income Noninterest income (GAAP) $ 5,143 $ 5,691 $ 4,976 $ 4,121 $ 3,511 Securities (gain) losses - - - 9 (16) ADECA termination proceeds - - (465) - - Operating noninterest income (Non-GAAP) $ 5,143 $ 5,691 $ 4,511 $ 4,130 $ 3,495 Operating Noninterest Expense Noninterest expense (GAAP) $ 20,797 $ 19,464 $ 19,953 $ 19,167 $ 18,806 Merger related and restructuring expenses (372) (103) (702) (290) (1,477) Operating noninterest expense (Non-GAAP) $ 20,425 $ 19,361 $ 19,251 $ 18,877 $ 17,329 Operating Pre-Tax Pre-Provison ("PTPP") Earnings Net interest income (GAAP) $ 26,897 $ 26,260 $ 26,506 $ 26,043 25,746 $ Operating noninterest income (Non-GAAP) 5,143 5,691 4,511 4,130 3,495 Operating noninterest expense (Non-GAAP) (20,425) (19,361) (19,251) (18,877) (17,329) Operating PTPP earnings (Non-GAAP) $ 11,615 $ 12,590 $ 11,766 $ 11,296 11,912 $ Non-GAAP Return Ratios Operating return on average assets (Non-GAAP)(2) 1.01% 1.19% 1.14% 0.79% 0.93% Operating PTPP return on average assets (Non-GAAP)(3) 1.30% 1.52% 1.45% 1.35% 1.53% Return on average tangible common equity (Non-GAAP)(4) 12.54% 14.41% 13.43% 9.72% 9.80% Operating return on average shareholders' equity (Non-GAAP)(5) 9.83% 11.05% 10.34% 7.57% 8.58% Operating return on average tangible common equity (Non-GAAP)(6) 12.93% 14.53% 13.69% 10.06% 11.51% Operating Efficiency Ratio Efficiency ratio (GAAP) 64.91% 60.92% 63.38% 63.54% 64.28% Adjustment for taxable equivalent yields (0.30%) (0.28%) (0.30%) (0.32%) (0.34%) Adjustment for securities gains (losses) --- 0.02% (0.04%) Adjustment for merger expenses (1.15%) (0.32%) (2.22%) (0.99%) (4.95%) Operating efficiency ratio (Non-GAAP) 63.46% 60.32% 60.86% 62.25% 58.95% |
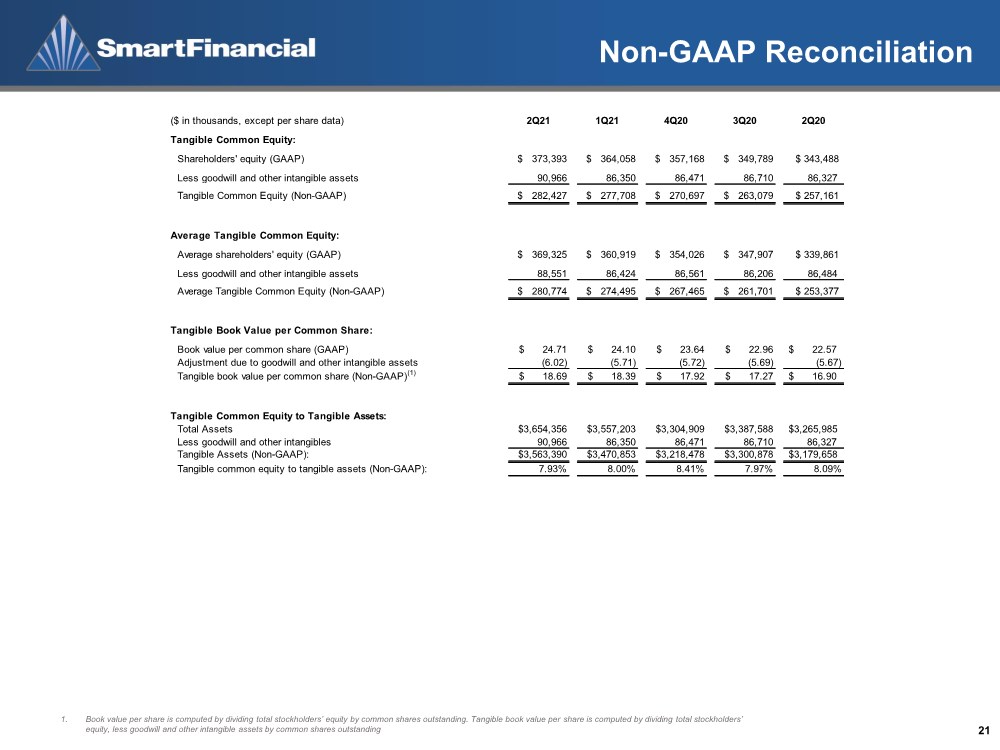
| Non-GAAP Reconciliation 21 1. Book value per share is computed by dividing total stockholders’ equity by common shares outstanding. Tangible book value per share is computed by dividing total stockholders’ equity, less goodwill and other intangible assets by common shares outstanding ($ in thousands, except per share data) 2Q21 1Q21 4Q20 3Q20 2Q20 Tangible Common Equity: Shareholders' equity (GAAP) $ 373,393 $ 364,058 $ 357,168 $ 349,789 $ 343,488 Less goodwill and other intangible assets 90,966 86,350 86,471 86,710 86,327 Tangible Common Equity (Non-GAAP) $ 282,427 $ 277,708 $ 270,697 $ 263,079 $ 257,161 Average Tangible Common Equity: Average shareholders' equity (GAAP) $ 369,325 $ 360,919 $ 354,026 $ 347,907 $ 339,861 Less goodwill and other intangible assets 88,551 86,424 86,561 86,206 86,484 Average Tangible Common Equity (Non-GAAP) $ 280,774 $ 274,495 $ 267,465 $ 261,701 $ 253,377 Tangible Book Value per Common Share: Book value per common share (GAAP) $ 24.71 $ 24.10 $ 23.64 $ 22.96 $ 22.57 Adjustment due to goodwill and other intangible assets (6.02) (5.71) (5.72) (5.69) (5.67) Tangible book value per common share (Non-GAAP)(1) $ 18.69 $ 18.39 $ 17.92 $ 17.27 $ 16.90 Tangible Common Equity to Tangible Assets: Total Assets $3,654,356 $3,557,203 $3,304,909 $3,387,588 $3,265,985 Less goodwill and other intangibles 90,966 86,350 86,471 86,710 86,327 Tangible Assets (Non-GAAP): $3,563,390 $3,470,853 $3,218,478 $3,300,878 $3,179,658 Tangible common equity to tangible assets (Non-GAAP): 7.93% 8.00% 8.41% 7.97% 8.09% |
| Investor Contact 22 Billy Carroll President & CEO 865.868.0613 billy.carroll@smartbank.com Miller Welborn Chairman 423.385.3067 miller.welborn@smartbank.com 5401 Kingston Pike, Suite 600 Knoxville, TN 37919 |
|