Attached files
| file | filename |
|---|---|
| 8-K - 8-K - UNITY BANCORP INC /NJ/ | unty-20210714x8k.htm |
Exhibit 99.1
For Immediate Release | News Media & Financial Analyst Contact: |
Unity Bancorp, Inc. (NSDQ: UNTY) | George Boyan, EVP and CFO |
July 14, 2021 | (908) 713-4565 |
 Unity Bancorp Reports
Quarterly Earnings of $8.4 Million
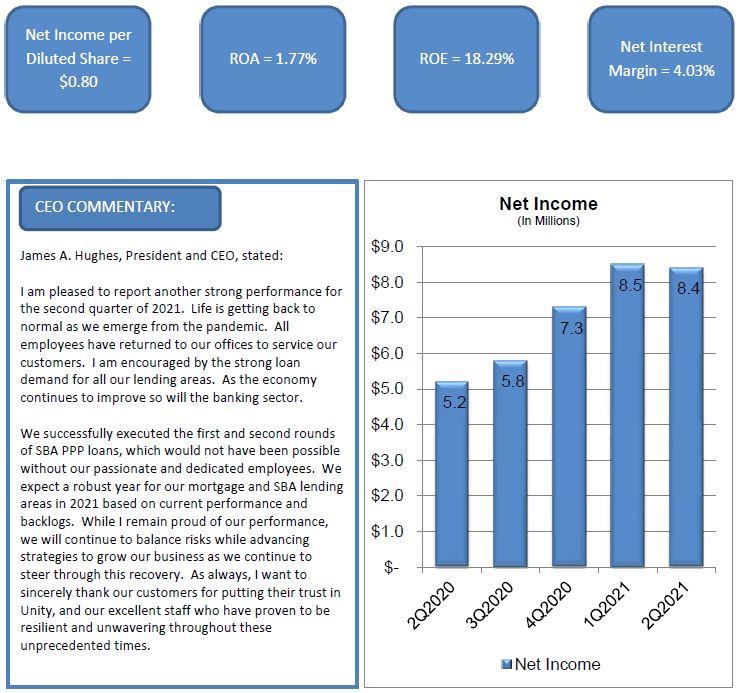
Clinton, NJ, July 14, 2021 - Unity Bancorp, Inc. (NASDAQ: UNTY), parent company of Unity Bank, reported net income of $8.4 million, or $0.80 per diluted share, for the quarter ended June 30, 2021, a 62.8% increase compared to net income of $5.2 million, or $0.47 per diluted share for the prior year’s second quarter. For the six months ended June 30, 2021, Unity reported net income of $16.9 million, or $1.60 per diluted share, a 60.5% increase compared to $10.5 million or $0.96 per diluted share for the prior year’s period.
Second Quarter Earnings Highlights
| ● | Net interest income, our primary driver of earnings, increased $2.9 million to $18.4 million for the quarter ended June 30, 2021, compared to $15.5 million for the prior year’s quarter, due to SBA PPP loans, commercial loan growth and a reduction in the cost of funds. |
| ● | Net interest margin (“NIM”) increased to 4.03% for the quarter ended June 30, 2021, compared to 3.73% for the prior year’s quarter and decreased six basis points from 4.09% in the prior sequential quarter ended March 31, 2021. |
| ● | The Company reported no provision for loan losses for the quarter ended June 30, 2021 compared to the prior year’s quarter. The provision for loan losses decreased $3.5 million for the six months ended June 30, 2021 compared to the prior year’s period. The decreases were due to an improved economic environment. |
| ● | Noninterest income increased $84 thousand to $2.9 million compared to the prior year’s quarter, primarily due to increased gains on SBA loan sales. Noninterest income decreased $831 thousand compared to the prior sequential quarter, primarily due a decrease in sales of residential mortgage loans. For the quarter ended June 30, 2021 SBA loan sales totaled $3.6 million with net gains of $496 thousand. |
| ● | Noninterest expense increased $1.3 million to $10.5 million compared to the prior year’s quarter and increased $658 thousand compared to the prior sequential quarter. The increases were primarily due to increased expenses related to a deferred compensation adjustment and increased advertising expenses. |
| ● | The effective tax rate was 22.7% compared to 22.3% in the prior year’s quarter. |
Balance Sheet Highlights
| ● | Total loans increased $26.2 million, or 1.6%, from year-end 2020 to $1.7 billion at June 30, 2021. The increase was primarily due to increases in commercial, SBA PPP and residential construction loans. Residential mortgage loans decreased 9.7% due to prepayments. |
| ● | Total deposits increased $36.4 million, or 2.3%, from year-end 2020 to $1.6 billion at June 30, 2021. The Company’s deposit composition at June 30, 2021 consisted of 32.5% in savings deposits, 30.7% in noninterest-bearing demand deposits, 23.7% in time deposits and 13.1% in interest-bearing demand deposits. |
| ● | Borrowed funds decreased $35.0 million to $165.0 million at June 30, 2021, due to decreased FHLB advances. |
| ● | Shareholders’ equity was $188.8 million at June 30, 2021 compared to $173.9 million at year-end 2020. |
| ● | Book value per common share was $18.12 as of June 30, 2021. During the second quarter, the Company repurchased 40,434 shares of common stock for a total cost of $874 thousand. |
| ● | At June 30, 2021, the Community Bank Leverage Ratio was 10.11%. |
| ● | Net nonperforming assets were $9.5 million at June 30, 2021, compared to $11.7 million at December 31, 2020. Most of the nonperforming assets are residential loans, the resolution of which has been impacted by foreclosure restrictions due to COVID-19. The allowance to total loans ratio excluding SBA PPP loans was 1.50% at June 30, 2021. |
Paycheck Protection Program Loans
As of June 30, 2021, the Company funded 955 Small Business Administration Paycheck Protection Program Round 2 loans, totaling $101.0 million. This is in addition to the 1,224 SBA PPP loans, totaling $143.0 million funded during the year ended December 31, 2020.
The table below summarizes SBA PPP loans as of June 30, 2021:
| | Round 1 | | Round 2 | | Total | ||||||
| | $ | | # | | $ | | # | | $ | | # |
Funded | | 143,001 | | 1,224 | | 101,048 | | 955 | | 244,049 | | 2,179 |
Forgiven | | 105,106 | | 901 | | 6,568 | | 17 | | 111,674 | | 918 |
Outstanding | | 37,895 | | 323 | | 94,480 | | 938 | | 132,375 | | 1,261 |
Loan Deferrals
The Bank worked with borrowers who were unable to meet their contractual obligations because of the effects of COVID-19. By June 30, 2021, $5.7 million in loans were on deferral. Some loan deferrals are expected for the duration of 2021.
The table below summarizes loan deferrals as of June 30, 2021:
(In thousands) | | Total Loan Portfolio balance | | Full Deferrals | | Principal Only Deferrals | | Total Loans in Deferral | | % Deferrals to Total Loans | ||||
SBA loans held for sale | | $ | 11,314 | | $ | — | | $ | — | | $ | — | | 0.00% |
SBA loans held for investment | | | 38,114 | | | — | | | — | | | — | | 0.00% |
SBA PPP loans | | | 132,375 | | | — | | | — | | | — | | 0.00% |
Commercial loans | |
| 885,566 | |
| — | |
| 5,508 | |
| 5,508 | | 0.62% |
Residential mortgage loans | |
| 422,188 | |
| 231 | |
| — | |
| 231 | | 0.05% |
Consumer loans | |
| 64,557 | |
| — | |
| — | |
| — | | 0.00% |
Residential construction loans | |
| 99,874 | |
| — | |
| — | |
| — | | 0.00% |
Total loans | | $ | 1,653,988 | | $ | 231 | | $ | 5,508 | | $ | 5,739 | | 0.35% |
Other Highlights
Unity Bank has been named one of the 2021 Best Places to Work in New Jersey – the only bank in New Jersey to make the prestigious list. It is the fifth year in a row that Unity has been honored by the survey and awards program, which identifies, recognizes and honors the top places of employment in New Jersey that benefit the state's economy, workforce and businesses.
Unity Bank donated $50,000 to St. Jude Children’s Research Hospital® as part of the Inspiration4 campaign, a $200 million fundraising initiative inspired by the world’s first all-civilian mission to space. Jared Isaacman, Founder and Chief Executive Officer of Shift4 Payments (NYSE: FOUR), headquartered in Allentown, Pa., is funding the historic three-day journey in space to support the lifesaving mission of St. Jude: Finding cures. Saving children.®
Unity Bank was the top ranked New Jersey community bank on the recently published American Banker magazine list of the Top 200 Publicly Traded Community Banks with less than $2 billion in assets. Unity was ranked 20th nationally on the respected industry list, which reviewed 511 institutions throughout the U.S.
On May 21, 2021, the Company announced a cash dividend of $0.09 per common share, an increase of 12.5%, payable on June 25, 2021, to shareholders of record as of June 11, 2021.
Unity Bancorp, Inc. is a financial service organization headquartered in Clinton, New Jersey, with approximately $2.0 billion in assets and $1.6 billion in deposits. Unity Bank provides financial services to retail, corporate and small business customers through its 19 retail service centers located in Bergen, Hunterdon, Middlesex, Somerset, Union and Warren Counties in New Jersey and Northampton County in Pennsylvania. For additional information about Unity, visit our website at www.unitybank.com , or call 800-618-BANK.
This news release contains certain forward-looking statements, either expressed or implied, which are provided to assist the reader in understanding anticipated future financial performance. These statements may be identified by use of the words “believe”, “expect”, “intend”, “anticipate”, “estimate”, “project” or similar expressions. These statements involve certain risks, uncertainties, estimates and assumptions made by management, which are subject to factors beyond the company’s control and could impede its ability to achieve these goals. These factors include those items included in our Annual Report on Form 10-K under the heading “Item IA-Risk Factors” as amended or supplemented by our subsequent filings with the SEC, as well as general economic conditions, trends in interest rates, the ability of our borrowers to repay their loans, our ability to manage and reduce the level of our nonperforming assets, results of regulatory exams, and the impact of COVID-19 on the Bank, its employees and customers, among other factors.
UNITY BANCORP, INC.
SUMMARY FINANCIAL HIGHLIGHTS
June 30,2021
| | | |
|
| |
|
| |
| | Jun. 30, 2021 vs. | | ||
| | | | | | | | | | | | Dec. 31, 2020 | | Jun. 30, 2020 | |
(In thousands, except percentages and per share amounts) |
| Jun. 30, 2021 |
| Dec. 31, 2020 |
| Jun. 30, 2020 |
|
| % |
| % | | |||
BALANCE SHEET DATA: | |
| | |
| | |
| | | |
| |
| |
Total assets | | $ | 1,973,311 | | $ | 2,004,818 | | $ | 1,900,774 | | | (1.6) | % | 3.8 | % |
Total deposits |
| | 1,594,316 |
| | 1,628,393 |
| | 1,483,457 |
| | (2.1) |
| 7.5 |
|
Total loans |
| | 1,653,988 |
| | 1,668,448 |
| | 1,592,507 |
| | (0.9) |
| 3.9 |
|
Total securities |
| | 37,054 |
| | 34,551 |
| | 54,888 |
| | 7.2 |
| (32.5) |
|
Total shareholders' equity |
| | 188,756 |
| | 181,186 |
| | 166,607 |
| | 4.2 |
| 13.3 |
|
Allowance for loan losses |
| | 22,801 |
| | 22,965 |
| | 20,234 |
| | (0.7) |
| 12.7 |
|
| | | | | | | | | | | | | | | |
FINANCIAL DATA - QUARTER TO DATE: |
| |
|
| |
|
| | |
| | |
| |
|
Income before provision for income taxes | | $ | 10,884 | | $ | 11,442 | | $ | 6,659 |
| | (4.9) |
| 63.4 |
|
Provision for income taxes | |
| 2,466 | |
| 2,946 | |
| 1,488 |
| | (16.3) |
| 65.7 |
|
Net income | | $ | 8,418 | | $ | 8,496 | | $ | 5,171 |
| | (0.9) |
| 62.8 |
|
| | | | | | | | | | | | | | | |
Net income per common share - Basic | | $ | 0.81 | | $ | 0.81 | | $ | 0.48 |
| | — |
| 68.8 |
|
Net income per common share - Diluted | | $ | 0.80 | | $ | 0.80 | | $ | 0.47 |
| | — |
| 70.2 |
|
| | | | | | | | | | | | | | | |
Performance ratios: | |
| | |
| | |
| |
| |
|
|
|
|
Return on average assets | |
| 1.77 | % |
| 1.85 | % |
| 1.19 | % | |
| | | |
Return on average equity | |
| 18.29 | % |
| 19.51 | % |
| 12.59 | % | |
| | | |
Efficiency ratio | |
| 49.06 | % |
| 45.74 | % |
| 50.27 | % | |
| | | |
Net interest margin | |
| 4.03 | % |
| 4.09 | % |
| 3.73 | % | |
| | | |
Noninterest expense to average assets | |
| 2.19 | % |
| 2.13 | % |
| 2.10 | % | |
| | | |
| | | | | | | | | | | | | | | |
FINANCIAL DATA - YEAR TO DATE: |
| |
|
| | |
| | |
| | |
|
|
|
Income before provision for income taxes | | $ | 22,325 | | | | | $ | 13,625 |
| | |
| 63.9 |
|
Provision for income taxes | |
| 5,411 | | | | |
| 3,086 |
| | |
| 75.3 |
|
Net income | | $ | 16,914 | | | | | $ | 10,539 |
| | |
| 60.5 |
|
| | | | | | | | | | | | | | | |
Net income per common share - Basic | | $ | 1.62 | | | | | $ | 0.97 |
| | |
| 67.0 |
|
Net income per common share - Diluted | | $ | 1.60 | | | | | $ | 0.96 |
| | |
| 66.7 |
|
| | | | | | | | | | | | | | | |
Performance ratios: | |
| | | | | |
| |
| |
|
| |
|
Return on average assets | |
| 1.81 | % | | | |
| 1.25 | % | |
| | 44.8 | |
Return on average equity | |
| 18.88 | % | | | |
| 12.91 | % | |
| | 46.2 | |
Efficiency ratio | |
| 47.39 | % | | | |
| 51.34 | % | |
| | (7.7) | |
Net interest margin | |
| 4.06 | % | | | |
| 3.82 | % | |
| | 6.3 | |
Noninterest expense to average assets | |
| 2.16 | % | | | |
| 2.19 | % | |
| | (1.4) | |
| | | | | | | | | | | | | | | |
SHARE INFORMATION: | |
| | | | | |
| |
| |
|
|
|
|
Market price per share | | $ | 22.05 | | $ | 22.00 | | $ | 14.30 |
| | 0.2 | | 54.2 |
|
Dividends paid | | $ | 0.09 | | $ | 0.08 | | $ | 0.08 |
| | 13 | | 12.5 |
|
Book value per common share | | $ | 18.12 | | $ | 17.38 | | $ | 15.53 |
| | 4.3 | | 16.7 |
|
Average diluted shares outstanding (QTD) | |
| 10,569 | |
| 10,565 | |
| 10,888 |
| | 0.0 | | (2.9) |
|
| | | | | | | | | | | | | | | |
CAPITAL RATIOS: | |
| | |
|
| |
| |
| |
|
|
|
|
Total equity to total assets | |
| 9.57 | % |
| 9.04 | % |
| 8.77 | % | |
| | | |
Community bank leverage ratio | |
| 10.11 | % |
| 10.19 | % |
| 10.01 | % | |
| | | |
| | | | | | | | | | | | | | | |
CREDIT QUALITY AND RATIOS: | |
|
| |
|
| |
|
|
| |
|
|
|
|
Nonperforming assets | | $ | 9,685 | | $ | 11,788 | | $ | 10,184 |
| | (17.8) | | (4.9) |
|
QTD net chargeoffs to QTD average loans | |
| 0.04 | % |
| 0.16 | % |
| (0.09) | % | |
| | | |
Allowance for loan losses to total loans | |
| 1.38 | % |
| 1.38 | % |
| 1.27 | % | |
| | | |
Nonperforming assets to total loans | |
| 0.59 | % |
| 0.71 | % |
| 0.59 | % | |
| | | |
Nonperforming assets to total assets | |
| 0.49 | % |
| 0.59 | % |
| 0.54 | % | |
| | | |
UNITY BANCORP, INC.
CONSOLIDATED BALANCE SHEETS
June 30,2021
|
| | |
|
| |
|
| |
| | June 30, 2021 vs. |
| ||
| | | | | | | | | | | | December 31, | | June 30, |
|
| | June 30, | | December 31, | | June 30, | | | 2020 | | 2020 | | |||
(In thousands, except percentages) |
| 2021 |
| 2020 |
| 2020 |
| | % |
| % | | |||
ASSETS | |
| | |
| | |
| | | |
| |
|
|
Cash and due from banks | | $ | 24,527 | | $ | 22,750 | | $ | 24,066 | | | 7.8 | % | 1.9 | % |
Federal funds sold and interest-bearing deposits |
| | 197,325 | | | 196,561 | | | 162,617 |
| | 0.4 | | 21.3 | |
Cash and cash equivalents |
| | 221,852 | | | 219,311 | | | 186,683 |
| | 1.2 | | 18.8 | |
Securities: |
| | | | | | | | |
| | | | | |
Securities available for sale |
| | 32,810 | | | 45,617 | | | 53,102 |
| | (28.1) | | (38.2) | |
Securities held to maturity |
| | 2,000 | | | — | | | — |
| | 100.0 | | 100.0 | |
Equity securities |
| | 2,244 | | | 1,954 | | | 1,786 |
| | 14.8 | | 25.6 | |
Total securities |
| | 37,054 | | | 47,571 | | | 54,888 |
| | (22.1) | | (32.5) | |
Loans: |
| | | | | | | | |
| | | | | |
SBA loans held for sale |
| | 11,314 | | | 9,335 | | | 10,602 |
| | 21.2 | | 6.7 | |
SBA loans held for investment |
| | 38,114 | | | 39,587 | | | 36,966 |
| | (3.7) | | 3.1 | |
SBA PPP loans | | | 132,375 | | | 118,257 | | | 136,039 | | | 11.9 | | (2.7) | |
Commercial loans |
| | 885,566 | | | 839,788 | | | 792,752 |
| | 5.5 | | 11.7 | |
Residential mortgage loans |
| | 422,188 | | | 467,586 | | | 469,987 |
| | (9.7) | | (10.2) | |
Consumer loans |
| | 64,557 | | | 66,100 | | | 68,719 |
| | (2.3) | | (6.1) | |
Residential construction loans |
| | 99,874 | | | 87,164 | | | 77,442 |
| | 14.6 | | 29.0 | |
Total loans |
| | 1,653,988 | | | 1,627,817 | | | 1,592,507 |
| | 1.6 | | 3.9 | |
Allowance for loan losses |
| | (22,801) | | | (23,105) | | | (20,234) |
| | (1.3) | | 12.7 | |
Net loans |
| | 1,631,187 | | | 1,604,712 | | | 1,572,273 |
| | 1.6 | | 3.7 | |
Premises and equipment, net |
| | 19,799 | | | 20,226 | | | 20,751 |
| | (2.1) | | (4.6) | |
Bank owned life insurance ("BOLI") |
| | 26,560 | | | 26,514 | | | 26,435 |
| | 0.2 | | 0.5 | |
Deferred tax assets |
| | 9,377 | | | 9,183 | | | 7,274 |
| | 2.1 | | 28.9 | |
Federal Home Loan Bank ("FHLB") stock |
| | 9,060 | | | 10,594 | | | 11,629 |
| | (14.5) | | (22.1) | |
Accrued interest receivable |
| | 9,486 | | | 10,429 | | | 11,039 |
| | (9.0) | | (14.1) | |
Other real estate owned ("OREO") |
| | — | | | — | | | 711 |
| | — | | (100.0) | |
Goodwill |
| | 1,516 | | | 1,516 | | | 1,516 |
| | — | | — | |
Other assets |
| | 7,420 | | | 8,858 | | | 7,575 |
| | (16.2) | | (2.0) | |
Total assets | | $ | 1,973,311 | | $ | 1,958,914 | | $ | 1,900,774 |
| | 0.7 | % | 3.8 | % |
| | | | | | | | | | | | | | | |
LIABILITIES AND SHAREHOLDERS' EQUITY | |
|
| |
|
| |
|
|
| |
|
|
| |
Liabilities: | |
|
| |
|
| |
|
|
| |
|
|
| |
Deposits: | |
|
| |
|
| |
|
|
| |
|
|
| |
Noninterest-bearing demand | | $ | 489,700 | | $ | 459,677 | | $ | 429,899 |
| | 6.5 | % | 13.9 | % |
Interest-bearing demand | |
| 208,802 | | | 204,236 | | | 154,803 |
| | 2.2 | | 34.9 | |
Savings | |
| 518,405 | | | 455,449 | | | 426,563 |
| | 13.8 | | 21.5 | |
Time, under $100,000 | | | 245,423 | | | 264,671 | | | 271,860 | | | (7.3) | | (9.7) | |
Time, $100,000 to $250,000 | | | 74,282 | | | 95,595 | | | 113,351 | | | (22.3) | | (34.5) | |
Time, $250,000 and over | |
| 57,704 | | | 78,331 | | | 86,981 |
| | (26.3) | | (33.7) | |
Total deposits | |
| 1,594,316 | | | 1,557,959 | | | 1,483,457 |
| | 2.3 | | 7.5 | |
Borrowed funds | |
| 165,000 | | | 200,000 | | | 223,000 |
| | (17.5) | | (26.0) | |
Subordinated debentures | |
| 10,310 | | | 10,310 | | | 10,310 |
| | — | | — | |
Accrued interest payable | |
| 231 | | | 248 | | | 228 |
| | (6.9) | | 1.3 | |
Accrued expenses and other liabilities | |
| 14,698 | | | 16,486 | | | 17,172 |
| | (10.8) | | (14.4) | |
Total liabilities | |
| 1,784,555 | | | 1,785,003 | | | 1,734,167 |
| | (0.0) | | 2.9 | |
Shareholders' equity: | |
| | | | | | | |
| | | | | |
Common stock | |
| 92,810 | | | 91,873 | | | 91,103 |
| | 1.0 | | 1.9 | |
Retained earnings | |
| 105,811 | | | 90,669 | | | 79,253 |
| | 16.7 | | 33.5 | |
Treasury stock, at cost | |
| (9,668) | | | (7,442) | | | (2,991) |
| | 29.9 | | 223.2 | |
Accumulated other comprehensive loss | |
| (197) | | | (1,189) | | | (758) |
| | NM* | | NM* | |
Total shareholders' equity | |
| 188,756 | | | 173,911 | | | 166,607 |
| | 8.5 | | 13.3 | |
Total liabilities and shareholders' equity | | $ | 1,973,311 | | $ | 1,958,914 | | $ | 1,900,774 |
| | 0.7 | % | 3.8 | % |
| | | | | | | | | | | | | | | |
| | | | | | | | | | | | | | | |
COMMON SHARES AT PERIOD END: | |
|
| |
|
| |
|
|
| |
|
|
| |
Shares issued | |
| 11,031 | | | 10,961 | | | 10,939 |
| |
|
|
| |
Shares outstanding | |
| 10,415 | | | 10,456 | | | 10,728 |
| |
|
|
| |
Treasury shares | |
| 615 | | | 505 | | | 211 |
| |
|
|
| |
NM=Not meaningful
UNITY BANCORP, INC.
QTD CONSOLIDATED STATEMENTS OF INCOME
June 30,2021
| | | | | | | | | | | | Jun. 30, 2021 vs. | | ||||||||
| | For the three months ended | | | Mar. 31, 2021 |
| Jun. 30, 2020 |
| |||||||||||||
(In thousands, except percentages and per share amounts) |
| Jun. 30, 2021 |
| Mar. 31, 2021 |
| Jun. 30, 2020 |
|
| $ |
| % |
| $ |
| % |
| |||||
INTEREST INCOME | |
| | |
| | |
| | | |
| | |
| |
| | |
|
|
Federal funds sold and interest-bearing deposits | | $ | 33 | | $ | 24 | | $ | 23 | | | $ | 9 |
| 37.5 | % | $ | 10 |
| 43.5 | % |
FHLB stock | |
| 53 | | | 63 | | | 79 | | |
| (10) |
| (15.9) | |
| (26) |
| (32.9) | |
Securities: | |
| | | | | | | | | |
| |
| | |
| |
| | |
Taxable | |
| 253 | | | 292 | | | 437 | | |
| (39) |
| (13.4) | |
| (184) |
| (42.1) | |
Tax-exempt | |
| 9 | | | 10 | | | 17 | | |
| (1) |
| (10) | |
| (8) |
| (47.1) | |
Total securities | |
| 262 | | | 302 | | | 454 | | |
| (40) |
| (13.2) | |
| (192) |
| (42.3) | |
Loans: | |
| | | | | | | | | |
| |
| | |
| |
| | |
SBA loans | |
| 776 | | | 783 | | | 709 | | |
| (7) |
| (0.9) | |
| 67 |
| 9.4 | |
SBA PPP loans | | | 1,748 | | | 1,730 | | | 723 | | | | 18 |
| 1.0 | | | 1,025 |
| 141.8 | |
Commercial loans | |
| 10,734 | | | 10,474 | | | 9,815 | | |
| 260 |
| 2.5 | |
| 919 |
| 9.4 | |
Residential mortgage loans | |
| 4,906 | | | 5,128 | | | 5,554 | | |
| (222) |
| (4.3) | |
| (648) |
| (11.7) | |
Consumer loans | |
| 682 | | | 857 | | | 875 | | |
| (175) |
| (20.4) | |
| (193) |
| (22.1) | |
Residential construction loans | |
| 1,486 | | | 1,215 | | | 1,046 | | |
| 271 |
| 22.3 | |
| 440 |
| 42.1 | |
Total loans | |
| 20,332 | | | 20,187 | | | 18,722 | | |
| 145 |
| 0.7 | |
| 1,610 |
| 8.6 | |
Total interest income | |
| 20,680 | | | 20,576 | | | 19,278 | | |
| 104 |
| 0.5 | |
| 1,402 |
| 7.3 | |
INTEREST EXPENSE | |
|
| |
|
| |
|
| | |
|
|
|
| |
|
|
|
| |
Interest-bearing demand deposits | |
| 307 | | | 309 | | | 329 | | |
| (2) |
| (0.6) | |
| (22) |
| (6.7) | |
Savings deposits | |
| 419 | | | 431 | | | 547 | | |
| (12) |
| (2.8) | |
| (128) |
| (23.4) | |
Time deposits | |
| 1,171 | | | 1,463 | | | 2,454 | | |
| (292) |
| (20.0) | |
| (1,283) |
| (52.3) | |
Borrowed funds and subordinated debentures | |
| 334 | | | 355 | | | 423 | | |
| (21) |
| (5.9) | |
| (89) |
| (21.0) | |
Total interest expense | |
| 2,231 | | | 2,558 | | | 3,753 | | |
| (327) |
| (12.8) | |
| (1,522) |
| (40.6) | |
Net interest income | |
| 18,449 | | | 18,018 | | | 15,525 | | |
| 431 |
| 2.4 | |
| 2,924 |
| 18.8 | |
Provision for loan losses | |
| — | | | 500 | | | 2,500 | | |
| (500) |
| (100.0) | |
| (2,500) |
| (100.0) | |
Net interest income after provision for loan losses | |
| 18,449 | | | 17,518 | | | 13,025 | | |
| 931 |
| 5.3 | |
| 5,424 |
| 41.6 | |
NONINTEREST INCOME | |
| | | | | | | | | |
|
|
|
| |
|
|
|
| |
Branch fee income | |
| 269 | | | 295 | | | 207 | | |
| (26) |
| (8.8) | |
| 62 |
| 30.0 | |
Service and loan fee income | |
| 509 | | | 625 | | | 390 | | |
| (116) |
| (18.6) | |
| 119 |
| 30.5 | |
Gain on sale of SBA loans held for sale, net | |
| 496 | | | 245 | | | 92 | | |
| 251 |
| 102.4 | |
| 404 |
| 439.1 | |
Gain on sale of mortgage loans, net | |
| 1,066 | | | 1,750 | | | 1553 | | |
| (684) |
| (39.1) | |
| (487) |
| (31.4) | |
BOLI income | |
| 133 | | | 129 | | | 154 | | |
| 4 |
| 3.1 | |
| (21) |
| (13.6) | |
Net security gains | |
| 23 | | | 310 | | | 79 | | |
| (287) |
| (92.6) | |
| (56) |
| (70.9) | |
Other income | |
| 399 | | | 372 | | | 336 | | |
| 27 |
| 7.3 | |
| 63 |
| 18.8 | |
Total noninterest income | |
| 2,895 | | | 3,726 | | | 2,811 | | |
| (831) |
| (22.3) | |
| 84 |
| 3.0 | |
NONINTEREST EXPENSE | |
| | | | | | | | | |
|
|
|
| |
|
|
|
| |
Compensation and benefits | |
| 6,333 | | | 6,063 | | | 5,553 | | |
| 270 |
| 4.5 | |
| 780 |
| 14.0 | |
Processing and communications | |
| 750 | | | 807 | | | 769 | | |
| (57) |
| (7.1) | |
| (19) |
| (2.5) | |
Furniture and equipment | |
| 659 | | | 649 | | | 641 | | |
| 10 |
| 1.5 | |
| 18 |
| 2.8 | |
Occupancy | |
| 631 | | | 706 | | | 630 | | |
| (75) |
| (10.6) | |
| 1 |
| 0.2 | |
Professional services | |
| 339 | | | 380 | | | 261 | | |
| (41) |
| (10.8) | |
| 78 |
| 29.9 | |
BSA expenses | | | 282 | | | 168 | | | 488 | | | | 114 |
| 67.9 | | | (206) |
| (42.2) | |
Other loan expenses | |
| 165 | | | 143 | | | 168 | | |
| 22 |
| 15.4 | |
| (3) |
| (1.8) | |
Loan collection & OREO expenses (recoveries) | |
| 54 | | | (49) | | | 1 | | |
| 103 |
| (210.2) | |
| 53 |
| 5,300.0 | |
Deposit insurance | |
| 225 | | | 214 | | | 159 | | |
| 11 |
| 5 | |
| 66 |
| 41.5 | |
Advertising | |
| 403 | | | 268 | | | 207 | | |
| 135 |
| 50.4 | |
| 196 |
| 94.7 | |
Director fees | |
| 204 | | | 208 | | | 181 | | |
| (4) |
| (1.9) | |
| 23 |
| 12.7 | |
Other expenses | |
| 415 | | | 245 | | | 119 | | |
| 170 |
| 69.4 | |
| 296 |
| 248.7 | |
Total noninterest expense | |
| 10,460 | | | 9,802 | | | 9,177 | | |
| 658 |
| 6.7 | |
| 1,283 |
| 14.0 | |
Income before provision for income taxes | |
| 10,884 | | | 11,442 | | | 6,659 | | |
| (558) |
| (4.9) | |
| 4,225 |
| 63.4 | |
Provision for income taxes | |
| 2,466 | | | 2,946 | | | 1,488 | | |
| (480) |
| (16.3) | |
| 978 |
| 65.7 | |
Net income | | $ | 8,418 | | $ | 8,496 | | $ | 5,171 | | | $ | (78) |
| (0.9) | % | $ | 3,247 |
| 62.8 | % |
| | | | | | | | | | | | | | | | | | | | | |
Effective tax rate | | | 22.7 | % | | 25.7 | % | | 22.3 | % | | | | | | | | | | | |
Net income per common share - Basic | | $ | 0.81 | | $ | 0.81 | | $ | 0.48 | | | | | | | | | | | | |
Net income per common share - Diluted | | $ | 0.80 | | $ | 0.80 | | $ | 0.47 | | | | | | | | | | | | |
Weighted average common shares outstanding - Basic | | | 10,427 | | | 10,437 | | | 10,792 | | | | | | | | | | | | |
Weighted average common shares outstanding - Diluted | | | 10,569 | | | 10,565 | | | 10,888 | | | | | | | | | | | | |
UNITY BANCORP, INC.
YTD CONSOLIDATED STATEMENTS OF INCOME
June 30,2021
| | For the six months ended June 30, | | | Current YTD vs. Prior YTD |
| |||||||
(In thousands, except percentages and per share amounts) |
| 2021 |
| 2020 |
|
| $ |
| % |
| |||
INTEREST INCOME | |
| | |
| | | |
| | |
|
|
Federal funds sold and interest-bearing deposits | | $ | 57 | | $ | 212 | | | $ | (155) |
| (73.1) | % |
FHLB stock | |
| 116 | | | 188 | | |
| (72) |
| (38.3) | |
Securities: | |
| | | | | | |
| |
| | |
Taxable | |
| 546 | | | 948 | | |
| (402) |
| (42.4) | |
Tax-exempt | |
| 18 | | | 39 | | |
| (21) |
| (53.8) | |
Total securities | |
| 564 | | | 987 | | |
| (423) |
| (42.9) | |
Loans: | |
| | | | | | |
| |
| | |
SBA loans | |
| 1,559 | | | 1,694 | | |
| (135) |
| (8.0) | |
SBA PPP loans | | | 3,477 | | | 723 | | | | 2,754 | | 380.9 | |
Commercial loans | |
| 21,210 | | | 19,748 | | |
| 1,462 |
| 7.4 | |
Residential mortgage loans | |
| 10,034 | | | 11,324 | | |
| (1,290) |
| (11.4) | |
Consumer loans | | | 1,538 | | | 1,835 | | | | (297) | | (16.2) | |
Residential construction loans | |
| 2,701 | | | 2,153 | | |
| 548 |
| 25.5 | |
Total loans | |
| 40,519 | | | 37,477 | | |
| 3,042 |
| 8.1 | |
Total interest income | |
| 41,256 | | | 38,864 | | |
| 2,392 |
| 6.2 | |
INTEREST EXPENSE | |
| | |
| | | |
| |
| | |
Interest-bearing demand deposits | |
| 616 | | | 706 | | |
| (90) |
| (12.7) | |
Savings deposits | |
| 851 | | | 1,499 | | |
| (648) |
| (43.2) | |
Time deposits | |
| 2,634 | | | 4,900 | | |
| (2,266) |
| (46.2) | |
Borrowed funds and subordinated debentures | |
| 688 | | | 989 | | |
| (301) |
| (30.4) | |
Total interest expense | |
| 4,789 | | | 8,094 | | |
| (3,305) |
| (40.8) | |
Net interest income | |
| 36,467 | | | 30,770 | | |
| 5,697 |
| 18.5 | |
Provision for loan losses | |
| 500 | | | 4,000 | | |
| (3,500) |
| (87.5) | |
Net interest income after provision for loan losses | |
| 35,967 | | | 26,770 | | |
| 9,197 |
| 34.4 | |
NONINTEREST INCOME | |
| | | | | | |
| |
| | |
Branch fee income | |
| 564 | | | 523 | | |
| 41 |
| 7.8 | |
Service and loan fee income | |
| 1,133 | | | 766 | | |
| 367 |
| 47.9 | |
Gain on sale of SBA loans held for sale, net | |
| 741 | | | 565 | | |
| 176 |
| 31.2 | |
Gain on sale of mortgage loans, net | |
| 2,817 | | | 2,604 | | |
| 213 |
| 8.2 | |
BOLI income | |
| 261 | | | 327 | | |
| (66) |
| (20.2) | |
Net security gains (loss) | |
| 333 | | | (91) | | |
| 424 |
| (465.9) | |
Other income | |
| 772 | | | 662 | | |
| 110 |
| 16.6 | |
Total noninterest income | |
| 6,621 | | | 5,356 | | |
| 1,265 |
| 23.6 | |
NONINTEREST EXPENSE | |
| | | | | | |
| |
| | |
Compensation and benefits | |
| 12,396 | | | 10,992 | | |
| 1,404 |
| 12.8 | |
Processing and communications | |
| 1,557 | | | 1,477 | | |
| 80 |
| 5.4 | |
Furniture and equipment | |
| 1,308 | | | 1,296 | | |
| 12 |
| 0.9 | |
Occupancy | |
| 1,337 | | | 1,253 | | |
| 84 |
| 6.7 | |
Professional services | |
| 720 | | | 531 | | |
| 189 |
| 35.6 | |
BSA expenses | | | 450 | | | 550 | | | | (100) | | (18.2) | |
Other loan expenses | |
| 308 | | | 257 | | |
| 51 |
| 19.8 | |
Loan collection & OREO expenses | |
| 5 | | | 187 | | |
| (182) |
| (97.3) | |
Deposit insurance | |
| 439 | | | 247 | | |
| 192 |
| 77.7 | |
Advertising | |
| 671 | | | 497 | | |
| 174 |
| 35.0 | |
Director fees | |
| 412 | | | 381 | | |
| 31 |
| 8.1 | |
Other expenses | |
| 660 | | | 833 | | |
| (173) |
| (20.8) | |
Total noninterest expense | |
| 20,263 | | | 18,501 | | |
| 1,762 |
| 9.5 | |
Income before provision for income taxes | |
| 22,325 | | | 13,625 | | |
| 8,700 |
| 63.9 | |
Provision for income taxes | |
| 5,411 | | | 3,086 | | |
| 2,325 |
| 75.3 | |
Net income | | $ | 16,914 | | $ | 10,539 | | | $ | 6,375 | | 60.5 | % |
| | | | | | | | | | | | | |
Effective tax rate | | | 24.2 | % | | 22.6 | % | | | | | | |
Net income per common share - Basic | | $ | 1.62 | | $ | 0.97 | | | | | | | |
Net income per common share - Diluted | | $ | 1.60 | | $ | 0.96 | | | | | | | |
Weighted average common shares outstanding - Basic | | | 10,432 | | | 10,838 | | | | | | | |
Weighted average common shares outstanding - Diluted | | | 10,567 | | | 10,962 | | | | | | | |
UNITY BANCORP, INC.
QUARTER TO DATE NET INTEREST MARGIN
June 30,2021
(Dollar amounts in thousands, interest amounts and interest rates/yields on a fully tax-equivalent basis)
| | For the three months ended | | ||||||||||||||
| | June 30, 2021 | | June 30, 2020 | | ||||||||||||
|
| Average |
| | |
| |
| Average |
| | |
| | | ||
|
| Balance | | Interest | | Rate/Yield | | Balance | | Interest | | Rate/Yield | | ||||
ASSETS |
| |
|
| |
|
|
|
| |
|
| |
|
|
| |
Interest-earning assets: |
| |
|
| |
|
|
|
| |
|
| |
|
|
| |
Federal funds sold and interest-bearing deposits | | $ | 124,728 | | $ | 33 | | 0.11 | % | $ | 73,899 | | $ | 23 | | 0.13 | % |
FHLB stock | |
| 4,725 | | | 53 | | 4.46 | |
| 5,976 | | | 79 | | 5.32 | |
Securities: | |
| | | | | | | |
| | | | | | | |
Taxable | |
| 34,609 | | | 253 | | 2.94 | |
| 53,592 | | | 437 | | 3.28 | |
Tax-exempt | |
| 1,754 | | | 11 | | 2.49 | |
| 3,534 | | | 21 | | 2.39 | |
Total securities (A) | |
| 36,363 | | | 264 | | 2.92 | |
| 57,126 | | | 458 | | 3.22 | |
Loans: | |
| | | | | | | |
| | | | | | | |
SBA loans | |
| 50,742 | | | 776 | | 6.14 | |
| 47,964 | | | 709 | | 5.95 | |
SBA PPP loans | | | 164,073 | | | 1,748 | | 4.27 | | | 100,586 | | | 723 | | 2.89 | |
Commercial loans | |
| 865,292 | | | 10,734 | | 4.98 | |
| 783,962 | | | 9,815 | | 5.04 | |
Residential mortgage loans | |
| 434,558 | | | 4,906 | | 4.53 | |
| 461,156 | | | 5,554 | | 4.84 | |
Consumer loans | |
| 61,357 | | | 682 | | 4.46 | |
| 72,495 | | | 875 | | 4.85 | |
Residential construction loans | |
| 94,388 | | | 1,486 | | 6.31 | |
| 73,475 | | | 1,046 | | 5.73 | |
Total loans (B) | |
| 1,670,410 | | | 20,332 | | 4.88 | |
| 1,539,638 | | | 18,722 | | 4.89 | |
Total interest-earning assets | | $ | 1,836,226 | | $ | 20,682 | | 4.52 | % | $ | 1,676,639 | | $ | 19,282 | | 4.63 | % |
| | | | | | | | | | | | | | | | | |
Noninterest-earning assets: | |
|
| |
|
|
| | |
|
| |
|
|
| | |
Cash and due from banks | |
| 23,511 | | | |
| | |
| 20,698 | |
|
|
| | |
Allowance for loan losses | |
| (23,043) | | | |
| | |
| (17,909) | |
|
|
| | |
Other assets | |
| 75,300 | | | |
| | |
| 74,076 | |
|
|
| | |
Total noninterest-earning assets | |
| 75,768 | | | |
| | |
| 76,865 | |
|
|
| | |
Total assets | | $ | 1,911,994 | | | |
| | | $ | 1,753,504 | |
|
|
| | |
| | | | | | | | | | | | | | | | | |
LIABILITIES AND SHAREHOLDERS' EQUITY | |
|
| |
|
|
| | |
|
| |
|
|
| | |
Interest-bearing liabilities: | |
|
| |
|
|
| | |
|
| |
|
|
| | |
Total interest-bearing demand deposits | | $ | 219,244 | | $ | 307 | | 0.56 | % | $ | 163,685 | | $ | 329 | | 0.81 | % |
Total savings deposits | |
| 509,476 | | | 419 | | 0.33 | |
| 421,647 | | | 547 | | 0.52 | |
Total time deposits | |
| 422,472 | | | 1,171 | | 1.11 | |
| 482,734 | | | 2,454 | | 2.04 | |
Total interest-bearing deposits | |
| 1,151,192 | | | 1,897 | | 0.66 | |
| 1,068,066 | | | 3,330 | | 1.25 | |
Borrowed funds and subordinated debentures | |
| 78,991 | | | 334 | | 1.69 | |
| 107,761 | | | 423 | | 1.58 | |
Total interest-bearing liabilities | | $ | 1,230,183 | | $ | 2,231 | | 0.73 | % | $ | 1,175,827 | | $ | 3,753 | | 1.28 | % |
| | | | | | | | | | | | | | | | | |
Noninterest-bearing liabilities: | |
| | | | | | | |
| | | | |
| | |
Noninterest-bearing demand deposits | |
| 482,536 | | | | | | |
| 394,723 | | | |
| | |
Other liabilities | |
| 14,713 | | | | | | |
| 17,682 | | | |
| | |
Total noninterest-bearing liabilities | |
| 497,249 | | | | | | |
| 412,405 | | | |
| | |
Total shareholders' equity | |
| 184,562 | | | | | | |
| 165,272 | | | |
| | |
Total liabilities and shareholders' equity | | $ | 1,911,994 | | | | | | | $ | 1,753,504 | | | |
| | |
| | | | | | | | | | | | | | | | | |
Net interest spread | | | | | $ | 18,451 | | 3.79 | % | | | | $ | 15,529 | | 3.35 | % |
Tax-equivalent basis adjustment | | | | | | (2) | | | | | | | | (4) | | | |
Net interest income | | | | | $ | 18,449 | | | | | | | $ | 15,525 | | | |
Net interest margin | | | | | | | | 4.03 | % |
|
| |
| | | 3.73 | % |
| (A) | Yields related to securities exempt from federal and state income taxes are stated on a fully tax-equivalent basis. They are reduced by the nondeductable portion of interest expense, assuming a federal tax rate of 21 percent and applicable state rates. |
| (B) | The loan averages are stated net of unearned income, and the averages include loans on which the accrual of interest has been discontinued. |
UNITY BANCORP, INC.
QUARTER TO DATE NET INTEREST MARGIN
June 30,2021
(Dollar amounts in thousands, interest amounts and interest rates/yields on a fully tax-equivalent basis)
| | For the three months ended | | ||||||||||||||
| | June 30, 2021 | | March 31, 2021 | | ||||||||||||
|
| Average |
| | |
| |
| Average |
| | |
| | | ||
|
| Balance | | Interest | | Rate/Yield | | Balance | | Interest | | Rate/Yield | | ||||
ASSETS |
| |
|
| |
|
|
|
| |
|
| |
|
|
| |
Interest-earning assets: |
| |
|
| |
|
|
|
| |
|
| |
|
|
| |
Federal funds sold and interest-bearing deposits | | $ | 124,728 | | $ | 33 | | 0.11 | % | $ | 90,830 | | $ | 24 | | 0.11 | % |
FHLB stock | |
| 4,725 | | | 53 | | 4.46 | |
| 5,167 | | | 63 | | 4.98 | |
Securities: | |
| | | | | | | |
| | | | | | | |
Taxable | |
| 34,609 | | | 253 | | 2.94 | |
| 38,741 | | | 292 | | 3.06 | |
Tax-exempt | |
| 1,754 | | | 11 | | 2.49 | |
| 2,405 | | | 12 | | 2.03 | |
Total securities (A) | |
| 36,363 | | | 264 | | 2.92 | |
| 41,146 | | | 304 | | 3.00 | |
Loans: | |
| | | | | | | |
| | | | | | | |
SBA loans | |
| 50,742 | | | 776 | | 6.14 | |
| 48,845 | | | 783 | | 6.50 | |
SBA PPP loans | | | 164,073 | | | 1,748 | | 4.27 | | | 142,581 | | | 1,730 | | 4.92 | |
Commercial loans | |
| 865,292 | | | 10,734 | | 4.98 | |
| 849,065 | | | 10,474 | | 5.00 | |
Residential mortgage loans | |
| 434,558 | | | 4,906 | | 4.53 | |
| 455,782 | | | 5,128 | | 4.56 | |
Consumer loans | |
| 61,357 | | | 682 | | 4.46 | |
| 63,440 | | | 857 | | 5.48 | |
Residential construction loans | |
| 94,388 | | | 1,486 | | 6.31 | |
| 88,992 | | | 1,215 | | 5.54 | |
Total loans (B) | |
| 1,670,410 | | | 20,332 | | 4.88 | |
| 1,648,705 | | | 20,187 | | 4.97 | |
Total interest-earning assets | | $ | 1,836,226 | | $ | 20,682 | | 4.52 | % | $ | 1,785,848 | | $ | 20,578 | | 4.67 | % |
| | | | | | | | | | | | | | | | | |
Noninterest-earning assets: | |
|
| |
|
|
| | |
|
| |
|
|
|
| |
Cash and due from banks | |
| 23,511 | | | |
| | |
| 23,781 | | | |
|
| |
Allowance for loan losses | |
| (23,043) | | | |
| | |
| (23,308) | | | |
|
| |
Other assets | |
| 75,300 | | | |
| | |
| 76,309 | | | |
|
| |
Total noninterest-earning assets | |
| 75,768 | | | |
| | |
| 76,782 | | | |
|
| |
Total assets | | $ | 1,911,994 | | | |
| | | $ | 1,862,630 | | | |
|
| |
| | | | | | | | | | | | | | | | | |
LIABILITIES AND SHAREHOLDERS' EQUITY | |
|
| |
|
|
| | |
|
| |
|
|
|
| |
Interest-bearing liabilities: | |
|
| |
|
|
| | |
|
| |
|
|
|
| |
Total interest-bearing demand deposits | | $ | 219,244 | | $ | 307 | | 0.56 | % | $ | 209,020 | | $ | 309 | | 0.60 | % |
Total savings deposits | |
| 509,476 | | | 419 | | 0.33 | |
| 476,463 | | | 431 | | 0.37 | |
Total time deposits | |
| 422,472 | | | 1,171 | | 1.11 | |
| 438,250 | | | 1,463 | | 1.35 | |
Total interest-bearing deposits | |
| 1,151,192 | | | 1,897 | | 0.66 | |
| 1,123,733 | | | 2,203 | | 0.80 | |
Borrowed funds and subordinated debentures | |
| 78,991 | | | 334 | | 1.69 | |
| 89,699 | | | 355 | | 1.61 | |
Total interest-bearing liabilities | | $ | 1,230,183 | | $ | 2,231 | | 0.73 | % | $ | 1,213,432 | | $ | 2,558 | | 0.85 | % |
| | | | | | | | | | | | | | | | | |
Noninterest-bearing liabilities: | |
| | | | | | | |
| | | | | | | |
Noninterest-bearing demand deposits | |
| 482,536 | | | | | | |
| 455,146 | | | | | | |
Other liabilities | |
| 14,713 | | | | | | |
| 17,418 | | | | | | |
Total noninterest-bearing liabilities | |
| 497,249 | | | | | | |
| 472,564 | | | | | | |
Total shareholders' equity | |
| 184,562 | | | | | | |
| 176,634 | | | | | | |
Total liabilities and shareholders' equity | | $ | 1,911,994 | | | | | | | $ | 1,862,630 | | | | | | |
| | | | | | | | | | | | | | | | | |
Net interest spread | | | | | $ | 18,451 | | 3.79 | % | | | | $ | 18,020 | | 3.82 | % |
Tax-equivalent basis adjustment | | | | | | (2) | | | | | | | | (2) | | | |
Net interest income | | | | | $ | 18,449 | | | | | | | $ | 18,018 | | | |
Net interest margin | | | | | | | | 4.03 | % |
| | | | | | 4.09 | % |
| (A) | Yields related to securities exempt from federal and state income taxes are stated on a fully tax-equivalent basis. They are reduced by the nondeductable portion of interest expense, assuming a federal tax rate of 21 percent and applicable state rates. |
| (B) | The loan averages are stated net of unearned income, and the averages include loans on which the accrual of interest has been discontinued. |
UNITY BANCORP, INC.
YEAR TO DATE NET INTEREST MARGIN
June 30,2021
(Dollar amounts in thousands, interest amounts and interest rates/yields on a fully tax-equivalent basis)
| | For the year ended |
| |||||||||||||||
| | June 30, 2021 | | June 30, 2020 |
| |||||||||||||
|
| Average |
| | |
| | |
| Average |
| | |
| |
| ||
| | Balance | | Interest | | Rate/Yield | | Balance | | Interest | | Rate/Yield |
| |||||
ASSETS | | | | | | | | | | | | | | | | | | |
Interest-earning assets: |
| |
|
| |
|
| |
|
| |
|
| |
|
|
| |
Federal funds sold and interest-bearing deposits | | $ | 107,873 | | $ | 57 | | | 0.11 | % | $ | 71,548 | | $ | 212 | | 0.60 | % |
FHLB stock | |
| 4,945 | | | 116 | | | 4.73 | |
| 6,429 | | | 188 | | 5.88 | |
Securities: | |
| | | | | | | | |
| | | | | | | |
Taxable | |
| 36,664 | | | 546 | | | 3.00 | |
| 56,917 | | | 948 | | 3.35 | |
Tax-exempt | |
| 2,077 | | | 23 | | | 2.23 | |
| 3,659 | | | 49 | | 2.69 | |
Total securities (A) | |
| 38,741 | | | 569 | | | 2.96 | |
| 60,576 | | | 997 | | 3.31 | |
Loans: | |
| | | | | | | | |
| | | | | | | |
SBA loans | |
| 49,799 | | | 1,559 | | | 6.31 | |
| 49,127 | | | 1,694 | | 6.93 | |
SBA PPP loans | | | 153,387 | | | 3,477 | | | 4.57 | | | 50,412 | | | 723 | | 2.88 | |
Commercial loans | |
| 857,223 | | | 21,210 | | | 4.99 | |
| 776,729 | | | 19,748 | | 5.11 | |
Residential mortgage loans | |
| 445,111 | | | 10,034 | | | 4.55 | |
| 461,952 | | | 11,324 | | 4.93 | |
Consumer loans | | | 62,393 | | | 1,538 | | | 4.97 | | | 72,445 | | | 1,835 | | 5.09 | |
Residential construction loans | |
| 91,705 | | | 2,701 | | | 5.94 | |
| 71,682 | | | 2,153 | | 6.04 | |
Total loans (B) | |
| 1,659,618 | | | 40,519 | | | 4.92 | |
| 1,482,347 | | | 37,477 | | 5.08 | |
Total interest-earning assets | | $ | 1,811,177 | | $ | 41,261 | | | 4.59 | % | $ | 1,620,900 | | $ | 38,874 | | 4.82 | % |
| | | | | | | | | | | | | | | | | | |
Noninterest-earning assets: | |
|
| |
|
| | | | |
|
| |
|
| | | |
Cash and due from banks | |
| 23,645 | | | | | | | |
| 21,320 | |
|
| | | |
Allowance for loan losses | |
| (23,175) | | | | | | | |
| (17,303) | |
|
| | | |
Other assets | |
| 75,803 | | | | | | | |
| 72,228 | |
|
| | | |
Total noninterest-earning assets | |
| 76,273 | | | | | | | |
| 76,245 | |
|
| | | |
Total assets | | $ | 1,887,450 | | | | | | | | $ | 1,697,145 | |
|
| | | |
| | | | | | | | | | | | | | | | | | |
LIABILITIES AND SHAREHOLDERS' EQUITY | |
|
| |
|
| | | | |
|
| |
|
| | | |
Interest-bearing liabilities: | |
|
| |
|
| | | | |
|
| |
|
| | | |
Total interest-bearing demand deposits | | $ | 214,160 | | $ | 616 | | | 0.58 | % | $ | 162,939 | | $ | 706 | | 0.87 | % |
Total savings deposits | |
| 493,061 | | | 851 | | | 0.35 | |
| 423,277 | | | 1,499 | | 0.71 | |
Total time deposits | |
| 430,317 | | | 2,634 | | | 1.23 | |
| 459,218 | | | 4,900 | | 2.15 | |
Total interest-bearing deposits | |
| 1,137,538 | | | 4,101 | | | 0.73 | |
| 1,045,434 | | | 7,105 | | 1.37 | |
Borrowed funds and subordinated debentures | |
| 84,316 | | | 688 | | | 1.65 | |
| 119,409 | | | 989 | | 1.67 | |
Total interest-bearing liabilities | | $ | 1,221,854 | | $ | 4,789 | | | 0.79 | % | $ | 1,164,843 | | $ | 8,094 | | 1.40 | % |
| | | | | | | | | | | | | | | | | | |
Noninterest-bearing liabilities: | |
| | | | | | | | |
| | | | | | | |
Noninterest-bearing demand deposits | |
| 468,916 | | | | | | | |
| 351,203 | | | | | | |
Other liabilities | |
| 16,069 | | | | | | | |
| 16,891 | | | | | | |
Total noninterest-bearing liabilities | |
| 484,985 | | | | | | | |
| 368,094 | | | | | | |
Total shareholders' equity | |
| 180,611 | | | | | | | |
| 164,208 | | | | | | |
Total liabilities and shareholders' equity | | $ | 1,887,450 | | | | | | | | $ | 1,697,145 | | | | | | |
| | | | | | | | | | | | | | | | | | |
Net interest spread | | | | | $ | 36,472 | | | 3.80 | % | | | | $ | 30,780 | | 3.42 | % |
Tax-equivalent basis adjustment | | | | | | (5) | | | | | | | | | (10) | | | |
Net interest income | | | | | $ | 36,467 | | | | | | | | $ | 30,770 | | | |
Net interest margin | | | | | | | | | 4.06 | % | | | | | | | 3.82 | % |
| (A) | Yields related to securities exempt from federal and state income taxes are stated on a fully tax-equivalent basis. They are reduced by the nondeductable portion of interest expense, assuming a federal tax rate of 21 percent and applicable state rates. |
| (B) | The loan averages are stated net of unearned income, and the averages include loans on which the accrual of interest has been discontinued. |
UNITY BANCORP, INC.
QUARTERLY ALLOWANCE FOR LOAN LOSSES AND LOAN QUALITY SCHEDULES
June 30,2021
Amounts in thousands, except percentages |
| Jun. 30, 2021 |
| Mar. 31, 2021 |
| Dec. 31, 2020 |
| Sept. 30, 2020 |
| Jun. 30, 2020 |
| |||||
ALLOWANCE FOR LOAN LOSSES: | |
| | |
| | |
| | |
| | |
| |
|
Balance, beginning of period | | $ | 22,965 | | $ | 23,105 | | $ | 22,237 | | $ | 20,234 | | $ | 17,376 | |
Provision for loan losses charged to expense | |
| — | | | 500 | | | 1,000 | | | 2,000 | | | 2,500 | |
| |
| 22,965 | | | 23,605 | | | 23,237 | | | 22,234 | | | 19,876 | |
Less: Chargeoffs | |
|
| |
|
| |
|
| |
|
| |
|
| |
SBA loans | |
| 164 | | | 282 | | | — | | | 1 | | | — | |
Commercial loans | |
| 20 | | | 373 | | | 150 | | | — | | | 219 | |
Consumer loans | |
| — | | | 1 | | | — | | | — | | | — | |
Total chargeoffs | |
| 184 | | | 656 | | | 150 | | | 1 | | | 219 | |
Add: Recoveries | |
| | | | | | | | | | | | | | |
SBA loans | |
| 19 | | | 15 | | | — | | | 3 | | | 75 | |
Commercial loans | |
| 1 | | | 1 | | | 18 | | | 1 | | | 502 | |
Total recoveries | |
| 20 | | | 16 | | | 18 | | | 4 | | | 577 | |
Net chargeoffs (recoveries) | |
| 164 | | | 640 | | | 132 | | | (3) | | | (358) | |
Balance, end of period | | $ | 22,801 | | $ | 22,965 | | $ | 23,105 | | $ | 22,237 | | $ | 20,234 | |
| | | | | | | | | | | | | | | | |
LOAN QUALITY INFORMATION: | |
|
| |
|
| |
|
| |
|
| |
|
| |
Nonperforming loans: | |
|
| |
|
| |
|
| |
|
| |
|
| |
SBA loans | | $ | 1,713 | | $ | 1,560 | | $ | 2,473 | | $ | 3,446 | | $ | 2,363 | |
Commercial loans | |
| 1,637 | | | 952 | | | 1,325 | | | 527 | | | 413 | |
Residential mortgage loans | |
| 4,043 | | | 6,711 | | | 5,217 | | | 3,722 | | | 6,192 | |
Consumer loans | | | 3 | | | — | | | 1,295 | | | 1,293 | | | 505 | |
Residential construction loans | |
| 2,289 | | | 2,565 | | | 1,750 | | | — | | | — | |
Total nonperforming loans | |
| 9,685 | | | 11,788 | | | 12,060 | | | 8,988 | | | 9,473 | |
Other real estate owned ("OREO") | |
| — | | | — | | | — | | | 711 | | | 711 | |
Nonperforming assets | |
| 9,685 | | | 11,788 | | | 12,060 | | | 9,699 | | | 10,184 | |
Less: Amount guaranteed by SBA | |
| 139 | | | 139 | | | 371 | | | 812 | | | 307 | |
Net nonperforming assets | | $ | 9,546 | | $ | 11,649 | | $ | 11,689 | | $ | 8,887 | | $ | 9,877 | |
| | | | | | | | | | | | | | | | |
Loans 90 days past due & still accruing | | $ | 574 | | $ | 2,540 | | $ | 449 | | $ | — | | $ | — | |
| | | | | | | | | | | | | | | | |
Performing Troubled Debt Restructurings (TDRs) | | $ | 1,068 | | $ | 1,079 | | $ | 663 | | $ | 673 | | $ | 684 | |
| | | | | | | | | | | | | | | | |
Allowance for loan losses to: | |
| | | | | | | | | | | | | | |
Total nonperforming loans | |
| 235.43 | | | 194.82 | | | 191.58 | | | 247.41 | | | 213.60 | |
Nonperforming assets | |
| 235.43 | | | 194.82 | | | 191.58 | | | 229.27 | | | 198.68 | |
Net nonperforming assets | |
| 238.85 | | | 197.14 | | | 197.66 | | | 250.22 | | | 204.86 | |
| | | | | | | | | | | | | | | | |
UNITY BANCORP, INC.
QUARTERLY FINANCIAL DATA
June 30,2021
(In thousands, except percentages and per share amounts) |
| Jun. 30, 2021 |
| Mar. 31, 2021 |
| Dec. 31, 2020 |
| Sept. 30, 2020 |
| Jun. 30, 2020 |
| |||||
SUMMARY OF INCOME: | |
| | |
| | |
| | |
| | |
| |
|
Total interest income | | $ | 20,680 | | $ | 20,576 | | $ | 20,288 | | $ | 19,764 | | $ | 19,278 | |
Total interest expense | |
| 2,231 | | | 2,558 | | | 2,949 | | | 3,437 | | | 3,753 | |
Net interest income | |
| 18,449 | | | 18,018 | | | 17,339 | | | 16,327 | | | 15,525 | |
Provision for loan losses | |
| — | | | 500 | | | 1,000 | | | 2,000 | | | 2,500 | |
Net interest income after provision for loan losses | |
| 18,449 | | | 17,518 | | | 16,339 | | | 14,327 | | | 13,025 | |
Total noninterest income | |
| 2,895 | | | 3,726 | | | 4,254 | | | 3,336 | | | 2,811 | |
Total noninterest expense | |
| 10,460 | | | 9,802 | | | 10,725 | | | 10,037 | | | 9,177 | |
Income before provision for income taxes | |
| 10,884 | | | 11,442 | | | 9,868 | | | 7,626 | | | 6,659 | |
Provision for income taxes | |
| 2,466 | | | 2,946 | | | 2,523 | | | 1,866 | | | 1,488 | |
Net income | | $ | 8,418 | | $ | 8,496 | | $ | 7,345 | | $ | 5,760 | | $ | 5,171 | |
| | | | | | | | | | | | | | | | |
Net income per common share - Basic | | $ | 0.81 | | $ | 0.81 | | $ | 0.70 | | $ | 0.54 | | $ | 0.48 | |
Net income per common share - Diluted | | $ | 0.80 | | $ | 0.80 | | $ | 0.69 | | $ | 0.54 | | $ | 0.47 | |
| | | | | | | | | | | | | | | | |
COMMON SHARE DATA: | |
| | |
| | |
| | |
|
| |
|
| |
Market price per share | | $ | 22.05 | | $ | 22.00 | | $ | 17.55 | | $ | 11.58 | | $ | 14.30 | |
Dividends paid | | $ | 0.09 | | $ | 0.08 | | $ | 0.08 | | $ | 0.08 | | $ | 0.08 | |
Book value per common share | | $ | 18.12 | | $ | 17.38 | | $ | 16.63 | | $ | 16.01 | | $ | 15.53 | |
| | | | | | | | | | | | | | | | |
Weighted average common shares outstanding - Basic | |
| 10,427 | | | 10,437 | | | 10,532 | | | 10,630 | | | 10,792 | |
Weighted average common shares outstanding - Diluted | |
| 10,569 | | | 10,565 | | | 10,629 | | | 10,706 | | | 10,888 | |
Issued common shares | |
| 11,031 | | | 10,996 | | | 10,961 | | | 10,943 | | | 10,939 | |
Outstanding common shares | |
| 10,416 | | | 10,422 | | | 10,456 | | | 10,570 | | | 10,728 | |
Treasury shares | |
| 615 | | | 574 | | | 505 | | | 373 | | | 211 | |
| | | | | | | | | | | | | | | | |
PERFORMANCE RATIOS (Annualized): | |
| | |
| | |
| | |
|
| |
|
| |
Return on average assets | |
| 1.77 | % | | 1.85 | % | | 1.61 | % | | 1.28 | % | | 1.19 | % |
Return on average equity | |
| 18.29 | | | 19.51 | | | 17.07 | | | 13.76 | | | 12.59 | |
Efficiency ratio | |
| 49.06 | | | 45.74 | | | 50.31 | | | 50.80 | | | 50.27 | |
Noninterest expense to average assets | |
| 2.19 | | | 2.13 | | | 2.35 | | | 2.23 | | | 2.10 | |
| | | | | | | | | | | | | | | | |
BALANCE SHEET DATA: | |
| | |
| | |
| | |
|
| |
|
| |
Total assets | | $ | 1,973,311 | | $ | 2,004,818 | | $ | 1,958,914 | | $ | 1,930,836 | | $ | 1,900,774 | |
Total deposits | |
| 1,594,316 | | | 1,628,393 | | | 1,557,959 | | | 1,493,440 | | | 1,483,457 | |
Total loans | |
| 1,653,988 | | | 1,668,448 | | | 1,627,817 | | | 1,613,291 | | | 1,592,507 | |
Total securities | |
| 37,054 | | | 34,551 | | | 47,571 | | | 50,387 | | | 54,888 | |
Total shareholders' equity | |
| 188,756 | | | 181,186 | | | 173,911 | | | 169,234 | | | 166,607 | |
Allowance for loan losses | |
| 22,801 | | | 22,965 | | | 23,105 | | | 22,237 | | | 20,234 | |
| | | | | | | | | | | | | | | | |
TAX EQUIVALENT YIELDS AND RATES: | |
| | | | | | | | | | | | | | |
Interest-earning assets | |
| 4.52 | % | | 4.67 | % | | 4.64 | % | | 4.58 | % | | 4.63 | % |
Interest-bearing liabilities | |
| 0.73 | | | 0.85 | | | 0.98 | | | 1.15 | | | 1.28 | |
Net interest spread | |
| 3.79 | | | 3.82 | | | 3.66 | | | 3.43 | | | 3.35 | |
Net interest margin | |
| 4.03 | | | 4.09 | | | 3.97 | | | 3.78 | | | 3.73 | |
| | | | | | | | | | | | | | | | |
CREDIT QUALITY: | |
| | |
| | |
| | |
|
| |
|
| |
Nonperforming assets | | $ | 9,685 | | $ | 11,788 | | $ | 12,060 | | $ | 9,699 | | $ | 10,184 | |
QTD net chargeoffs (recoveries) (annualized) to QTD average loans | |
| 0.04 | % | | 0.16 | % | | 0.03 | % | | — | % | | (0.09) | % |
Allowance for loan losses to total loans | |
| 1.38 | | | 1.38 | | | 1.42 | | | 1.38 | | | 1.27 | |
Nonperforming assets to total loans | |
| 0.59 | | | 0.71 | | | 0.74 | | | 0.56 | | | 0.59 | |
Nonperforming assets to total assets | |
| 0.49 | | | 0.59 | | | 0.62 | | | 0.50 | | | 0.54 | |
| | | | | | | | | | | | | | | | |
CAPITAL RATIOS AND OTHER: | |
| | |
| | |
| | |
|
| |
|
| |
Total equity to total assets | |
| 9.57 | % | | 9.04 | % | | 8.88 | % | | 8.76 | % | | 8.77 | % |
Community bank leverage ratio | |
| 10.11 | | | 10.19 | | | 10.09 | | | 9.95 | | | 10.01 | |
| | | | | | | | | | | | | | | | |
Number of banking offices | |
| 19 | | | 19 | | | 19 | | | 19 | | | 19 | |
Number of ATMs | |
| 20 | | | 20 | | | 20 | | | 20 | | | 20 | |
Number of employees | |
| 208 | | | 209 | | | 206 | | | 196 | | | 191 | |