Attached files
| file | filename |
|---|---|
| EX-99.2 - FINANCIAL SUPPLEMENT - Bank of New York Mellon Corp | ex992_financialsupplementx.htm |
| EX-99.1 - EARNINGS RELEASE - Bank of New York Mellon Corp | ex991_earningsreleasex2q21.htm |
| 8-K - FORM 8-K - Bank of New York Mellon Corp | bk-20210715.htm |
Second Quarter 2021 Financial Highlights J u l y 1 5 , 2 0 2 1
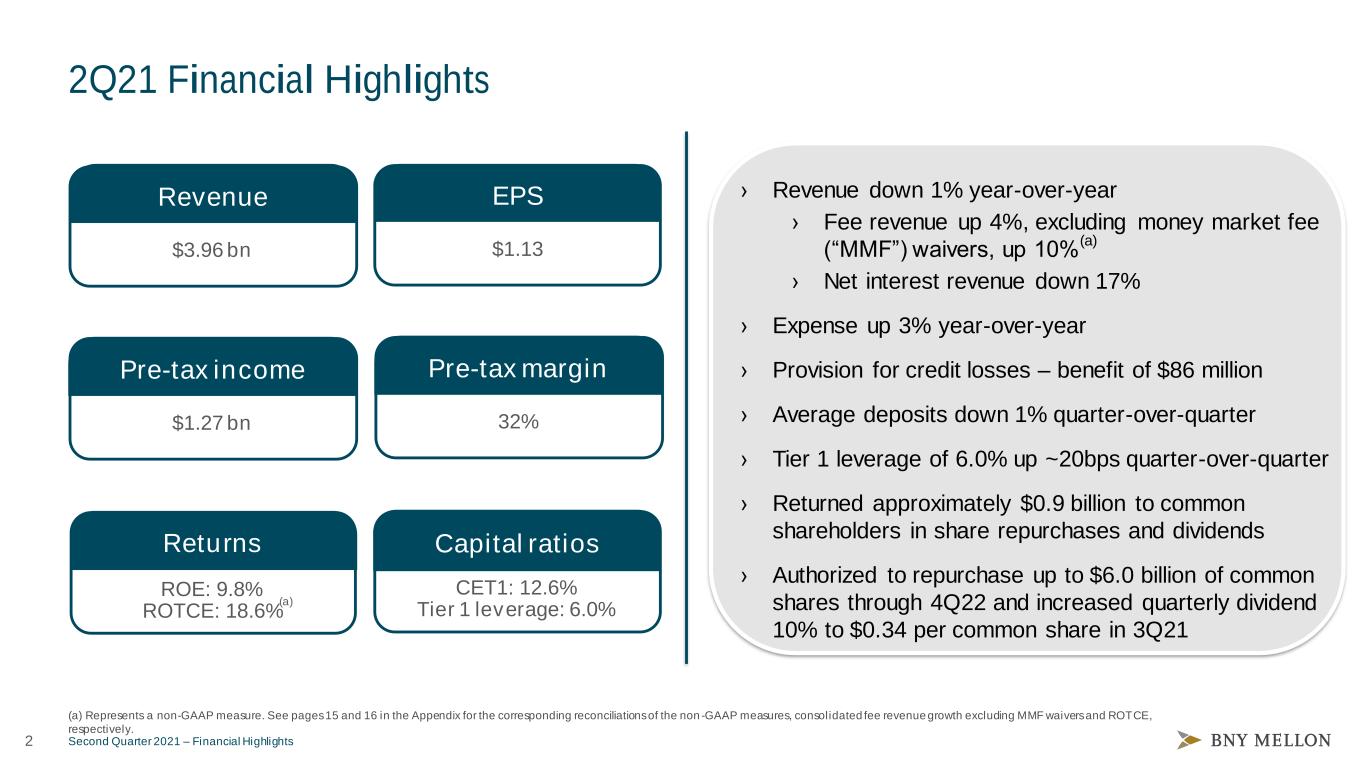
2 Second Quarter 2021 – Financial Highlights 2Q21 Financial Highlights $1.13 EPS $1.27 bn Pre-tax income ROE: 9.8% ROTCE: 18.6% Returns CET1: 12.6% Tier 1 leverage: 6.0% Capital ratios › Revenue down 1% year-over-year › Fee revenue up 4%, excluding money market fee (“MMF”) waivers, up 10% (a) › Net interest revenue down 17% › Expense up 3% year-over-year › Provision for credit losses – benefit of $86 million › Average deposits down 1% quarter-over-quarter › Tier 1 leverage of 6.0% up ~20bps quarter-over-quarter › Returned approximately $0.9 billion to common shareholders in share repurchases and dividends › Authorized to repurchase up to $6.0 billion of common shares through 4Q22 and increased quarterly dividend 10% to $0.34 per common share in 3Q21 (a) $3.96 bn Revenue 32% Pre-tax margin (a) Represents a non-GAAP measure. See pages 15 and 16 in the Appendix for the corresponding reconciliations of the non -GAAP measures, consolidated fee revenue growth excluding MMF waivers and ROTCE, respectively.
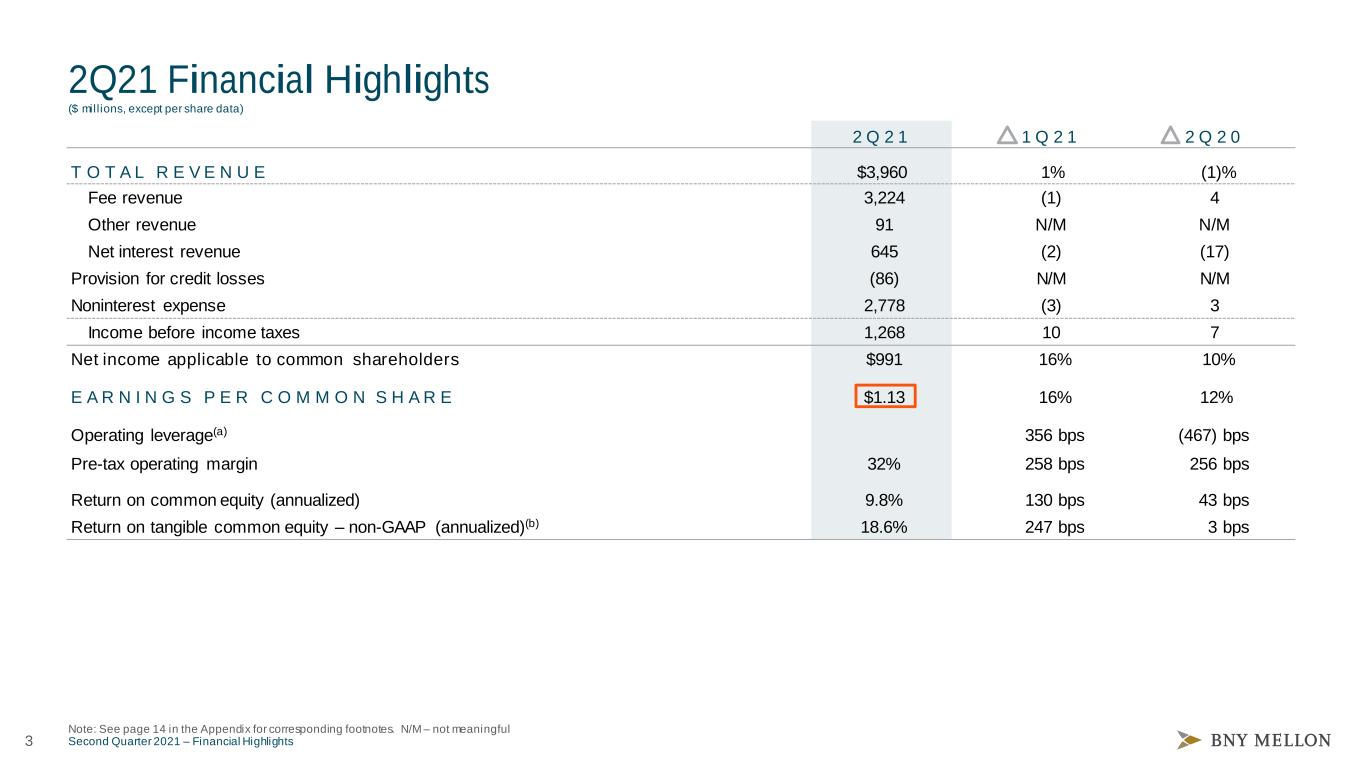
3 Second Quarter 2021 – Financial Highlights 2 Q 2 1 1 Q 2 1 2 Q 2 0 T O T A L R E V E N U E $3,960 1% (1)% Fee revenue 3,224 (1) 4 Other revenue 91 N/M N/M Net interest revenue 645 (2) (17) Provision for credit losses (86) N/M N/M Noninterest expense 2,778 (3) 3 Income before income taxes 1,268 10 7 Net income applicable to common shareholders $991 16% 10% E A R N I N G S P E R C O M M O N S H A R E $1.13 16% 12% Operating leverage(a) 356 bps (467) bps Pre-tax operating margin 32% 258 bps 256 bps Return on common equity (annualized) 9.8% 130 bps 43 bps Return on tangible common equity – non-GAAP (annualized)(b) 18.6% 247 bps 3 bps 2Q21 Financial Highlights ($ mill ions, except per share data) Note: See page 14 in the Appendix for corresponding footnotes. N/M – not meaningful
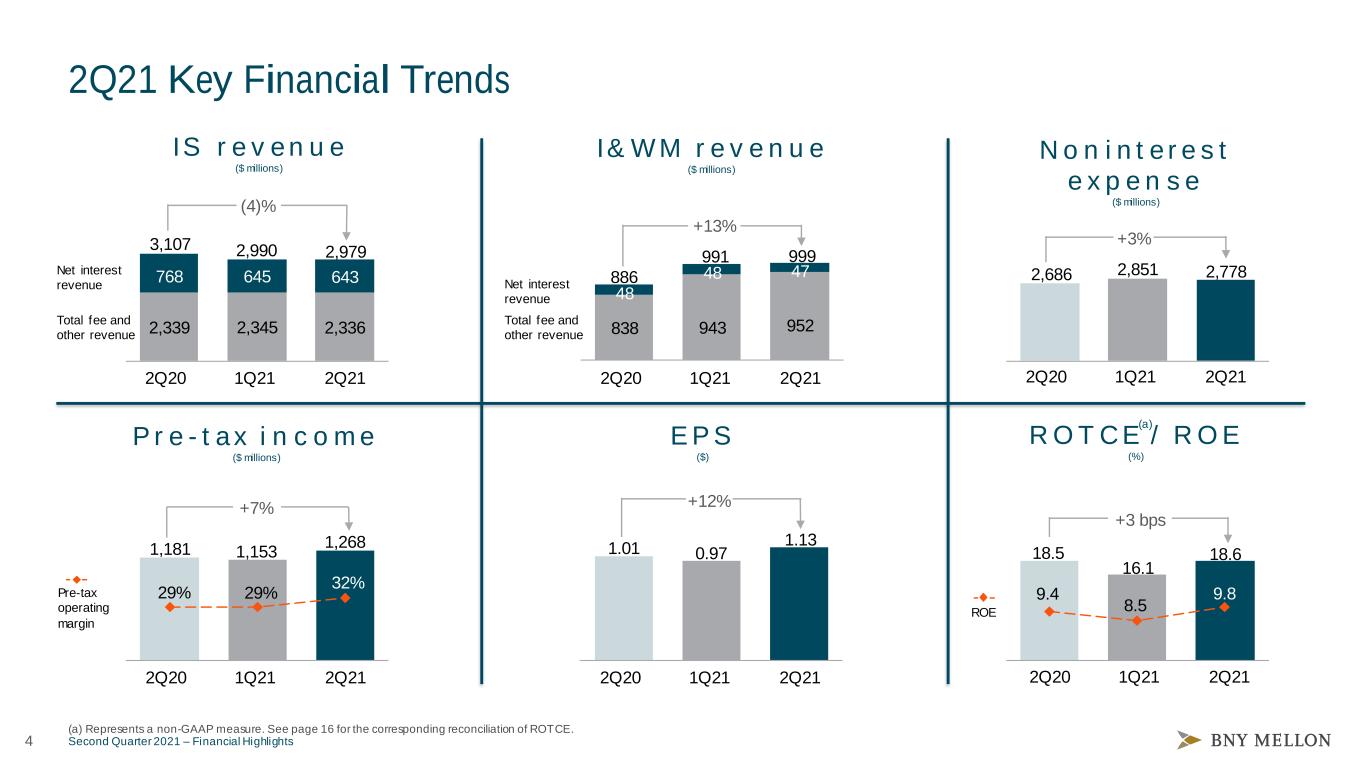
4 Second Quarter 2021 – Financial Highlights 9.4 8.5 9.8 5 10 15 2Q21 Key Financial Trends 838 943 952 48 48 47 999 886 2Q20 1Q21 2Q21 991 +13% I& W M r e v e n u e ($ millions) 2,7782,686 2Q20 1Q21 2Q21 2,851 +3% 18.618.5 2Q20 1Q21 2Q21 16.1 +3 bps IS r e v en u e ($ millions) N o n i nt e re s t e xp e n se ($ millions) R O T C E / R O E (%) 10 15 20 25 30 35 40 45 501,2681,181 2Q20 1Q21 2Q21 29% 29% 1,153 Pre-tax operating margin P r e - t ax i n c o me ($ millions) +7% 1.13 1.01 2Q20 1Q21 2Q21 0.97 E P S ($) ROE Total fee and other revenue Net interest revenue 2,339 2,345 2,336 768 645 643 2,9793,107 2Q20 1Q21 2Q21 2,990 (4)% Total fee and other revenue Net interest revenue 32% (a) Represents a non-GAAP measure. See page 16 for the corresponding reconciliation of ROTCE. +12% (a)
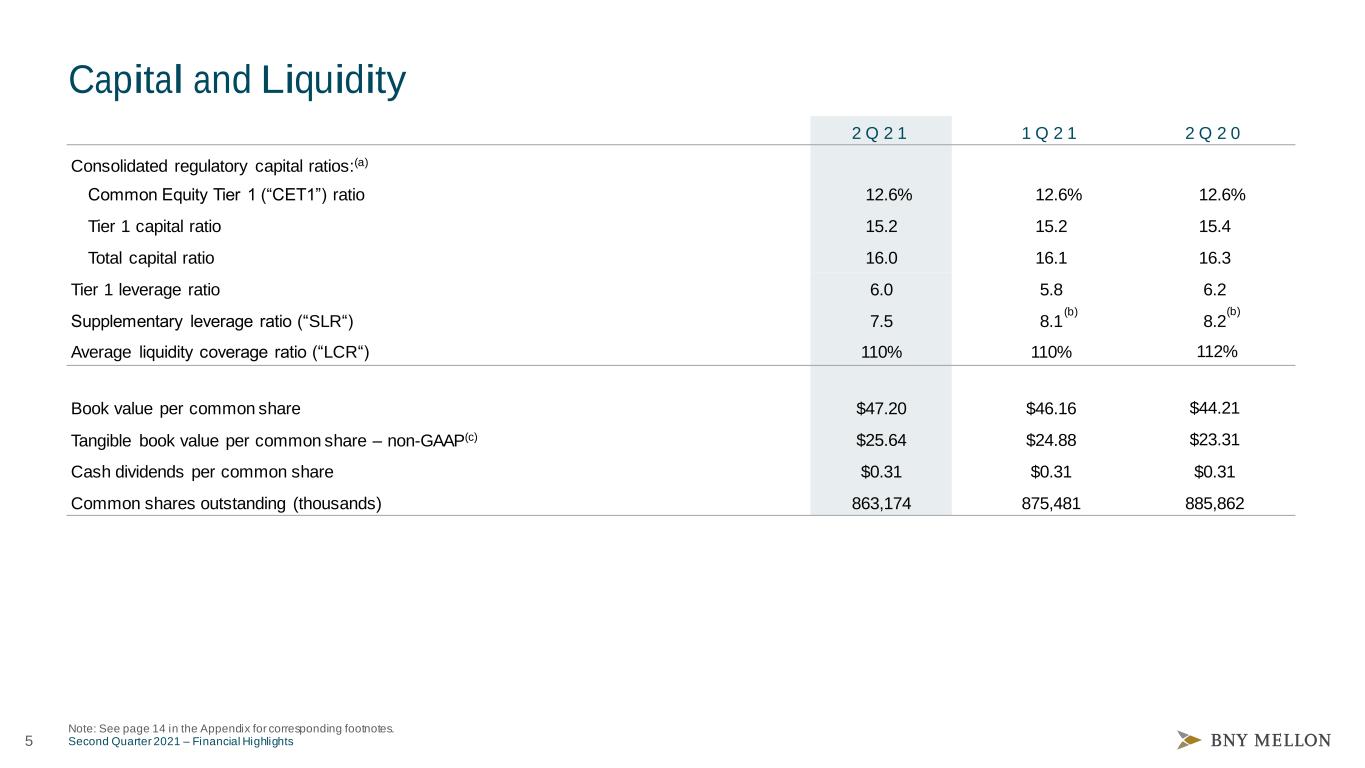
5 Second Quarter 2021 – Financial Highlights Capital and Liquidity Note: See page 14 in the Appendix for corresponding footnotes. 2 Q 2 1 1 Q 2 1 2 Q 2 0 Consolidated regulatory capital ratios:(a) Common Equity Tier 1 (“CET1”) ratio 12.6% 12.6% 12.6% Tier 1 capital ratio 15.2 15.2 15.4 Total capital ratio 16.0 16.1 16.3 Tier 1 leverage ratio 6.0 5.8 6.2 Supplementary leverage ratio (“SLR“) 7.5 8.1 8.2 Average liquidity coverage ratio (“LCR“) 110% 110% 112% Book value per common share $47.20 $46.16 $44.21 Tangible book value per common share – non-GAAP(c) $25.64 $24.88 $23.31 Cash dividends per common share $0.31 $0.31 $0.31 Common shares outstanding (thousands) 863,174 875,481 885,862 (b) (b)
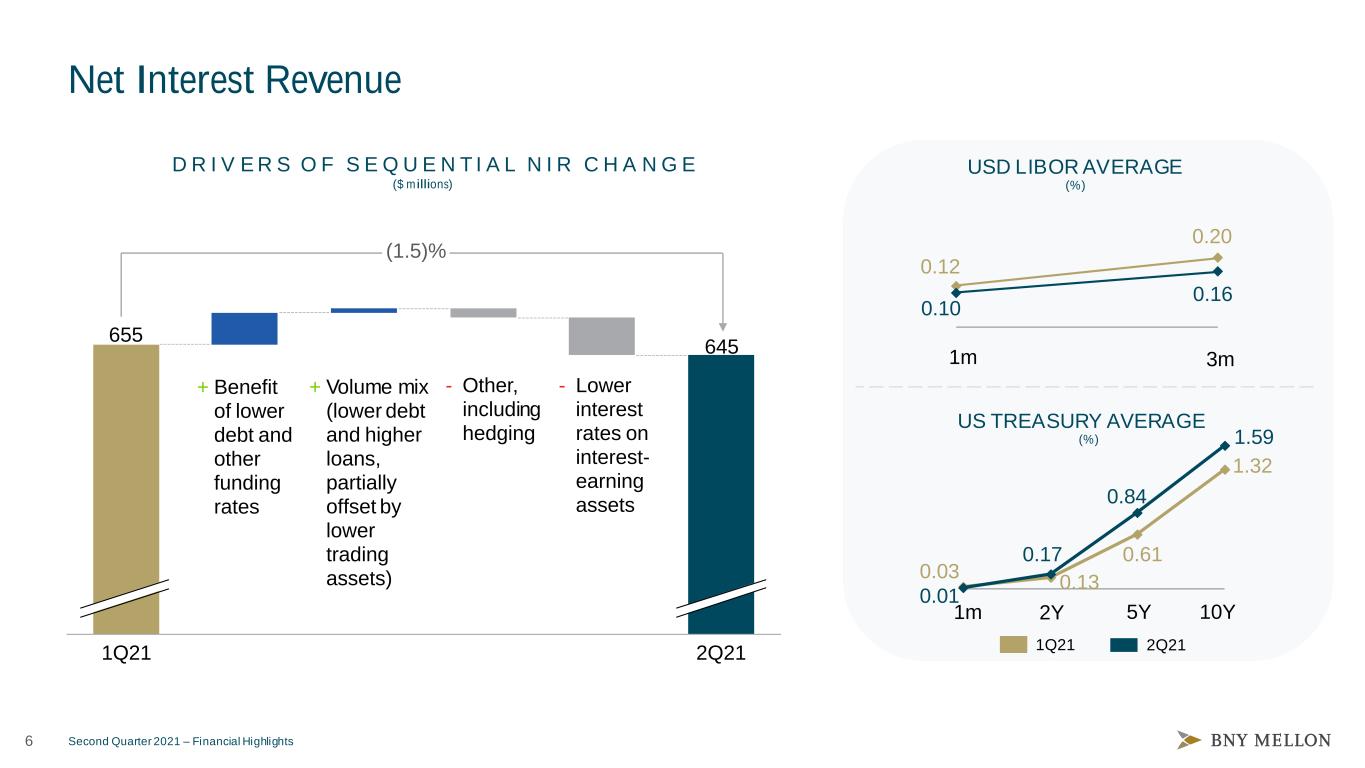
6 Second Quarter 2021 – Financial Highlights Net Interest Revenue ($ millions) - Lower interest rates on interest- earning assets - Other, including hedging + Benefit of lower debt and other funding rates D R I V E R S O F S E Q U E N T I A L N I R C H A N G E 2Q211Q21 655 645 + Volume mix (lower debt and higher loans, partially offset by lower trading assets) 2Q211Q21 (1.5)% 0.03 0.13 0.61 1.32 0.01 0.17 0.84 1.59 0.12 0.20 0.10 0.16 USD LIBOR AVERAGE 1m 3m 5Y2Y 10Y US TREASURY AVERAGE (%) (%) 1m
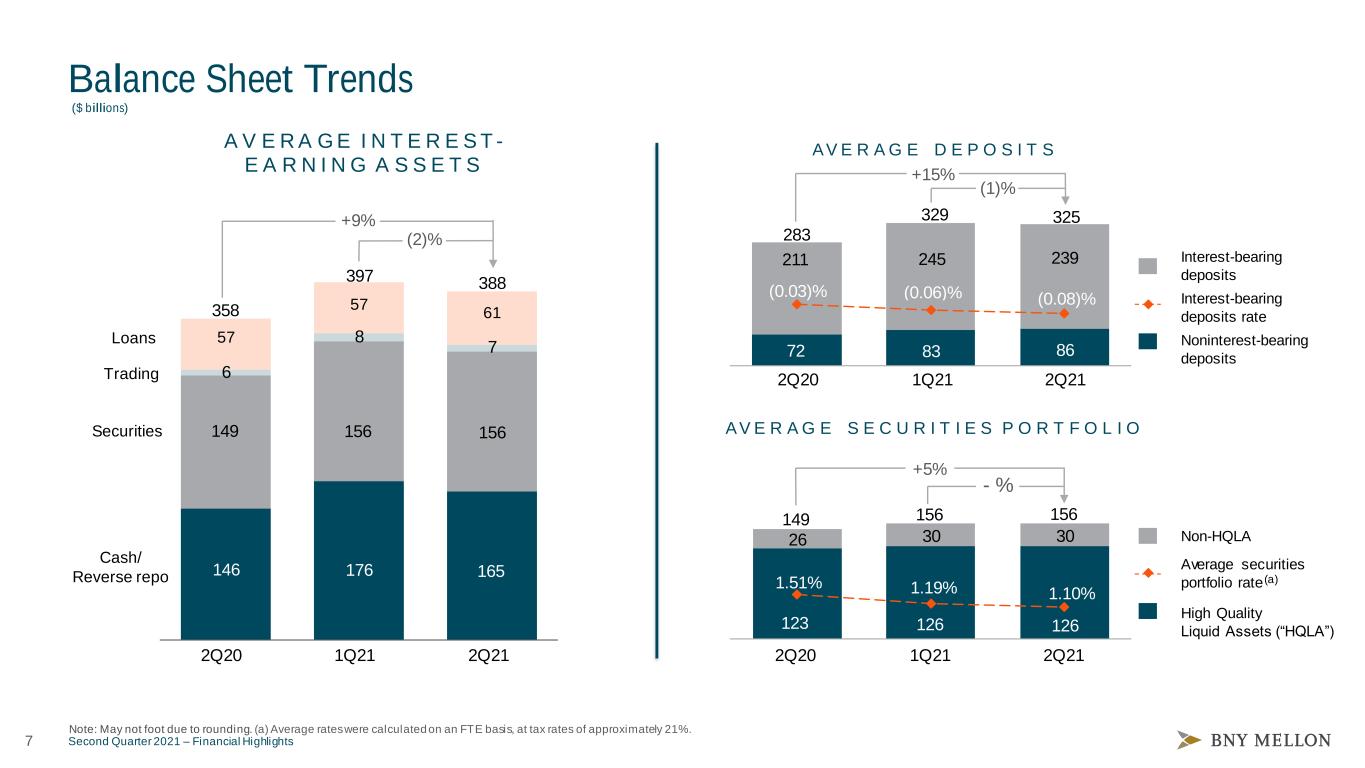
7 Second Quarter 2021 – Financial Highlights 123 126 126 26 30 30 1.51% 1.19% 1.10% 0.00 2.00 4.00 0.0 50.0 100.0 150.0 200.0 Balance Sheet Trends AV E R A G E D E P O S I T S Interest-bearing deposits rate AV E R A G E S E C U R I T I E S P O R T F O L I O Average securities portfolio rate High Quality Liquid Assets (“HQLA”) Non-HQLA 149 156 156 1Q212Q20 2Q21 +5% - % Note: May not foot due to rounding. (a) Average rates were calculated on an FTE basis, at tax rates of approximately 21%. (a) 72 83 86 211 245 239 (0.03)% (0.06)% (0.08)% 1Q212Q20 2Q21 329 283 325 Interest-bearing deposits +15% Noninterest-bearing deposits (1)% 146 176 165 149 156 156 6 8 7 57 57 61 A V E R A G E I N T E R E S T - E A R N I N G A S S E T S Securities Loans Cash/ Reverse repo 2Q211Q212Q20 388 358 397 (2)% +9% ($ billions) Trading
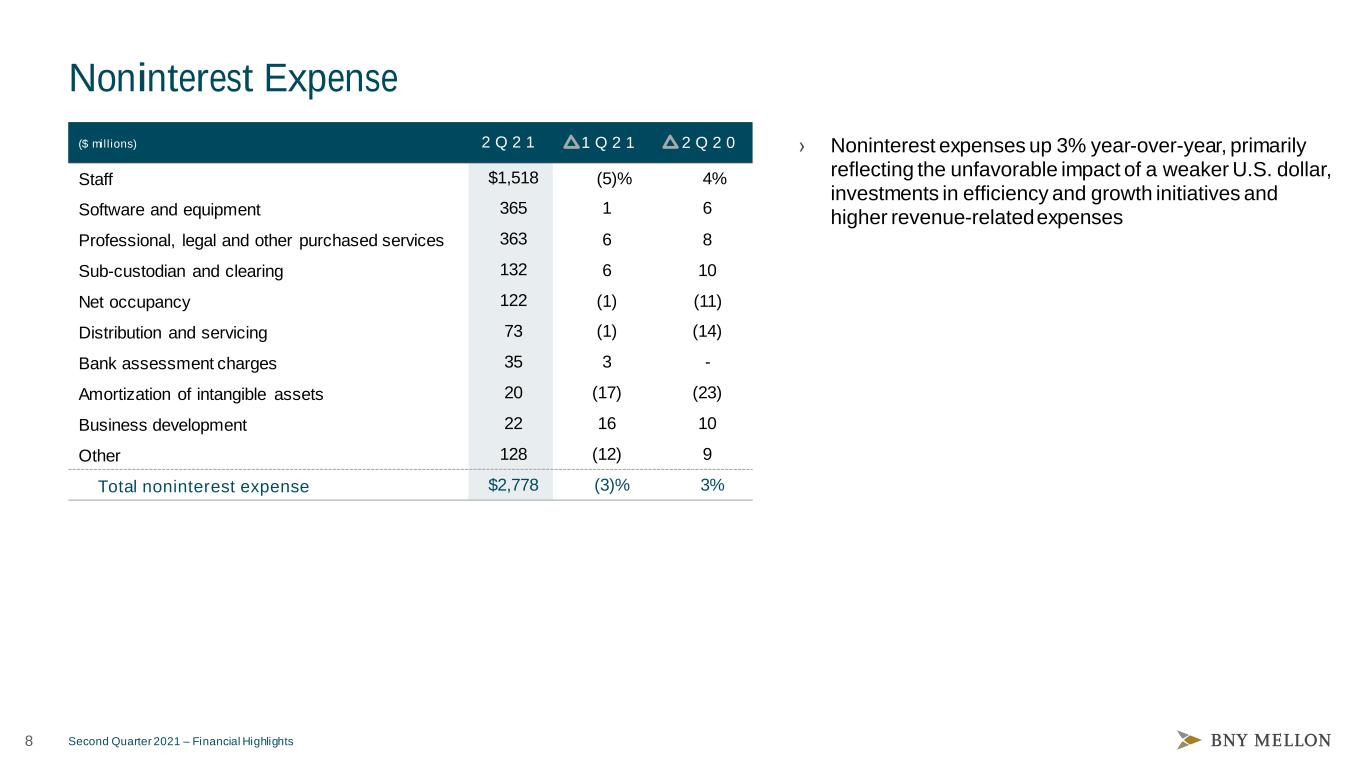
8 Second Quarter 2021 – Financial Highlights Noninterest Expense › Noninterest expenses up 3% year-over-year, primarily reflecting the unfavorable impact of a weaker U.S. dollar, investments in efficiency and growth initiatives and higher revenue-related expenses 2 Q 2 1 1 Q 2 1 2 Q 2 0 Staff $1,518 (5)% 4% Software and equipment 365 1 6 Professional, legal and other purchased services 363 6 8 Sub-custodian and clearing 132 6 10 Net occupancy 122 (1) (11) Distribution and servicing 73 (1) (14) Bank assessment charges 35 3 - Amortization of intangible assets 20 (17) (23) Business development 22 16 10 Other 128 (12) 9 Total noninterest expense $2,778 (3)% 3% ($ mill ions)
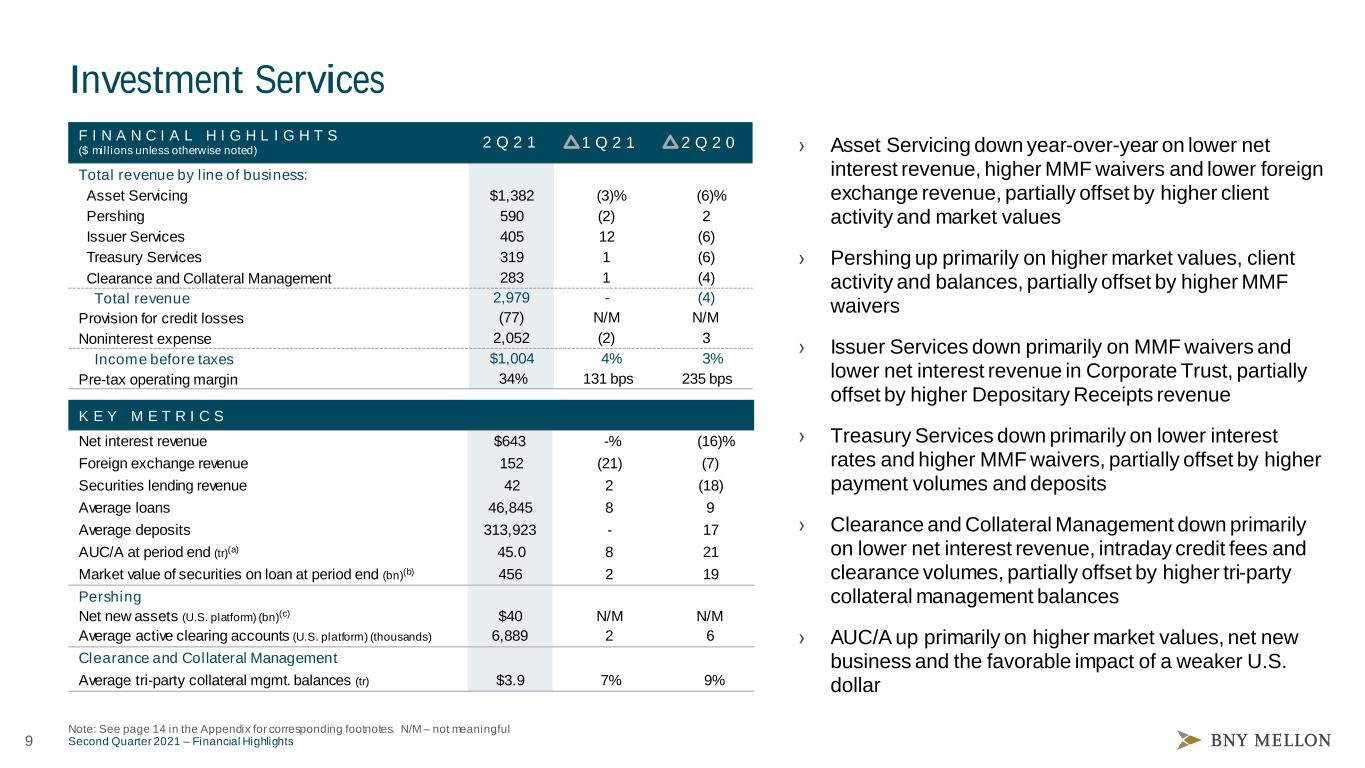
9 Second Quarter 2021 – Financial Highlights Investment Services Note: See page 14 in the Appendix for corresponding footnotes. N/M – not meaningful › Asset Servicing down year-over-year on lower net interest revenue, higher MMF waivers and lower foreign exchange revenue, partially offset by higher client activity and market values › Pershing up primarily on higher market values, client activity and balances, partially offset by higher MMF waivers › Issuer Services down primarily on MMF waivers and lower net interest revenue in Corporate Trust, partially offset by higher Depositary Receipts revenue › Treasury Services down primarily on lower interest rates and higher MMF waivers, partially offset by higher payment volumes and deposits › Clearance and Collateral Management down primarily on lower net interest revenue, intraday credit fees and clearance volumes, partially offset by higher tri-party collateral management balances › AUC/A up primarily on higher market values, net new business and the favorable impact of a weaker U.S. dollar F I N A N C I A L H I G H L I G H T S ($ mill ions unless otherwise noted) 2 Q 2 1 1 Q 2 1 2 Q 2 0 Total revenue by line of business: Asset Servicing $1,382 (3)% (6)% Pershing 590 (2) 2 Issuer Services 405 12 (6) Treasury Services 319 1 (6) Clearance and Collateral Management 283 1 (4) Total revenue 2,979 - (4) Provision for credit losses (77) N/M N/M Noninterest expense 2,052 (2) 3 Income before taxes $1,004 4% 3% Pre-tax operating margin 34% 131 bps 235 bps K E Y M E T R I C S Net interest revenue $643 -% (16)% Foreign exchange revenue 152 (21) (7) Securities lending revenue 42 2 (18) Average loans 46,845 8 9 Average deposits 313,923 - 17 AUC/A at period end (tr)(a) 45.0 8 21 Market value of securities on loan at period end (bn)(b) 456 2 19 Pershing Net new assets (U.S. platform) (bn)(c) $40 N/M N/M Average active clearing accounts (U.S. platform) (thousands) 6,889 2 6 Clearance and Collateral Management Average tri-party collateral mgmt. balances (tr) $3.9 7% 9%
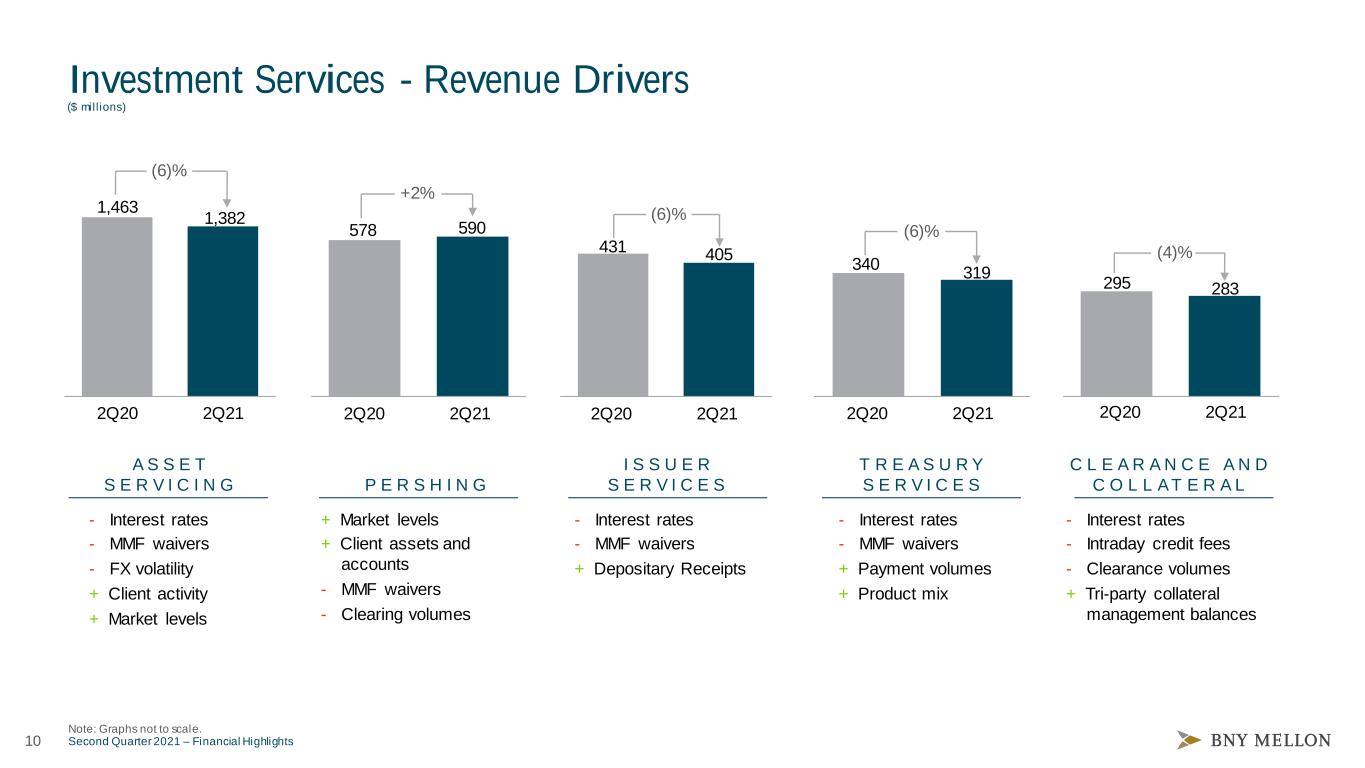
10 Second Quarter 2021 – Financial Highlights Investment Services - Revenue Drivers A S S E T S E R V I C I N G I S S U E R S E R V I C E SP E R S H I N G T R E A S U R Y S E R V I C E S C L E A R A N C E A N D C O L L AT E R A L - Interest rates - MMF waivers - FX volatility + Client activity + Market levels + Market levels + Client assets and accounts - MMF waivers - Clearing volumes - Interest rates - MMF waivers + Payment volumes + Product mix - Interest rates - Intraday credit fees - Clearance volumes + Tri-party collateral management balances 1,463 1,382 2Q20 2Q21 578 590 431 405 340 319 295 283 (6)% +2% (6)% (4)% ($ mill ions) 2Q20 2Q21 2Q20 2Q21 2Q20 2Q21 2Q20 2Q21 - Interest rates - MMF waivers + Depositary Receipts Note: Graphs not to scale. (6)%
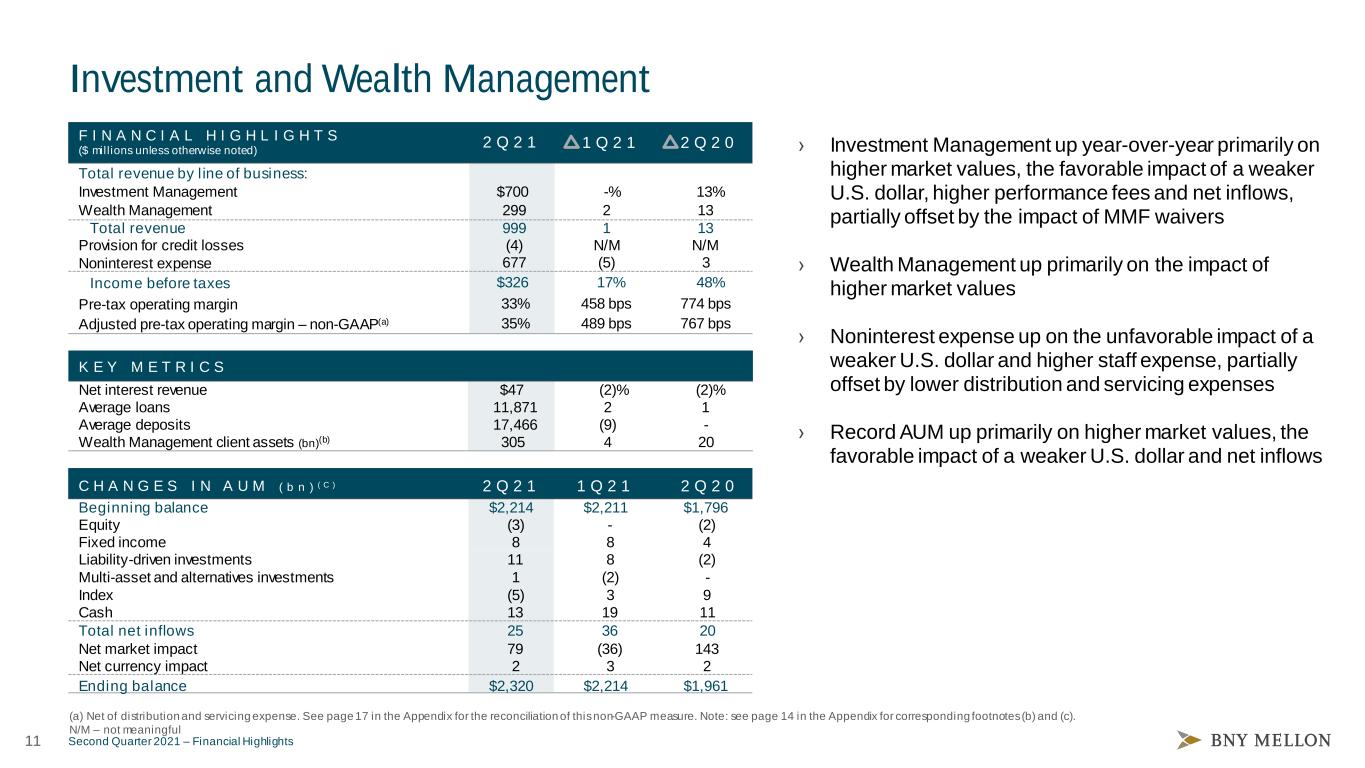
11 Second Quarter 2021 – Financial Highlights Investment and Wealth Management (a) Net of distribution and servicing expense. See page 17 in the Appendix for the reconciliation of this non-GAAP measure. Note: see page 14 in the Appendix for corresponding footnotes (b) and (c). N/M – not meaningful › Investment Management up year-over-year primarily on higher market values, the favorable impact of a weaker U.S. dollar, higher performance fees and net inflows, partially offset by the impact of MMF waivers › Wealth Management up primarily on the impact of higher market values › Noninterest expense up on the unfavorable impact of a weaker U.S. dollar and higher staff expense, partially offset by lower distribution and servicing expenses › Record AUM up primarily on higher market values, the favorable impact of a weaker U.S. dollar and net inflows F I N A N C I A L H I G H L I G H T S ($ mill ions unless otherwise noted) 2 Q 2 1 1 Q 2 1 2 Q 2 0 Total revenue by line of business: Investment Management $700 -% 13% Wealth Management 299 2 13 Total revenue 999 1 13 Provision for credit losses (4) N/M N/M Noninterest expense 677 (5) 3 Income before taxes $326 17% 48% Pre-tax operating margin 33% 458 bps 774 bps Adjusted pre-tax operating margin – non-GAAP(a) 35% 489 bps 767 bps K E Y M E T R I C S Net interest revenue $47 (2)% (2)% Average loans 11,871 2 1 Average deposits 17,466 (9) - Wealth Management client assets (bn)(b) 305 4 20 C H A N G E S I N A U M ( b n ) ( C ) 2 Q 2 1 1 Q 2 1 2 Q 2 0 Beginning balance $2,214 $2,211 $1,796 Equity (3) - (2) Fixed income 8 8 4 Liability-driven investments 11 8 (2) Multi-asset and alternatives investments 1 (2) - Index (5) 3 9 Cash 13 19 11 Total net inflows 25 36 20 Net market impact 79 (36) 143 Net currency impact 2 3 2 Ending balance $2,320 $2,214 $1,961
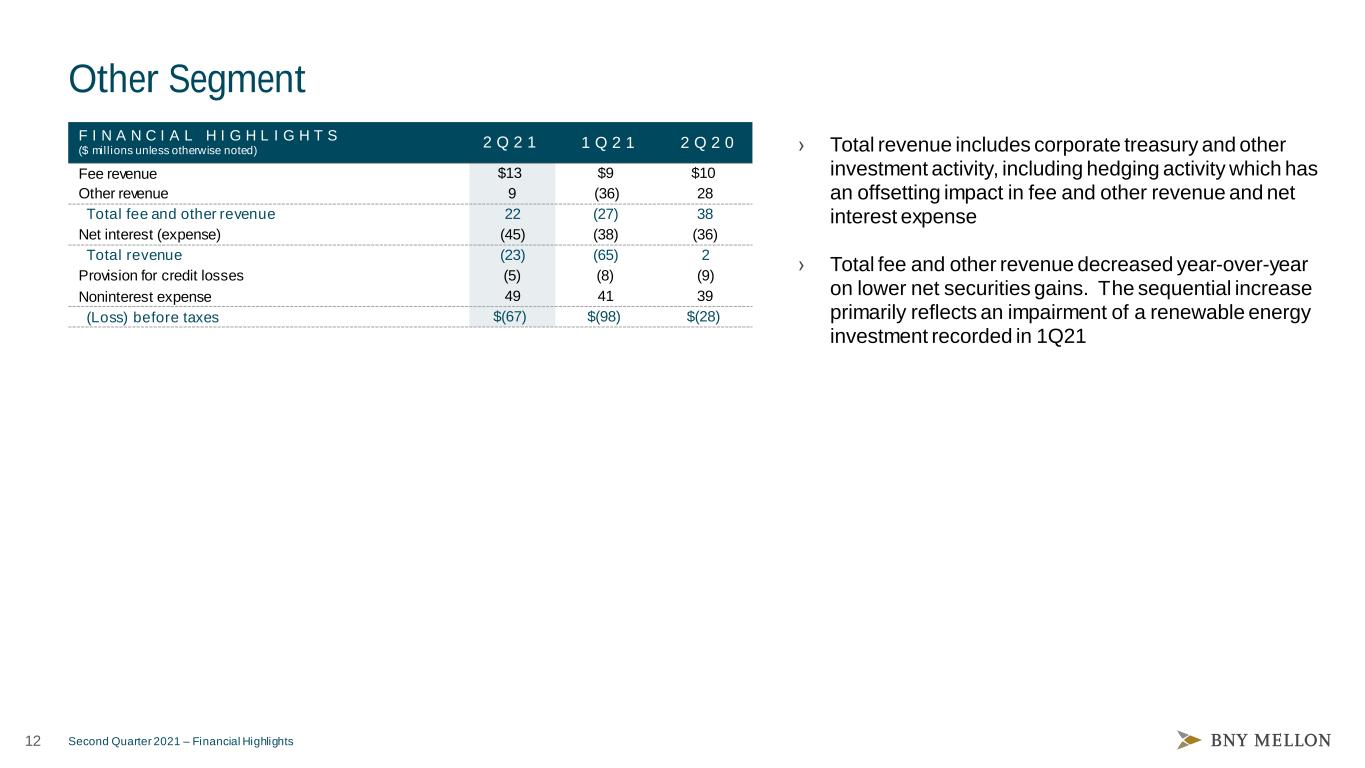
12 Second Quarter 2021 – Financial Highlights Other Segment › Total revenue includes corporate treasury and other investment activity, including hedging activity which has an offsetting impact in fee and other revenue and net interest expense › Total fee and other revenue decreased year-over-year on lower net securities gains. The sequential increase primarily reflects an impairment of a renewable energy investment recorded in 1Q21 F I N A N C I A L H I G H L I G H T S ($ mill ions unless otherwise noted) 2 Q 2 1 1 Q 2 1 2 Q 2 0 Fee revenue $13 $9 $10 Other revenue 9 (36) 28 Total fee and other revenue 22 (27) 38 Net interest (expense) (45) (38) (36) Total revenue (23) (65) 2 Provision for credit losses (5) (8) (9) Noninterest expense 49 41 39 (Loss) before taxes $(67) $(98) $(28)

Appendix
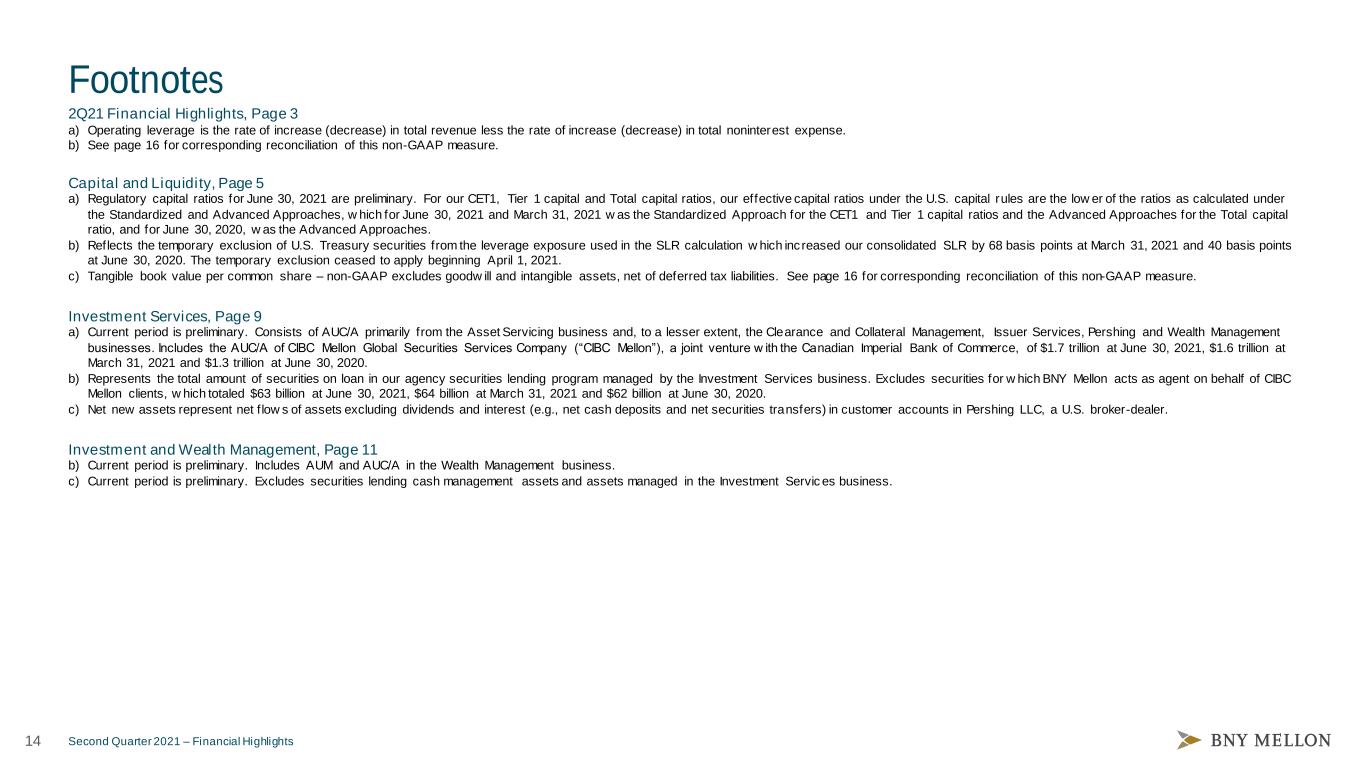
14 Second Quarter 2021 – Financial Highlights Footnotes 2Q21 Financial Highlights, Page 3 a) Operating leverage is the rate of increase (decrease) in total revenue less the rate of increase (decrease) in total noninterest expense. b) See page 16 for corresponding reconciliation of this non-GAAP measure. Capital and Liquidity, Page 5 a) Regulatory capital ratios for June 30, 2021 are preliminary. For our CET1, Tier 1 capital and Total capital ratios, our effective capital ratios under the U.S. capital rules are the low er of the ratios as calculated under the Standardized and Advanced Approaches, w hich for June 30, 2021 and March 31, 2021 w as the Standardized Approach for the CET1 and Tier 1 capital ratios and the Advanced Approaches for the Total capital ratio, and for June 30, 2020, w as the Advanced Approaches. b) Reflects the temporary exclusion of U.S. Treasury securities from the leverage exposure used in the SLR calculation w hich inc reased our consolidated SLR by 68 basis points at March 31, 2021 and 40 basis points at June 30, 2020. The temporary exclusion ceased to apply beginning April 1, 2021. c) Tangible book value per common share – non-GAAP excludes goodw ill and intangible assets, net of deferred tax liabilities. See page 16 for corresponding reconciliation of this non-GAAP measure. Investment Services, Page 9 a) Current period is preliminary. Consists of AUC/A primarily from the Asset Servicing business and, to a lesser extent, the Clearance and Collateral Management, Issuer Services, Pershing and Wealth Management businesses. Includes the AUC/A of CIBC Mellon Global Securities Services Company (“CIBC Mellon”), a joint venture w ith the Canadian Imperial Bank of Commerce, of $1.7 trillion at June 30, 2021, $1.6 trillion at March 31, 2021 and $1.3 trillion at June 30, 2020. b) Represents the total amount of securities on loan in our agency securities lending program managed by the Investment Services business. Excludes securities for w hich BNY Mellon acts as agent on behalf of CIBC Mellon clients, w hich totaled $63 billion at June 30, 2021, $64 billion at March 31, 2021 and $62 billion at June 30, 2020. c) Net new assets represent net f low s of assets excluding dividends and interest (e.g., net cash deposits and net securities transfers) in customer accounts in Pershing LLC, a U.S. broker-dealer. Investment and Wealth Management, Page 11 b) Current period is preliminary. Includes AUM and AUC/A in the Wealth Management business. c) Current period is preliminary. Excludes securities lending cash management assets and assets managed in the Investment Servic es business.
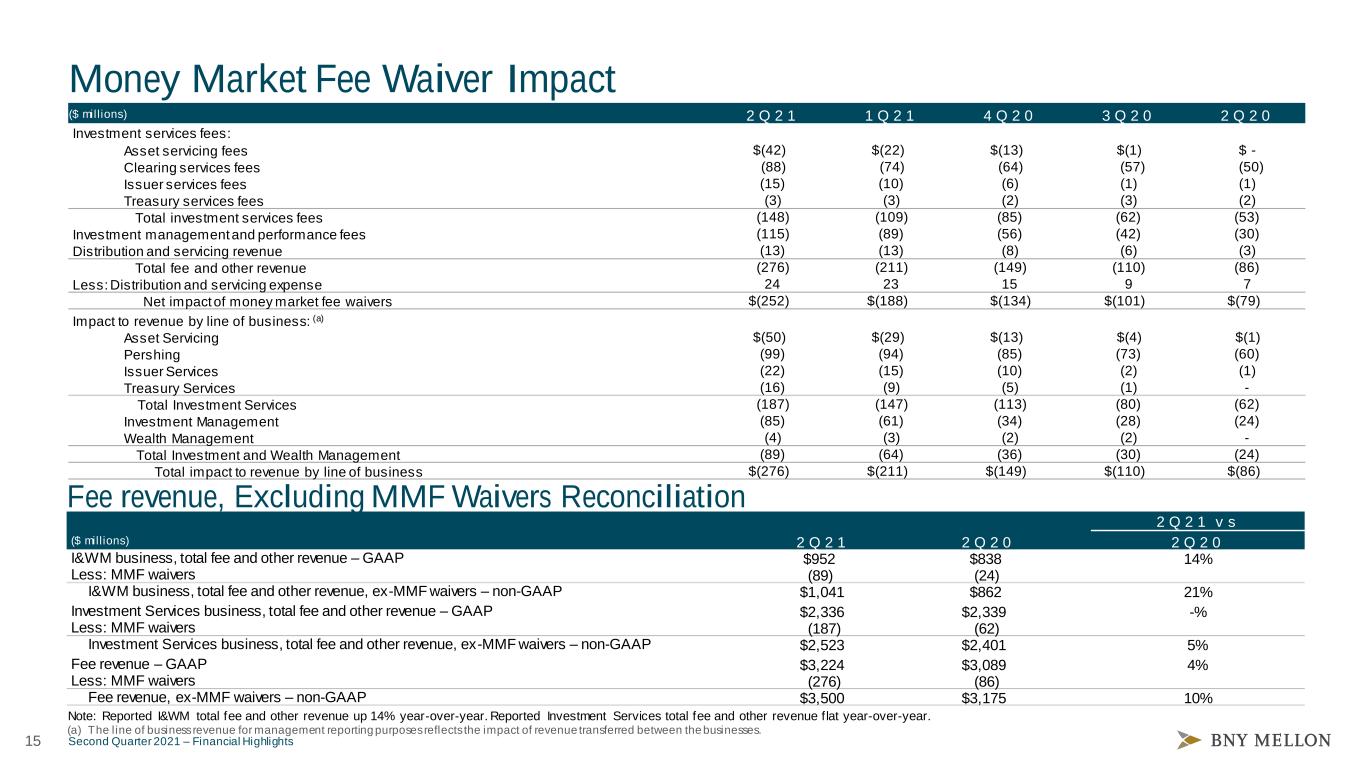
15 Second Quarter 2021 – Financial Highlights Money Market Fee Waiver Impact 2 Q 2 1 1 Q 2 1 4 Q 2 0 3 Q 2 0 2 Q 2 0 Investment services fees: Asset servicing fees $(42) $(22) $(13) $(1) $ - Clearing services fees (88) (74) (64) (57) (50) Issuer services fees (15) (10) (6) (1) (1) Treasury services fees (3) (3) (2) (3) (2) Total investment services fees (148) (109) (85) (62) (53) Investment management and performance fees (115) (89) (56) (42) (30) Distribution and servicing revenue (13) (13) (8) (6) (3) Total fee and other revenue (276) (211) (149) (110) (86) Less: Distribution and servicing expense 24 23 15 9 7 Net impact of money market fee waivers $(252) $(188) $(134) $(101) $(79) Impact to revenue by line of business: (a) Asset Servicing $(50) $(29) $(13) $(4) $(1) Pershing (99) (94) (85) (73) (60) Issuer Services (22) (15) (10) (2) (1) Treasury Services (16) (9) (5) (1) - Total Investment Services (187) (147) (113) (80) (62) Investment Management (85) (61) (34) (28) (24) Wealth Management (4) (3) (2) (2) - Total Investment and Wealth Management (89) (64) (36) (30) (24) Total impact to revenue by line of business $(276) $(211) $(149) $(110) $(86) (a) The line of business revenue for management reporting purposes reflects the impact of revenue transferred between the businesses. Fee revenue, Excluding MMF Waivers Reconciliation 2 Q 2 1 v s ($ mill ions) 2 Q 2 1 2 Q 2 0 2 Q 2 0 I&WM business, total fee and other revenue – GAAP $952 $838 14% Less: MMF waivers (89) (24) I&WM business, total fee and other revenue, ex-MMF waivers – non-GAAP $1,041 $862 21% Investment Services business, total fee and other revenue – GAAP $2,336 $2,339 -% Less: MMF waivers (187) (62) Investment Services business, total fee and other revenue, ex-MMF waivers – non-GAAP $2,523 $2,401 5% Fee revenue – GAAP $3,224 $3,089 4% Less: MMF waivers (276) (86) Fee revenue, ex-MMF waivers – non-GAAP $3,500 $3,175 10% Note: Reported I&WM total fee and other revenue up 14% year-over-year. Reported Investment Services total fee and other revenue flat year-over-year. ($ mill ions)
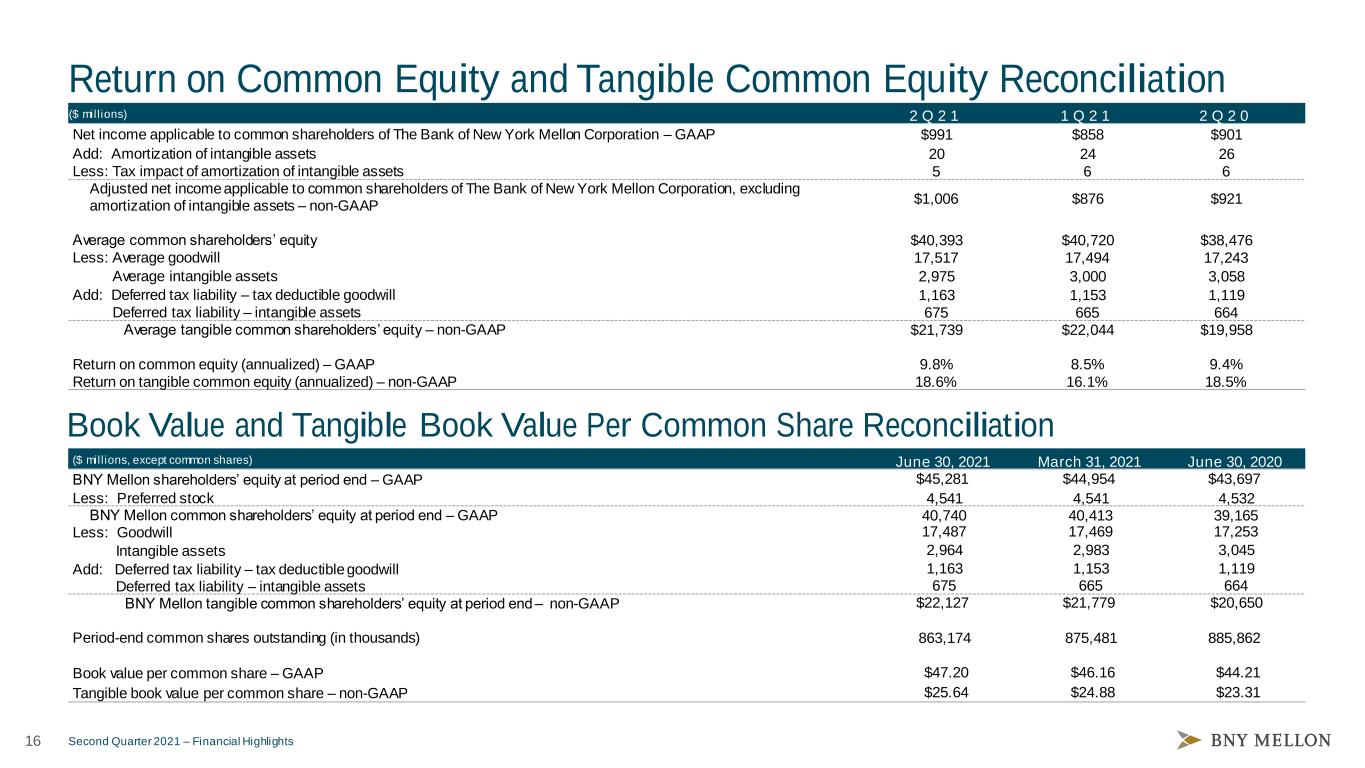
16 Second Quarter 2021 – Financial Highlights Return on Common Equity and Tangible Common Equity Reconciliation 2 Q 2 1 1 Q 2 1 2 Q 2 0 Net income applicable to common shareholders of The Bank of New York Mellon Corporation – GAAP $991 $858 $901 Add: Amortization of intangible assets 20 24 26 Less: Tax impact of amortization of intangible assets 5 6 6 Adjusted net income applicable to common shareholders of The Bank of New York Mellon Corporation, excluding amortization of intangible assets – non-GAAP $1,006 $876 $921 Average common shareholders’ equity $40,393 $40,720 $38,476 Less: Average goodwill 17,517 17,494 17,243 Average intangible assets 2,975 3,000 3,058 Add: Deferred tax liability – tax deductible goodwill 1,163 1,153 1,119 Deferred tax liability – intangible assets 675 665 664 Average tangible common shareholders’ equity – non-GAAP $21,739 $22,044 $19,958 Return on common equity (annualized) – GAAP 9.8% 8.5% 9.4% Return on tangible common equity (annualized) – non-GAAP 18.6% 16.1% 18.5% Book Value and Tangible Book Value Per Common Share Reconciliation ($ mill ions, except common shares) June 30, 2021 March 31, 2021 June 30, 2020 BNY Mellon shareholders’ equity at period end – GAAP $45,281 $44,954 $43,697 Less: Preferred stock 4,541 4,541 4,532 BNY Mellon common shareholders’ equity at period end – GAAP 40,740 40,413 39,165 Less: Goodwill 17,487 17,469 17,253 Intangible assets 2,964 2,983 3,045 Add: Deferred tax liability – tax deductible goodwill 1,163 1,153 1,119 Deferred tax liability – intangible assets 675 665 664 BNY Mellon tangible common shareholders’ equity at period end – non-GAAP $22,127 $21,779 $20,650 Period-end common shares outstanding (in thousands) 863,174 875,481 885,862 Book value per common share – GAAP $47.20 $46.16 $44.21 Tangible book value per common share – non-GAAP $25.64 $24.88 $23.31 ($ mill ions)
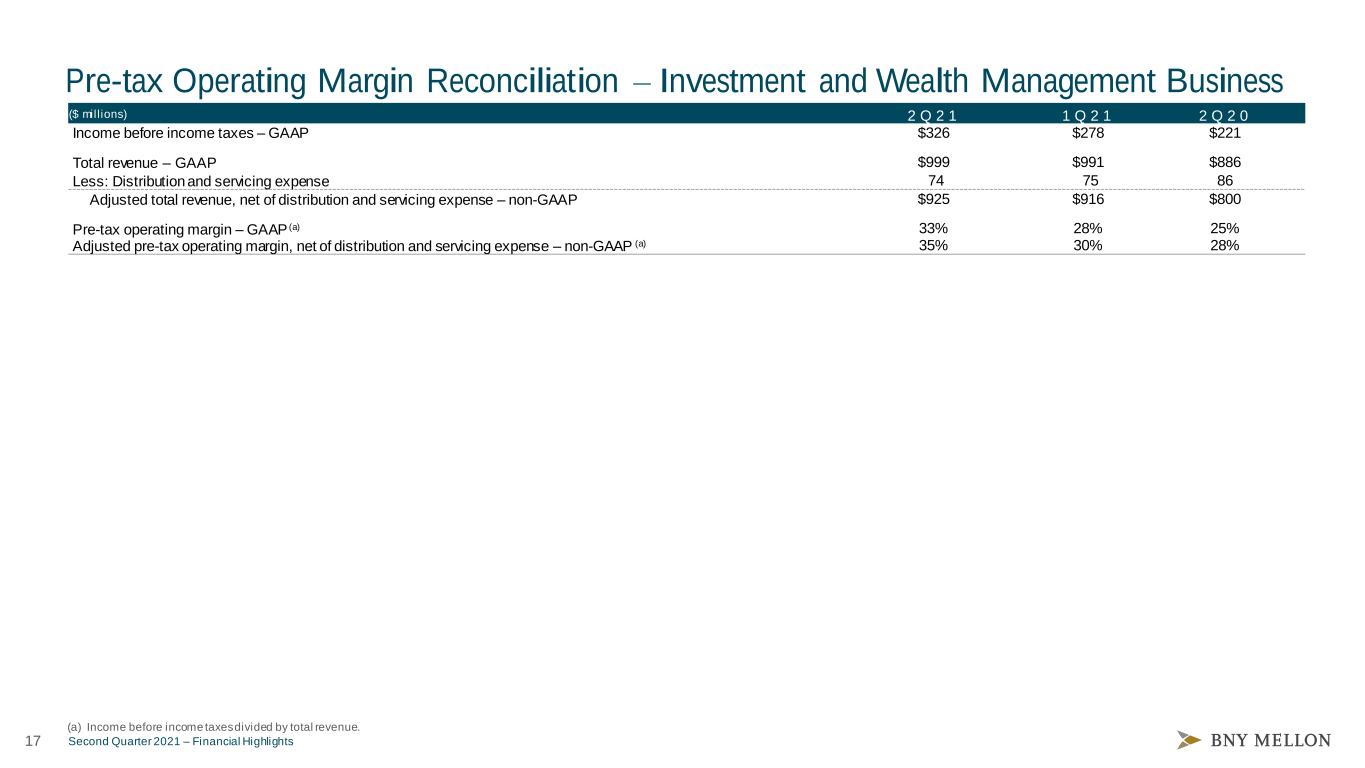
17 Second Quarter 2021 – Financial Highlights Pre-tax Operating Margin Reconciliation – Investment and Wealth Management Business (a) Income before income taxes divided by total revenue. 2 Q 2 1 1 Q 2 1 2 Q 2 0 Income before income taxes – GAAP $326 $278 $221 Total revenue – GAAP $999 $991 $886 Less: Distribution and servicing expense 74 75 86 Adjusted total revenue, net of distribution and servicing expense – non-GAAP $925 $916 $800 Pre-tax operating margin – GAAP (a) 33% 28% 25% Adjusted pre-tax operating margin, net of distribution and servicing expense – non-GAAP (a) 35% 30% 28% ($ mill ions)
18 Second Quarter 2021 – Financial Highlights Cautionary Statement A number of statements in this discussion and the responses to your questions may contain “forward-looking statements,” including statements about The Bank of New York Mellon Corporation’s (the “Corporation”) capital plans, strategic priorities, financial goals, organic growth, performance, organizational quality and efficiency, investments, including in technology and product development, resiliency, capabilities, revenue, net interest revenue, money market fee waivers, fees, expenses, cost discipline, sustainable growth, company management, human capital management (including related ambitions, objectives, aims and goals), deposits, interest rates and yield curves, securities portfolio, taxes, business opportunities, divestments, volatility, preliminary business metrics and regulatory capital ratios and statements regarding the Corporation's aspirations, as well as the Corporation’s overall plans, strategies, goals, objectives, expectations, outlooks, estimates, intentions, targets, opportunities, focus and initiatives, including the potential effects of the coronavirus pandemic on any of the foregoing. These statements may be expressed in a variety of ways, including the use of future or present tense language. Words such as “estimate,” “forecast,” “project,” “anticipate,” “likely,” “target,” “expect,” “intend,” “continue,” “seek,” “believe,” “plan,” “goal,” “could,” “should,” “would,” “may,” “might,” “will,” “strategy,” “synergies,” “opportunities,” “trends,” “ambition”, “objective,” “aim,” “future,” “potent ially,” “outlook” and words of similar meaning may signify forward-looking statements. These forward-looking statements are based upon current beliefs and expectations and are subject to significant risks and uncertainties (some of which are beyond the Corporation’s control). Actual outcomes may differ materially from those expressed or implied as a result of a number of factors, including, but not limited to, those discussed in “Risk Factors” in the Corporation’s Annual Report on Form 10-K for the year ended December 31, 2020 (the “2020 Annual Report”) and in other filings of the Corporation with the Securities and Exchange Commission (the “SEC”). Statements about the effects of the current and near-term market and macroeconomic outlook on the Corporation, including on its business, operations, financial performance and prospects, may constitute forward- looking statements, and are based on assumptions that involve risks and uncertainties and that are subject to change based on various important factors (some of which are beyond the Corporation's control), including the scope and duration of the pandemic, actions taken by governmental authorities and other third parties in response to the pandemic, the availability, use and effectiveness of vaccines, and the direct and indirect impact of the pandemic on the Corporation, its clients, customers and third parties. Preliminary business metrics and regulatory capital ratios are subject to change, possibly materially, as the Corporation completes its Quarterly Report on Form 10-Q for the quarter ended June 30, 2021. All forward-looking statements speak only as of July 15, 2021, and the Corporation undertakes no obligation to update any forward-looking statement to reflect events or circumstances after that date or to reflect the occurrence of unanticipated events. For additional information regarding the Corporation, please refer to the Corporation's SEC filings available at www.bnymellon.com/investorrelations. Non-GAAP Measures: In this presentation we discuss certain non-GAAP measures in detailing the Corporation’s performance, which exclude certain items or otherwise include components that differ from GAAP. We believe these measures are useful to the investment community in analyzing the financial results and trends of ongoing operations. We believe they facilitate comparisons with prior periods and reflect the principal basis on which the Corporation’s management monitors financial performance. Additional disclosures relating to non-GAAP measures are contained in the Corporation’s reports filed with the SEC, including the 2020 Annual Report, the second quarter 2021 earnings release and the second quarter 2021 financial supplement, and are available at www.bnymellon.com/investorrelations.

