Attached files
| file | filename |
|---|---|
| EX-99.2 - EX-99.2 - ADT Inc. | d193317dex992.htm |
| 8-K - 8-K - ADT Inc. | d193317d8k.htm |
Investor Presentation July 15, 2021 Exhibit 99.1
Disclaimer This presentation (the “Presentation”) has been prepared by ADT Inc. (the “Company”) and The ADT Security Corporation (the “Issuer”), an indirect wholly owned subsidiary of the Company, in connection with the issuance of the 1st Lien Senior Secured Notes (the “Notes”), solely for informational purposes. The information contained in this Presentation has been prepared to assist prospective investors in conducting their own evaluation of the Company and does not purport to be complete or to contain all of the information that a prospective investor may require. Prospective investors should conduct their own investigation and analysis of the Company and of the information set forth in this Presentation. The Company makes no representation or warranty as to the accuracy, reliability, reasonableness or completeness of this information and shall not have any liability for any representations regarding information contained in, or for any omission from, this Presentation or any other written or oral communications transmitted to the recipient in the course of its evaluation of the Company. By accepting this Presentation, each receiving prospective investor acknowledges and agrees that all of the information contained herein is confidential and proprietary information of the Company. Each prospective investor agrees that it will not disclose this information to any person or entity other than its directors, officers and employees who have a need to know such information, and will use the information only in connection with its evaluation of the Company and the Notes and will keep such information permanently confidential. The Company and its affiliates, representatives and advisors expressly disclaim any and all liability based, in whole or in part, on the information contained in this Presentation (which only speaks as of the date identified on the cover page of this Presentation), errors therein or omissions therefrom. Neither the Company nor any of its affiliates, representatives or advisors intends to update or otherwise revise the information contained herein to reflect circumstances existing after the date identified on the cover page of this Presentation to reflect the occurrence of future events even if any or all of the assumptions, judgments and estimates on which the information contained herein is based are shown to be in error.
Forward Looking Statements & Non-GAAP Measures The Company has made statements in this Presentation and other reports, filings, and other public written and verbal announcements that are forward-looking and therefore subject to risks and uncertainties. All statements, other than statements of historical fact, included in this document are, or could be, “forward-looking statements” within the meaning of the Private Securities Litigation Reform Act of 1995 and are made in reliance on the safe harbor protections provided thereunder. These forward-looking statements relate to anticipated financial performance, management’s plans and objectives for future operations, business prospects, outcome of regulatory proceedings, market conditions, our ability to successfully respond to the challenges posed by the COVID-19 pandemic, our strategic partnership and ongoing relationship with Google, the expected timing of product commercialization with Google or any changes thereto, the successful internal development, commercialization and timing of our next generation platform and other matters. Any forward-looking statement made in this Presentation speaks only as of the date on which it is made. The Company undertakes no obligation to publicly update or revise any forward-looking statement, whether as a result of new information, future developments or otherwise. Forward-looking statements can be identified by various words such as “expects,” “intends,” “will,” “anticipates,” “believes,” “confident,” “continue,” “propose,” “seeks,” “could,” “may,” “should,” “estimates,” “forecasts,” “might,” “goals,” “objectives,” “targets,” “planned,” “projects,” and similar expressions. These forward-looking statements are based on management’s current beliefs and assumptions and on information currently available to management. The Company cautions that these statements are subject to risks and uncertainties, many of which are outside of the Company’s control, and could cause future events or results to be materially different from those stated or implied in this document, including among others, risk factors that are described in the Company’s Annual Report on Form 10-K, Quarterly Reports on Form 10-Q, Current Reports on Form 8-K, and other filings with the Securities and Exchange Commission, including the sections entitled “Risk Factors” and “Management’s Discussion and Analysis of Financial Condition and Results of Operations” contained therein. Forward Looking Statements To provide investors with additional information in connection with our results as determined in accordance with generally accepted accounting principles in the United States (“GAAP”), we disclose Adjusted EBITDA, Adjusted EBITDA margin, Covenant Adjusted EBITDA (Pre-SAC), Free Cash Flow, Adjusted Free Cash Flow, and various leverage ratios as non-GAAP measures. Reconciliations from GAAP to non-GAAP financials measures for reported results can be found in the appendix. The operating metrics Gross Customer Revenue Attrition, Unit Count, Unit Additions, RMR, RMR additions, and Revenue Payback are approximated as there may be variations to reported results in each period due to certain adjustments we might make in connection with the integration over several periods of acquired companies that calculated these metrics differently, or otherwise, including periodic reassessments and refinements in the ordinary course of business. These refinements, for example, may include changes due to systems conversion or historical methodology differences in legacy systems. Note: Amounts on subsequent pages may not add due to rounding. Non-GAAP Measures This Presentation includes industry and trade data, forecasts and information that was prepared based, in part, upon data, forecasts and information obtained from independent trade associations, industry publications and surveys and other independent sources available to the Company. Some data also are based on the Company’s good faith estimates, which are derived from our knowledge of the industry and from independent sources. These third-party publications and surveys generally state that the information included therein has been obtained from sources believed to be reliable, but that the publications and surveys can give no assurance as to the accuracy or completeness of such information. The Company has not independently verified any of the data from third-party sources nor has it ascertained the underlying economic assumptions on which such data are based. Market and Industry Data
Non-GAAP Measures To provide investors with additional information in connection with our results, as determined in accordance with generally accepted accounting principles in the United States (“GAAP”), we disclose Adjusted EBITDA, Adjusted EBITDA margin, Covenant Adjusted EBITDA (Pre-SAC), Free Cash Flow, Adjusted Free Cash Flow, and various leverage ratios as non-GAAP measures. These measures are not financial measures calculated in accordance with GAAP and should not be considered as a substitute for net income, operating income, cash flows, or any other measure calculated in accordance with GAAP, and may not be comparable to similarly titled measures reported by other companies Adjusted EBITDA and Covenant Adjusted EBITDA (Pre-SAC) We believe that the presentation of Adjusted EBITDA is appropriate to provide additional information to investors about our operating profitability adjusted for certain non-cash items, non-routine items that we do not expect to continue at the same level in the future, as well as other items that are not core to our operations. Further, we believe Adjusted EBITDA provides a meaningful measure of operating profitability because we use it for evaluating our business performance, making budgeting decisions, and comparing our performance against that of other peer companies using similar measures. We define Adjusted EBITDA as net income or loss adjusted for (i) interest, (ii) taxes, (iii) depreciation and amortization, including depreciation of subscriber system assets and other fixed assets and amortization of dealer and other intangible assets, (iv) amortization of deferred costs and deferred revenue associated with subscriber acquisitions, (v) share-based compensation expense, (vi) merger, restructuring, integration, and other, (vii) losses on extinguishment of debt, (viii) radio conversion costs, net, (ix) financing and consent fees, (x) foreign currency gains/losses, (xi) acquisition related adjustments, and (xii) other charges and non-cash items. Covenant Adjusted EBITDA (Pre-SAC) also is adjusted for costs in our statement of operations associated with the acquisition of customers, net of revenue associated with the sale of equipment (Expensed Net SAC). There are material limitations to using Adjusted EBITDA and Covenant Adjusted EBITDA (Pre-SAC). Adjusted EBITDA and Covenant Adjusted EBITDA (Pre-SAC) do not take into account certain significant items, including depreciation and amortization, interest, taxes, and other adjustments which directly affect our net income or loss. These limitations are best addressed by considering the economic effects of the excluded items independently, and by considering Adjusted EBITDA and Covenant Adjusted EBITDA (Pre-SAC) in conjunction with net income or loss as calculated in accordance with GAAP. The Adjusted EBITDA discussion above is also applicable to its margin measure, which is calculated as Adjusted EBITDA as a percentage of monitoring and related services revenue. Free Cash Flow We believe that the presentation of Free Cash Flow is appropriate to provide additional information to investors about our ability to repay debt, make other investments, and pay dividends. We define Free Cash Flow as cash flows from operating activities less cash outlays related to capital expenditures. We define capital expenditures to include accounts purchased through our network of authorized dealers or third parties outside of our authorized dealer network; subscriber system asset expenditures; and purchases of property and equipment. These items are subtracted from cash flows from operating activities because they represent long-term investments that are required for normal business activities. Free Cash Flow adjusts for cash items that are ultimately within management’s discretion to direct, and therefore, may imply that there is less or more cash that is available than the most comparable GAAP measure. Free Cash Flow is not intended to represent residual cash flow for discretionary expenditures since debt repayment requirements and other non-discretionary expenditures are not deducted. These limitations are best addressed by using Free Cash Flow in combination with the cash flows as calculated in accordance with GAAP. Adjusted Free Cash Flow We define Adjusted Free Cash Flow as Free Cash Flow adjusted for payments related to (i) net cash flow associated with our consumer receivables facility, (ii) financing and consent fees, (iii) restructuring and integration, (iv) integration related capital expenditures, (v) radio conversion costs, net, and (vi) other payments or receipts that may mask our operating results or business trends. As a result, subject to the limitations described below, Adjusted Free Cash Flow is a useful measure of our cash flow attributable to our normal business activities, inclusive of the net cash flows associated with the acquisition of subscribers, as well as our ability to repay other debt, make other investments, and pay dividends. Adjusted Free Cash Flow adjusts for cash items that are ultimately within management’s discretion to direct, and therefore, may imply that there is less or more cash that is available than the most comparable GAAP measure. Adjusted Free Cash Flow is not intended to represent residual cash flow for discretionary expenditures since debt repayment requirements and other non-discretionary expenditures are not deducted. These limitations are best addressed by using Adjusted Free Cash Flow in combination with the GAAP cash flow numbers. During the second quarter of 2020, Free Cash Flow before special items was renamed Adjusted Free Cash Flow to reflect the net cash flow associated with our consumer receivables facility, which supports our consumer financing program that launched nationally in 2020. The inclusion of the net cash flow associated with our consumer receivables facility represents the only revision to Free Cash Flow before special items. Leverage Ratios Leverage ratios include first lien debt, net first lien debt, total debt, and net total debt, all compared to Covenant Adjusted EBITDA (Pre-SAC). Net first lien debt and net total debt are calculated as first lien debt and total debt, respectively, less cash and cash equivalents. The Company also presents Covenant Adjusted EBITDA (Pre-SAC) to cash interest. Leverage ratios are useful measures of the Company’s credit position and progress towards leverage targets. Refer to discussion on Adjusted EBITDA and Covenant Adjusted EBITDA (Pre-SAC) for a description of the differences between the most comparable GAAP measure. The calculation is limited in that the Company may not always be able to use cash to repay debt on a dollar-for-dollar basis. Finally, the leverage ratios discussed herein may be presented on a pro forma basis.
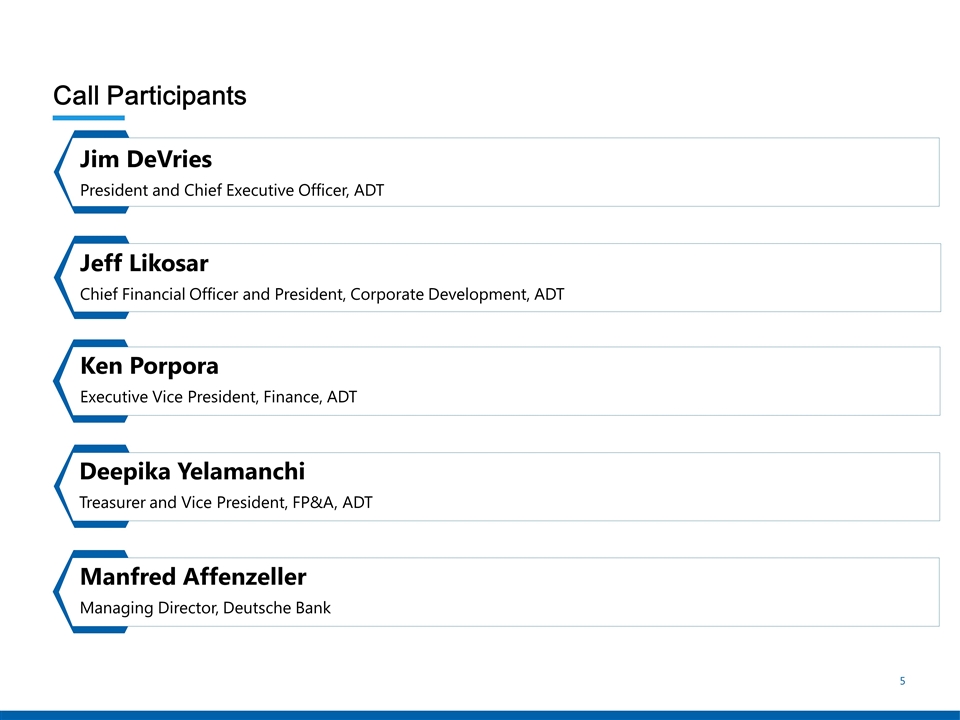
Jim DeVries President and Chief Executive Officer, ADT Call Participants Jeff Likosar Chief Financial Officer and President, Corporate Development, ADT Deepika Yelamanchi Treasurer and Vice President, FP&A, ADT Manfred Affenzeller Managing Director, Deutsche Bank Ken Porpora Executive Vice President, Finance, ADT
Transaction Overview
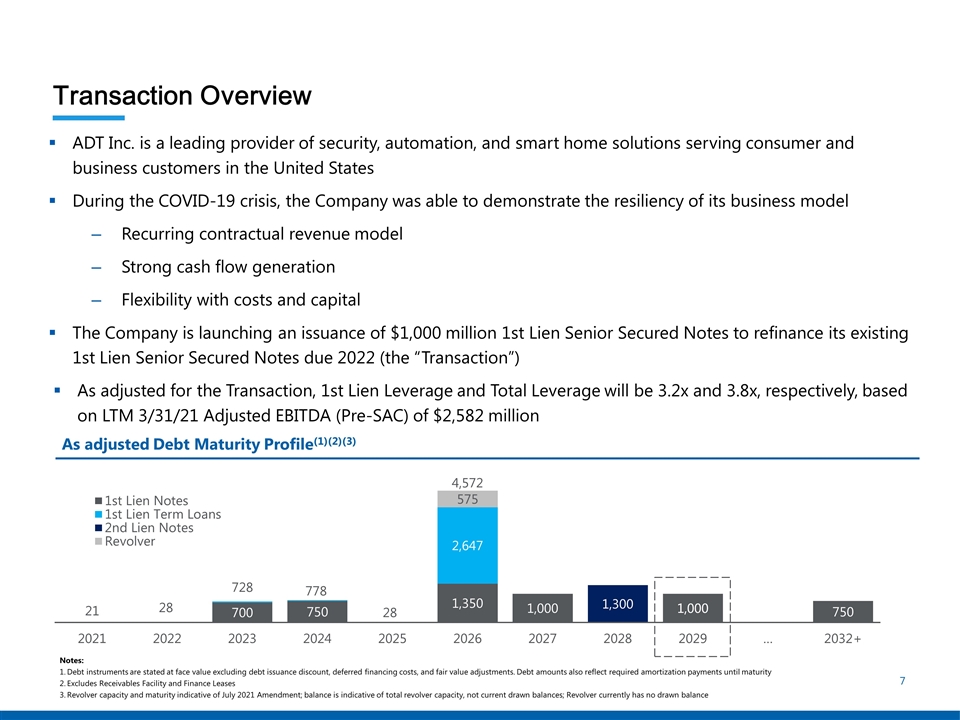
Transaction Overview ADT Inc. is a leading provider of security, automation, and smart home solutions serving consumer and business customers in the United States During the COVID-19 crisis, the Company was able to demonstrate the resiliency of its business model Recurring contractual revenue model Strong cash flow generation Flexibility with costs and capital The Company is launching an issuance of $1,000 million 1st Lien Senior Secured Notes to refinance its existing 1st Lien Senior Secured Notes due 2022 (the “Transaction”) As adjusted for the Transaction, 1st Lien Leverage and Total Leverage will be 3.2x and 3.8x, respectively, based on LTM 3/31/21 Adjusted EBITDA (Pre-SAC) of $2,582 million As adjusted Debt Maturity Profile(1)(2)(3) Notes: Debt instruments are stated at face value excluding debt issuance discount, deferred financing costs, and fair value adjustments. Debt amounts also reflect required amortization payments until maturity Excludes Receivables Facility and Finance Leases Revolver capacity and maturity indicative of July 2021 Amendment; balance is indicative of total revolver capacity, not current drawn balances; Revolver currently has no drawn balance
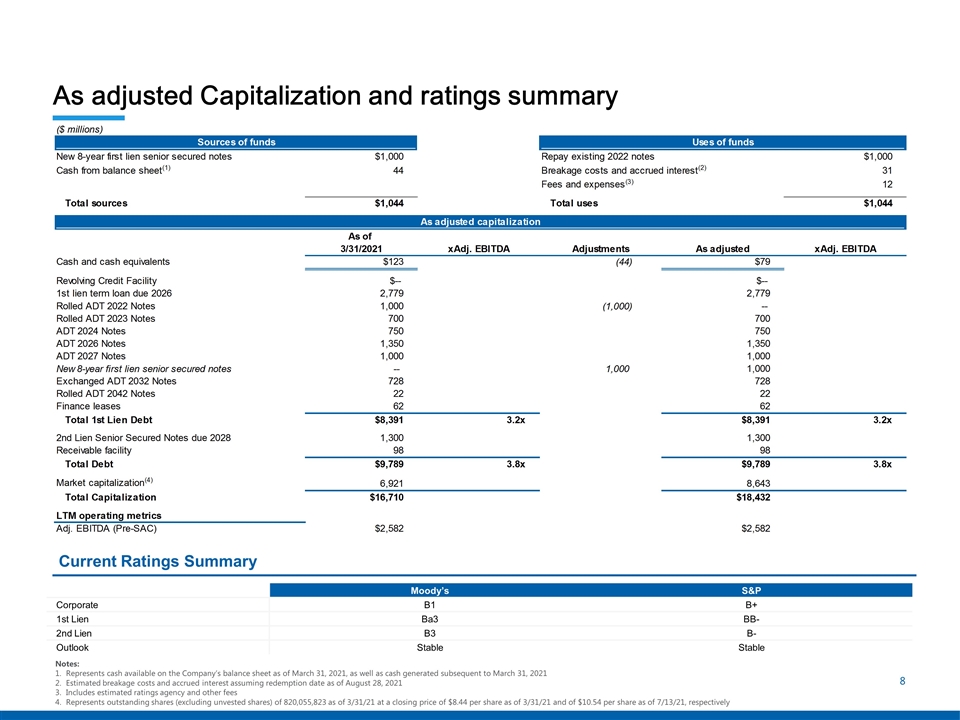
As adjusted Capitalization and ratings summary Notes: Represents cash available on the Company’s balance sheet as of March 31, 2021, as well as cash generated subsequent to March 31, 2021 Estimated breakage costs and accrued interest assuming redemption date as of August 28, 2021 Includes estimated ratings agency and other fees Represents outstanding shares (excluding unvested shares) of 820,055,823 as of 3/31/21 at a closing price of $8.44 per share as of 3/31/21 and of $10.54 per share as of 7/13/21, respectively Current Ratings Summary Moody’s S&P Corporate B1 B+ 1st Lien Ba3 BB- 2nd Lien B3 B- Outlook Stable Stable
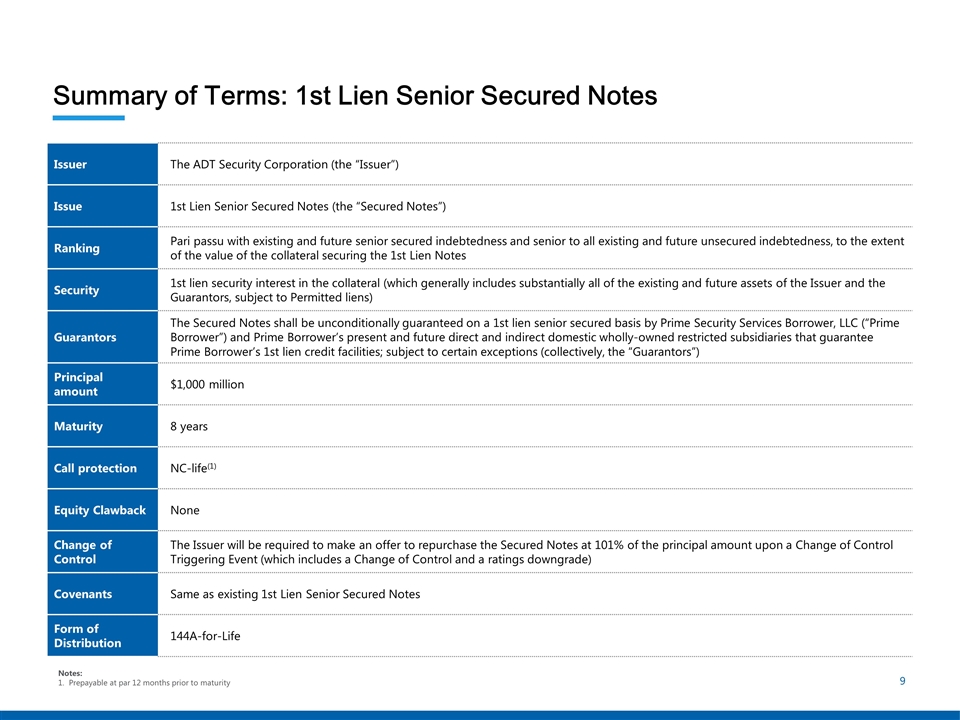
Summary of Terms: 1st Lien Senior Secured Notes Issuer The ADT Security Corporation (the “Issuer”) Issue 1st Lien Senior Secured Notes (the “Secured Notes”) Ranking Pari passu with existing and future senior secured indebtedness and senior to all existing and future unsecured indebtedness, to the extent of the value of the collateral securing the 1st Lien Notes Security 1st lien security interest in the collateral (which generally includes substantially all of the existing and future assets of the Issuer and the Guarantors, subject to Permitted liens) Guarantors The Secured Notes shall be unconditionally guaranteed on a 1st lien senior secured basis by Prime Security Services Borrower, LLC (“Prime Borrower”) and Prime Borrower’s present and future direct and indirect domestic wholly-owned restricted subsidiaries that guarantee Prime Borrower’s 1st lien credit facilities; subject to certain exceptions (collectively, the “Guarantors”) Principal amount $1,000 million Maturity 8 years Call protection NC-life(1) Equity Clawback None Change of Control The Issuer will be required to make an offer to repurchase the Secured Notes at 101% of the principal amount upon a Change of Control Triggering Event (which includes a Change of Control and a ratings downgrade) Covenants Same as existing 1st Lien Senior Secured Notes Form of Distribution 144A-for-Life Notes: Prepayable at par 12 months prior to maturity
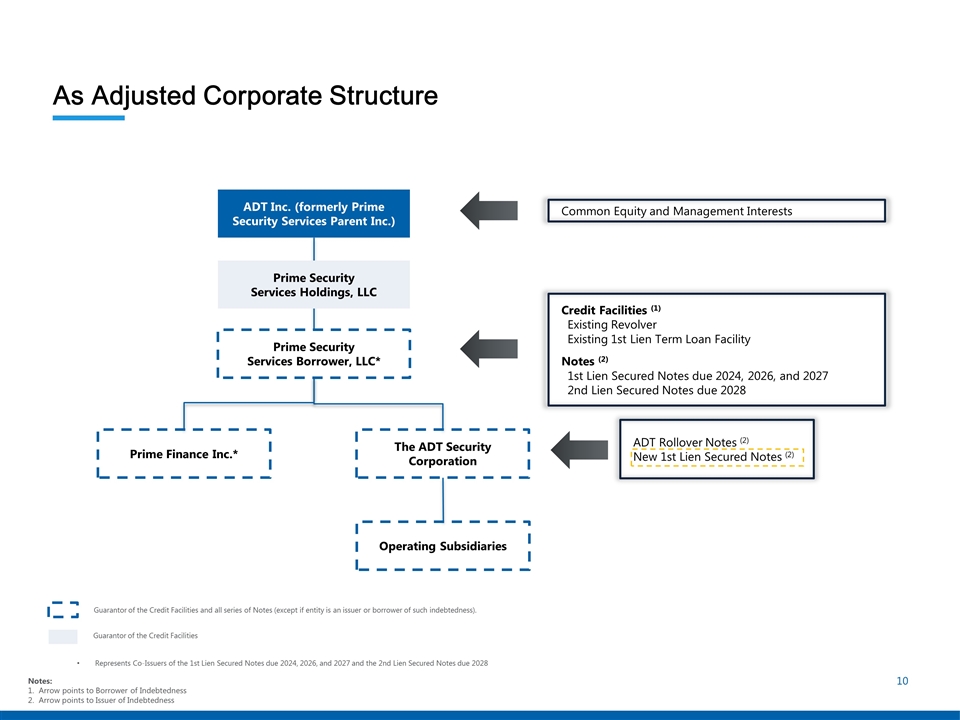
As Adjusted Corporate Structure ADT Inc. (formerly Prime Security Services Parent Inc.) Common Equity and Management Interests Prime Security Services Holdings, LLC Credit Facilities (1) Existing Revolver Existing 1st Lien Term Loan Facility Notes (2) 1st Lien Secured Notes due 2024, 2026, and 2027 2nd Lien Secured Notes due 2028 Prime Security Services Borrower, LLC* Operating Subsidiaries Prime Finance Inc.* The ADT Security Corporation ADT Rollover Notes (2) New 1st Lien Secured Notes (2) Guarantor of the Credit Facilities and all series of Notes (except if entity is an issuer or borrower of such indebtedness). Guarantor of the Credit Facilities Represents Co-Issuers of the 1st Lien Secured Notes due 2024, 2026, and 2027 and the 2nd Lien Secured Notes due 2028 Notes: Arrow points to Borrower of Indebtedness Arrow points to Issuer of Indebtedness
Business Overview
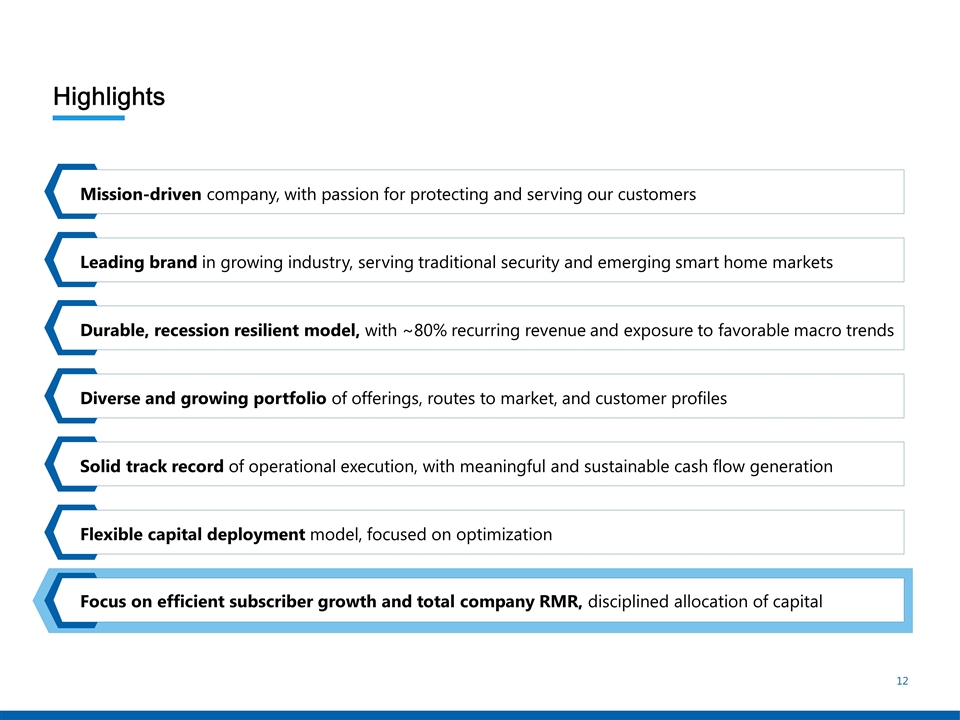
Highlights Mission-driven company, with passion for protecting and serving our customers Leading brand in growing industry, serving traditional security and emerging smart home markets Durable, recession resilient model, with ~80% recurring revenue and exposure to favorable macro trends Diverse and growing portfolio of offerings, routes to market, and customer profiles Solid track record of operational execution, with meaningful and sustainable cash flow generation Flexible capital deployment model, focused on optimization Focus on efficient subscriber growth and total company RMR, disciplined allocation of capital
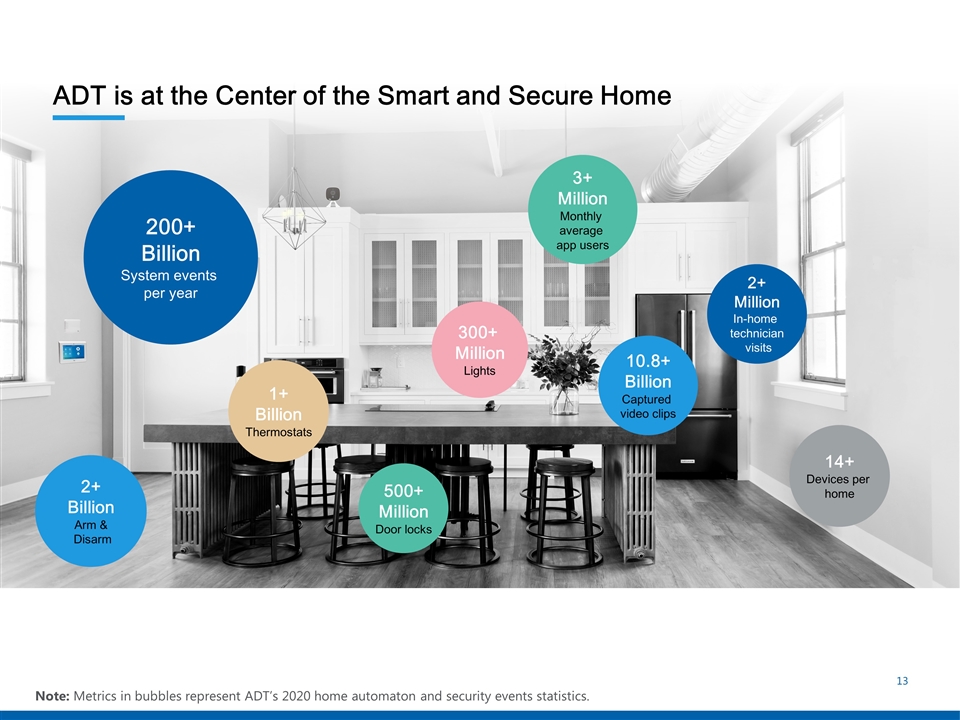
Note: Metrics in bubbles represent ADT’s 2020 home automaton and security events statistics. ADT is at the Center of the Smart and Secure Home 500+ Million Door locks 300+ Million Lights 1+ Billion Thermostats 10.8+ Billion Captured video clips 2+ Billion Arm & Disarm 14+ Devices per home 200+ Billion System events per year 2+ Million In-home technician visits 3+ Million Monthly average app users
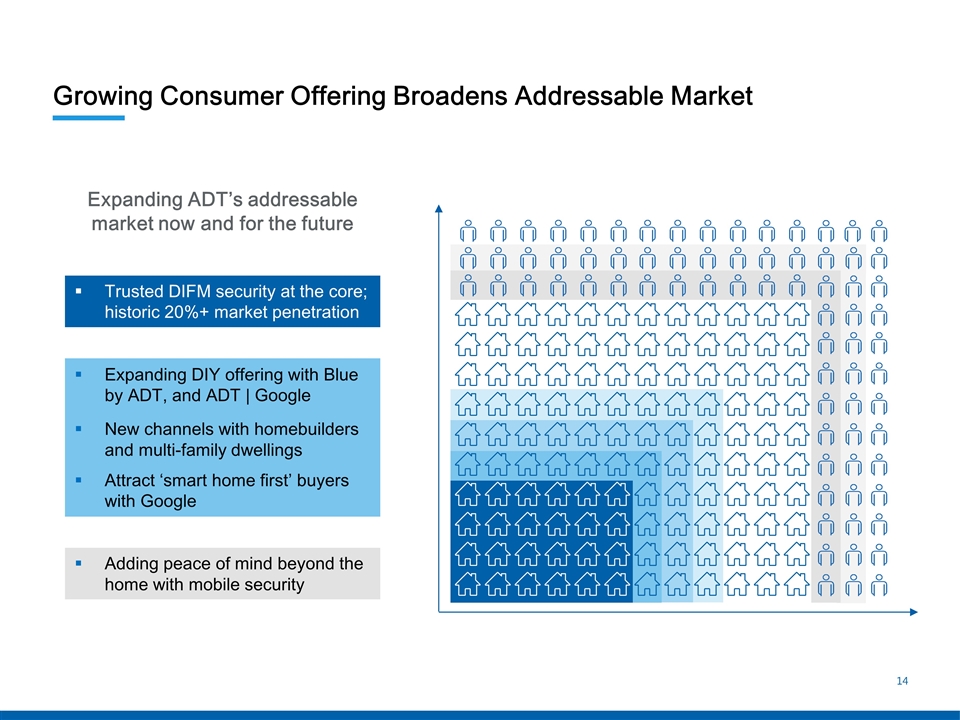
Growing Consumer Offering Broadens Addressable Market Expanding ADT’s addressable market now and for the future Trusted DIFM security at the core; historic 20%+ market penetration Expanding DIY offering with Blue by ADT, and ADT | Google New channels with homebuilders and multi-family dwellings Attract ‘smart home first’ buyers with Google Adding peace of mind beyond the home with mobile security
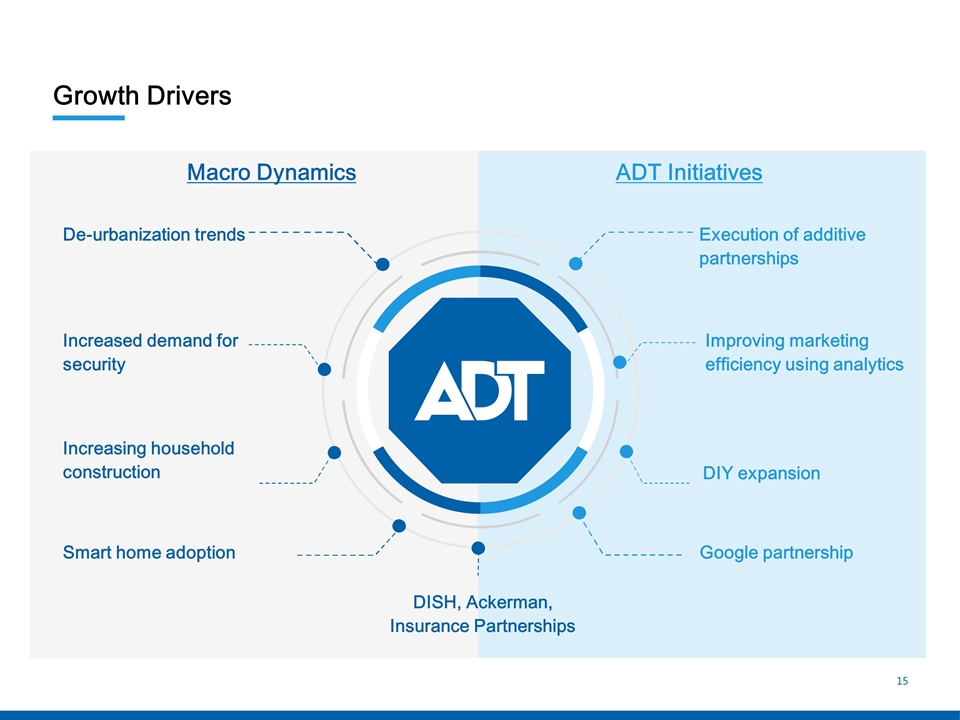
Growth Drivers Increased demand for security De-urbanization trends Smart home adoption Increasing household construction Macro Dynamics ADT Initiatives Improving marketing efficiency using analytics Execution of additive partnerships Google partnership DIY expansion DISH, Ackerman, Insurance Partnerships
Financial Update
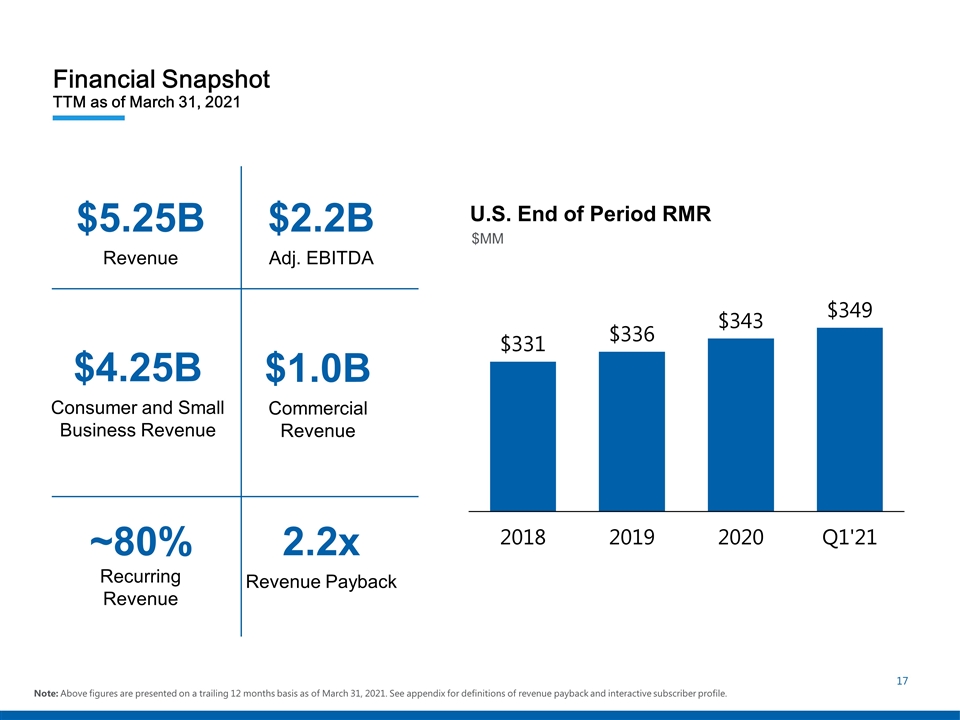
Financial Snapshot TTM as of March 31, 2021 Note: Above figures are presented on a trailing 12 months basis as of March 31, 2021. See appendix for definitions of revenue payback and interactive subscriber profile. $5.25B Revenue $2.2B Adj. EBITDA $4.25B Consumer and Small Business Revenue $1.0B Commercial Revenue 2.2x Revenue Payback ~80% Recurring Revenue U.S. End of Period RMR $MM
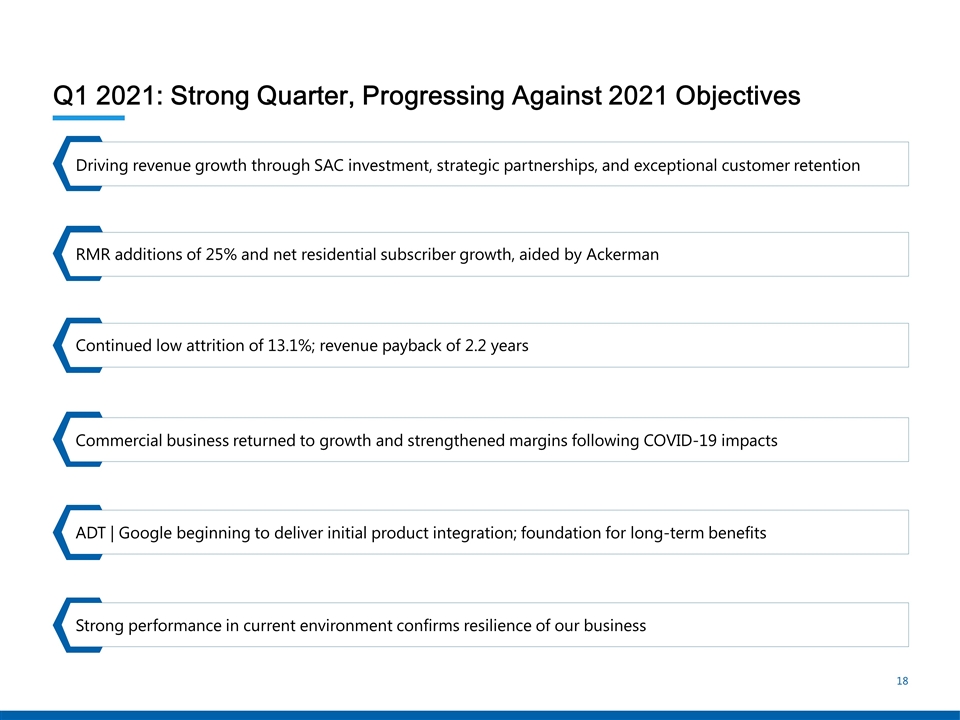
Q1 2021: Strong Quarter, Progressing Against 2021 Objectives Driving revenue growth through SAC investment, strategic partnerships, and exceptional customer retention RMR additions of 25% and net residential subscriber growth, aided by Ackerman Continued low attrition of 13.1%; revenue payback of 2.2 years Commercial business returned to growth and strengthened margins following COVID-19 impacts ADT | Google beginning to deliver initial product integration; foundation for long-term benefits Strong performance in current environment confirms resilience of our business
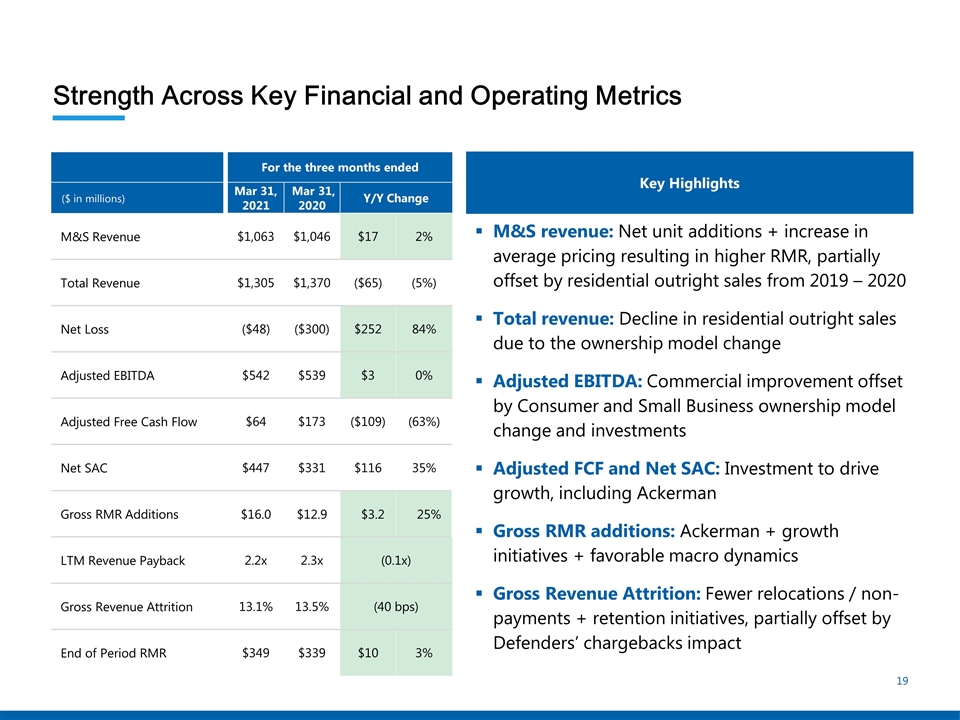
Strength Across Key Financial and Operating Metrics M&S revenue: Net unit additions + increase in average pricing resulting in higher RMR, partially offset by residential outright sales from 2019 – 2020 Total revenue: Decline in residential outright sales due to the ownership model change Adjusted EBITDA: Commercial improvement offset by Consumer and Small Business ownership model change and investments Adjusted FCF and Net SAC: Investment to drive growth, including Ackerman Gross RMR additions: Ackerman + growth initiatives + favorable macro dynamics Gross Revenue Attrition: Fewer relocations / non-payments + retention initiatives, partially offset by Defenders’ chargebacks impact For the three months ended ($ in millions) Mar 31, 2021 Mar 31, 2020 Y/Y Change M&S Revenue $1,063 $1,046 $17 2% Total Revenue $1,305 $1,370 ($65) (5%) Net Loss ($48) ($300) $252 84% Adjusted EBITDA $542 $539 $3 0% Adjusted Free Cash Flow $64 $173 ($109) (63%) Net SAC $447 $331 $116 35% Gross RMR Additions $16.0 $12.9 $3.2 25% LTM Revenue Payback 2.2x 2.3x (0.1x) Gross Revenue Attrition 13.1% 13.5% (40 bps) End of Period RMR $349 $339 $10 3% Key Highlights
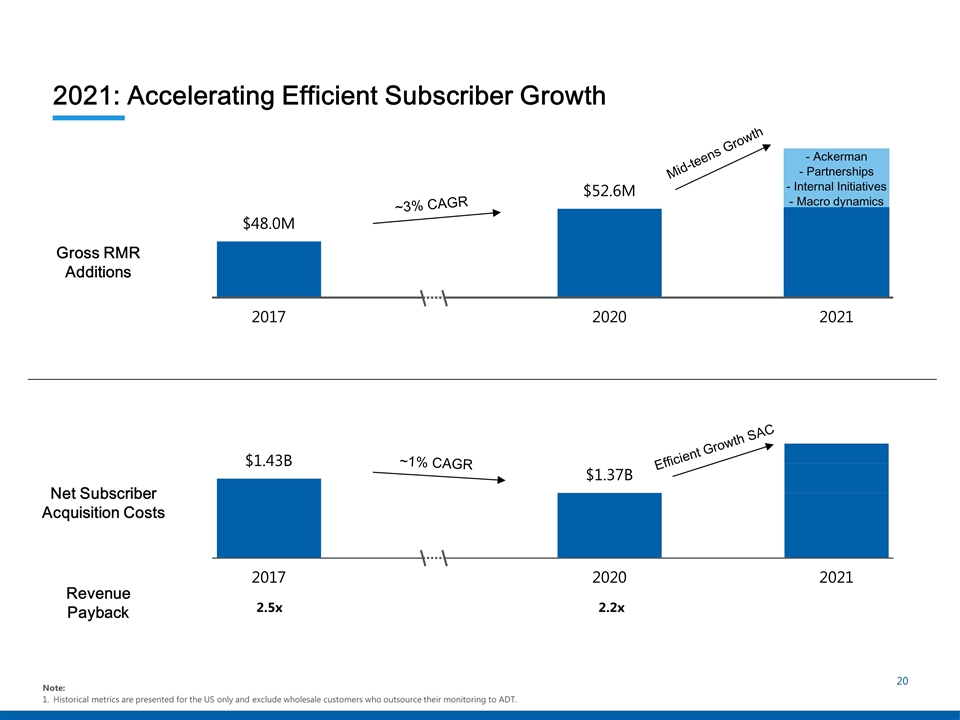
2021: Accelerating Efficient Subscriber Growth Gross RMR Additions Net Subscriber Acquisition Costs Revenue Payback 2.5x 2.2x ~3% CAGR ~1% CAGR Mid-teens Growth Note: Historical metrics are presented for the US only and exclude wholesale customers who outsource their monitoring to ADT. - Ackerman - Partnerships - Internal Initiatives Efficient Growth SAC - Macro dynamics
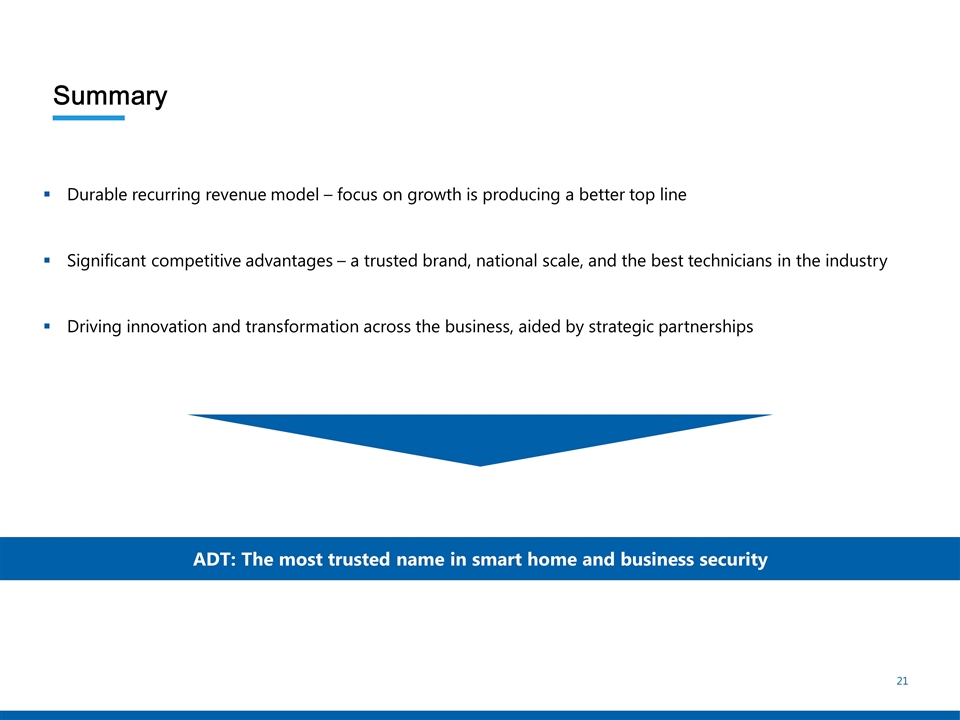
Summary Durable recurring revenue model – focus on growth is producing a better top line Significant competitive advantages – a trusted brand, national scale, and the best technicians in the industry Driving innovation and transformation across the business, aided by strategic partnerships ADT: The most trusted name in smart home and business security
Q&A
Appendix
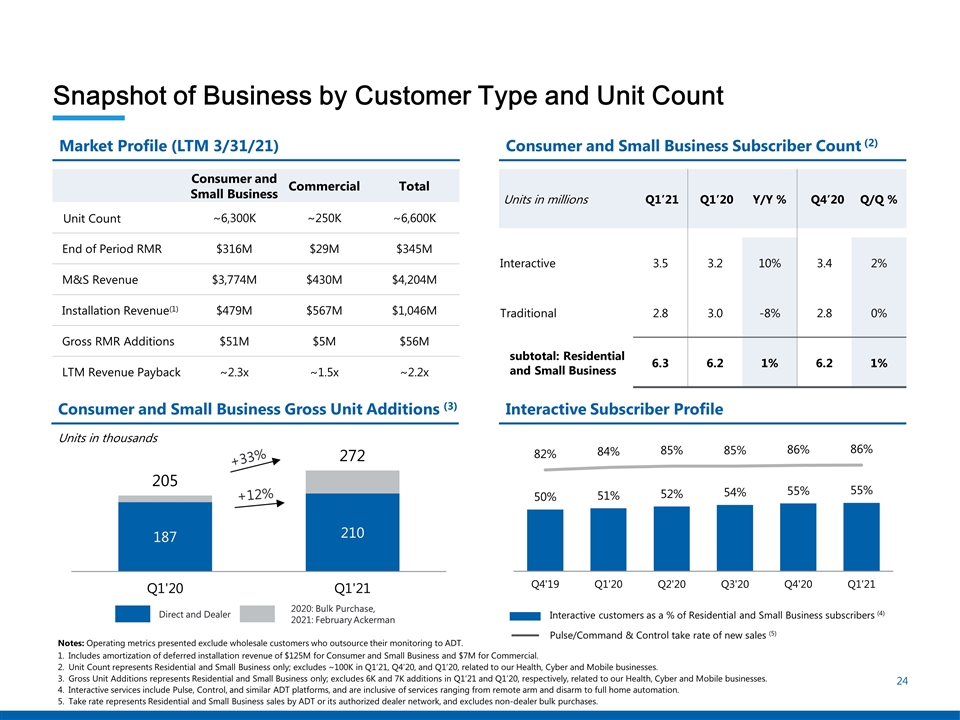
Snapshot of Business by Customer Type and Unit Count Consumer and Small Business Commercial Total Unit Count ~6,300K ~250K ~6,600K End of Period RMR $316M $29M $345M M&S Revenue $3,774M $430M $4,204M Installation Revenue(1) $479M $567M $1,046M Gross RMR Additions $51M $5M $56M LTM Revenue Payback ~2.3x ~1.5x ~2.2x Notes: Operating metrics presented exclude wholesale customers who outsource their monitoring to ADT. Includes amortization of deferred installation revenue of $125M for Consumer and Small Business and $7M for Commercial. Unit Count represents Residential and Small Business only; excludes ~100K in Q1’21, Q4’20, and Q1’20, related to our Health, Cyber and Mobile businesses. Gross Unit Additions represents Residential and Small Business only; excludes 6K and 7K additions in Q1’21 and Q1’20, respectively, related to our Health, Cyber and Mobile businesses. Interactive services include Pulse, Control, and similar ADT platforms, and are inclusive of services ranging from remote arm and disarm to full home automation. Take rate represents Residential and Small Business sales by ADT or its authorized dealer network, and excludes non-dealer bulk purchases. Units in millions Q1’21 Q1’20 Y/Y % Q4’20 Q/Q % Interactive 3.5 3.2 10% 3.4 2% Traditional 2.8 3.0 -8% 2.8 0% subtotal: Residential and Small Business 6.3 6.2 1% 6.2 1% Interactive customers as a % of Residential and Small Business subscribers (4) Pulse/Command & Control take rate of new sales (5) +12% +33% Direct and Dealer 2020: Bulk Purchase, 2021: February Ackerman Units in thousands Market Profile (LTM 3/31/21) Consumer and Small Business Subscriber Count (2) Interactive Subscriber Profile Consumer and Small Business Gross Unit Additions (3)
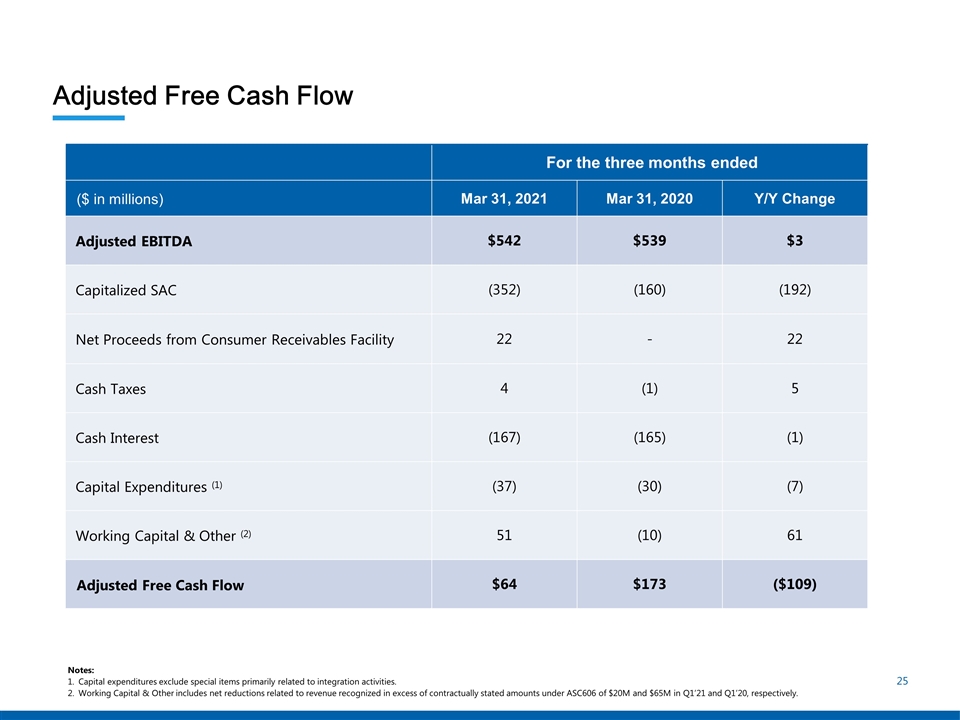
Adjusted Free Cash Flow For the three months ended ($ in millions) Mar 31, 2021 Mar 31, 2020 Y/Y Change Adjusted EBITDA $542 $539 $3 Capitalized SAC (352) (160) (192) Net Proceeds from Consumer Receivables Facility 22 - 22 Cash Taxes 4 (1) 5 Cash Interest (167) (165) (1) Capital Expenditures (1) (37) (30) (7) Working Capital & Other (2) 51 (10) 61 Adjusted Free Cash Flow $64 $173 ($109) Notes: Capital expenditures exclude special items primarily related to integration activities. Working Capital & Other includes net reductions related to revenue recognized in excess of contractually stated amounts under ASC606 of $20M and $65M in Q1’21 and Q1’20, respectively.
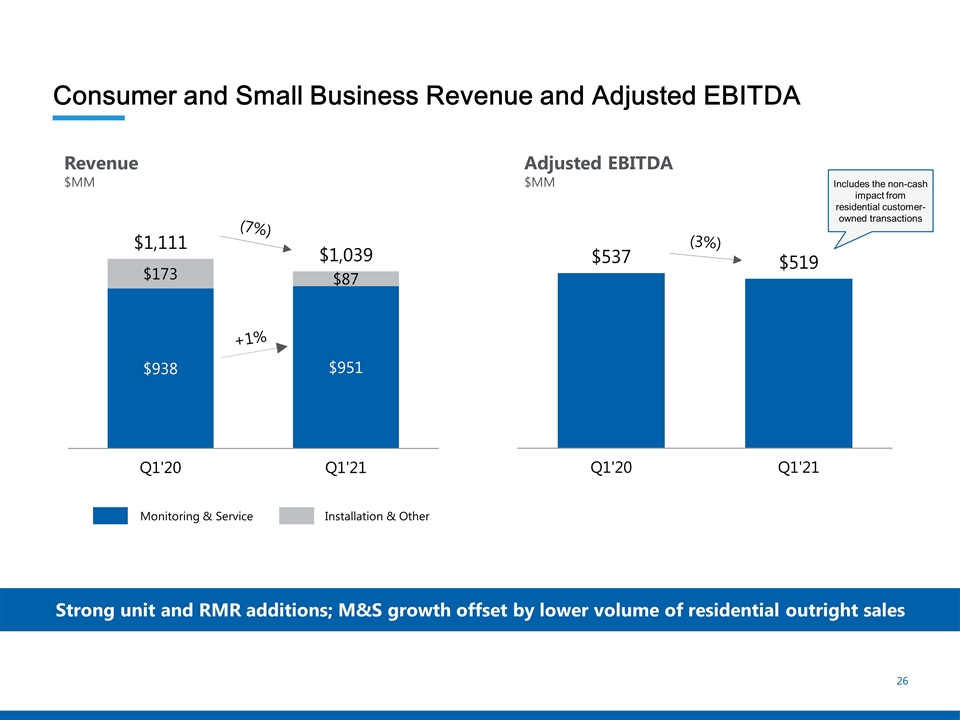
Consumer and Small Business Revenue and Adjusted EBITDA (7%) Installation & Other Monitoring & Service Revenue $MM Adjusted EBITDA $MM (3%) +1% Includes the non-cash impact from residential customer-owned transactions Strong unit and RMR additions; M&S growth offset by lower volume of residential outright sales
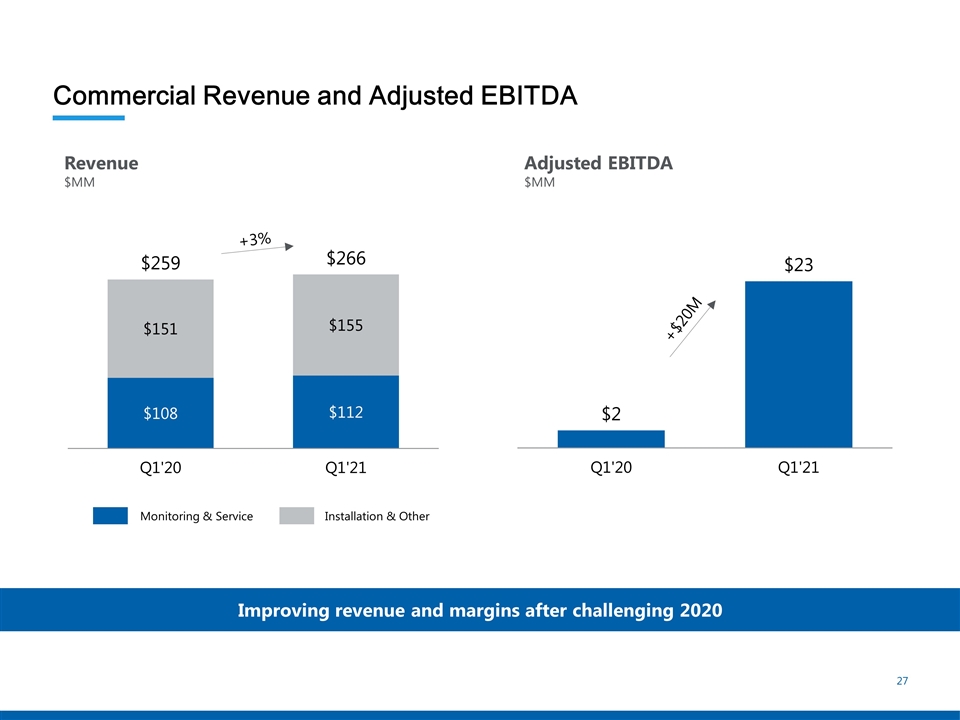
Commercial Revenue and Adjusted EBITDA Revenue $MM Adjusted EBITDA $MM Installation & Other Monitoring & Service +3% +$20M Improving revenue and margins after challenging 2020
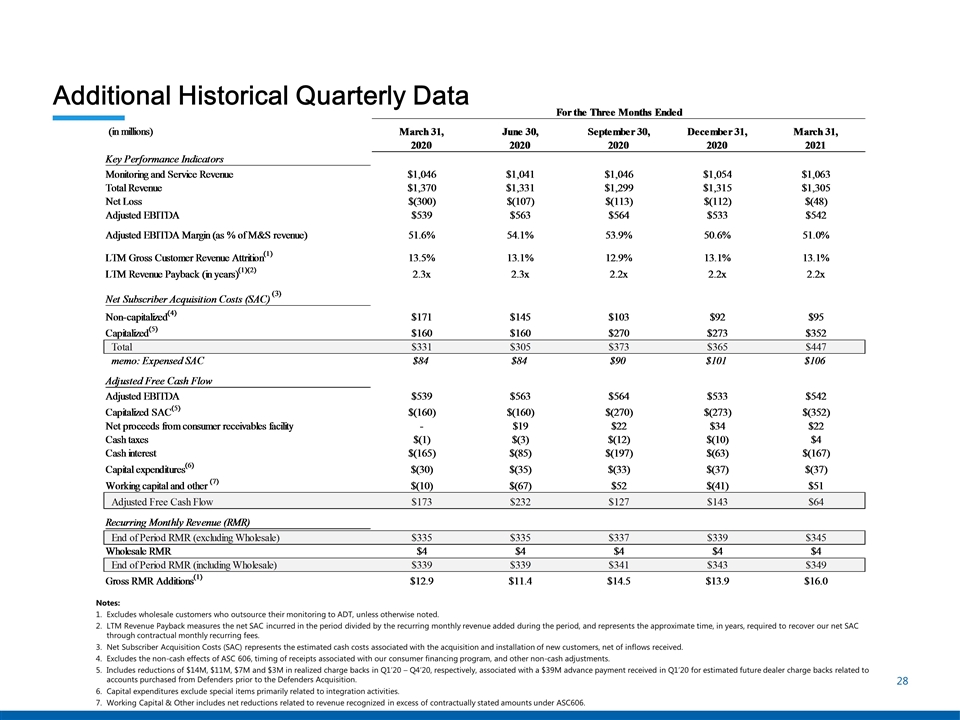
Additional Historical Quarterly Data Notes: Excludes wholesale customers who outsource their monitoring to ADT, unless otherwise noted. LTM Revenue Payback measures the net SAC incurred in the period divided by the recurring monthly revenue added during the period, and represents the approximate time, in years, required to recover our net SAC through contractual monthly recurring fees. Net Subscriber Acquisition Costs (SAC) represents the estimated cash costs associated with the acquisition and installation of new customers, net of inflows received. Excludes the non-cash effects of ASC 606, timing of receipts associated with our consumer financing program, and other non-cash adjustments. Includes reductions of $14M, $11M, $7M and $3M in realized charge backs in Q1’20 – Q4’20, respectively, associated with a $39M advance payment received in Q1’20 for estimated future dealer charge backs related to accounts purchased from Defenders prior to the Defenders Acquisition. Capital expenditures exclude special items primarily related to integration activities. Working Capital & Other includes net reductions related to revenue recognized in excess of contractually stated amounts under ASC606.
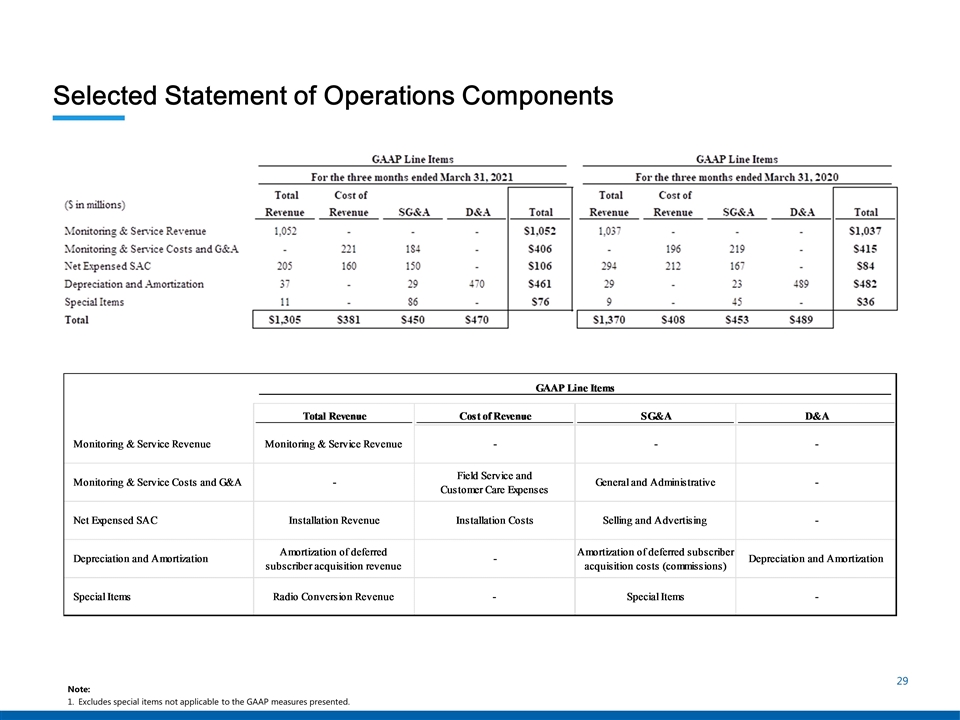
Selected Statement of Operations Components Note: Excludes special items not applicable to the GAAP measures presented.
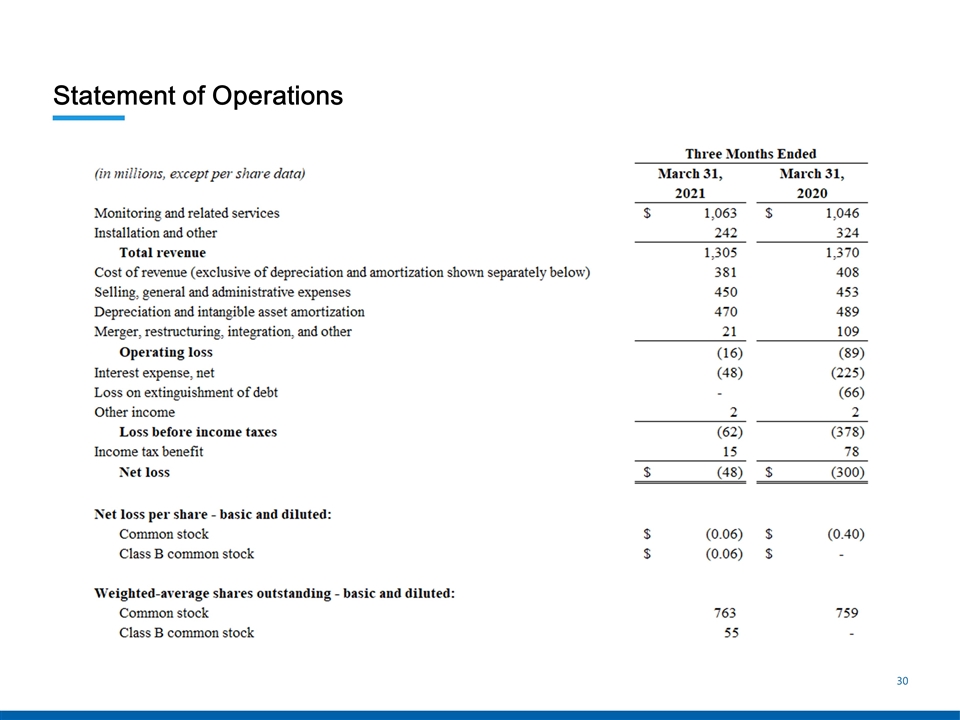
Statement of Operations
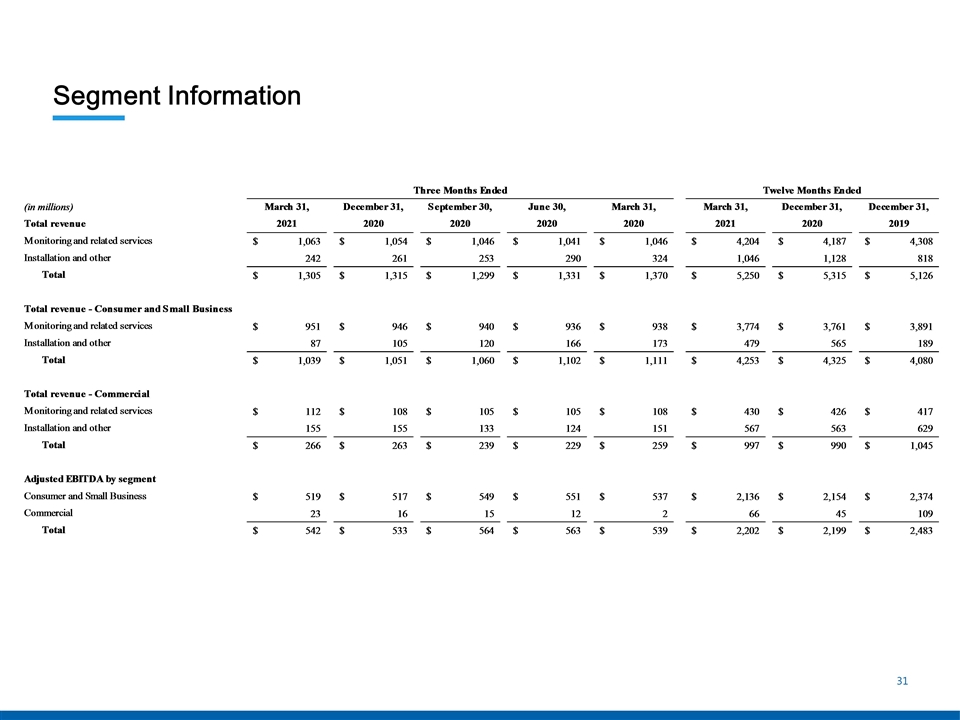
Segment Information
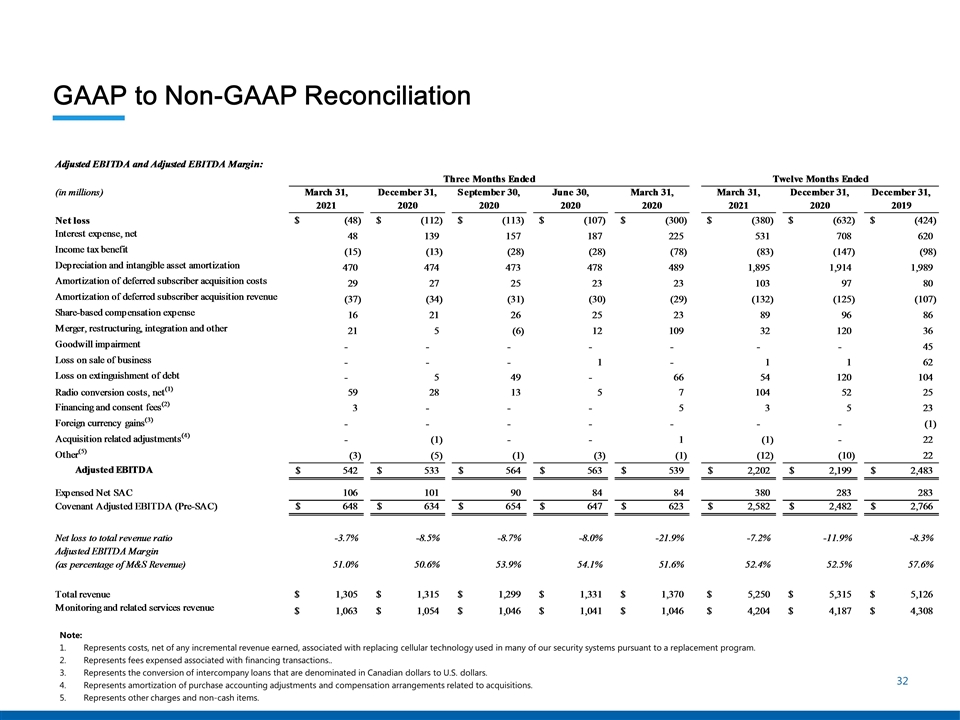
GAAP to Non-GAAP Reconciliation Note: Represents costs, net of any incremental revenue earned, associated with replacing cellular technology used in many of our security systems pursuant to a replacement program. Represents fees expensed associated with financing transactions.. Represents the conversion of intercompany loans that are denominated in Canadian dollars to U.S. dollars. Represents amortization of purchase accounting adjustments and compensation arrangements related to acquisitions. Represents other charges and non-cash items.
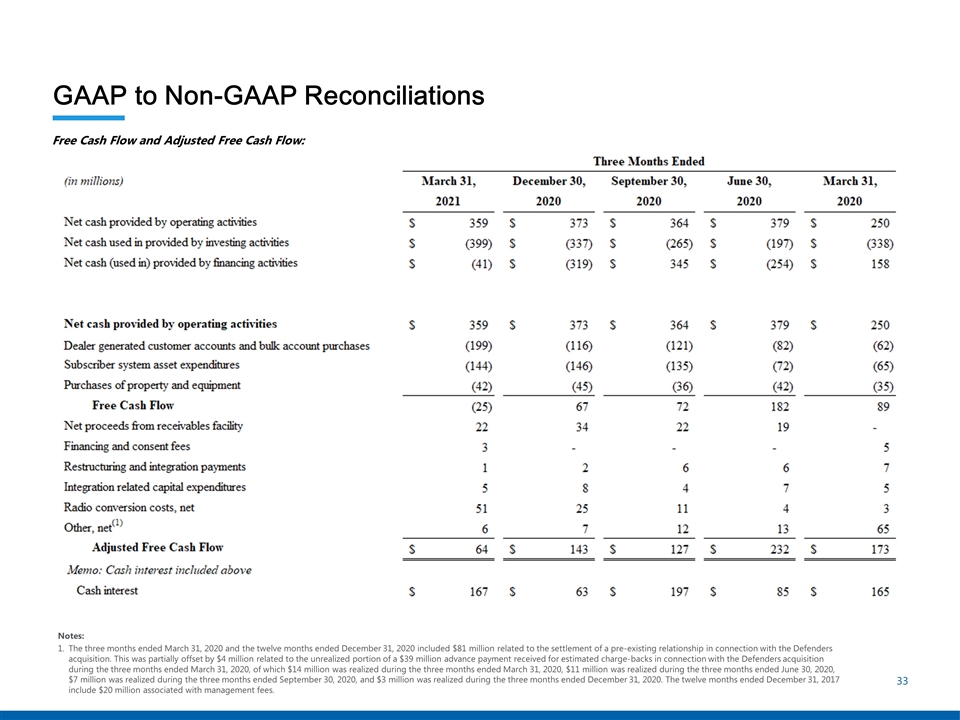
GAAP to Non-GAAP Reconciliations Free Cash Flow and Adjusted Free Cash Flow: Notes: The three months ended March 31, 2020 and the twelve months ended December 31, 2020 included $81 million related to the settlement of a pre-existing relationship in connection with the Defenders acquisition. This was partially offset by $4 million related to the unrealized portion of a $39 million advance payment received for estimated charge-backs in connection with the Defenders acquisition during the three months ended March 31, 2020, of which $14 million was realized during the three months ended March 31, 2020, $11 million was realized during the three months ended June 30, 2020, $7 million was realized during the three months ended September 30, 2020, and $3 million was realized during the three months ended December 31, 2020. The twelve months ended December 31, 2017 include $20 million associated with management fees.
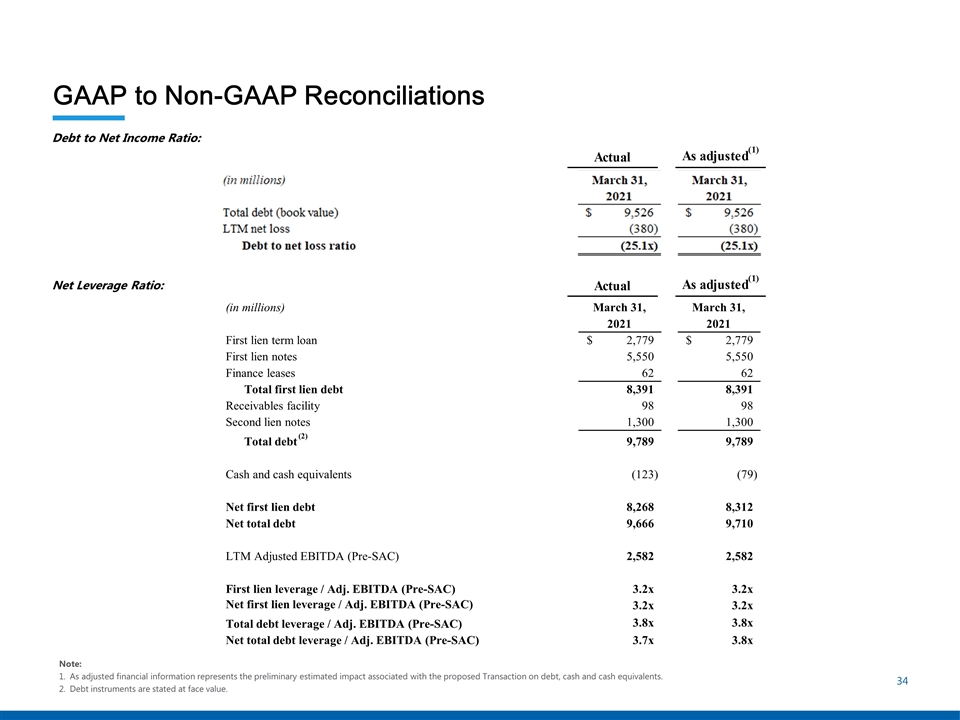
GAAP to Non-GAAP Reconciliations Debt to Net Income Ratio: Note: As adjusted financial information represents the preliminary estimated impact associated with the proposed Transaction on debt, cash and cash equivalents. Debt instruments are stated at face value. Net Leverage Ratio: (in millions) March 31, March 31, 2021 2021 First lien term loan 2,779 $ 2,779 $ First lien notes 5,550 5,550 Finance leases 62 62 Total first lien debt 8,391 8,391 Receivables facility 98 98 Second lien notes 1,300 1,300 Total debt (2) 9,789 9,789 Cash and cash equivalents (123) (79) Net first lien debt 8,268 8,312 Net total debt 9,666 9,710 LTM Adjusted EBITDA (Pre-SAC) 2,582 2,582 First lien leverage / Adj. EBITDA (Pre-SAC) 3.2x 3.2x Net first lien leverage / Adj. EBITDA (Pre-SAC) 3.2x 3.2x Total debt leverage / Adj. EBITDA (Pre-SAC) 3.8x 3.8x Net total debt leverage / Adj. EBITDA (Pre-SAC) 3.7x 3.8x
