Attached files
| file | filename |
|---|---|
| 8-K - FORM 8-K - FVCBankcorp, Inc. | tm2122205d1_8k.htm |
| EX-99.1 - EXHIBIT 99.1 - FVCBankcorp, Inc. | tm2122205d1_ex99-1.htm |
Exhibit 99.2

1 Transformational Combination Blue Ridge Bankshares (BRBS) and FVCBankcorp (FVCB) July 14, 2021

2 Important Information about the Merger and Where to Find It Blue Ridge Bankshares, Inc. (“Blue Ridge” or “BRBS”) intends to file a registration statement on Form S - 4 with the Securities an d Exchange Commission (the “SEC”) to register the shares of Blue Ridge’s common stock that will be issued to FVCBankcorp, Inc. (“FVCB”) shareholders in con nection with the proposed transaction. The registration statement will include a joint proxy statement of Blue Ridge and FVCB that also constitutes a pro spectus of Blue Ridge. The definitive joint proxy statement/prospectus will be sent to the shareholders of Blue Ridge and FVCB seeking their approval of th e proposed merger. INVESTORS AND SECURITY HOLDERS ARE URGED TO READ THE REGISTRATION STATEMENT ON FORM S - 4 AND THE JOINT PROXY STATEMENT/PROSPECTUS INCLUDED WITHIN THE REGISTRATION STATEMENT ON FORM S - 4 WHEN THEY BECOME AVAILABLE (AND ANY OTHER RELEVANT DOCUMENTS FILED WITH THE SEC IN CONNECTION WITH THE PROPOSED TRANSACTION OR INCORPORATED BY REFERENCE INTO THE JOINT PROXY STATEMENT/PROSPECTUS) BECAUSE SUCH DOCUMENTS WILL CONTAIN IMPORTANT INFORMATION REGARDING BLUE RIDGE, FVCB, THE PROPOSED MERGER AND RELATED MATTERS . Investors and security holders may obtain free copies of these documents, once they are filed, and other documents filed with th e SEC by Blue Ridge or FVCB through the website maintained by the SEC at http://www.sec.gov. Investors and security holders will also be able to obtain the se documents, once they are filed, free of charge, by requesting them in writing from Brian K. Plum, Blue Ridge Bankshares, Inc., 17 West Main Street, Lu ray , Virginia 22835, or by telephone at (540) 743 - 6521, or from David W. Pijor, FVCBankcorp, Inc., 11325 Random Hills Road, Fairfax, Virginia 22030, or by telephone at (703) 436 - 3800. This presentation does not constitute an offer to sell or the solicitation of an offer to buy any securities or a solicitatio n o f any vote or proxy in favor of the merger, nor shall there be any sale of securities in any jurisdiction in which such offer, solicitation or sale would be unla wfu l prior to registration or qualification under the securities laws of such jurisdiction. Blue Ridge, FVCB, and certain of their respective directors and executive officers may be deemed participants in the solicita tio n of proxies from the shareholders of each of Blue Ridge and FVCB in connection with the proposed merger under the rules of the SEC. Certain infor mat ion regarding the interests of the directors and executive officers of Blue Ridge and FVCB and other persons who may be deemed participants in the solici tat ion of the shareholders of Blue Ridge or of FVCB in connection with the proposed merger and a description of their direct and indirect interests, by sec uri ty holdings or otherwise, will be included in the joint proxy statement/prospectus related to the proposed merger, which will be filed with the SEC. Additi ona l information about Blue Ridge, the directors and executive officers of Blue Ridge and their ownership of Blue Ridge common stock can also be found in Bl ue Ridge’ definitive proxy statement in connection with its 2021 annual meeting of shareholders, as filed with the SEC on April 30, 2021, and other docu men ts subsequently filed by Blue Ridge with the SEC. Additional information about FVCB, the directors and executive officers of FVCB and their ownership of FVCB common stock can also be found in FVCB’s definitive proxy statement in connection with its 2021 annual meeting of shareholders, as filed with the S EC on April 8, 2021, and other documents subsequently filed by FVCB with the SEC. These documents can be obtained free of charge from the sources described ab ove.
3 Forward - Looking Statements This presentation contains “forward - looking statements” within the meaning of the Private Securities Litigation Reform Act of 19 95 regarding the financial condition, results of operations, business plans and future performance of Blue Ridge and FVCB, including, but not limited to statements ab out the benefits of the merger between Blue Ridge and FVCB, including future financial and operating results, cost savings, enhancements to revenue and accr eti on to reported earnings that may be realized from the merger. Words such as “anticipates," "believes," "estimates," "expects," "forecasts," "intends," "plans, " " projects," “targets,” “designed,” "could," "may," "should," "will" or other similar words and expressions are intended to identify these forward - looking statement s. These forward - looking statements are based on Blue Ridge’s and FVCB's current expectations and assumptions regarding Blue Ridge’s and FVCB’s businesses, the e con omy, and other future conditions. Because forward - looking statements relate to future results and occurrences, they are subject to inherent risks, uncertainties, changes in circumstances and other factors that are difficult to predict. Many possible events or factors could affect Blue Ridge’s and/or FVCB’s future financ ial results and performance and could cause the actual results, performance or achievements of Blue Ridge and/or FVCB to differ materially from any anticipated results e xpr essed or implied by such forward - looking statements. Such risks and uncertainties include, among others, (1) the risk that the cost savings, any revenue syne rgi es and other anticipated benefits of the proposed merger may not be realized or may take longer than anticipated to be realized, including as a result of the impact o f, or problems arising from, the integration of the two companies or as a result of the condition of the economy and competitive factors in areas where Blue R idg e and FVCB do business, (2) deposit attrition, operating costs, customer losses and other disruptions to the parties’ businesses as a result of the announcement and pendency of the proposed merger, and diversion of management’s attention from ongoing business operations and opportunities, (3) the occurrence of any event, cha nge or other circumstances that could give rise to the right of one or both of the parties to terminate the definitive merger agreement between Blue Ridge an d F VCB, (4) the risk that the integration of Blue Ridge’ and FVCB’s operations will be materially delayed or will be more costly or difficult than expected or that Blu e R idge and FVCB are otherwise unable to successfully integrate their businesses, (5) the failure to obtain the necessary approvals of the shareholders of Blue Ridge and /or FVCB, (6) the outcome of any legal proceedings that may be instituted against Blue Ridge and/or FVCB, (7) the failure to obtain required governmental approvals (an d the risk that such approvals may result in the imposition of conditions that could adversely affect the combined company or the expected benefits of the propo sed transaction), (8) reputational risk and potential adverse reactions of Blue Ridge’ and/or FVCB’s customers, suppliers, employees or other business partners, incl udi ng those resulting from the announcement or completion of the proposed merger, (9) the failure of any of the closing conditions in the definitive merger agr eement to be satisfied on a timely basis or at all, (10) delays in closing the proposed merger, (11) the possibility that the proposed merger may be more expens ive to complete than anticipated, including as a result of unexpected factors or events, (12) the dilution caused by Blue Ridge’s issuance of additional shares of its capital stock in connection with the proposed merger, (13) general competitive, economic, political and market conditions, (14) other factors that may affect futu re results of FVCB and/or Blue Ridge including changes in asset quality and credit risk, the inability to sustain revenue and earnings growth, changes in interest ra tes and capital markets, inflation, customer borrowing, repayment, investment and deposit practices, the impact, extent and timing of technological changes, capi tal management activities, and other actions of bank regulatory agencies and legislative and regulatory actions and reforms, and (15) the impact of the global COV ID - 19 pandemic on Blue Ridge’s and/or FVCB’s businesses, the ability to complete the proposed merger and/or any of the other foregoing risks. Except to the extent required by applicable law or regulation, each of Blue Ridge and FVCB disclaims any obligation to update su ch factors or to publicly announce the results of any revisions to any of the forward - looking statements included herein to reflect future events or developments. Further information regarding Blue Ridge, FVCB and factors which could affect the forward - looking statements contained herein can be found in Blue Ridge’s Annual R eport on Form 10 - K for the fiscal year ended December 31, 2020, its Quarterly Report on Form 10 - Q for the period ended March 31, 2021, and its other filings with the SEC, and in FVCB’s Annual Report on Form 10 - K for the fiscal year ended December 31, 2020, its Quarterly Report on Form 10 - Q for the period ended March 31 , 2021, and its other filings with the SEC.

4 Creating A Premier Financial Institution in Attractive Growth Markets 1) Pro forma market capitalization is based on BRBS share price of $18.03 as of July 13, 2021 and 34,691,823 pro forma shares ou tst anding Note: Branch footprint excludes BRBS loan production offices Attractive Returns ~16% ‘22 ROATCE Operating Leverage ~56% Efficiency Ratio Enhanced Liquidity ~$625M Market Cap¹ Significant Scale ~$5B Assets at Close 4.21 4.05 3.80 3.73 3.61 2.14 1.43 2.91 Greensboro (NC) Washington DC Charlottes- ville (VA) Richmond (VA) Harrisonburg (VA) Virginia Beach (VA) Baltimore (MD) National Average Projected 2021 - 2026 Population Growth (%) in Key MSAs 109.2 87.3 79.1 73.3 70.4 60.8 53.8 67.8 Washington DC Baltimore (MD) Charlottes- ville (VA) Richmond (VA) Virginia Beach (VA) Harrisonburg (VA) Greensboro (NC) National Average Median Household Income ($K) in Key MSAs BRBS Headquarters BRBS Branches (33) FVCB Headquarters FVCB Branches (10) WEST VIRGINIA PENNSYLVANIA MARYLAND VIRGINIA NORTH CAROLINA Baltimore Rockville Fairfax Fredericksburg Harrisonburg Charlottesville Richmond Virginia Beach Greensboro Charlotte County Lancaster County Washington , DC Martinsville Stuart

5 Transformational Partnership Driving Top - Tier Performance Capitalizing on Scarcity Value and Creating Operating Leverage in Our Core Markets Strategically Compelling Enhanced scale to drive increased growth and profitability Strong, affluent, growing markets of operation Enhanced revenue streams with increased sources of fee income Powerful operating leverage Creation of a stronger franchise with greater scarcity value Low - cost deposit base (0.41% cost of deposits) with ~30% non - interest bearing accounts Additional scale and expertise to support FinTech efforts Financially Attractive 16%+ 2022 and 2023 EPS accretion to BRBS shareholders (assuming illustrative phase - in of cost savings at 100%) 12%+ 2022 and 2023 EPS accretion to FVCB shareholders (assuming illustrative phase - in of cost savings at 100%) ~5.7% TBVPS dilution with an earnback of ~2.1 years Strong accretion to profitability metrics and meaningful capital generation Low - Risk Transaction Substantial due diligence completed by both parties Experienced management teams with significant integration experience Embedded purchase accounting marks provide additional capital support

6 Consideration & Transaction Pricing 100% stock consideration Fixed exchange ratio of 1.1492 BRBS shares for each FVCB share outstanding Assumes FVCB options are rolled over into BRBS options Aggregate consideration of ~$306.6M BRBS will be both the legal and accounting acquirer Pro Forma Ownership Approximately 52.5% BRBS / 47.5% FVCB on a fully diluted basis Leadership David W. Pijor: Executive Chairman (FVCB) Brian K. Plum: Chief Executive Officer (BRBS) Patricia A. Ferrick: President; President and Bank CEO (FVCB) Jennifer L. Deacon: Chief Financial Officer (FVCB) Combining best talent from both companies Board of Directors Equal Board split: 8 members from BRBS and 8 members from FVCB for a total of 16 directors Chairman of the Board: David W. Pijor (Current FVCB Chairman & CEO) Lead Independent Director: to be selected from BRBS Board Brian K. Plum and Patricia A. Ferrick to be named Directors Headquarters Holding Company Headquarters: Fairfax, VA Timing and Required Approvals Approval of BRBS and FVCB shareholders Customary regulatory approvals Anticipated closing in the fourth quarter of 2021 or early first quarter 2022 Summary of Key Transaction Terms

7 Pro Forma Leadership Team Brings a Strong History of Leadership Board of Directors (Preliminary Named Directors) Leadership Team David W. Pijor, Executive Chairman • Founder, Chairman and CEO of FVCbank • Previous founder and Chairman of James Monroe Bank • 30+ years of experience in business law and taxation Brian K. Plum, Chief Executive Officer • President and CEO of Blue Ridge Bank • Certified Public Accountant with MBA and MSA degrees • 15+ years of experience in banking Patricia A. Ferrick, President & CEO of Bank • President and Director at FVCbank; original CFO at FVCbank • Previous CFO of Southern Financial Bancorp, Inc. and Potomac Bank of VA Jennifer L. Deacon, Chief Financial Officer • EVP and Chief Financial Officer of FVCbank • Previous Chief Accounting Officer at Cardinal Bank • 20+ years of community banking experience BRBS FVCB Brian K. Plum (41), Director Current Director and CEO Current BRBS Board Member Lead Director 8 8 David W. Pijor (68), Executive Chairman Current Chairman and CEO Patricia A. Ferrick (58), President & CEO of Bank Current President, Director and Secretary
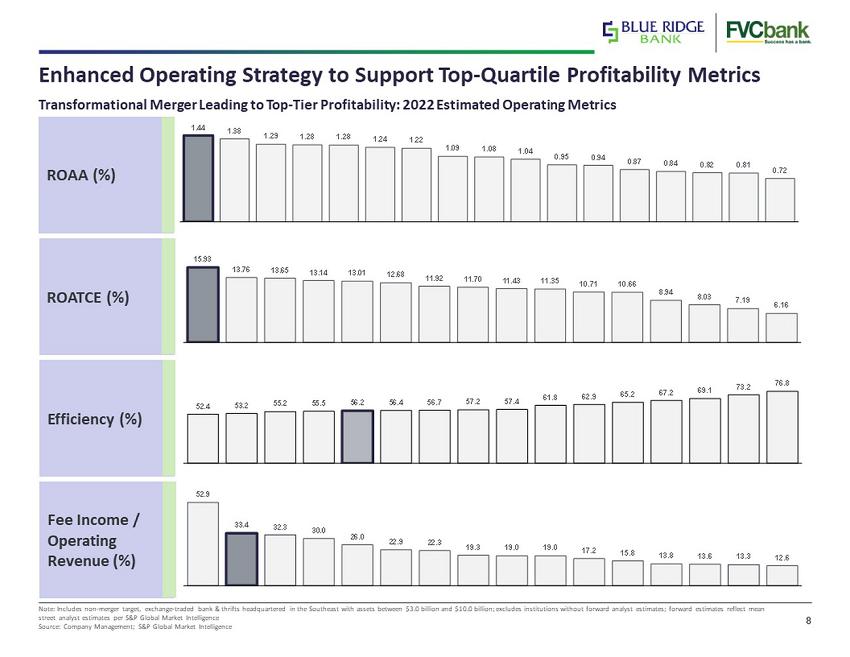
8 Enhanced Operating Strategy to Support Top - Quartile Profitability Metrics Note: Includes non - merger target, exchange - traded bank & thrifts headquartered in the Southeast with assets between $3.0 billion and $10.0 billion; excludes institutions without forward analyst estimates; forward estimates reflect mean street analyst estimates per S&P Global Market Intelligence Source: Company Management; S&P Global Market Intelligence Transformational Merger Leading to Top - Tier Profitability: 2022 Estimated Operating Metrics 1.44 1.38 1.29 1.28 1.28 1.24 1.22 1.09 1.08 1.04 0.95 0.94 0.87 0.84 0.82 0.81 0.72 ROAA (%) 15.93 13.76 13.65 13.14 13.01 12.68 11.92 11.70 11.43 11.35 10.71 10.66 8.94 8.03 7.19 6.16 ROATCE (%) 52.4 53.2 55.2 55.5 56.2 56.4 56.7 57.2 57.4 61.8 62.9 65.2 67.2 69.1 73.2 76.8 Efficiency (%) 52.9 33.4 32.3 30.0 26.0 22.9 22.3 19.3 19.0 19.0 17.2 15.8 13.8 13.6 13.3 12.6 Fee Income / Operating Revenue (%)
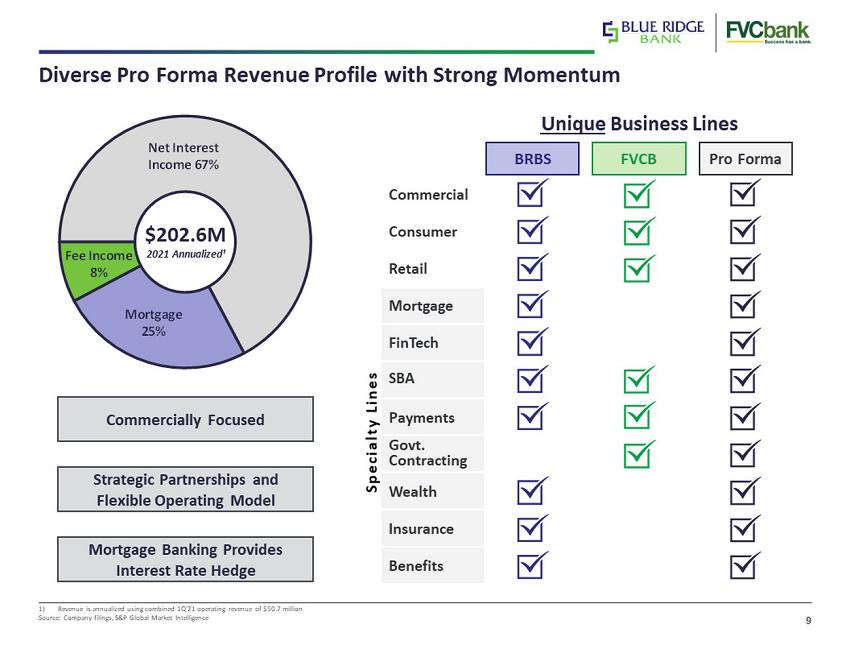
9 Diverse Pro Forma Revenue Profile with Strong Momentum 1) Revenue is annualized using combined 1Q’21 operating revenue of $50.7 million Source: Company filings, S&P Global Market Intelligence Net Interest Income 67% Mortgage 25% Fee Income 8% $ 202.6 M 2021 Annualized¹ Commercially Focused Strategic Partnerships and Flexible Operating Model Mortgage Banking Provides Interest Rate Hedge Mortgage FinTech SBA Payments BRBS FVCB Pro Forma Unique Business Lines Commercial Consumer Retail Specialty Lines Govt. Contracting Wealth Insurance Benefits

10 1) Loan composition data reflects regulatory bank level data as of March 31, 2021 and excludes PPP Loans Source: Company filings, S&P Global Market Intelligence Commercially Oriented Loan Portfolio With No Significant Concentrations BRBS, ex PPP FVCB, ex PPP PRO FORMA, ex PPP Consumer and Residential 37.7% Multifamily 5.8% CRE 29.9% C&D 11.3% C&I 14.0% Other 1.4% Consumer and Residential 13.5% Multifamily 6.5% CRE 54.5% C&D 17.0% C&I 8.1% Other 0.4% Consumer and Residential 27.7% Multifamily 6.1% CRE 40.1% C&D 13.7% C&I 11.4% Other 1.0% $1.8B 1 MRQ Yield: 4.34% $1.3B 1 MRQ Yield: 4.38% $3.1B 1 MRQ Yield: 4.36% L/D ex PPP: 85.0% L/D ex PPP: 80.3% L/D ex PPP: 83.0% CRE Ratio: 287.3% CRE Ratio: 361.4% CRE Ratio: 323.8% C&D Ratio: 86.5% C&D Ratio: 94.9% C&D Ratio: 90.6% Consistent mix of mortgage, commercial and CRE Active SBA platform resulting in strong PPP origination Disciplined, low - risk balance sheets Emphasis on credit administration and risk management $852.6MCurrent PPP Balance ($712.6M)Less: Announced Sale of PPP Loans $140.0MPPP Loans, Post-Sale $166.6MPPP Balance as of 2021Q1 $306.6MEstimated Pro Forma PPP Balance

11 History of Strong Asset Quality and Limited Exposure to COVID Sensitive Industries Note: FDIC Peer Group consists of all institutions with total assets between $1.0 billion and $10.0 billion Source: Company filings, S&P Global Market Intelligence Historical NCOs / Average Loans (0.10%) 0.60% 1.30% 2.00% 2008 2009 2010 2011 2012 2013 2014 2015 2016 2017 2018 2019 2020 2021Q1 BRBS FVCB FDIC Peer Group Loans $M % of Loans BRBS 30 $31.0 1.35% FVCB 3 $10.0 0.69% Minimal Loans Remaining on Payment Deferral
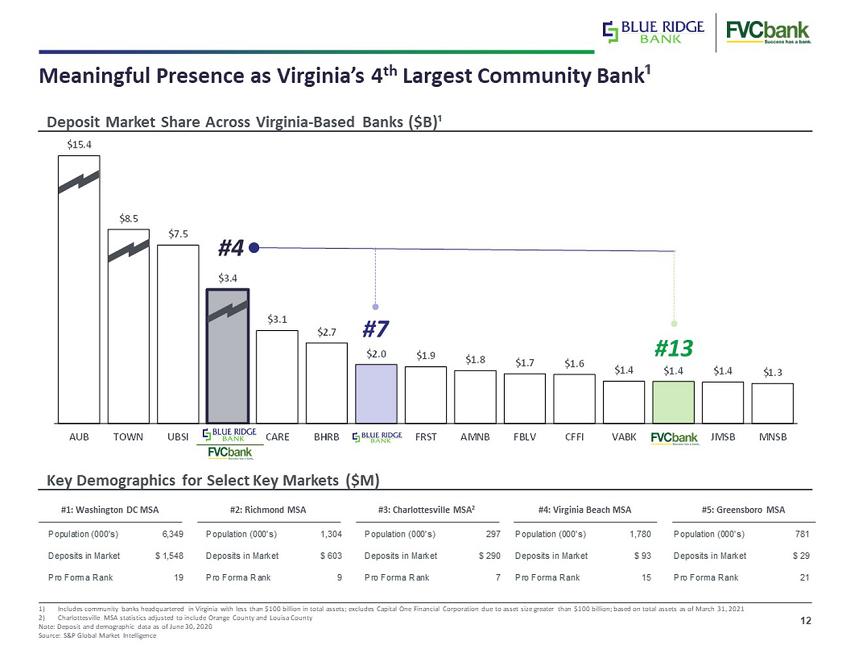
12 $15.4 $8.5 $7.5 $3.4 $3.1 $2.7 $2.0 $1.9 $1.8 $1.7 $1.6 $1.4 $1.4 $1.4 $1.3 AUB TOWN UBSI CARE BHRB FRST AMNB FBLV CFFI VABK JMSB MNSB #3: Charlottesville MSA 2 #2: Richmond MSA Deposit Market Share Across Virginia - Based Banks ($B)¹ Meaningful Presence as Virginia’s 4 th Largest Community Bank ¹ 1) Includes community banks headquartered in Virginia with less than $100 billion in total assets; excludes Capital One Financia l C orporation due to asset size greater than $100 billion; based on total assets as of March 31, 2021 2) Charlottesville MSA statistics adjusted to include Orange County and Louisa County Note: Deposit and demographic data as of June 30, 2020 Source: S&P Global Market Intelligence Key Demographics for Select Key Markets ($M) #1: Washington DC MSA #4: Virginia Beach MSA #5: Greensboro MSA Population (000's) 6,349 Deposits in Market $ 1,548 Pro Forma Rank 19 Population (000's) 1,304 Deposits in Market $ 603 Pro Forma Rank 9 Population (000's) 297 Deposits in Market $ 290 Pro Forma Rank 7 Population (000's) 1,780 Deposits in Market $ 93 Pro Forma Rank 15 #4 #7 #13

13 Non - Interest Bearing 31.5% Interest Bearing Non - Time 53.8% Retail Time 3.4% Jumbo Time 11.3% Non - Interest Bearing 28.8% Interest Bearing Non - Time 42.6% Retail Time 9.7% Jumbo Time 18.9% Source: Company filings, S&P Global Market Intelligence Attractive Low - Cost Deposit Platform BRBS FVCB PRO FORMA $2.1B Deposits $1.6B Deposits $3.7B Deposits 1Q’21 Cost of Deposits: 0.36% 1Q’21 Cost of Deposits: 0.51% 1Q’21 Cost of Deposits: 0.41% Relationship - based driven platforms Diversifies geography Reduced reliance on time deposits Meaningful non - interest bearing base Non - Interest Bearing 30.0% Interest Bearing Non - Time 47.4% Retail Time 7.0% Jumbo Time 15.7%

14 Key Merger Model Assumptions 2022 Earnings Assumptions ▪ BRBS internal targeted EPS of $1.75 in 2022, or ~$32.9M in aggregate ▪ FVCB internal targeted EPS of $1.95 in 2022, or ~$28.3M in aggregate Estimated One - Time Merger Costs ▪ $25 million (pre - tax) Estimated Cost Savings ▪ 15% of combined non - interest expense, excluding mortgage banking related expenses ▪ ~$11M in 2022 (75% phase - in) and ~$16M in 2023 (100% phase - in) Purchase Accounting and Other Adjustments ▪ Gross credit mark equal to 1.50% of FVCB’s gross loans excluding PPP loans at closing, or ~$23.6 million ▪ Assumes projected provision reserve coverage of 1.00% on net - FVCB loan growth ▪ Core deposit intangible of ~$6.6 million, or 0.50% of non - time deposits; amortized 10 years using the Double Declining Balance methodology ▪ Assumes 0.50% pre - tax cost of cash and 21% tax rate on pro forma adjustments ▪ Assumes transaction closing of December 31, 2021

15 Compelling Financial Impact For All Shareholders 1) Assumes fully phased - in cost savings in FY2022 2) Annualized based on July 2021 quarterly dividend, declared at $0.12 per share of BRBS common stock Note: Metrics based on preliminary merger analysis Dominant Pro Forma Virginia Franchise ~$5B Assets ~$73M Net Income 1 ~$625M Market Cap Attractive Returns to BRBS 16%+ 2022 And 2023 EPS Accretion¹ ~5.7% TBV Dilution ~2.1 Year Earnback Significant Upside to FVCB ~20% FVCB ’22 EPS Accretion¹ $0.55 Dividend Per Share² Strong Capital Position > 11 % CET1 Ratio > 14 % Total Capital Ratio

16 Due Diligence Process Scope of BRBS and FVCB Thorough and Reciprocal Due Diligence Efforts Mortgage Banking Commercial Real Estate C&I Retail & Consumer Banking / Deposit Strategy Engaged Third Party Credit Review Investment Portfolio / ALCO Technology & Data Operations Accounting & Finance Audit / Compliance / BSA Legal Extensive Scope Looking Forward ▪ Estimated closing in 4Q2021 or early Q12022 ▪ Comprehensive due diligence coordinated and led by key executives of BRBS and FVCB ▪ Full engagement of external consultants and advisors through the diligence process, including third party credit review of more than 50% of commercial loan balances of both companies ▪ Integration will be managed by long - time employees of BRBS and FVCB who have been actively involved in diligence and previous merger integrations

17 ▪ Strong Alignment of company cultures and values with high regard on client - focus and team - oriented approach ▪ Strong focus on diversity, inclusion and employee development ▪ Diversified client base and scope ▪ Increased technology capabilities and mortgage platform ▪ Expanded breadth of products available to customers ▪ Enhanced ability to serve larger client base ▪ Greater capabilities and expanded product base ▪ Larger balance sheet and increased capital to support client growth ▪ Double Digit Earnings Accretion ▪ Accelerates efficiencies ▪ Enhances long - term profitability and growth SHAREHOLDERS EMPLOYEES CUSTOMERS COMMUNITIES Continued Focus and Dedicated Service to Communities and Shareholders Core to Respective Purposes and Respective Business Models

18 Strong, Affluent Growth Markets of Operation Strong, affluent growth markets Diversified footprint across key growth markets in Virginia, Maryland and North Carolina Enhanced Scale to Drive Increased Growth and Profitability Dominant market positions Strengthens core franchise to create 4th largest Virginia - headquartered community bank¹ Expands market reach, product offering and scale to better serve customers Strategic Transformation to Benefit Shareholders and Communities 1) Includes community banks headquartered in Virginia with less than $100 billion in total assets; excludes Capital One Financia l C orporation due to asset size greater than $100 billion; based on total assets as of March 31, 2021 Enhanced Revenue Streams with Increased Sources of Fee Income Complementary Product Lines Specialty business lines, including mortgage and FinTech partnerships Creation of a Stronger Franchise with Greater Scarcity Value Establishment of a powerful middle - market franchise not currently operating in Virginia Best talent taken from both franchises Strong and complementary culture Powerful Operating Leverage Top - tier metrics with meaningful capital generation and flexibility Increased scale supports investments in technology and FinTech strategies Flexibility to acquire smaller Virginia banks – limited competition among $2B+ Banks

19 Appendix

20 Historical Acquisition Summary Note: Transaction values based on values at closing History of Solid Growth and Successful Integration ▪ Transaction Value: $127M ▪ Total Assets: $1.25B ▪ Number of Branches: 17 Bay Banks of Virginia, Inc. (2021) 1 Virginia Community Bankshares, Inc. (2019) 2 ▪ Transaction Value: $46M ▪ Total Assets: $251M ▪ Number of Branches: 8 River Bancorp, Inc. (2016) 3 ▪ Transaction Value: $13.4M ▪ Total Assets: $116M Colombo Bank (2018) 1 st Commonwealth Bank of Virginia (2012) 1 ▪ Transaction Value: $33M ▪ Total Assets: $191M ▪ Number of Branches: 5 2 ▪ Transaction Value: $2.8M ▪ Total Assets: $56.9M ▪ Number of Branches: 1

21 Estimated Earnings Per Share Impact 2022 Estimated Run - Rate Earnings, Including Targeted Cost Savings ($M, except per share values) Blue Ridge's Standalone Net Income to Common Estimate $32.9 FVCB Standalone Net Income to Common Estimate $28.3 After-Tax Transaction Adjustments: Cost Savings (Illustrative Phase-In of Cost Savings at 100%) $11.8 CDI Amortization Expense from Transaction (1.0) Reversal of FVCB Existing Intangible Amortization 0.2 Other Accounting Adjustments 0.7 Pro Forma Net Income to Common $72.9 Pro Forma Average Diluted Shares (Ms) 35.8 Blue Ridge Pro Forma EPS $2.04 Accretion ($) $0.28 Accretion (%) 16.2% FVCB Exchange Ratio Adjusted Pro Forma EPS $2.34 Accretion ($) $0.39 Accretion (%) 19.8%

22 $12.29 $2.14 $0.35 $0.11 $0.51 $10.90 $13.04 Pro Forma Tangible Book Value Per Share 1) Includes full impact of one - time merger expenses for illustrative purposes ~(5.7%) Blue Ridge Standalone (1Q’21) Est. Growth To Close Blue Ridge Est. at Close (4Q’21) Equity Consideration and Merger Purchase Accounting Impact Est. Total Restructuring Costs¹ Pro Forma TBVPS Core Deposit Intangible Established