Attached files
| file | filename |
|---|---|
| 8-K - FORM 8-K - Butterfly Network, Inc. | tm2119270d1_8k.htm |
Exhibit 99.1
Legacy Butterfly
BFLY Operations, Inc. (formerly known as Butterfly Network, Inc.)
Unaudited Quarterly Financial Results for 2020
Butterfly Network, Inc. (the “Company”) is furnishing the following tables which set forth supplemental unaudited financial information of BFLY Operations, Inc. (formerly known as Butterfly Network, Inc. prior to the business combination completed on February 12, 2021 and which is a wholly- owned subsidiary of the Company following the business combination) (“Legacy Butterfly”) for the periods and as of the dates indicated. This supplemental presentation of unaudited financial information is not intended to replace the financial information presented in the Company’s Annual Report on Form 10-K for the year ended December 31, 2020 filed with the Securities and Exchange Commission (the “SEC”) on March 29, 2021, as amended by Form 10-K/A on May 12, 2021, or the Company’s Quarterly Reports on Form 10-Q, or the audited consolidated financial statements and related notes of Legacy Butterfly presented in the Company’s Current Report on Form 8-K filed with the SEC on February 16, 2021, as amended by Form 8-K/A on February 16, 2021 and March 29, 2021. Investors should refer to the notes to the financial statements included with such filings.
| 1 |
BFLY OPERATIONS, INC.
(FORMERLY BUTTERFLY NETWORK, INC.)
CONDENSED CONSOLIDATED BALANCE SHEETS
(In thousands, except share and per share amounts)
(Unaudited)
| March 31, 2020 | June 30, 2020 | September 30, 2020 | December 31, 2020 | |||||||||||||
| Assets | ||||||||||||||||
| Current assets: | ||||||||||||||||
| Cash and cash equivalents | $ | 70,006 | $ | 73,428 | $ | 51,686 | $ | 60,206 | ||||||||
| Accounts receivable, net | 1,993 | 5,374 | 2,828 | 5,752 | ||||||||||||
| Inventories | 8,857 | 11,726 | 14,942 | 25,805 | ||||||||||||
| Current portion of vendor advances | 3,937 | 2,958 | 236 | 2,571 | ||||||||||||
| Prepaid expenses and other current assets | 3,021 | 1,729 | 3,102 | 2,998 | ||||||||||||
| Total current assets | $ | 87,814 | $ | 95,215 | $ | 72,794 | $ | 97,332 | ||||||||
| Property and equipment, net | 5,467 | 6,730 | 6,881 | 6,870 | ||||||||||||
| Non-current portion of vendor advances | 46,940 | 46,940 | 46,940 | 37,390 | ||||||||||||
| Other non-current assets | 3,548 | 3,461 | 3,478 | 5,599 | ||||||||||||
| Total assets | $ | 143,769 | $ | 152,346 | $ | 130,093 | $ | 147,191 | ||||||||
| Liabilities, convertible preferred stock and stockholders' deficit | ||||||||||||||||
| Current liabilities: | ||||||||||||||||
| Accounts payable | $ | 6,588 | $ | 6,920 | $ | 8,330 | $ | 16,400 | ||||||||
| Deferred revenue, current | 4,607 | 6,128 | 5,350 | 8,443 | ||||||||||||
| Accrued purchase commitments, current | — | — | 63,376 | 22,890 | ||||||||||||
| Accrued expenses and other current liabilities | 4,268 | 6,840 | 8,886 | 21,962 | ||||||||||||
| Total current liabilities | $ | 15,463 | $ | 19,888 | $ | 85,942 | $ | 69,695 | ||||||||
| Deferred revenue, non-current | 587 | 587 | 1,099 | 2,790 | ||||||||||||
| Convertible debt | — | 20,263 | 21,019 | 49,528 | ||||||||||||
| Loan payable | — | 4,366 | 4,366 | 4,366 | ||||||||||||
| Accrued purchase commitments, non-current | — | — | — | 19,660 | ||||||||||||
| Other non-current liabilities | 563 | 567 | 624 | 2,146 | ||||||||||||
| Total liabilities | $ | 16,613 | $ | 45,671 | $ | 113,050 | $ | 148,185 | ||||||||
| Commitments and contingencies | ||||||||||||||||
| Convertible preferred stock: | ||||||||||||||||
| Convertible preferred stock (Series A, B, C, and D) $.0001 par value with an aggregate liquidation preference of $383,829 at each reporting date | 360,937 | 360,937 | 360,937 | 360,937 | ||||||||||||
| Stockholders' deficit: | ||||||||||||||||
| Class A common stock $.0001 par value | 1 | 1 | 1 | 1 | ||||||||||||
| Class B common stock $.0001 par value 1 | — | — | — | — | ||||||||||||
| Additional paid-in capital | 22,633 | 25,393 | 27,969 | 32,874 | ||||||||||||
| Accumulated deficit | (256,415 | ) | (279,656 | ) | (371,864 | ) | (394,806 | ) | ||||||||
| Total stockholders' deficit | $ | (233,781 | ) | $ | (254,262 | ) | $ | (343,894 | ) | $ | (361,931 | ) | ||||
| Total liabilities, convertible preferred stock and stockholders' deficit | $ | 143,769 | $ | 152,346 | $ | 130,093 | $ | 147,191 | ||||||||
1 There were 0 shares of Class B common stock issued and outstanding at each reporting date
| 2 |
BFLY OPERATIONS, INC.
(FORMERLY BUTTERFLY NETWORK, INC.)
CONDENSED CONSOLIDATED STATEMENTS OF OPERATIONS AND COMPREHENSIVE LOSS
(In thousands, except shares and per share amounts)
(Unaudited)
| Three months ended | ||||||||||||||||||||
| March 31, 2020 | June 30, 2020 | September 30, 2020 | December 31, 2020 2 | Total | ||||||||||||||||
| Revenue: | ||||||||||||||||||||
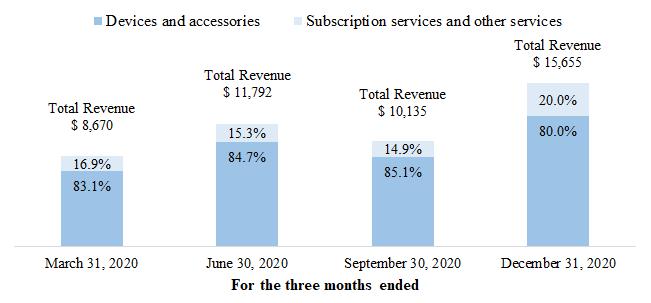
| Product | $ | 7,209 | $ | 9,990 | $ | 8,621 | $ | 12,527 | $ | 38,347 | ||||||||||
| Subscription | 1,461 | 1,802 | 1,514 | 3,128 | 7,905 | |||||||||||||||
| Total revenue | $ | 8,670 | $ | 11,792 | $ | 10,135 | $ | 15,655 | $ | 46,252 | ||||||||||
| Cost of revenue: | ||||||||||||||||||||
| Product 1 | 9,262 | 11,385 | 78,612 | 7,148 | 106,407 | |||||||||||||||
| Subscription | 244 | 242 | 774 | (192 | ) | 1,068 | ||||||||||||||
| Total cost of revenue | $ | 9,506 | $ | 11,627 | $ | 79,386 | $ | 6,956 | $ | 107,475 | ||||||||||
| Gross margin | $ | (836 | ) | $ | 165 | $ | (69,251 | ) | $ | 8,699 | $ | (61,223 | ) | |||||||
| Operating expenses: | ||||||||||||||||||||
| Research and development | $ | 12,516 | $ | 11,940 | $ | 11,971 | $ | 13,311 | $ | 49,738 | ||||||||||
| Sales and marketing | 5,915 | 5,955 | 5,538 | 8,855 | 26,263 | |||||||||||||||
| General and administrative | 5,242 | 5,341 | 5,068 | 8,744 | 24,395 | |||||||||||||||
| Total operating expenses | 23,673 | 23,236 | 22,577 | 30,910 | 100,396 | |||||||||||||||
| Loss from operations | $ | (24,509 | ) | $ | (23,071 | ) | $ | (91,828 | ) | $ | (22,211 | ) | $ | (161,619 | ) | |||||
| Interest income | $ | 199 | $ | 23 | $ | 16 | $ | 47 | $ | 285 | ||||||||||
| Interest expense | (5 | ) | (113 | ) | (300 | ) | (723 | ) | (1,141 | ) | ||||||||||
| Other income (expense), net | (29 | ) | (70 | ) | (84 | ) | (48 | ) | (231 | ) | ||||||||||
| Loss before provision for income taxes | $ | (24,344 | ) | $ | (23,231 | ) | $ | (92,196 | ) | $ | (22,935 | ) | $ | (162,706 | ) | |||||
| Provision for income taxes | 10 | 10 | 12 | 7 | 39 | |||||||||||||||
| Net loss and comprehensive loss | $ | (24,354 | ) | $ | (23,241 | ) | $ | (92,208 | ) | $ | (22,942 | ) | $ | (162,745 | ) | |||||
| Net loss per common share attributable to Class A common stockholders, basic and diluted | $ | (4.07 | ) | $ | (3.85 | ) | $ | (15.20 | ) | $ | (3.73 | ) | $ | (26.87 | ) | |||||
| Weighted-average shares used to compute net loss per share attributable to Class A common stockholders, basic and diluted | 5,979,231 | 6,034,191 | 6,066,117 | 6,145,688 | 6,056,578 | |||||||||||||||
| 1 Losses (gains) on purchase commitments included in product costs of revenue (in millions) | $ | — | $ | — | $ | 64.0 | $ | (3.9 | ) | $ | 60.1 | |||||||||
| 2 In Amendment No. 2 to the Company’s Current Report on Form 8-K/A filed with the SEC on March 29, 2021, the Company disclosed that it had made reclassification adjustments from product revenues to subscription revenues in the amount of $650 and from product cost of revenue to subscription cost of revenue in the amount of $533. The reclassifications were recorded during the three months ended December 31, 2020 and also related to the three months ended September 30, 2020. The reclassifications were deemed immaterial. The reclassifications do not impact total revenue, total cost of revenue or net loss for any period presented in this Current Report or any previously issued financial statements. | ||||||||||||||||||||
| 3 |
BFLY OPERATIONS, INC.
(FORMERLY BUTTERFLY NETWORK, INC.)
CONDENSED CONSOLIDATED STATEMENTS OF CASH FLOWS
(In thousands)
(Unaudited)
| Three months ended | ||||||||||||||||||||
| March 31, 2020 | June 30, 2020 | September 30, 2020 | December 31, 2020 | Total | ||||||||||||||||
| Cash flows from operating activities: | ||||||||||||||||||||
| Net loss | $ | (24,354 | ) | $ | (23,241 | ) | $ | (92,208 | ) | $ | (22,942 | ) | $ | (162,745 | ) | |||||
| Adjustments to reconcile net loss to net cash used in operating activities: | ||||||||||||||||||||
| Depreciation and amortization | 285 | 308 | 311 | 412 | 1,316 | |||||||||||||||
| Write-down of other assets – related party | — | — | — | 1,390 | 1,390 | |||||||||||||||
| Write-down of vendor advance | — | — | — | 10,560 | 10,560 | |||||||||||||||
| Non-cash interest expense on convertible debt | — | 113 | 305 | 629 | 1,047 | |||||||||||||||
| Write-down of inventories | — | 709 | 6,214 | 200 | 7,123 | |||||||||||||||
| Stock-based compensation expense | 2,683 | 2,662 | 2,382 | 3,277 | 11,004 | |||||||||||||||
| Other | 244 | 47 | 438 | (153 | ) | 576 | ||||||||||||||
| Changes in operating assets and liabilities: | ||||||||||||||||||||
| Accounts receivable | (229 | ) | (2,969 | ) | 1,723 | (2,902 | ) | (4,377 | ) | |||||||||||
| Inventories | 528 | (3,522 | ) | (9,432 | ) | (11,061 | ) | (23,487 | ) | |||||||||||
| Prepaid expenses and other assets | (1,495 | ) | 2,030 | (874 | ) | 319 | (20 | ) | ||||||||||||
| Vendor advances | 1,302 | 979 | 2,723 | (3,346 | ) | 1,658 | ||||||||||||||
| Accounts payable | 1,487 | 143 | 1,606 | 7,939 | 11,175 | |||||||||||||||
| Deferred revenue | 1,407 | 1,521 | (266 | ) | 4,784 | 7,446 | ||||||||||||||
| Accrued purchase commitments | — | — | 63,376 | (20,826 | ) | 42,550 | ||||||||||||||
| Accrued expenses and other liabilities | (1,528 | ) | 1,484 | 2,031 | 11,097 | 13,084 | ||||||||||||||
| Net cash used in operating activities | $ | (19,670 | ) | $ | (19,736 | ) | $ | (21,671 | ) | $ | (20,623 | ) | $ | (81,700 | ) | |||||
| Cash flows from investing activities: | ||||||||||||||||||||
| Purchases of property and equipment | (480 | ) | (1,428 | ) | (689 | ) | 221 | (2,376 | ) | |||||||||||
| Net cash used in investing activities | $ | (480 | ) | $ | (1,428 | ) | $ | (689 | ) | $ | 221 | $ | (2,376 | ) | ||||||
| Cash flows from financing activities: | ||||||||||||||||||||
| Proceeds from exercise of stock options | 154 | 70 | 118 | 1,696 | 2,038 | |||||||||||||||
| Proceeds from loan payable | — | 4,366 | — | — | 4,366 | |||||||||||||||
| Proceeds from issuance of convertible debt | — | 20,150 | 500 | 29,350 | 50,000 | |||||||||||||||
| Payments of deferred offering costs | — | — | — | (657 | ) | (657 | ) | |||||||||||||
| Payments of debt issuance costs | — | — | — | (1,467 | ) | (1,467 | ) | |||||||||||||
| Net cash provided by financing activities | $ | 154 | $ | 24,586 | $ | 618 | $ | 28,922 | $ | 54,280 | ||||||||||
| Net (decrease) increase in cash and cash equivalents | $ | (19,996 | ) | $ | 3,422 | $ | (21,742 | ) | $ | 8,520 | $ | (29,796 | ) | |||||||
| Cash and cash equivalents, beginning of period | 90,002 | 70,006 | 73,428 | 51,686 | 90,002 | |||||||||||||||
| Cash and cash equivalents, end of period | $ | 70,006 | $ | 73,428 | $ | 51,686 | $ | 60,206 | $ | 60,206 | ||||||||||
| 4 |
Key Performance Metrics
In addition to providing supplemental unaudited consolidated financial information of Legacy Butterfly above based on generally accepted accounting principles in the United States of America (“GAAP”), the Company has also provided above additional key performance metrics of Legacy Butterfly. We review the key performance measures discussed below, to evaluate business and measure performance, identify trends, formulate plans and make strategic decisions.
Units fulfilled
We define units fulfilled as the number of devices whereby control is transferred to a customer. We do not adjust this metric for returns as our volume of returns has historically been low. We view units fulfilled as a key indicator of the growth of our business. We believe that this metric is useful to investors because it presents our core growth and performance of our business period over period.
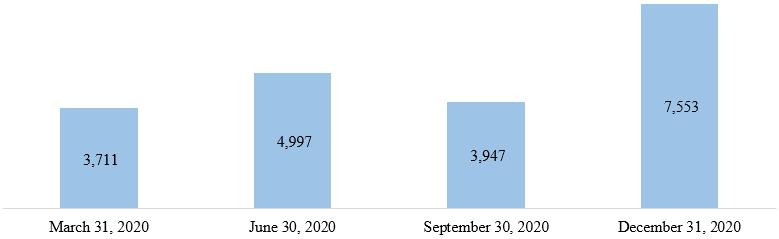
For the three months ended
| 5 |
Subscription Mix
We define subscription mix as a percentage of our total revenue recognized in a reporting period that is subscription based, consisting primarily of our software as a service (“SaaS”) offering. We view subscription mix as a key indicator of the profitability of our business, and thus we believe that this metric is useful to investors.
| 6 |
Non-GAAP Financial Measures
In addition to providing supplemental unaudited consolidated financial information of Legacy Butterfly above based on generally accepted accounting principles in the United States of America (“GAAP”), the Company has also provided above additional financial metrics of Legacy Butterfly that are not prepared in accordance with GAAP (“non-GAAP”). The non-GAAP financial measures included in this exhibit are Adjusted EBITDA, Adjusted gross profit and Adjusted gross margin. The Company presents non-GAAP financial measures in order to assist readers of its consolidated financial statements in understanding the core operating results that its management uses to evaluate the business and for financial planning purposes. These non-GAAP financial measures provide an additional tool for investors to use in comparing our financial performance over multiple periods.
Adjusted EBITDA, Adjusted gross profit and Adjusted gross margin are key performance measures that the Company’s management uses to assess its operating performance. These non-GAAP measures facilitate internal comparisons of the Company’s operating performance on a more consistent basis. The Company uses these performance measures for business planning purposes and forecasting. The Company believes that Adjusted EBITDA, Adjusted gross profit and Adjusted gross margin enhance an investor’s understanding of the Company’s financial performance as they are useful in assessing its operating performance from period-to-period by excluding certain items that the Company believes are not representative of its core business.
Adjusted EBITDA, Adjusted gross profit and Adjusted gross margin may not be comparable to similarly titled measures of other companies because they may not calculate these measures in the same manner. Adjusted EBITDA, Adjusted gross profit and Adjusted gross margin are not prepared in accordance with GAAP and should not be considered in isolation of, or as an alternative to, measures prepared in accordance with GAAP. When evaluating the Company’s performance, you should consider Adjusted EBITDA, Adjusted gross profit and Adjusted gross margin alongside other financial performance measures prepared in accordance with GAAP, including net loss, gross profit and gross margin.
The non-GAAP financial measures do not replace the presentation of the Company’s GAAP financial results and should only be used as a supplement to, not as a substitute for, the Company’s financial results presented in accordance with GAAP. In this exhibit, the Company has provided a reconciliation of Adjusted EBITDA to net loss, Adjusted gross profit to gross profit, and Adjusted gross margin to gross margin, the most directly comparable GAAP financial measures. Management strongly encourages investors to review the Company’s financial statements and publicly-filed reports in their entirety and not rely on any single financial measure.
| 7 |
BFLY OPERATIONS, INC.
(FORMERLY BUTTERFLY NETWORK, INC.)
RECONCILIATION OF GAAP TO NON-GAAP
FINANCIAL MEASURES
(In thousands)
(Unaudited)
| Three months ended | ||||||||||||||||||||
| March 31, 2020 | June 30, 2020 | September 30, 2020 | December 31, 2020 | Total | ||||||||||||||||
| Revenue | $ | 8,670 | $ | 11,792 | $ | 10,135 | $ | 15,655 | $ | 46,252 | ||||||||||
| Cost of revenue | 9,506 | 11,627 | 79,386 | 6,956 | 107,475 | |||||||||||||||
| Gross profit | $ | (836 | ) | $ | 165 | $ | (69,251 | ) | $ | 8,699 | $ | (61,223 | ) | |||||||
| Gross margin | -9.6 | % | 1.4 | % | -683.3 | % | 55.6 | % | -132.4 | % | ||||||||||
| Add: | ||||||||||||||||||||
| Depreciation and amortization | 22 | 24 | 23 | 71 | 140 | |||||||||||||||
| Loss (gain) on purchase commitments | — | — | 63,993 | (3,880 | ) | 60,113 | ||||||||||||||
| Inventory write-downs | — | — | 2,570 | — | 2,570 | |||||||||||||||
| Adjusted gross profit | $ | (814 | ) | $ | 189 | $ | (2,665 | ) | $ | 4,890 | $ | 1,600 | ||||||||
| Adjusted gross margin | -9.4 | % | 1.6 | % | -26.3 | % | 31.2 | % | 3.5 | % | ||||||||||
| Three months ended | ||||||||||||||||||||
| March 31, 2020 | June 30, 2020 | September 30, 2020 | December 31, 2020 | Total | ||||||||||||||||
| Net loss | $ | (24,354 | ) | $ | (23,241 | ) | $ | (92,208 | ) | $ | (22,942 | ) | $ | (162,745 | ) | |||||
| Interest income | (199 | ) | (23 | ) | (16 | ) | (47 | ) | (285 | ) | ||||||||||
| Interest expense | 5 | 113 | 300 | 723 | 1,141 | |||||||||||||||
| Other expense, net | 29 | 70 | 84 | 48 | 231 | |||||||||||||||
| Provision for income taxes | 10 | 10 | 12 | 7 | 39 | |||||||||||||||
| Stock based compensation | 2,683 | 2,662 | 2,382 | 3,277 | 11,004 | |||||||||||||||
| Depreciation and amortization | 285 | 308 | 311 | 412 | 1,316 | |||||||||||||||
| Impairments | — | — | — | 1,390 | 1,390 | |||||||||||||||
| Loss (gain) on purchase commitments | — | — | 63,993 | (3,880 | ) | 60,113 | ||||||||||||||
| Inventory write-downs | — | — | 2,570 | — | 2,570 | |||||||||||||||
| Adjusted EBITDA | $ | (21,541 | ) | $ | (20,101 | ) | $ | (22,572 | ) | $ | (21,012 | ) | $ | (85,226 | ) | |||||
| 8 |