Attached files
| file | filename |
|---|---|
| EX-99.2 - EXHIBIT 99.2 - Roth CH Acquisition III Co | tm2119598d2_ex99-2.htm |
| EX-99.1 - EXHIBIT 99.1 - Roth CH Acquisition III Co | tm2119598d2_ex99-1.htm |
| 8-K - FORM 8-K - Roth CH Acquisition III Co | tm2119598d2_8k.htm |
Exhibit 99.3

1 Investor Presentation June 2021

2 Disclaimer THIS PRESENTATION (THIS “PRESENTATION”) IS PROVIDED FOR INFORMATION PURPOSES ONLY AND HAS BEEN PREPARED TO ASSIST INTERESTED PAR TIES IN MAKING THEIR OWN EVALUATION WITH RESPECT TO A POTENTIAL BUSINESS COMBINATION BETWEEN ROTH CH ACQUISITION III CO. (“ROCR”) AND BCP QUALTEK HOLDCO, LLC (TOGETHER WITH ITS DIRECT AND INDIRECT SUBSIDIARIES, COLLECTIVELY, THE “COMPANY” OR “Q UALTEK”) AND RELATED TRANSACTIONS (THE “PROPOSED BUSINESS COMBINATION”) AND FOR NO OTHER PURPOSE. THE DISTRIBUTION OF THIS PRESENTATION MAY ALSO BE RESTRICTED BY LAW AND PERSONS INTO WHOSE POSSESSION THIS PRESENTATION COMES SH OULD INFORM THEMSELVES OF AND OBSERVE ANY SUCH RESTRICTIONS. THE RECIPIENT ACKNOWLEDGES THAT IT IS (I) AWARE THAT THE UNITED STATES SECURITIES LAWS PROHIBIT ANY PERSON WHO HAS MATERIAL, NON - PUBLIC INFORMATION CONCERNING A COMPANY FROM PURCHAS ING OR SELLING SECURITIES OF SUCH COMPANY OR FROM COMMUNICATING SUCH INFORMATION TO ANY OTHER PERSON UNDER CIRCUMSTANCES IN WHICH IT IS REASONABLY FORESEEABLE THAT SUCH PERSON IS LIKELY TO PURCHASE OR SELL SUCH SECURITIES, AND (II) FAM ILIAR WITH THE SECURITIES EXCHANGE ACT OF 1934, AS AMENDED, AND THE RULES AND REGULATIONS PROMULGATED THEREUNDER (COLLECTIVELY, THE “EXCHANGE ACT”), AND THAT THE RECIPIENT WILL NEITHER USE, NOR CAUSE ANY THIRD PARTY TO USE, THIS PRESENTAT ION OR ANY INFORMATION CONTAINED HEREIN IN CONTRAVENTION OF THE EXCHANGE ACT, INCLUDING, WITHOUT LIMITATION, RULE 10B - 5 HEREUNDER. THIS PRESENTATION AND THE INFORMATION CONTAINED HEREIN CONSTITUTES CONFIDENTIAL INFORMATION, IS PROVIDED TO YOU ON THE CONDIT ION THAT YOU AGREE THAT YOU WILL HOLD IT IN STRICT CONFIDENCE AND NOT REPRODUCE, DISCLOSE, FORWARD OR DISTRIBUTE IT IN WHOLE OR IN PART WITHOUT THE PRIOR WRITTEN CONSENT OF ROCR AND THE COMPANY AND IS INTENDED FOR THE RECIPIENT HEREOF ONLY NO REPRESENTATIONS OR WARRANTIES, EXPRESS OR IMPLIED ARE GIVEN IN, OR IN RESPECT OF, THIS PRESENTATION. TO THE FULLEST EXTENT PE RMITTED BY LAW IN NO CIRCUMSTANCES WILL ROCR, QUALTEK OR ANY OF THEIR RESPECTIVE SUBSIDIARIES, STOCKHOLDERS, AFFILIATES, REPRESENTATIVES, PARTNERS, DIRECTORS, OFFICERS, EMPLOYEES, ADVISERS OR AGENTS BE RESPONSIBLE OR LIABLE FOR ANY DI REC T, INDIRECT OR CONSEQUENTIAL LOSS OR LOSS OF PROFIT ARISING FROM THE USE OF THIS PRESENTATION, ITS CONTENTS, ITS OMISSIONS, RELIANCE ON THE INFORMATION CONTAINED WITHIN IT, OR ON OPINIONS COMMUNICATED IN RELATION THERETO OR OTHERWISE ARIS ING IN CONNECTION THEREWITH. INDUSTRY AND MARKET DATA USED IN THIS PRESENTATION HAVE BEEN OBTAINED FROM THIRD - PARTY INDUSTRY PUBLICATIONS AND SOURCES AS WELL AS FROM RESEARCH REPORTS PREPARED FOR OTHER PURPOSES. NEITHER ROCR NOR QUALTEK HAS IND EPENDENTLY VERIFIED THE DATA OBTAINED FROM THESE SOURCES AND CANNOT ASSURE YOU OF THE DATA’S ACCURACY OR COMPLETENESS. THIS DATA IS SUBJECT TO CHANGE. IN ADDITION, THIS PRESENTATION DOES NOT PURPORT TO BE ALL - INCLUSIVE OR TO CONTAIN ALL OF THE INFORMATION THAT MAY BE REQUIRED TO MAKE A FULL ANALYSIS OF QUALTEK OR THE PROPOSED BUSINESS COMBINATION. VIEWERS OF THIS PRESENTATION SHOULD EACH MAKE THEIR OWN EVALUATION OF QUALTEK AND OF THE RELEVANCE AND ADEQUACY OF THE INFORM ATI ON AND SHOULD MAKE SUCH OTHER INVESTIGATIONS AS THEY DEEM NECESSARY. FORWARD - LOOKING STATEMENTS CERTAIN STATEMENTS INCLUDED IN THIS PRESENTATION THAT ARE NOT HISTORICAL FACTS ARE FORWARD - LOOKING STATEMENTS FOR PURPOSES OF TH E SAFE HARBOR PROVISIONS UNDER THE UNITED STATES PRIVATE SECURITIES LITIGATION REFORM ACT OF 1995. FORWARD - LOOKING STATEMENTS GENERALLY ARE ACCOMPANIED BY WORDS SUCH AS “BELIEVE,” “MAY,” “WILL,” “ESTIMATE,” “CONTINUE,” “ANTICIPATE,” “I NTEND,” “EXPECT,” “SHOULD,” “WOULD,” “PLAN,” “PREDICT,” “POTENTIAL,” “SEEM,” “SEEK,” “FUTURE,” “OUTLOOK,” “MODEL,” “TARGET,” “GO AL,” AND SIMILAR EXPRESSIONS THAT PREDICT OR INDICATE FUTURE EVENTS OR TRENDS OR THAT ARE NOT STATEMENTS OF HISTORICAL MATTERS. THESE FOR WARD - LOOKING STATEMENTS INCLUDE, BUT ARE NOT LIMITED TO, STATEMENTS REGARDING ESTIMATES AND FORECASTS OF OTHER FINANCIAL AND PERFORMANCE METRICS AND PROJECTIONS OF MARKET OPPORTUNITY. THESE STATEMENTS ARE BASED ON VARIOUS ASSUMPTIONS, W HET HER OR NOT IDENTIFIED IN THIS PRESENTATION, AND ON THE CURRENT EXPECTATIONS OF ROCR’S AND QUALTEK’S MANAGEMENT AND ARE NOT PREDICTIONS OF ACTUAL PERFORMANCE. THESE FORWARD - LOOKING STATEMENTS ARE PROVIDED FOR ILLUSTRATIVE PURPOSES ONLY AND ARE NOT INTENDED TO SERVE AS, AND MUST NOT BE RELIED ON BY ANY INVESTOR AS, A GUARANTEE, AN ASSURANCE, A PREDICTION OR A DEFINITIVE STATEMENT OF FACT OR PROBABILITY. ACTUAL EVENTS AND CIRCUMSTANCES ARE DIFFICULT OR IMPOSSIBLE TO P RED ICT AND WILL DIFFER FROM ASSUMPTIONS. MANY ACTUAL EVENTS AND CIRCUMSTANCES ARE BEYOND THE CONTROL OF ROCR AND QUALTEK. THESE FORWARD - LOOKING STATEMENTS ARE SUBJECT TO A NUMBER OF RISKS AND UNCERTAINTIES, INCLUDING CHANGES IN DOMESTIC AND FOREIGN BUSINESS, MARKET, FINANCIAL, POLITICAL AND LEGAL CONDITIONS; THE INABILITY OF THE PARTIES TO SUCCESSFULLY OR TIMELY CONSUMMATE THE PROPOSED BUSINESS COMBINATION, INCLUDING THE RISK THAT ANY REQUIRED REGULATORY APPROVALS ARE NOT OBTAIN ED, ARE DELAYED OR ARE SUBJECT TO UNANTICIPATED CONDITIONS THAT COULD ADVERSELY AFFECT THE COMBINED COMPANY OR THE EXPECTED BENEFITS OF THE PROPOSED BUSINESS COMBINATION OR THAT THE APPROVAL OF THE STOCKHOLDERS OF ROCR OR QUALTEK IS NOT OB TAINED; FAILURE TO REALIZE THE ANTICIPATED BENEFITS OF THE PROPOSED BUSINESS COMBINATION; RISKS RELATING TO THE UNCERTAINTY OF THE PROJECTED FINANCIAL INFORMATION WITH RESPECT TO QUALTEK; RISKS RELATED TO THE ORGANIC AND INORGANIC GROWTH OF QUALTEK’S BUSINESS; RISKS RELATED TO QUALTEK’S ACQUISITIONS, INCLUDING POTENTIAL ACQUISITIONS; AND THE TIMING OF EXPECTED BUSINESS MILESTONES; THE EFFECTS OF COMPETITION ON QUALTEK’S FUTURE BUSINESS; THE AMOUNT OF REDEMPTION REQUESTS MADE BY ROCR’S STOCKHOLDERS; THE ABILITY OF ROCR OR THE COMBINED COMPANY TO ISSUE EQUITY OR EQUITY - LINKED SECURITIES OR OBTAIN DEBT FINANCING IN CONNECTION WITH THE PROPOSED BUSINESS COMBINATION OR IN THE FUTURE, AND THOSE FACTORS DISCUSSED IN R OCR ’S FINAL PROSPECTUS DATED MARCH 4, 2021, UNDER THE HEADING “RISK FACTORS,” AND OTHER DOCUMENTS OF ROCR FILED, OR TO BE FILED, WITH THE SECURITIES AND EXCHANGE COMMISSION (“SEC”). IF ANY OF THESE RISKS MATERIALIZE OR OUR ASSUMPTIONS PROVE INC ORR ECT, ACTUAL RESULTS COULD DIFFER MATERIALLY FROM THE RESULTS IMPLIED BY THESE FORWARD - LOOKING STATEMENTS. THERE MAY BE ADDITIONAL RISKS THAT NEITHER ROCR NOR QUALTEK PRESENTLY KNOW OR THAT ROCR AND QUALTEK CURRENTLY BELIEVE ARE IMMATERIAL TH AT COULD ALSO CAUSE ACTUAL RESULTS TO DIFFER FROM THOSE CONTAINED IN THE FORWARD - LOOKING STATEMENTS. IN ADDITION, FORWARD - LOOKING STATEMENTS REFLECT ROCR’S AND QUALTEK’S EXPECTATIONS, PLANS OR FORECASTS OF FUTURE EVENTS AND VIEWS AS OF THE DA TE OF THIS PRESENTATION. ROCR AND QUALTEK ANTICIPATE THAT SUBSEQUENT EVENTS AND DEVELOPMENTS WILL CAUSE ROCR’S AND QUALTEK’S ASSESSMENTS TO CHANGE. HOWEVER, WHILE ROCR AND QUALTEK MAY ELECT TO UPDATE THESE FORWARD - LOOKING STATEMENTS AT SOM E POINT IN THE FUTURE, ROCR AND QUALTEK SPECIFICALLY DISCLAIM ANY OBLIGATION TO DO SO. THESE FORWARD - LOOKING STATEMENTS SHOULD NOT BE RELIED UPON AS REPRESENTING ROCR’S AND QUALTEK’S ASSESSMENTS AS OF ANY DATE SUBSEQUENT TO THE DATE O F T HIS PRESENTATION. ACCORDINGLY, UNDUE RELIANCE SHOULD NOT BE PLACED UPON THE FORWARD - LOOKING STATEMENTS.

3 Disclaimer USE OF PROJECTIONS THIS PRESENTATION CONTAINS PROJECTED FINANCIAL INFORMATION WITH RESPECT TO QUALTEK. SUCH PROJECTED FINANCIAL INFORMATION CONS TIT UTES FORWARD - LOOKING INFORMATION AND IS FOR ILLUSTRATIVE PURPOSES ONLY AND SHOULD NOT BE RELIED UPON AS NECESSARILY BEING INDICATIVE OF FUTURE RESULTS. THE ASSUMPTIONS AND ESTIMATES UNDERLYING SUCH FINANCIAL FORECAST INFORMATION ARE INHERENTLY UNCERTAIN AND ARE SUBJECT TO A WIDE VARIETY OF SIGNIFICANT BUSINESS, ECONOMIC, COMPETITIVE AND OTHER RISKS AND UNCERTAINTIES. SEE “FORWARD - LOOKING STATEMENTS” ABOVE. ACTUAL RESULTS MAY DIFFER MATERIALLY FROM THE RESULTS CONTEMPLA TED BY THE FINANCIAL FORECAST INFORMATION CONTAINED IN THIS PRESENTATION, AND THE INCLUSION OF SUCH INFORMATION IN THIS PRESENTATION SHOULD NOT BE REGARDED AS A REPRESENTATION BY ANY PERSON THAT THE RESULTS REFLECTED IN SUCH FORECASTS WILL BE ACHIEVED. IN PARTICULAR, THERE CAN BE NO ASSURANCE THAT QUALTEK’S HISTORICAL RETURNS FROM PAST ACQUISITIONS WILL BE ACHIEVED ON FUTURE ACQUISITIONS. NEITHER THE INDEPENDENT AUDITORS OF ROCR NOR THE INDEPENDENT REGISTERED PUBLIC ACCOUNTING FI RM OF THE COMPANY AUDITED, REVIEWED, COMPILED OR PERFORMED ANY PROCEDURES WITH RESPECT TO THE PROJECTIONS FOR THE PURPOSE OF THEIR INCLUSION IN THIS PRESENTATION AND, ACCORDINGLY, NEITHER OF THEM EXPRESSED AN OPINION OR PROVIDED ANY OT HER FORM OF ASSURANCE WITH RESPECT THERETO FOR THE PURPOSE OF THIS PRESENTATION. THERE ARE NUMEROUS FACTORS RELATED TO THE MARKETS IN GENERAL OR THE IMPLEMENTATION OF ANY OPERATIONAL STRATEGY THAT CANNOT BE FULLY ACCOUNTED FOR WITH R ESP ECT TO THE PROJECTIONS HEREIN. ANY TARGETS OR ESTIMATES ARE THEREFORE SUBJECT TO A NUMBER OF IMPORTANT RISKS, QUALIFICATIONS, LIMITATIONS AND EXCEPTIONS THAT COULD MATERIALLY AND ADVERSELY AFFECT ROCR AND THE COMPANY’S PERFORMANCE. MOR EOV ER, ACTUAL EVENTS ARE DIFFICULT TO PROJECT AND OFTEN DEPEND UPON FACTORS THAT ARE BEYOND THE CONTROL OF ROCR AND THE COMPANY AND ITS AFFILIATES. A RECONCILIATION OF NON - GAAP FINANCIAL MEASURES IN THIS PRESENTATION TO THE MOST DIRECTLY CO MPARABLE UNITED STATES GENERALLY ACCEPTED ACCOUNTING PRINCIPLES (“GAAP”) FINANCIAL MEASURES IS NOT INCLUDED, BECAUSE, WITHOUT UNREASONABLE EFFORT, THE COMPANY IS UNABLE TO PREDICT WITH REASONABLE CERTAINTY THE AMOUNT OR TIMING OF NON - GAAP ADJUSTM ENTS THAT ARE USED TO CALCULATE THESE NON - GAAP FINANCIAL MEASURES. FINANCIAL INFORMATION; NON - GAAP FINANCIAL MEASURES THE FINANCIAL INFORMATION AND DATA CONTAINED IN THIS PRESENTATION IS UNAUDITED AND DOES NOT CONFORM TO REGULATION S - X. ACCORDING LY, SUCH INFORMATION AND DATA MAY NOT BE INCLUDED IN, MAY BE ADJUSTED IN OR MAY BE PRESENTED DIFFERENTLY IN, ANY PROXY STATEMENT OR REGISTRATION STATEMENT TO BE FILED BY ROCR WITH THE SEC, AND SUCH DIFFERENCES MAY BE MATERIAL. IN PARTICUL AR, ALL QUALTEK PROJECTED FINANCIAL INFORMATION INCLUDED HEREIN IS PRELIMINARY AND SUBJECT TO RISKS AND UNCERTAINTIES. ANY VARIATION BETWEEN QUALTEK’S ACTUAL RESULTS AND THE PROJECTED FINANCIAL INFORMATION INCLUDED HEREIN MAY BE MATERIAL. SOME OF THE FINANCIAL INFORMATION AND DATA CONTAINED IN THIS PRESENTATION, SUCH AS ADJUSTED EBITDA, HAVE NOT BEEN PREPARED IN AC CORDANCE WITH UNITED STATES GENERALLY ACCEPTED ACCOUNTING PRINCIPLES (“GAAP”). ROCR AND QUALTEK BELIEVE THAT THE USE OF THESE NON - GAAP FINANCIAL MEASURES PROVIDES AN ADDITIONAL TOOL FOR INVESTORS TO USE IN EVALUATING HISTORICAL OR PROJECTED OPERATING RESULTS AND TRENDS IN AND IN COMPARING QUALTEK’S FINANCIAL MEASURES WITH OTHER SIMILAR COMPANIES, MANY OF WHICH PRESENT SIMILAR NON - GAAP FINANCIAL MEASURES TO INVESTORS. MANAGEMENT DOES NOT CONSIDER THESE NON - GAAP MEASURES IN ISOLA TION OR AS AN ALTERNATIVE TO FINANCIAL MEASURES DETERMINED IN ACCORDANCE WITH GAAP. THE PRINCIPAL LIMITATION OF THESE NON - GAAP FINANCIAL MEASURES IS THAT THEY EXCLUDE SIGNIFICANT EXPENSES AND REVENUE THAT ARE REQUIRED BY GAAP TO BE RECORDED IN QUALTEK’S FINANCIAL STATEMENTS. IN ADDITION, THEY ARE SUBJECT TO INHERENT LIMITATIONS AS THEY REFLECT THE EXERCISE OF JUDGMENTS BY MANAGEMENT ABOUT WHICH EXPENSE AND REVENUE ITEMS ARE EXCLUDED OR INCLUDED IN DETERMINING THESE NON - GAAP FINANCIAL MEASURES. IN ORDER TO COMPENSATE FOR THESE LIMITATIONS, MANAGEMENT PRESENTS HISTORICAL NON - GAAP FINANCIAL MEASURES IN CONNECTION WITH GAAP RESULTS. YOU SHOULD REVIEW QUALTEK’S AUDITED FINANCIAL STATEMENTS, WHICH WILL BE I NCL UDED IN THE PROXY STATEMENT TO BE FILED BY ROCR. HOWEVER, NOT ALL OF THE INFORMATION NECESSARY FOR A QUANTITATIVE RECONCILIATION OF THE FORWARD - LOOKING NON - GAAP FINANCIAL MEASURES TO THE MOST DIRECTLY COMPARABLE GAAP FINANCIAL MEASURES IS AVA ILABLE WITHOUT UNREASONABLE EFFORTS AT THIS TIME. IMPORTANT INFORMATION ABOUT THE PROPOSED BUSINESS COMBINATION AND WHERE TO FIND IT IN CONNECTION WITH THE PROPOSED BUSINESS COMBINATION, ROCR INTENDS TO FILE A PROXY STATEMENT (THE “PROXY STATEMENT”) WITH THE SE C, WHICH WILL BE DISTRIBUTED TO HOLDERS OF ROCR’S COMMON STOCK IN CONNECTION WITH ROCR’S SOLICITATION OF PROXIES FOR THE VOTE BY ROCR’S STOCKHOLDERS WITH RESPECT TO THE PROPOSED BUSINESS COMBINATION AND OTHER MATTERS AS DESCRIBED IN THE PROXY ST ATEMENT. ROCR WILL MAIL A DEFINITIVE PROXY STATEMENT, WHEN AVAILABLE, TO ITS STOCKHOLDERS. INVESTORS AND SECURITY HOLDERS ARE URGED TO READ THE PROXY STATEMENT, ANY AMENDMENTS THERETO AND ANY OTHER DOCUMENTS FILED WITH THE SEC CAREFULLY AN D I N THEIR ENTIRETY WHEN THEY BECOME AVAILABLE BECAUSE THEY WILL CONTAIN IMPORTANT INFORMATION ABOUT ROCR, QUALTEK AND THE PROPOSED BUSINESS COMBINATION. INVESTORS AND SECURITY HOLDERS MAY OBTAIN FREE COPIES OF THE PRELIMINARY PROXY ST ATEMENT AND DEFINITIVE PROXY STATEMENT (WHEN AVAILABLE) AND OTHER DOCUMENTS FILED WITH THE SEC BY ROCR THROUGH THE WEBSITE MAINTAINED BY THE SEC AT HTTP://WWW.SEC.GOV, OR BY DIRECTING A REQUEST TO ROCR AT 888 SAN CLEMENTE DRIVE, SUITE 4 00, NEWPORT BEACH, CA 92660. INVESTMENT IN ANY SECURITIES DESCRIBED HEREIN HAS NOT BEEN APPROVED OR DISAPPROVED BY THE SEC OR ANY OTHER REGULATORY AUTHORI TY NOR HAS ANY AUTHORITY PASSED UPON OR ENDORSED THE MERITS OF THE OFFERING OR THE ACCURACY OR ADEQUACY OF THE INFORMATION CONTAINED HEREIN. ANY REPRESENTATION TO THE CONTRARY IS A CRIMINAL OFFENSE. PARTICIPANTS IN THE SOLICITATION ROCR AND QUALTEK AND THEIR RESPECTIVE DIRECTORS AND CERTAIN OF THEIR RESPECTIVE EXECUTIVE OFFICERS AND OTHER MEMBERS OF MANAG EME NT AND EMPLOYEES MAY BE CONSIDERED PARTICIPANTS IN THE SOLICITATION OF PROXIES WITH RESPECT TO THE PROPOSED BUSINESS COMBINATION. INFORMATION ABOUT THE DIRECTORS AND EXECUTIVE OFFICERS OF ROCR IS SET FORTH IN ITS FINAL PROSPECTUS DAT ED MARCH 4, 2021. ADDITIONAL INFORMATION REGARDING THE PARTICIPANTS IN THE PROXY SOLICITATION AND A DESCRIPTION OF THEIR DIRECT AND INDIRECT INTERESTS, BY SECURITY HOLDINGS OR OTHERWISE, WILL BE INCLUDED IN THE PROXY STATEMENT AND OTHER RELEVANT MAT ERIALS TO BE FILED WITH THE SEC REGARDING THE PROPOSED BUSINESS COMBINATION WHEN THEY BECOME AVAILABLE. STOCKHOLDERS, POTENTIAL INVESTORS AND OTHER INTERESTED PERSONS SHOULD READ THE PROXY STATEMENT CAREFULLY WHEN IT BECOMES AVAI LAB LE BEFORE MAKING ANY VOTING OR INVESTMENT DECISIONS. YOU MAY OBTAIN FREE COPIES OF THESE DOCUMENTS AS INDICATED ABOVE. NO OFFER OR SOLICITATION THIS PRESENTATION SHALL NOT CONSTITUTE AN OFFER TO SELL OR THE SOLICITATION OF AN OFFER TO BUY ANY SECURITIES, NOR SHALL THER E B E ANY SALE OF SECURITIES IN ANY JURISDICTION IN WHICH SUCH OFFER, SOLICITATION OR SALE WOULD BE UNLAWFUL PRIOR TO REGISTRATION OR QUALIFICATION UNDER THE SECURITIES LAWS OF ANY SUCH JURISDICTION. NO OFFERING OF SECURITIES WILL BE MADE EXCE PT BY MEANS OF A PROSPECTUS MEETING THE REQUIREMENTS OF THE SECURITIES ACT OF 193 3, AS AMENDED, OR AN EXEMPTION THEREFROM. TRADEMARKS AND TRADE NAMES ROCR AND QUALTEK OWN OR HAVE RIGHTS TO VARIOUS TRADEMARKS, SERVICE MARKS AND TRADE NAMES THAT THEY USE IN CONNECTION WITH THE OP ERATION OF THEIR RESPECTIVE BUSINESSES. THIS PRESENTATION ALSO CONTAINS TRADEMARKS, SERVICE MARKS AND TRADE NAMES OF THIRD PARTIES, WHICH ARE THE PROPERTY OF THEIR RESPECTIVE OWNERS. THE USE OR DISPLAY OF THIRD PARTIES’ TRADEMARKS, S ERV ICE MARKS, TRADE NAMES OR PRODUCTS IN THIS PRESENTATION IS NOT INTENDED TO, AND DOES NOT IMPLY, A RELATIONSHIP WITH ROCR OR QUALTEK, OR AN ENDORSEMENT OR SPONSORSHIP BY OR OF ROCR OR THE COMPANY. SOLELY FOR CONVENIENCE, THE TRADEMARKS, SERVI CE MARKS AND TRADE NAMES REFERRED TO IN THIS PRESENTATION MAY APPEAR WITHOUT THE®, TM OR SM SYMBOLS, BUT SUCH REFERENCES ARE NOT INTENDED TO INDICATE, IN ANYWAY, THAT ROCR OR QUALTEK WILL NOT ASSERT, TO THE FULLEST EXTENT UNDER APPLICA BLE LAW, THEIR RIGHTS OR THE RIGHTS OF THE APPLICABLE LICENSOR TO THESE TRADEMARKS, SERVICE MARKS AND TRADE NAMES.

4 ▪ The Transaction contemplates a post - money equity value of ~$564M and enterprise value of ~$829M ▪ Implies 7.8x CY2021E EBITDA of $106M Transaction Overview Proposed Transaction Summary (1) Assumes no existing ROCR shareholders exercise redemption rights Combination With III ▪ QualTek USA, LLC (“QualTek”), and Roth CH Acquisition III Co. (“ROCR”) have executed a merger agreement to enter into a business combination (the “Transaction”) ▪ In connection with the Transaction, QualTek and ROCR have signed subscription agreements with investors for a Pre - PIPE and PIPE, which in combination with cash in ROCR’s trust account totals $225M (1) ($44M Pre - PIPE | $66M PIPE | $115M Cash in Trust) ▪ Transaction expected to close in Q3 2021 ▪ Upon the closing of the Transaction, QualTek will be a publicly listed company on Nasdaq under the new ticker QTEK Financials and Valuation (1)
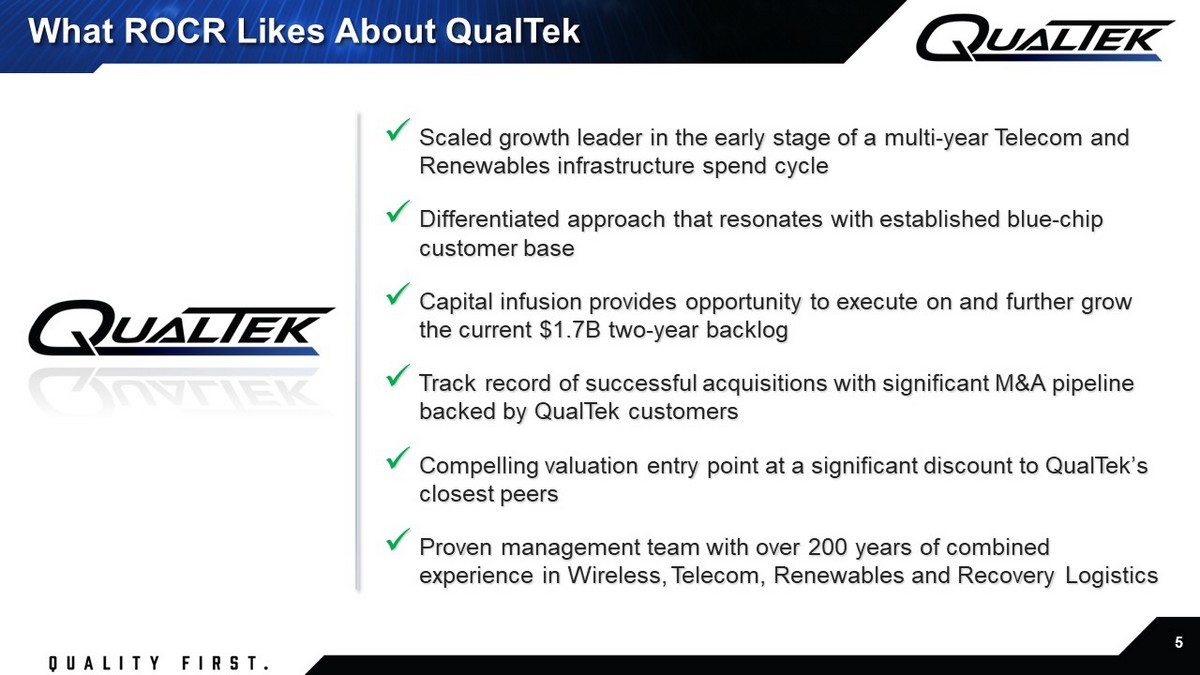
5 What ROCR Likes About QualTek x Scaled growth leader in the early stage of a multi - year Telecom and Renewables infrastructure spend cycle x Differentiated approach that resonates with established blue - chip customer base x Capital infusion provides opportunity to execute on and further grow the current $1.7B two - year backlog x Track record of successful acquisitions with significant M&A pipeline backed by QualTek customers x Compelling valuation entry point at a significant discount to QualTek’s closest peers x Proven management team with over 200 years of combined experience in Wireless, Telecom, Renewables and Recovery Logistics

6 Business Overview
7 Today’s Presenters Adam Spittler Scott Hisey Chief Financial Officer President & Chief Executive Officer Founder

8 Secular Shift From Traditional Coal - Generated Energy to Green Energy (e.g., Wind and Solar) Provides a Strong Growth Backdrop for the Renewables Business Market - Leading Infrastructure Solutions Provider Focused on Wireless, Wireline, Renewables and Recovery Logistics Sectors Revenue Visibility via Predictable $1.7B Two - Year Backlog Massive Industry Tailwinds, Including $81B C - band Spectrum Auction, Expected to Drive Significant 5G Infrastructure Buildout Forecasted to Reach $26B in 2022 (1) Blue - Chip Customers Including AT&T, Verizon, T - Mobile and Duke Energy Robust Cash Flow Generation | 2021E EBITDA of $106M and FCF conversion of 74% (2) QualTek Investment Highlights Seasoned Management Team that has Built a Highly Leverageable Shared Services Platform Managing Over 5,000 Workers (1) Source: Finley Engineering (2) Memo: Unlevered Free Cash Flow Margin

9 62% 18% 10% 10% 53% 47% QualTek Overview Total Current Two - Year Backlog $1.7 billion 2021E Revenue $818 million Service Locations (U.S. & Canada) 80+ Workforce 5,000+ Employees 1,800+ Founded 2012 Headquarters Blue Bell , PA QualTek at a Glance Consolidated Revenue (1) ▪ World - class, technology - driven, leading provider of communications infrastructure services and renewables solutions to the North American telecommunications and utilities industries ▪ National footprint with 80+ service locations across the U.S. & Canada ▪ Highly scalable shared services platform with real - time monitoring, driving industry leading results ▪ Robust acquisition pipeline filled with value - driven targets ▪ Direct relationships with end - customers & unparalleled customer service ▪ Positioned to drive market share and capitalize on sector momentum 2021E Segment Financial Mix Business Highlights Wireless Wireline Revenue: $818M EBITDA: $106M (1) Projected Revenue does not include the effects of any potential future acquisitions Renewables Recovery Logistics $621 $675 $818 $975 $1,135 2019 2020 2021E 2022E 2023E ($ in millions)

10 Jay Heaberlin | President Relevant Experience: 20 years Together Since: 2002 QualTek is Led by an Experienced, Entrepreneurial Management Team with a Proven Track Record of Driving Value for Customers, Employees and Shareholders Highly Experienced Management Team Scott Hisey Founder | President | CEO Relevant Experience: 32 years Elizabeth Downey | CAO Relevant Experience: 25 years Together Since: 2005 Mike Williams | CTO Relevant Experience: 20 years Together Since: 2006 Adam Spittler | CFO Relevant Experience: 20 years Together Since: 2008 Kevin Doran | President Relevant Experience: 35 years Together Since: 2010 Tom Mix | President Relevant Experience: 30 years Together Since: 2018 Wireless Telecom Recovery Logistics Tim Hooker | President Relevant Experience: 22 years Together Since: 2021 Renewables
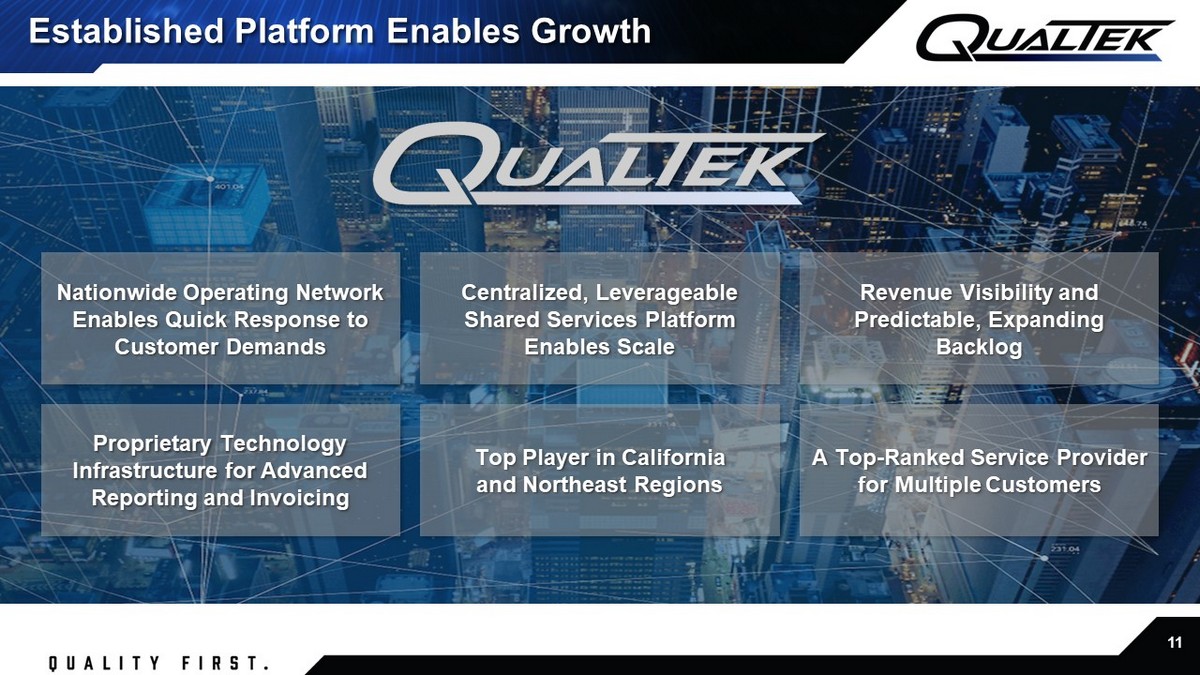
11 Nationwide Operating Network Enables Quick Response to Customer Demands Centralized, Leverageable Shared Services Platform Enables Scale Revenue Visibility and Predictable, Expanding Backlog Proprietary Technology Infrastructure for Advanced Reporting and Invoicing Top Player in California and Northeast Regions A Top - Ranked Service Provider for Multiple Customers Established Platform Enables Growth

12 Governance & Compliance Mergers & Acquisitions Risk & Safety IT & Software Development Finance & Accounting Fleet & Facilities HR & Staffing Shared Services Highly Scalable Shared Services Platform Shared Services Provides a Competitive Advantage for Operational Execution and Growth

13 Note: Bridge is illustrative and not presented to scale. T - Mobile / Sprint Merger C - Band Auction Renewable Energy Rural Digital Opportunity Fund “Strong, dependable network connectivity has never been more critical to customers or to the country …This quantum leap forward can only be achieved by using T - Mobile and Sprint’s combined low - , mid - and high - spectrum bands — and only the New T - Mobile will have the resources to do it quickly.” “Within six years, the New T - Mobile will provide 5G to 99% of the U.S. population and average 5G speeds in excess of 100 Mbps to 90% of the U.S. population.” “New T - Mobile’s business plan is built on covering 90% of rural Americans with average 5G speeds of 50 Mbps, up to two times faster than broadband on average.” “Auction of 3.7 GHz service licenses yields over $81 billion in gross bids and provides much - needed mid - band spectrum for 5G services.” “Twenty - one bidders won all of the available 5,684 licenses.” “ This auction reflects a shift in our nation’s approach to 5G toward mid - band spectrum that can support fast, reliable, and ubiquitous service that is competitive with our global peers.” “It is essential to America’s economic recovery that we deliver on the promise of next - generation wireless services for everyone , everywhere…” “ Successful Rural Digital Opportunity Fund (RDOF) auction to expand broadband to over 10 million rural Americans; Phase I auction allocates $9.2 Billion to close the digital divide in 49 states and the Commonwealth of the Northern Mariana Islands ” “Bidders won funding to deploy high - speed broadband to over 5.2 million unserved homes and businesses, almost 99% of the locations available in the auction. Moreover, 99.7% of these locations will be receiving broadband with speeds of at least 100/20 Mbps, with an overwhelming majority (over 85%) getting gigabit - speed broadband.” “A total of 180 bidders won auction support, to be distributed over the next 10 years.” “Biden will invest $400 billion over ten years, as one part of a broad mobilization of public investment, in clean energy and innovation … will set a target of reducing the carbon footprint of the U.S. building stock 50% by 2035.” “Biden…unknowingly left himself a down - payment for the work ahead: $40 billion in unused Energy Department loan authority awarded under the 2009 stimulus.” “ President Joe Biden enlisted the entire U.S. government in the fight against climate change… even telling the Central Intelligence Agency to consider global warming a national security threat ... has vowed to make the electric grid carbon - free by 2035 and [has] said the world’s “future rests in renewable energy.” Sources: T - Mobile website; Federal Communications Commission; PCMag website; Politico; Biden - Harris campaign website; White Hous e website Crystalizing the Growth Drivers in the Industry

14 ▪ Installation ▪ Project management ▪ Maintenance ▪ Real estate ▪ Site acquisition ▪ Fiber optic aerial and underground installation ▪ Fiber optic splicing, termination & testing ▪ New installations ▪ Engineering ▪ Wind Farm fiber optic communications ▪ Solar Farm fiber optic communications ▪ Fiber optic transmission line design, installation and testing ▪ Wind & Solar Farm fiber maintenance ▪ Emergency response ▪ Underground and aerial work ▪ Commissioning ▪ Project management ▪ Generator deployment 10% 35% Segment Brand Key Services Key Customers Wireless Maintain - Upgrade - Replace Wireline Place - Sustain - Preserve Install - Service - Upgrade Recovery Logistics Repair - Remediate Renewables Design - Install - Service 2021E EBITDA Margin % 2021E Revenue 62% 18% 10% 10% One - Stop Infrastructure Solutions Provider We Believe QualTek is at the Epicenter of the 5G and Renewables Buildout
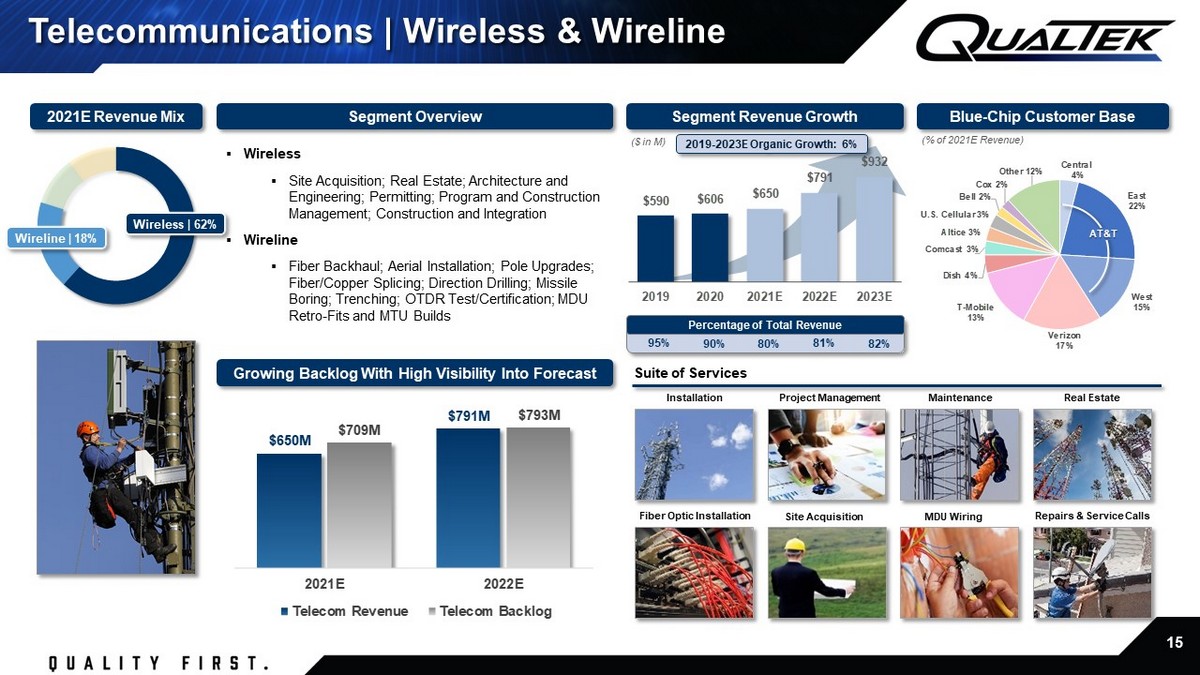
15 $590 $606 $650 $791 $932 2019 2020 2021E 2022E 2023E $650M $791M $709M $793M 2021E 2022E Telecom Revenue Telecom Backlog Growing Backlog With High Visibility Into Forecast 2019 - 2023E Organic Growth: 6% Telecommunications | Wireless & Wireline Installation Project Management Maintenance Site Acquisition Real Estate Blue - Chip Customer Base (% of 2021E Revenue) ▪ Wireless ▪ Site Acquisition; Real Estate; Architecture and Engineering; Permitting; Program and Construction Management; Construction and Integration ▪ Wireline ▪ Fiber Backhaul; Aerial Installation; Pole Upgrades; Fiber/Copper Splicing; Direction Drilling; Missile Boring; Trenching; OTDR Test/Certification; MDU Retro - Fits and MTU Builds Segment Revenue Growth Repairs & Service Calls MDU Wiring Segment Overview Fiber Optic Installation Suite of Services AT&T ($ in M) 20 21E Revenue Mix Wireless | 62% Wireline | 18% 81% 82% Percentage of Total Revenue 80% 95% 90%

16 $7 $10 $3 $17 $2 $14 $19 $41 $19 $7 $5 $80 1G 1995 PCS 1G 1996 PCS 1G 1997 PCS 2G 2001 PCS 2G 2005 PCS 3G 2006 AWS-1 3G 2008 700 4G 2015 AWS-3 4G 2018 600 5G 2019 mmW 5G 2020 CBRS 5G 2020 C-Band $11.0B $13.0B $18.2B $21.4B The Perfect Storm | Telecom Infrastructure Spend is Poised to Surge 2020 – 2021E Capex Spend by Major Customer Forecast Number of 5G Connections in N.A. Sources: SEC filings; Thomson Reuters consensus estimates 2020 2021E 18% 18% 18% 275% 4M 14M 80M 150M 230M 310M 410M 2019 2020 2021E 2022E 2023E 2024E 2025E Selected FCC Auction Total Net Proceeds ($ in B) Sources: FierceWireless; CCS Insight; Statista estimates; Company reports; KeyBanc Capital Markets Inc. estimates

17 Wireless Carriers Investing in the Future Announced plans to double its fiber footprint from 14M homes - passed in 2020 (~25% of 60M addressable locations) to ~30M homes - passed $27B spectrum purchase Raised $14.7 billion on March 23, 2021, to fund and accelerate C - Band deployment Goal of 4M new fiber locations in 2022 34% % of QualTek 2021E Revenue excluding the effects of any potential future acquisitions $53B spectrum purchase Raised $25 billion on February 24, 2021, to fund and accelerate C - Band deployment Plans to upgrade 7,000 - 8,000 existing cell sites to support C - Band in 2021 13% Intends to expand its 5G Home fixed wireless Internet service to an additional 20 cities in 2021 (would raise total to 37) Expects to increase 5G footprint (106M people at 2020 year - end) to 200M by 2021 year - end and to 250M people by the end of 2022 $11B spectrum purchase Plans to grow its ~65K macro cell towers to ~85K and install 2.5GHz radios on ~30K towers Aggressive rural market expansion plans 10% Committed to deploying a 5G network covering 70% of the U.S. population by June 2023 Plans to build a wireless network 3% Plans to deploy C - Band across 100M POPs in 2021, 175M POPs in 2022 - 2023, and 250M+ POPs in 2024 and beyond
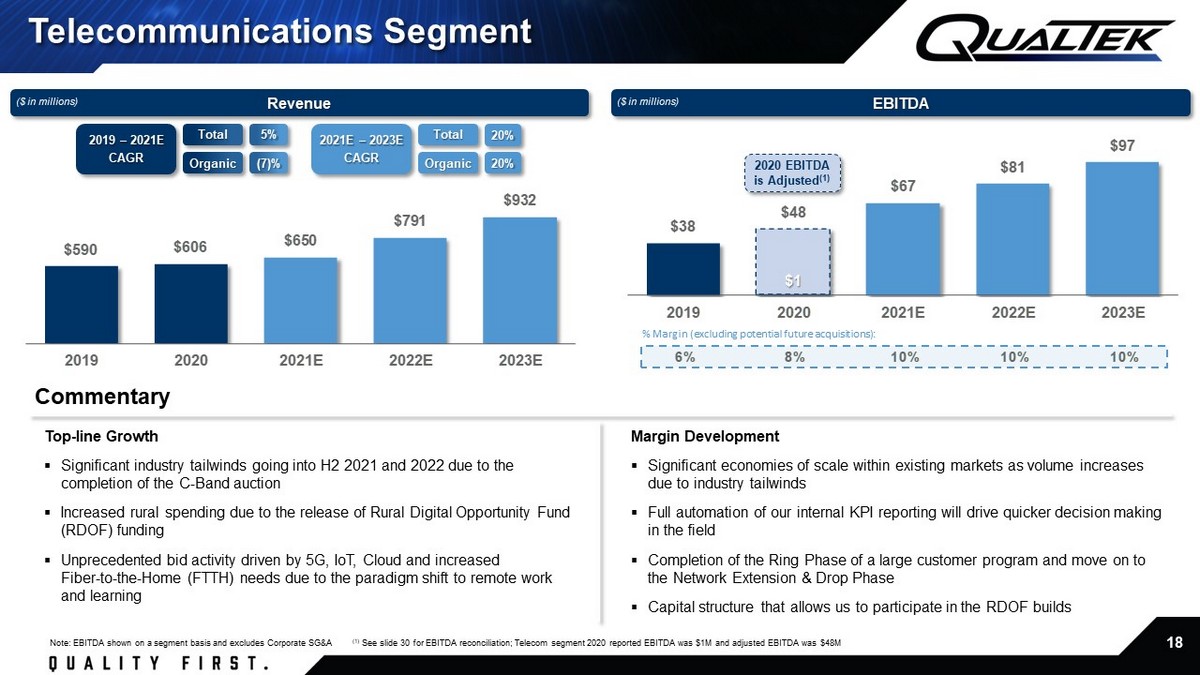
18 $1 $38 $48 $67 $81 $97 2019 2020 2021E 2022E 2023E $590 $606 $650 $791 $932 2019 2020 2021E 2022E 2023E 6% 8% 10% 10% 10% Commentary Top - line Growth ▪ Significant industry tailwinds going into H2 2021 and 2022 due to the completion of the C - Band auction ▪ Increased rural spending due to the release of Rural Digital Opportunity Fund (RDOF) funding ▪ Unprecedented bid activity driven by 5G, IoT, Cloud and increased Fiber - to - the - Home (FTTH) needs due to the paradigm shift to remote work and learning Margin Development ▪ Significant economies of scale within existing markets as volume increases due to industry tailwinds ▪ Full automation of our internal KPI reporting will drive quicker decision making in the field ▪ Completion of the Ring Phase of a large customer program and move on to the Network Extension & Drop Phase ▪ Capital structure that allows us to participate in the RDOF builds Note: EBITDA shown on a segment basis and excludes Corporate SG&A (1) See slide 30 for EBITDA reconciliation; Telecom segment 2020 reported EBITDA was $1M and adjusted EBITDA was $48M Revenue EBITDA % Margin (excluding potential future acquisitions): Telecommunications Segment ($ in millions) ($ in millions) 2020 EBITDA is Adjusted (1) 2019 – 2021E CAGR 2021E – 2023E CAGR 5% 20% Total Organic (7)% Total Organic 20%

19 $84 $92 $102 2019 2020 2021E 2022E 2023E 2021E - 2023E Organic Growth: 10% Blue - Chip Customer Base Sub - Segment Revenue Growth Wind Farms Solar Farms Construction Suite of Services Sub - Segment Overview (% of 2021E Revenue) ($ in M) Strategic Growth Initiatives ▪ ESG Renewables 90% Wind | 10% Solar ▪ Fiber Optic Terminations; OTDR and Power Meter Testing; Fusion Splicing; Fiber Replacement; Fiber Optic and Copper Infrastructure Installation; Cable Jetting; Boring & Trenching ▪ Expertise in Wind and Solar Farm fiber design, installation, and testing ▪ Large scale Data Com solutions and installation ▪ OPGW & ADSS Aerial transmission line install ▪ Entered the space through acquisition of Fiber Network Solutions (FNS) for $48M (1) in Jan 2021 ▪ Significant opportunity to leverage existing customers and footprint for incremental projects ▪ Expectations of greatly increased government spending in this space from new administration ▪ Over 40 customers served since 2018 Renewables 20 21E Revenue Mix Renewables | 10% Percentage of Total Revenue (1) Includes an additional $20M in potential earnouts in future years Others: Rosendin; Henkels & McCoy; Brink; William Charles Construction; Bowie - Cass; Great Southwest Construction; eLight; Mortenson; Maslonka; Irby; Wilson; NHPL; Irby; Barnard Construction; Wilson; RES; Mesa; Altitude Energy; Burns & McDonnell; LE Myers FNS Acq. in ‘21 9% 9% 10%
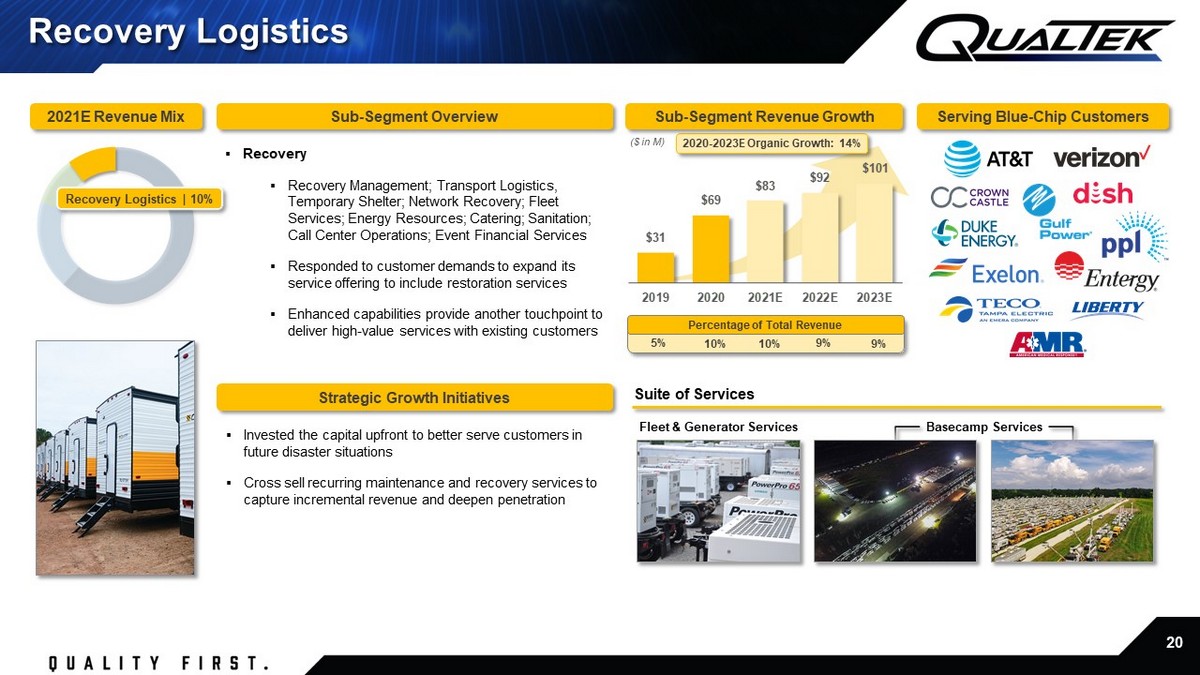
20 $31 $69 $83 $92 $101 2019 2020 2021E 2022E 2023E Strategic Growth Initiatives 2020 - 2023E Organic Growth: 14% Serving Blue - Chip Customers Sub - Segment Revenue Growth Sub - Segment Overview ($ in M) ▪ Recovery ▪ Recovery Management; Transport Logistics, Temporary Shelter; Network Recovery; Fleet Services; Energy Resources; Catering; Sanitation; Call Center Operations; Event Financial Services ▪ Responded to customer demands to expand its service offering to include restoration services ▪ Enhanced capabilities provide another touchpoint to deliver high - value services with existing customers ▪ Invested the capital upfront to better serve customers in future disaster situations ▪ Cross sell recurring maintenance and recovery services to capture incremental revenue and deepen penetration Recovery Logistics 20 21E Revenue Mix Recovery Logistics | 10% Percentage of Total Revenue Fleet & Generator Services Basecamp Services Suite of Services 9% 9% 10% 5% 10%

21 37% 42% 35% 35% 35% $24 $11 $29 $59 $65 $71 2019 2020 2021E 2022E 2023E $84 $31 $69 $167 $184 $202 2019 2020 2021E 2022E 2023E % Margin (excluding potential future acquisitions): Revenue EBITDA Commentary Top - line Growth ▪ Government focus and spending in the Renewables space ▪ Expansion of Recovery Logistics service offerings and customer base ▪ Significantly increased bid activity due to COVID - 19 - driven project delays and supply chain disruptions ▪ Unable to fully capitalize on Hurricane Dorian in 2019 due to limitations of basecamp assets (purchased in 2020 for $12M) Margin Development ▪ Margin decline from 2020 to 2021E solely due to mix (acquisition of FNS and the introduction of Renewables) Renewables & Recovery Logistics Segment ($ in millions) ($ in millions) Note: EBITDA shown on a segment basis and excludes Corporate SG&A (1) Projected 2021E figures include $84M of Revenue and $24M of EBITDA related to the FNS acquisition in January 2021 (1) (1) FNS Acquisition (Jan 2021) 2019 – 2021E CAGR 2021E – 2023E CAGR 133% 10% Total Organic 64% Total Organic 10%
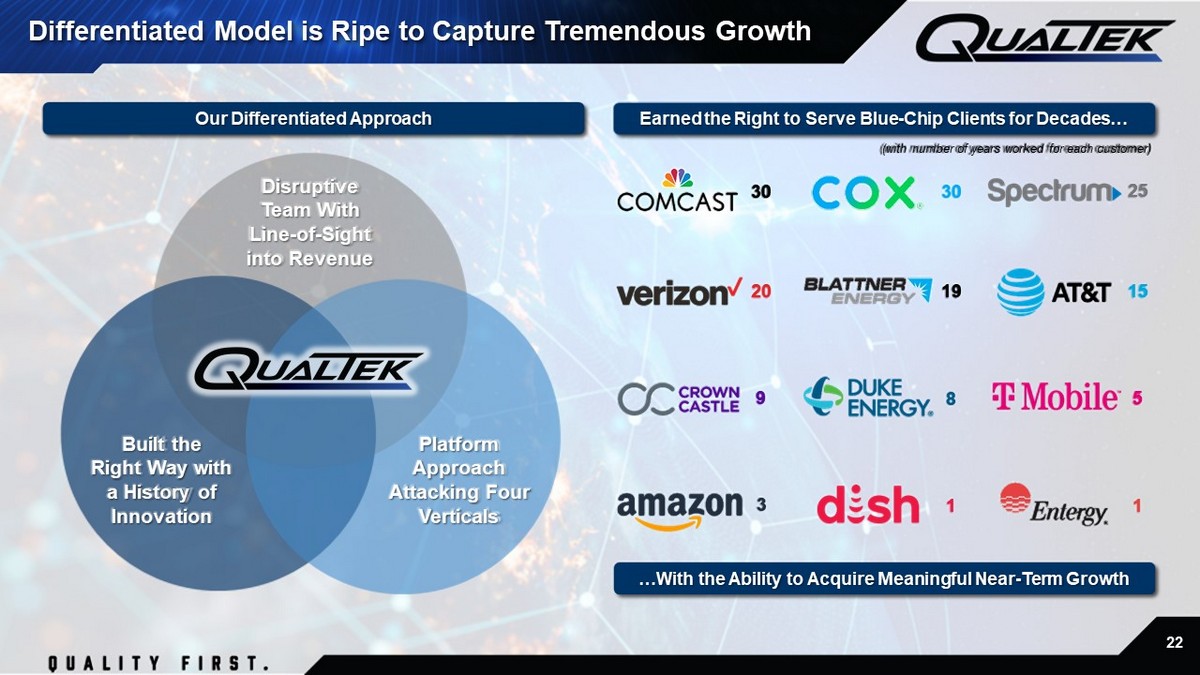
22 Earned the Right to Serve Blue - Chip Clients for Decades… 15 (with number of years worked for each customer) 20 5 30 8 3 9 19 30 1 25 1 Disruptive Team With Line - of - Sight into Revenue Built the Right Way with a History of Innovation Platform Approach Attacking Four Verticals …With the Ability to Acquire Meaningful Near - Term Growth Our Differentiated Approach Differentiated Model is Ripe to Capture Tremendous Growth

23 The QualTek Advantage

24 ▪ Close Proximity to Customers ▪ Knowledge of Local Markets ▪ Relationships w/ Local Stakeholders ▪ Access to Local Labor ▪ Ability to Efficiently Cross - Sell Services Site Locations Midwest Facilities: 11 Workforce: 1,012 Nationwide Operating Network Note: Shaded areas on map represent positions of geographic leadership (1) Northeast region includes 101 corporate employees that support all regions West Facilities: 17 Workforce: 951 Southwest Facilities: 9 Workforce: 548 Canada Facilities: 4 Workforce: 253 Northeast (1) Facilities: 20 Workforce: 1,451 Southeast Facilities: 21 Workforce: 748 80+ locations across the U.S. and Canada ensure QualTek is well positioned to respond to customer demand Insight into local market drivers and customer demand enables bespoke services in each market Deep relationships with local customers drive superior project execution Hybrid in - house & contracted labor model allows QualTek to flex its labor force in real - time to efficiently deliver on engagemen ts Complementary suite of services utilized by the same customer base offers a unique cross - selling opportunity | | | | | QualTek Operates a Strategically Located Network of Facilities that Provides Competitive Advantages in the Market

25 Daily Production Updates x Central and proprietary database for each of our lines of business ▪ Custom designed to each segment/customer ▪ We know where every job is at all times x End - to - end solution from engineering/permitting to final invoicing x Field data capture removes lags in reporting x Subcontractor management allows data reporting and reverse invoicing x Accelerates every measurable business activity ▪ Decreases DSO and OTC timeline x Integrates via Oracle ERP platform Proprietary Technology - Driven Platform Q Vision: Cloud - Based Mobility Project Management Tool Technology Advantage PM Life Cycle Collaboration Standardization & Execution Quality Control Reporting/Live Dashboards Scalable Technology Tool Supports Rapid Growth via Seamless Integration and Reporting

26 Robust Pipeline of Actionable Targets Valuation Discipline Margin Accretive 15+ Acquisition Pipeline ▪ History of improving acquired businesses by leveraging our proprietary technology driven platform and highly scalable shared services platform ▪ Acquisitions are often sourced by current blue - chip customers that prefer QualTek to provide them with services in a particular geography ▪ Highly experienced acquisition team ▪ Six acquisitions completed over the last 2½ years ▪ Previously acquired targets have all met or exceeded earnout targets ▪ Demonstrated track record of solid returns on past acquisitions Attractive Acquisition Platform M&A Pipeline The QualTek M&A Advantage $500M Gap

27 Most Recent Material Acquisitions Date of Acquisition Purchase Price (1) Multiple at Time of Closing (1) Multiple on 2021E EBITDA Multiple Buydown Oct 2018 $52M 5.3x 1.5x ( 3.8x ) Mar 2019 $32M 4.8x 3.9x ( 0.9x ) Oct 2019 $93M 8.8x 6.0x ( 2.8x ) Jan 2021 $48M 3.1x 2.0x ( 1.1x ) (1) Includes full considerations for earnouts, if applicable Strong Acquisition Track Record Proven Track Record of Integrating & Rapidly Seeding Meaningful Growth in Our Acquisitions Sub - Segment: Recovery Logistics Sub - Segment: Wireless Sub - Segment: Wireless Sub - Segment: Renewables

28 Financial Overview

29 $11 $24 $33 $61 $106 $120 $136 2019 2020 2021E 2022E 2023E 5% 9% 13% 12% 12% $84 $621 $675 $818 $975 $1,135 2019 2020 2021E 2022E 2023E Revenue % Margin (excluding potential future acquisitions): ($ in millions) EBITDA ($ in millions) Financial Profile | Revenue & EBITDA (1) Note: Consolidated EBITDA includes Corporate SG&A (1) Projected 2021E figures include $84M of Revenue and $24M of EBITDA related to the FNS acquisition in January 2021 (2) See slide 30 for EBITDA reconciliation 2020 EBITDA is Adjusted (2) (1) FNS Acquisition (Jan 2021) 2019 – 2021E CAGR 2021E – 2023E CAGR 15% 18% Total Organic (2)% Total Organic 17%

30 Commentary • Large Customer Program ▪ Unique fixed contract structure to build fiber rings in cities without existing customer franchise agreements ▪ Program negatively impacted both QualTek and peers ▪ Type of contract will not be used again by the industry • COVID - 19 ▪ Impact of crew - level COVID - 19 mitigation costs and project interruptions ▪ 53%+ of 2020 revenue was in the Northeast and California where pandemic restrictions on the industry were the most severe in the nation • Wireless Integration & Reorganization ▪ Primarily tied to headcount reductions related to the formation of national scoping, VQA and invoicing teams to support the Wireless group ▪ Includes acceleration of synergies for the two large Wireless acquisitions completed in 2019 • Operating Lease Adjustment ▪ Reflects the accounting impact if operating leases (primarily from acquisitions) were shifted to capitalized lease structures • Corporate HQ Move ▪ Costs tied to move from King of Prussia to Blue Bell, PA A B C D ($ in millions) CY2020 Reported EBITDA $11.5 Large Customer Program 25.4 COVID - 19 11.2 Wireless Integration & Reorganization 10.1 Operating Lease Adjustment 1.6 Corporate HQ Move 1.6 Adjusted EBITDA $61.3 A B C D 2020 EBITDA Reconciliation E E Note: Adjustments A, B, C & D relate to the Telecommunications segment; Adjustment E pertains to Corporate SG&A

31 Shares Outstanding 56.4 Price Per Share 10.00$ Market Capitalization 563.8$ Plus: Net Debt 264.9$ Enterprise Value 828.7$ Shares % SPAC Sponsor 3.3 5.8% Existing SPAC Investors 11.5 20.4% Target | Common Roll 29.4 52.2% Pre-PIPE Investors 5.6 9.8% PIPE Investors 6.6 11.7% Total 56.4 100.0% 2021E EBITDA $ 106 EV / 2021E EBITDA 7.8x Note: Pro forma ownership shown as of the close of the merger (1) Excludes 3M warrants at an $11.50 strike price (2) Assumes no redemptions from ROCR trust (3) Includes the conversion of $30.5M of preferred equity held by QualTek shareholders and $11.4M of taxes payable into 5.0M shar es Sources & Uses | Pro Forma Ownership (1)(2) ▪ QualTek is being acquired by Roth CH Acquisition III (“ROCR”), a publicly listed special purpose acquisition company with $115M cash in trust ▪ Consideration for QualTek includes 29.4M shares of ROCR common stock and the assumption of $472M of debt (3) (Total consideration of $766M) ▪ The 29.4M shares includes 24.5M shares plus 5.0M shares upon the conversion of $30.5M of BCP preferred equity and $11.4M of taxes payable ▪ The transaction assumes an approximate $66M common stock PIPE and $44M common stock Pre - PIPE Private Placement ▪ The Pre - PIPE, with proceeds to be used for near - term M&A as explained on the following slide, funds immediately at announcement of offering ▪ Approximate pro forma market cap of $564M and enterprise value of $829M ▪ Pro forma net debt of ~$265M after estimated fees and expenses ▪ Net leverage ratio of 2.5x on $106M of 2021E EBITDA ▪ A portion of the sponsor’s promote shares will be at risk based on the amount of redemptions from ROCR trust, if any Overview Post - Transaction Value Sources Uses Pro Forma Valuation Post - Transaction Ownership (in millions; except per share data) ▪ QualTek shareholders are eligible to receive additional common shares of the combined company equal to $100M of the combined company’s outstanding common stock ▪ ~3.3M ($50M) of the earn - out shares will vest if, after 180 days from close and before 5 years from close, the closing price exceeds $15.00 for any 20 out of 30 trading days ▪ ~2.8M ($50M) of the earn - out shares will vest if, after 180 days from close and before 5 years from close, the closing price exceeds $18.00 for any 20 out of 30 trading days Earn - Out Shares

32 Assumed Acquired EBITDA $0 $20 Implied PF 2021E EBITDA $106 $126 Implied PF Net Debt $265 $305 Implied PF Enterprise Value ($10.00 Cost Basis) $829 $929 Implied PF EV / 2021E EBITDA ($10.00 PIPE Investors) 7.8x 7.4x Implied PF Leverage Multiple 2.5x 2.4x ▪ Pre - PIPE capital to be used to execute on a robust & actionable M&A pipeline, with acquisitions expected to be completed prior t o the SPAC merger close ▪ Management expects to close on three complementary acquisitions in the wireless telecom infrastructure space by early July ▪ Total acquisition spend expected to total $100M ($40M cash | $60M equity) ▪ At a blended 5x purchase price multiple (in line with historical levels), the acquisitions are highly accretive ▪ The implied enterprise value to 2021E EBITDA multiple is reduced from 7.8x to 7.4x M&A Funded by Pre - PIPE Drives Additional Shareholder Value Pro Forma Acquisition Metrics ($ in millions) Before Acquisitions Pro Forma for Acquisitions Overview Note: Assumes no redemptions from ROCR trust decreases to

33 10.7x 9.9x 12.3x 7.8x 7.4x 13% 9% 11% 9% 13% 4% 12% 8% Note: QualTek metrics shown on an organic basis Sources: S&P Capital IQ as of 15 - Jun - 2021; Consensus estimates (Thomson Reuters); Wall Street Research; Management guidance (1) Pro Forma multiple of 7.4x assumes $20M of acquired EBITDA for CY2021E for a combined purchase price of $100M Operational & Valuation Benchmarking Revenue CAGR % EBITDA Margin EV / EBITDA Multiple CY2020 - CY2022E CY2021 E CY2021E Comparable Public Companies QualTek MEAN: 8% MEAN: 10% MEAN: 11.0x Before Acquisitions Pro Forma for Acquisitions (1)
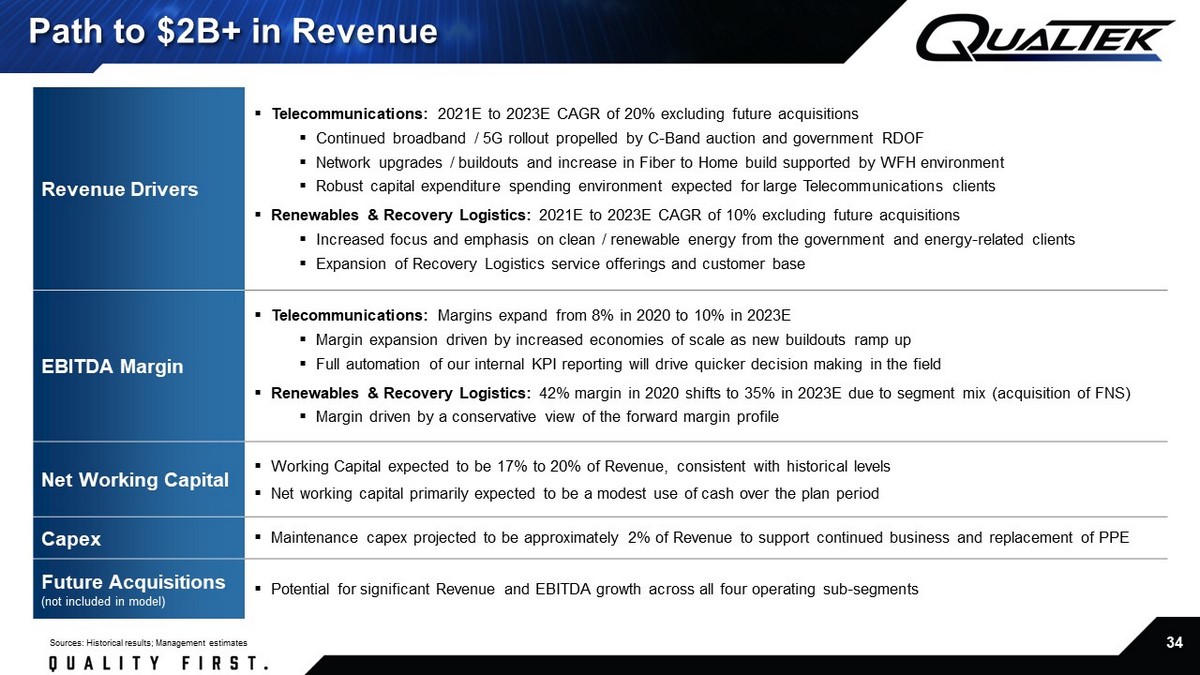
34 Revenue Drivers ▪ Telecommunications: 2021E to 2023E CAGR of 20% excluding future acquisitions ▪ Continued broadband / 5G rollout propelled by C - Band auction and government RDOF ▪ Network upgrades / buildouts and increase in Fiber to Home build supported by WFH environment ▪ Robust capital expenditure spending environment expected for large Telecommunications clients ▪ Renewables & Recovery Logistics: 2021E to 2023E CAGR of 10% excluding future acquisitions ▪ Increased focus and emphasis on clean / renewable energy from the government and energy - related clients ▪ Expansion of Recovery Logistics service offerings and customer base EBITDA Margin ▪ Telecommunications: Margins expand from 8% in 2020 to 10% in 2023E ▪ Margin expansion driven by increased economies of scale as new buildouts ramp up ▪ Full automation of our internal KPI reporting will drive quicker decision making in the field ▪ Renewables & Recovery Logistics: 42% margin in 2020 shifts to 35% in 2023E due to segment mix (acquisition of FNS) ▪ Margin driven by a conservative view of the forward margin profile Net Working Capital ▪ Working Capital expected to be 17% to 20% of Revenue, consistent with historical levels ▪ Net working capital primarily expected to be a modest use of cash over the plan period Capex ▪ Maintenance capex projected to be approximately 2% of Revenue to support continued business and replacement of PPE Future Acquisitions (not included in model) ▪ Potential for significant Revenue and EBITDA growth across all four operating sub - segments Path to $2B+ in Revenue Sources: Historical results; Management estimates

35 Appendix
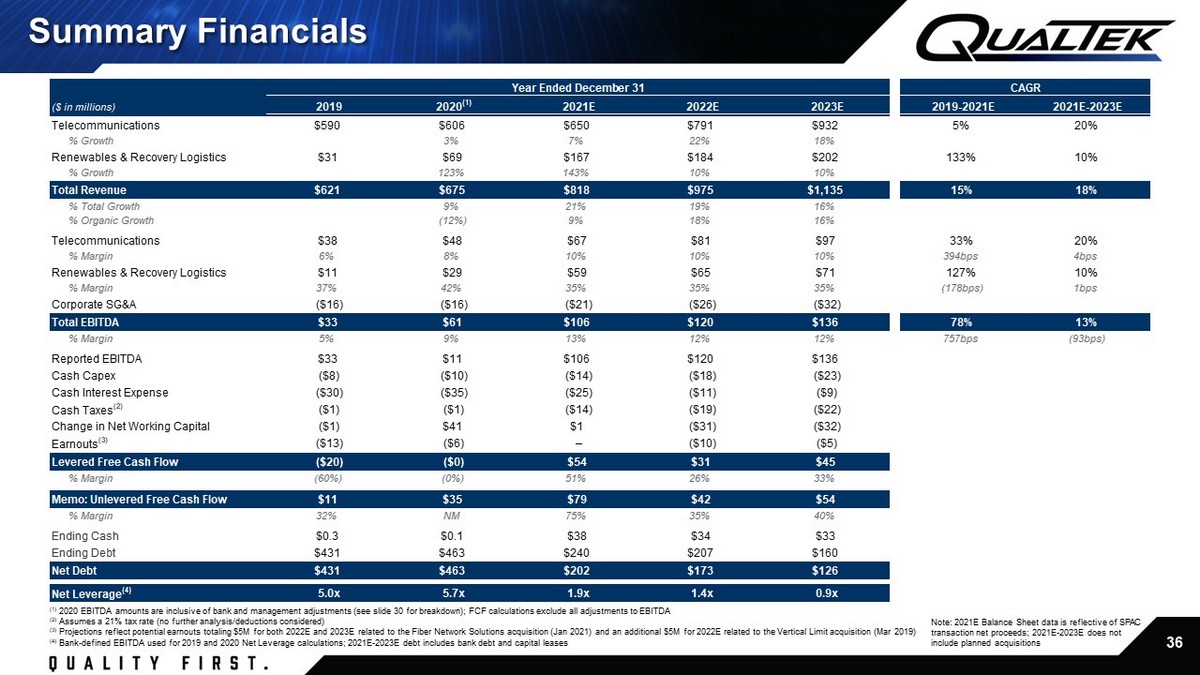
36 Year Ended December 31 CAGR ($ in millions) 2019 2020 (1) 2021E 2022E 2023E 2019-2021E 2021E-2023E Telecommunications $590 $606 $650 $791 $932 5% 20% % Growth 3% 7% 22% 18% Renewables & Recovery Logistics $31 $69 $167 $184 $202 133% 10% % Growth 123% 143% 10% 10% Total Revenue $621 $675 $818 $975 $1,135 15% 18% % Total Growth 9% 21% 19% 16% % Organic Growth (12%) 9% 18% 16% Telecommunications $38 $48 $67 $81 $97 33% 20% % Margin 6% 8% 10% 10% 10% 394bps 4bps Renewables & Recovery Logistics $11 $29 $59 $65 $71 127% 10% % Margin 37% 42% 35% 35% 35% (178bps) 1bps Corporate SG&A ($16) ($16) ($21) ($26) ($32) Total EBITDA $33 $61 $106 $120 $136 78% 13% % Margin 5% 9% 13% 12% 12% 757bps (93bps) Reported EBITDA $33 $11 $106 $120 $136 Cash Capex ($8) ($10) ($14) ($18) ($23) Cash Interest Expense ($30) ($35) ($25) ($11) ($9) Cash Taxes (2) ($1) ($1) ($14) ($19) ($22) Change in Net Working Capital ($1) $41 $1 ($31) ($32) Earnouts (3) ($13) ($6) – ($10) ($5) Levered Free Cash Flow ($20) ($0) $54 $31 $45 % Margin (60%) (0%) 51% 26% 33% Memo: Unlevered Free Cash Flow $11 $35 $79 $42 $54 % Margin 32% NM 75% 35% 40% Ending Cash $0.3 $0.1 $38 $34 $33 Ending Debt $431 $463 $240 $207 $160 Net Debt $431 $463 $202 $173 $126 Net Leverage (4) 5.0x 5.7x 1.9x 1.4x 0.9x Note: 2021E Balance Sheet data is reflective of SPAC transaction net proceeds; 2021E - 2023E does not include planned acquisitions (1) 2020 EBITDA amounts are inclusive of bank and management adjustments (see slide 30 for breakdown); FCF calculations exclude a ll adjustments to EBITDA (2) Assumes a 21% tax rate (no further analysis/deductions considered) (3) Projections reflect potential earnouts totaling $5M for both 2022E and 2023E related to the Fiber Network Solutions acquisiti on (Jan 2021) and an additional $5M for 2022E related to the Vertical Limit acquisition (Mar 2019) (4) Bank - defined EBITDA used for 2019 and 2020 Net Leverage calculations; 2021E - 2023E debt includes bank debt and capital leases Summary Financials
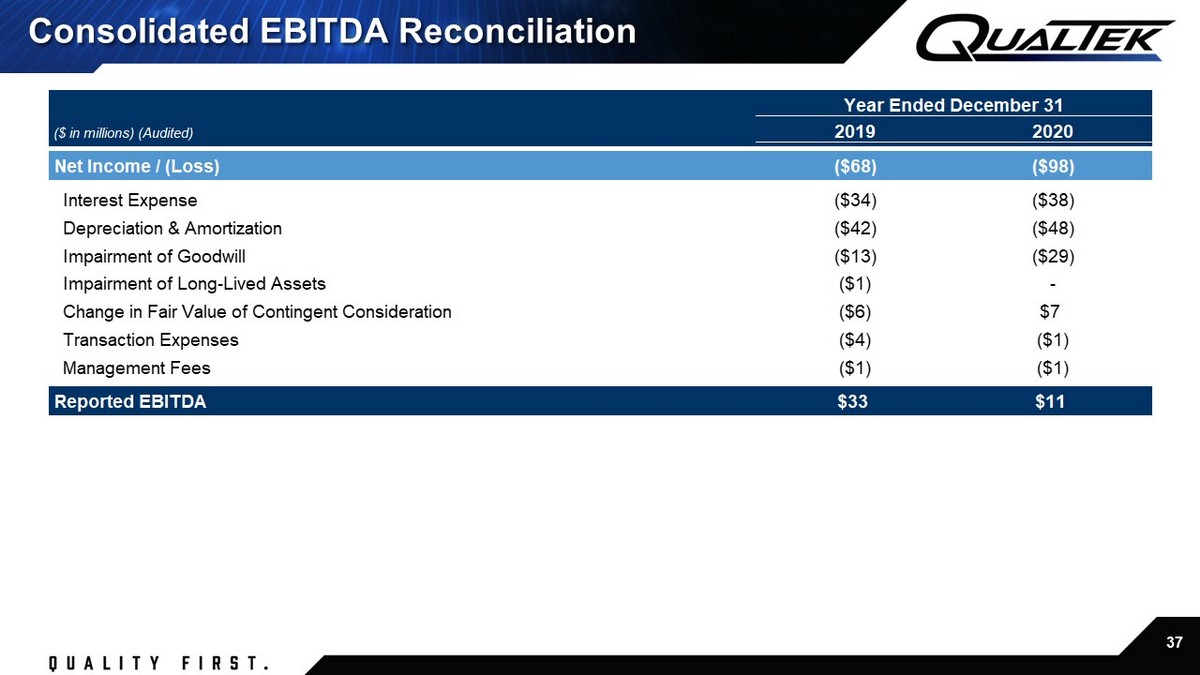
37 Consolidated EBITDA Reconciliation ($ in millions) (Audited) 2019 2020 Net Income / (Loss) ($68) ($98) Interest Expense ($34) ($38) Depreciation & Amortization ($42) ($48) Impairment of Goodwill ($13) ($29) Impairment of Long-Lived Assets ($1) - Change in Fair Value of Contingent Consideration ($6) $7 Transaction Expenses ($4) ($1) Management Fees ($1) ($1) Reported EBITDA $33 $11 Year Ended December 31

38 Risk Factors THE RISKS PRESENTED BELOW ARE CERTAIN OF THE GENERAL RISKS RELATED TO THE COMPANY’S INDUSTRY, BUSINESS AND OPERATIONS, REGULA TIO N AND COMPLIANCE, STRATEGIC TRANSACTIONS AND BUSINESS FINANCING AND ARE NOT EXHAUSTIVE. THE LIST BELOW IS QUALIFIED IN ITS ENTIRETY BY DISCLOSURES CONTAINED IN FUTURE FILINGS BY THE COMPANY, ITS AFFILIATES OR BY THIRD PARTIES WITH THE UNITED ST ATES SECURITIES AND EXCHANGE COMMISSION (“SEC”). THESE RISKS SPEAK ONLY AS OF THE DATE OF THE PRESENTATION, AND WE HAVE NO OBLIGATION TO UPDATE THE DISCLOSURES CONTAINED HEREIN. THE RISKS HIGHLIGHTED IN FUTURE FILINGS WITH THE SEC MAY DIFFER SIGNIF ICA NTLY FROM AND WILL BE MORE EXTENSIVE THAN THOSE PRESENTED BELOW. ADDITIONAL RISKS RELATED TO QUALTEK IN CONNECTION WITH AND FOLLOWING THE CONSUMMATION OF THE PROPOSED BUSINESS COMBINATION ARE DESCRIBED ABOVE UNDER “FORWARD LOOKING STATEMENT S”. RISKS RELATING TO OUR INDUSTRY ▪ CHANGES TO LAWS, GOVERNMENTAL REGULATIONS AND POLICIES, INCLUDING GOVERNMENTAL PERMITTING PROCESSES AND TAX INCENTIVES, COULD AF FECT DEMAND FOR OUR SERVICES. ADDITIONALLY, DEMAND FOR CONSTRUCTION SERVICES DEPENDS ON INDUSTRY ACTIVITY AND EXPENDITURE LEVELS, WHICH CAN BE AFFECTED BY A VARIETY OF FACTORS. OUR INABILITY OR FAILURE TO ADJUST TO SUCH CHANGES OR ACT IVITY COULD RESULT IN DECREASED DEMAND FOR OUR SERVICES AND ADVERSELY AFFECT OUR RESULTS OF OPERATIONS, CASH FLOWS AND LIQUIDITY. ▪ MANY OF THE INDUSTRIES WE SERVE ARE HIGHLY COMPETITIVE AND SUBJECT TO RAPID TECHNOLOGICAL AND REGULATORY CHANGES, AS WELL AS CUS TOMER CONSOLIDATION, ANY OF WHICH COULD RESULT IN DECREASED DEMAND FOR OUR SERVICES AND ADVERSELY AFFECT OUR RESULTS OF OPERATIONS, CASH FLOWS AND LIQUIDITY. ▪ UNFAVORABLE MARKET CONDITIONS, MARKET UNCERTAINTY, PUBLIC HEALTH OUTBREAKS SUCH AS THE COVID - 19 PANDEMIC AND/OR ECONOMIC DOWNTUR NS COULD REDUCE CAPITAL EXPENDITURES IN THE INDUSTRIES WE SERVE OR COULD ADVERSELY AFFECT OUR CUSTOMERS, WHICH COULD RESULT IN DECREASED DEMAND OR IMPAIR OUR CUSTOMERS’ ABILITY TO PAY FOR OUR SERVICES. RISKS RELATING TO OUR BUSINESS AND OPERATIONS ▪ OUR FAILURE TO PROPERLY MANAGE PROJECTS, OR PROJECT DELAYS, INCLUDING THOSE RESULTING FROM DIFFICULT WORK SITES AND ENVIRONME NTS , COULD RESULT IN ADDITIONAL COSTS OR CLAIMS, WHICH COULD HAVE A MATERIAL ADVERSE EFFECT ON OUR OPERATING RESULTS, CASH FLOWS AND LIQUIDITY. ▪ OUR FAILURE TO RECOVER ADEQUATELY ON CHARGES AGAINST PROJECT OWNERS, SUBCONTRACTORS OR SUPPLIERS FOR PAYMENT OR PERFORMANCE C OUL D HAVE A MATERIAL ADVERSE EFFECT ON OUR FINANCIAL RESULTS. ▪ WE MAY NOT ACCURATELY ESTIMATE THE COSTS ASSOCIATED WITH SERVICES PROVIDED UNDER FIXED PRICE CONTRACTS, WHICH COULD IMPAIR OU R F INANCIAL PERFORMANCE. ADDITIONALLY, WE RECOGNIZE REVENUE FOR CERTAIN PROJECTS USING THE COST - TO - COST METHOD OF ACCOUNTING; THEREFORE, VARIATIONS OF ACTUAL RESULTS FROM OUR ASSUMPTIONS COULD REDUCE OUR PROFITABILITY. ▪ WE DERIVE A SIGNIFICANT PORTION OF OUR REVENUE FROM A FEW CUSTOMERS, AND THE LOSS OF ONE OR MORE OF THESE CUSTOMERS, OR A RED UCT ION IN THEIR DEMAND FOR OUR SERVICES, COULD IMPAIR OUR FINANCIAL PERFORMANCE. IN ADDITION, MANY OF OUR CONTRACTS, INCLUDING OUR SERVICE AGREEMENTS, DO NOT OBLIGATE OUR CUSTOMERS TO UNDERTAKE ANY INFRASTRUCTURE PROJECTS OR OTHER WOR K WITH US, AND MOST OF OUR CONTRACTS MAY BE CANCELED ON SHORT OR NO ADVANCE NOTICE. ▪ AMOUNTS INCLUDED IN OUR BACKLOG MAY NOT RESULT IN ACTUAL REVENUE OR TRANSLATE INTO PROFITS. OUR BACKLOG IS SUBJECT TO CANCELL ATI ON AND UNEXPECTED ADJUSTMENTS AND IS, THEREFORE, AN UNCERTAIN INDICATOR OF FUTURE OPERATING RESULTS. ▪ OUR BUSINESS AND OPERATIONS, AND THE OPERATIONS OF OUR CUSTOMERS, MAY BE ADVERSELY AFFECTED BY EPIDEMICS OR PANDEMICS SUCH AS TH E COVID - 19 PANDEMIC. ▪ WE MAINTAIN A WORKFORCE BASED UPON CURRENT AND ANTICIPATED WORKLOADS. WE COULD INCUR SIGNIFICANT COSTS AND REDUCED PROFITABIL ITY FROM UNDERUTILIZATION OF OUR WORKFORCE IF THERE IS A SIGNIFICANT REDUCTION IN THE LEVEL OF SERVICES WE PROVIDE OR IF CONTRACT AWARDS ARE DELAYED OR NOT RECEIVED. ▪ OUR FINANCIAL RESULTS ARE BASED, IN PART, UPON ESTIMATES AND ASSUMPTIONS THAT MAY DIFFER FROM ACTUAL RESULTS. IN ADDITION, CH ANG ES IN ACCOUNTING PRINCIPLES MAY CAUSE UNEXPECTED FLUCTUATIONS IN OUR REPORTED FINANCIAL INFORMATION. ▪ OUR BUSINESS IS SUBJECT TO OPERATIONAL RISK, INCLUDING FROM OPERATIONAL AND PHYSICAL HAZARDS THAT COULD RESULT IN SUBSTANTIAL LI ABILITIES AND WEAKEN OUR FINANCIAL CONDITION. ▪ OUR BUSINESS IS SEASONAL AND AFFECTED BY THE SPENDING PATTERNS OF OUR CUSTOMERS AND TIMING OF GOVERNMENTAL PERMITTING, AS WEL L A S WEATHER CONDITIONS AND NATURAL CATASTROPHES, WHICH EXPOSES US TO VARIATIONS IN QUARTERLY RESULTS. ▪ IN THE ORDINARY COURSE OF OUR BUSINESS, WE MAY BECOME SUBJECT TO LAWSUITS, INDEMNITY OR OTHER CLAIMS, WHICH COULD MATERIALLY AND ADVERSELY AFFECT OUR BUSINESS, RESULTS OF OPERATIONS AND CASH FLOWS. ▪ WE RELY ON INFORMATION, COMMUNICATIONS AND DATA SYSTEMS IN OUR OPERATIONS. SYSTEM AND INFORMATION TECHNOLOGY INTERRUPTIONS AN D/O R DATA SECURITY BREACHES COULD ADVERSELY AFFECT OUR ABILITY TO OPERATE AND OUR OPERATING RESULTS OR COULD RESULT IN HARM TO OUR REPUTATION. ▪ OUR SUBCONTRACTORS AND SUPPLIERS MAY FAIL, OR BE UNABLE TO, SATISFY THEIR OBLIGATIONS TO US OR OTHER PARTIES, OR WE MAY BE UN ABL E TO MAINTAIN THESE RELATIONSHIPS, EITHER OF WHICH COULD HAVE A MATERIAL ADVERSE EFFECT ON OUR RESULTS OF OPERATIONS, CASH FLOWS AND LIQUIDITY. ▪ WE MAY HAVE ADDITIONAL TAX LIABILITIES ASSOCIATED WITH OUR DOMESTIC AND INTERNATIONAL OPERATIONS. ▪ WE COULD INCUR GOODWILL AND INTANGIBLE ASSET IMPAIRMENT CHARGES, WHICH COULD HARM OUR PROFITABILITY. ▪ WE ARE SELF - INSURED AGAINST MANY POTENTIAL LIABILITIES. ▪ IF WE ARE UNABLE TO ATTRACT AND RETAIN QUALIFIED MANAGERS AND SKILLED EMPLOYEES, WE WILL BE UNABLE TO OPERATE EFFICIENTLY, WH ICH COULD REDUCE OUR REVENUE, PROFITABILITY AND LIQUIDITY. ▪ THE USE OF UNIONIZED EMPLOYEES AND CONTRACTORS AND ANY RELATED OBLIGATIONS COULD SUBJECT US TO LIABILITIES THAT COULD ADVERSE LY AFFECT OUR LIQUIDITY, CASH FLOWS AND RESULTS OF OPERATIONS. ▪ OUR RECOVERY LOGISTICS BUSINESS IS SUBJECT TO A NUMBER OF RISKS THAT MAY IMPACT OUR BUSINESS, LIQUIDITY, CASH FLOWS AND RESUL TS OF OPERATIONS.

39 Risk Factors RISKS RELATING TO REGULATION AND COMPLIANCE ▪ OUR OPERATIONS COULD AFFECT THE ENVIRONMENT OR CAUSE EXPOSURE TO HAZARDOUS SUBSTANCES. IN ADDITION, OUR PROPERTIES COULD HAVE EN VIRONMENTAL CONTAMINATION, WHICH COULD RESULT IN MATERIAL LIABILITIES. ▪ WE PERFORM WORK IN UNDERGROUND ENVIRONMENTS, WHICH COULD AFFECT THE ENVIRONMENT. A FAILURE TO COMPLY WITH ENVIRONMENTAL LAWS COU LD RESULT IN SIGNIFICANT LIABILITIES OR HARM OUR REPUTATION, AND NEW ENVIRONMENTAL LAWS OR REGULATIONS COULD ADVERSELY AFFECT OUR BUSINESS. ▪ WE ARE SUBJECT TO RISKS ASSOCIATED WITH CLIMATE CHANGE. ▪ OUR FAILURE TO COMPLY WITH THE REGULATIONS OF FEDERAL, STATE AND LOCAL AGENCIES THAT OVERSEE TRANSPORTATION AND SAFETY COMPLI ANC E COULD REDUCE OUR REVENUE, PROFITABILITY AND LIQUIDITY. ▪ OUR FAILURE TO COMPLY WITH VARIOUS LAWS AND REGULATIONS RELATED TO CONTRACTOR LICENSING AND BUSINESS LICENSING COULD RESULT I N S IGNIFICANT LIABILITIES. ▪ IF WE ARE REQUIRED TO RECLASSIFY INDEPENDENT CONTRACTORS AS EMPLOYEES, WE MAY INCUR ADDITIONAL COSTS AND TAXES WHICH COULD AD VER SELY AFFECT OUR BUSINESS, FINANCIAL CONDITION, RESULTS OF OPERATIONS AND PROSPECTS. RISKS RELATED TO STRATEGIC TRANSACTIONS ▪ ACQUISITIONS, STRATEGIC INVESTMENTS AND DISPOSITIONS INVOLVE RISKS THAT COULD NEGATIVELY AFFECT OUR OPERATING RESULTS, CASH F LOW S AND LIQUIDITY AND MAY NOT ENHANCE SHAREHOLDER VALUE. RISKS RELATING TO FINANCING OUR BUSINESS ▪ WE HAVE A SIGNIFICANT AMOUNT OF DEBT, WHICH COULD ADVERSELY AFFECT OUR BUSINESS, FINANCIAL CONDITION AND RESULTS OF OPERATION S O R COULD AFFECT OUR ABILITY TO ACCESS CAPITAL MARKETS IN THE FUTURE. IN ADDITION, OUR DEBT CONTAINS RESTRICTIVE COVENANTS THAT MAY PREVENT US FROM ENGAGING IN TRANSACTIONS THAT MIGHT BENEFIT US. ▪ WE MAY BE UNABLE TO OBTAIN SUFFICIENT BONDING CAPACITY TO SUPPORT CERTAIN SERVICE OFFERINGS, AND THE NEED FOR PERFORMANCE AND SU RETY BONDS COULD REDUCE AVAILABILITY UNDER OUR CREDIT FACILITY.