Attached files
Exhibit 99.5
OWL ROCK’S MANAGEMENT’S DISCUSSION AND ANALYSIS OF
FINANCIAL CONDITION AND RESULTS OF OPERATIONS
In this section, unless the context otherwise requires, references to “Owl Rock,” “we,” “us,” “our,” and the “Company” are intended to mean the business and operations of Owl Rock and its consolidated subsidiaries. The following discussion analyzes the financial condition and results of operations of the Company. Additional terms used by the Company are defined in the Glossary and throughout the Management’s Discussion and Analysis in this Current Report on Form 8-K.
The following discussion and analysis should be read in conjunction with the consolidated and combined audited financial statements and the related notes included in this Current Report on Form 8-K.
Amounts and percentages presented throughout our discussion and analysis of financial condition and results of operations may reflect rounded results in thousands (unless otherwise indicated) and consequently, totals may not appear to sum. Certain prior period amounts have been reclassified to conform to the current year presentation.
Our Business
We are a leading alternative asset management firm focused on providing direct lending solutions to U.S. middle market companies. Our breadth of lending product offerings enables us to offer a holistic platform to the middle market, which establishes us as a partner of choice for private-equity sponsored companies as well as other businesses primarily in non-cyclical, recession-resistant businesses. We provide these loans predominantly by utilizing permanent capital vehicles funded by our high-quality, largely institutional investor base. By utilizing these permanent capital vehicles and long-dated private funds, we believe our business provides a high degree of earnings stability and predictability. Our investors include a diversified mix of institutional investors, including prominent domestic public and private pension funds, endowments, foundations, institutional-quality family offices, asset managers and insurance companies, as well as high net worth and retail clients, distributed through many well-known wealth management firms. We have continued to grow our dedicated investor base through emphasizing our disciplined investment approach, client service, best-in-class portfolio performance and industry leading margins. We operate across four different strategies, through which we currently manage five permanent capital vehicles, all of which are BDCs, as well as long-dated private funds and managed accounts. As of March 31, 2021, we managed $27.8 billion in AUM, 83% of which is considered permanent capital AUM. Our $27.8 billion in AUM reflects year-over-year growth of 42% since March 31, 2020 and a CAGR of 22% since December 31, 2019. Our executives and employees have invested over $515 million in our products.
Our business is focused on direct lending to middle market companies primarily in the United States under the following four investment strategies:
| • | Diversified Lending. We primarily originate and make loans to, and make debt and equity investments in, U.S. middle market companies. We invest in senior secured or unsecured loans, subordinated loans or mezzanine loans and, to a lesser extent, equity and equity-related securities including warrants, preferred stock and similar forms of senior equity, which may or may not be convertible into a portfolio company’s common equity. Our investment objective is to generate current income and, to a lesser extent, capital appreciation by targeting investment opportunities with favorable risk-adjusted returns. While we believe that current market conditions favor extending credit to middle market companies in the United States, our investment strategy is intended to generate favorable returns across credit cycles with an emphasis on preserving capital. |
We focus on providing debt capital to private-equity sponsored companies and other businesses primarily in non-cyclical, recession-resistant businesses. We provide a wide range of financing solutions with strong focus on the top of the capital structure and operate this strategy through significant diversification by borrower, sector, sponsor, and position size.
Our Diversified Lending strategy is intended to generate favorable returns across credit cycles with an emphasis on preserving capital and is managed through four BDCs, ORCC, ORCC II, ORCC III and ORCIC, private debt funds and managed accounts. As of March 31, 2021, we have $17.7 billion of assets under management across these products.
1
| • | Technology Lending. We are focused primarily on originating and making debt and equity investments in technology-related companies based primarily in the United States. We originate and invest in senior secured or unsecured loans, subordinated loans or mezzanine loans, and equity-related securities including common equity, warrants, preferred stock and similar forms of senior equity, which may or may not be convertible into a portfolio company’s common equity. Our investment objective is to maximize total return by generating current income from debt investments and other income producing securities, and capital appreciation from our equity and equity-linked investments. |
We invest in a broad range of established and high growth technology companies that are capitalizing on the large and growing demand for technology products and services. These companies use technology extensively to improve their business processes, applications and opportunities or seek to grow through technological developments and innovations. These companies operate in technology-related industries or sectors which include, but are not limited to, information technology, application or infrastructure software, financial services, data and analytics, security, cloud computing, communications, life sciences, healthcare, media, consumer electronics, semi-conductor, internet commerce and advertising, environmental, aerospace and defense industries and sectors.
Our Technology Lending strategy is managed through our technology-focused BDC, ORTF. As of March 31, 2021, we have $5.5 billion of assets under management in ORTF.
| • | First Lien Lending. We seek to realize significant current income with an emphasis on preservation of capital primarily through originating primary transactions in and, to a lesser extent, secondary transactions of first lien senior secured loans in or related to middle market businesses based primarily in the United States. We may also invest, on a limited basis, in other types of debt and debt-related securities in or related to middle market businesses based primarily in the United States. While we believe that current market conditions favor extending credit to middle market companies in the United States, our investment strategy is intended to generate favorable returns across credit cycles with an emphasis on preserving capital. We expect that capital will be used by portfolio companies to support growth, acquisitions, market or product expansion, refinancings and/or recapitalizations. |
Our First Lien Lending strategy is managed through our Private Debt fund, First Lien Fund, and through Managed Accounts. As of March 31, 2021, we have $3.1 billion of assets under management across these products.
| • | Opportunistic Lending. We seek to generate attractive risk-adjusted returns by taking advantage of credit opportunities in U.S. middle-market companies with liquidity needs and market leaders seeking to improve their balance sheets. We focus on high quality companies that could be experiencing disruption, dislocation, distress, or transformational change. We leverage the Owl Rock platform to source investment opportunities directly from potential portfolio companies and/or financial sponsors. |
We are a partner of choice for a number of privately held companies that are often controlled by private equity sponsors, and we are well positioned to provide such companies with a variety of financing solutions to meet a broad range of situations, including but not limited to the following: (i) rescue financing, (ii) new issuance and recapitalizations, (iii) wedge capital, (iv) debtor-in-possession loans, (v) financing for additional liquidity and covenant relief, and (vi) broken syndications. We may from time to time engage in secondary purchases as well.
We intend to make opportunistic investments in U.S. middle-market companies by providing a variety of approaches to financing, including but not limited to originating and/or investing in secured debt, unsecured debt, mezzanine debt, other subordinated debt, interests senior to common equity, as well as equity securities (or rights to acquire equity securities) which may or may not be acquired in connection with a debt financing transaction, and doing any and all things necessary, convenient or incidental thereto as necessary or desirable to promote and carry out such purpose.
Our Opportunistic Lending strategy is managed through our Private Debt fund, Owl Rock Opportunistic Fund, L.P., and through Managed Accounts. As of March 31, 2021, we have $1.4 billion of assets under management across these products.
2
Fee Structure
Management Fees
The investment adviser generally receives a quarterly management fee based upon a defined percentage of average fair value of gross assets (excluding cash) or average fair value of gross assets (excluding cash) plus undrawn commitments in the case of our BDCs, or fair value of gross assets (excluding cash), fair value of investments plus undrawn commitments, or invested capital in the case of our Private Debt funds and Managed Accounts, and also includes BDC Part I Fees. BDC Part I Fees refers to a quarterly performance income on the net investment income of ORCC, ORCC II, ORTF, ORCIC (and, should such BDC become publicly listed in the future, ORCC III), subject to a fixed hurdle rate. These fees are classified as management fees as they are predictable and recurring in nature, not subject to contingent repayment, and cash-settled each quarter.
Our investment advisory agreements of our BDCs typically must be reviewed or approved annually by their boards of directors (including a majority of its independent directors).
Incentive Fees
We are entitled to receive incentive fees in accordance with the investment advisory agreements we have with our BDCs. We may receive BDC Part II Fees, which are not paid unless a BDC achieves cumulative aggregate realized capital gains (net of cumulative aggregate realized capital losses and aggregate unrealized capital depreciation).
Capital Invested In and Through Our Funds
To further align our interests with those of investors in our products, our executives and employees have invested and committed over $515 million in Owl Rock products across our platform. We determine these capital commitments based on a variety of factors, including regulatory requirements, investor requirements, estimates regarding liquidity over the estimated time period during which commitments will be funded, estimates regarding the amounts of capital that may be appropriate for other opportunities or other products we may be in the process of raising or are considering raising, prevailing industry standards with respect to sponsor commitments and our general working capital requirements. Our capital commitments are typically funded with cash and not with carried interest or deferral of management fees.
COVID-19 and Our Response
The outbreak of a novel strain of coronavirus (“COVID-19”) continues to impact the United States and other countries throughout the world. In March 2020, the World Health Organization declared COVID-19 to be a pandemic and the United States declared a national emergency due to the outbreak. In connection with these declarations, various governments around the world have instituted measures to slow the transmissions of COVID-19, which substantially restrict individual and business activities. These measures have included, for example, closures of non-essential businesses, limitations of crowd size, stay-at-home orders, quarantines, heightened border controls and limitations on travel. Governments in the United States and around the world have responded with fiscal and monetary stimuli that aim to provide emergency assistance to individuals and businesses negatively impacted by COVID-19. The outbreak of COVID-19 and the actions taken in response have had far reaching impact on the U.S. and global economies, contributing to significant volatility in the financial markets, resulting in increased volatility in equity prices and lower interest rates, and causing furloughs and layoffs in the labor market. While COVID-19 cases have declined in some parts of the United States, many states are seeing increases in the infection rates as they began to allow businesses to reopen. COVID-19 cases have also continued to surge in certain countries outside the United States, and certain countries that were initially successful at containing the virus have experienced renewed outbreaks in recent months. The extent of the impact of the COVID-19 pandemic on us and our funds’ operational and financial performance will depend on many factors, including the duration and scope of the public health emergency, the actions taken by governmental authorities to contain its financial and economic impact, the continued or renewed implementation of travel restrictions and shelter in place orders, the widespread availability and deployment of a vaccine, and the extent of disruption to global, regional and local supply chains and economic markets.
3
The scale and scope of the COVID-19 pandemic may heighten the potential adverse effects on our business, financial performance and operating results for the quarterly periods and full fiscal year of 2020 and possibly beyond, and may be material and affect us in ways that we cannot foresee at this time. Many of the adverse ways in which COVID-19 may impact us have already materialized and adversely affected (or may in the future materialize and adversely affect) our funds’ portfolio valuations and the operations of our business and the businesses of our funds’ portfolio companies, as well as the businesses of entities of which we or our funds are creditors, and our and their other counterparties, including suppliers and customers. These risks may, in the future, become even more significant than is currently the case or than is currently anticipated. It is impossible to predict with certainty the potential full magnitude of the business and economic ramifications, COVID-19 has impacted, and may further impact, our business.
As the global response to COVID-19 continues to evolve, our primary focus has been the safety and wellbeing of our employees and their families, as well as the seamless functioning of the firm in serving our stakeholders and fund investors who have entrusted us with their capital. In accordance with local government guidance and social distancing recommendations, the vast majority of our employees have been working remotely since mid-March 2020. Our technology infrastructure has proven to be robust and capable of supporting this model. We have implemented rigorous protocols for remote work across the firm, including increased cadence of group calls and updates, and frequent communication across leadership and working levels. We are leveraging technology to ensure our teams stay connected and productive, and that our culture remains strong even in these unusual circumstances. While we are generally not meeting with our clients in person, we continue to actively communicate with our clients and all of our stakeholders through videoconference, teleconference and email. Investment committees continue to convene as needed, and the firm continues to operate across investment, asset management and corporate support functions.
The combination of the pandemic and responses to it, together with the drop in LIBOR, slowed our capital deployment in 2020. However, in this challenging environment, we have continued to grow our fundraising and business. During the twelve months ended March 31, 2021, we have raised approximately $3.8 billion in commitments to our products, which represents an increase in equity commitments of over 25% since March 31, 2020.
Market Trends and Business Environment
We believe the sustained low interest rate environment following the most recent global financial crisis has resulted in increasing demand for yield, and significant tailwinds for direct lending. The search for yield has resulted in growing allocations to alternative assets, as investors seek to meet their return objectives. This rotation into alternatives, coupled with the void left by banks as they pulled back from the middle market following the global financial crisis, has helped give rise to and sustain continued growth of the direct lending market. Direct lending continues to attract investor capital given its position as a higher-yielding product with defensive characteristics that provides an attractive income alternative to traditional liquid fixed income and a lower-risk alternative to private equity.
We believe that our disciplined investment philosophy across our distinct but complementary investment strategies contributes to the stability of our performance throughout market cycles. As of March 31, 2021, approximately 83% of our AUM were in permanent capital vehicles, and for the three months ended March 31, 2021, 95% of our management fees (including BDC Part I Fees) were derived from permanent capital vehicles. Our products have a stable base of permanent or long-term capital enabling us to invest in assets with a long- term focus over different points in a market cycle and to take advantage of market volatility. However, our results of operations, including the fair value of our AUM, are affected by a variety of factors, particularly in the United States, including conditions in the global financial markets and the economic and political environments.
2020 was a challenging year for markets around the world due to the ongoing impact of the COVID-19 pandemic. Following a historic decline due to the effects of the COVID-19 pandemic, global capital markets continued to rally in the first quarter of 2021 as investor sentiment was encouraged by global central bank support, improving economic data and optimism surrounding vaccine development to combat COVID-19. In the U.S., corporate credit spreads continued to tighten amidst larger gains in the equity markets, economic data showing signs of stabilization, progress on development of COVID-19 vaccines, and investors’ continued search for yield. Specifically, the Credit Suisse Leveraged Loan Index (“CSLLI”), a leveraged loan index, returned 2.0% in the first quarter of 2021 and 4.8% since year-ended 2019, while the ICE BAML High Yield Master II Index, a high yield bond index, returned 0.9% in the first quarter of 2021 and 7.1% since year-ended 2019.
Equity markets continued to recover during the quarter. In the U.S., the S&P 500 returned 6.2% in the first quarter of 2021 and 25.7% since year-ended 2019. Outside the U.S., the MSCI All Country World ex USA Index returned 3.5% in the first quarter 2021 and 14.5% since full-year 2019.
4
Corporate performance and earnings across many industries continue to be impacted by COVID-19. While certain industries and companies have demonstrated resilience in the current environment, and in some cases, are experiencing positive trends, others have been negatively affected. We believe the market continues to experience a bifurcation between companies that can access the public markets versus those who cannot, creating an opportunity for our funds to provide flexible solutions.
We believe the middle-market lending environment provides opportunities for us to meet our goal of making investments that generate attractive risk-adjusted returns based on a combination of the following factors, which continue to remain true in the current environment, with the economic shutdown resulting from the COVID-19 national health emergency.
Limited Availability of Capital for Middle-Market Companies. We believe that regulatory and structural changes in the market have reduced the amount of capital available to U.S. middle-market companies. In particular, we believe there are currently fewer providers of capital to middle market companies. We believe that many commercial and investment banks have, in recent years, de-emphasized their service and product offerings to middle-market businesses in favor of lending to large corporate clients and managing capital markets transactions. In addition, these lenders may be constrained in their ability to underwrite and hold bank loans and high yield securities for middle-market issuers as they seek to meet existing and future regulatory capital requirements. We also believe that there is a lack of market participants that are willing to hold meaningful amounts of certain middle-market loans. As a result, we believe our products’ ability to minimize syndication risk for a company seeking financing by being able to hold its loans without having to syndicate them, coupled with reduced capacity of traditional lenders to serve the middle-market, present an attractive opportunity to invest in middle-market companies.
Capital Markets Have Been Unable to Fill the Void in U.S. Middle Market Finance Left by Banks. While underwritten bond and syndicated loan markets have been robust in recent years, middle market companies are less able to access these markets for reasons including the following:
High Yield Market – Middle market companies generally are not issuing debt in an amount large enough to be an attractively sized bond. High yield bonds are generally purchased by institutional investors who, among other things, are focused on the liquidity characteristics of the bond being issued. For example, mutual funds and exchange traded funds (“ETFs”) are significant buyers of underwritten bonds. However, mutual funds and ETFs generally require the ability to liquidate their investments quickly in order to fund investor redemptions and/or comply with regulatory requirements. Accordingly, the existence of an active secondary market for bonds is an important consideration in these entities’ initial investment decision. Because there is typically little or no active secondary market for the debt of U.S. middle market companies, mutual funds and ETFs generally do not provide debt capital to U.S. middle market companies. We believe this is likely to be a persistent problem and creates an advantage for those like us who have a more stable capital base and have the ability to invest in illiquid assets.
Syndicated Loan Market – While the syndicated loan market is modestly more accommodating to middle market issuers, as with bonds, loan issue size and liquidity are key drivers of institutional appetite and, correspondingly, underwriters’ willingness to underwrite the loans. Loans arranged through a bank are done either on a “best efforts” basis or are underwritten with terms plus provisions that permit the underwriters to change certain terms, including pricing, structure, yield and tenor, otherwise known as “flex”, to successfully syndicate the loan, in the event the terms initially marketed are insufficiently attractive to investors. Loans provided by companies such as ours provide certainty to issuers in that we can commit to a given amount of debt on specific terms, at stated coupons and with agreed upon fees. As our products are the ultimate holder of the loans, we do not require market “flex” or other arrangements that banks may require when acting on an agency basis.
Robust Demand for Debt Capital. We believe U.S. middle market companies will continue to require access to debt capital to refinance existing debt, support growth and finance acquisitions. In addition, we believe the large amount of uninvested capital held by funds of private equity firms, estimated by Preqin Ltd., an alternative assets industry data and research company, to be $1.5 trillion as of March 2020, will continue to drive deal activity. We expect that private equity sponsors will continue to pursue acquisitions and leverage their equity investments with secured loans provided by funds or products such as the ones we manage.
The Middle Market is a Large Addressable Market. According to the National Center for the Middle Market 4th quarter 2020 Middle Market Indicator, there are approximately 200 thousand U.S. middle market companies, which have approximately 48 million aggregate employees. Moreover, the U.S. middle market accounts for one-third of private sector gross domestic product (“GDP”). GE defines U.S. middle market companies as those between $10 million and $1 billion in annual revenue, which we believe has significant overlap with our definition of U.S. middle market companies.
5
Attractive Investment Dynamics. An imbalance between the supply of, and demand for, middle market debt capital creates attractive pricing dynamics. We believe the directly negotiated nature of middle market financings also generally provides more favorable terms to the lender, including stronger covenant and reporting packages, better call protection, and lender-protective change of control provisions. Additionally, we believe alternative credit managers’ expertise in credit selection and ability to manage through credit cycles has generally resulted in alternative credit managers experiencing lower loss rates than U.S. commercial banks through credit cycles. Further, we believe that historical middle market default rates have been lower, and recovery rates have been higher, as compared to the larger market capitalization, broadly distributed market, leading to lower cumulative losses. Lastly, we believe that in the current environment, with the economic shutdown resulting from the COVID-19 national health emergency, lenders with available capital may be able to take advantage of attractive investment opportunities as the economy re-opens and may be able to achieve improved economic spreads and documentation terms.
Conservative Capital Structures. Following the credit crisis, which we define broadly as occurring between mid-2007 and mid-2009, lenders have generally required borrowers to maintain more equity as a percentage of their total capitalization, specifically to protect lenders during economic downturns. With more conservative capital structures, U.S. middle market companies have exhibited higher levels of cash flows available to service their debt. In addition, U.S. middle market companies often are characterized by simpler capital structures than larger borrowers, which facilitates a streamlined underwriting process and, when necessary, restructuring process.
Attractive Opportunities in Investments in Loans. Our products invest in senior secured or unsecured loans, subordinated loans or mezzanine loans and, to a lesser extent, equity and equity-related securities. We believe that opportunities in senior secured loans are significant because of the floating rate structure of most senior secured debt issuances and because of the strong defensive characteristics of these types of investments. Given the current low interest rate environment, we believe that debt issues with floating interest rates offer a superior return profile as compared with fixed-rate investments, since floating rate structures are generally less susceptible to declines in value experienced by fixed-rate securities in a rising interest rate environment. Senior secured debt also provides strong defensive characteristics. Senior secured debt has priority in payment among an issuer’s security holders whereby holders are due to receive payment before junior creditors and equity holders. Further, these investments are secured by the issuer’s assets, which may provide protection in the event of a default.
Managing Business Performance and Key Financial Measures
Non-GAAP Financial Measures
Fee related earnings, or “FRE”, is used to assess our operating performance by determining whether recurring revenue, primarily consisting of management fees, is sufficient to cover operating expenses and to generate profits. FRE is derived from and reconciled to, but not equivalent to, its most directly comparable GAAP measure of net income (loss) before income taxes. FRE differs from income before taxes computed in accordance with GAAP as it adjusts for transaction-related charges, equity-based compensation, non-controlling interests in subsidiaries of the Company and certain other items that we believe reflects our operating performance. Other than for Owl Rock, the calculation of FRE also adjusts for performance income, performance related compensation and investment net gains (losses). Management believes that adding these adjustments assist in clarifying stable and predictable cash flows that cover operating expenses and lead to the generation of profits.
Distributable earnings, or “DE”, is used to assess performance and amounts available for dividends to members. DE is derived from and reconciled to, but not equivalent to, its most directly comparable GAAP measure of net income (loss) before income taxes. Distributable earnings is FRE less current income taxes and (other than with respect to Owl Rock), includes net realized gains, realized performance income and performance related compensation, if applicable. DE differs from income before taxes computed in accordance with GAAP as it adjusts for certain items that we believe are indicative of our ability to make our dividend payments. Our presentation of DE represents our operating performance, as further adjusted for performance income and performance related compensation, as applicable. Management believes that these adjustments enable investors to better understand the Company’s earnings that are available for distribution.
Adjusted EBITDA is used to assess the Company’s ability to service its borrowings. Adjusted EBITDA is derived from and reconciled to, but not equivalent to, its most directly comparable GAAP measure of net income (loss) before income taxes. Adjusted EBITDA represents Distributable Earnings plus (a) interest expense, (b) income tax expense (benefits), and (c) depreciation and amortization.
6
Adjusted Revenues are used to assess the net revenue expected to be received by the Company. Adjusted Revenues are derived from and reconciled to, but not equivalent to, its most directly comparable GAAP measure of total revenues. Adjusted Revenues differ from total revenues computed in accordance with GAAP as it excludes reimbursed expenses and dealer manager revenues, if applicable, that have an offsetting amount included within expenses on the consolidated and combined statement of operations.
Adjusted Compensation is used to assess the net cash settled compensation to be paid by the Company. Adjusted Compensation is derived from and reconciled to, but not equivalent to its most directly comparable GAAP measure of compensation and benefits. Adjusted Compensation differs from compensation and benefits computed in accordance with GAAP as it excludes equity compensation expense and compensation and benefits reimbursed through the receipt of administrative revenues. The administrative revenues reflect allocable compensation and expenses incurred by certain professionals of the Company and reimbursed by products managed by the Company.
We use FRE, DE, Adjusted EBITDA, Adjusted Revenues and Adjusted Compensation as non-GAAP measures to assess and track our performance. These are non-GAAP financial measure supplements and should be considered in addition to and not in lieu of, the results of operations, which are discussed further under “—Components of Consolidated Results of Operations” and are prepared in accordance with GAAP. For the specific components and calculations of these non-GAAP measures, as well as a reconciliation of these measures to the most comparable measure in accordance with GAAP, see “—Reconciliation of Consolidated GAAP Financial Measures to Certain Non-GAAP Measures.”
Operating Metrics
We monitor certain operating metrics that are common to the alternative asset management industry, which are discussed below.
Assets Under Management
Assets under management (“AUM”) refers to the assets we manage. We view AUM as a metric to measure our investment and fundraising performance as it reflects assets generally at fair value plus undrawn debt and available uncalled capital. Our AUM equals the sum of the following:
| • | total assets (including assets acquired with leverage) of our products; |
| • | undrawn debt (at the product-level including certain amounts subject to restrictions); and |
| • | uncalled committed capital (including commitments to products that have yet to commence their investment periods). |
Our calculations of assets under management and fee-earning assets under management may differ from the calculation methodologies of other asset managers, and as a result this measure may not be comparable to similar measures presented by other asset managers. In addition, our calculation of assets under management includes commitments to, and the fair value of invested capital in our products from executives and employees, regardless of whether such commitments or invested capital are subject to fees. Our definitions of assets under management and fee-earning assets under management are not based on any definition of assets under management and fee-earning assets under management that is set forth in the agreements governing the investment funds and products that we manage.
7
The tables below present roll forwards of our total AUM by investment strategy:
| ($ amounts in millions) | Diversified Lending |
Technology Lending |
First Lien Lending |
Opportunistic Lending |
Total AUM | |||||||||||||||
| AUM at December 31, 2020 |
$ | 17,234 | $ | 5,387 | $ | 3,014 | $ | 1,466 | $ | 27,101 | ||||||||||
| Net change to total assets |
548 | 366 | 45 | 96 | 1,055 | |||||||||||||||
| Net change to uncalled committed capital |
63 | (243 | ) | — | (182 | ) | (362 | ) | ||||||||||||
| Net change to undrawn debt |
(130 | ) | 27 | 88 | — | (15 | ) | |||||||||||||
|
|
|
|
|
|
|
|
|
|
|
|||||||||||
| AUM at March 31, 2021 |
$ | 17,715 | $ | 5,537 | $ | 3,147 | $ | 1,380 | $ | 27,779 | ||||||||||
|
|
|
|
|
|
|
|
|
|
|
|||||||||||
| Average AUM |
$ | 17,474 | $ | 5,462 | $ | 3,081 | $ | 1,423 | $ | 27,440 | ||||||||||
|
|
|
|
|
|
|
|
|
|
|
|||||||||||
| ($ amounts in millions) | Diversified Lending |
Technology Lending |
First Lien Lending |
Opportunistic Lending |
Total AUM | |||||||||||||||
| AUM at December 31, 2019 |
$ | 12,490 | $ | 3,491 | $ | 2,655 | $ | — | $ | 18,636 | ||||||||||
| Net change to total assets |
383 | 350 | 272 | — | 1,005 | |||||||||||||||
| Net change to uncalled committed capital |
— | 5 | (113 | ) | — | (108 | ) | |||||||||||||
| Net change to undrawn debt |
281 | (92 | ) | (160 | ) | — | 29 | |||||||||||||
|
|
|
|
|
|
|
|
|
|
|
|||||||||||
| AUM at March 31, 2020 |
$ | 13,154 | $ | 3,754 | $ | 2,654 | $ | — | $ | 19,562 | ||||||||||
|
|
|
|
|
|
|
|
|
|
|
|||||||||||
| Average AUM |
$ | 12,822 | $ | 3,623 | $ | 2,655 | $ | — | $ | 19,100 | ||||||||||
|
|
|
|
|
|
|
|
|
|
|
|||||||||||
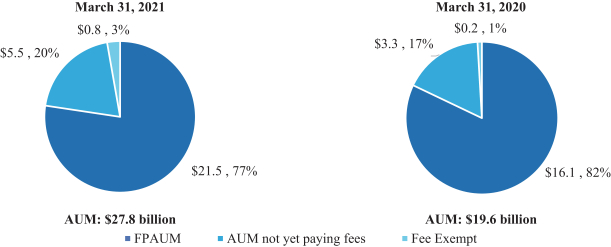
The components of our AUM are presented below ($ in billions):
Fee Paying Assets Under Management
Our FPAUM is generally comprised of the following components:
| • | the portfolio value, invested capital, net asset value (“NAV”), or total assets (including assets acquired with leverage, but excluding cash) of our products, as applicable; and |
| • | the uncalled committed capital (including commitments to products that have yet to commence their investment periods) for products where we earn management fees on uncalled committed capital. |
8
The tables below present rollforwards of our total FPAUM by investment strategy:
| ($ amounts in millions) | Diversified Lending |
Technology Lending |
First Lien Lending |
Opportunistic Lending |
Total FPAUM | |||||||||||||||
| FPAUM at December 31, 2020 |
$ | 13,536 | $ | 4,772 | $ | 2,392 | $ | 162 | $ | 20,862 | ||||||||||
| Net change to fee paying assets |
609 | 166 | (6 | ) | 81 | 850 | ||||||||||||||
| Net change to uncalled capital earning fees |
— | (243 | ) | — | — | (243 | ) | |||||||||||||
|
|
|
|
|
|
|
|
|
|
|
|||||||||||
| FPAUM at March 31, 2021 |
$ | 14,145 | $ | 4,695 | $ | 2,386 | $ | 243 | $ | 21,469 | ||||||||||
|
|
|
|
|
|
|
|
|
|
|
|||||||||||
| Average FPAUM |
$ | 13,841 | $ | 4,734 | $ | 2,389 | $ | 202 | $ | 21,166 | ||||||||||
|
|
|
|
|
|
|
|
|
|
|
|||||||||||
| ($ amounts in millions) | Diversified Lending |
Technology Lending |
First Lien Lending |
Opportunistic Lending |
Total FPAUM | |||||||||||||||
| FPAUM at December 31, 2019 |
$ | 10,337 | $ | 3,228 | $ | 1,713 | $ | — | $ | 15,278 | ||||||||||
| Net change to fee paying assets |
331 | 358 | 276 | — | 965 | |||||||||||||||
| Net change to uncalled capital earning fees |
— | 5 | (109 | ) | — | (104 | ) | |||||||||||||
|
|
|
|
|
|
|
|
|
|
|
|||||||||||
| FPAUM at March 31, 2020 |
$ | 10,668 | $ | 3,591 | $ | 1,880 | $ | — | $ | 16,139 | ||||||||||
|
|
|
|
|
|
|
|
|
|
|
|||||||||||
| Average FPAUM |
$ | 10,503 | $ | 3,410 | $ | 1,797 | $ | — | $ | 15,710 | ||||||||||
|
|
|
|
|
|
|
|
|
|
|
|||||||||||
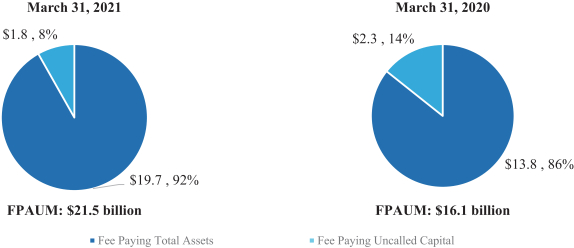
The components of our FPAUM are presented below ($ in billions):
Available Capital and AUM Not Yet Paying Fees
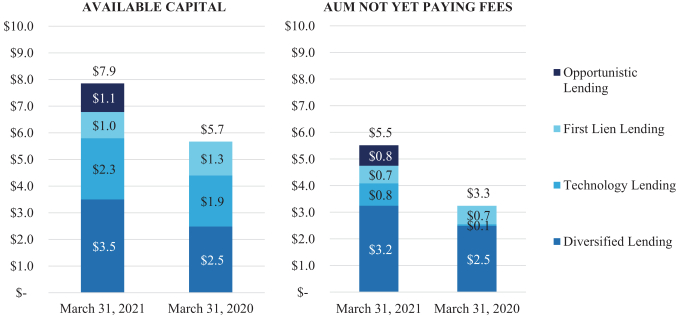
Our Available Capital is generally comprised of the following components:
| • | uncalled committed capital (including commitments to products that have yet to commence their investment periods) |
| • | cash and cash equivalents |
| • | undrawn debt (at the product-level including certain amounts subject to restrictions); and |
Our AUM not yet paying fees refers to AUM that is not currently paying fees and is eligible to earn management fees and/or performance income upon deployment.
9
For the three months ended March 31, 2021, we experienced AUM and FPAUM growth of $0.7 billion and $0.6 billion, or 2.5% and 2.9%, respectively. These increases were primarily driven by fundraising and increased borrowings in our Diversified Lending and Technology Lending strategies.
The charts below present our available capital, which we may also refer to as dry powder, and AUM not yet paying fees, by investment strategy ($ in billions):
Management Fees Product Duration
We view the duration of products we manage as a metric to measure the stability of our future management fees. For the three months ended March 31, 2021 and 2020, 100% of our management fees were attributable to products with five or more years in duration. The charts below present the composition of our management fees by remaining product duration:
10
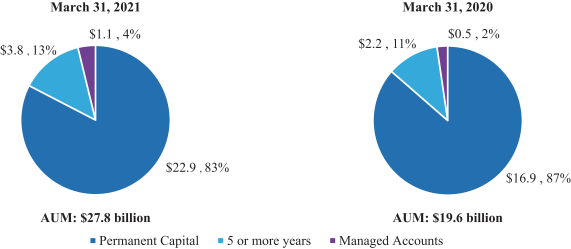
Our management fees, as well as our incentive fees, are typically earned over the life of the product. The duration of our products as well as the available capital should be contemplated in concert when evaluating our future earnings potential. We typically expect to deploy available capital within three to four years of launching a product. Our AUM is comprised of 83% permanent capital vehicles, and 100% of AUM is concentrated in the products with a remaining life in excess of five years. Therefore, given our fee structure, our typical expectation of capital deployment of three to four years from product launch, and the long dated remaining life of our funds, we expect that we will experience stable management fee growth, driven by capital deployment, in subsequent periods.
Product Performance Metrics
Product performance information is included throughout this discussion with analysis to facilitate an understanding of our results of operations for the periods presented. We do not present product performance metrics for products with less than two years of investment performance from the date of the product’s first investment. The performance information reflected in this discussion and analysis is not indicative of our overall performance. An investment in Owl Rock is not an investment in any of our products. Past performance is not indicative of future results. As with any investment there is always the potential for gains as well as the possibility of losses. There can be no assurance that any of these products or our other existing and future funds will achieve similar returns.
11
| MOIC | IRR (%) | |||||||||||||||||||||||||||||||||||||||||||
| ($ amounts in millions) | Year of Inception |
AUM | Capital Commitments / Equity Raise(2) |
Invested Capital |
Realized Proceeds(3) |
Unrealized Value (4) |
Total Value |
Gross (5) |
Net (6) | Gross (7) |
Net (8) | |||||||||||||||||||||||||||||||||
| Diversified Lending(1) |
||||||||||||||||||||||||||||||||||||||||||||
| Owl Rock Capital Corp. (ORCC) |
2016 | $ | 13,065 | $ | 5,972 | $ | 5,984 | $ | 1,536 | $ | 5,802 | $ | 7,338 | 1.28 | x | 1.23 | x | 11.1 | % | 8.9 | % | |||||||||||||||||||||||
| Owl Rock Capital Corp. II (ORCC II)(10) |
2017 | 2,453 | 1,399 | 1,373 | 177 | 1,361 | 1,538 | N/A | 1.12 | x | N/A | 7.0 | % | |||||||||||||||||||||||||||||||
| Technology Lending(1) |
||||||||||||||||||||||||||||||||||||||||||||
| Owl Rock Technology Finance Corp. (ORTF) |
2018 | $ | 5,537 | $ | 3,164 | $ | 1,710 | $ | 135 | $ | 1,793 | $ | 1,928 | 1.18 | x | 1.13 | x | 14.2 | % | 9.9 | % | |||||||||||||||||||||||
| First Lien Lending(9) |
||||||||||||||||||||||||||||||||||||||||||||
| Owl Rock First Lien Fund Levered |
2018 | $ | 2,696 | $ | 986 | $ | 715 | $ | 50 | $ | 741 | $ | 791 | 1.14 | x | 1.11 | x | 10.8 | % | 8.0 | % | |||||||||||||||||||||||
| Owl Rock First Lien Fund Unlevered |
2019 | 175 | 129 | 3 | 131 | 134 | 1.07 | x | 1.04 | x | 5.6 | % | 3.3 | % | ||||||||||||||||||||||||||||||
| (1) | Invested Capital includes capital calls, dividends reinvested and periodic investors closes, as applicable. |
| (2) | Includes dividend reinvest, if applicable. |
| (3) | Realized proceeds represent the sum of all cash distributions to all partners or shareholders. |
| (4) | Unrealized value represents the fund’s NAV. There can be no assurance that unrealized values will be realized at the valuations indicated. |
| (5) | The gross multiple of invested capital (“MoIC”) is calculated at the fund-level and is based on the interests of the fee-paying limited partners or shareholders and if applicable, excludes interests attributable to the non-fee paying limited partners and/or the general partner which does not pay management fees. The gross MoIC is before giving effect to management fees and Part I/Part II BDC fees. |
| (6) | The net MoIC is calculated at the fund-level and is based on the interests of the fee-paying limited partners or shareholders and if applicable, excludes interests attributable to the non-fee paying limited partners, and/or the general partner which does not pay management fees. The net MoIC is after giving effect to management fees, and Part I/Part II BDC fees, as applicable and all other expenses. |
| (7) | The gross IRR is an annualized since inception gross internal rate of return of cash flows to and from the fund and the fund’s residual value at the end of the measurement period. Gross IRR reflects returns to the fee-paying limited partners or shareholders and if applicable, excludes interests attributable to the non-fee paying limited partners or shareholders and/or the general partner which does not pay management fees. The cash flow dates used in the gross IRR calculation are based on the actual dates of the cash flows or in case of BDCs, the ex-dividend dates of distributions. Gross IRRs are calculated before giving effect to management fees and Part I/Part II BDC fees, as applicable. |
| (8) | The net IRR is an annualized since inception net internal rate of return of cash flows to and from the fund and the fund’s residual value at the end of the measurement period. Net IRRs reflect returns to the fee-paying limited partners or shareholders and if applicable, exclude interests attributable to the non-fee paying limited partners or shareholders and/or the general partner which does not pay management fees. The cash flow dates used in the net IRR calculations are based on the actual dates of the cash flows or in case of BDCs, the ex-dividend dates of distributions. The net IRRs are calculated after giving effect to management fees or Part I/Part II BDC fees as applicable, and all other expenses. The funds may utilize a credit facility during the investment period and for general cash management purposes. Net fund-level IRRs would likely have been lower had such fund called capital from its limited partners instead of utilizing the credit facility. |
| (9) | Owl Rock First Lien Fund is made up of three feeder funds: Onshore Levered, Offshore Levered and Insurance Unlevered. The gross and net MoIC and IRR presented in the chart are for Onshore Levered and Insurance Unlevered as those are the largest of the levered and unlevered feeder funds. The gross and net MoIC for the Offshore Levered feeder fund are 1.14x and 1.09x, respectively. The gross and net IRR for the Offshore Levered feeder are 10.3% and 6.2%, respectively. All other values for Owl Rock First Lien Fund Levered are for Onshore Levered and Offshore Levered combined. AUM is presented as the aggregate of the three Owl Rock First Lien Fund feeders. Owl Rock First Lien Fund Unlevered Investor equity and note commitments are both treated as capital for all values. |
| (10) | For the purposes of calculating Gross IRR, the expense support provided to the fund would be impacted when assuming a performance excluding management or Part I/Part II BDC fees, and therefore is not applicable to ORCC II. |
12
Components of Consolidated Results of Operations
Revenues
Management Fees, Net. The investment adviser of each of our products receives a quarterly management fee generally based upon a defined percentage of average fair value of gross assets (excluding cash) or average fair value of gross assets (excluding cash) plus undrawn commitments in the case of our BDCs, or fair value of gross assets (excluding cash), fair value of investments plus undrawn commitments, or invested capital in the case of our Private Debt funds and Managed Accounts, and also include BDC Part I Fees. BDC Part I Fees refers to a quarterly performance income on the net investment income of ORCC, ORCC II, ORTF and ORCIC (and, should such BDC be listed in the future, ORCC III), subject to a fixed hurdle rate. These fees are classified as management fees as they are predictable and recurring in nature, not subject to contingent repayment, and cash-settled each quarter.
The fees are generally based on a quarterly measurement period and amounts can be paid in advance or in arrears depending on the terms set forth in each product’s investment advisory agreement. Management fees are recognized as revenue in the period advisory services are rendered, subject to our assessment of collectability.
Some of our BDC fee structures begin with a discounted management and/or BDC Part I/II Fees (in some cases, no BDC Part I/II Fees) and upon a listing event, as defined in their respective organization documents, revert to a market fee structure, typically 1.50% management fee for average gross assets (excluding cash) above an asset coverage ratio of 200%, and a 1.00% management fee for average gross assets (excluding cash) below an asset coverage ratio of 200% and 17.5% BDC Part I/II Fees, (which are independent of each other). As of March 31, 2021, our BDCs that have a discounted fee structure include ORCC III and ORTF.
We may also, from time to time, waive, rebate, or voluntarily defer any fees payable by our funds. In connection with the initial public offering of ORCC, we agreed to waive management fees, inclusive of BDC Part I Fees, and BDC Part II Fees for fifteen months following ORCC’s exchange listing which expired in October 2020. We did not extend the waiver.
Incentive Fees. Incentive fees earned on the performance of certain product structures are recognized based on the product’s performance during the period, subject to the achievement of minimum return levels in accordance with the respective terms set out in each product’s investment advisory agreement. Incentive fees are realized at the end of a measurement period, typically annually. Once realized, such fees are no longer subject to reversal. Incentive fees include BDC Part II Fees. In addition, because BDC Part II Fees are not paid unless our BDCs achieve cumulative aggregate realized capital gains (net of cumulative aggregate realized capital losses and aggregate unrealized capital depreciation), BDC Part II Fees payable to us are variable and not predictable.
Administrative, Transaction and Other Fees. Administrative, transaction and other fees primarily include fee income, administrative fees and dealer manager revenue. Fee income represents income earned for providing services to certain portfolio companies of Owl Rock products. Such services include arrangement, syndication, origination, structuring analysis, capital structure and business plan advice and other services. Administrative fees represent revenue from administrative services provided to certain of our funds that are paid to us. Dealer manager revenue consists of commissions earned for providing distribution services to certain of Owl Rock products.
Expenses
Compensation and Benefits. Compensation generally includes salaries, bonuses, commissions, long-term deferral programs, benefits and payroll taxes. Compensation is accrued over the related service period and long-term deferral program awards are paid out based on the various vesting dates.
General, Administrative and Other Expenses. General and administrative expenses include costs primarily related to professional services, occupancy, travel, communication and information services, depreciation and amortization, distribution costs, and other general operating items.
Interest Expense. Interest expense consists of the interest expense on our outstanding debt, amortization of deferred financing costs and amortization of original issue discount.
13
Income Tax Expense. Income tax expense (benefit) consists of taxes paid or payable by our consolidated operating subsidiaries. Certain of our subsidiaries (the “Taxable Partnerships”) are treated as partnerships for federal income tax purposes and, accordingly, are not subject to federal and state income taxes, as such taxes are the responsibility of certain direct and indirect owners of the Taxable Partnerships; however, the taxable partnerships are subjected to unincorporated business tax (“UBT”) and other state taxes. A portion of our operations is conducted through domestic and foreign corporations that are subject to corporate level taxes and for which we record current and deferred income taxes at the prevailing rates in the various jurisdictions in which these entities operate.
Non-Controlling Interests. Net (income) loss attributable to non-controlling interests represents the ownership interests that third parties hold in Owl Rock entities that are consolidated into our consolidated and combined financial statements based on their ownership interests in such Owl Rock entities.
Results of Operations
Consolidated and Combined Results of Operations –the Three Months Ended March 31, 2021 Compared to the Three Months Ended March 31, 2020
| For the Three Months Ended March 31, |
Favorable (Unfavorable) | |||||||||||||||
| ($ amounts in thousands) | 2021 | 2020 | $ Change | % Change | ||||||||||||
| Revenues |
||||||||||||||||
| Management fees, net (includes BDC Part I fees of $28,914 and $3,927 for the three months ended March 31, 2021 and 2020, respectively |
$ | 94,713 | $ | 36,847 | 57,866 | 157 | % | |||||||||
| Administrative, transaction and other fees |
13,511 | 12,421 | 1,090 | 9 | % | |||||||||||
|
|
|
|
|
|||||||||||||
| Total revenues, net |
108,224 | 49,268 | 58,956 | 120 | % | |||||||||||
| Expenses |
||||||||||||||||
| Compensation and benefits |
47,984 | 32,175 | (15,809 | ) | -49 | % | ||||||||||
| General, administrative and other expenses |
14,860 | 19,220 | 4,360 | 23 | % | |||||||||||
|
|
|
|
|
|||||||||||||
| Total expenses |
62,844 | 51,395 | (11,449 | ) | -22 | % | ||||||||||
| Interest expense |
5,858 | 5,894 | 36 | 1 | % | |||||||||||
|
|
|
|
|
|||||||||||||
| Net income (loss) before income taxes |
39,522 | (8,021 | ) | 47,543 | NM | |||||||||||
| Income tax expense (benefit) |
188 | (46 | ) | (234 | ) | NM | ||||||||||
|
|
|
|
|
|||||||||||||
| Net income (loss) including non-controlling interests |
39,334 | (7,975 | ) | 47,309 | NM | |||||||||||
| Net (income) loss attributed to non-controlling interests |
80 | 915 | (835 | ) | -91 | % | ||||||||||
|
|
|
|
|
|||||||||||||
| Net income (loss) attributable to members of Owl Rock Capital and sole member of Owl Rock Capital Securities LLC |
$ | 39,414 | $ | (7,060 | ) | 46,474 | NM | |||||||||
|
|
|
|
|
|||||||||||||
NM - Not Meaningful
Revenues
The Three Months Ended March 31, 2021 Compared to the Three Months Ended March 31, 2020
| For the Three Months Ended March 31, |
Favorable (Unfavorable) | |||||||||||||||
| ($ amounts in thousands) | 2021 | 2020 | $ Change | % Change | ||||||||||||
| Management Fees (including BDC Part I Fees) |
||||||||||||||||
| Diversified Lending |
$ | 76,478 | $ | 24,899 | 51,579 | NM | ||||||||||
| Technology Lending |
13,857 | 9,167 | 4,690 | 51 | % | |||||||||||
| First Lien Lending |
3,815 | 2,781 | 1,034 | 37 | % | |||||||||||
| Opportunistic Lending |
563 | — | 563 | NM | ||||||||||||
|
|
|
|
|
|||||||||||||
| Total |
$ | 94,713 | $ | 36,847 | 57,866 | 157 | % | |||||||||
|
|
|
|
|
|||||||||||||
14
Management Fees. Management fees increased by $57.9 million, or 157%, for the three months ended March 31, 2021 compared to the three months ended March 31, 2020. The increase was primarily due to the expiration of the ORCC fee waiver, which expired on October 18, 2020. Fee waivers were $43.0 million for the three months ended March 31, 2020. The remaining increase is due to the 35% increase in average FPAUM as of March 31, 2021 compared to March 31, 2020.
Administrative, Transaction and Other Fees. Administrative, transaction and other fees increased by $1.1 million, or 9%, for the three months ended March 31, 2021 compared to the three months ended March 31, 2020. Administrative, transaction and other fees primarily include fee income, administrative fees and dealer manager revenue. The increase was driven by an increase in administrative fees and fee income, partially offset by a decrease in dealer manager revenue. Fee income, which is income earned from portfolio companies for providing arrangement, syndication, origination, structuring analysis, capital structure and business plan advice and other services, increased from $7.6 million to $9.0 million for the three months ended March 31, 2021 as compared to the three months ended March 31, 2020. The increase was primarily due to higher fee income from portfolio companies for the three months ended March 31, 2021, a result of higher demand for such services as well as an increase in origination activity. Administrative fees increased from $2.8 million to $3.5 million for the three months ended March 31, 2021 as compared to the three months ended March 31, 2020. Administrative fees were higher for the three months ended March 31, 2021 due to the overall growth of the business and staff required to support the business. Dealer manager revenue was lower for the three months ended March 31, 2021 due to slower broker dealer fundraising.
Expenses
The Three Months Ended March 31, 2021 Compared to the Three Months Ended March 31, 2020
Compensation and Benefits. Compensation and benefits increased by $15.8 million, or 49%, for the three months ended March 31, 2021 compared to the three months ended March 31, 2020. The increases were primarily driven by headcount growth of 30% from March 31, 2020 to March 31, 2021, merit increases and long-term compensation award increases for the comparative periods.
General, Administrative and Other Expenses. General, administrative and other expenses decreased by $4.4 million, or 23%, for the three months ended March 31, 2021 compared to the three months ended March 31, 2020. The decrease was primarily driven by a $4.3 million decrease in expense support related to ORCC II. Additionally, certain expenses have increased during this period, including occupancy costs, and technology to support our growing headcount and expansion of our business. The three months ended March 31, 2021 was also impacted by the COVID-19 pandemic and resulted in a decrease in certain operating expenses.
Interest Expense. Interest expense remains relatively consistent for the three months ended March 31, 2021 and 2020.
Income Tax Expense (Benefit). Income tax expense increased by $0.2 million for the three months ended March 31, 2021 compared to the three months ended March 31, 2020. Income taxes are a result of Owl Rock’s taxable income (loss), which for the three months ended March 31, 2021 was positive as compared to a net loss for the three months ended March 31, 2020.
Non-Controlling Interests. Net income (loss) attributable to non-controlling interests in Owl Rock entities represents results attributable to third parties in our operating subsidiaries. Net income (loss) is generally allocated based on such ownership interests held by third parties with respect to each of these entities.
Net income (loss) attributable to non-controlling interests in Owl Rock entities decreased by $0.8 million for the three months ended March 31, 2021 compared to the three months ended March 31, 2020. The changes in the comparative periods are a result of the respective changes in income (loss) before taxes and changes in third party ownership interests in such Owl Rock entities.
15
Reconciliation of Consolidated GAAP Financial Measures to Certain Non-GAAP Measures
We use FRE, DE, Adjusted EBITDA, Adjusted Revenues and Adjusted Compensation as non-GAAP measures to assess and track our performance. The following table presents the reconciliation of net income (loss) before taxes as reported in the consolidated and combined statements of operations to FRE, DE, Adjusted EBITDA, Adjusted Revenue and Adjusted Compensation:
| For the Three Months Ended March 31, | ||||||||
| ($ amounts in thousands) | 2021 | 2020 | ||||||
| Net income (loss) before taxes |
$ | 39,522 | $ | (8,021 | ) | |||
| Adjustments: |
||||||||
| Equity compensation expense |
— | — | ||||||
| Net (gain) loss attributable to non-controlling interests |
80 | 915 | ||||||
| Transaction-related charges |
890 | — | ||||||
|
|
|
|
|
|||||
| Fee Related Earnings |
$ | 40,492 | $ | (7,106 | ) | |||
|
|
|
|
|
|||||
| Fee Related Earnings |
$ | 40,492 | $ | (7,106 | ) | |||
| Adjustments: |
||||||||
| Current income tax (expense) benefit |
(238 | ) | (5 | ) | ||||
|
|
|
|
|
|||||
| Distributable Earnings |
$ | 40,254 | $ | (7,111 | ) | |||
|
|
|
|
|
|||||
| Distributable Earnings |
$ | 40,254 | $ | (7,111 | ) | |||
| Adjustments: |
||||||||
| Interest expense |
5,858 | 5,894 | ||||||
| Current income tax expense (benefit) |
238 | 5 | ||||||
| Depreciation and amortization expense |
131 | 230 | ||||||
|
|
|
|
|
|||||
| Adjusted EBITDA |
$ | 46,481 | $ | (982 | ) | |||
|
|
|
|
|
|||||
| Total revenues, net |
$ | 108,224 | $ | 49,268 | ||||
| Adjustments: |
||||||||
| Administrative fees |
(3,454 | ) | (2,841 | ) | ||||
| Dealer manager fees |
(999 | ) | (1,765 | ) | ||||
|
|
|
|
|
|||||
| Adjusted Revenues |
$ | 103,771 | $ | 44,662 | ||||
|
|
|
|
|
|||||
| Compensation and benefits |
$ | 47,984 | $ | 32,175 | ||||
| Adjustments: |
||||||||
| Equity compensation expense |
— | — | ||||||
| Administrative fees |
(3,454 | ) | (2,841 | ) | ||||
|
|
|
|
|
|||||
| Adjusted Compensation |
$ | 44,530 | $ | 29,334 | ||||
|
|
|
|
|
|||||
Management is pleased with its non-GAAP results for the first quarter, as they are in line with its expectations for full year 2021 results.
Liquidity and Capital Resources
Management assesses liquidity in terms of our ability to generate cash to fund operating, investing and financing activities. In the wake of the COVID-19 pandemic, management believes that we are well-positioned and our liquidity will continue to be sufficient for its foreseeable working capital needs, contractual obligations, distribution payments and strategic initiatives. For further discussion regarding the potential risks and impact of the COVID-19 pandemic on the Company, see “Risk Factors” in this Current Report on Form 8-K.
Sources and Uses of Liquidity
Our primary sources of liquidity are (1) cash on hand, (2) cash from operations, including management fees, which are generally collected quarterly (including our BDC Part I Fees), and (3) net borrowing from our credit facilities. As of March 31, 2021, our cash and cash equivalents were $8.6 million, we had $363.4 million outstanding, and availability under our credit facilities of $11.9 million. Our ability to draw from the credit facilities is subject to minimum management fee and other covenants. We believe that these sources of liquidity will be sufficient to fund our working capital requirements and to meet our commitments in the ordinary course of business and under the current market conditions for the foreseeable future. Market conditions resulting from the COVID-19 pandemic may impact our liquidity. Cash flows from management fees may be impacted by a slowdown or declines in deployment, declines, or write downs in valuations, or a slowdown or negatively impacted fundraising. Declines or delays and transaction activity may impact our product distributions and net realized performance income which could adversely impact our cash flows and liquidity. Market conditions may make it difficult to extend the maturity of or refinance our existing indebtedness or obtain new indebtedness with similar terms.
16
One of our sources of cash flows from operations is BDC Part I Fees. BDC Part I Fees are earned based on our BDCs’ net investment income, which does not include any realized gains or losses or any unrealized gains or losses resulting from changes in fair value. These calculations will be adjusted for any share issuances or repurchases. Once earned, BDC Part I Fees are not reversible.
We expect that our primary liquidity needs will continue to be to (1) provide capital to facilitate the growth of our existing investment management businesses, (2) provide capital to facilitate our expansion into businesses that are complementary to our existing investment management businesses as well as other strategic growth initiatives, (3) pay operating expenses, including cash compensation to our employees, (4) fund capital expenditures, (5) service our debt, (6) pay income taxes and (7) make distribution payments to our unit holders in accordance with our distribution policy.
In the normal course of business, we expect to pay distributions that are aligned with the expected changes in our fee related earnings. If cash flow from operations were insufficient to fund distributions over a sustained period of time, we expect that we would suspend or reduce paying such distributions. In addition, there is no assurance that distributions would continue at the current levels or at all.
Our ability to obtain debt financing provides us with additional sources of liquidity. For further discussion of financing transactions occurring in the current period and our debt obligations, see “Cash Flows” within this section and “Note 4. Debt Obligations, Net” to our unaudited consolidated and combined financial statements included in this Current Report on Form 8-K.
Cash Flows
The Three Months Ended March 31, 2021 Compared to the Three Months Ended March 31, 2020
The following tables and discussion summarize our consolidated and combined statements of cash flows by activity attributable to the Company. Negative amounts represent a net outflow or use of cash.
| For the Three Months Ended March 31, |
Favorable (Unfavorable) | |||||||||||||||
| ($ amounts in thousands) | 2021 | 2020 | $ Change | % Change | ||||||||||||
| Net cash provided by (used in) operating activities |
$ | 587 | $ | (20,107 | ) | 20,694 | 103 | % | ||||||||
| Net cash provided by (used in) investing activities |
(295 | ) | (15 | ) | (280 | ) | NM | |||||||||
| Net cash provided by (used in) financing activities |
(3,358 | ) | 21,878 | (25,236 | ) | -115 | % | |||||||||
|
|
|
|
|
|||||||||||||
| Net change in cash and cash equivalents |
$ | (3,066 | ) | $ | 1,756 | (4,822 | ) | NM | ||||||||
|
|
|
|
|
|||||||||||||
NM - Not Meaningful
Operating Activities
| For the Three Months Ended March 31, |
Favorable (Unfavorable) | |||||||||||||||
| ($ amounts in thousands) | 2021 | 2020 | $ Change | % Change | ||||||||||||
| Cash flows from operating activities |
||||||||||||||||
| Net income (loss) including non-controlling interests |
$ | 39,334 | $ | (7,975 | ) | 47,309 | NM | |||||||||
| Adjustments to reconcile net income (loss) to net cash from operating activities: |
||||||||||||||||
| Depreciation and amortization |
131 | 230 | (99 | ) | -43 | % | ||||||||||
| Amortization of deferred financing costs |
218 | 168 | 50 | 30 | % | |||||||||||
| Non-cash lease expense |
1,148 | — | 1,148 | NM | ||||||||||||
| Changes in operating assets and liabilities: |
||||||||||||||||
| Due from affiliates, net |
(7,555 | ) | 7,635 | (15,190 | ) | -199 | % | |||||||||
| Other assets |
(10,047 | ) | 1,724 | (11,771 | ) | NM | ||||||||||
| Accrued compensation |
(26,045 | ) | (17,962 | ) | (8,083 | ) | 45 | % | ||||||||
| Accounts payable, accrued expenses and other liabilities |
4,608 | (3,927 | ) | 8,535 | NM | |||||||||||
| Operating lease liabilities |
(1,205 | ) | — | |||||||||||||
|
|
|
|
|
|||||||||||||
| Net cash provided by (used in) operating activities |
$ | 587 | $ | (20,107 | ) | 20,694 | 103 | % | ||||||||
|
|
|
|
|
|||||||||||||
17
Cash provided by (used in) the Company’s operating activities increased from $(20.1) million for the three months ended March 31, 2020 to $0.6 million for the three months ended March 31, 2021. Net income (loss) including non-controlling interests of the Company and its subsidiaries increased by $47.3 million for the three months ended March 31, 2021. The increase was primarily driven by the net income the business experienced in the three months ended March 31, 2021.
Our increasing working capital needs reflect the growth of our business. We believe that our ability to generate cash from operations, as well as the capacity under our credit facilities, provides us with the necessary liquidity to manage short-term fluctuations in working capital and to meet our short-term commitments.
Investing Activities
| For the Three Months Ended March 31, |
Favorable (Unfavorable) | |||||||||||||||
| ($ amounts in thousands) | 2021 | 2020 | $ Change | % Change | ||||||||||||
| Cash flows from investing activities |
||||||||||||||||
| Purchase of fixed assets |
$ | (295 | ) | $ | (15 | ) | (280 | ) | NM | |||||||
|
|
|
|
|
|||||||||||||
| Net cash provided by (used in) investing activities |
$ | (295 | ) | $ | (15 | ) | (280 | ) | NM | |||||||
|
|
|
|
|
|||||||||||||
Net cash provided by (used in) in the Company’s investing activities for the three months ended March 31, 2021 was principally composed of cash used for furniture, fixtures, equipment and leasehold improvements purchased during both periods to support the growth in our staffing levels.
Financing Activities
| For the Three Months Ended March 31, |
Favorable (Unfavorable) | |||||||||||||||
| ($ amounts in thousands) | 2021 | 2020 | $ Change | % Change | ||||||||||||
| Cash flows from financing activities |
||||||||||||||||
| Proceeds from debt obligations |
$ | 97,898 | $ | 71,570 | 26,328 | 37 | % | |||||||||
| Repayments of debt obligations |
(94,745 | ) | (31,095 | ) | (63,650 | ) | NM | |||||||||
| Deferred financing costs |
— | (300 | ) | 300 | 100 | % | ||||||||||
| Contributions |
2,614 | 1,804 | 810 | 45 | % | |||||||||||
| Distributions |
(9,125 | ) | (20,101 | ) | 10,976 | 55 | % | |||||||||
|
|
|
|
|
|||||||||||||
| Net cash provided by (used in) financing activities |
$ | (3,358 | ) | $ | 21,878 | (25,236 | ) | -115 | % | |||||||
|
|
|
|
|
|||||||||||||
Net cash provided by (used in) the Company’s financing activities for the three months ended March 31, 2021 was principally composed of net proceeds from the use of our credit facilities. A portion of these proceeds were used to repay borrowings under our credit facilities. Distributions to third parties that own interests in Owl Rock entities were lower during the period.
Capital Resources
We intend to use a portion of our available liquidity to pay cash distributions on a quarterly basis in accordance with our distribution policies. Our ability to make cash dividends to our members is dependent on a large number of factors, including among others: general economic and business conditions; our strategic plans and prospects; our business and investment opportunities; our financial condition and operating results; working capital requirements and other anticipated cash needs; contractual restrictions and obligations; legal, tax and regulatory restrictions; restrictions on the payment of distributions by our subsidiaries and other relevant factors.
18
Financial Condition and Liquidity of Blue Owl Following the Business Combination
Our primary sources of liquidity are (1) cash on hand, (2) cash from operations, including management fees, which are generally collected quarterly (including our BDC Part I Fees), and (3) net borrowing from our credit facilities. We believe that following the Closing of the Business Combination, the sources of liquidity discussed above will continue to be sufficient to fund our working capital requirements and to meet our commitments in the ordinary course of business, under current market conditions, for the foreseeable future. We intend to use a portion of our available liquidity to pay cash distributions on a quarterly basis in accordance with our distribution policies. We will continue to explore strategic financing and share buyback opportunities in the ordinary course of business. We expect this to include potential financings and refinancings of indebtedness, through the issuance of debt securities or otherwise, to maximize our liquidity and capital structure. As of the date of this filing, there were no borrowings outstanding under any revolving credit facility.
Contractual Obligations, Commitments and Contingencies
The following table sets forth information relating to our contractual obligations as of March 31, 2021:
| ($ amounts in thousands) | Less than 1 year | 1 - 3 years | 4 - 5 years | Thereafter | Total | |||||||||||||||
| Operating lease obligations (1)(2) |
$ | 4,106 | $ | 9,830 | $ | 77 | $ | — | $ | 14,013 | ||||||||||
| Term loan payable |
— | — | — | 250,000 | 250,000 | |||||||||||||||
| Interest obligations on debt (3) |
23,007 | 38,021 | 38,073 | 71,302 | 170,403 | |||||||||||||||
| Revolving credit facilities (4) |
113,413 | — | — | — | 113,413 | |||||||||||||||
|
|
|
|
|
|
|
|
|
|
|
|||||||||||
| $ | 140,526 | $ | 47,851 | $ | 38,150 | $ | 321,302 | $ | 547,829 | |||||||||||
|
|
|
|
|
|
|
|
|
|
|
|||||||||||
| (1) | Office space and equipment are leased under agreements with lease commitments through 2024. Lease obligations include only base contractual rent. |
| (2) | The Company has future operating lease payments of $55.1 million related to leases that have not commenced that were entered into as of March 31, 2021. Such lease payments are not yet accounted for in the table above or the Company’s consolidated statements of financial condition as operating lease assets and operating lease liabilities. These operating lease payments are anticipated to commence in the fourth quarter of 2022 and continue for 10 years. |
| (3) | Interest obligations reflect future interest payments on outstanding debt obligations with interest rates in effect as of March 31, 2021. |
| (4) | Represents outstanding balance under the revolving credit facilities as of March 31, 2021 and maturing on August 20, 2021 and February 28, 2022. In April 2021, the Company repaid its borrowings and terminated these revolving credit facilities. In April 2021, the Company also entered into a $150 million Corporate Revolving Credit Facility. For further discussion, see “Note 4. Debt Obligations, Net” to our unaudited consolidated and combined financial statements included in this Current Report on Form 8-K. |
Guarantees
As of March 31, 2021, we had assumed a guarantee of revolving credit facility #2 and a term loan for affiliated entities. This revolving credit facility matures in August 2021 and the term loan matures in October 2029. As of March 31, 2021, the total aggregate outstanding loan balance of this credit facility and term loan was $271.0 million. In April 2021, the Company terminated revolving credit facility #2. There has been no history of default and we have determined that the likelihood of default is remote.
Commitments and Contingencies
In the normal course of business, we may engage in off-balance sheet arrangements, including transactions in derivatives, guarantees, commitments, indemnifications and potential contingent repayment obligations. We do not have any off-balance sheet arrangements that would require us to fund losses or guarantee target returns to investors in our products.
Indemnification Arrangements
In many of its service contracts, Owl Rock agrees to indemnify the third party service provider under certain circumstances. The terms of the indemnities vary from contract to contract and the amount of indemnification liability, if any, cannot be determined and has not been included in the table above or recorded in our Consolidated and Combined Financial Statements as of March 31, 2021.
19
Consistent with standard business practices in the normal course of business, we enter into contracts that contain indemnities for our affiliates and our employees, officers and directors, persons acting on our behalf or such affiliates and third parties. The terms of the indemnities vary from contract to contract and the maximum exposure under these arrangements, if any, cannot be determined and has neither been recorded in the above table nor in our consolidated and combined financial statements. As of March 31, 2021, we have not had prior claims or losses pursuant to these contracts and expect the risk of loss to be remote.
Litigation
From time to time, the Company may be named as a defendant in legal actions in the ordinary course of business. Although there can be no assurance of the outcome of such legal actions, in the opinion of management, the Company does not have a potential liability related to any current legal proceeding or claim that would individually or in the aggregate materially affect its results of operations, financial condition or cash flows.
Impact of Changes in Accounting on Recent and Future Trends
None of the changes to GAAP that went into effect during the three months ended March 31, 2021, or that have been issued but that we have not yet adopted are expected to substantively impact our future trends.
Critical Accounting Estimates
We prepare our consolidated and combined financial statements in accordance with U.S. GAAP. In applying many of these accounting principles, we need to make assumptions, estimates and/or judgments that affect the reported amounts of assets, liabilities, revenues and expenses in our consolidated and combined financial statements. We base our estimates and judgments on historical experience and other assumptions that we believe are reasonable under the circumstances. These assumptions, estimates and/or judgments, however, are both subjective and subject to change, and actual results may differ from our assumptions and estimates. Actual results may also differ from our estimates and judgments due to risks and uncertainties and changing circumstances, including uncertainty in the current economic environment due to the COVID-19 pandemic. If actual amounts are ultimately different from our estimates, the revisions are included in our results of operations for the period in which the actual amounts become known. For a summary of our significant accounting policies, see “Note 2. Summary of Significant Accounting Policies,” to our consolidated and combined financial statements included in this Current Report on Form 8-K.
Principles of Consolidation
We consolidate entities based on either a variable interest model or voting interest model. As such, for entities that are determined to be variable interest entities (“VIEs”), we consolidate those entities where we have both significant economics and the power to direct the activities of the entity that impact economic performance. For limited partnerships and similar entities evaluated under the voting interest model, we do not consolidate those entities for which we act as the general partner unless we hold a majority voting interest.
The consolidation guidance requires qualitative and quantitative analysis to determine whether our involvement, through holding interests directly or indirectly in the entity or contractually through other variable interests (e.g., management and performance related income), would give us a controlling financial interest. This analysis requires judgment. These judgments include: (1) determining whether the equity investment at risk is sufficient to permit the entity to finance its activities without additional subordinated financial support, (2) evaluating whether the equity holders, as a group, can make decisions that have a significant effect on the success of the entity, (3) determining whether two or more parties’ equity interests should be aggregated, (4) determining whether the equity investors have proportionate voting rights to their obligations to absorb losses or rights to receive returns from an entity and (5) evaluating the nature of relationships and activities of the parties involved in determining which party within a related-party group is most closely associated with a VIE and hence would be deemed the primary beneficiary.
20
Revenue Recognition
We recognize revenue in accordance with ASC 606. Revenue is recognized in a manner that depicts the transfer of promised goods or services to customers and for an amount that reflects the consideration to which we expect to be entitled in exchange for those goods or services. We are required to identify our contracts with customers, identify the performance obligations in a contract, determine the transaction price, allocate the transaction price to the performance obligations in the contract and recognize revenue when (or as) the entity satisfies a performance obligation. In determining the transaction price, variable consideration is included only to the extent that it is probable that a significant reversal in the amount of cumulative revenue recognized would not occur when the uncertainty associated with the variable consideration is resolved.
Income Taxes
For tax purposes, we have historically been treated as a partnership for U.S. federal and state income tax purposes. As a result, we have not been subject to U.S. federal and state income taxes. The provision for income taxes in the historical consolidated statements of income consists of local and foreign income taxes. Following this transaction, we will be subject to U.S. federal and state income taxes, in addition to local and foreign income taxes, with respect to our allocable share of any taxable income generated by the Partnership that will flow through to its interest holders, including us.
Taxes are accounted for using the asset and liability method of accounting. Under this method, deferred tax assets and liabilities are recognized for the expected future tax consequences of differences between the financial statement carrying amounts of existing assets and liabilities and their respective tax bases, using tax rates in effect for the year in which the differences are expected to reverse. The effect of a change in tax rates on deferred tax assets and liabilities is recognized in income in the period when the change is enacted.
Deferred tax assets are reduced by a valuation allowance when it is more-likely-than-not that some portion or all of the deferred tax assets will not be realized. The realization of deferred tax assets is dependent on the amount of the Company’s future taxable income. When evaluating the realizability of deferred tax assets, all evidence—both positive and negative—is considered. This evidence includes, but is not limited to, expectations regarding future earnings, future reversals of existing temporary tax differences and tax planning strategies.
GAAP requires us to recognize tax benefits in an amount that is more-likely-than-not to be sustained by the relevant taxing authority upon examination. We analyze our tax filing positions in all of the U.S. federal, state, local and foreign tax jurisdictions where we are required to file income tax returns, as well as for all open tax years in these jurisdictions. If, based on this analysis, we determine that uncertainties in tax positions exist that do not meet the minimum threshold for recognition of the related tax benefit, a liability is recorded in the consolidated financial statements. We recognize interest and penalties, if any, related to unrecognized tax benefits as general, administrative and other expenses in the consolidated statements of income. If recognized, the entire amount of unrecognized tax positions would be recorded as a reduction in the provision for income taxes.
Tax laws are complex and subject to different interpretations by the taxpayer and respective governmental taxing authorities. Significant judgment is required in determining tax expense and in evaluating tax positions, including evaluating uncertainties under GAAP. We review our tax positions quarterly and adjust our tax balances as new information becomes available.
Quantitative and Qualitative Disclosures About Market Risk
Our primary exposure to market risk is related to our role as investment adviser or general partner to our investment products and the sensitivity to movements in the fair value of their investments, including the effect on management fees, performance income and investment income. Uncertainty with respect to the economic effects of the COVID-19 pandemic has introduced significant volatility in the financial markets, and the effects of this volatility could materially impact our market risks, including those listed below. For additional information concerning the COVID-19 pandemic and its potential impact on our business and our operating results, see “Risk Factors” in this Current Report on Form 8-K.
21
Market Risk
The market price of investments may significantly fluctuate during the period of investment. Investments may decline in value due to factors affecting securities markets generally or particular industries represented in the securities markets. The value of an investment may decline due to general market conditions, which are not specifically related to such investment, such as real or perceived adverse economic conditions, changes in the general outlook for corporate earnings, changes in interest or currency rates or adverse investor sentiment generally. It may also decline due to factors that affect a particular industry or industries, such as labor shortages or increased production costs and competitive conditions within an industry.
Our credit orientation has been a central tenet of our business across our investment strategies. Our investment professionals benefit from our independent research and relationship networks and insights from our portfolio of active investments. We believe the combination of high-quality proprietary pipeline and a consistent, rigorous approach to managing investments across our strategies has been, and we believe will continue to be, a major driver of our strong risk-adjusted returns and the stability and predictability of our income.
Interest Rate Risk
Our credit facilities provide $105 million and $22 million revolving lines of credit and $250 million of term loan debt. The facilities bear interest at a variable rate based on either LIBOR or a base rate plus an applicable margin with an unused commitment fee paid quarterly. Currently, the revolving facilities interest is calculated based on the base rate plus 0.25% or the LIBOR rate loans bear interest calculated based on LIBOR rate plus 3.05%, subject to a minimum interest rate. Our unused commitment fee is 0.5% per annum. Currently, the term loan bears interest calculated based on LIBOR rate plus 6.00%, subject to a LIBOR floor. As of March 31, 2021, we had $113.4 million and $250.0 million of borrowings outstanding under the revolving facilities and term loan, respectively.
We estimate that in the event of 100 basis points of an increase in LIBOR, there would be no impact to our interest expense; however, for any incremental increase above approximately 100 basis points, we would be subject to the variable rate and would expect our interest expense to increase commensurately.
Credit Risk
We are party to agreements providing for various financial services and transactions that contain an element of risk in the event that the counterparties are unable to meet the terms of such agreements. In such agreements, we depend on the counterparty to make payment or otherwise perform. We generally endeavor to minimize our risk of exposure by limiting to reputable financial institutions the counterparties with which we enter into financial transactions. In other circumstances, availability of financing from financial institutions may be uncertain due to market events, and we may not be able to access these financing markets. At March 31, 2021 and March 31, 2020, we had cash balances with financial institutions in excess of Federal Deposit Insurance Corporation insured limits. We seek to mitigate this exposure by monitoring the credit standing of these financial institutions.
There have been no material changes in our market risks for the three months ended March 31, 2021.
22