Attached files
| file | filename |
|---|---|
| 8-K - 8-K - JUNIATA VALLEY FINANCIAL CORP | tmb-20210518x8k.htm |
Exhibit 99.1
| JUNIATA VALLEY FINANCIAL CORP. 2021 ANNUAL MEETING MAY 18, 2021 Weathering The Storm Exhibit 99.1 |

| Shareholders’ Business Meeting Chairman, Timothy Havice |

| Agenda • Call to Order • Rules of Conduct • Introduction of Members of the Board of Directors • Determine Presence of Quorum, Approval of Minutes, Appointment of Tellers • Nominations • Management’s Presentation –“Weathering The Storm” • Questions/Comments • Voting Tabulation • Adjournment |

| Board of Directors • Chairman, Timothy I. Havice • Vice Chairman, Philip E. Gingerich, Jr. • Bradley J. Wagner • Marcie A. Barber • Martin L. Dreibelbis • Gary E. Kelsey • Michael A. Buffington • Dr. Richard M. Scanlon |

| Agenda Call to Order ✓ Rules of Conduct ✓ Introduction of Members of the Board of Directors • Determine Presence of Quorum, Approval of Minutes, Appointment of Tellers • Nominations • Management’s Presentation –“Weathering The Storm” • Questions/Comments • Voting Tabulation • Adjournment |

| Forward Looking Statements This presentation may contain “forward looking” information as defined by the Private Securities Litigation Reform Act of 1995. When words such as “believes”, “expects”, “anticipates” or similar expressions are used in this presentation, Juniata is making forward-looking statements. Such information is based on Juniata’s current expectations, estimates and projections about future events and financial trends affecting the financial condition of its business. These statements are not historical facts or guarantees of future performance, events or results. Such statements involve potential risks and uncertainties and, accordingly, actual results may differ materially from this forward-looking information. Many factors could affect future financial results. Juniata undertakes no obligation to publicly update or revise forward looking information, whether as a result of new or updated information, future events, or otherwise. For a more complete discussion of certain risks and uncertainties affecting Juniata, please see the sections entitled “Risk Factors” and “Management’s Discussion and Analysis of Financial Condition and Results of Operations – Forward-Looking Statements” set forth in the Juniata’s filings with the Securities and Exchange Commission. |

| Weathering The Storm President and CEO Marcie A. Barber EVP and CFO JoAnn McMinn |

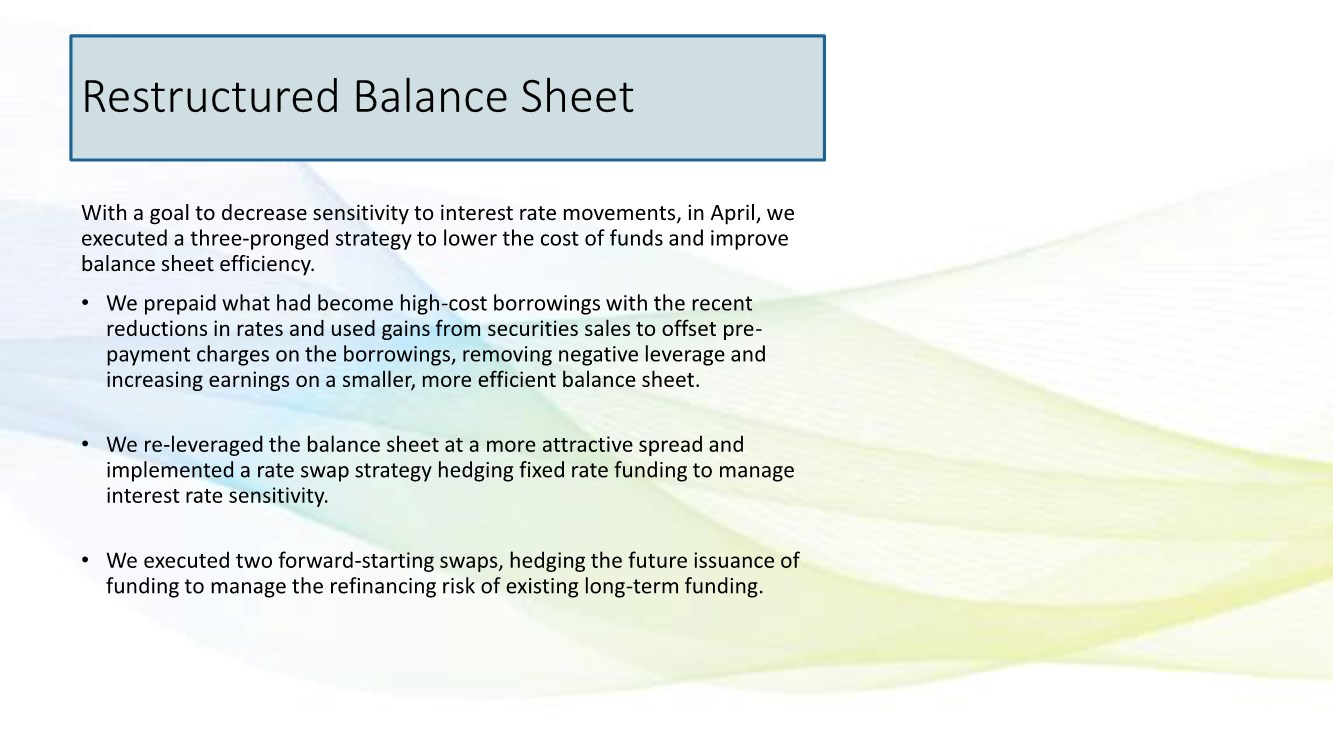
| Restructured Balance Sheet With a goal to decrease sensitivity to interest rate movements, in April, we executed a three-pronged strategy to lower the cost of funds and improve balance sheet efficiency. • We prepaid what had become high-cost borrowings with the recent reductions in rates and used gains from securities sales to offset pre- payment charges on the borrowings, removing negative leverage and increasing earnings on a smaller, more efficient balance sheet. • We re-leveraged the balance sheet at a more attractive spread and implemented a rate swap strategy hedging fixed rate funding to manage interest rate sensitivity. • We executed two forward-starting swaps, hedging the future issuance of funding to manage the refinancing risk of existing long-term funding. |
| Response to Pandemic • Ready with prepared Business Continuity Plan • Critical personnel separated • Remote work locations • Closed branch lobbies, while maintaining drive-thru service • Reduced staffing through furloughs and temporary re-assignments |
| Assisted Community • Paycheck Protection Program (PPP) • COVID-19 related loan payment deferrals • Offered virtual and/or social distanced personal meetings with customers to stay connected and allay concerns • Expanded drive-thru hours at branch locations • Enhanced on-line services • Initiated “chat” feature • Launched Business Mobile Deposit |
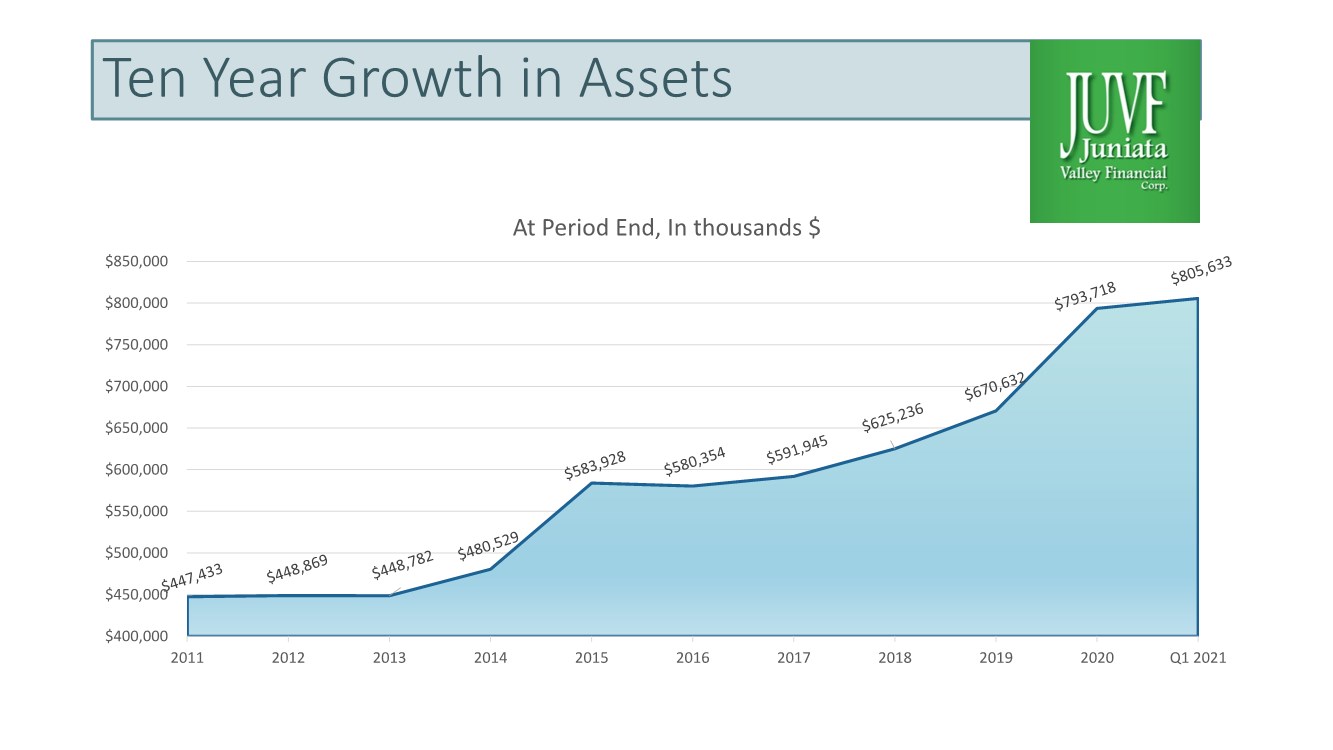
| Ten Year Growth in Assets $400,000 $450,000 $500,000 $550,000 $600,000 $650,000 $700,000 $750,000 $800,000 $850,000 2011 2012 2013 2014 2015 2016 2017 2018 2019 2020 Q1 2021 At Period End, In thousands $ |
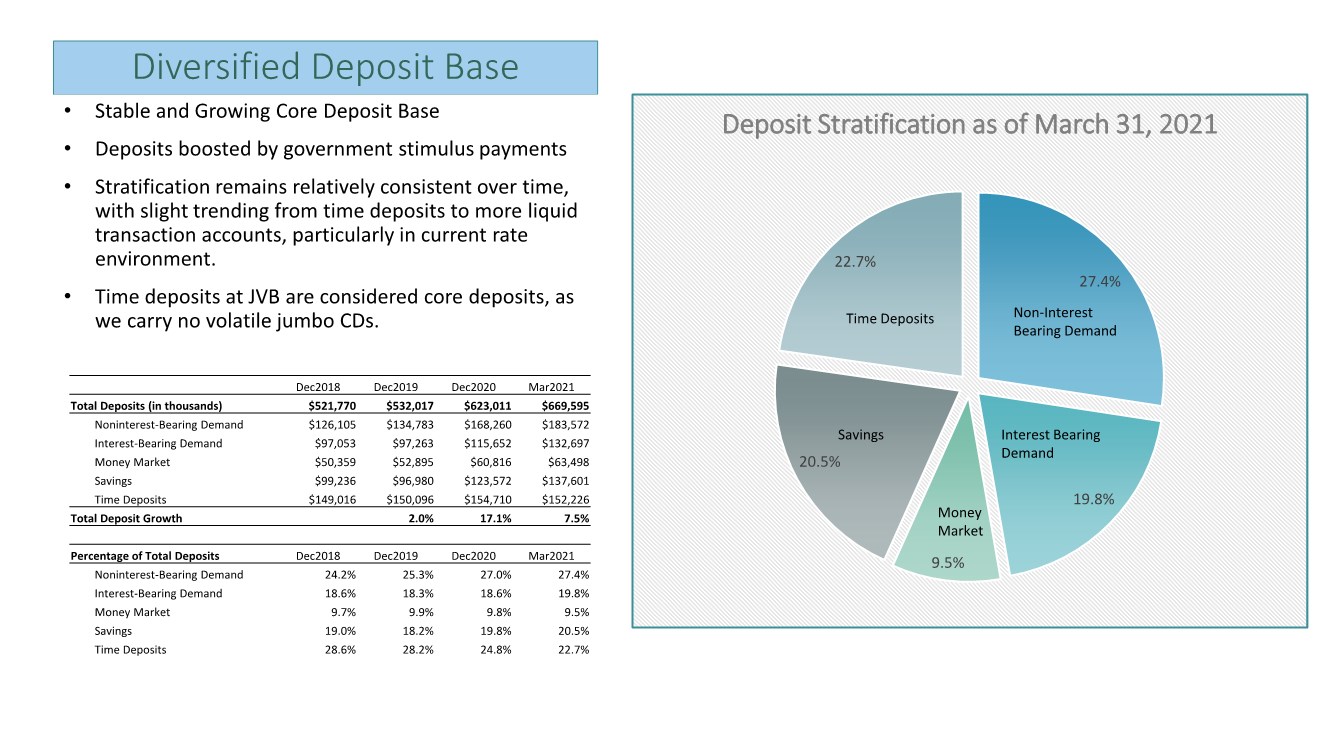
| Diversified Deposit Base 27.4% 19.8% 9.5% 20.5% 22.7% Deposit Stratification as of March 31, 2021 Non-Interest Bearing Demand Interest Bearing Demand Money Market Savings Time Deposits • Stable and Growing Core Deposit Base • Deposits boosted by government stimulus payments • Stratification remains relatively consistent over time, with slight trending from time deposits to more liquid transaction accounts, particularly in current rate environment. • Time deposits at JVB are considered core deposits, as we carry no volatile jumbo CDs. Dec2018 Dec2019 Dec2020 Mar2021 Total Deposits (in thousands) $521,770 $532,017 $623,011 $669,595 Noninterest-Bearing Demand $126,105 $134,783 $168,260 $183,572 Interest-Bearing Demand $97,053 $97,263 $115,652 $132,697 Money Market $50,359 $52,895 $60,816 $63,498 Savings $99,236 $96,980 $123,572 $137,601 Time Deposits $149,016 $150,096 $154,710 $152,226 Total Deposit Growth 2.0% 17.1% 7.5% Percentage of Total Deposits Dec2018 Dec2019 Dec2020 Mar2021 Noninterest-Bearing Demand 24.2% 25.3% 27.0% 27.4% Interest-Bearing Demand 18.6% 18.3% 18.6% 19.8% Money Market 9.7% 9.9% 9.8% 9.5% Savings 19.0% 18.2% 19.8% 20.5% Time Deposits 28.6% 28.2% 24.8% 22.7% |
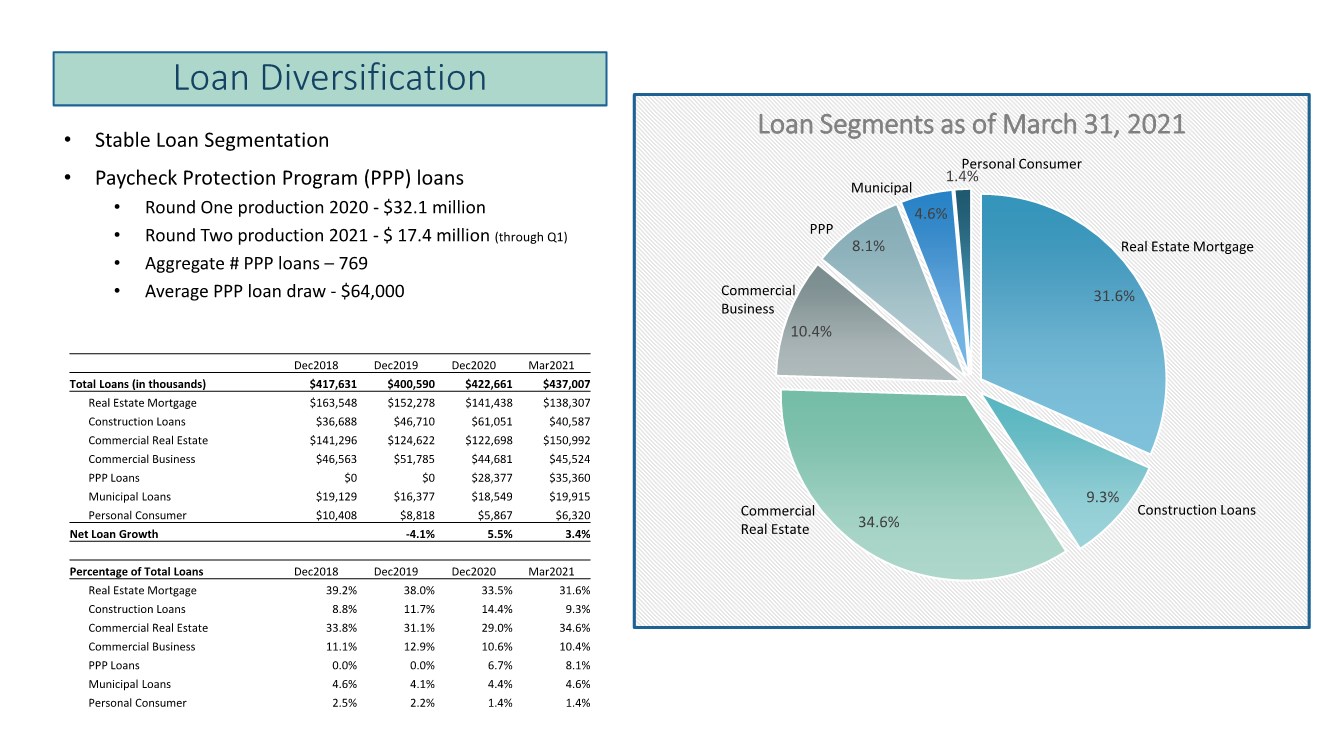
| Loan Diversification 31.6% 9.3% 34.6% 10.4% 8.1% 4.6% 1.4% Loan Segments as of March 31, 2021 Construction Loans Commercial Business Commercial Real Estate Real Estate Mortgage PPP Municipal Personal Consumer • Stable Loan Segmentation • Paycheck Protection Program (PPP) loans • Round One production 2020 - $32.1 million • Round Two production 2021 - $ 17.4 million (through Q1) • Aggregate # PPP loans – 769 • Average PPP loan draw - $64,000 Dec2018 Dec2019 Dec2020 Mar2021 Total Loans (in thousands) $417,631 $400,590 $422,661 $437,007 Real Estate Mortgage $163,548 $152,278 $141,438 $138,307 Construction Loans $36,688 $46,710 $61,051 $40,587 Commercial Real Estate $141,296 $124,622 $122,698 $150,992 Commercial Business $46,563 $51,785 $44,681 $45,524 PPP Loans $0 $0 $28,377 $35,360 Municipal Loans $19,129 $16,377 $18,549 $19,915 Personal Consumer $10,408 $8,818 $5,867 $6,320 Net Loan Growth -4.1% 5.5% 3.4% Percentage of Total Loans Dec2018 Dec2019 Dec2020 Mar2021 Real Estate Mortgage 39.2% 38.0% 33.5% 31.6% Construction Loans 8.8% 11.7% 14.4% 9.3% Commercial Real Estate 33.8% 31.1% 29.0% 34.6% Commercial Business 11.1% 12.9% 10.6% 10.4% PPP Loans 0.0% 0.0% 6.7% 8.1% Municipal Loans 4.6% 4.1% 4.4% 4.6% Personal Consumer 2.5% 2.2% 1.4% 1.4% |
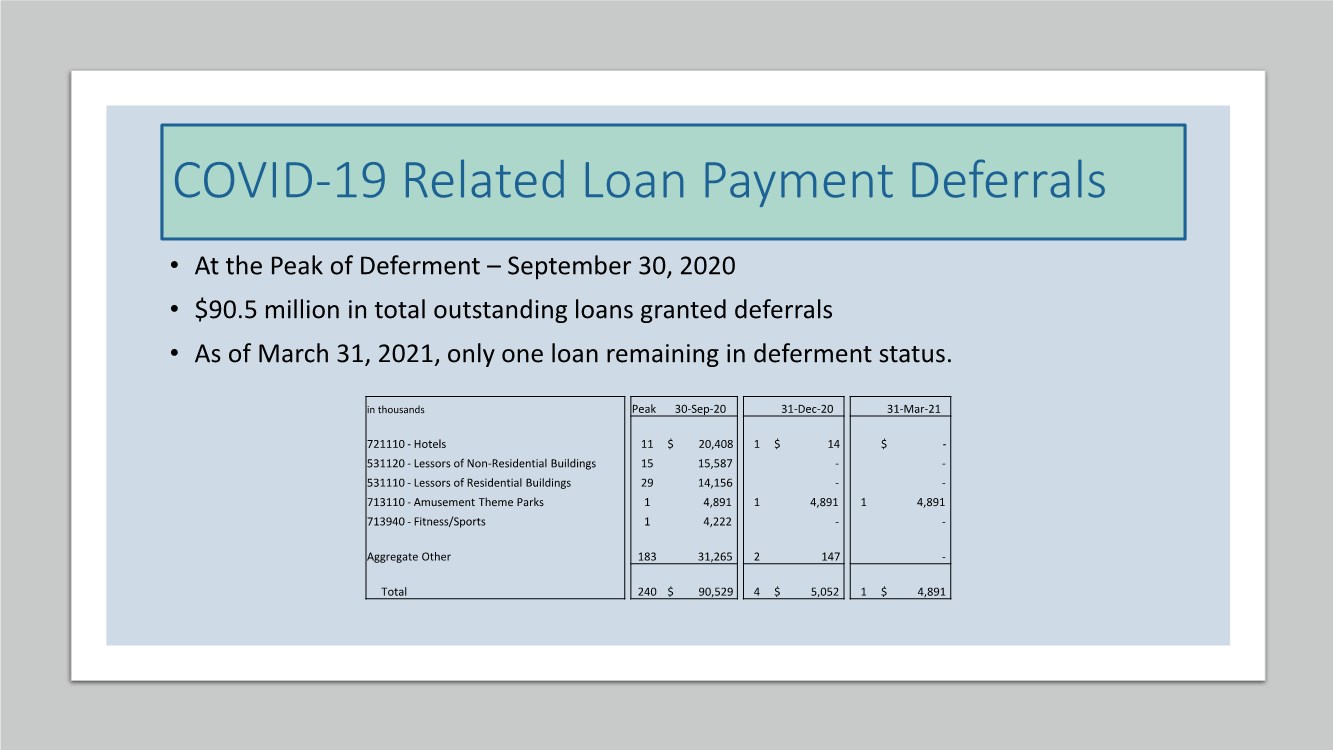
| COVID-19 Related Loan Payment Deferrals • At the Peak of Deferment – September 30, 2020 • $90.5 million in total outstanding loans granted deferrals • As of March 31, 2021, only one loan remaining in deferment status. in thousands Peak 30-Sep-20 31-Dec-20 31-Mar-21 721110 - Hotels 11 $ 20,408 1 $ 14 $ - 531120 - Lessors of Non-Residential Buildings 15 15,587 -- 531110 - Lessors of Residential Buildings 29 14,156 -- 713110 - Amusement Theme Parks 1 4,891 1 4,891 1 4,891 713940 - Fitness/Sports 1 4,222 -- Aggregate Other 183 31,265 2 147 - Total 240 $ 90,529 4 $ 5,052 1 $ 4,891 |
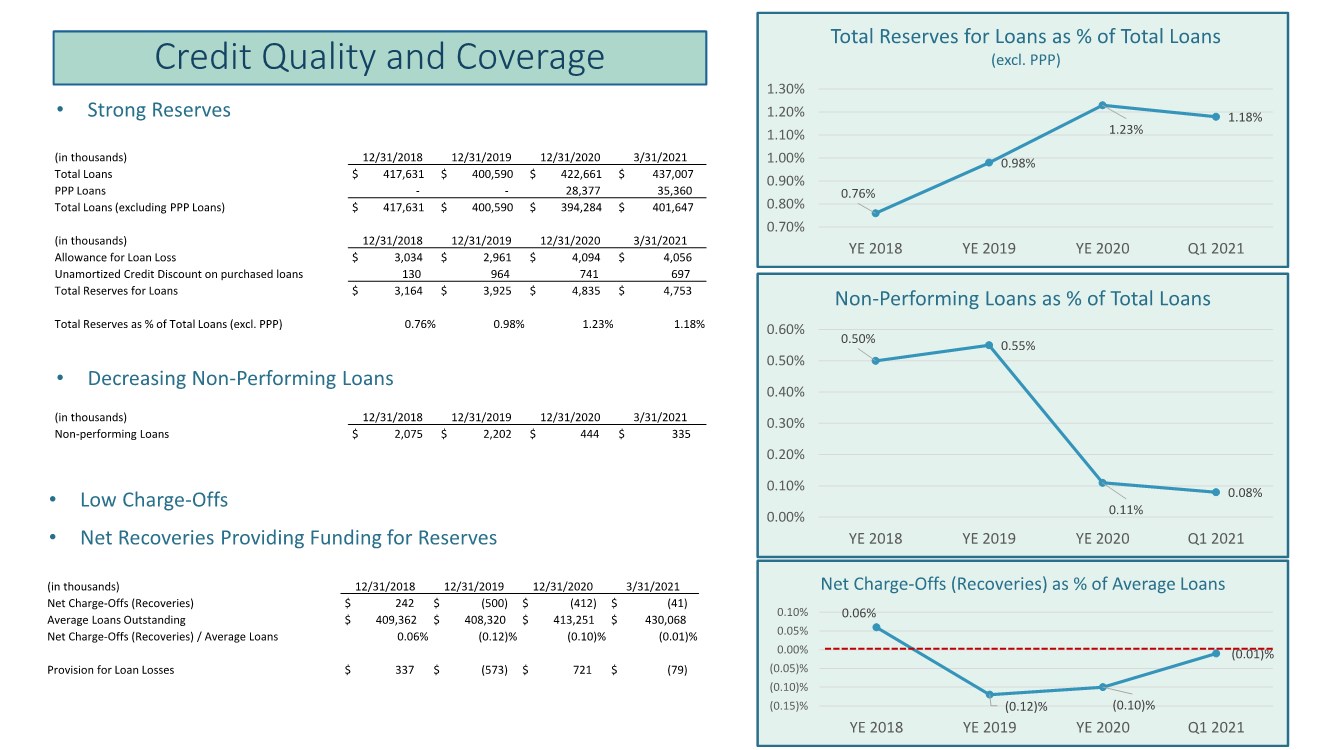
| Credit Quality and Coverage • Strong Reserves 0.50% 0.55% 0.11% 0.08% 0.00% 0.10% 0.20% 0.30% 0.40% 0.50% 0.60% YE 2018 YE 2019 YE 2020 Q1 2021 Non-Performing Loans as % of Total Loans 0.76% 0.98% 1.23% 1.18% 0.70% 0.80% 0.90% 1.00% 1.10% 1.20% 1.30% YE 2018 YE 2019 YE 2020 Q1 2021 Total Reserves for Loans as % of Total Loans (excl. PPP) 0.06% (0.12)% (0.10)% (0.01)% (0.15)% (0.10)% (0.05)% 0.00% 0.05% 0.10% YE 2018 YE 2019 YE 2020 Q1 2021 Net Charge-Offs (Recoveries) as % of Average Loans • Decreasing Non-Performing Loans (in thousands) 12/31/2018 12/31/2019 12/31/2020 3/31/2021 Non-performing Loans $ 2,075 $ 2,202 $ 444 $ 335 • Low Charge-Offs • Net Recoveries Providing Funding for Reserves (in thousands) 12/31/2018 12/31/2019 12/31/2020 3/31/2021 Net Charge-Offs (Recoveries) $ 242 $ (500) $ (412) $ (41) Average Loans Outstanding $ 409,362 $ 408,320 $ 413,251 $ 430,068 Net Charge-Offs (Recoveries) / Average Loans 0.06% (0.12)% (0.10)% (0.01)% Provision for Loan Losses $ 337 $ (573) $ 721 $ (79) (in thousands) 12/31/2018 12/31/2019 12/31/2020 3/31/2021 Total Loans $ 417,631 $ 400,590 $ 422,661 $ 437,007 PPP Loans -- 28,377 35,360 Total Loans (excluding PPP Loans) $ 417,631 $ 400,590 $ 394,284 $ 401,647 (in thousands) 12/31/2018 12/31/2019 12/31/2020 3/31/2021 Allowance for Loan Loss $ 3,034 $ 2,961 $ 4,094 $ 4,056 Unamortized Credit Discount on purchased loans 130 964 741 697 Total Reserves for Loans $ 3,164 $ 3,925 $ 4,835 $ 4,753 Total Reserves as % of Total Loans (excl. PPP) 0.76% 0.98% 1.23% 1.18% |
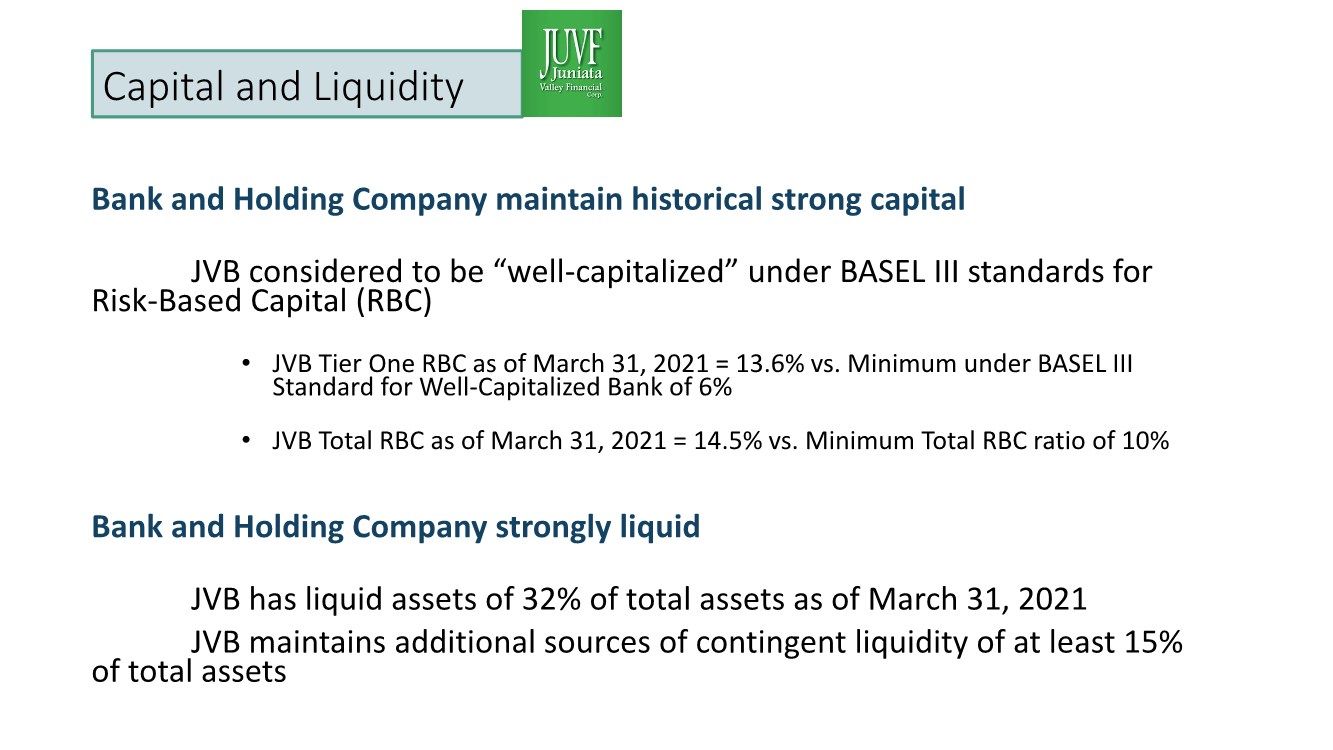
| Capital and Liquidity Bank and Holding Company maintain historical strong capital JVB considered to be “well-capitalized” under BASEL III standards for Risk-Based Capital (RBC) • JVB Tier One RBC as of March 31, 2021 = 13.6% vs. Minimum under BASEL III Standard for Well-Capitalized Bank of 6% • JVB Total RBC as of March 31, 2021 = 14.5% vs. Minimum Total RBC ratio of 10% Bank and Holding Company strongly liquid JVB has liquid assets of 32% of total assets as of March 31, 2021 JVB maintains additional sources of contingent liquidity of at least 15% of total assets |
| Full Year 2020 and Q1 2021 Financial Results 2020 Key Influencers • Economic downturn due to coronavirus reflected in: • Provision for Loan Losses • Reduction in customer service fees • Compensation expense • Margin compression due to: • significant reduction in fed funds target and prime rate • prolonged flattened yield curve • Accelerated mortgage prepayments ▪ Balance sheet restructuring ▪ Offset some margin compression ▪ Provided net gains Earnings Highlights 2020 Full Year 2021 Quarter 1 Net Income $5,602,000 $1,635,000 Return on Average Assets 0.76% 0.82% Return on Average Equity 7.37% 8.68% Net Interest Margin (fully tax equivalent) 3.00% 2.71% Loan Loss Provision as % of Average Assets (0.10)% 0.01% Securities gains (losses) as % of Average Assets, net of Debt Extinquishment Costs 0.04% (0.03)% Non-Interest Income as % of Average Assets (excludes securities gains/losses) 0.67% 0.73% Non-Interest Expense as % of Average Assets (2.43)% (2.97)% (excludes amortization of Low Income Housing Inv and Debt Extinguishment Costs) Low Income Housing Investment tax credit, 0.04% 0.04% net of after-tax amortization of investment, as % of Average Assets Tax Provision Expense as % of Average Assets (0.12)% (0.15)% Earnings per Share, diluted $1.10 $0.33 |

| Looking Ahead for 2021 Refer to Forward-Looking Statement Disclaimer |

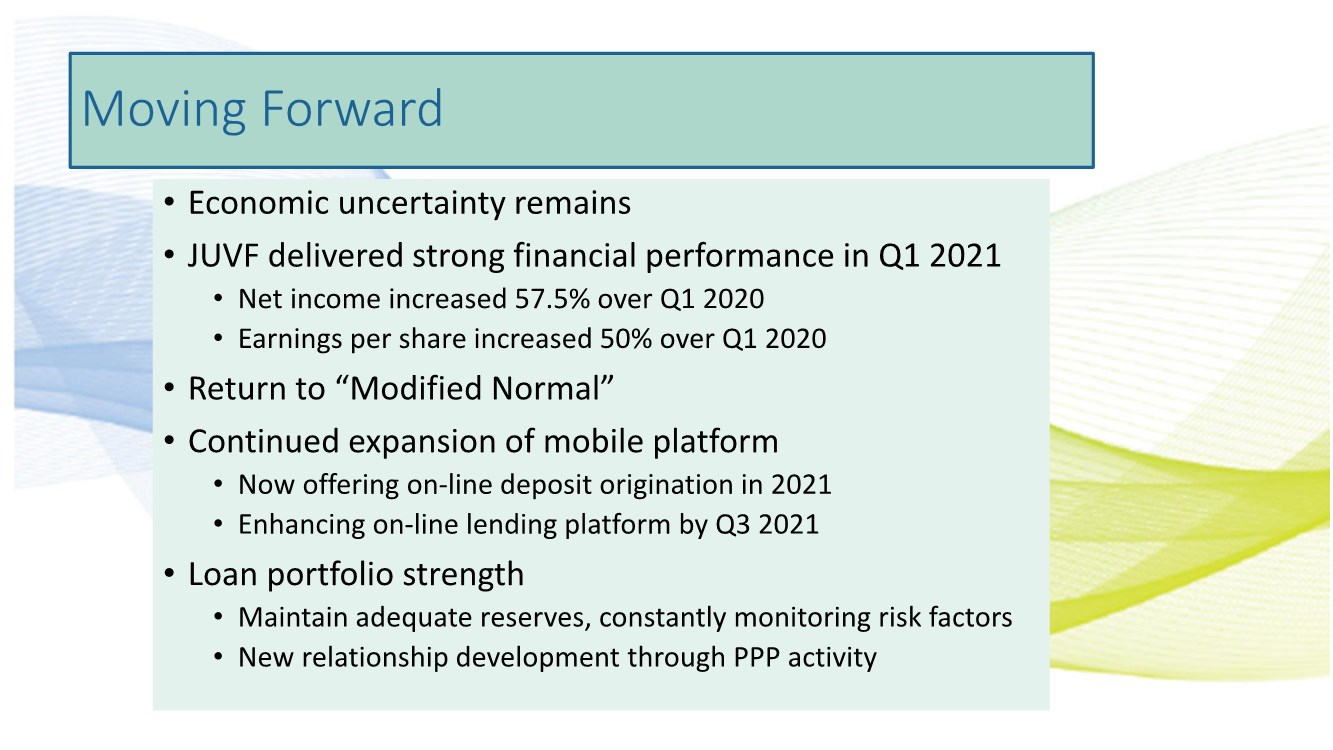
| • Economic uncertainty remains • JUVF delivered strong financial performance in Q1 2021 • Net income increased 57.5% over Q1 2020 • Earnings per share increased 50% over Q1 2020 • Return to “Modified Normal” • Continued expansion of mobile platform • Now offering on-line deposit origination in 2021 • Enhancing on-line lending platform by Q3 2021 • Loan portfolio strength • Maintain adequate reserves, constantly monitoring risk factors • New relationship development through PPP activity Moving Forward |
| Questions / Comments Note that this presentation has been recorded and will be available for one year on our Investor Website Additionally, this presentation has been filed with the SEC on a Form 8-K |

| Vote Tabulation Report Lisa Snyder |

| JUNIATA VALLEY FINANCIAL CORP. 2021 ANNUAL MEETING MAY 18, 2021 Meeting Adjournment |