Attached files
| file | filename |
|---|---|
| 8-K - 8-K - AVIENT CORP | avnt-20210430.htm |

NEWS RELEASE
FOR IMMEDIATE RELEASE
Avient Announces Record First Quarter 2021 Results;
Increases Full Year Guidance
•Organic revenues increased 17% to $1.16 billion driven by strong demand across all segments, with the most significant growth in healthcare and consumer end markets
•GAAP EPS from continuing operations of $0.86 compared to $0.38 in the prior year quarter
•Adjusted EPS from continuing operations of $0.89 expanded 68% over the prior year of $0.53 with all segments achieving record operating income
•Full year adjusted EPS guidance for 2021 increased from $2.40 to $2.80 representing 45% growth over the prior year of $1.93.
CLEVELAND – April 30, 2021 – Avient Corporation (NYSE: AVNT), a leading provider of specialized and sustainable material solutions, today reported its first quarter results for 2021. First quarter 2021 GAAP EPS from continuing operations was $0.86 compared to $0.38 in the prior year first quarter. The company noted that GAAP EPS includes special items (Attachment 3), which impacted EPS in both periods and were primarily associated with acquisition-related and restructuring costs. Unless otherwise noted herein, all comparisons to prior year results are pro forma for the Clariant Masterbatch acquisition.
“I’m very pleased to report we achieved the highest level of organic sales growth in the last decade, as the economy recovers from the pandemic lows of the prior year. This is a direct result of the investments we have made to transform our portfolio to one that is more specialized and focused on high growth end markets with sustainable solutions,” said Robert M. Patterson, Chairman, President and Chief Executive Officer, Avient Corporation.
The company cited strong demand for healthcare (up 22%) and consumer products (up 24%) as organic revenue increased 17% to $1.16 billion. Coupled with expanding margins, and early synergy capture related to the Clariant Masterbatch acquisition, this led to a 68% increase in adjusted EPS to $0.89 versus $0.53 in the prior year.
1
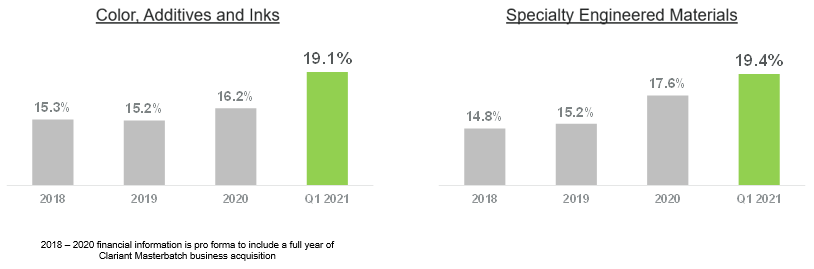
Specialty EBITDA Margins
Mr. Patterson added, “We are an asset-light, high-touch business that generates very high free cash flow conversion. We specialize in formulating sustainable solutions to meet our customers’ toughest challenges, and I am proud of how well our team has delivered throughout the COVID-19 pandemic and recent supply chain disruptions.”
The company noted the following segment highlights:
The Color, Additives and Inks segment delivered record operating income of $89 million during the first quarter, a 40% increase over the prior year. The company said it is ahead of schedule in capturing cost synergies from the Clariant Masterbatch acquisition and now expects to achieve $45 million in the current year from the previously announced $35 million.
The Specialty Engineered Materials segment also achieved its highest-ever quarterly operating income at $34 million, a 53% increase over the prior year. Demand conditions were robust in the quarter, in particular for composite technologies and new business gains in healthcare applications.
Despite significant supply chain disruptions, the company’s Distribution segment also performed exceptionally well to start the year, highlighted by record quarterly operating income of $24 million, a 24% increase over the prior year, as sales increased 25% to $363 million.
2
Second Quarter and Full Year 2021 Outlook
Commenting on the Company’s 2021 outlook, Mr. Patterson said, “As more and more vaccines are administered, we anticipate demand conditions will continue to improve. We now estimate second quarter sales of $1.1 billion and adjusted EPS of $0.80. This represents sales and adjusted EPS growth of 26% and 90%, respectively, over the prior year second quarter.”
Mr. Patterson added, “We are also increasing our full year 2021 estimates and now expect revenues of approximately $4.3 billion and adjusted EPS of $2.80, a 45% increase over the prior year." "As companies report their earnings this year and compare to 2020, there will be many examples of significant growth being delivered. This is the case for Avient as well, but what further differentiates us, is that in 2020 our EPS also grew 11% vs. 2019. Our EPS projections for 2021 are 61% higher than 2019 because of the resiliency of our portfolio, the end markets we serve and how we have executed during these challenging times," Mr. Patterson concluded. | 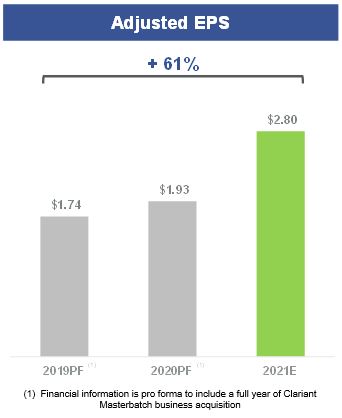 | |||||||
The Company noted it will provide more details on its 2021 outlook during the webcast scheduled for 9:00 a.m. Eastern Time on April 30, 2021.
Pro Forma
The Company acquired the Clariant Masterbatch business (“CMB”) on July 1, 2020 (the “Acquisition Date”). Unless otherwise noted, all comparisons to prior year financial results herein are presented on a pro forma basis and referred to as “organic” such that the prior periods include the business results of CMB for that prior period. Management believes this provides better comparability of the performance of the combined businesses. Refer to Attachment 7 Reconciliation of Non-GAAP Financial Measures for details regarding adjustments to previously reported results to arrive to the pro forma financial metrics.
3
Webcast Details
The webcast can be viewed live at avient.com/investors, or by clicking here: https://edge.media-server.com/mmc/p/eaivs28r. To participate in the audio-only portion of the call, dial 1-844-835-7433 (domestic) or 1-914-495-8589 (international) and provide conference ID number 6746706. There will be a question and answer session following the company’s presentation and prepared remarks.
A recording of the webcast and the slide presentation will be available at avient.com/investors. In addition, a recording of the audio will be available for one week, beginning at 12:00 p.m. ET on Friday, April 30, 2021. To access, dial 1-855-859-2056 (domestic) or 1-404-537-3406 (international) and provide conference ID number 6746706.
About Avient
Avient Corporation (NYSE: AVNT), with 2020 pro forma revenues of $3.8 billion, provides specialized and sustainable material solutions that transform customer challenges into opportunities, bringing new products to life for a better world. Examples include:
•Barrier technologies that preserve the shelf-life and quality of food, beverages, medicine and other perishable goods through high-performance materials that require less plastic
•Light-weighting solutions that replace heavier traditional materials like metal, glass and wood, which can improve fuel efficiency in all modes of transportation
•Breakthrough technologies that minimize wastewater and improve the recyclability of materials and packaging across a spectrum of end uses
Avient employs approximately 8,400 associates and is certified ACC Responsible Care®, a founding member of the Alliance to End Plastic Waste and certified Great Place to Work®. For more information, visit www.avient.com.
# # #
4
Forward-looking Statements
In this press release, statements that are not reported financial results or other historical information are “forward-looking statements” within the meaning of the Private Securities Litigation Reform Act of 1995. Forward-looking statements give current expectations or forecasts of future events and are not guarantees of future performance. They are based on management's expectations that involve a number of business risks and uncertainties, any of which could cause actual results to differ materially from those expressed in or implied by the forward-looking statements. They use words such as “will,” “anticipate,” “estimate,” “expect,” “project,” “intend,” “plan,” “believe,” and other words and terms of similar meaning in connection with any discussion of future operating or financial condition, performance and/or sales. Factors that could cause actual results to differ materially from those implied by these forward-looking statements include disruptions, uncertainty or volatility in the credit markets that could adversely impact the availability of credit already arranged and the availability and cost of credit in the future; the effect on foreign operations of currency fluctuations, tariffs and other political, economic and regulatory risks; the current and potential future impact of the COVID-19 pandemic on our business, results of operations, financial position or cash flows; our ability to achieve the strategic and other objectives relating to the acquisition of Clariant's Masterbatch business, including any expected synergies; changes in polymer consumption growth rates and laws and regulations regarding plastics in jurisdictions where we conduct business; fluctuations in raw material prices, quality and supply, and in energy prices and supply; production outages or material costs associated with scheduled or unscheduled maintenance programs; unanticipated developments that could occur with respect to contingencies such as litigation and environmental matters; an inability to achieve the anticipated financial benefit from initiatives related to acquisition and integration working capital reductions, cost reductions and employee productivity goals; our ability to pay regular quarterly cash dividends and the amounts and timing of any future dividends; information systems failures and cyberattacks; our ability to consummate and successfully integrate acquisitions; and amounts for cash and non-cash charges related to restructuring plans that may differ from original estimates, including because of timing changes associated with the underlying actions. The above list of factors is not exhaustive.
We undertake no obligation to publicly update forward-looking statements, whether as a result of new information, future events or otherwise. You are advised to consult any further disclosures we make on related subjects in our reports on Form 10-Q, 8-K and 10-K that we provide to the Securities and Exchange Commission.
Non-GAAP Reconciliation
The Company does not provide reconciliations of forward-looking non-GAAP financial measures, such as outlook for adjusted earnings per share, to the most comparable GAAP financial measures on a forward-looking basis because the Company is unable to provide a meaningful or accurate calculation or estimation of reconciling items and the information is not available without unreasonable effort. This is due to the inherent difficulty of forecasting the timing and amount of certain items, such as, but not limited to, restructuring costs, environmental remediation costs, acquisition related costs, and other non-routine costs. Each of such adjustments has not yet occurred, are out of the Company's control and/or cannot be reasonably predicted. For the same reasons, the Company is unable to address the probable significance of the unavailable information.
5
Investor Relations Contact:
Giuseppe (Joe) Di Salvo
Vice President, Treasurer and Investor Relations
Avient Corporation
+1 440-930-1921
giuseppe.disalvo@avient.com
Media Contact:
Kyle G. Rose
Vice President, Corporate Communications
Avient Corporation
+1 440-930-3162
kyle.rose@avient.com
6
Attachment 1
Avient Corporation
Summary of Condensed Consolidated Statements of Income (Unaudited)
(In millions, except per share data)
| Three Months Ended March 31, | |||||||||||
| 2021 | 2020 | ||||||||||
| Sales | $ | 1,162.3 | $ | 711.5 | |||||||
| Operating Income | 120.4 | 52.8 | |||||||||
| Net income from continuing operations attributable to Avient shareholders | 79.3 | 33.1 | |||||||||
Basic earnings per share from continuing operations attributable to Avient shareholders | $ | 0.87 | $ | 0.38 | |||||||
Diluted earnings per share from continuing operations attributable to Avient shareholders | $ | 0.86 | $ | 0.38 | |||||||
Senior management uses comparisons of adjusted net income from continuing operations attributable to Avient shareholders and diluted adjusted earnings per share (EPS) from continuing operations attributable to Avient shareholders, excluding special items, to assess performance and facilitate comparability of results. Senior management believes these measures are useful to investors because they allow for comparison to Avient's performance in prior periods without the effect of items that, by their nature, tend to obscure Avient's operating results due to the potential variability across periods based on timing, frequency and magnitude. Non-GAAP financial measures have limitations as analytical tools and should not be considered in isolation from, or solely as alternatives to, financial measures prepared in accordance with GAAP. Below is a reconciliation of these non-GAAP financial measures to their most directly comparable financial measures calculated and presented in accordance with GAAP. See Attachment 3 for a definition and summary of special items.
| Three Months Ended March 31, 2021 | Three Months Ended March 31, 2020 | ||||||||||||||||||||||
| Reconciliation to Condensed Consolidated Statements of Income | $ | EPS | $ | EPS | |||||||||||||||||||
| Net income from continuing operations attributable to Avient shareholders | $ | 79.3 | $ | 0.86 | $ | 33.1 | $ | 0.38 | |||||||||||||||
| Special items, after tax (Attachment 3) | 2.6 | 0.03 | 8.6 | 0.10 | |||||||||||||||||||
| Adjusted net income / EPS - excluding special items | $ | 81.9 | $ | 0.89 | $ | 41.7 | $ | 0.48 | |||||||||||||||
7
Attachment 2
Avient Corporation
Condensed Consolidated Statements of Income (Unaudited)
(In millions, except per share data)
| Three Months Ended March 31, | |||||||||||
| 2021 | 2020 | ||||||||||
| Sales | $ | 1,162.3 | $ | 711.5 | |||||||
| Cost of sales | 859.9 | 540.0 | |||||||||
| Gross margin | 302.4 | 171.5 | |||||||||
| Selling and administrative expense | 182.0 | 118.7 | |||||||||
| Operating income | 120.4 | 52.8 | |||||||||
| Interest expense, net | (19.3) | (9.4) | |||||||||
| Other income, net | 1.5 | 1.6 | |||||||||
| Income from continuing operations before income taxes | 102.6 | 45.0 | |||||||||
| Income taxes | (22.9) | (11.9) | |||||||||
| Net income from continuing operations | 79.7 | 33.1 | |||||||||
| Loss from discontinued operations, net of income taxes | — | (0.3) | |||||||||
| Net income | 79.7 | 32.8 | |||||||||
| Net income attributable to noncontrolling interests | (0.4) | — | |||||||||
| Net income attributable to Avient common shareholders | $ | 79.3 | $ | 32.8 | |||||||
| Earnings per share attributable to Avient common shareholders - Basic: | |||||||||||
| Continuing operations | $ | 0.87 | $ | 0.38 | |||||||
| Discontinued operations | — | — | |||||||||
| Total | $ | 0.87 | $ | 0.38 | |||||||
| Earnings per share attributable to Avient common shareholders - Diluted: | |||||||||||
| Continuing operations | $ | 0.86 | $ | 0.38 | |||||||
| Discontinued operations | — | — | |||||||||
| Total | $ | 0.86 | $ | 0.38 | |||||||
| Cash dividends declared per share of common stock | $ | 0.2125 | $ | 0.2025 | |||||||
| Weighted-average shares used to compute earnings per common share: | |||||||||||
| Basic | 91.3 | 86.3 | |||||||||
| Diluted | 92.2 | 86.7 | |||||||||
8
Attachment 3
Avient Corporation
Summary of Special Items (Unaudited)
(In millions, except per share data)
Special items (1) | Three Months Ended March 31, | ||||||||||
| 2021 | 2020 | ||||||||||
Cost of sales: | |||||||||||
Restructuring costs, including accelerated depreciation and amortization | $ | (1.8) | $ | — | |||||||
Environmental remediation costs | (0.5) | (0.4) | |||||||||
Reimbursement of previously incurred environmental costs | 4.5 | 0.2 | |||||||||
Impact on cost of sales | 2.2 | (0.2) | |||||||||
| Selling and administrative expense: | |||||||||||
Restructuring, legal and other | (1.3) | (1.8) | |||||||||
Acquisition earn-out adjustments | — | (1.0) | |||||||||
Acquisition related costs | (3.3) | (6.7) | |||||||||
Impact on selling and administrative expense | (4.6) | (9.5) | |||||||||
Impact on operating income | (2.4) | (9.7) | |||||||||
Other income, net | — | 0.1 | |||||||||
Impact on income from continuing operations before income taxes | (2.4) | (9.6) | |||||||||
Income tax benefit on above special items | 0.9 | 2.0 | |||||||||
Tax adjustments(2) | (1.1) | (1.0) | |||||||||
Impact of special items on net income from continuing operations attributable to Avient Shareholders | $ | (2.6) | $ | (8.6) | |||||||
| Diluted earnings per common share impact | $ | (0.03) | $ | (0.10) | |||||||
Weighted average shares used to compute adjusted earnings per share: | |||||||||||
| Diluted | 92.2 | 86.7 | |||||||||
(1) Special items include charges related to specific strategic initiatives or financial restructuring such as: consolidation of operations; debt extinguishment costs; costs incurred directly in relation to acquisitions or divestitures; employee separation costs resulting from personnel reduction programs, plant realignment costs, executive separation agreements; asset impairments; settlement gains or losses and mark-to-market adjustments associated with actuarial gains and losses on pension and other post-retirement benefit plans; environmental remediation costs, fines, penalties and related insurance recoveries related to facilities no longer owned or closed in prior years; gains and losses on the divestiture of operating businesses, joint ventures and equity investments; gains and losses on facility or property sales or disposals; results of litigation, fines or penalties, where such litigation (or action relating to the fines or penalties) arose prior to the commencement of the performance period; one-time, non-recurring items; and the effect of changes in accounting principles or other such laws or provisions affecting reported results.
(2) Tax adjustments include the net tax benefit/(expense) from one-time income tax items, the set-up or reversal of uncertain tax position reserves and deferred income tax valuation allowance adjustments.
9
Attachment 4
Avient Corporation
Condensed Consolidated Balance Sheets
(In millions)
(Unaudited) March 31, 2021 | December 31, 2020 | ||||||||||
| ASSETS | |||||||||||
| Current assets: | |||||||||||
| Cash and cash equivalents | $ | 594.5 | $ | 649.5 | |||||||
| Accounts receivable, net | 642.2 | 516.6 | |||||||||
| Inventories, net | 357.0 | 327.5 | |||||||||
| Other current assets | 122.7 | 108.5 | |||||||||
| Total current assets | 1,716.4 | 1,602.1 | |||||||||
| Property, net | 675.5 | 694.9 | |||||||||
| Goodwill | 1,281.9 | 1,308.1 | |||||||||
| Intangible assets, net | 973.3 | 1,008.5 | |||||||||
| Operating lease assets, net | 80.9 | 80.9 | |||||||||
| Other non-current assets | 181.4 | 176.0 | |||||||||
| Total assets | $ | 4,909.4 | $ | 4,870.5 | |||||||
| LIABILITIES AND SHAREHOLDERS' EQUITY | |||||||||||
| Current liabilities: | |||||||||||
| Short-term and current portion of long-term debt | $ | 18.8 | $ | 18.6 | |||||||
| Accounts payable | 529.6 | 471.7 | |||||||||
| Current operating lease obligations | 24.3 | 25.1 | |||||||||
| Accrued expenses and other current liabilities | 290.9 | 285.6 | |||||||||
| Total current liabilities | 863.6 | 801.0 | |||||||||
| Non-current liabilities: | |||||||||||
| Long-term debt | 1,852.7 | 1,854.0 | |||||||||
| Pension and other post-retirement benefits | 111.3 | 115.0 | |||||||||
| Non-current operating lease obligations | 56.8 | 56.0 | |||||||||
| Other non-current liabilities | 303.0 | 332.8 | |||||||||
| Total non-current liabilities | 2,323.8 | 2,357.8 | |||||||||
| SHAREHOLDERS' EQUITY | |||||||||||
| Avient shareholders’ equity | 1,707.0 | 1,697.1 | |||||||||
| Noncontrolling interest | 15.0 | 14.6 | |||||||||
| Total equity | 1,722.0 | 1,711.7 | |||||||||
| Total liabilities and equity | $ | 4,909.4 | $ | 4,870.5 | |||||||
10
Attachment 5
Avient Corporation
Condensed Consolidated Statements of Cash Flows (Unaudited)
(In millions)
| Three Months Ended March 31, | |||||||||||
| 2021 | 2020 | ||||||||||
| Operating Activities | |||||||||||
| Net income | $ | 79.7 | $ | 32.8 | |||||||
| Adjustments to reconcile net income to net cash provided by operating activities: | |||||||||||
| Depreciation and amortization | 36.6 | 19.9 | |||||||||
| Accelerated depreciation and amortization | 0.5 | — | |||||||||
| Share-based compensation expense | 2.7 | 2.1 | |||||||||
| Changes in assets and liabilities, net of the effect of acquisitions: | |||||||||||
| Increase in accounts receivable | (137.6) | (56.9) | |||||||||
| Increase in inventories | (35.1) | (13.0) | |||||||||
| Increase in accounts payable | 67.3 | 44.6 | |||||||||
| Decrease in pension and other post-retirement benefits | (7.1) | (3.2) | |||||||||
| Increase in post-acquisition earnout liabilities | — | 1.0 | |||||||||
| Decrease in accrued expenses and other assets and liabilities, net | (3.4) | (19.1) | |||||||||
| Payment of post-acquisition date earnout liability | — | (21.0) | |||||||||
| Net cash provided (used) by operating activities | 3.6 | (12.8) | |||||||||
| Investing activities | |||||||||||
| Capital expenditures | (16.5) | (11.1) | |||||||||
| Net proceeds from divestiture | — | 7.1 | |||||||||
| Net proceeds (used) provided by other assets | (2.0) | 5.2 | |||||||||
| Net cash (used) provided by investing activities | (18.5) | 1.2 | |||||||||
| Financing activities | |||||||||||
| Purchase of common shares for treasury | (4.2) | (13.6) | |||||||||
| Cash dividends paid | (19.5) | (15.6) | |||||||||
| Repayment of long-term debt | (2.3) | (2.0) | |||||||||
| Payments of withholding tax on share awards | (3.1) | (1.3) | |||||||||
| Equity offering proceeds, net of underwriting discount and issuance costs | — | 496.3 | |||||||||
| Payment of acquisition date earnout liability | — | (32.9) | |||||||||
| Net cash (used) provided by financing activities | (29.1) | 430.9 | |||||||||
| Effect of exchange rate changes on cash | (11.0) | (3.8) | |||||||||
| (Decrease) increase in cash and cash equivalents | (55.0) | 415.5 | |||||||||
| Cash and cash equivalents at beginning of year | 649.5 | 864.7 | |||||||||
| Cash and cash equivalents at end of period | $ | 594.5 | $ | 1,280.2 | |||||||
11
Attachment 6
Avient Corporation
Business Segment Operations (Unaudited)
(In millions)
Operating income and earnings before interest, taxes, depreciation and amortization (EBITDA) at the segment level does not include: special items as defined in Attachment 3; corporate general and administration costs that are not allocated to segments; intersegment sales and profit eliminations; share-based compensation costs; and certain other items that are not included in the measure of segment profit and loss that is reported to and reviewed by the chief operating decision maker. These costs are included in Corporate and eliminations.
| Three Months Ended March 31, | |||||||||||
| 2021 | 2020 | ||||||||||
| Sales: | |||||||||||
| Color, Additives and Inks | $ | 609.3 | $ | 256.5 | |||||||
| Specialty Engineered Materials | 216.5 | 185.3 | |||||||||
| Distribution | 362.7 | 289.5 | |||||||||
| Corporate and eliminations | (26.2) | (19.8) | |||||||||
| Sales | $ | 1,162.3 | $ | 711.5 | |||||||
| Gross margin: | |||||||||||
| Color, Additives and Inks | $ | 197.5 | $ | 89.4 | |||||||
| Specialty Engineered Materials | 64.7 | 52.6 | |||||||||
| Distribution | 39.3 | 33.6 | |||||||||
| Corporate and eliminations | 0.9 | (4.1) | |||||||||
| Gross margin | $ | 302.4 | $ | 171.5 | |||||||
| Selling and administrative expense: | |||||||||||
| Color, Additives and Inks | $ | 108.7 | $ | 48.9 | |||||||
| Specialty Engineered Materials | 30.5 | 30.3 | |||||||||
| Distribution | 15.3 | 14.2 | |||||||||
| Corporate and eliminations | 27.5 | 25.3 | |||||||||
| Selling and administrative expense | $ | 182.0 | $ | 118.7 | |||||||
| Operating income: | |||||||||||
| Color, Additives and Inks | $ | 88.8 | $ | 40.5 | |||||||
| Specialty Engineered Materials | 34.2 | 22.3 | |||||||||
| Distribution | 24.0 | 19.4 | |||||||||
| Corporate and eliminations | (26.6) | (29.4) | |||||||||
| Operating income | $ | 120.4 | $ | 52.8 | |||||||
Earnings before interest, taxes, depreciation and amortization (EBITDA): | |||||||||||
| Color, Additives and Inks | $ | 116.2 | $ | 51.4 | |||||||
| Specialty Engineered Materials | 42.0 | 29.8 | |||||||||
| Distribution | 24.2 | 19.5 | |||||||||
| Corporate and eliminations | (24.9) | (28.0) | |||||||||
| Other income, net | 1.5 | 1.6 | |||||||||
| EBITDA | $ | 159.0 | $ | 74.3 | |||||||
12
Attachment 7
Avient Corporation
Reconciliation of Non-GAAP Financial Measures (Unaudited)
(In millions, except per share data)
Senior management uses gross margin before special items and operating income before special items to assess performance and allocate resources because senior management believes that these measures are useful in understanding current profitability levels and how it may serve as a basis for future performance. In addition, operating income before the effect of special items is a component of Avient annual and long-term employee incentive plans and is used in debt covenant computations. Senior management believes these measures are useful to investors because they allow for comparison to Avient's performance in prior periods without the effect of items that, by their nature, tend to obscure Avient's operating results due to the potential variability across periods based on timing, frequency and magnitude. Non-GAAP financial measures have limitations as analytical tools and should not be considered in isolation from, or solely as alternatives to, financial measures prepared in accordance with GAAP. Below is a reconciliation of these non-GAAP financial measures to their most directly comparable financial measures calculated and presented in accordance with GAAP. See Attachment 3 for a definition and summary of special items.
| Three Months Ended March 31, | |||||||||||
| Reconciliation to Consolidated Statements of Income | 2021 | 2020 | |||||||||
| Sales | $ | 1,162.3 | $ | 711.5 | |||||||
| Gross margin - GAAP | 302.4 | 171.5 | |||||||||
| Special items in gross margin (Attachment 3) | (2.2) | 0.2 | |||||||||
| Adjusted Gross margin | $ | 300.2 | $ | 171.7 | |||||||
| Adjusted Gross margin as a percent of sales | 25.8 | % | 24.1 | % | |||||||
| Operating income - GAAP | 120.4 | 52.8 | |||||||||
| Special items in operating income (Attachment 3) | 2.4 | 9.7 | |||||||||
| Adjusted Operating income | $ | 122.8 | $ | 62.5 | |||||||
| Adjusted Operating income as a percent of sales | 10.6 | % | 8.8 | % | |||||||
The table below reconciles pre-special income tax expense and the pre-special effective tax rate to their most comparable US GAAP figures.
| Three Months Ended March 31, | |||||||||||||||||||||||||||||||||||
| 2021 | 2020 | ||||||||||||||||||||||||||||||||||
| GAAP Results | Special Items | Adjusted Results | GAAP Results | Special Items | Adjusted Results | ||||||||||||||||||||||||||||||
Income from continuing operations before income taxes | $ | 102.6 | $ | 2.4 | $ | 105.0 | $ | 45.0 | $ | 9.6 | $ | 54.6 | |||||||||||||||||||||||
| Income tax expense - GAAP | (22.9) | — | (22.9) | (11.9) | — | (11.9) | |||||||||||||||||||||||||||||
| Income tax impact of special items (Attachment 3) | — | (0.9) | (0.9) | — | (2.0) | (2.0) | |||||||||||||||||||||||||||||
| Tax adjustments (Attachment 3) | — | 1.1 | 1.1 | — | 1.0 | 1.0 | |||||||||||||||||||||||||||||
| Income tax (expense) benefit | $ | (22.9) | $ | 0.2 | $ | (22.7) | $ | (11.9) | $ | (1.0) | $ | (12.9) | |||||||||||||||||||||||
Effective Tax Rate(1) | 22.3 | % | 21.6 | % | 26.5 | % | 23.7 | % | |||||||||||||||||||||||||||
(1) Rates may not recalculate from figures presented herein due to rounding
13
The following pro forma adjustments are referenced by management to provide comparable business performance by incorporating the Clariant Masterbatch business in periods prior to the acquisition date (July 1, 2020). Financial information referenced here is provided to aid in reconciling back to the most comparable GAAP figures.
| Reconciliation of Pro Forma Adjusted Earnings per Share: | Three Months Ended March 31, 2020 | ||||
| Net income from continuing operations attributable to Avient shareholders | $ | 33.1 | |||
| Special items, after tax (Attachment 3) | 8.6 | ||||
| Adjusted net income from continuing operations excluding special items | 41.7 | ||||
Clariant MB pro forma adjustments to net income from continuing operations(2) | 7.8 | ||||
| Pro forma adjusted net income from continuing operations attributable to Avient shareholders | $ | 49.5 | |||
| Weighted average diluted shares | 86.7 | ||||
| Pro forma impact to diluted shares from January 2020 equity offering | 6.1 | ||||
| Pro forma weighted average diluted shares | 92.8 | ||||
| Adjusted EPS - excluding special items pro forma for Clariant MB acquisition | $ | 0.53 | |||
| Year Ended December 31, 2020 | |||||||||||||||||||||||||||||
| Reconciliation of Pro Forma Adjusted Earnings per Share: | Avient | Special Items | Adjusted Avient | Clariant MB Pro Forma Adjustments(2) | Pro Forma Adjusted Avient | ||||||||||||||||||||||||
| Sales | $ | 3,242.1 | $ | — | $ | 3,242.1 | $ | 540.4 | $ | 3,782.5 | |||||||||||||||||||
| Operating income | $ | 189.3 | $ | 73.7 | $ | 263.0 | $ | 45.0 | $ | 308.0 | |||||||||||||||||||
| Interest expense, net | (74.6) | 10.1 | (64.5) | (18.1) | (82.6) | ||||||||||||||||||||||||
| Other income, net | 24.3 | (17.6) | 6.7 | — | 6.7 | ||||||||||||||||||||||||
| Income taxes | (5.2) | (41.4) | (46.6) | (6.2) | (52.8) | ||||||||||||||||||||||||
| Net income attributable to noncontrolling interests | (1.8) | — | (1.8) | — | (1.8) | ||||||||||||||||||||||||
| Net income from continuing operations attributable to Avient shareholders | $ | 132.0 | $ | 24.8 | $ | 156.8 | $ | 20.7 | $ | 177.5 | |||||||||||||||||||
| Weighted average diluted shares | 90.6 | ||||||||||||||||||||||||||||
| Impact to diluted shares from January 2020 equity offering | 1.5 | ||||||||||||||||||||||||||||
| Pro forma weighted average diluted shares | 92.1 | ||||||||||||||||||||||||||||
| Pro forma adjusted EPS | $ | 1.93 | |||||||||||||||||||||||||||
(2) Pro forma adjustments for the periods prior to the acquisition date (July 1, 2020) and to give effects to the financing for the acquisition
14
| Year Ended December 31, 2019 | |||||||||||||||||||||||||||||
| Reconciliation of Pro Forma Adjusted Earnings per Share: | Avient | Special Items | Adjusted Avient | Clariant MB Pro Forma Adjustments(3) | Pro Forma Adjusted Avient | ||||||||||||||||||||||||
| Sales | $ | 2,862.7 | $ | — | $ | 2,862.7 | $ | 1,118.6 | $ | 3,981.3 | |||||||||||||||||||
| Operating income | $ | 156.8 | $ | 71.7 | $ | 228.5 | $ | 72.9 | $ | 301.4 | |||||||||||||||||||
| Interest expense, net | (59.5) | — | (59.5) | (33.4) | (92.9) | ||||||||||||||||||||||||
| Other income, net | 12.1 | (10.0) | 2.1 | — | 2.1 | ||||||||||||||||||||||||
| Income taxes | (33.7) | (5.9) | (39.6) | (9.1) | (48.7) | ||||||||||||||||||||||||
| Net income attributable to noncontrolling interests | (0.2) | — | (0.2) | — | (0.2) | ||||||||||||||||||||||||
| Net income from continuing operations attributable to Avient shareholders | $ | 75.5 | $ | 55.8 | $ | 131.3 | $ | 30.4 | $ | 161.7 | |||||||||||||||||||
| Weighted average diluted shares | 77.7 | ||||||||||||||||||||||||||||
| Impact to diluted shares from January 2020 equity offering | 15.3 | ||||||||||||||||||||||||||||
| Pro forma weighted average diluted shares | 93.0 | ||||||||||||||||||||||||||||
| Pro forma adjusted EPS | $ | 1.74 | |||||||||||||||||||||||||||
(3) Pro forma adjustments for the periods prior to the acquisition date (July 1, 2020) and to give effects to the financing for the acquisition
15
| Reconciliation of EBITDA by Segment | Three Months Ended March 31, | Year Ended December 31, | |||||||||||||||||||||||||||
| 2021 | 2020 | 2020 | 2019 | 2018 | |||||||||||||||||||||||||
| Operating income: | |||||||||||||||||||||||||||||
| Color, Additives and Inks | $ | 88.8 | $ | 40.5 | $ | 180.8 | $ | 147.4 | $ | 158.5 | |||||||||||||||||||
| Specialty Engineered Materials | 34.2 | 22.3 | 94.4 | 83.7 | 72.3 | ||||||||||||||||||||||||
| Distribution | 24.0 | 19.4 | 69.5 | 75.4 | 71.5 | ||||||||||||||||||||||||
| Corporate and eliminations | (26.6) | (29.4) | (155.4) | (149.7) | (123.7) | ||||||||||||||||||||||||
| Operating income | $ | 120.4 | $ | 52.8 | $ | 189.3 | $ | 156.8 | $ | 178.6 | |||||||||||||||||||
| Items below OI in Corporate: | |||||||||||||||||||||||||||||
| Other income, net | $ | 1.5 | $ | 1.6 | $ | 24.3 | $ | 12.1 | $ | (12.9) | |||||||||||||||||||
| Depreciation & amortization: | |||||||||||||||||||||||||||||
| Color, Additives and Inks | $ | 27.4 | $ | 10.9 | $ | 75.1 | $ | 42.7 | $ | 44.3 | |||||||||||||||||||
| Specialty Engineered Materials | 7.8 | 7.5 | 30.0 | 29.5 | 23.2 | ||||||||||||||||||||||||
| Distribution | 0.2 | 0.1 | 0.7 | 0.5 | 0.7 | ||||||||||||||||||||||||
| Corporate and eliminations | 1.7 | 1.4 | 9.2 | 5.4 | 4.4 | ||||||||||||||||||||||||
| Depreciation & Amortization | $ | 37.1 | $ | 19.9 | $ | 115.0 | $ | 78.1 | $ | 72.6 | |||||||||||||||||||
| EBITDA: | |||||||||||||||||||||||||||||
| Color, Additives and Inks | $ | 116.2 | $ | 51.4 | $ | 255.9 | $ | 190.1 | $ | 202.8 | |||||||||||||||||||
| Specialty Engineered Materials | 42.0 | 29.8 | 124.4 | 113.2 | 95.5 | ||||||||||||||||||||||||
| Distribution | 24.2 | 19.5 | 70.2 | 75.9 | 72.2 | ||||||||||||||||||||||||
| Corporate and eliminations | (24.9) | (28.0) | (146.2) | (144.3) | (119.3) | ||||||||||||||||||||||||
| EBITDA | $ | 159.0 | $ | 74.3 | $ | 328.6 | $ | 247.0 | $ | 238.3 | |||||||||||||||||||
| EBITDA as a % of Sales: | |||||||||||||||||||||||||||||
| Color, Additives and Inks | 19.1 | % | 20.0 | % | 17.0 | % | 18.9 | % | 19.4 | % | |||||||||||||||||||
| Specialty Engineered Materials | 19.4 | % | 16.1 | % | 17.6 | % | 15.2 | % | 14.8 | % | |||||||||||||||||||
| Distribution | 6.7 | % | 6.7 | % | 6.3 | % | 6.4 | % | 5.7 | % | |||||||||||||||||||
16
| Reconciliation of Pro Forma EBITDA - Color, Additives and Inks | Three Months Ended March 31, | Year Ended December 31, | |||||||||||||||||||||
| 2020 | 2020 | 2019 | 2018 | ||||||||||||||||||||
| Sales: | |||||||||||||||||||||||
| Color, Additives and Inks | $ | 256.5 | $ | 1,502.9 | $ | 1,003.8 | $ | 1,046.5 | |||||||||||||||
Clariant MB pro forma adjustments(4) | 279.4 | 540.4 | 1,118.6 | 1,209.8 | |||||||||||||||||||
| Pro forma sales | $ | 535.9 | $ | 2,043.3 | $ | 2,122.4 | $ | 2,256.3 | |||||||||||||||
| Operating income: | |||||||||||||||||||||||
| Color, Additives and Inks | $ | 40.5 | $ | 180.8 | $ | 147.4 | $ | 158.5 | |||||||||||||||
Clariant MB pro forma adjustments(4) | 23.0 | 45.0 | 72.9 | 80.3 | |||||||||||||||||||
| Pro forma operating income | $ | 63.5 | $ | 225.8 | $ | 220.3 | $ | 238.8 | |||||||||||||||
| Depreciation & amortization: | |||||||||||||||||||||||
| Color, Additives and Inks | $ | 10.9 | $ | 75.1 | $ | 42.7 | $ | 44.3 | |||||||||||||||
Clariant MB pro forma adjustments(4) | 15.1 | 30.1 | 60.3 | 61.2 | |||||||||||||||||||
| Pro forma depreciation & amortization | $ | 26.0 | $ | 105.2 | $ | 103.0 | $ | 105.5 | |||||||||||||||
Earnings Before Interest, Taxes, Depreciation and Amortization (EBITDA): | |||||||||||||||||||||||
| Color, Additives and Inks | $ | 51.4 | $ | 255.9 | $ | 190.1 | $ | 202.8 | |||||||||||||||
Clariant MB pro forma adjustments(4) | 38.1 | 75.1 | 133.2 | 141.5 | |||||||||||||||||||
| Pro forma EBITDA | $ | 89.5 | $ | 331.0 | $ | 323.3 | $ | 344.3 | |||||||||||||||
| Pro forma EBITDA as a % of Sales | 16.7 | % | 16.2 | % | 15.2 | % | 15.3 | % | |||||||||||||||
| Three Months Ended March 31, | Year Ended December 31, | ||||||||||||||||||||||||||||
| Reconciliation to Adjusted EBITDA: | 2021 | 2020 | 2020 | 2019 | 2018 | ||||||||||||||||||||||||
| Net income from continuing operations – GAAP | $ | 79.7 | $ | 33.1 | $ | 133.8 | $ | 75.7 | $ | 87.4 | |||||||||||||||||||
| Income tax expense | 22.9 | 11.9 | 5.2 | 33.7 | 14.4 | ||||||||||||||||||||||||
| Interest expense | 19.3 | 9.4 | 74.6 | 59.5 | 62.8 | ||||||||||||||||||||||||
| Debt extinguishment cost | — | — | 1.1 | ||||||||||||||||||||||||||
| Depreciation and amortization from continuing operations | 37.1 | 19.9 | 115.0 | 78.1 | 72.6 | ||||||||||||||||||||||||
| EBITDA | $ | 159.0 | $ | 74.3 | $ | 328.6 | $ | 247.0 | $ | 238.3 | |||||||||||||||||||
| Special items, before tax | 2.4 | 9.6 | 66.2 | 61.7 | 59.5 | ||||||||||||||||||||||||
| Interest expense included in special items | — | — | (10.1) | — | — | ||||||||||||||||||||||||
| Accelerated depreciation included in special items | (0.5) | — | (3.2) | — | (3.0) | ||||||||||||||||||||||||
| Adjusted EBITDA | $ | 160.9 | $ | 83.9 | $ | 381.6 | $ | 308.7 | $ | 294.8 | |||||||||||||||||||
| Reconciliation of Pro Forma Sales: | Three Months Ended March 31, 2020 | ||||
| Sales | $ | 711.5 | |||
Clariant MB pro forma adjustment to sales(4) | 279.4 | ||||
| Pro forma sales | $ | 990.9 | |||
(4) Pro forma adjustments for the periods prior to the acquisition date (July 1, 2020)
17