Attached files
| file | filename |
|---|---|
| 8-K - FORM 8-K - REALTY INCOME CORP | tm2114533d1_8k.htm |
| EX-99.1 - EXHIBIT 99.1 - REALTY INCOME CORP | tm2114533d1_ex99-1.htm |
Exhibit 99.2
 |
Realty Income to Combine With VEREIT Further Distancing Itself as the Preeminent Net Lease REIT April 29, 2021 |
 |
Forward-Looking Statements This communication may include “forward-looking statements” within the meaning of the Private Securities Litigation Reform Act. All statements other than statements of historical fact are “forward-looking statements” for purposes of federal and state securities laws. These forward-looking statements, which are based on current expectations, estimates and projections about the industry and markets in which Realty Income Corporation (“Realty Income”) and VEREIT, Inc. (“VEREIT”) operate and beliefs of and assumptions made by Realty Income management and VEREIT management, involve uncertainties that could significantly affect the financial or operating results of Realty Income, VEREIT, the combined company or any company spun-off by the combined company. Words such as “expects,” “anticipates,” “intends,” “plans,” “believes,” “seeks,” “estimates,” “will,” and variations of such words and similar expressions are intended to identify such forward-looking statements. Such forward-looking statements include, but are not limited to, statements about the benefits of the proposed transactions involving Realty Income and VEREIT, including future financial and operating results, plans, objectives, expectations and intentions. All statements that address operating performance, events or developments that we expect or anticipate will occur in the future — including statements relating to creating value for stockholders, benefits of the proposed transactions to clients, employees, stockholders and other constituents of the combined company, integrating our companies, cost savings and the expected timetable for completing the proposed transactions — are forward-looking statements. These statements are not guarantees of future performance and involve certain risks, uncertainties and assumptions that are difficult to predict. Although we believe the expectations reflected in any forward-looking statements are based on reasonable assumptions, we can give no assurance that our expectations will be attained and, therefore, actual outcomes and results may differ materially from what is expressed or forecasted in such forward-looking statements. For example, these forward-looking statements could be affected by factors including, without limitation, risks associated with the ability to consummate the proposed merger and the timing of the closing of the proposed merger; the ability to secure favorable interest rates on any borrowings incurred in connection with the proposed transactions; the impact of indebtedness incurred in connection with the proposed transactions; the ability to successfully integrate our operations and employees; the ability to realize anticipated benefits and synergies of the proposed transactions as rapidly or to the extent anticipated by financial analysts or investors; the potential liability for a failure to meet regulatory or tax-related requirements, including the maintenance of REIT status; material changes in the dividend rates on securities or the ability to pay dividends on common shares or other securities; potential changes to tax legislation; changes in demand for developed properties; adverse changes in the financial condition of joint venture partner(s) or major tenants; risks associated with the acquisition, development, expansion, leasing and management of properties; risks associated with the ability to consummate the proposed spin-off of a company holding the office property assets of Realty Income and VEREIT (“SpinCo”) and the terms thereof, and the timing of the closing of the proposed spin-off; the risks associated with the ability to list the common stock of SpinCo on a national stock exchange following the proposed spin-off; risks associated with the ability to consummate any sales of the office property assets of Realty Income and VEREIT and the impact of such sales on SpinCo or the combined company; risks associated with the ability to consummate the spin-off on terms contemplated by Realty Income and VEREIT; the failure to obtain debt financing to capitalize SpinCo, risks associated with the geographic concentration of Realty Income, VEREIT or SpinCo; risks associated with the industry concentration of tenants; the potential impact of announcement of the proposed transactions or consummation of the proposed transactions on relationships, including with clients, employees, customers and competitors; the unfavorable outcome of any legal proceedings that have been or may be instituted against Realty Income, VEREIT or any company spun-off by the combined company; significant costs related to uninsured losses, condemnation, or environmental issues; the ability to retain key personnel; the amount of the costs, fees, expenses and charges related to the proposed transactions and the actual terms of the financings that may be obtained in connection with the proposed transactions; changes in local, national and international financial market, insurance rates and interest rates; general adverse economic and local real estate conditions; the inability of major tenants to continue paying their rent obligations due to bankruptcy, insolvency or a general downturn in their business; foreign currency exchange rates; increases in operating costs and real estate taxes; changes in the dividend policy for Realty Income’s or VEREIT’s common stock or preferred stock or Realty Income’s or VEREIT’s ability to pay dividends; impairment charges; unanticipated changes in Realty Income’s or VEREIT’s intention or ability to prepay certain debt prior to maturity and/or hold certain securities until maturity; pandemics or other health crises, such as coronavirus (COVID-19); and those additional risks and factors discussed in reports filed with the U.S. Securities and Exchange Commission (“SEC”) by Realty Income and VEREIT. Moreover, other risks and uncertainties of which Realty Income or VEREIT are not currently aware may also affect each of the companies’ forward-looking statements and may cause actual results and the timing of events to differ materially from those anticipated. The forward-looking statements made in this communication are made only as of the date hereof or as of the dates indicated in the forward-looking statements, even if they are subsequently made available by Realty Income or VEREIT on their respective websites or otherwise. Neither Realty Income nor VEREIT undertakes any obligation to update or supplement any forward-looking statements to reflect actual results, new information, future events, changes in its expectations or other circumstances that exist after the date as of which the forward-looking statements were made. No Offer or Solicitation This communication and the information contained herein shall not constitute an offer to sell or the solicitation of an offer to buy any securities, nor shall there be any sale of securities in any jurisdiction in which such offer, solicitation or sale would be unlawful prior to registration or qualification under the securities laws of any such jurisdiction. No offering of securities shall be made except by means of a prospectus meeting the requirements of Section 10 of the U.S. Securities Act of 1933, as amended. 2 |
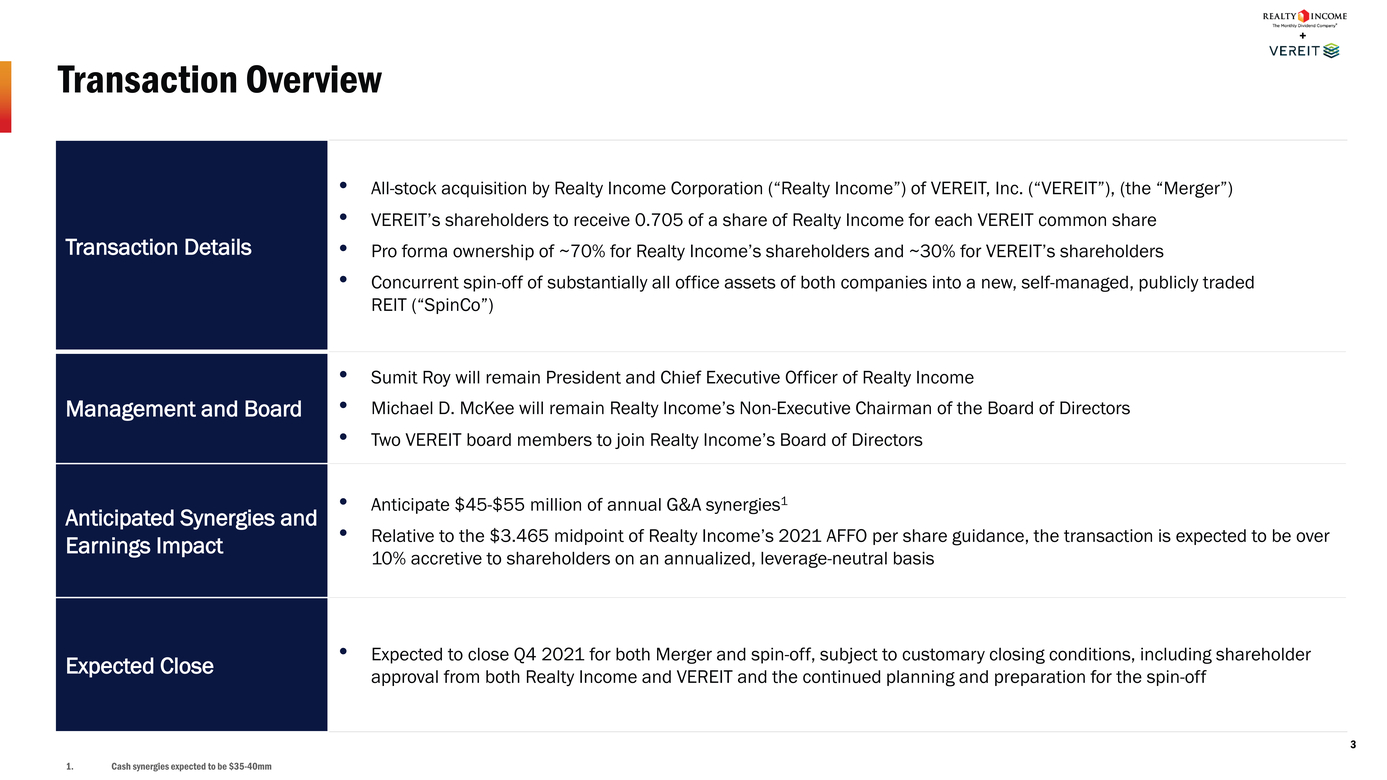 |
Transaction Overview 3 1.Cash synergies expected to be $35-40mm |
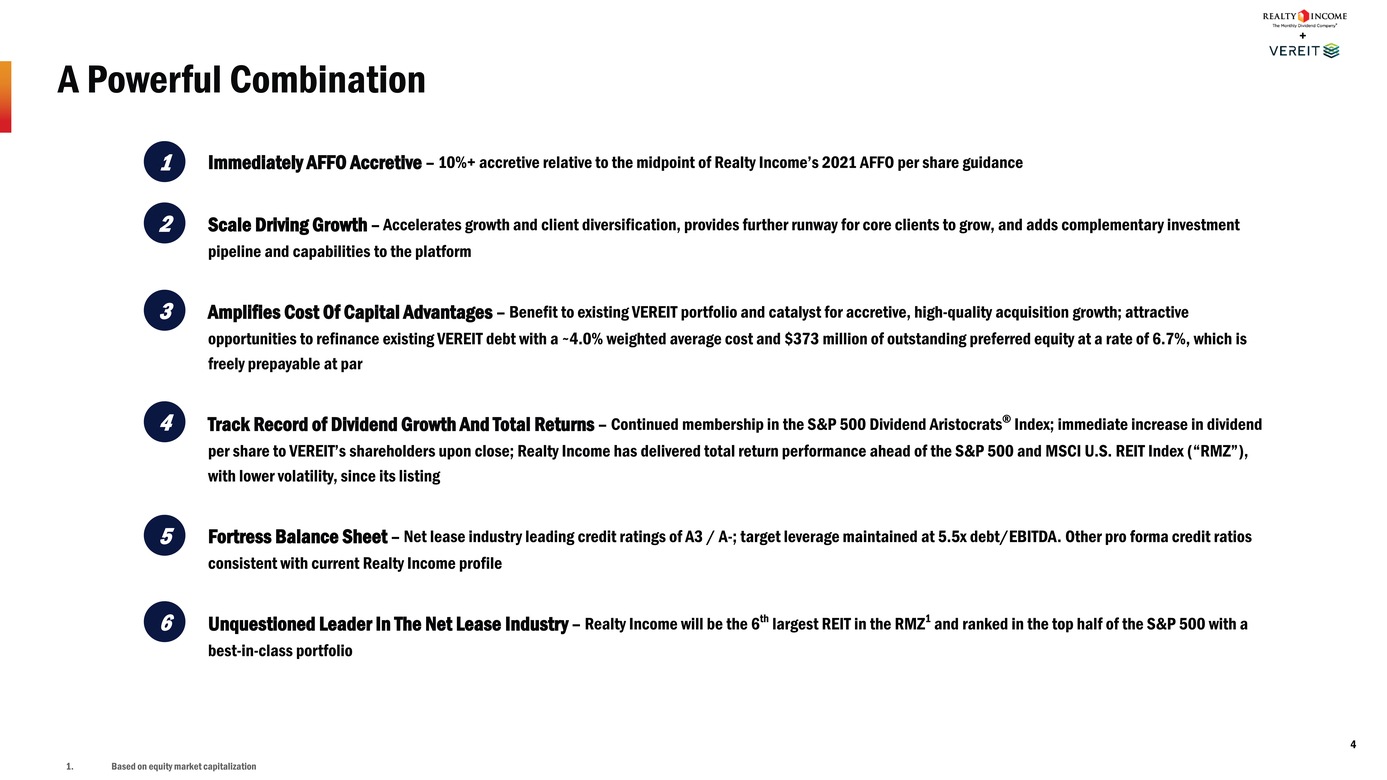 |
A Powerful Combination •1Immediately AFFO Accretive – 10%+ accretive relative to the midpoint of Realty Income’s 2021 AFFO per share guidance •2Scale Driving Growth – Accelerates growth and client diversification, provides further runway for core clients to grow, and adds complementary investment pipeline and capabilities to the platform •3Amplifies Cost Of Capital Advantages – Benefit to existing VEREIT portfolio and catalyst for accretive, high-quality acquisition growth; attractive opportunities to refinance existing VEREIT debt with a ~4.0% weighted average cost and $373 million of outstanding preferred equity at a rate of 6.7%, which is freely prepayable at par •4Track Record of Dividend Growth And Total Returns – Continued membership in the S&P 500 Dividend Aristocrats® Index; immediate increase in dividend per share to VEREIT’s shareholders upon close; Realty Income has delivered total return performance ahead of the S&P 500 and MSCI U.S. REIT Index (“RMZ”), with lower volatility, since its listing •5Fortress Balance Sheet – Net lease industry leading credit ratings of A3 / A-; target leverage maintained at 5.5x debt/EBITDA. Other pro forma credit ratios consistent with current Realty Income profile •6Unquestioned Leader In The Net Lease Industry – Realty Income will be the 6th largest REIT in the RMZ1 and ranked in the top half of the S&P 500 with a best-in-class portfolio 4 Based on equity market capitalization |
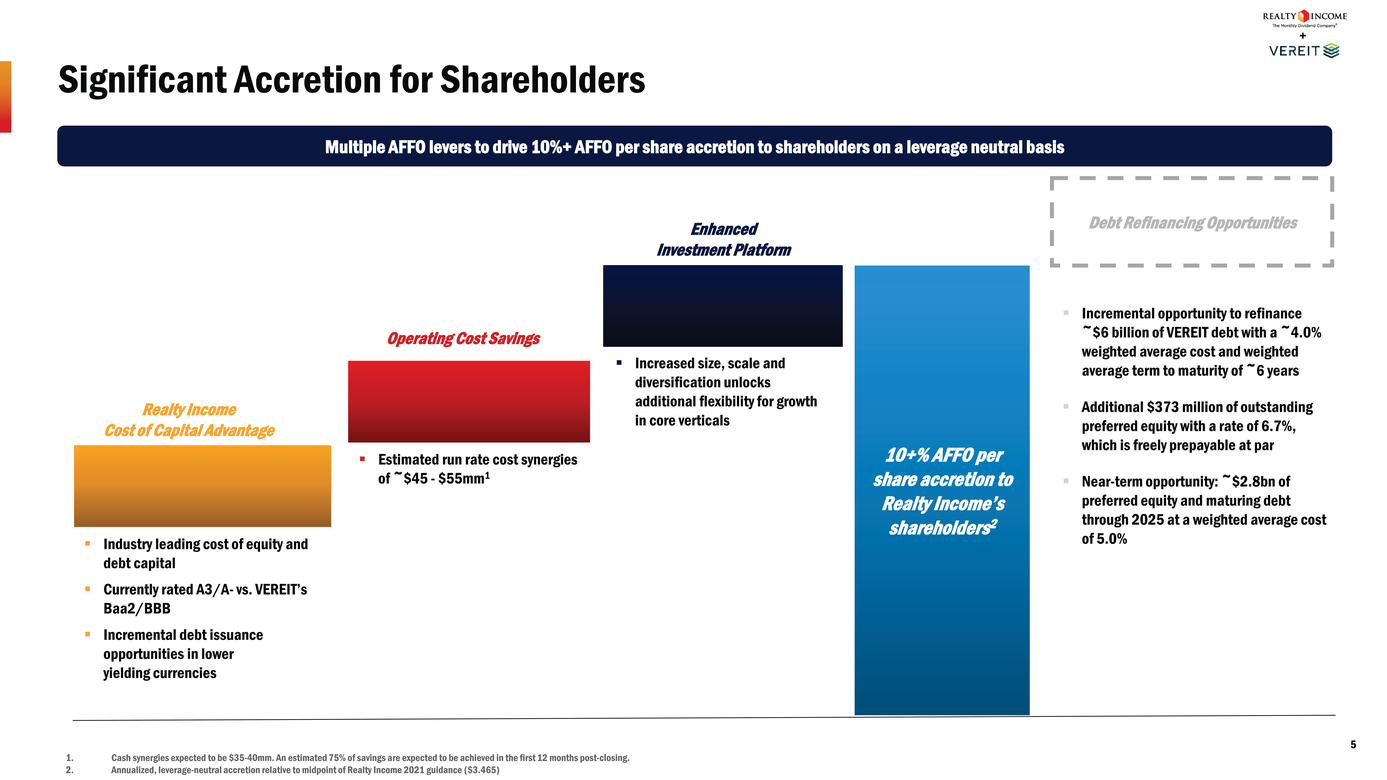 |
Significant Accretion for Shareholders Multiple AFFO levers to drive 10%+ AFFO per share accretion to shareholders on a leverage neutral basis Enhanced Investment Platform Debt Refinancing Opportunities Realty Income Cost of Capital Advantage Industry leading cost of equity and debt capital Currently rated A3/A-vs. VEREIT’s Baa2/BBB Incremental debt issuance opportunities in lower yielding currencies Operating Cost Savings Estimated run rate cost synergies of ~$45 - $55mm1 Increased size, scale and diversification unlocks additional flexibility for growth in core verticals 10+% AFFO per share accretion to Realty Income’s shareholders2 Incremental opportunity to refinance ~$6 billion of VEREIT debt with a ~4.0% weighted average cost and weighted average term to maturity of ~6 years Additional $373 million of outstanding preferred equity with a rate of 6.7%, which is freely prepayable at par Near-term opportunity: ~$2.8bn of preferred equity and maturing debt through 2025 at a weighted average cost of 5.0% 5 Cash synergies expected to be $35-40mm. An estimated 75% of savings are expected to be achieved in the first 12 months post-closing. Annualized, leverage-neutral accretion relative to midpoint of Realty Income 2021 guidance ($3.465) |
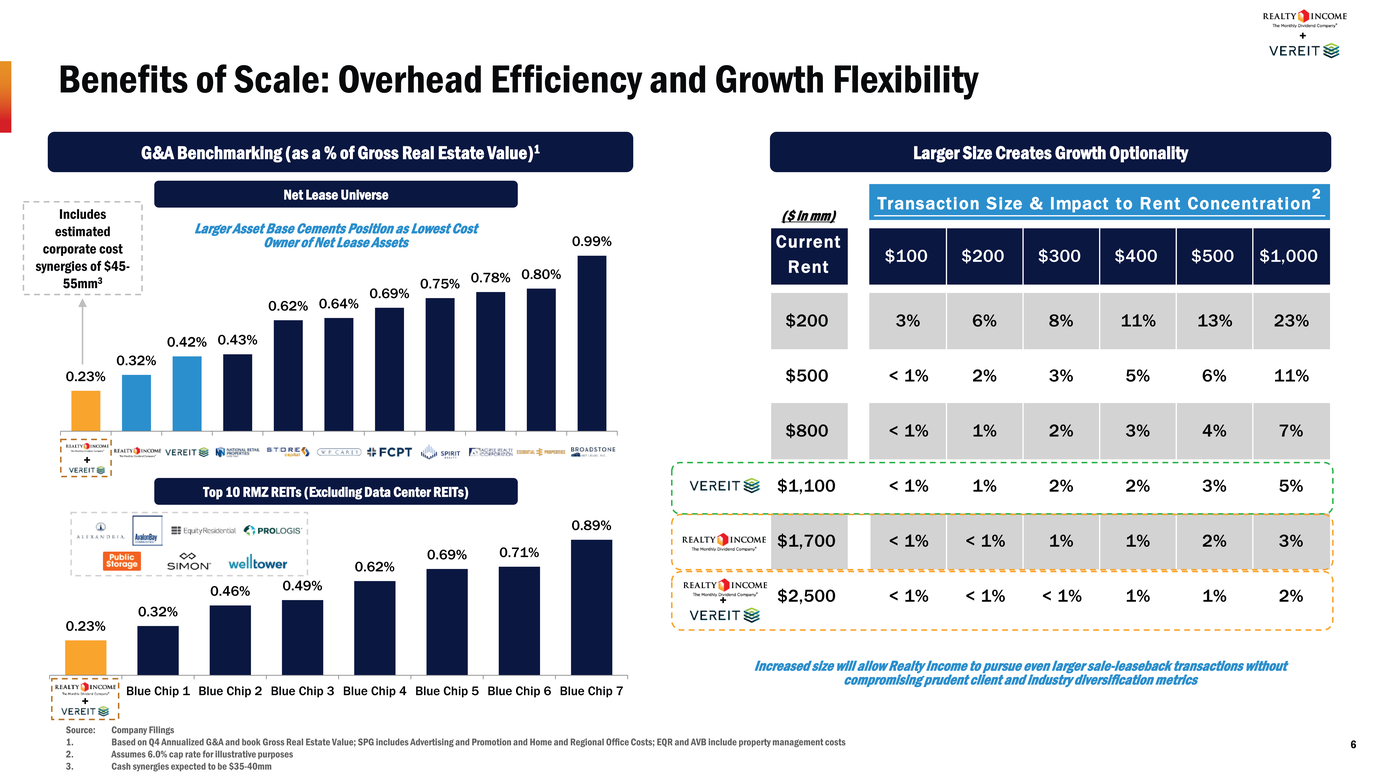 |
Benefits of Scale: Overhead Efficiency and Growth Flexibility Includes estimated corporate cost synergies of $45-55mm3 G&A Benchmarking (as a % of Gross Real Estate Value)1 Net Lease Universe Larger Asset Base Cements Position as Lowest Cost Owner of Net Lease Assets 0.75% 0.78% 0.80% 0.69% 0.99% 3% 6% 8% 11% 13% 23% $500 < 1% 2% 3% 5% 6% 11% $800 < 1% 1% 2% 3% 4% 7% $1,100 < 1% 1% 2% 2% 3% 5% $1,700 < 1% < 1% 1% 1% 2% 3% + $2,500 < 1% < 1% < 1% 1% 1% 2% Larger Size Creates Growth Optionality $100 $200 $300 $400 $500 $1,000 0.23% 0.32% 0.42% 0.43% 0.62% 0.64% $200 + Top 10 RMZ REITs (Excluding Data Center REITs) 0.23% 0.32% 0.46%0.49% 0.62% 0.71% 0.89% Blue Chip 1 Blue Chip 2 Blue Chip 3 Blue Chip 4 Blue Chip 5 Blue Chip 6 Blue Chip 7 + Increased size will allow Realty Income to pursue even larger sale-leaseback transactions without compromising prudent client and industry diversification metrics Source:Company Filings Based on Q4 Annualized G&A and book Gross Real Estate Value; SPG includes Advertising and Promotion and Home and Regional Office Costs; EQR and AVB include property management costs6 Assumes 6.0% cap rate for illustrative purposes Cash synergies expected to be $35-40mm |
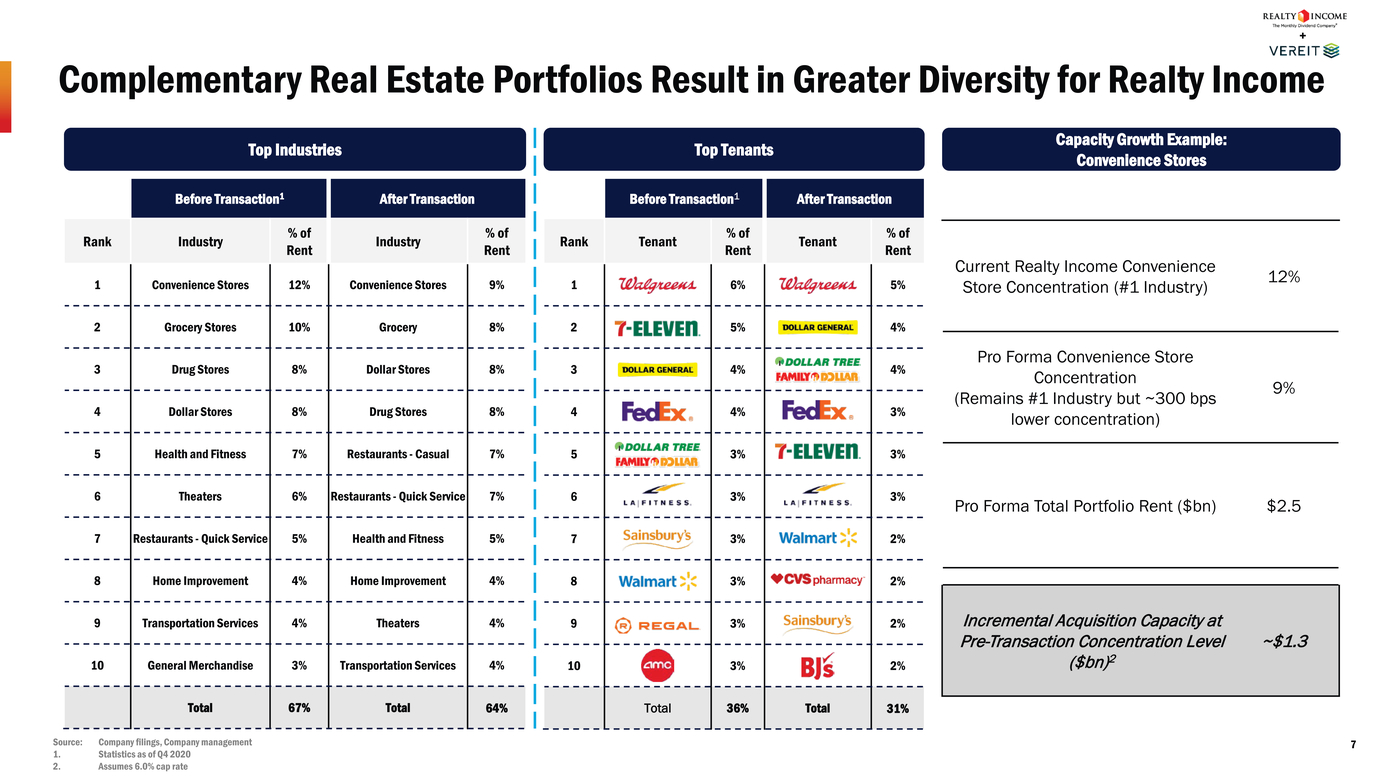 |
Complementary Real Estate Portfolios Result in Greater Diversity for Realty Income Top IndustriesTop Tenants Capacity Growth Example: Convenience Stores Before Transaction1 After Transaction Rank Tenant % of Rent Tenant % of Rent 1 6% 5% 2 5% 4% 3 4% 4% 4 4% 3% 5 3% 3% 6 3% 3% 7 3% 2% 8 3% 2% 9 3% 2% 10 3% 2% Total 36% Total 31% Current Realty Income Convenience Store Concentration (#1 Industry) 12% Pro Forma Convenience Store Concentration (Remains #1 Industry but ~300 bps lower concentration) 9% Pro Forma Total Portfolio Rent ($bn) $2.5 Incremental Acquisition Capacity at Pre-Transaction Concentration Level ($bn)2 ~$1.3 Statistics as of Q4 2020 Assumes 6.0% cap rate |
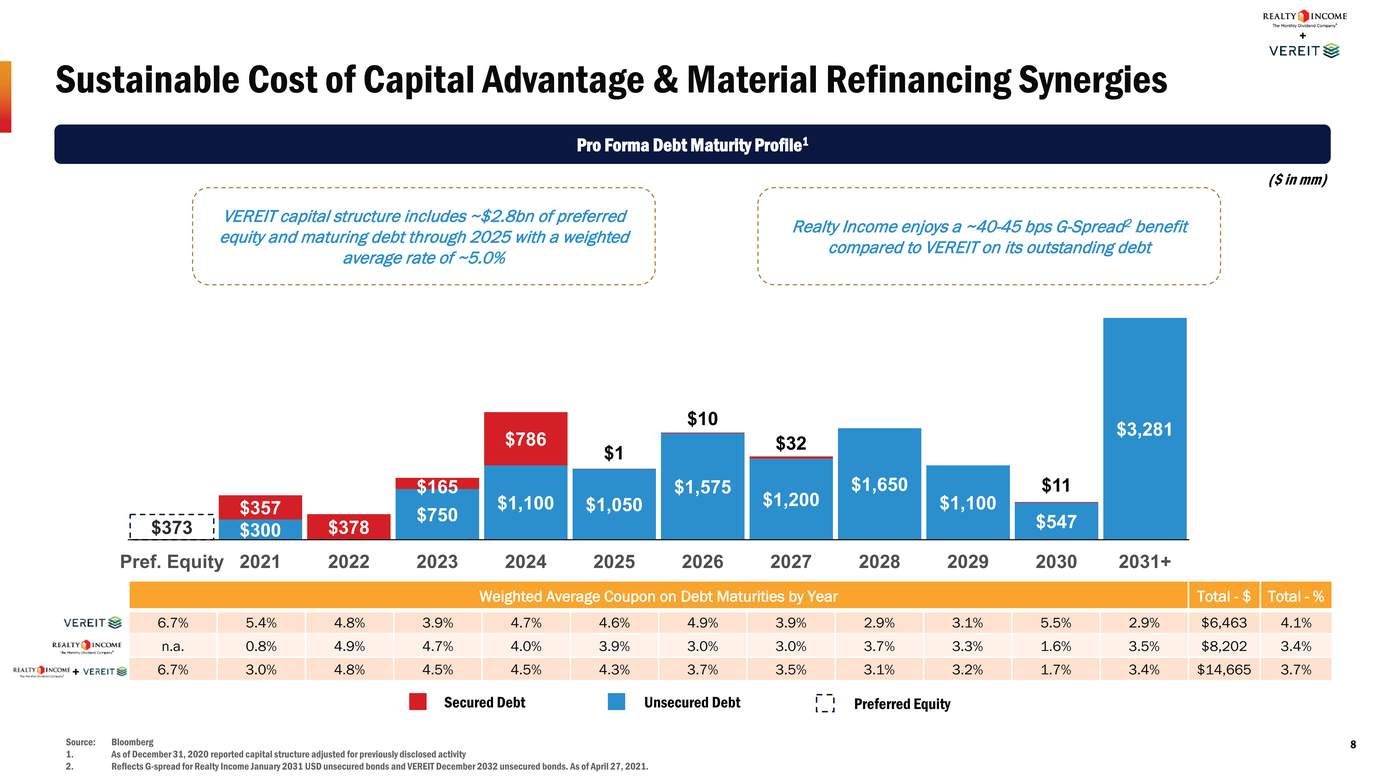 |
Sustainable Cost of Capital Advantage & Material Refinancing Synergies Pro Forma Debt Maturity Profile1 ($ in mm) VEREIT capital structure includes ~$2.8bn of preferred equity and maturing debt through 2025 with a weighted average rate of ~5.0% Realty Income enjoys a ~40-45 bps G-Spread2 benefit compared to VEREIT on its outstanding debt $165 $786 $10 $1 $1,575 $32 $1,650 $11 $3,281 $373 $357 $300 $378 $750$1,100$1,050 $1,200 $1,100 $547 Pref. Equity20212022202320242025202620272028202920302031+ Weighted Average Coupon on Debt Maturities by Year Total - $ Total - % 6.7% 5.4% 4.8% 3.9% 4.7% 4.6% 4.9% 3.9% 2.9% 3.1% 5.5% 2.9% $6,463 4.1% n.a. 0.8% 4.9% 4.7% 4.0% 3.9% 3.0% 3.0% 3.7% 3.3% 1.6% 3.5% $8,202 3.4% 6.7% 3.0% 4.8% 4.5% 4.5% 4.3% 3.7% 3.5% 3.1% 3.2% 1.7% 3.4% $14,665 3.7% Secured Debt Unsecured Debt Preferred Equity Source:Bloomberg8 As of December 31, 2020 reported capital structure adjusted for previously disclosed activity Reflects G-spread for Realty Income January 2031 USD unsecured bonds and VEREIT December 2032 unsecured bonds. As of April 27, 2021. |
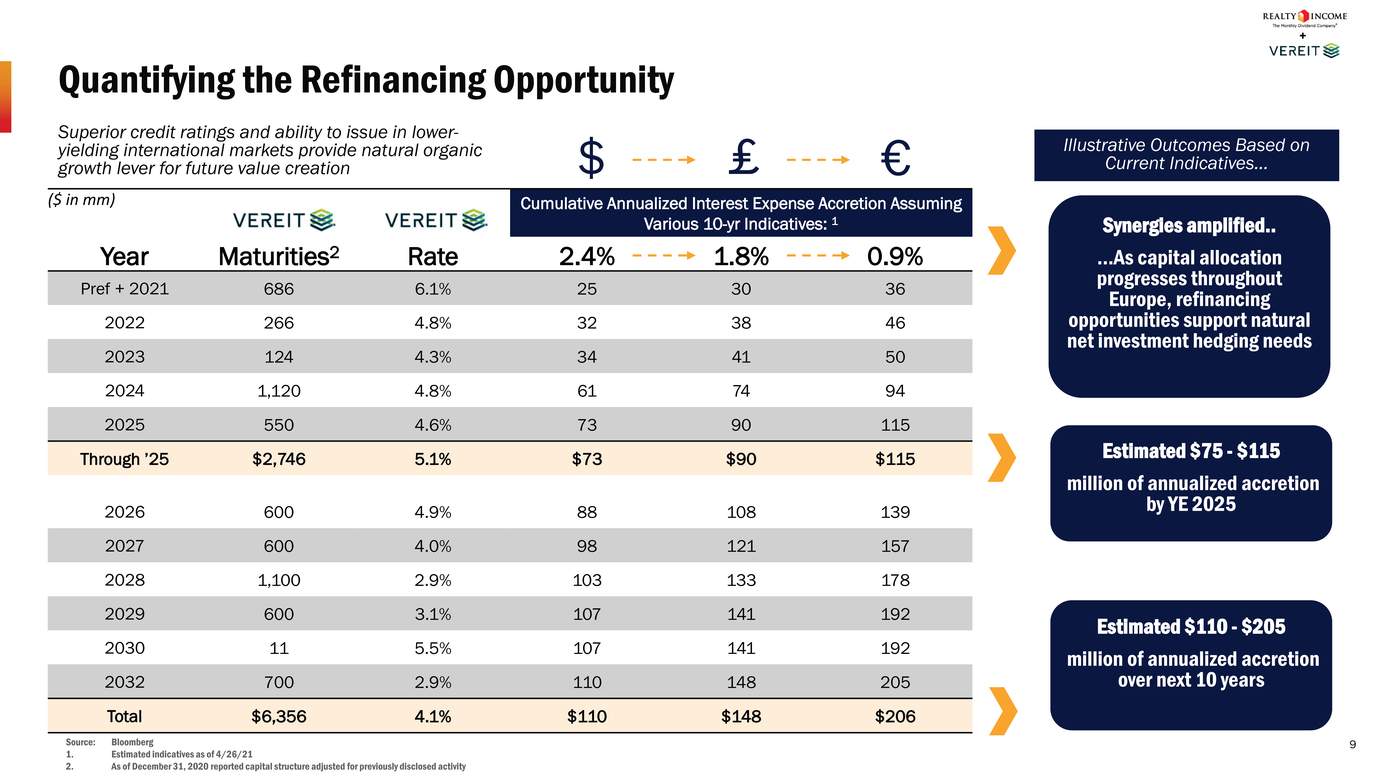 |
Quantifying the Refinancing Opportunity $ ₤€ Illustrative Outcomes Based on Current Indicatives… Synergies amplified.. …As capital allocation progresses throughout Europe, refinancing opportunities support natural net investment hedging needs ($ in mm) Cumulative Annualized Interest Expense Accretion Assuming Various 10-yr Indicatives: 1 Year Maturities2 Rate 2.4% 1.8% 0.9% Pref + 2021 686 6.1% 25 30 36 2022 266 4.8% 32 38 46 2023 124 4.3% 34 41 50 2024 1,120 4.8% 61 74 94 2025 550 4.6% 73 90 115 Through ’25 $2,746 5.1% $73 $90 $115 2026 600 4.9% 88 108 139 2027 600 4.0% 98 121 157 2028 1,100 2.9% 103 133 178 2029 600 3.1% 107 141 192 2030 11 5.5% 107 141 192 2032 700 2.9% 110 148 205 Total $6,356 4.1% $110 $148 $206 million of annualized accretion by YE 2025 Estimated $110 - $205 million of annualized accretion over next 10 years Source:Bloomberg9 Estimated indicatives as of 4/26/21 As of December 31, 2020 reported capital structure adjusted for previously disclosed activity |
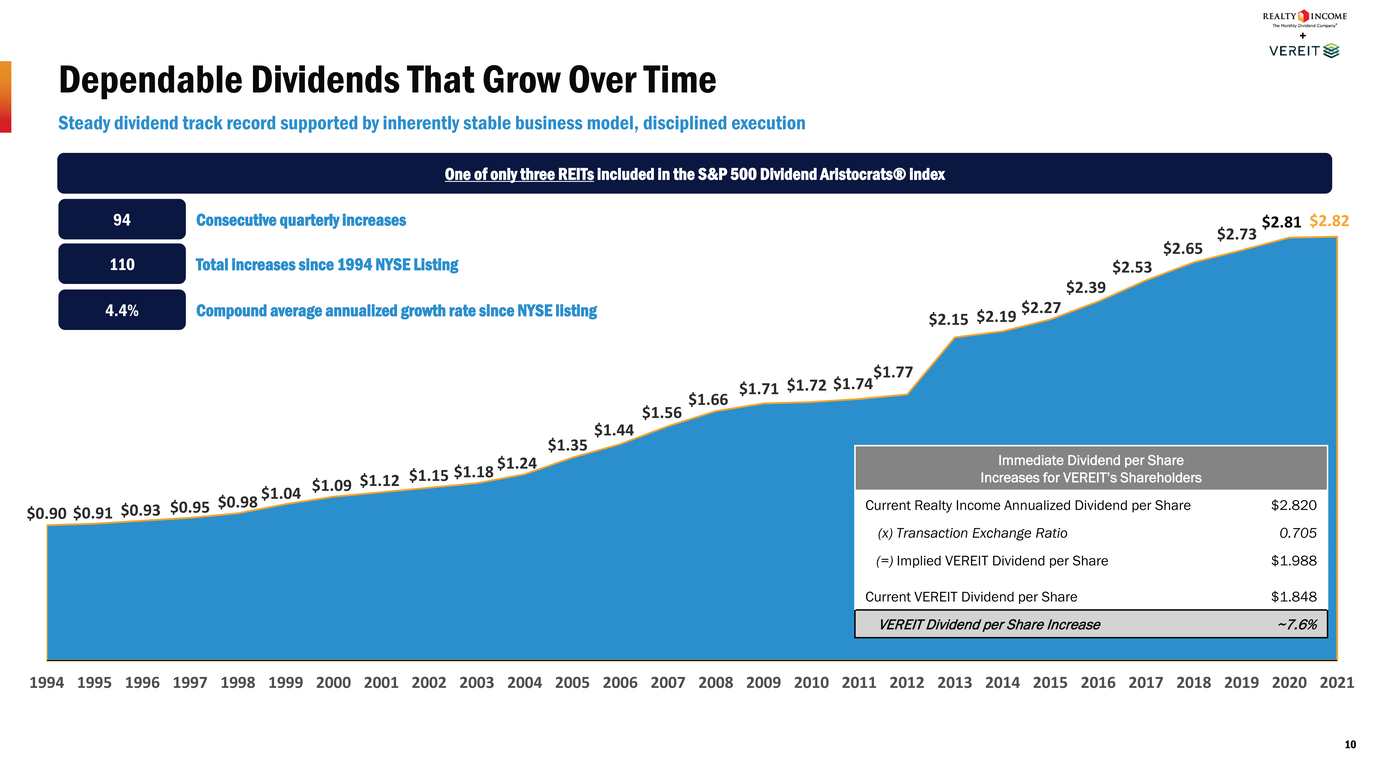 |
Dependable Dividends That Grow Over Time Steady dividend track record supported by inherently stable business model, disciplined execution One of only three REITs included in the S&P 500 Dividend Aristocrats® index 94Consecutive quarterly increases 110Total increases since 1994 NYSE Listing 4.4%Compound average annualized growth rate since NYSE listing $2.15 $2.19 $2.27 $2.39 $2.53 $2.65 $2.73 $2.81 $2.82 $0.90 $0.91 $0.93 $0.95 $0.98 $1.04 $1.09 $1.12 $1.15 $1.18 $1.24 $1.35 Immediate Dividend per Share Increases for VEREIT’s Shareholders Current Realty Income Annualized Dividend per Share $2.820 (x) Transaction Exchange Ratio 0.705 (=) Implied VEREIT Dividend per Share $1.988 Current VEREIT Dividend per Share $1.848 VEREIT Dividend per Share Increase ~7.6% $1.56 $1.66 $1.71 $1.72 $1.74 $1.77 1994 1995 1996 1997 1998 1999 2000 2001 2002 2003 2004 2005 2006 2007 2008 2009 2010 2011 2012 2013 2014 2015 2016 2017 2018 2019 2020 2021 10 |
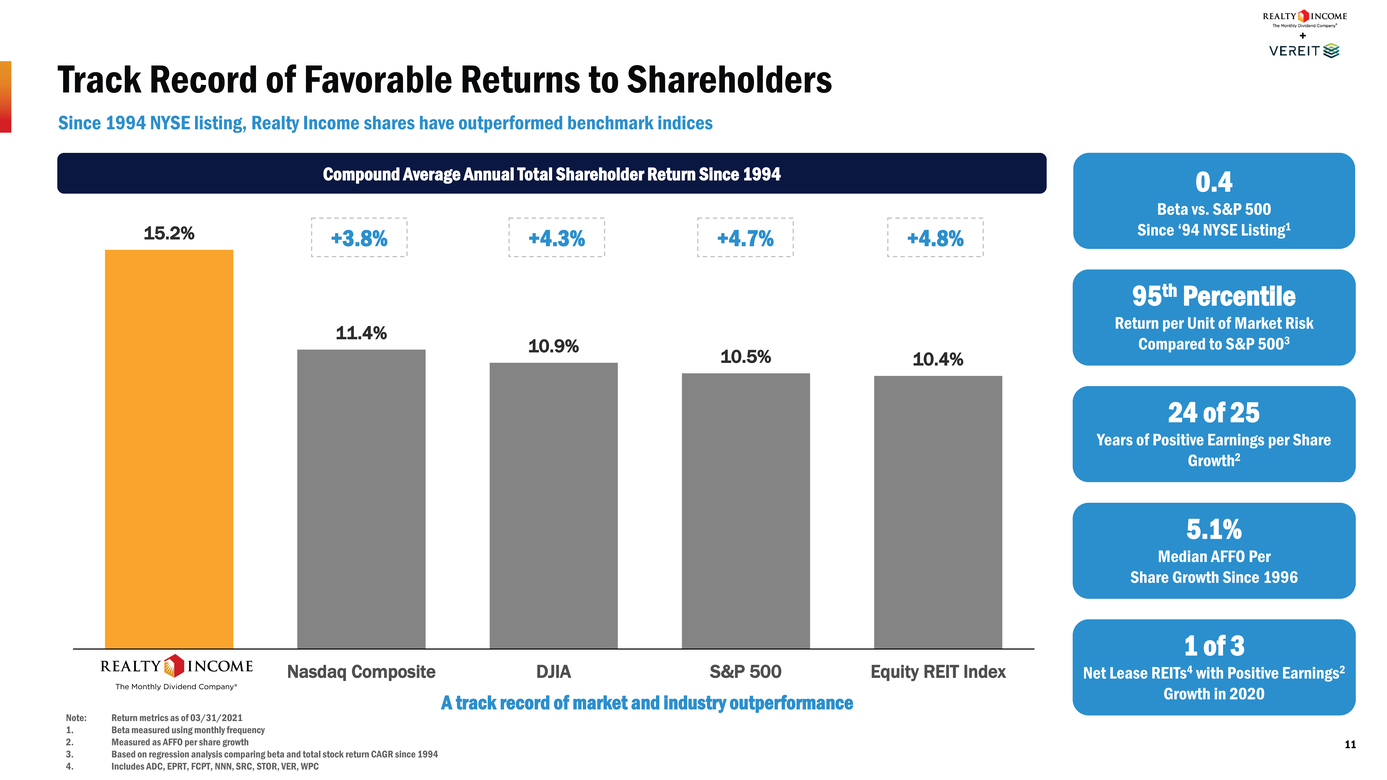 |
Track Record of Favorable Returns to Shareholders Since 1994 NYSE listing, Realty Income shares have outperformed benchmark indices Compound Average Annual Total Shareholder Return Since 1994 0.4 Beta vs. S&P 500 15.2% +3.8% +4.3% +4.7% +4.8% Since ‘94 NYSE Listing1 11.4% 10.9%10.5%10.4% 95th Percentile Return per Unit of Market Risk Compared to S&P 5003 24 of 25 Years of Positive Earnings per Share Growth2 5.1% Median AFFO Per Share Growth Since 1996 Note:Return metrics as of 03/31/2021 Beta measured using monthly frequency Measured as AFFO per share growth Nasdaq CompositeDJIAS&P 500Equity REIT Index A track record of market and industry outperformance 1 of 3 Net Lease REITs4 with Positive Earnings2 Growth in 2020 11 Based on regression analysis comparing beta and total stock return CAGR since 1994 Includes ADC, EPRT, FCPT, NNN, SRC, STOR, VER, WPC |
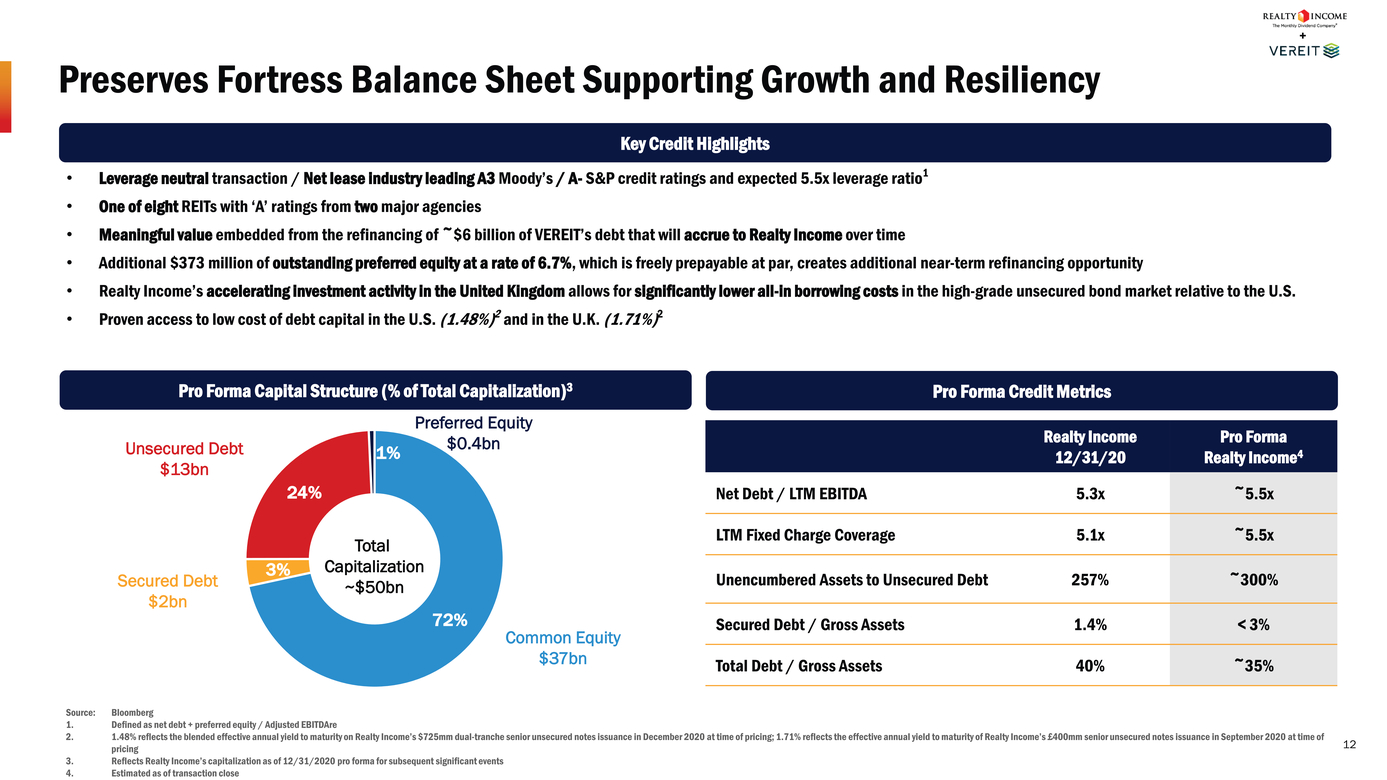 |
Preserves Fortress Balance Sheet Supporting Growth and Resiliency Key Credit Highlights Leverage neutral transaction / Net lease industry leading A3 Moody’s / A-S&P credit ratings and expected 5.5x leverage ratio1 One of eight REITs with ‘A’ ratings from two major agencies Meaningful value embedded from the refinancing of ~$6 billion of VEREIT’s debt that will accrue to Realty Income over time Additional $373 million of outstanding preferred equity at a rate of 6.7%, which is freely prepayable at par, creates additional near-term refinancing opportunity Realty Income’s accelerating investment activity in the United Kingdom allows for significantly lower all-in borrowing costs in the high-grade unsecured bond market relative to the U.S. Proven access to low cost of debt capital in the U.S. (1.48%)2 and in the U.K. (1.71%)2 Pro Forma Capital Structure (% of Total Capitalization)3Pro Forma Credit Metrics Realty Income 12/31/20 Pro Forma Realty Income4 Net Debt / LTM EBITDA 5.3x ~5.5x LTM Fixed Charge Coverage 5.1x ~5.5x Unencumbered Assets to Unsecured Debt 257% ~300% Secured Debt / Gross Assets 1.4% < 3% Total Debt / Gross Assets 40% ~35% Unsecured Debt $13bn Secured Debt $2bn 24% 3% 1% Total Capitalization ~$50bn $0.4bn 72% Common Equity $37bn Source:Bloomberg Defined as net debt + preferred equity / Adjusted EBITDAre 1.48% reflects the blended effective annual yield to maturity on Realty Income’s $725mm dual-tranche senior unsecured notes issuance in December 2020 at time of pricing; 1.71% reflects the effective annual yield to maturity of Realty Income’s £400mm senior unsecured notes issuance in September 2020 at time of pricing 12 Reflects Realty Income’s capitalization as of 12/31/2020 pro forma for subsequent significant events Estimated as of transaction close |
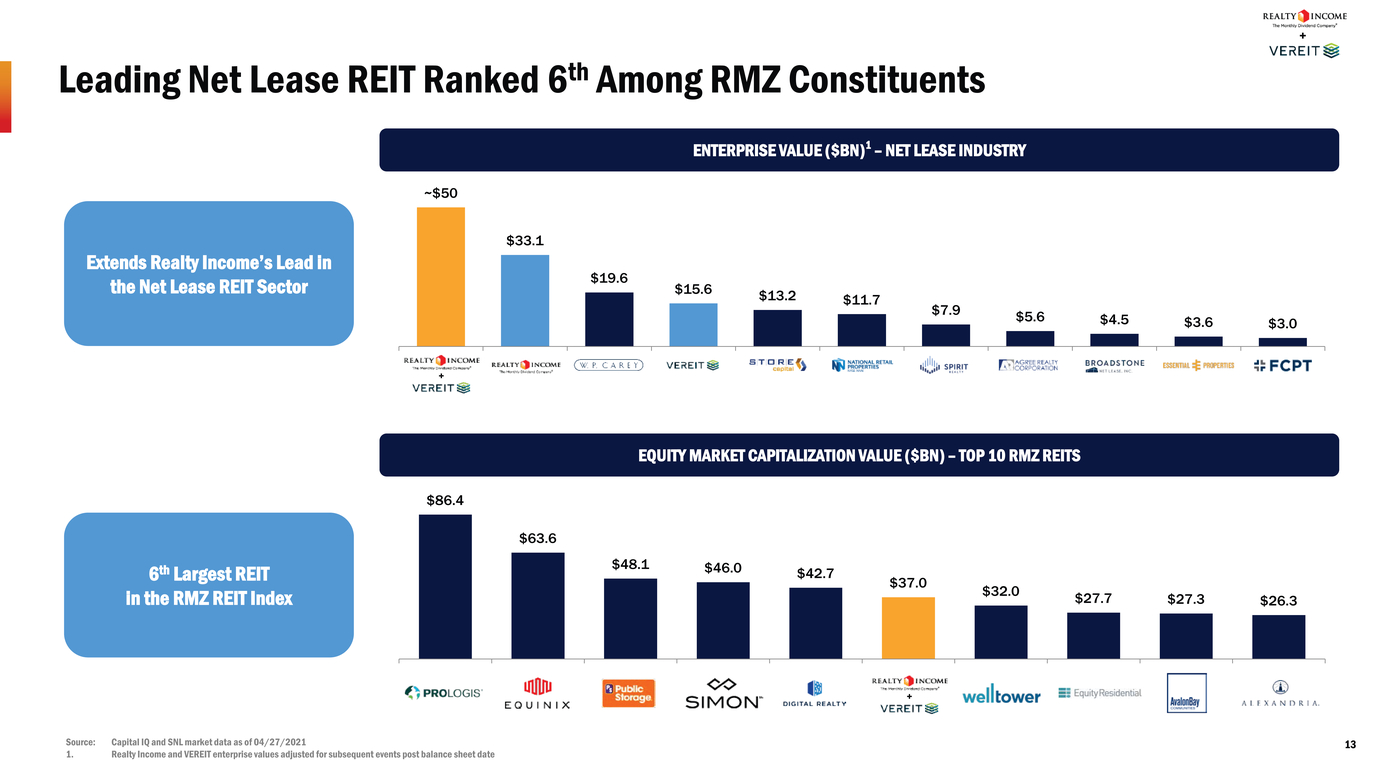 |
Leading Net Lease REIT Ranked 6th Among RMZ Constituents ENTERPRISE VALUE ($BN)1 – NET LEASE INDUSTRY ~$50 Extends Realty Income’s Lead in the Net Lease REIT Sector $33.1 + $19.6 $15.6$13.2$11.7 $7.9$5.6$4.5$3.6$3.0 EQUITY MARKET CAPITALIZATION VALUE ($BN) – TOP 10 RMZ REITS $86.4 6th Largest REIT in the RMZ REIT Index $63.6 $48.1$46.0$42.7 $37.0$32.0 $27.7$27.3$26.3 + Source:Capital IQ and SNL market data as of 04/27/202113 1.Realty Income and VEREIT enterprise values adjusted for subsequent events post balance sheet date |
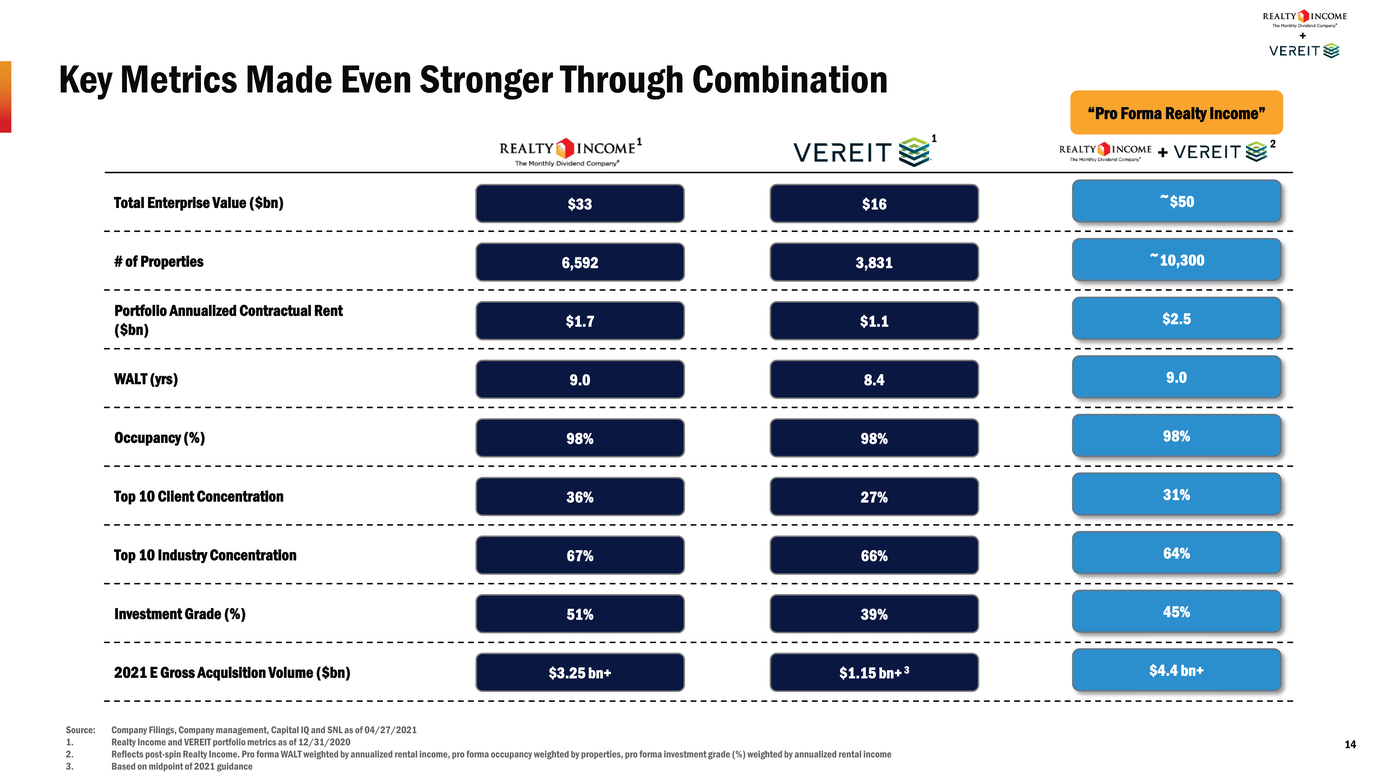 |
Key Metrics Made Even Stronger Through Combination 11 “Pro Forma Realty Income” +2 Total Enterprise Value ($bn) # of Properties Portfolio Annualized Contractual Rent ($bn) WALT (yrs) Occupancy (%) Top 10 Client Concentration Top 10 Industry Concentration Investment Grade (%) 2021 E Gross Acquisition Volume ($bn) $33$16 6,5923,831 $1.7$1.1 9.08.4 98%98% 36%27% 67%66% 51%39% $3.25 bn+$1.15 bn+ 3 ~$50 ~10,300 $2.5 9.0 98% 31% 64% 45% $4.4 bn+ Source:Company Filings, Company management, Capital IQ and SNL as of 04/27/2021 Realty Income and VEREIT portfolio metrics as of 12/31/2020 14 Reflects post-spin Realty Income. Pro forma WALT weighted by annualized rental income, pro forma occupancy weighted by properties, pro forma investment grade (%) weighted by annualized rental income Based on midpoint of 2021 guidance |
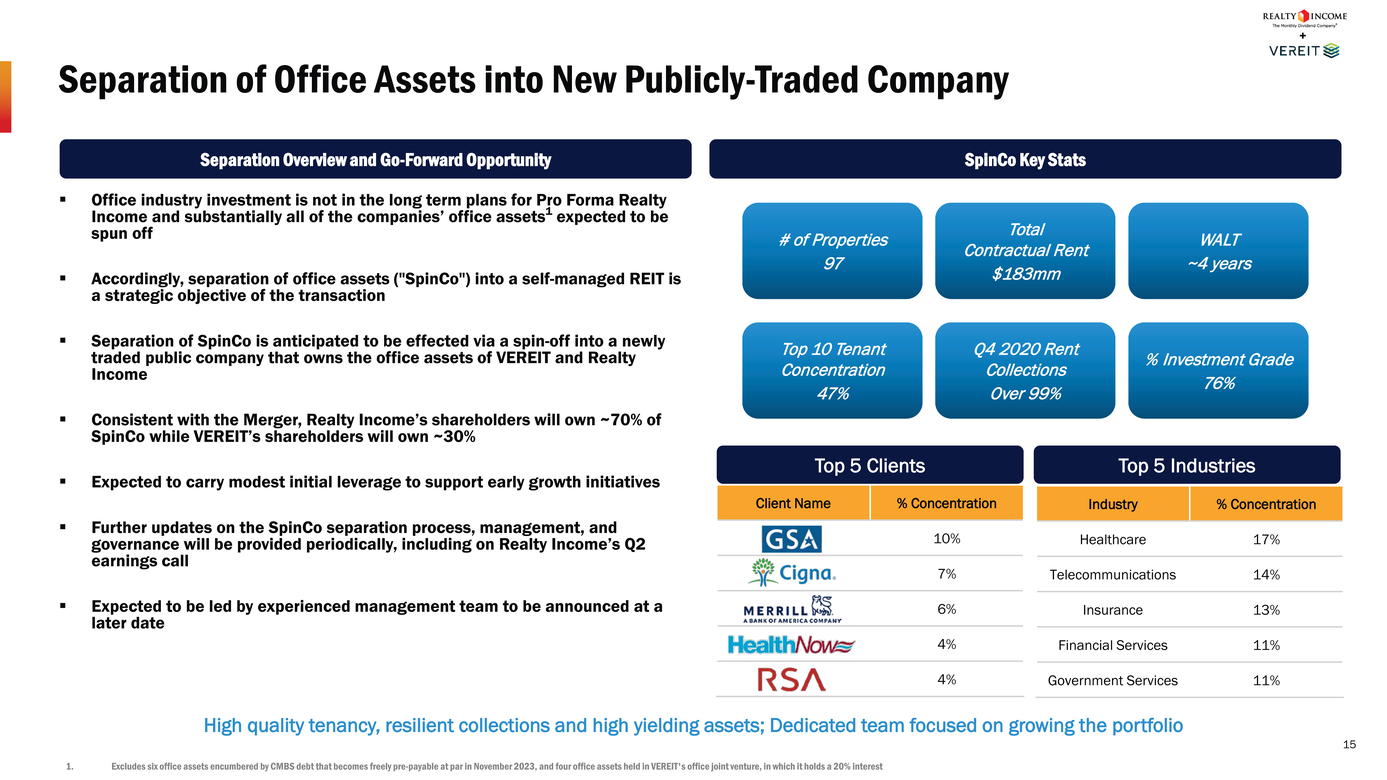 |
Separation of Office Assets into New Publicly-Traded Company Separation Overview and Go-Forward OpportunitySpinCo Key Stats Office industry investment is not in the long term plans for Pro Forma Realty Income and substantially all of the companies’ office assets1 expected to be spun off Accordingly, separation of office assets ("SpinCo") into a self-managed REIT is a strategic objective of the transaction Separation of SpinCo is anticipated to be effected via a spin-off into a newly traded public company that owns the office assets of VEREIT and Realty Income Consistent with the Merger, Realty Income’s shareholders will own ~70% of SpinCo while VEREIT’s shareholders will own ~30% Expected to carry modest initial leverage to support early growth initiatives Further updates on the SpinCo separation process, management, and governance will be provided periodically, including on Realty Income’s Q2 earnings call Expected to be led by experienced management team to be announced at a later date # of Properties 97 Top 10 Tenant Concentration 47% Client Name % Concentration 10% 7% 6% 4% 4% Total Contractual Rent $183mm Q4 2020 Rent Collections Over 99% WALT ~4 years % Investment Grade 76% Industry % Concentration Healthcare 17% Telecommunications 14% Insurance 13% Financial Services 11% Government Services 11% High quality tenancy, resilient collections and high yielding assets; Dedicated team focused on growing the portfolio 15 1.Excludes six office assets encumbered by CMBS debt that becomes freely pre-payable at par in November 2023, and four office assets held in VEREIT's office joint venture, in which it holds a 20% interest ##soft-page## |
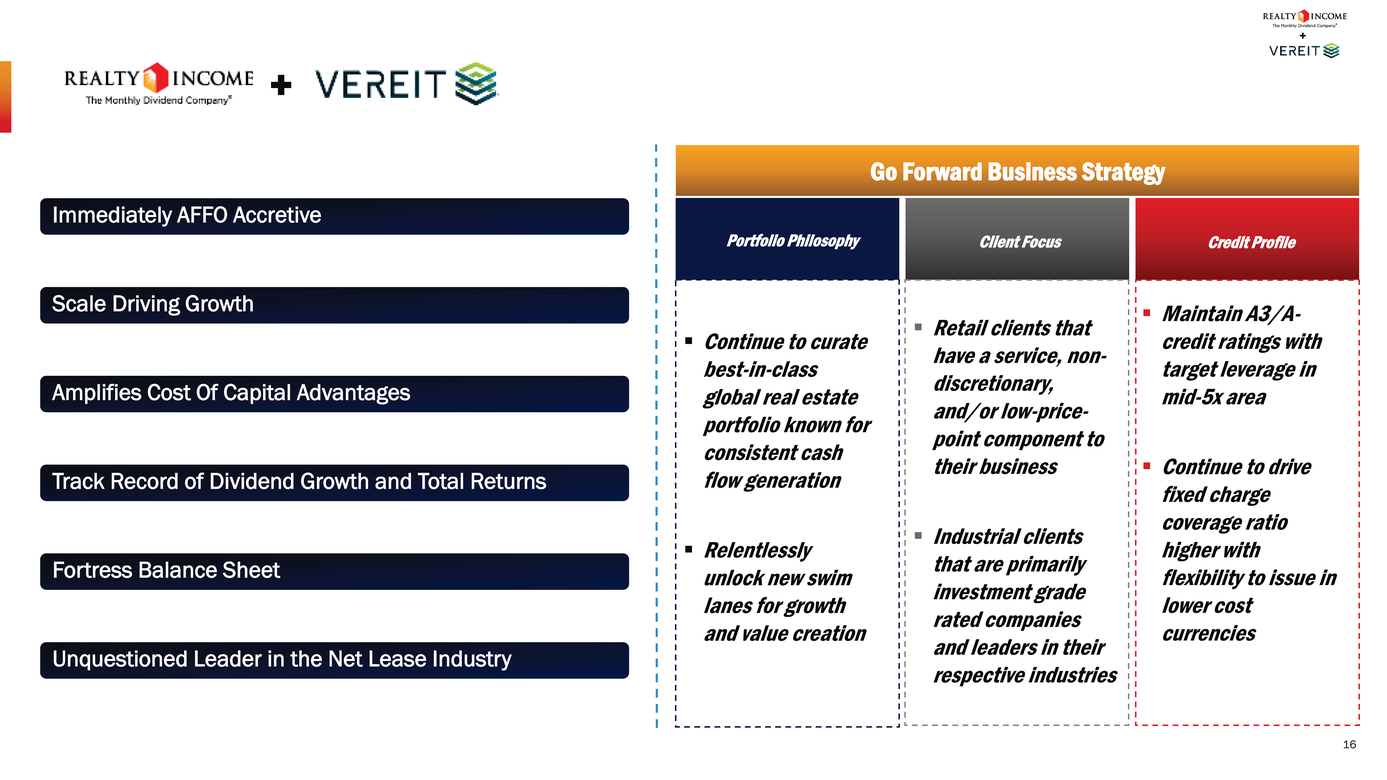 |
+ Immediately AFFO Accretive Go Forward Business Strategy Client Focus Credit Profile Scale Driving Growth Amplifies Cost Of Capital Advantages Track Record of Dividend Growth and Total Returns Fortress Balance Sheet Unquestioned Leader in the Net Lease Industry Maintain A3/A-credit ratings with target leverage in mid-5x area Continue to drive fixed charge coverage ratio higher with flexibility to issue in lower cost currencies Portfolio Philosophy Continue to curate best-in-class global real estate portfolio known for consistent cash flow generation Relentlessly unlock new swim lanes for growth and value creation Retail clients that have a service, non-discretionary, and/or low-price-point component to their business Industrial clients that are primarily investment grade rated companies and leaders in their respective industries |