Attached files
| file | filename |
|---|---|
| EX-99.1 - EX-99.1 - PARKER HANNIFIN CORP | exhibit9913qfy21.htm |
| 8-K - 8-K - PARKER HANNIFIN CORP | ph-20210429.htm |

Parker Hannifin Corporation Fiscal 2021 Third Quarter Earnings Presentation April 29, 2021 Exhibit 99.2

Forward-Looking Statements and Non-GAAP Financial Measures 2 Forward-looking statements contained in this and other written and oral reports are made based on known events and circumstances at the time of release, and as such, are subject in the future to unforeseen uncertainties and risks. These statements may be identified from the use of forward-looking terminology such as “anticipates,” “believes,” “may,” “should,” “could,” “potential,” “continues,” “plans,” “forecasts,” “estimates,” “projects,” “predicts,” “would,” “intends,” “expects,” “targets,” “is likely,” “will,” or the negative of these terms and similar expressions, and include all statements regarding future performance, earnings projections, events or developments. Parker cautions readers not to place undue reliance on these statements. It is possible that the future performance and earnings projections of the company, including its individual segments, may differ materially from current expectations, depending on economic conditions within its mobile, industrial and aerospace markets, and the company's ability to maintain and achieve anticipated benefits associated with announced realignment activities, strategic initiatives to improve operating margins, actions taken to combat the effects of the current economic environment, and growth, innovation and global diversification initiatives. Additionally, the actual impact of changes in tax laws in the United States and foreign jurisdictions and any judicial or regulatory interpretation thereof on future performance and earnings projections may impact the company’s tax calculations. A change in the economic conditions in individual markets may have a particularly volatile effect on segment performance. Among other factors which may affect future performance are: the impact of the global outbreak of COVID-19 and governmental and other actions taken in response; changes in business relationships with and purchases by or from major customers, suppliers or distributors, including delays or cancellations in shipments; disputes regarding contract terms or significant changes in financial condition, changes in contract cost and revenue estimates for new development programs and changes in product mix; ability to identify acceptable strategic acquisition targets; uncertainties surrounding timing, successful completion or integration of acquisitions and similar transactions, including the integration of LORD Corporation or Exotic Metals; the ability to successfully divest businesses planned for divestiture and realize the anticipated benefits of such divestitures; the determination to undertake business realignment activities and the expected costs thereof and, if undertaken, the ability to complete such activities and realize the anticipated cost savings from such activities; ability to implement successfully capital allocation initiatives, including timing, price and execution of share repurchases; availability, limitations or cost increases of raw materials, component products and/or commodities that cannot be recovered in product pricing; ability to manage costs related to insurance and employee retirement and health care benefits; compliance costs associated with environmental laws and regulations; potential labor disruptions; threats associated with and efforts to combat terrorism and cyber-security risks; uncertainties surrounding the ultimate resolution of outstanding legal proceedings, including the outcome of any appeals; global competitive market conditions, including global reactions to U.S. trade policies, and resulting effects on sales and pricing; and global economic factors, including manufacturing activity, air travel trends, currency exchange rates, difficulties entering new markets and general economic conditions such as inflation, deflation, interest rates and credit availability. The company makes these statements as of the date of this disclosure and undertakes no obligation to update them unless otherwise required by law. This presentation contains references to non-GAAP financial information for Parker, including organic sales for Parker and by segment, adjusted earnings per share, adjusted operating margin for Parker and by segment, EBITDA, adjusted EBITDA, EBITDA margin, and free cash flow. EBITDA is defined as earnings before interest, taxes, depreciation and amortization. For Parker, adjusted EBITDA is defined as EBITDA before business realignment, Integration costs to achieve, and acquisition related expenses. Free cash flow is defined as cash flow from operations less capital expenditures. Although organic sales, adjusted earnings per share, adjusted operating margin for Parker and by segment, EBITDA, adjusted EBITDA, EBITDA margin and free cash flow are not measures of performance calculated in accordance with GAAP, we believe that they are useful to an investor in evaluating the company performance for the period presented. Detailed reconciliations of these non-GAAP financial measures to the comparable GAAP financial measures have been included in the appendix to this presentation. Please visit www.PHstock.com for more information
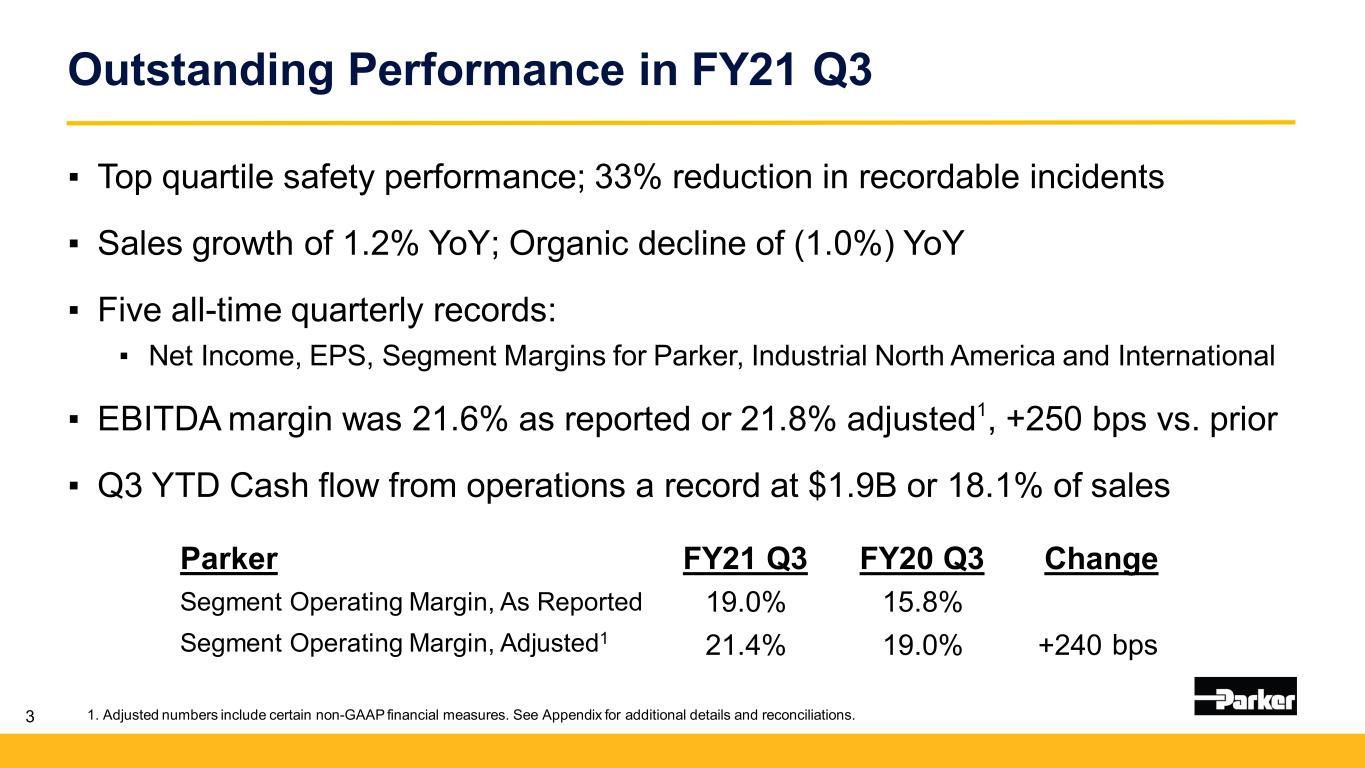
Outstanding Performance in FY21 Q3 3 ▪ Top quartile safety performance; 33% reduction in recordable incidents ▪ Sales growth of 1.2% YoY; Organic decline of (1.0%) YoY ▪ Five all-time quarterly records: ▪ Net Income, EPS, Segment Margins for Parker, Industrial North America and International ▪ EBITDA margin was 21.6% as reported or 21.8% adjusted1, +250 bps vs. prior ▪ Q3 YTD Cash flow from operations a record at $1.9B or 18.1% of sales Parker FY21 Q3 FY20 Q3 Change Segment Operating Margin, As Reported 19.0% 15.8% Segment Operating Margin, Adjusted1 21.4% 19.0% 240+ bps 1. Adjusted numbers include certain non-GAAP financial measures. See Appendix for additional details and reconciliations.

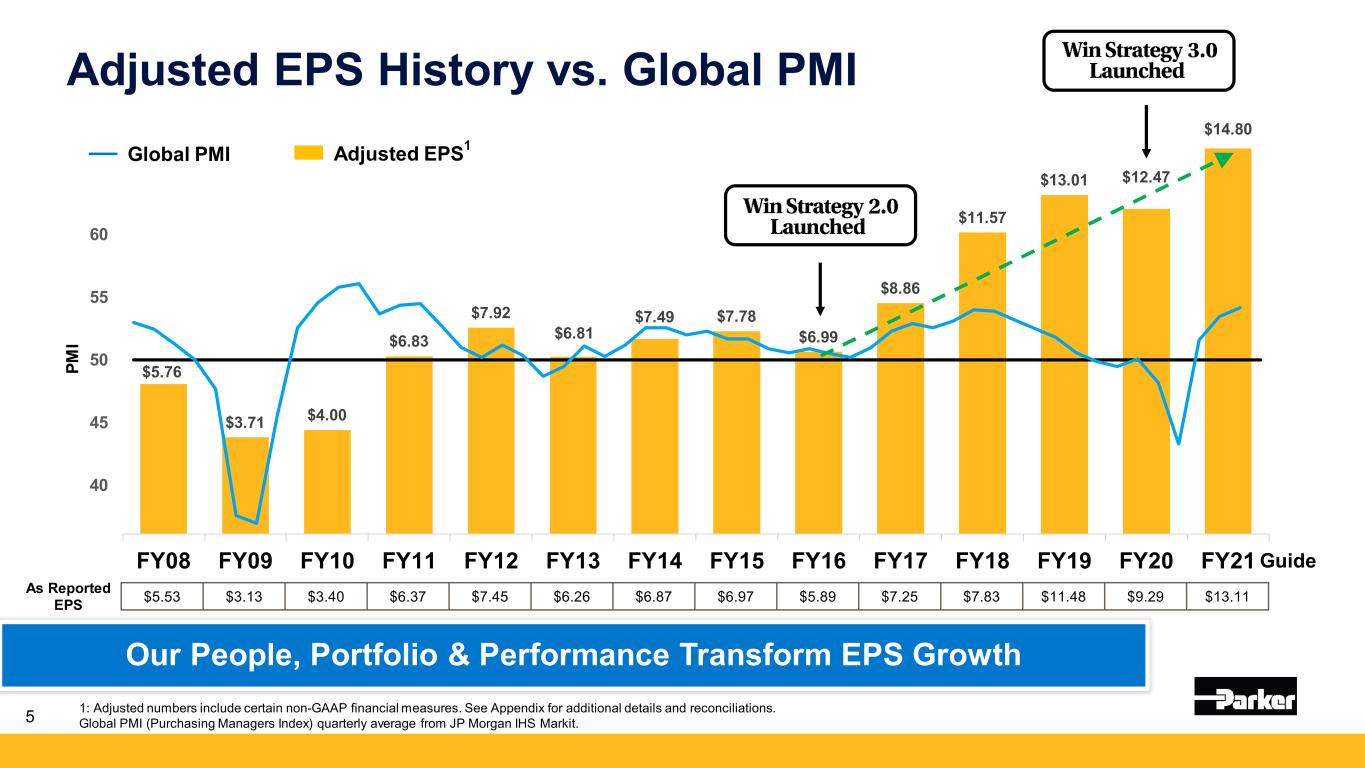
$5.76 $3.71 $4.00 $6.83 $7.92 $6.81 $7.49 $7.78 $6.99 $8.86 $11.57 $13.01 $12.47 $14.80 FY08 FY09 FY10 FY11 FY12 FY13 FY14 FY15 FY16 FY17 FY18 FY19 FY20 FY21 30 35 40 45 50 55 60 65 70 Adjusted EPS1 1: Adjusted numbers include certain non-GAAP financial measures. See Appendix for additional details and reconciliations. Global PMI (Purchasing Managers Index) quarterly average from JP Morgan IHS Markit. Guide Global PMI PM I Our People, Portfolio & Performance Transform EPS Growth $5.53 $3.13 $3.40 $6.37 $7.45 $6.26 $6.87 $6.97 $5.89 $7.25 $7.83 $11.48 $9.29 $13.11As Reported EPS Adjusted EPS History vs. Global PMI 5

Convergence of Positive Inflection Points Macro Environment CLARCOR, LORD & Exotic acquisitions Future capital deployment Performance Top quartile Growth strategies Margin expansion Cash flow generation 6 Strategically Positioned for a Brighter Future Portfolio Technology Industrial momentum Aerospace recovery Vaccine progress Climate investment Interconnected Technologies Positioned well for clean technology

Unmatched Breadth of Core Technologies Interconnected Technologies Creates Competitive Advantages 7
8

9 Electric Vehicle Technology Weight Savings • Structural adhesives • Engineered plastics Thermal Management • Thermal gels & interface materials • Environmental & hermetic sealing Safety • Flame-resistant coatings • High temperature materials • Environmental & hermetic sealing Applications Critical Protection • Electromagnetic shielding • Sealing • Vibration dampening • Electrically conductive or isolating materials Parker Technologies Enabling a More Sustainable Future • Battery Pack & Housing • Motor & Gear Box • Charger & Inverter • Infotainment & Driver Assistance • Power Electronics • Lightweight Assembly


1. Sales figures As Reported. Adjusted numbers include certain non-GAAP financial measures. See Appendix for additional details and reconciliations. Note: FY20 Q3 As Reported: Segment Operating Margin of 15.8%, EBITDA Margin of 18.2%, Net Income of $367M, EPS of $2.83. 11 Financial Summary FY21 Q3 vs. FY20 Q3 $ Millions, except per share amounts Q3 FY21 As Reported Q3 FY21 Adjusted1 Q3 FY20 Adjusted1 YoY Change Adjusted Sales $3,746 $3,746 $3,702 +1.2% Segment Operating Margin 19.0% 21.4% 19.0% +240 bps EBITDA 21.6% 21.8% 19.3% +250 bps Net Income $472 $540 $441 +22% EPS $3.59 $4.11 $3.39 +21%

12 Adjusted Earnings per Share Bridge FY20 Q3 to FY21 Q3 1 1. FY20 Q3 As Reported EPS of $2.83. FY21 Q3 As Reported EPS of $3.59. Adjusted numbers include certain non-GAAP financial measures. See Appendix for additional details and reconciliations. 1

Savings from Cost Out Actions 13 ~50% ~45% ~55% Savings FY21 Q3 YTD FY21 Forecast FY21 YoY Incremental Discretionary Actions ~$215 ~$225 ~$ 50 Permanent Actions ~$190 ~$250 ~$210 Total ~$405M ~$475M* ~$260M* *Estimated savings from cost actions will vary based on demand conditions Year-to-date and forecasted cost savings remain on track

14 FY21 Q3 Segment Performance Sales As Reported $ Organic %1 Segment Operating Margin As Reported Segment Operating Margin Adjusted1 Order Rates2 Commentary $1,758M (1.2)% Organic 19.1% 21.9% +190 bps YoY +11% • Higher margins YoY despite lower volume • Disciplined cost management $1,389M +11.1% Organic 19.8% 21.6% +400 bps YoY +14% • Double-digit organic growth • Significant margin expansion $599M (19.7)% Organic 17.1% 19.4% +30 bps YoY (19%) • Organization right-sized to demand • Military sales strength $3,746M (1.0)% Organic 19.0% 21.4% +240 bps YoY +6% • The Win StrategyTM • Record segment margins • Total orders turned positive 1. Adjusted numbers include certain non-GAAP financial measures. See Appendix for additional details and reconciliations. 2. Order Rates exclude acquisitions, divestitures, & currency. Industrial is a 3 month YoY comparison of total dollars. Aerospace is a rolling 12 month YoY comparison. Diversified International Diversified North America Parker Aerospace Systems
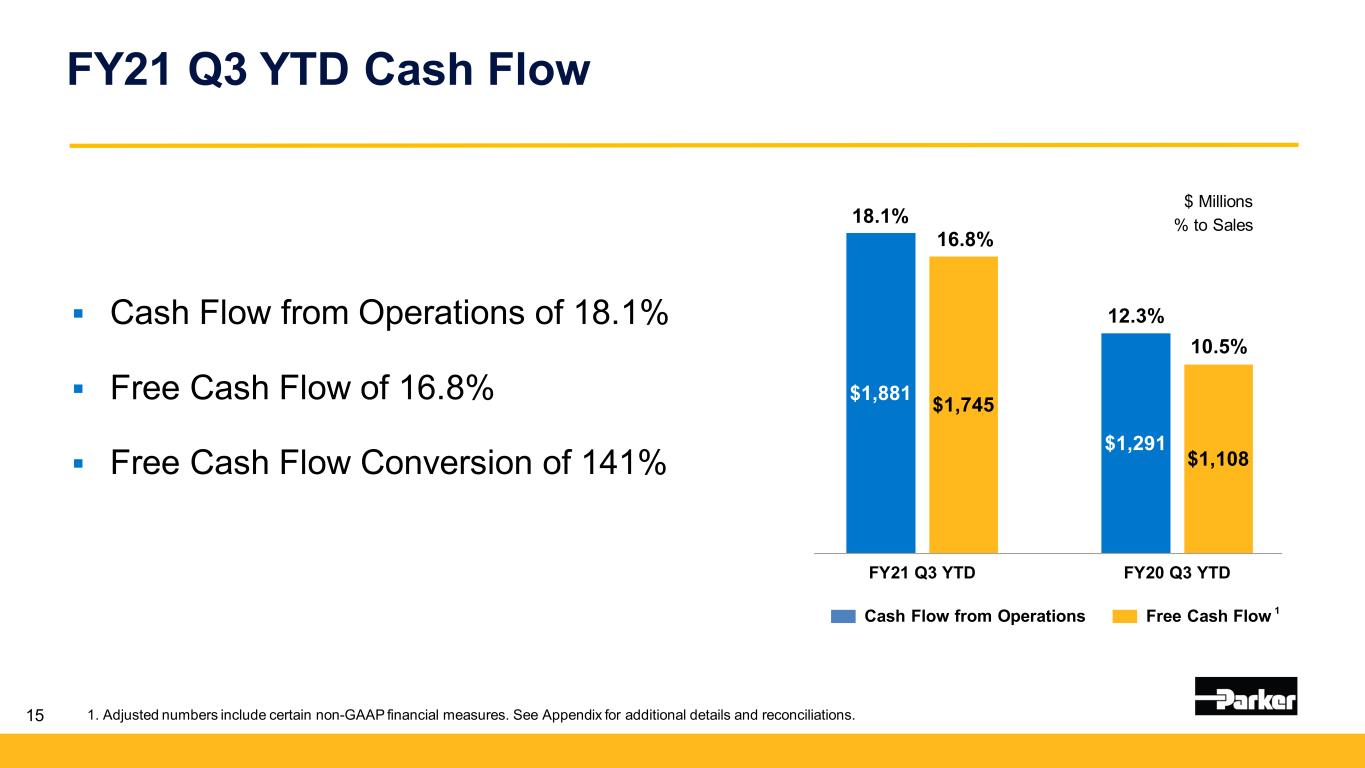
$1,881 $1,291 $1,745 $1,108 FY21 Q3 YTD FY20 Q3 YTD Free Cash Flow 15 FY21 Q3 YTD Cash Flow Cash Flow from Operations of 18.1% Free Cash Flow of 16.8% Free Cash Flow Conversion of 141% 1 $ Millions % to Sales Cash Flow from Operations 18.1% 16.8% 12.3% 10.5% 1. Adjusted numbers include certain non-GAAP financial measures. See Appendix for additional details and reconciliations.

Strong Capital Deployment 16 Paid down $426 million of debt during FY21 Q3 • ~$3.2 billion debt reduction in last 17 months • Gross debt to EBITDA of 2.4x; Net debt to EBITDA of 2.2x Quarterly dividend increase of 15 cents or 17% • 65 consecutive fiscal years of increasing dividends paid Reinstated 10b5-1 program, repurchased $50M in FY21 Q3 Expect all serviceable debt to be paid off in 2021Great Generators and Deployers of Cash
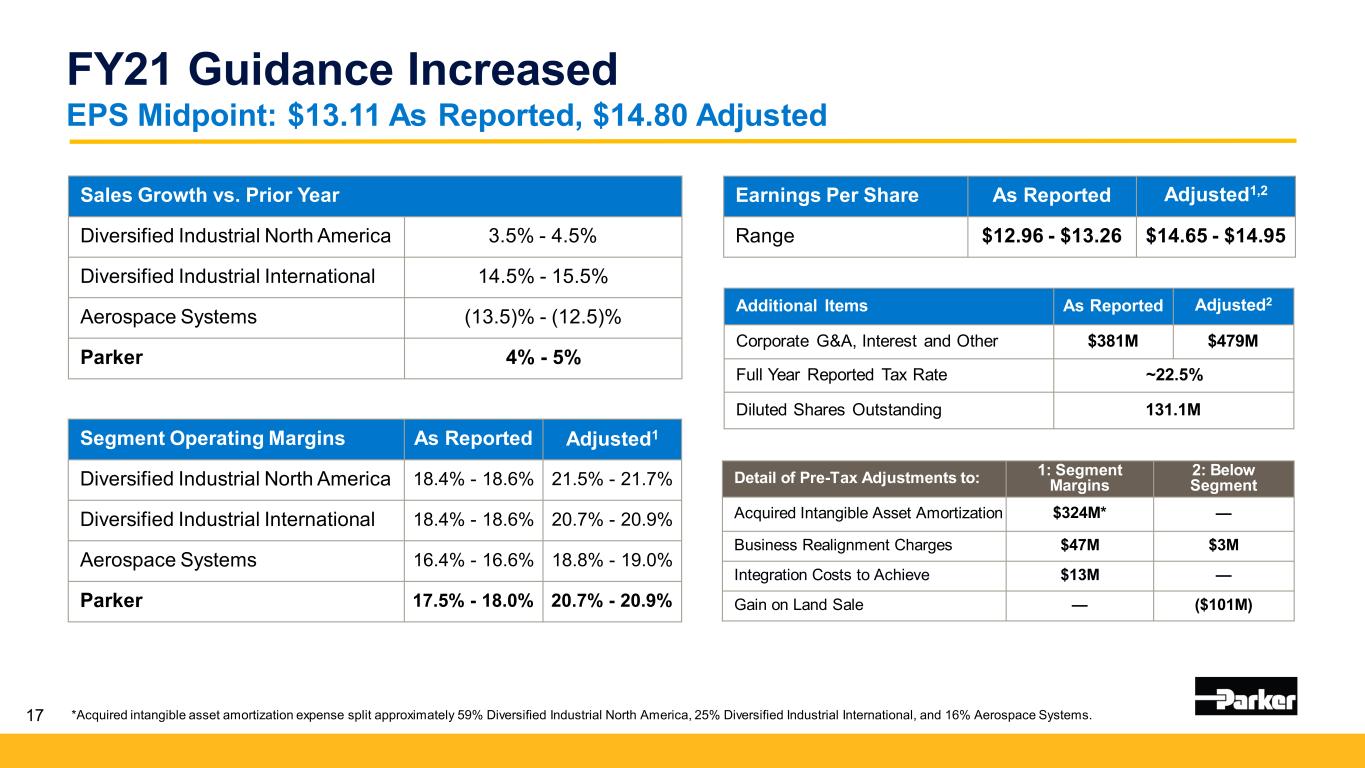
17 FY21 Guidance Increased EPS Midpoint: $13.11 As Reported, $14.80 Adjusted Sales Growth vs. Prior Year Diversified Industrial North America 3.5% - 4.5% Diversified Industrial International 14.5% - 15.5% Aerospace Systems (13.5)% - (12.5)% Parker 4% - 5% *Acquired intangible asset amortization expense split approximately 59% Diversified Industrial North America, 25% Diversified Industrial International, and 16% Aerospace Systems. Segment Operating Margins As Reported Adjusted1 Diversified Industrial North America 18.4% - 18.6% 21.5% - 21.7% Diversified Industrial International 18.4% - 18.6% 20.7% - 20.9% Aerospace Systems 16.4% - 16.6% 18.8% - 19.0% Parker 17.5% - 18.0% 20.7% - 20.9% Additional Items As Reported Adjusted2 Corporate G&A, Interest and Other $381M $479M Full Year Reported Tax Rate ~22.5% Diluted Shares Outstanding 131.1M Detail of Pre-Tax Adjustments to: 1: Segment Margins 2: Below Segment Acquired Intangible Asset Amortization $324M* — Business Realignment Charges $47M $3M Integration Costs to Achieve $13M — Gain on Land Sale — ($101M) Earnings Per Share As Reported Adjusted1,2 Range $12.96 - $13.26 $14.65 - $14.95
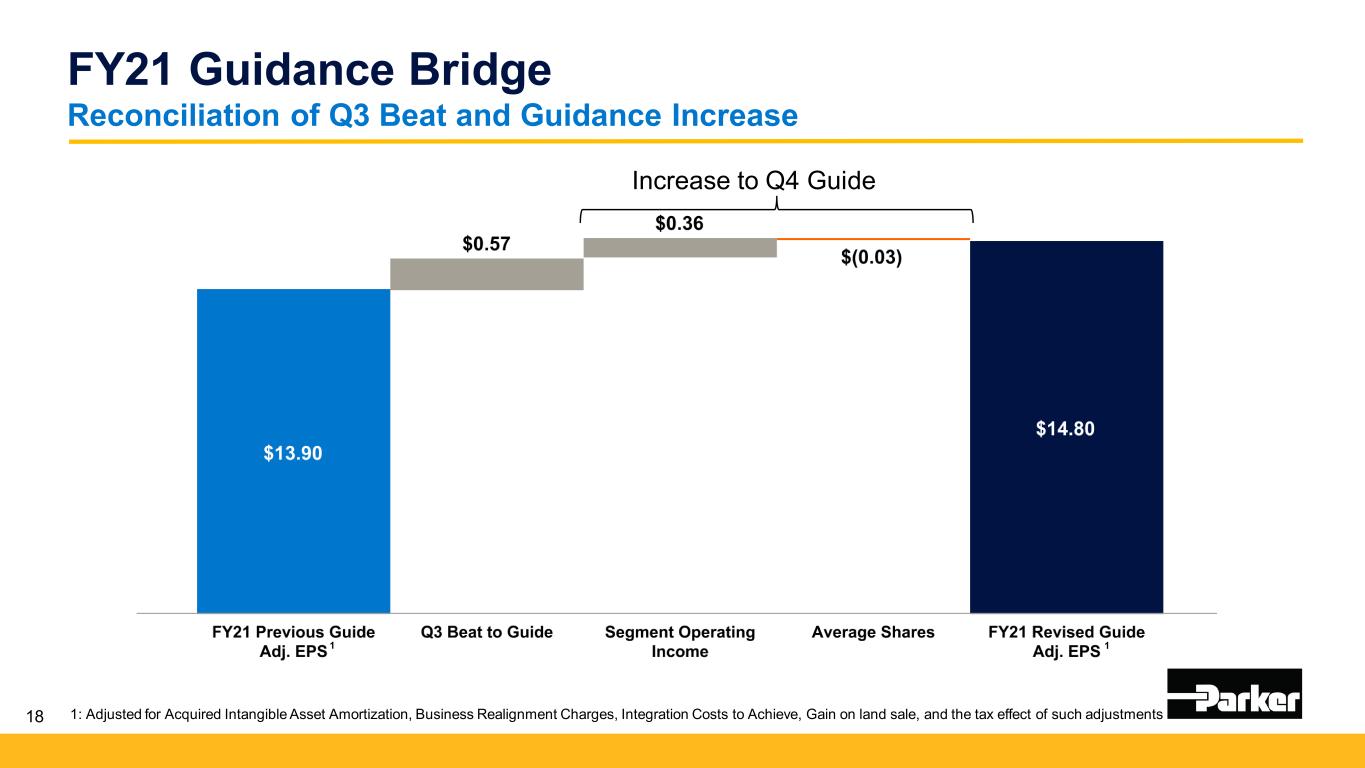
18 FY21 Guidance Bridge Reconciliation of Q3 Beat and Guidance Increase 1: Adjusted for Acquired Intangible Asset Amortization, Business Realignment Charges, Integration Costs to Achieve, Gain on land sale, and the tax effect of such adjustments 11 Increase to Q4 Guide

Key Messages Highly engaged global team Record performance in difficult times Convergence of positive inflection points Great Generators and Deployers of Cash 19 The Win Strategy 3.0 & Purpose Statement Accelerate Performance


Appendix • Reconciliation of Organic Growth • Adjusted Amounts Reconciliation • Reconciliation of EPS • Reconciliation of Total Segment Operating Margin to Adjusted Total Segment Operating Margin • Reconciliation of EBITDA to Adjusted EBITDA • Reconciliation of Free Cash Flow Conversion • Supplemental Sales Information – Global Technology Platforms • Reconciliation of Forecasted EPS 21
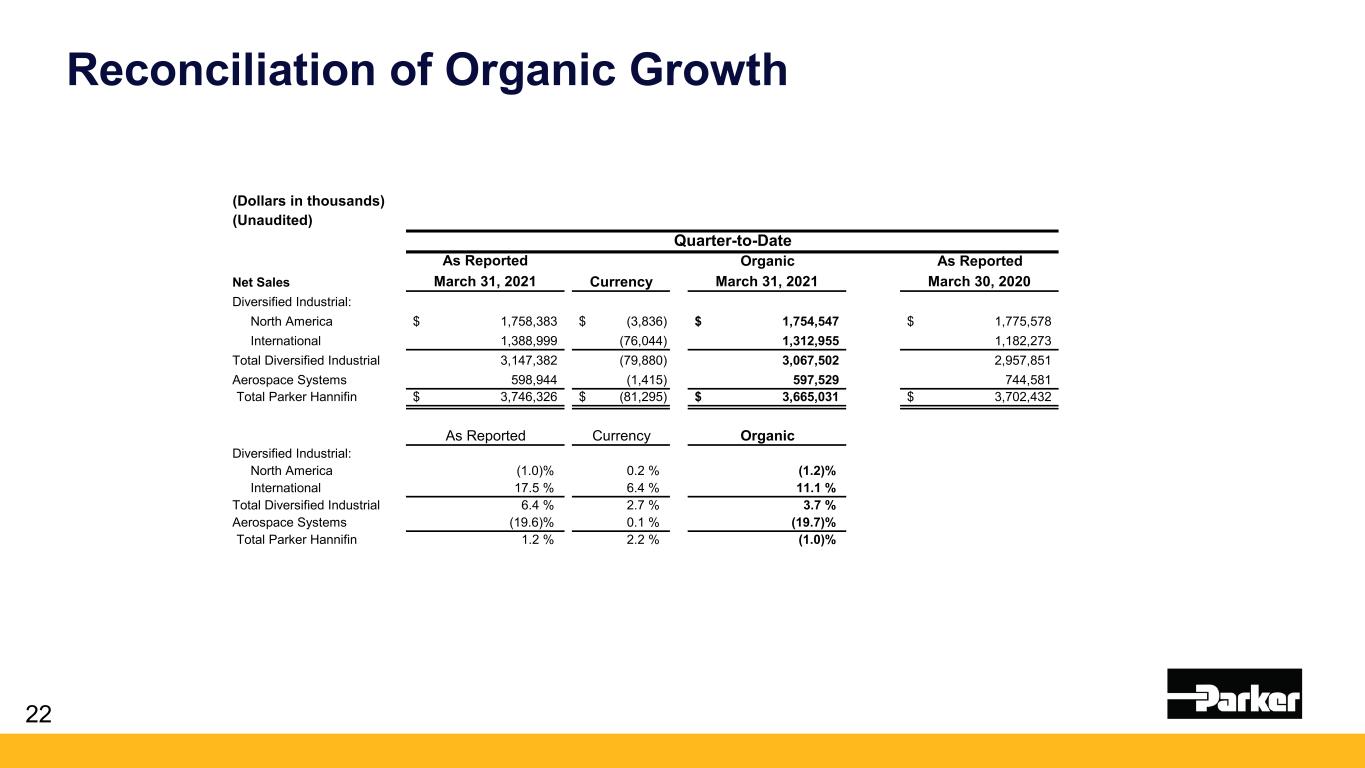
Reconciliation of Organic Growth 22 (Dollars in thousands) (Unaudited) Quarter-to-Date As Reported Organic As Reported Net Sales March 31, 2021 March 31, 2021 March 30, 2020 Diversified Industrial: North America 1,758,383$ (3,836)$ 1,754,547$ 1,775,578$ International 1,388,999 (76,044) 1,312,955 1,182,273 Total Diversified Industrial 3,147,382 (79,880) 3,067,502 2,957,851 Aerospace Systems 598,944 (1,415) 597,529 744,581 Total Parker Hannifin 3,746,326$ (81,295)$ 3,665,031$ 3,702,432$ As Reported Currency Organic Diversified Industrial: North America (1.0)% 0.2 % (1.2)% International 17.5 % 6.4 % 11.1 % Total Diversified Industrial 6.4 % 2.7 % 3.7 % Aerospace Systems (19.6)% 0.1 % (19.7)% Total Parker Hannifin 1.2 % 2.2 % (1.0)% Currency

Adjusted Amounts Reconciliation Consolidated Statement of Income 23 (Dollars in thousands, except per share data) (Unaudited) Quarter-to-Date FY 2021 % of Sales Acquired Intangible Asset Amortization Business Realignment Charges Lord Costs to Achieve Exotic Costs to Achieve % of Sales As Reported Adjusted March 31, 2021 March 31, 2021 Net Sales $ 3,746,326 100.0 % $ — $ — $ — $ — $ 3,746,326 100.0 % Cost of Sales 2,714,773 72.5 % — 3,056 425 — 2,711,292 72.4 % Selling, general, and admin. expenses 386,831 10.3 % 81,253 2,545 2,206 24 300,803 8.0 % Interest expense 60,830 1.6 % — — — — 60,830 1.6 % Other (income), net (13,460) (0.4)% — 1 — — (13,461) (0.4)% Income before income taxes 597,352 15.9 % (81,253) (5,602) (2,631) (24) 686,862 18.3 % Income taxes 125,619 3.4 % 18,851 1,300 610 6 146,386 3.9 % Net Income 471,733 12.6 % (62,402) (4,302) (2,021) (18) 540,476 14.4 % Less: Noncontrollable interests 86 0.0 % — — — — 86 0.0 % Net Income - common shareholders $ 471,647 12.6 % $ (62,402) $ (4,302) $ (2,021) $ (18) $ 540,390 14.4 % Diluted earnings per share $ 3.59 $ (0.47) $ (0.03) $ (0.02) $ — $ 4.11 Quarter-to-Date FY 2020 Acquired Business Lord Exotic Acquisition Favorable As Reported Intangible Asset Realignment Costs to Costs to Related Tax Adjusted March 30, 2020 % of Sales Amortization Charges Achieve Achieve Expenses Settlement March 30, 2020 % of Sales Net sales 3,702,432$ 100.0 % -$ -$ -$ -$ -$ -$ 3,702,432$ 100.0 % Cost of sales 2,766,693 74.7 % - 10,201 399 - 18,060 - 2,738,033 74.0 % Selling, general and admin. expenses 413,460 11.2 % 80,506 3,203 7,965 486 105 - 321,195 8.7 % Interest expense 80,765 2.2 % - - - - - - 80,765 2.2 % Other (income) expense, net (12,643) (0.3)% - 50 - - - - (12,693) (0.3)% Income before income taxes 454,157 12.3 % (80,506) (13,454) (8,364) (486) (18,165) - 575,132 15.5 % Income taxes 86,788 2.3 % 19,160 3,202 1,991 116 4,323 18,724 134,304 3.6 % Net income 367,369 9.9 % (61,346) (10,252) (6,373) (370) (13,842) 18,724 440,828 11.9 % Less: Noncontrolling interests 116 0.0 % - - - - - - 116 0.0 % Net income - common shareholders 367,253$ 9.9 % (61,346)$ (10,252)$ (6,373)$ (370)$ (13,842)$ 18,724$ 440,712$ 11.9 % Diluted earnings per share 2.83$ (0.47)$ (0.08)$ (0.05)$ -$ (0.10)$ 0.14$ 3.39$

Adjusted Amounts Reconciliation Business Segment Information 24 (Dollars in thousands) (Unaudited) Quarter-to-Date FY 2021 % of Sales Acquired Intangible Asset Amortization Business Realignment Charges Lord Costs to Achieve Exotic Costs to Achieve % of Sales2 As Reported Adjusted March 31, 2021 March 31, 2021 Diversified Industrial North America1 $ 336,589 19.1 % $ 47,574 $ (68) $ 1,751 $ — $ 385,846 21.9 % International1 274,427 19.8 % 20,909 4,207 880 — 300,423 21.6 % Aerospace Systems1 102,303 17.1 % 12,770 1,306 — 24 116,403 19.4 % Total segment operating income 713,319 19.0 % (81,253) (5,445) (2,631) (24) 802,672 21.4 % Corporate administration 48,089 1.3 % — 156 — — 47,933 1.3 % Income before interest and other 665,230 17.8 % (81,253) (5,601) (2,631) (24) 754,739 20.1 % Interest expense 60,830 1.6 % — — — — 60,830 1.6 % Other (income) expense 7,048 0.2 % — 1 — — 7,047 0.2 % Income before income taxes $ 597,352 15.9 % $ (81,253) $ (5,602) $ (2,631) $ (24) $ 686,862 18.3 % 1Segment operating income as a percent of sales is calculated on as reported segment sales. 2Adjusted amounts as a percent of sales are calculated on as reported segment sales.
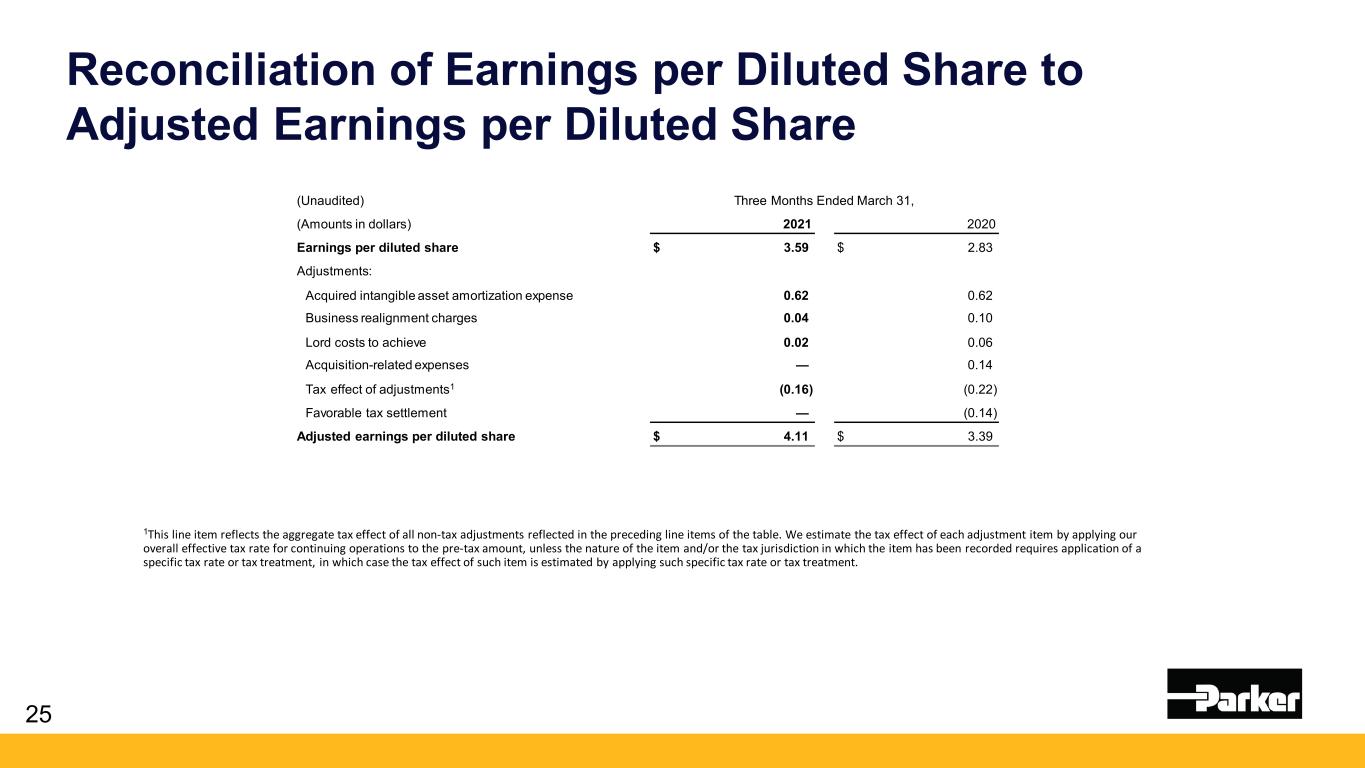
Reconciliation of Earnings per Diluted Share to Adjusted Earnings per Diluted Share 25 (Unaudited) Three Months Ended March 31, (Amounts in dollars) 2021 2020 Earnings per diluted share $ 3.59 $ 2.83 Adjustments: Acquired intangible asset amortization expense 0.62 0.62 Business realignment charges 0.04 0.10 Lord costs to achieve 0.02 0.06 Acquisition-related expenses — 0.14 Tax effect of adjustments1 (0.16) (0.22) Favorable tax settlement — (0.14) Adjusted earnings per diluted share $ 4.11 $ 3.39 1This line item reflects the aggregate tax effect of all non-tax adjustments reflected in the preceding line items of the table. We estimate the tax effect of each adjustment item by applying our overall effective tax rate for continuing operations to the pre-tax amount, unless the nature of the item and/or the tax jurisdiction in which the item has been recorded requires application of a specific tax rate or tax treatment, in which case the tax effect of such item is estimated by applying such specific tax rate or tax treatment.

Reconciliation of Earnings per Diluted Share to Adjusted Earnings per Diluted Share 26 1This line item reflects the aggregate tax effect of all non-tax adjustments reflected in the preceding line items of the table. We estimate the tax effect of each adjustment item by applying our overall effective tax rate for continuing operations to the pre-tax amount, unless the nature of the item and/or the tax jurisdiction in which the item has been recorded requires application of a specific tax rate or tax treatment, in which case the tax effect of such item is estimated by applying such specific tax rate or tax treatment.

27 Reconciliation of Total Segment Operating Margin to Adjusted Total Segment Operating Margin (Unaudited) Three Months Ended Three Months Ended (Dollars in thousands) March 31, 2021 March 31, 2020 Operating income Operating margin Operating income Operating margin Total segment operating income $ 713,319 19.0 % $ 584,022 15.8 % Adjustments: Acquired intangible asset amortization expense 81,253 80,506 Business realignment charges 5,445 13,333 Lord costs to achieve 2,631 8,364 Exotic costs to achieve 24 486 Acquisition-related expenses — 18,060 Adjusted total segment operating income $ 802,672 21.4 % $ 704,771 19.0 %

28 Reconciliation of EBITDA to Adjusted EBITDA (Unaudited) Three Months Ended March 31, Nine Months Ended March 31, (Dollars in thousands) 2021 2020 2021 2020 Net sales $ 3,746,326 $ 3,702,432 $ 10,388,771 $ 10,534,917 Net income $ 471,733 $ 367,369 $ 1,240,947 $ 911,008 Income taxes 125,619 86,788 348,212 231,051 Depreciation and amortization 150,548 137,649 448,808 390,949 Interest expense 60,830 80,765 189,778 233,612 EBITDA 808,730 672,571 2,227,745 1,766,620 Adjustments: Business realignment charges 5,602 13,454 40,070 28,013 Lord costs to achieve 2,631 8,364 9,495 18,503 Exotic costs to achieve 24 486 699 1,570 Acquisition-related expenses — 18,165 — 184,081 Gain on sale of land — — (100,893) — Adjusted EBITDA $ 816,987 $ 713,040 $ 2,177,116 $ 1,998,787 EBITDA margin 21.6 % 18.2 % 21.4 % 16.8 % Adjusted EBITDA margin 21.8 % 19.3 % 21.0 % 19.0 %

Reconciliation of Free Cash Flow Conversion 29 (Unaudited) Nine Months Ended March 31, 2021 Nine Months Ended March 31, 2020(Dollars in thousands) Net income $ 1,240,947 $ 911,008 Cash flow from operations $ 1,881,405 $ 1,290,859 Capital Expenditures (136,064) (182,502) Free cash flow $ 1,745,341 $ 1,108,357 Free cash flow conversion (free cash flow / net income) 141 % 122 %

30 (Unaudited) Three Months Ended March 31, Nine Months Ended March 31, (Dollars in thousands) 2021 2020 2021 2020 Net sales Diversified Industrial: Motion Systems $ 820,514 $ 778,840 $ 2,197,971 $ 2,297,961 Flow and Process Control 1,081,570 1,015,430 2,955,643 2,969,033 Filtration and Engineered Materials 1,245,298 1,163,581 3,477,632 3,157,248 Aerospace Systems 598,944 744,581 1,757,525 2,110,675 Total $ 3,746,326 $ 3,702,432 $ 10,388,771 $ 10,534,917 Supplemental Sales Information Global Technology Platforms

Reconciliation of EPS Fiscal Year 2021 Guidance 31 (Unaudited) (Amounts in dollars) Fiscal Year 2021 Forecasted earnings per diluted share $12.96 to $13.26 Adjustments: Business realignment charges 0.38 Costs to achieve 0.10 Acquisition-related intangible asset amortization expense 2.47 Gain on sale of land (0.77) Tax effect of adjustments1 (0.49) Adjusted forecasted earnings per diluted share $14.65 to $14.95 1This line item reflects the aggregate tax effect of all non-tax adjustments reflected in the preceding line items of the table. We estimate the tax effect of each adjustment item by applying our overall effective tax rate for continuing operations to the pre-tax amount, unless the nature of the item and/or the tax jurisdiction in which the item has been recorded requires application of a specific tax rate or tax treatment, in which case the tax effect of such item is estimated by applying such specific tax rate or tax treatment.
