Attached files
| file | filename |
|---|---|
| 8-K - 8-K - MERIT MEDICAL SYSTEMS INC | mmsi-20210429x8k.htm |
| EX-99.1 - EX-99.1 - MERIT MEDICAL SYSTEMS INC | mmsi-20210429xex99d1.htm |
Exhibit 99.2
| 1 Merit Medical Investor Call April 29, 2021 First Quarter 2021 Results Fred Lampropoulos Chairman and CEO Raul Parra CFO |

| 2 CAUTIONARY STATEMENT REGARDING FORWARD-LOOKING STATEMENTS This presentation and any accompanying management commentary include “forward-looking statements,” as defined within applicable securities laws and regulations. All statements in this presentation, other than statements of historical fact, are “forward-looking statements”, including without limitation estimates and statements regarding Merit's forecasted plans, net sales, net income or loss (GAAP and non-GAAP), operating income (GAAP and non-GAAP) gross and operating margins (GAAP and non-GAAP), earnings per share (GAAP and non-GAAP), free cash flow, and other financial measures, the potential impact, scope and duration of, and Merit’s response to, the COVID-19 pandemic and the potential for recovery from that pandemic, future growth and profit expectations or forecasted economic conditions, or the implementation of, and results achieved through, Merit’s Foundations for Growth program or other expense reduction initiatives, or the development and commercialization of new products. In some cases, forward-looking statements can be identified by the use of terminology such as “may,” “will,” “likely,” “expects,” “plans,” “anticipates,” “intends,” “believes,” “estimates,” “projects,” ”forecast,” “potential,” “plan,” or other comparable terminology. Merit’s future financial and operating results and condition, as well as any forward-looking statements, are subject to inherent risks and uncertainties such as those described in its Annual Report on Form 10-K for the year ended December 31, 2020 ( the “2020 Annual Report”) and other filings with the U.S. Securities and Exchange Commission. Such risks and uncertainties include inherent risks and uncertainties relating to Merit’s internal models or the projections in this presentation; risks and uncertainties associated with the COVID-19 pandemic and Merit’s response thereto; risks relating to Merit’s potential inability to successfully manage growth through acquisitions generally, including the inability to effectively integrate acquired operations or products or commercialize technology developed internally or acquired through completed, proposed or future transactions; negative changes in economic and industry conditions in the United States or other countries; expenditures relating to research, development, testing and regulatory approval or clearance of Merit’s products and risks that such products may not be developed successfully or approved for commercial use; governmental scrutiny and regulation of the medical device industry, including governmental inquiries, investigations and proceedings involving Merit; litigation and other judicial proceedings affecting Merit; restrictions on Merit’s liquidity or business operations resulting from its debt agreements; infringement of Merit’s technology or the assertion that Merit’s technology infringes the rights of other parties; product recalls and product liability claims; changes in customer purchasing patterns or the mix of products Merit sells; risks and uncertainties associated with Merit’s information technology systems, including the potential for breaches of security and evolving regulations regarding privacy and data protection; reduced availability of, and price increases associated with, commodity components; the potential of fines, penalties or other adverse consequences if Merit’s employees or agents violate the U.S. Foreign Corrupt Practices Act or other laws or regulations; laws and regulations targeting fraud and abuse in the healthcare industry; potential for significant adverse changes in governing regulations, including reforms to the procedures for approval or clearance of Merit’s products by the U.S. Food & Drug Administration or comparable regulatory authorities in other jurisdictions; changes in tax laws and regulations in the United States or other countries; termination or interruption of relationships with Merit’s suppliers, or failure of such suppliers to perform; fluctuations in exchange rates; concentration of a substantial portion of Merit’s revenues among a few products and procedures; development of new products and technology that could render Merit’s existing or future products obsolete; market acceptance of new products; volatility in the market price of Merit’s common stock; modification or limitation of governmental or private insurance reimbursement policies; changes in healthcare policies or markets related to healthcare reform initiatives; failure to comply with applicable environmental laws; changes in key personnel; work stoppage or transportation risks; failure to introduce products in a timely fashion; price and product competition; availability of labor and materials; fluctuations in and obsolescence of inventory; and other factors referenced in the 2020 Annual Report and other materials filed with the Securities and Exchange Commission. All forward-looking statements in this presentation or subsequent forward-looking statements attributable to Merit or persons acting on its behalf are expressly qualified in their entirety by these cautionary statements. Actual results will likely differ, and may differ materially, from those projected or assumed in the forward-looking statements. Financial estimates are subject to change and are not intended to be relied upon as predictions of future operating results. All forward-looking statements, including financial estimates, included in this presentation are made as of the date of this presentation, and are based on information available to Merit as of such date, and Merit assumes no obligation to update or disclose revisions to any forward-looking statement, except as required by law or regulation. 2 |
| 3 NON-GAAP FINANCIAL MEASURES Although Merit’s financial statements are prepared in accordance with accounting principles generally accepted in the United States of America (“GAAP”), Merit’s management believes that certain non-GAAP financial measures provide investors with useful information regarding the underlying business trends and performance of Merit’s ongoing operations and can be useful for period-over-period comparisons of such operations. Certain financial measures included in this presentation, or which may be referenced in management’s discussion of Merit’s historical and future operations and financial results, have not been calculated in accordance with GAAP, and, therefore, are referenced as non-GAAP financial measures. Readers should consider non-GAAP measures used in this presentation in addition to, not as a substitute for, financial reporting measures prepared in accordance with GAAP. These non-GAAP financial measures generally exclude some, but not all, items that may affect Merit's net income. In addition, they are subject to inherent limitations as they reflect the exercise of judgment by management about which items are excluded. Additionally, non-GAAP financial measures used in this presentation may not be comparable with similarly titled measures of other companies. Merit urges readers to review the reconciliations of its non-GAAP financial measures to the comparable GAAP financial measures, and not to rely on any single financial measure to evaluate Merit’s business or results of operations. Please refer to “Notes to Non-GAAP Financial Measures” at the end of these materials for more information. TRADEMARKS Unless noted otherwise, trademarks used in this presentation are the property of Merit Medical Systems, Inc., in the United States and other jurisdictions. 3 |
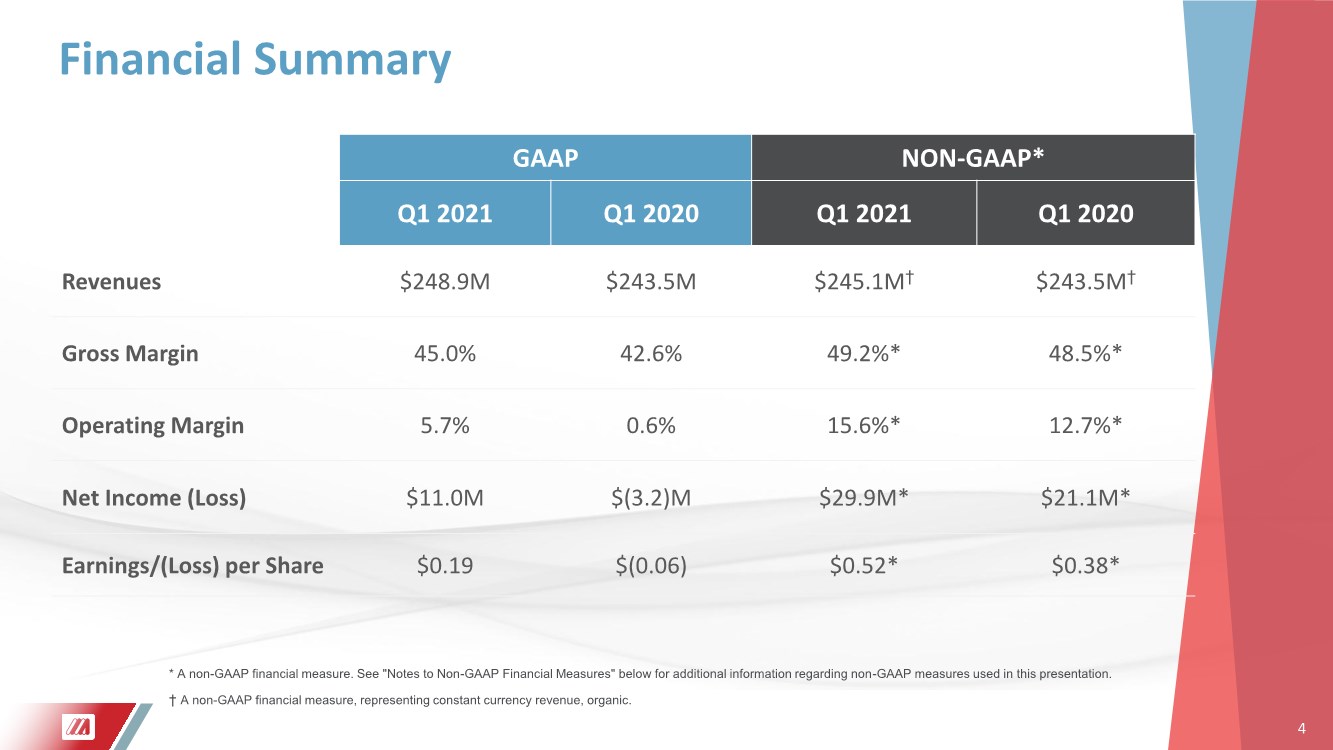
| 4 Financial Summary GAAP NON-GAAP* Q1 2021 Q1 2020 Q1 2021 Q1 2020 Revenues $248.9M $243.5M $245.1M† $243.5M† Gross Margin 45.0% 42.6% 49.2%* 48.5%* Operating Margin 5.7% 0.6% 15.6%* 12.7%* Net Income (Loss) $11.0M $(3.2)M $29.9M* $21.1M* Earnings/(Loss) per Share $0.19 $(0.06) $0.52* $0.38* * A non-GAAP financial measure. See "Notes to Non-GAAP Financial Measures" below for additional information regarding non-GAAP measures used in this presentation. † A non-GAAP financial measure, representing constant currency revenue, organic. 4 |
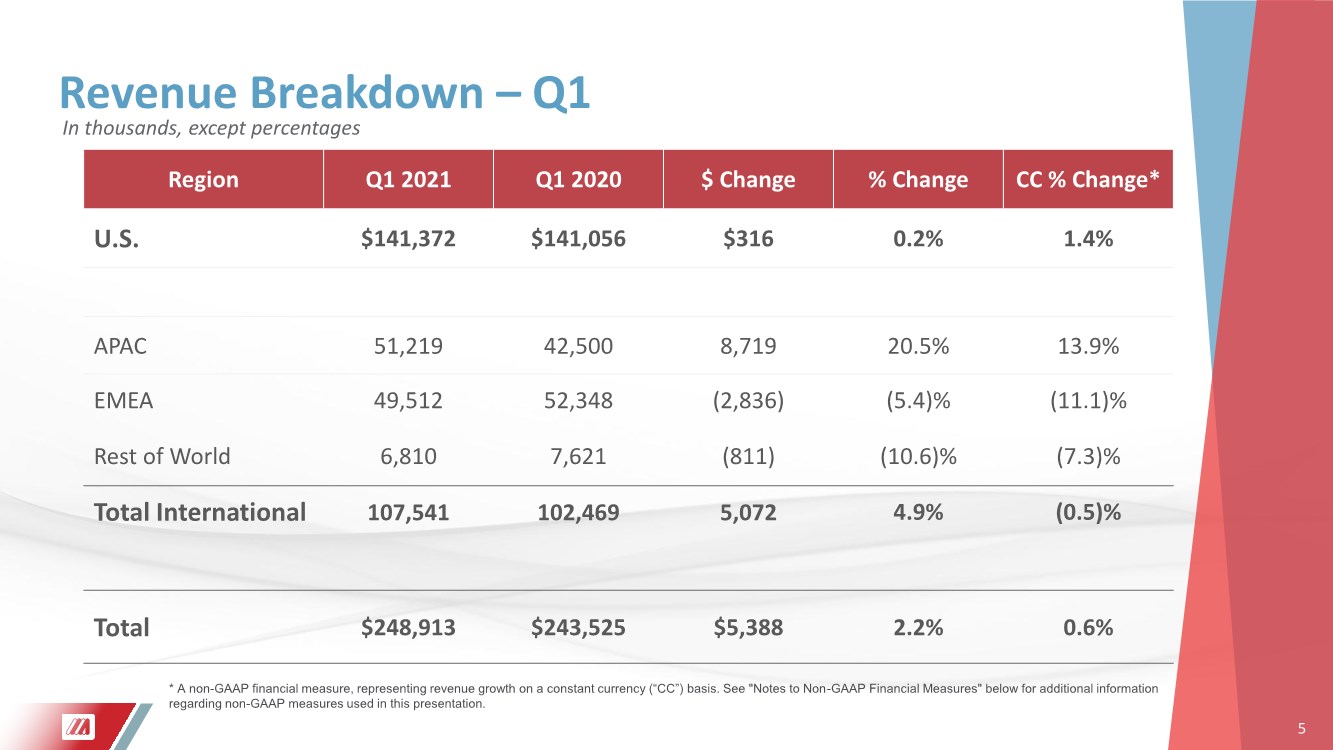
| 5 Revenue Breakdown –Q1 Region Q1 2021 Q1 2020 $ Change % Change CC % Change* U.S. $141,372 $141,056 $316 0.2% 1.4% APAC 51,219 42,500 8,719 20.5% 13.9% EMEA 49,512 52,348 (2,836) (5.4)% (11.1)% Rest of World 6,810 7,621 (811) (10.6)% (7.3)% Total International 107,541 102,469 5,072 4.9% (0.5)% Total $248,913 $243,525 $5,388 2.2% 0.6% 5 * A non-GAAP financial measure, representing revenue growth on a constant currency (“CC”) basis. See "Notes to Non-GAAP Financial Measures" below for additional information regarding non-GAAP measures used in this presentation. In thousands, except percentages |
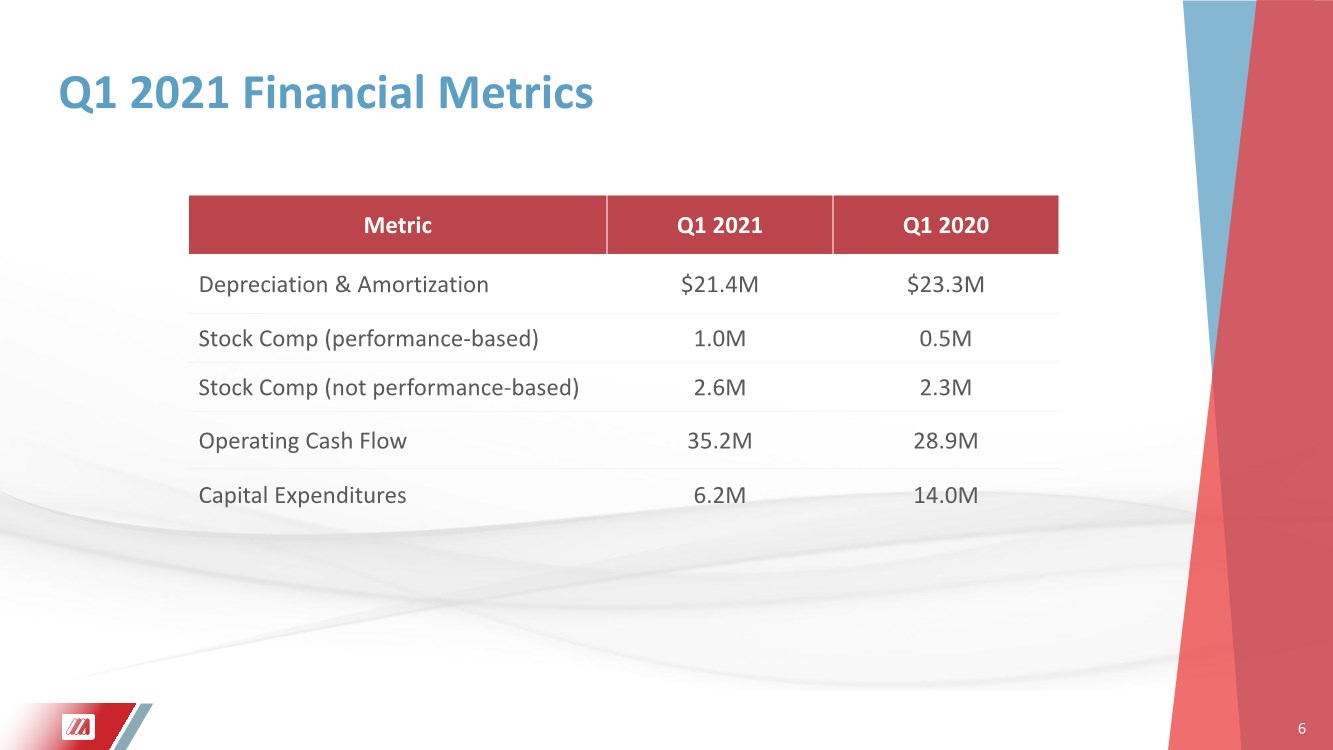
| 6 Q1 2021 Financial Metrics Metric Q1 2021 Q1 2020 Depreciation & Amortization $21.4M $23.3M Stock Comp (performance-based) 1.0M 0.5M Stock Comp (not performance-based) 2.6M 2.3M Operating Cash Flow 35.2M 28.9M Capital Expenditures 6.2M 14.0M 6 |
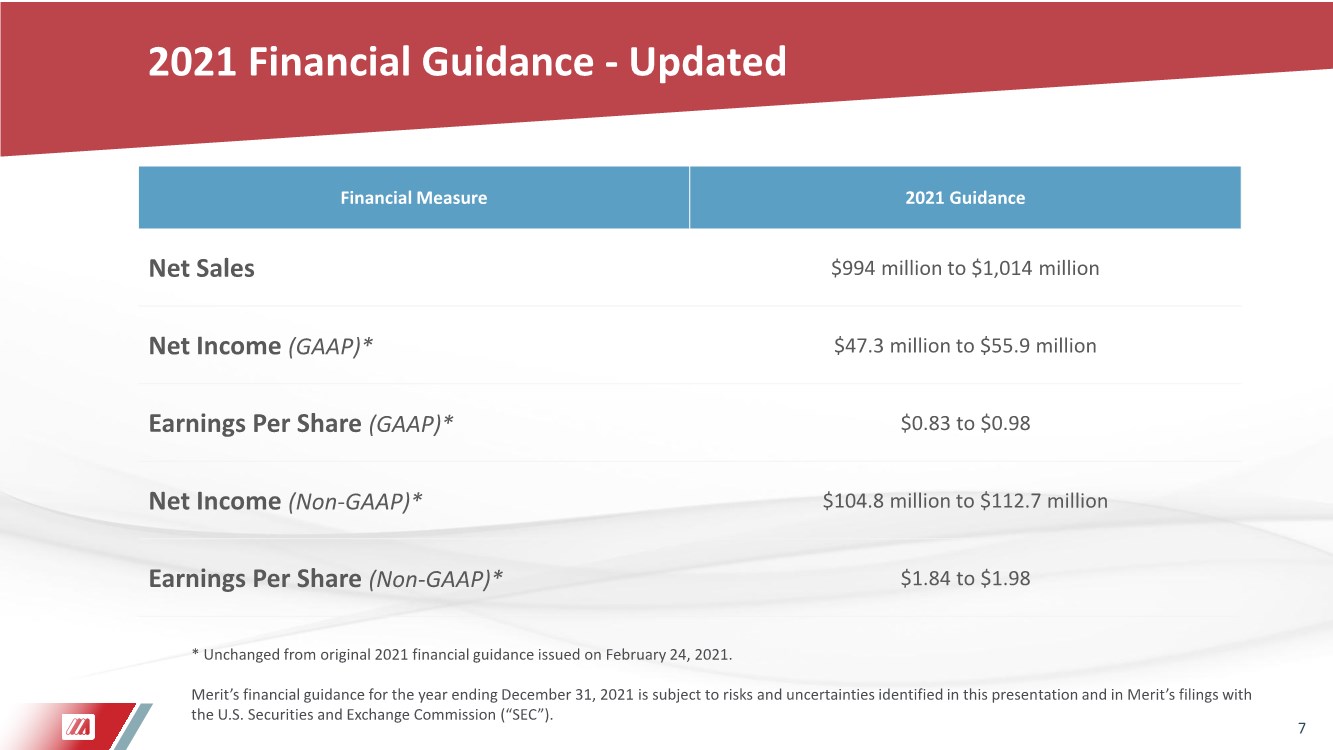
| 7 * Unchanged from original 2021 financial guidance issued on February 24, 2021. Merit’s financial guidance for the year ending December 31, 2021 is subject to risks and uncertainties identified in this presentation and in Merit’s filings with the U.S. Securities and Exchange Commission (“SEC”). Financial Measure 2021 Guidance Net Sales $994 million to $1,014 million Net Income (GAAP)* $47.3 million to $55.9 million Earnings Per Share (GAAP)* $0.83 to $0.98 Net Income (Non-GAAP)* $104.8 million to $112.7 million Earnings Per Share (Non-GAAP)* $1.84 to $1.98 2021 Financial Guidance - Updated |
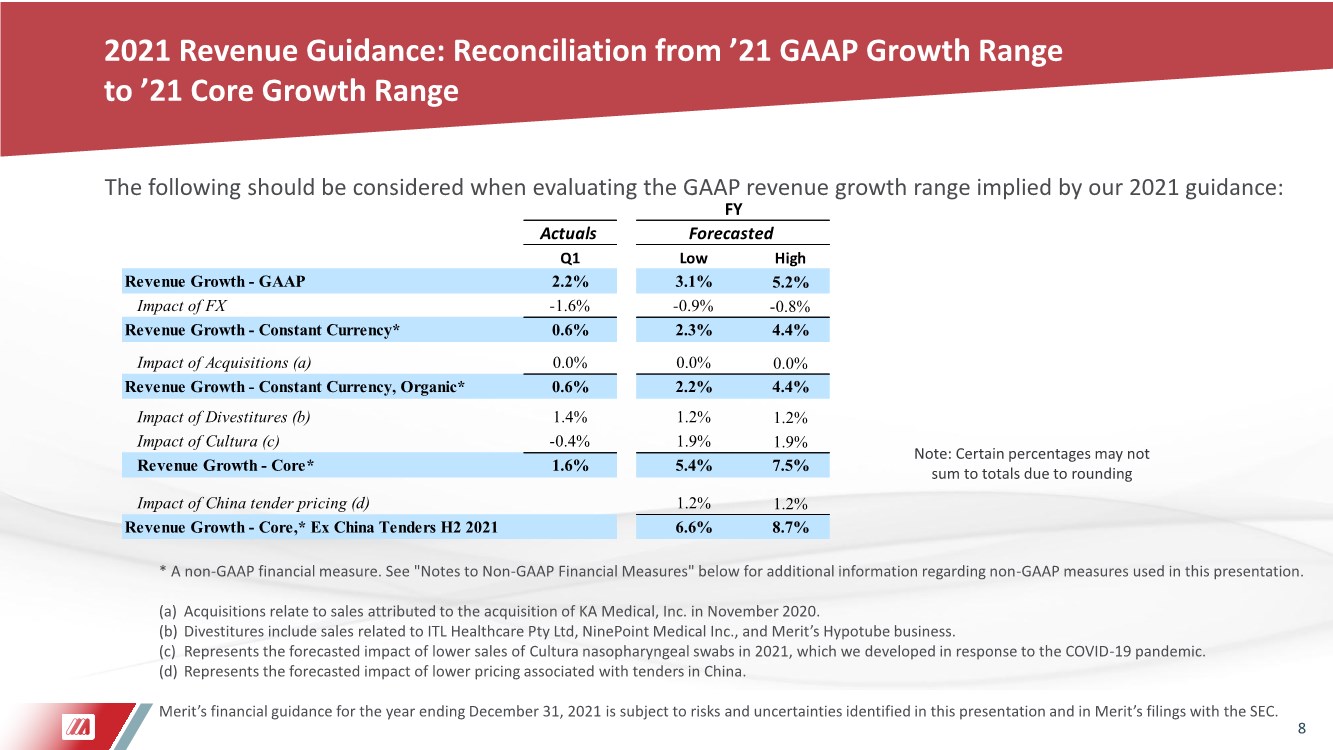
| 8 * A non-GAAP financial measure. See "Notes to Non-GAAP Financial Measures" below for additional information regarding non-GAAP measures used in this presentation. (a) Acquisitions relate to sales attributed to the acquisition of KA Medical, Inc. in November 2020. (b) Divestitures include sales related to ITL Healthcare Pty Ltd, NinePoint Medical Inc., and Merit’s Hypotube business. (c) Represents the forecasted impact of lower sales of Cultura nasopharyngeal swabs in 2021, which we developed in response to the COVID-19 pandemic. (d) Represents the forecasted impact of lower pricing associated with tenders in China. Merit’s financial guidance for the year ending December 31, 2021 is subject to risks and uncertainties identified in this presentation and in Merit’s filings with the SEC. Note: Certain percentages may not sum to totals due to rounding The following should be considered when evaluating the GAAP revenue growth range implied by our 2021 guidance: 2021 Revenue Guidance: Reconciliation from ’21 GAAP Growth Range to ’21 Core Growth Range Actuals Q1 Low High Revenue Growth - GAAP 2.2% 3.1% 5.2% Impact of FX -1.6% -0.9% -0.8% Revenue Growth - Constant Currency* 0.6% 2.3% 4.4% Impact of Acquisitions (a) 0.0% 0.0% 0.0% Revenue Growth - Constant Currency, Organic* 0.6% 2.2% 4.4% Impact of Divestitures (b) 1.4% 1.2% 1.2% Impact of Cultura (c) -0.4% 1.9% 1.9% Revenue Growth - Core* 1.6% 5.4% 7.5% Impact of China tender pricing (d) 1.2% 1.2% Revenue Growth - Core,* Ex China Tenders H2 2021 6.6% 8.7% Forecasted FY |
| 9 Appendix 9 |

| 10 Notes to Non-GAAP Financial Measures For additional details, please see the accompanying press release and forward-looking statement disclosure. These presentation materials and associated commentary from Merit’s management, as well as the press release issued today, use non-GAAP financial measures, including: • constant currency revenue; • constant currency revenue, organic; • core revenue; • non-GAAP gross margin; • non-GAAP operating income and margin; • non-GAAP net income; • non-GAAP earnings per share; and • free cash flow. Merit’s management team uses these non-GAAP financial measures to evaluate Merit’s profitability and efficiency, to compare operating and financial results to prior periods, to evaluate changes in the results of its operating segments, and to measure and allocate financial resources internally. However, Merit’s management does not consider such non- GAAP measures in isolation or as an alternative to measures determined in accordance with GAAP. Readers should consider non-GAAP measures used in this presentation in addition to, not as a substitute for, financial reporting measures prepared in accordance with GAAP. These non-GAAP financial measures generally exclude some, but not all, items that may affect Merit’s net income. In addition, they are subject to inherent limitations as they reflect the exercise of judgment by management about which items are excluded. Merit believes it is useful to exclude such items in the calculation of non-GAAP earnings per share, non-GAAP gross margin, non-GAAP operating income and margin, and non-GAAP net income (in each case, as further illustrated in the reconciliation tables below) because such amounts in any specific period may not directly correlate to the underlying performance of Merit’s business operations and can vary significantly between periods as a result of factors such as acquisition or other extraordinary transactions, non-cash expenses related to amortization or write-off of previously acquired tangible and intangible assets, severance expenses, expenses resulting from non-ordinary course litigation or administrative proceedings and resulting settlements, corporate transformation expenses, governmental proceedings or changes in tax or industry regulations, gains or losses on disposal of certain assets, and debt issuance costs. Merit may incur similar types of expenses in the future, and the non-GAAP financial information included in this presentation should not be viewed as a statement or indication that these types of expenses will not recur. Additionally, the non-GAAP financial measures used in this presentation may not be comparable with similarly titled measures of other companies. Merit urges investors and potential investors to review the reconciliations of its non-GAAP financial measures to the comparable GAAP financial measures, and not to rely on any single financial measure to evaluate Merit’s business or results of operations. |
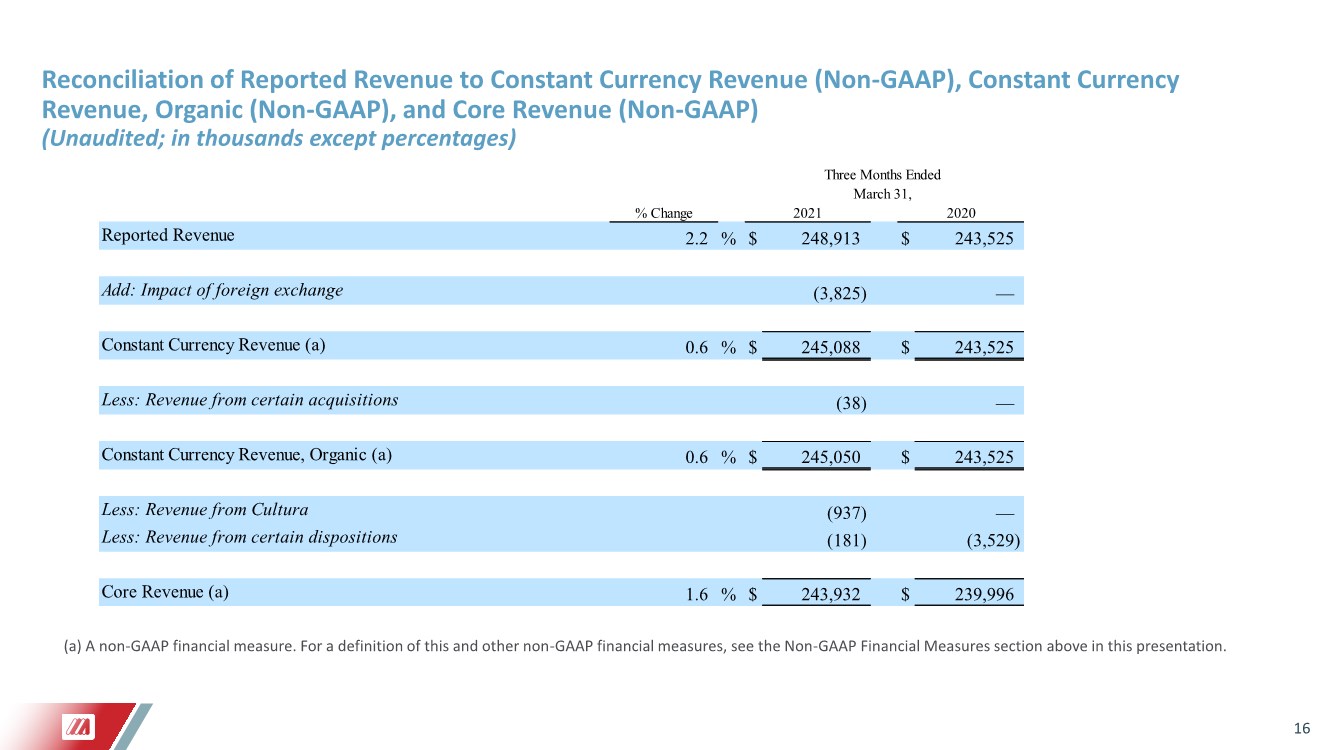
| 11 Notes to Non-GAAP Financial Measures (cont.) Constant Currency Revenue Merit’s constant currency revenue is prepared by converting the current-period reported revenue of subsidiaries whose functional currency is a currency other than the U.S. dollar at the applicable foreign exchange rates in effect during the comparable prior-year period, and adjusting for the effects of hedging transactions on reported revenue, which are recorded in the U.S. The constant currency revenue adjustment of ($3.8) million to reported revenue for the three-month period ended March 31, 2021 was calculated using the applicable average foreign exchange rates for the three-month period ended March 31, 2020. Constant Currency Revenue, Organic Merit’s constant currency revenue, organic, is defined, with respect to prior fiscal year periods, as GAAP revenue. With respect to current fiscal year periods, constant currency revenue, organic, is defined as constant currency revenue (as defined above), less revenue from certain acquisitions. For the three-month period ended March 31, 2021, Merit’s constant currency revenue, organic, excludes revenues attributable to the acquisition of KA Medical, LLC in November 2020. Core Revenue Merit’s core revenue is defined, with respect to prior fiscal year periods, as GAAP revenue less revenue from certain dispositions. For the three-month period ended March 31, 2020, Merit’s core revenue excludes revenues attributable to its distribution agreement with NinePoint Medical, Inc., which was suspended during the first quarter of 2020, revenues attributable to the manufacture of Merit’s Hypotube product which were divested in August 2020, and revenues attributable to the ITL Healthcare Pty Ltd (“ITL”) procedure pack business in Australia which was closed in December 2020 With respect to current fiscal year periods, core revenue is defined as constant currency revenue, organic (as defined above), less $0.9 million of revenue attributable to sales of the Cultura nasopharyngeal swab and test kit (which benefited from high demand in 2020 resulting from the COVID-19 pandemic but which is not expected to be a significant revenue contribution in the future), as well as $0.2 million of revenue attributable to the final sales of products from the closed ITL procedure pack business (which were carried over from the fourth quarter of 2020 to the first quarter of 2021 and are not expected to impact sales in future periods). |
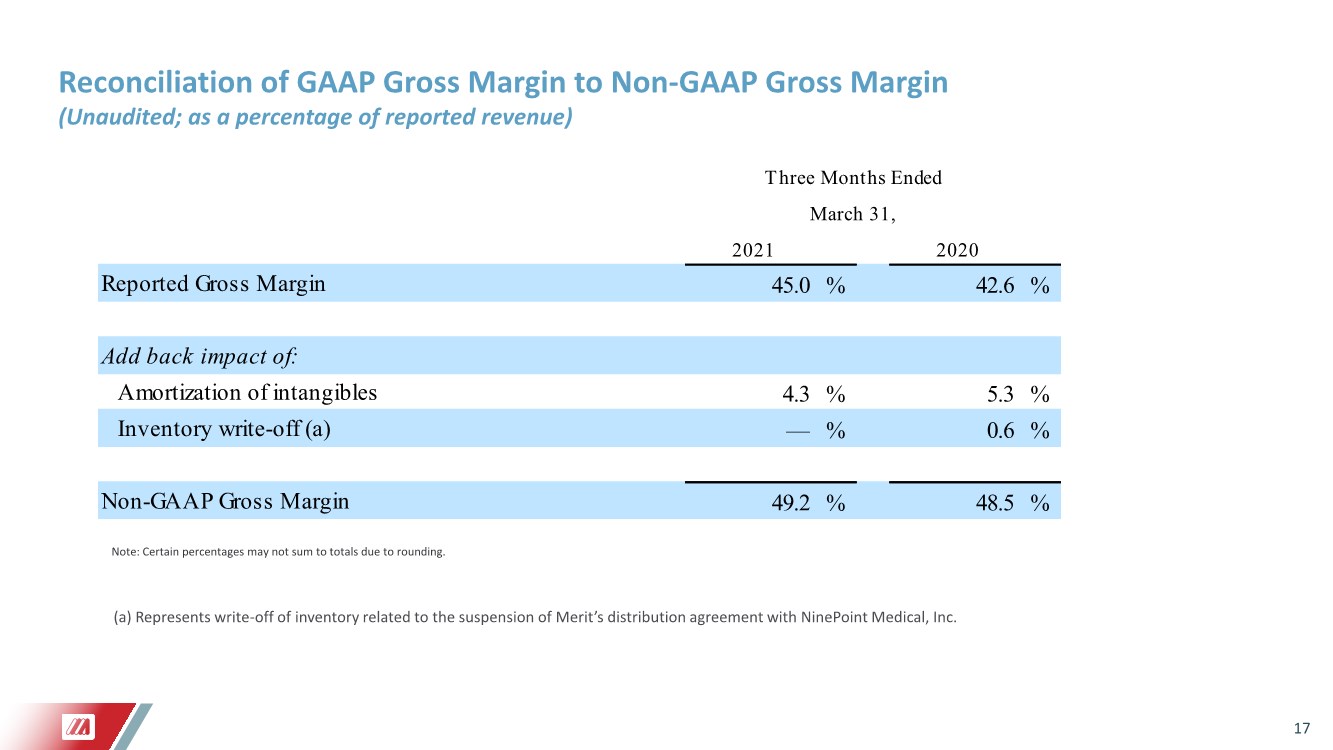
| 12 Notes to Non-GAAP Financial Measures (cont.) Non-GAAP Gross Margin Non-GAAP gross margin is calculated by reducing GAAP cost of sales by amounts recorded for amortization of intangible assets and certain inventory write-offs, divided by reported net sales. Non-GAAP Operating Income and Margin Non-GAAP operating income is calculated by adjusting GAAP operating income for certain items which are deemed by Merit’s management to be outside of core operations and vary in amount and frequency among periods, such as expenses related to new acquisitions, non-cash expenses related to amortization or write-off of previously acquired tangible and intangible assets, certain severance expenses, performance-based stock compensation expenses, corporate transformation expenses, expenses resulting from non-ordinary course litigation or administrative proceedings and resulting settlements, governmental proceedings or changes in industry regulations, as well as other items set forth in the tables below. Non-GAAP operating margin is calculated by dividing non-GAAP operating income by reported net sales. Non-GAAP Net Income Non-GAAP net income is calculated by adjusting GAAP net income (loss) for the items set forth in the definition of non-GAAP operating margin above, as well as for expenses related to debt issuance costs, gains or losses on disposal of certain assets, changes in tax regulations, as well as other items set forth in the tables below. Non-GAAP EPS Non-GAAP EPS is defined as non-GAAP net income divided by the diluted shares outstanding for the corresponding period. Free Cash Flow Free cash flow is defined as cash flow from operations calculated in accordance with GAAP, less capital expenditures calculated in accordance with GAAP, as set forth in the consolidated statement of cash flows. Other Non-GAAP Financial Measure Reconciliation The following tables set forth supplemental financial data and corresponding reconciliations of non-GAAP financial measures to Merit’s corresponding financial measures prepared in accordance with GAAP, in each case, for the three-month periods ended March 31, 2021 and 2020. The non-GAAP income adjustments referenced in the following tables do not reflect non-performance-based stock compensation expense of approximately $2.6 million and $2.3 million for the three-month periods ended March 31, 2021 and 2020, respectively. |
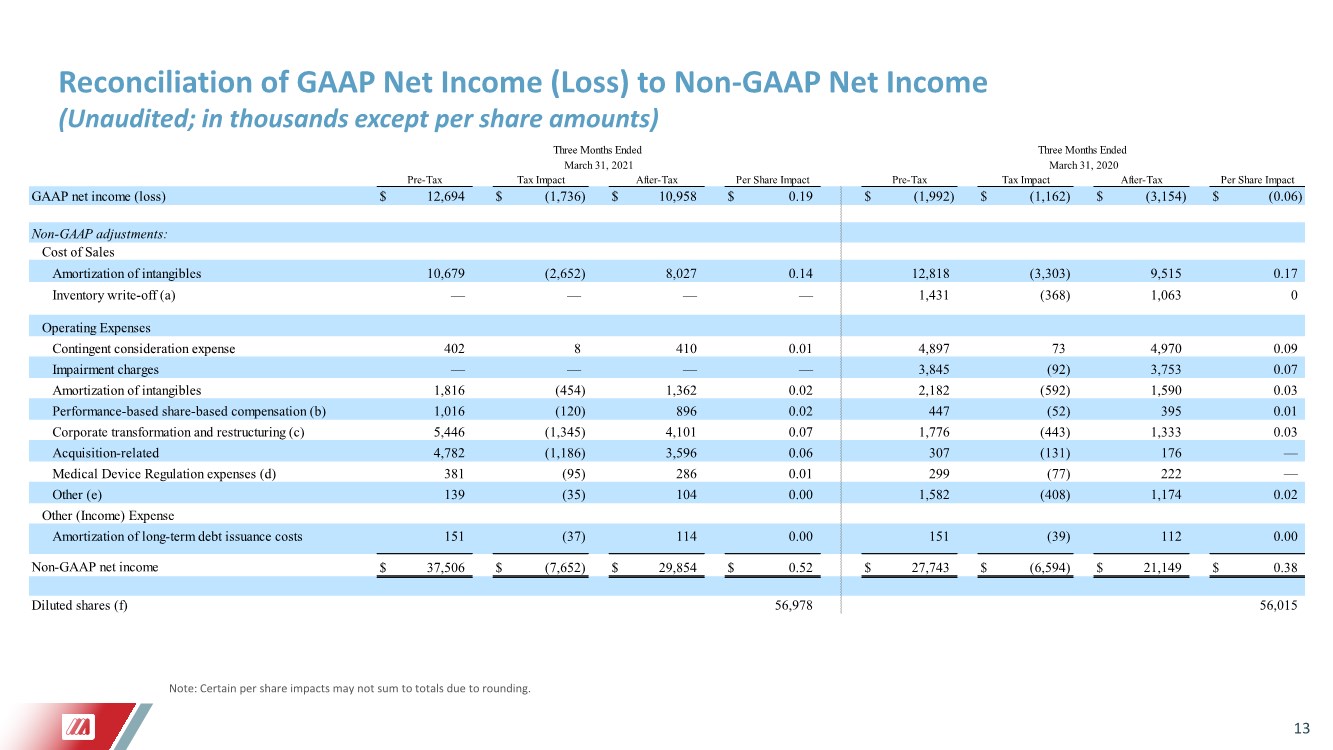
| 13 Reconciliation of GAAP Net Income (Loss) to Non-GAAP Net Income (Unaudited; in thousands except per share amounts) Note: Certain per share impacts may not sum to totals due to rounding. GAAP net income (loss) $ 12,694 $ (1,736) $ 10,958 $ 0.19 $ (1,992) $ (1,162) $ (3,154) $ (0.06) Non-GAAP adjustments: Cost of Sales Amortization of intangibles 10,679 (2,652) 8,027 0.14 12,818 (3,303) 9,515 0.17 Inventory write-off (a) — — — — 1,431 (368) 1,063 0 Operating Expenses Contingent consideration expense 402 8 410 0.01 4,897 73 4,970 0.09 Impairment charges — — — — 3,845 (92) 3,753 0.07 Amortization of intangibles 1,816 (454) 1,362 0.02 2,182 (592) 1,590 0.03 Performance-based share-based compensation (b) 1,016 (120) 896 0.02 447 (52) 395 0.01 Corporate transformation and restructuring (c) 5,446 (1,345) 4,101 0.07 1,776 (443) 1,333 0.03 Acquisition-related 4,782 (1,186) 3,596 0.06 307 (131) 176 — Medical Device Regulation expenses (d) 381 (95) 286 0.01 299 (77) 222 — Other (e) 139 (35) 104 0.00 1,582 (408) 1,174 0.02 Other (Income) Expense Amortization of long-term debt issuance costs 151 (37) 114 0.00 151 (39) 112 0.00 Non-GAAP net income $ 37,506 $ (7,652) $ 29,854 $ 0.52 $ 27,743 $ (6,594) $ 21,149 $ 0.38 Diluted shares (f) 56,978 56,015 Three Months Ended Three Months Ended March 31, 2021 March 31, 2020 After-Tax Per Share Impact Pre-Tax Tax Impact After-Tax Per Share Impact Pre-Tax Tax Impact |
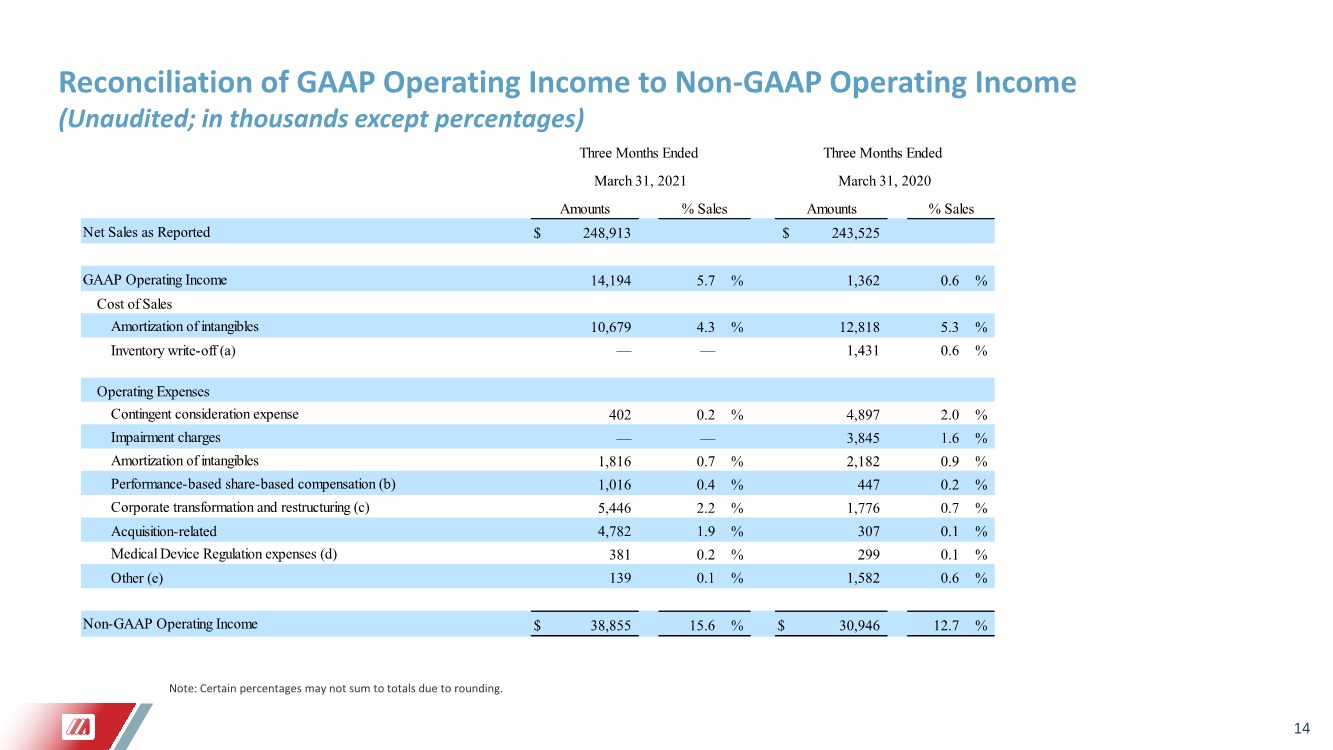
| 14 Reconciliation of GAAP Operating Income to Non-GAAP Operating Income (Unaudited; in thousands except percentages) Reconciliation of GAAP Net Income (Loss) to Non-GAAP Net Income (Unaudited, in thousands except per share amounts) Note: Certain percentages may not sum to totals due to rounding. Net Sales as Reported $ 248,913 $ 243,525 GAAP Operating Income 14,194 5.7 % 1,362 0.6 % Cost of Sales Amortization of intangibles 10,679 4.3 % 12,818 5.3 % Inventory write-off (a) — — 1,431 0.6 % Operating Expenses Contingent consideration expense 402 0.2 % 4,897 2.0 % Impairment charges — — 3,845 1.6 % Amortization of intangibles 1,816 0.7 % 2,182 0.9 % Performance-based share-based compensation (b) 1,016 0.4 % 447 0.2 % Corporate transformation and restructuring (c) 5,446 2.2 % 1,776 0.7 % Acquisition-related 4,782 1.9 % 307 0.1 % Medical Device Regulation expenses (d) 381 0.2 % 299 0.1 % Other (e) 139 0.1 % 1,582 0.6 % Non-GAAP Operating Income $ 38,855 15.6 % $ 30,946 12.7 % Three Months Ended Three Months Ended March 31, 2021 March 31, 2020 Amounts % Sales Amounts % Sales |
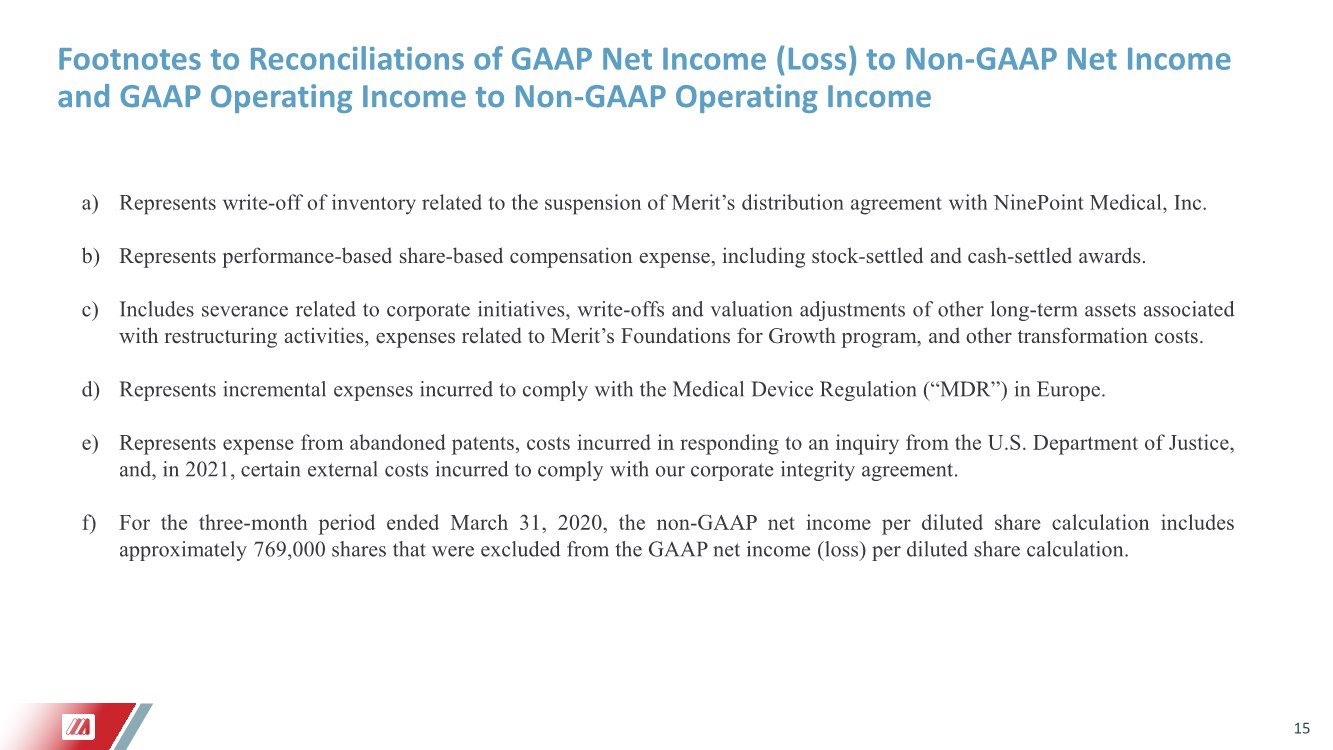
| 15 Footnotes to Reconciliations of GAAP Net Income (Loss) to Non-GAAP Net Income and GAAP Operating Income to Non-GAAP Operating Income a) Represents write-off of inventory related to the suspension of Merit’s distribution agreement with NinePoint Medical, Inc. b) Represents performance-based share-based compensation expense, including stock-settled and cash-settled awards. c) Includes severance related to corporate initiatives, write-offs and valuation adjustments of other long-term assets associated with restructuring activities, expenses related to Merit’s Foundations for Growth program, and other transformation costs. d) Represents incremental expenses incurred to comply with the Medical Device Regulation (“MDR”) in Europe. e) Represents expense from abandoned patents, costs incurred in responding to an inquiry from the U.S. Department of Justice, and, in 2021, certain external costs incurred to comply with our corporate integrity agreement. f) For the three-month period ended March 31, 2020, the non-GAAP net income per diluted share calculation includes approximately 769,000 shares that were excluded from the GAAP net income (loss) per diluted share calculation. |
| 16 Reconciliation of Reported Revenue to Constant Currency Revenue (Non-GAAP), Constant Currency Revenue, Organic (Non-GAAP), and Core Revenue (Non-GAAP) (Unaudited; in thousands except percentages) (a) A non-GAAP financial measure. For a definition of this and other non-GAAP financial measures, see the Non-GAAP Financial Measures section above in this presentation. % Change Reported Revenue 2.2 % $ 248,913 $ 243,525 Add: Impact of foreign exchange (3,825) — Constant Currency Revenue (a) 0.6 % $ 245,088 $ 243,525 Less: Revenue from certain acquisitions (38) — Constant Currency Revenue, Organic (a) 0.6 % $ 245,050 $ 243,525 Less: Revenue from Cultura (937) — Less: Revenue from certain dispositions (181) (3,529) Core Revenue (a) 1.6 % $ 243,932 $ 239,996 Three Months Ended March 31, 2021 2020 |
| 17 2021 2020 Reported Gross Margin 45.0 % 42.6 % Add back impact of: Amortization of intangibles 4.3 % 5.3 % Inventory write-off (a) — % 0.6 % Non-GAAP Gross Margin 49.2 % 48.5 % March 31, Three Months Ended Reconciliation of GAAP Gross Margin to Non-GAAP Gross Margin (Unaudited; as a percentage of reported revenue) (a) Represents write-off of inventory related to the suspension of Merit’s distribution agreement with NinePoint Medical, Inc. Note: Certain percentages may not sum to totals due to rounding. |
|