Attached files
| file | filename |
|---|---|
| EX-99.1 - EX-99.1 - MEDICAL PROPERTIES TRUST INC | d166327dex991.htm |
| 8-K - 8-K - MEDICAL PROPERTIES TRUST INC | d166327d8k.htm |
Exhibit 99.2
Q SUPPLEMENTAL 1 2021

3 COMPANY OVERVIEW Company Information 3 FINANCIAL INFORMATION Reconciliation of Net Income to Funds from Operations 6 6 Debt Summary 7 Debt Maturity Schedule 8 Pro Forma Net Debt /Annualized Adjusted EBITDA 9 PORTFOLIO INFORMATION Lease and Loan Maturity Schedule 10 10 Total Pro Forma Gross Assets and Adjusted Revenue by Asset Type, Operator, State and Country 11 EBITDARM to Rent Coverage 14 Summary of Investments and Development Projects 16 FINANCIAL STATEMENTS 17 Consolidated Statements of Income 17 Consolidated Balance Sheets 18 Unconsolidated Joint Venture Investments 19 FORWARD-LOOKING STATEMENTS Forward-looking statements involve known and unknown risks, uncertainties and other factors that may cause the actual results of the Company or future events to differ materially from those expressed in or underlying such forward-looking statements, including without limitation: Normalized FFO per share; expected payout ratio; the amount of acquisitions of healthcare real estate, if any; estimated debt metrics; portfolio diversification; capital markets conditions; the repayment of debt arrangements; statements concerning the additional income to the Company as a result of ownership interests in certain hospital operations and the timing of such income; the payment of future dividends, if any; completion of additional debt arrangements and additional investments; national and international economic, business, real estate and other market conditions; the competitive environment in which the Company operates; the execution of the Company’s business plan; financing risks; the Company’s ability to maintain its status as a REIT for federal income tax purposes; acquisition and development risks; potential environ- mental and other liabilities; potential impact from COVID-19 on our tenants/ borrowers and the related impact to us; and other factors affecting the real estate industry generally or healthcare real estate in particular. For further discussion of the factors that could affect outcomes, please refer to the “Risk Factors” section of the Company’s Annual Report on Form 10-K for the year ended December 31, 2020, and as updated by the Company’s subsequently filed Quarterly Reports on Form 10-Q and other SEC filings. Except as otherwise required by the federal securities laws, the Company undertakes no obligation to update the information in this report. Certain information in the supplemental package is shown pro forma for the transactions completed subsequent to period end and the consummation of pending transactions. The pro forma adjustments are based upon available information and assumptions that we believe are reasonable. There is no assurance that the pending transactions will occur. Clinica Centenario, an acute care facility in Bogota, Colombia. MEDICAL PROPERTIES TRUST | SUPPLEMENTAL INFORMATION | Q1 2021 2
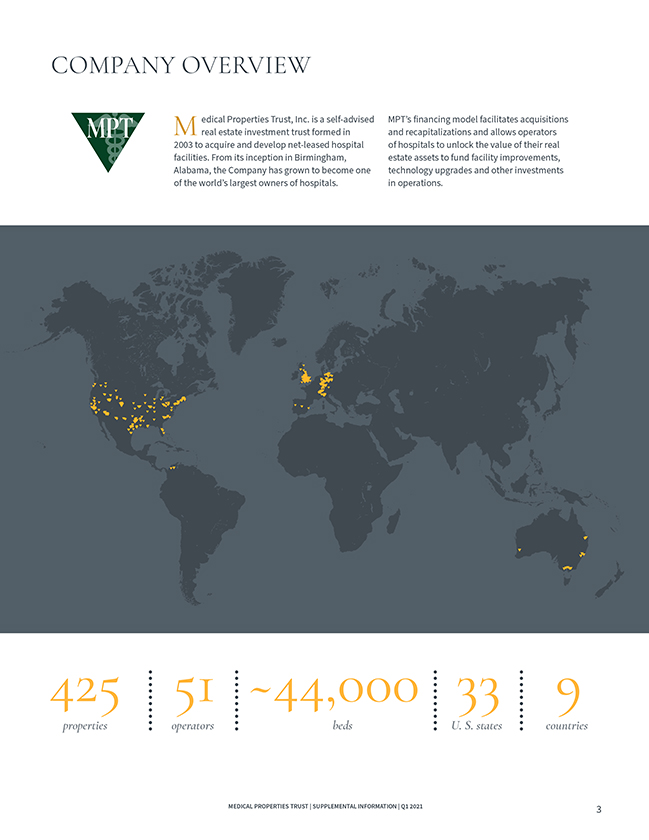
COMPANY OVERVIEW M edical Properties Trust, Inc. is a self-advised MPT’s financing model facilitates acquisitions real estate investment trust formed in and recapitalizations and allows operators 2003 to acquire and develop net-leased hospital of hospitals to unlock the value of their real facilities. From its inception in Birmingham, estate assets to fund facility improvements, Alabama, the Company has grown to become one technology upgrades and other investments of the world’s largest owners of hospitals. in operations. 425 51 ~44,000 33 9 properties operators bedsU. S. states countries MEDICAL PROPERTIES TRUST | SUPPLEMENTAL INFORMATION | Q1 2021 3

COMPANY OVERVIEW MPT OFFICERS: From the Left: Charles R. Lambert, Rosa H. Hooper, R. Lucas Savage, Edward K. Aldag, Jr., R. Steven Hamner, Emmett E. McLean and J. Kevin Hanna. Officers Edward K. Aldag, Jr. Chairman, President and Chief Executive Officer R. Steven Hamner Executive Vice President and Chief Financial Officer Emmett E. McLean Executive Vice President, Chief Operating Officer and Secretary J. Kevin Hanna Vice President, Controller and Chief Accounting Officer Rosa H. Hooper Vice President, Managing Director of Asset Management and Underwriting R. Lucas Savage Vice President, Head of Global Acquisitions Charles R. Lambert Vice President, Treasurer and Managing Director of Capital Markets Board of Directors Corporate Headquarters Edward K. Aldag, Jr. G. Steven Dawson Medical Properties Trust, Inc. R. Steven Hamner 1000 Urban Center Drive, Suite 501 Caterina A. Mozingo Birmingham, AL 35242 Elizabeth N. Pitman (205) 969-3755 D. Paul Sparks, Jr. (205) 969-3756 (fax) Michael G. Stewart C. Reynolds Thompson, III www.medicalpropertiestrust.com MEDICAL PROPERTIES TRUST | SUPPLEMENTAL INFORMATION | Q1 2021 4

COMPANY OVERVIEW INVESTOR RELATIONS Drew BabinTim Berryman Senior Managing Director of Corporate Communications Managing Director of Investor Relations (646) 884-9809 dbabin@medicalpropertiestrust.com (205) 397-8589 tberryman@medicalpropertiestrust.com Stock Exchange Senior Transfer Listing and Unsecured Agent Trading Symbol Debt Ratings American Stock Transfer New York Stock Exchange Moody’s – Ba1 and Trust Company (NYSE): MPW Standard & Poor’s – BBB- 6201 15th Avenue Brooklyn, NY 11219 Above: HM Torrelodones operated by HM Hospitales in Madrid, Spain. MEDICAL PROPERTIES TRUST | SUPPLEMENTAL INFORMATION | Q1 2021 5
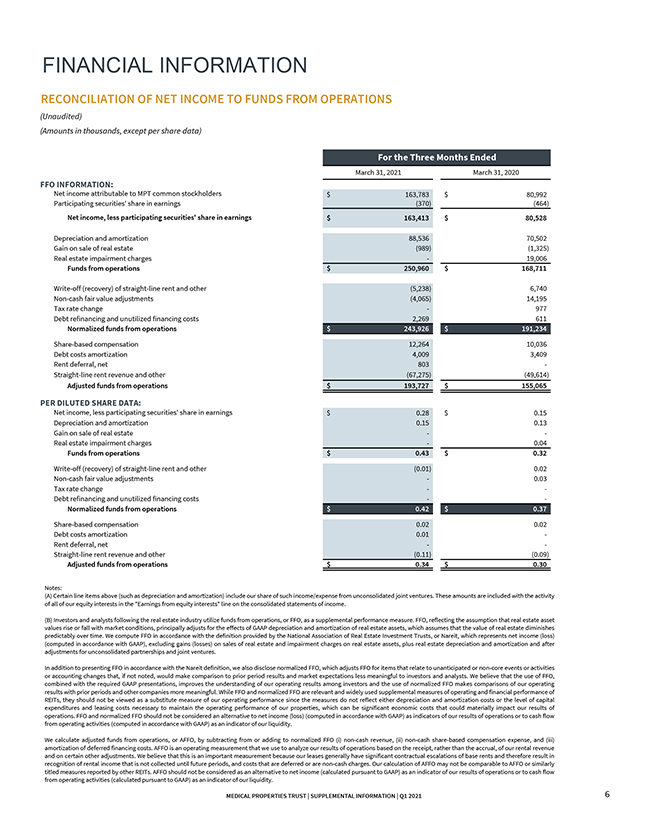
FINANCIAL INFORMATION RECONCILIATION OF NET INCOME TO FUNDS FROM OPERATIONS (Unaudited) (Amounts in thousands, except per share data) For the Three Months Ended March 31, 2021March 31, 2020 FFO INFORMATION: Net income attributable to MPT common stockholders $ 163,783 $ 80,992 Participating securities’ share in earnings(370)(464) Net income, less participating securities’ share in earnings $ 163,413 $ 80,528 Depreciation and amortization88,53670,502 Gain on sale of real estate(989)(1,325) Real estate impairment charges-19,006 Funds from operations $ 250,960 $ 168,711 Write-off (recovery) of straight-line rent and other(5,238)6,740 Non-cash fair value adjustments(4,065)14,195 Tax rate change-977 Debt refinancing and unutilized financing costs2,269611 Normalized funds from operations $ 243,926 $ 191,234 Share-based compensation12,26410,036 Debt costs amortization4,0093,409 Rent deferral, net803- Straight-line rent revenue and other(67,275)(49,614) Adjusted funds from operations $ 193,727 $ 155,065 PER DILUTED SHARE DATA: Net income, less participating securities’ share in earnings $ 0.28 $ 0.15 Depreciation and amortization0.150.13 Gain on sale of real estate— Real estate impairment charges-0.04 Funds from operations $ 0.43 $ 0.32 Write-off (recovery) of straight-line rent and other(0.01)0.02 Non-cash fair value adjustments-0.03 Tax rate change— Debt refinancing and unutilized financing costs— Normalized funds from operations $ 0.42 $ 0.37 Share-based compensation0.020.02 Debt costs amortization0.01- Rent deferral, net-- Straight-line rent revenue and other(0.11)(0.09) Adjusted funds from operations $ 0.34 $ 0.30 Notes: (A) Certain line items above (such as depreciation and amortization) include our share of such income/expense from unconsolidated joint ventures. These amounts are included with the activity of all of our equity interests in the “Earnings from equity interests” line on the consolidated statements of income. (B) Investors and analysts following the real estate industry utilize funds from operations, or FFO, as a supplemental performance measure. FFO, reflecting the assumption that real estate asset values rise or fall with market conditions, principally adjusts for the effects of GAAP depreciation and amortization of real estate assets, which assumes that the value of real estate diminishes predictably over time. We compute FFO in accordance with the definition provided by the National Association of Real Estate Investment Trusts, or Nareit, which represents net income (loss) (computed in accordance with GAAP), excluding gains (losses) on sales of real estate and impairment charges on real estate assets, plus real estate depreciation and amortization and after adjustments for unconsolidated partnerships and joint ventures. In addition to presenting FFO in accordance with the Nareit definition, we also disclose normalized FFO, which adjusts FFO for items that relate to unanticipated or non-core events or activities or accounting changes that, if not noted, would make comparison to prior period results and market expectations less meaningful to investors and analysts. We believe that the use of FFO, combined with the required GAAP presentations, improves the understanding of our operating results among investors and the use of normalized FFO makes comparisons of our operating results with prior periods and other companies more meaningful. While FFO and normalized FFO are relevant and widely used supplemental measures of operating and financial performance of REITs, they should not be viewed as a substitute measure of our operating performance since the measures do not reflect either depreciation and amortization costs or the level of capital expenditures and leasing costs necessary to maintain the operating performance of our properties, which can be significant economic costs that could materially impact our results of operations. FFO and normalized FFO should not be considered an alternative to net income (loss) (computed in accordance with GAAP) as indicators of our results of operations or to cash flow from operating activities (computed in accordance with GAAP) as an indicator of our liquidity. We calculate adjusted funds from operations, or AFFO, by subtracting from or adding to normalized FFO (i) non-cash revenue, (ii) non-cash share-based compensation expense, and (iii) amortization of deferred financing costs. AFFO is an operating measurement that we use to analyze our results of operations based on the receipt, rather than the accrual, of our rental revenue and on certain other adjustments. We believe that this is an important measurement because our leases generally have significant contractual escalations of base rents and therefore result in recognition of rental income that is not collected until future periods, and costs that are deferred or are non-cash charges. Our calculation of AFFO may not be comparable to AFFO or similarly titled measures reported by other REITs. AFFO should not be considered as an alternative to net income (calculated pursuant to GAAP) as an indicator of our results of operations or to cash flow from operating activities (calculated pursuant to GAAP) as an indicator of our liquidity. MEDICAL PROPERTIES TRUST | SUPPLEMENTAL INFORMATION | Q1 2021 6
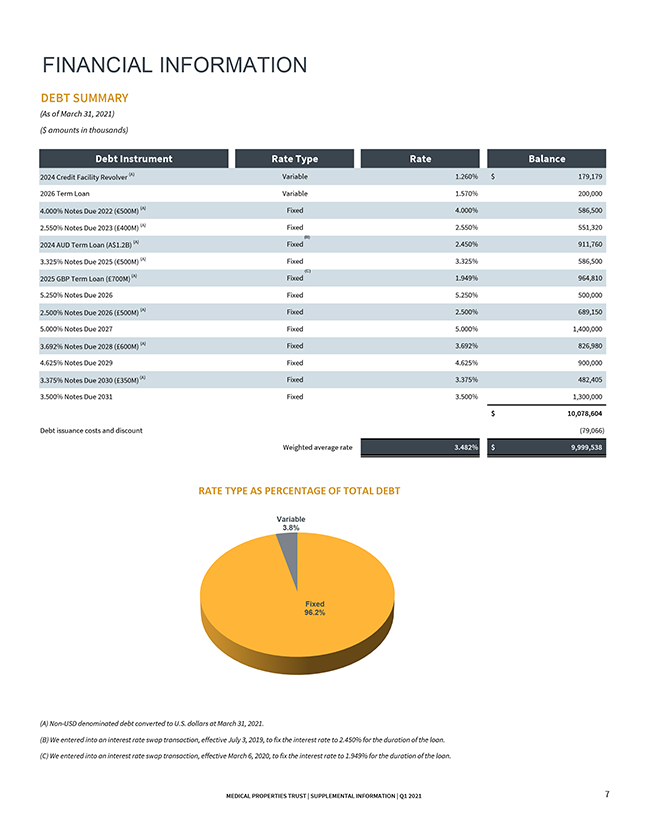
FINANCIAL INFORMATION DEBT SUMMARY (As of March 31, 2021) ($ amounts in thousands) Debt Instrument Rate Type Rate Balance 2024 Credit Facility Revolver (A) Variable1.260% $179,179 2026 Term Loan Variable1.570% 200,000 4.000% Notes Due 2022 (€500M) (A) Fixed4.000% 586,500 2.550% Notes Due 2023 (£400M) (A) Fixed2.550% 551,320 (B) 2024 AUD Term Loan (A$1.2B) (A) Fixed2.450% 911,760 3.325% Notes Due 2025 (€500M) (A) Fixed3.325% 586,500 (C) 2025 GBP Term Loan (£700M) (A) Fixed1.949% 964,810 5.250% Notes Due 2026 Fixed5.250% 500,000 2.500% Notes Due 2026 (£500M) (A) Fixed2.500% 689,150 5.000% Notes Due 2027 Fixed5.000% 1,400,000 3.692% Notes Due 2028 (£600M) (A) Fixed3.692% 826,980 4.625% Notes Due 2029 Fixed4.625% 900,000 3.375% Notes Due 2030 (£350M) (A) Fixed3.375% 482,405 3.500% Notes Due 2031 Fixed3.500% 1,300,000 $10,078,604 Debt issuance costs and discount(79,066) Weighted average rate3.482% $9,999,538 RATE TYPE AS PERCENTAGE OF TOTAL DEBT Variable 3.8% Fixed 96.2% (A) Non-USD denominated debt converted to U.S. dollars at March 31, 2021. (B) We entered into an interest rate swap transaction, effective July 3, 2019, to fix the interest rate to 2.450% for the duration of the loan. (C) We entered into an interest rate swap transaction, effective March 6, 2020, to fix the interest rate to 1.949% for the duration of the loan. MEDICAL PROPERTIES TRUST | SUPPLEMENTAL INFORMATION | Q1 20217
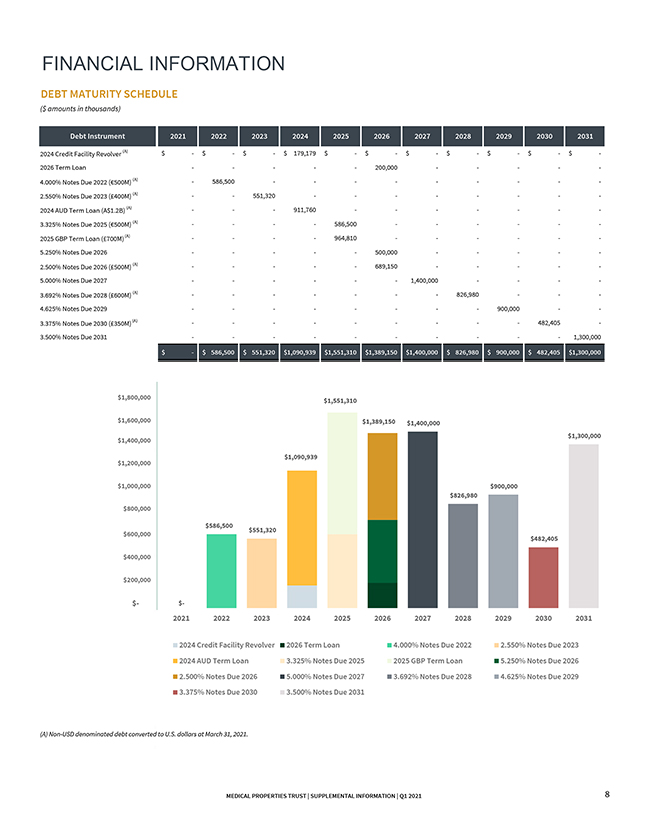
FINANCIAL INFORMATION DEBT MATURITY SCHEDULE ($ amounts in thousands) Debt Instrument202120222023 2024202520262027 2028202920302031 2024 Credit Facility Revolver (A) $- $—$—$ 179,179 $—$—$—$—$—$—$—2026 Term Loan ———200,000-—— 4.000% Notes Due 2022 (€500M) (A) -586,500- ———— 2.550% Notes Due 2023 (£400M) (A) --551,320 ———— 2024 AUD Term Loan (A$1.2B) (A) —- 911,760 ——-— 3.325% Notes Due 2025 (€500M) (A) —- -586,500-—-— 2025 GBP Term Loan (£700M) (A) —- -964,810-—-— 5.250% Notes Due 2026 ———500,000-—— 2.500% Notes Due 2026 (£500M) (A) ———689,150-—— 5.000% Notes Due 2027 —— — 1,400,000--— 3.692% Notes Due 2028 (£600M) (A) —— —-826,980-— 4.625% Notes Due 2029 —— —--900,000-—3.375% Notes Due 2030 (£350M) (A) —— ——-482,405—3.500% Notes Due 2031 —— ——--1,300,000 $- $ 586,500 $ 551,320 $1,090,939 $1,551,310 $1,389,150 $1,400,000 $ 826,980 $ 900,000 $ 482,405 $1,300,000 $1,800,000$ 1,551,310 $1,600,000$1,389,150 $1,400,000 $1,400,000 $ 1,300,000 $1,090,939 $1,200,000 $1,000,000 $ 900,000 $ 826,980 $800,000 $ 586,500 $600,000 $551,320 $ 482,405 $400,000 $200,000 $-$— 202120222023 2024202520262027 2028202920302031 2024 Credit Facility Revolver 2026 Term Loan 4.000% Notes Due 20222.550% Notes Due 2023 2024 AUD Term Loan3.325% Notes Due 20252025 GBP Term Loan5.250% Notes Due 2026 2.500% Notes Due 2026 5.000% Notes Due 20273.692% Notes Due 20284.625% Notes Due 2029 3.375% Notes Due 2030 3.500% Notes Due 2031 (A) Non-USD denominated debt converted to U.S. dollars at March 31, 2021. MEDICAL PROPERTIES TRUST | SUPPLEMENTAL INFORMATION | Q1 20218
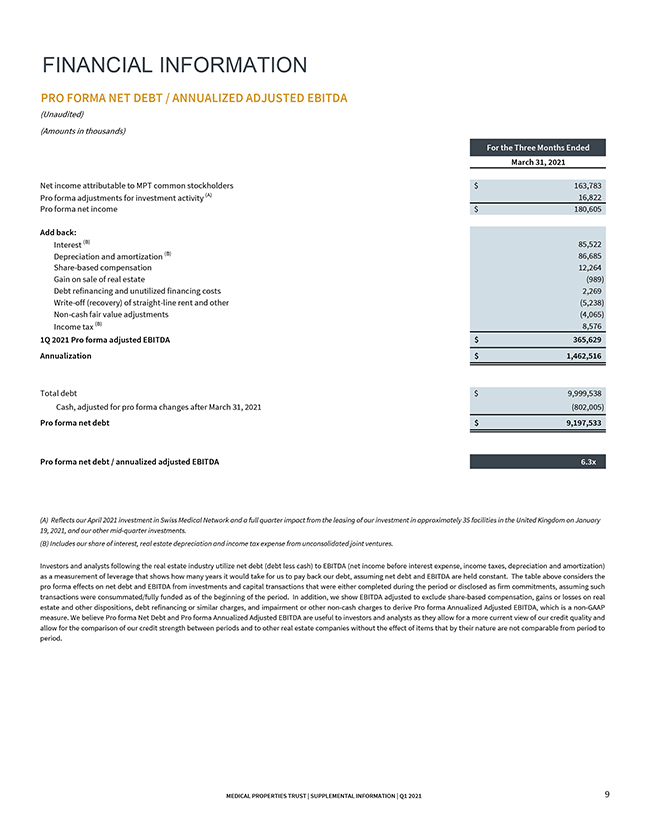
FINANCIAL INFORMATION PRO FORMA NET DEBT / ANNUALIZED ADJUSTED EBITDA (Unaudited) (Amounts in thousands) For the Three Months Ended March 31, 2021 Net income attributable to MPT common stockholders $ 163,783 Pro forma adjustments for investment activity (A)16,822 Pro forma net income $ 180,605 Add back: Interest (B)85,522 Depreciation and amortization (B)86,685 Share-based compensation12,264 Gain on sale of real estate(989) Debt refinancing and unutilized financing costs2,269 Write-off (recovery) of straight-line rent and other(5,238) Non-cash fair value adjustments(4,065) Income tax (B)8,576 1Q 2021 Pro forma adjusted EBITDA $ 365,629 Annualization $ 1,462,516 Total debt $ 9,999,538 Cash, adjusted for pro forma changes after March 31, 2021(802,005) Pro forma net debt $ 9,197,533 Pro forma net debt / annualized adjusted EBITDA6.3x (A) Reflects our April 2021 investment in Swiss Medical Network and a full quarter impact from the leasing of our investment in approximately 35 facilities in the United Kingdom on January 19, 2021, and our other mid-quarter investments. (B) Includes our share of interest, real estate depreciation and income tax expense from unconsolidated joint ventures. Investors and analysts following the real estate industry utilize net debt (debt less cash) to EBITDA (net income before interest expense, income taxes, depreciation and amortization) as a measurement of leverage that shows how many years it would take for us to pay back our debt, assuming net debt and EBITDA are held constant. The table above considers the pro forma effects on net debt and EBITDA from investments and capital transactions that were either completed during the period or disclosed as firm commitments, assuming such transactions were consummated/fully funded as of the beginning of the period. In addition, we show EBITDA adjusted to exclude share-based compensation, gains or losses on real estate and other dispositions, debt refinancing or similar charges, and impairment or other non-cash charges to derive Pro forma Annualized Adjusted EBITDA, which is a non-GAAP measure. We believe Pro forma Net Debt and Pro forma Annualized Adjusted EBITDA are useful to investors and analysts as they allow for a more current view of our credit quality and allow for the comparison of our credit strength between periods and to other real estate companies without the effect of items that by their nature are not comparable from period to period. MEDICAL PROPERTIES TRUST | SUPPLEMENTAL INFORMATION | Q1 20219
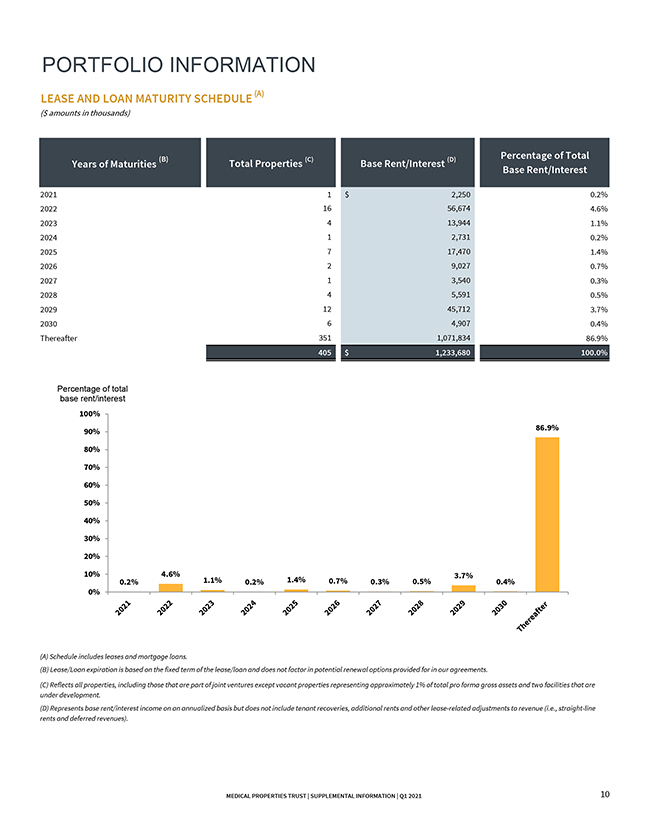
PORTFOLIO INFORMATION LEASE AND LOAN MATURITY SCHEDULE (A) ($ amounts in thousands) (B)Percentage of Total Years of MaturitiesTotal Properties (C) Base Rent/Interest (D) Base Rent/Interest 20211 $2,250 0.2% 20221656,674 4.6% 2023413,944 1.1% 202412,731 0.2% 2025717,470 1.4% 202629,027 0.7% 202713,540 0.3% 202845,591 0.5% 20291245,712 3.7% 203064,907 0.4% Thereafter3511,071,834 86.9% 405 $1,233,680 100.0% Percentage of total base rent/interest 100% 90% 86.9% 80% 70% 60% 50% 40% 30% 20% 10% 4.6% 3.7% 0.2% 1.1% 0.2% 1.4% 0.7% 0.3% 0.5% 0.4% 0% (A) Schedule includes leases and mortgage loans. (B) Lease/Loan expiration is based on the fixed term of the lease/loan and does not factor in potential renewal options provided for in our agreements. (C) Reflects all properties, including those that are part of joint ventures except vacant properties representing approximately 1% of total pro forma gross assets and two facilities that are under development. (D) Represents base rent/interest income on an annualized basis but does not include tenant recoveries, additional rents and other lease-related adjustments to revenue (i.e., straight-line rents and deferred revenues). MEDICAL PROPERTIES TRUST | SUPPLEMENTAL INFORMATION | Q1 2021 10
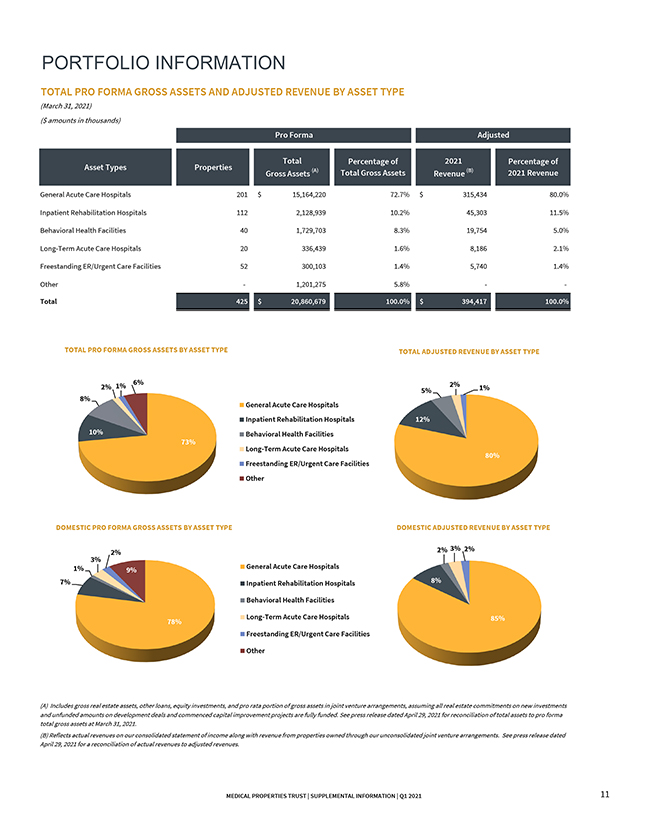
PORTFOLIO INFORMATION TOTAL PRO FORMA GROSS ASSETS AND ADJUSTED REVENUE BY ASSET TYPE (March 31, 2021) ($ amounts in thousands) Pro Forma Adjusted Total Percentage of2021 Percentage of Asset Types PropertiesGross Assets (A) Total Gross AssetsRevenue (B) 2021 Revenue General Acute Care Hospitals201 $ 15,164,22072.7% $315,434 80.0% Inpatient Rehabilitation Hospitals112 2,128,93910.2% 45,303 11.5% Behavioral Health Facilities40 1,729,7038.3% 19,754 5.0% Long-Term Acute Care Hospitals20 336,4391.6% 8,186 2.1% Freestanding ER/Urgent Care Facilities52 300,1031.4% 5,740 1.4% Other—1,201,2755.8% — Total 425 $ 20,860,679100.0% $394,417 100.0% TOTAL PRO FORMA GROSS ASSETS BY ASSET TYPETOTAL ADJUSTED REVENUE BY ASSET TYPE 2% 1% 6% 2% 1% 5% 8% General Acute Care Hospitals Inpatient Rehabilitation Hospitals 12% 10%Behavioral Health Facilities 73% Long-Term Acute Care Hospitals 80% Freestanding ER/Urgent Care Facilities Other DOMESTIC PRO FORMA GROSS ASSETS BY ASSET TYPEDOMESTIC ADJUSTED REVENUE BY ASSET TYPE 2% 2% 3% 2% 3% 1% 9%General Acute Care Hospitals 7% Inpatient Rehabilitation Hospitals 8% Behavioral Health Facilities 78% Long-Term Acute Care Hospitals85% Freestanding ER/Urgent Care Facilities Other (A) Includes gross real estate assets, other loans, equity investments, and pro rata portion of gross assets in joint venture arrangements, assuming all real estate commitments on new investments and unfunded amounts on development deals and commenced capital improvement projects are fully funded. See press release dated April 29, 2021 for reconciliation of total assets to pro forma total gross assets at March 31, 2021. (B) Reflects actual revenues on our consolidated statement of income along with revenue from properties owned through our unconsolidated joint venture arrangements. See press release dated April 29, 2021 for a reconciliation of actual revenues to adjusted revenues. MEDICAL PROPERTIES TRUST | SUPPLEMENTAL INFORMATION | Q1 202111
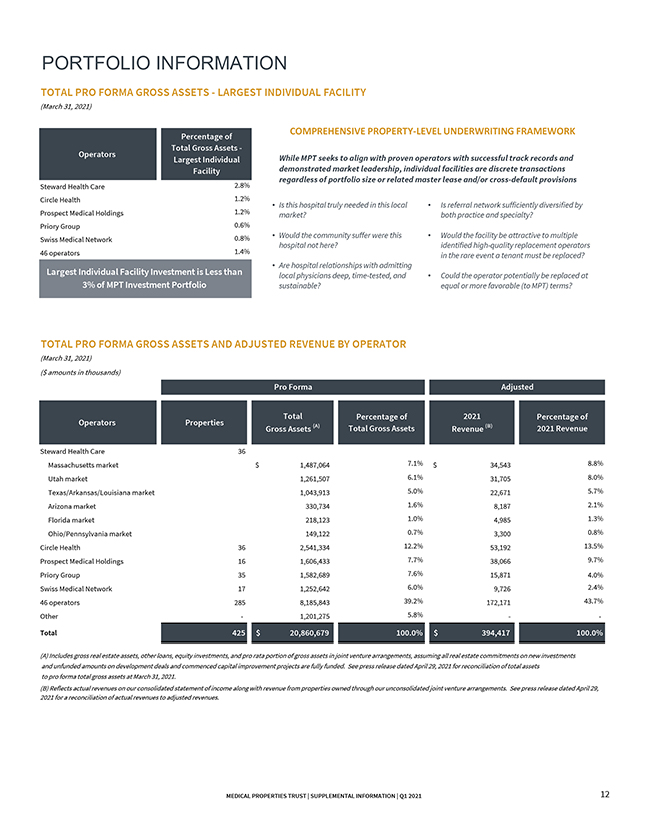
PORTFOLIO INFORMATION TOTAL PRO FORMA GROSS ASSETS—LARGEST INDIVIDUAL FACILITY (March 31, 2021) Percentage of COMPREHENSIVE PROPERTY-LEVEL UNDERWRITING FRAMEWORK Total Gross Assets—Operators Largest IndividualWhile MPT seeks to align with proven operators with successful track records and Facility demonstrated market leadership, individual facilities are discrete transactions regardless of portfolio size or related master lease and/or cross-default provisions Steward Health Care2.8% Circle Health1.2% • Is this hospital truly needed in this local • Is referral network sufficiently diversified by Prospect Medical Holdings1.2%market? both practice and specialty? Priory Group0.6% Swiss Medical Network0.8% • Would the community suffer were this • Would the facility be attractive to multiple hospital not here? identified high-quality replacement operators 46 operators1.4% in the rare event a tenant must be replaced? • Are hospital relationships with admitting Largest Individual Facility Investment is Less thanlocal physicians deep, time-tested, and • Could the operator potentially be replaced at 3% of MPT Investment Portfolio sustainable? equal or more favorable (to MPT) terms? TOTAL PRO FORMA GROSS ASSETS AND ADJUSTED REVENUE BY OPERATOR (March 31, 2021) ($ amounts in thousands) Pro Forma Adjusted Total Percentage of2021 Percentage of Operators PropertiesGross Assets (A) Total Gross AssetsRevenue (B) 2021 Revenue Steward Health Care36 Massachusetts market $ 1,487,064 7.1% $ 34,543 8.8% Utah market1,261,507 6.1%31,705 8.0% Texas/Arkansas/Louisiana market1,043,913 5.0%22,671 5.7% Arizona market330,734 1.6%8,187 2.1% Florida market218,123 1.0%4,985 1.3% Ohio/Pennsylvania market149,122 0.7%3,300 0.8% Circle Health362,541,334 12.2%53,192 13.5% Prospect Medical Holdings161,606,433 7.7%38,066 9.7% Priory Group351,582,689 7.6%15,871 4.0% Swiss Medical Network171,252,642 6.0%9,726 2.4% 46 operators2858,185,843 39.2%172,171 43.7% Other-1,201,275 5.8%— Total425 $ 20,860,679 100.0% $ 394,417 100.0% (A) Includes gross real estate assets, other loans, equity investments, and pro rata portion of gross assets in joint venture arrangements, assuming all real estate commitments on new investments and unfunded amounts on development deals and commenced capital improvement projects are fully funded. See press release dated April 29, 2021 for reconciliation of total assets to pro forma total gross assets at March 31, 2021. (B) Reflects actual revenues on our consolidated statement of income along with revenue from properties owned through our unconsolidated joint venture arrangements. See press release dated April 29, 2021 for a reconciliation of actual revenues to adjusted revenues. MEDICAL PROPERTIES TRUST | SUPPLEMENTAL INFORMATION | Q1 2021 12
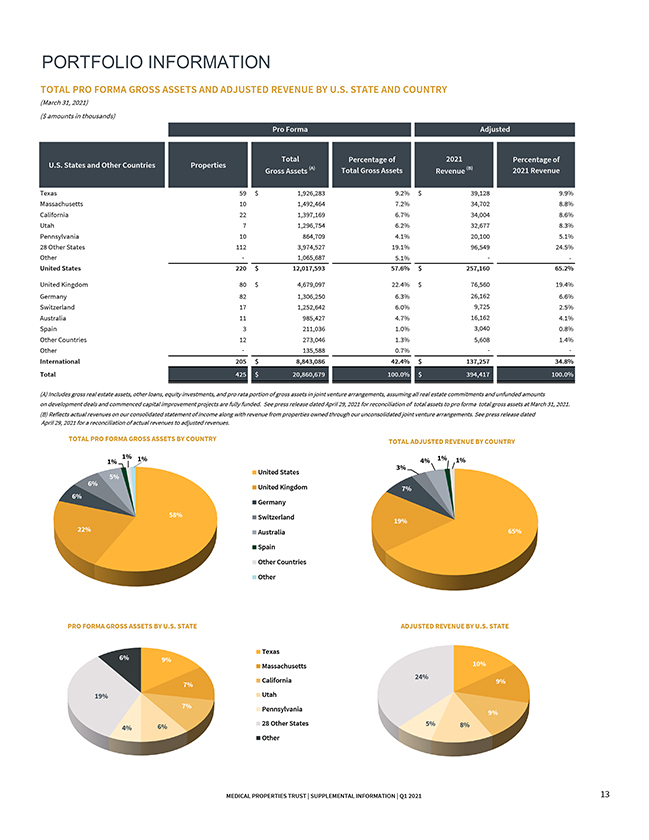
PORTFOLIO INFORMATION TOTAL PRO FORMA GROSS ASSETS AND ADJUSTED REVENUE BY U.S. STATE AND COUNTRY (March 31, 2021) ($ amounts in thousands) Pro FormaAdjusted Total Percentage of 2021 Percentage of U.S. States and Other Countries Properties Gross Assets (A) Total Gross Assets Revenue (B) 2021 Revenue Texas59 $ 1,926,283 9.2% $39,128 9.9% Massachusetts101,492,464 7.2% 34,702 8.8% California221,397,169 6.7% 34,004 8.6% Utah71,296,754 6.2% 32,677 8.3% Pennsylvania10864,709 4.1% 20,100 5.1% 28 Other States1123,974,527 19.1% 96,549 24.5% Other-1,065,687 5.1% — United States220 $ 12,017,593 57.6% $ 257,160 65.2% United Kingdom80 $ 4,679,097 22.4% $76,560 19.4% Germany821,306,250 6.3% 26,162 6.6% Switzerland171,252,642 6.0% 9,725 2.5% Australia11985,427 4.7% 16,162 4.1% Spain3211,036 1.0% 3,040 0.8% Other Countries12273,046 1.3% 5,608 1.4% Other-135,588 0.7% — International205 $ 8,843,086 42.4% $ 137,257 34.8% Total425 $ 20,860,679 100.0% $ 394,417 100.0% (A) Includes gross real estate assets, other loans, equity investments, and pro rata portion of gross assets in joint venture arrangements, assuming all real estate commitments and unfunded amounts on development deals and commenced capital improvement projects are fully funded. See press release dated April 29, 2021 for reconciliation of total assets to pro forma total gross assets at March 31, 2021. (B) Reflects actual revenues on our consolidated statement of income along with revenue from properties owned through our unconsolidated joint venture arrangements. See press release dated April 29, 2021 for a reconciliation of actual revenues to adjusted revenues. TOTAL PRO FORMA GROSS ASSETS BY COUNTRYTOTAL ADJUSTED REVENUE BY COUNTRY 1% 1% 1%4% 1% 1% 3% 5% United States 6% United Kingdom 7% 6% Germany 58%Switzerland 19% 22% Australia65% Spain Other Countries Other PRO FORMA GROSS ASSETS BY U.S. STATEADJUSTED REVENUE BY U.S. STATE Texas 6% 9% Massachusetts10% 24% 7% California9% 19%Utah 7% Pennsylvania 9% 4% 6% 28 Other States 5% 8% Other MEDICAL PROPERTIES TRUST | SUPPLEMENTAL INFORMATION | Q1 2021 13
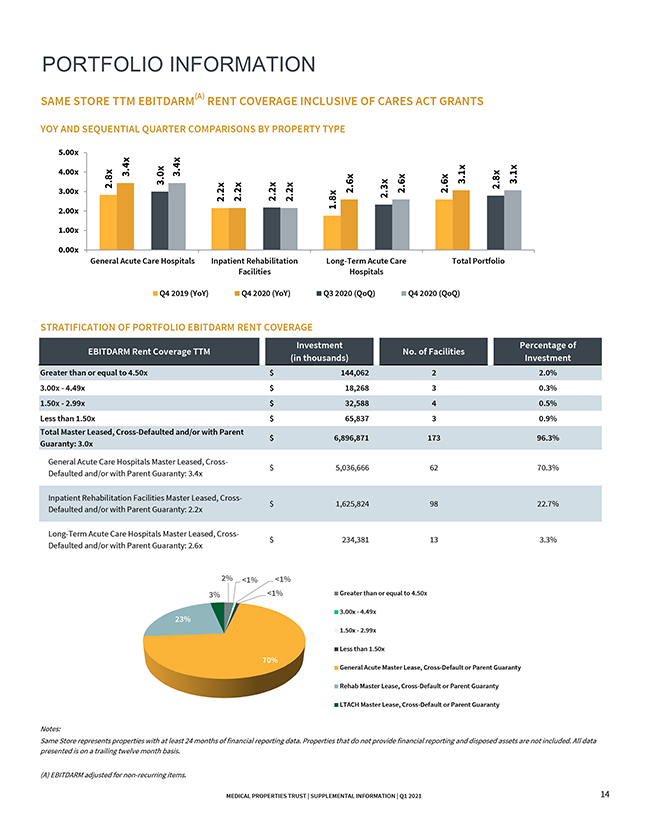
PORTFOLIO INFORMATION SAME STORE TTM EBITDARM(A) RENT COVERAGE INCLUSIVE OF CARES ACT GRANTS YOY AND SEQUENTIAL QUARTER COMPARISONS BY PROPERTY TYPE 5.00x 4.00x 3.4x 3.4x 3.00x 2.8x 3.0x 2.2x 2.2x 2.2x 2.2x 2.6x 2.3x 2.6x 2.6x 3.1x 2.8x 3.1x 2.00x1.8x 1.00x 0.00x General Acute Care Hospitals Inpatient Rehabilitation Long-Term Acute Care Total Portfolio FacilitiesHospitals Q4 2019 (YoY)Q4 2020 (YoY) Q3 2020 (QoQ) Q4 2020 (QoQ) STRATIFICATION OF PORTFOLIO EBITDARM RENT COVERAGE InvestmentPercentage of EBITDARM Rent Coverage TTM No. of Facilities (in thousands)Investment Greater than or equal to 4.50x $ 144,0622 2.0% 3.00x—4.49x$ 18,2683 0.3% 1.50x—2.99x$ 32,5884 0.5% Less than 1.50x $ 65,8373 0.9% Total Master Leased, Cross-Defaulted and/or with Parent Guaranty: 3.0x $ 6,896,871173 96.3% General Acute Care Hospitals Master Leased, Cross- Defaulted and/or with Parent Guaranty: 3.4x$ 5,036,66662 70.3% Inpatient Rehabilitation Facilities Master Leased, Cross- Defaulted and/or with Parent Guaranty: 2.2x$ 1,625,82498 22.7% Long-Term Acute Care Hospitals Master Leased, Cross- Defaulted and/or with Parent Guaranty: 2.6x$ 234,38113 3.3% 2% <1% <1% 3% <1% Greater than or equal to 4.50x 3.00x—4.49x 23% 1.50x—2.99x Less than 1.50x 70% General Acute Master Lease, Cross-Default or Parent Guaranty Rehab Master Lease, Cross-Default or Parent Guaranty LTACH Master Lease, Cross-Default or Parent Guaranty Notes: Same Store represents properties with at least 24 months of financial reporting data. Properties that do not provide financial reporting and disposed assets are not included. All data presented is on a trailing twelve month basis. (A) EBITDARM adjusted for non-recurring items. MEDICAL PROPERTIES TRUST | SUPPLEMENTAL INFORMATION | Q1 2021 14
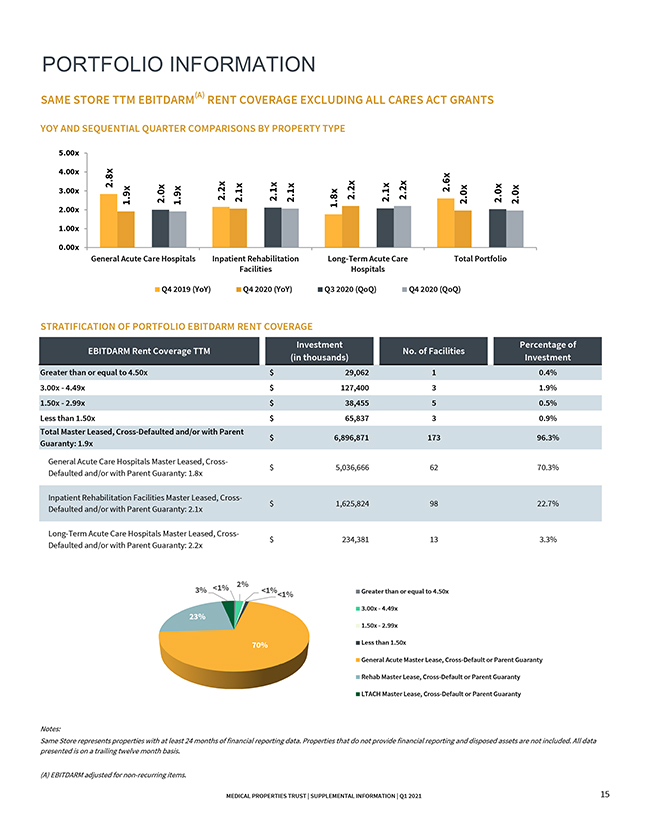
PORTFOLIO INFORMATION SAME STORE TTM EBITDARM(A) RENT COVERAGE EXCLUDING ALL CARES ACT GRANTS YOY AND SEQUENTIAL QUARTER COMPARISONS BY PROPERTY TYPE 5.00x 4.00x 3.00x 2.8x 1.9x 2.0x 1.9x 2.2x 2.1x 2.1x 2.1x 1.8x 2.2x 2.1x 2.2x 2.6x 2.0x 2.0x 2.0x 2.00x 1.00x 0.00x General Acute Care Hospitals Inpatient Rehabilitation Long-Term Acute Care Total Portfolio FacilitiesHospitals Q4 2019 (YoY)Q4 2020 (YoY) Q3 2020 (QoQ) Q4 2020 (QoQ) STRATIFICATION OF PORTFOLIO EBITDARM RENT COVERAGE InvestmentPercentage of EBITDARM Rent Coverage TTMNo. of Facilities (in thousands)Investment Greater than or equal to 4.50x$ 29,0621 0.4% 3.00x—4.49x$ 127,4003 1.9% 1.50x—2.99x$ 38,4555 0.5% Less than 1.50x $ 65,8373 0.9% Total Master Leased, Cross-Defaulted and/or with Parent Guaranty: 1.9x $ 6,896,871173 96.3% General Acute Care Hospitals Master Leased, Cross- Defaulted and/or with Parent Guaranty: 1.8x$ 5,036,66662 70.3% Inpatient Rehabilitation Facilities Master Leased, Cross- Defaulted and/or with Parent Guaranty: 2.1x$ 1,625,82498 22.7% Long-Term Acute Care Hospitals Master Leased, Cross- Defaulted and/or with Parent Guaranty: 2.2x$ 234,38113 3.3% 3% <1% 2% <1%Greater than or equal to 4.50x <1% 3.00x—4.49x 23% 1.50x—2.99x 70% Less than 1.50x General Acute Master Lease, Cross-Default or Parent Guaranty Rehab Master Lease, Cross-Default or Parent Guaranty LTACH Master Lease, Cross-Default or Parent Guaranty Notes: Same Store represents properties with at least 24 months of financial reporting data. Properties that do not provide financial reporting and disposed assets are not included. All data presented is on a trailing twelve month basis. (A) EBITDARM adjusted for non-recurring items. MEDICAL PROPERTIES TRUST | SUPPLEMENTAL INFORMATION | Q1 2021 15
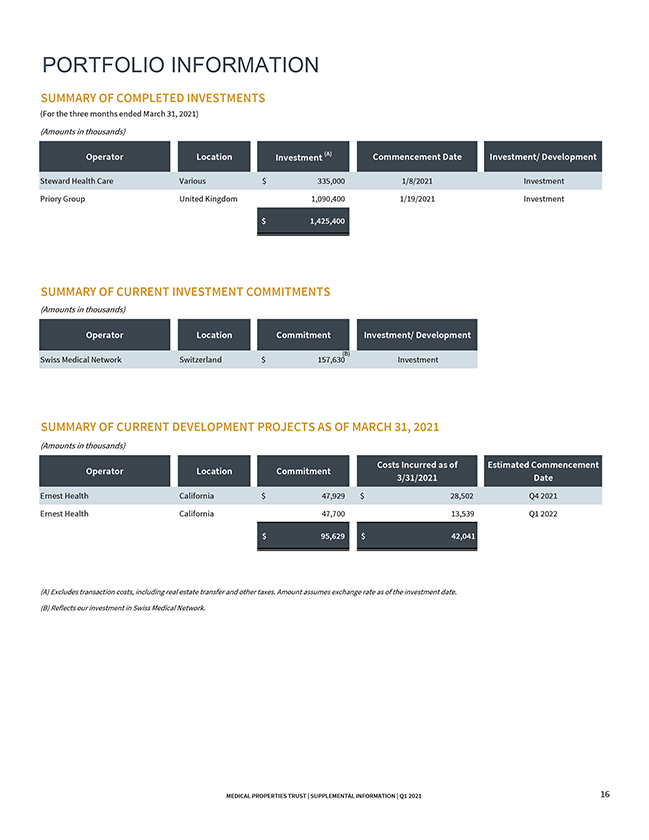
PORTFOLIO INFORMATION SUMMARY OF COMPLETED INVESTMENTS (For the three months ended March 31, 2021) (Amounts in thousands) Operator LocationInvestment (A) Commencement Date Investment/ Development Steward Health Care Various $ 335,000 1/8/2021Investment Priory Group United Kingdom1,090,400 1/19/2021Investment $ 1,425,400 SUMMARY OF CURRENT INVESTMENT COMMITMENTS (Amounts in thousands) Operator LocationCommitment Investment/ Development Swiss Medical Network Switzerland $ 157,630(B) Investment SUMMARY OF CURRENT DEVELOPMENT PROJECTS AS OF MARCH 31, 2021 (Amounts in thousands) Operator LocationCommitment Costs Incurred as of Estimated Commencement 3/31/2021Date Ernest Health California $ 47,929 $ 28,502 Q4 2021 Ernest Health California47,70013,539 Q1 2022 $ 95,629 $ 42,041 (A) Excludes transaction costs, including real estate transfer and other taxes. Amount assumes exchange rate as of the investment date. (B) Reflects our investment in Swiss Medical Network. MEDICAL PROPERTIES TRUST | SUPPLEMENTAL INFORMATION | Q1 202116
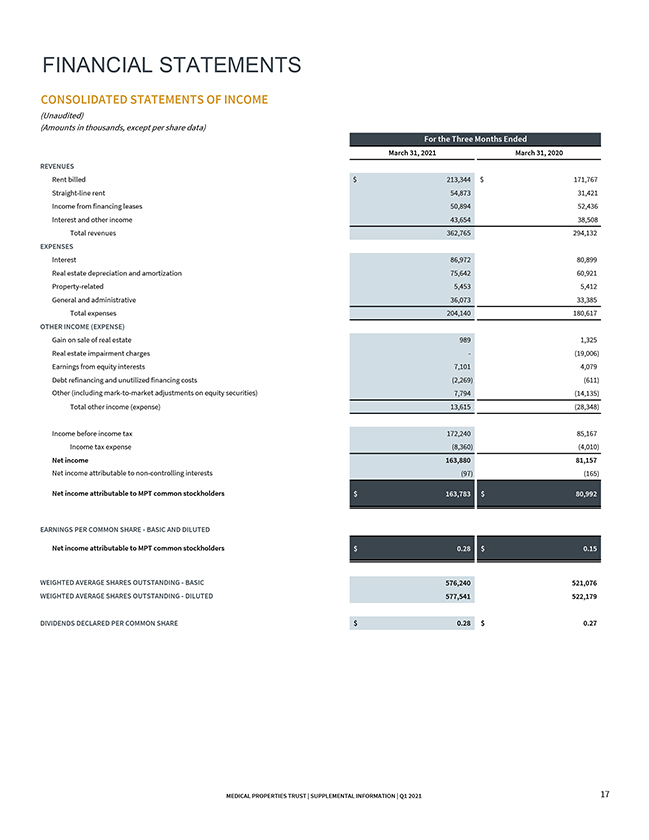
FINANCIAL STATEMENTS CONSOLIDATED STATEMENTS OF INCOME (Unaudited) (Amounts in thousands, except per share data) For the Three Months Ended March 31, 2021March 31, 2020 REVENUES Rent billed $ 213,344 $ 171,767 Straight-line rent 54,87331,421 Income from financing leases 50,89452,436 Interest and other income 43,65438,508 Total revenues 362,765294,132 EXPENSES Interest 86,97280,899 Real estate depreciation and amortization 75,64260,921 Property-related 5,4535,412 General and administrative 36,07333,385 Total expenses 204,140180,617 OTHER INCOME (EXPENSE) Gain on sale of real estate 9891,325 Real estate impairment charges -(19,006) Earnings from equity interests 7,1014,079 Debt refinancing and unutilized financing costs (2,269)(611) Other (including mark-to-market adjustments on equity securities) 7,794(14,135) Total other income (expense) 13,615(28,348) Income before income tax 172,24085,167 Income tax expense (8,360)(4,010) Net income 163,88081,157 Net income attributable to non-controlling interests (97)(165) Net income attributable to MPT common stockholders $ 163,783 $ 80,992 EARNINGS PER COMMON SHARE—BASIC AND DILUTED Net income attributable to MPT common stockholders $ 0.28 $ 0.15 WEIGHTED AVERAGE SHARES OUTSTANDING—BASIC 576,240521,076 WEIGHTED AVERAGE SHARES OUTSTANDING—DILUTED 577,541522,179 $—DIVIDENDS DECLARED PER COMMON SHARE $ 0.28 $ 0.27 MEDICAL PROPERTIES TRUST | SUPPLEMENTAL INFORMATION | Q1 2021 17
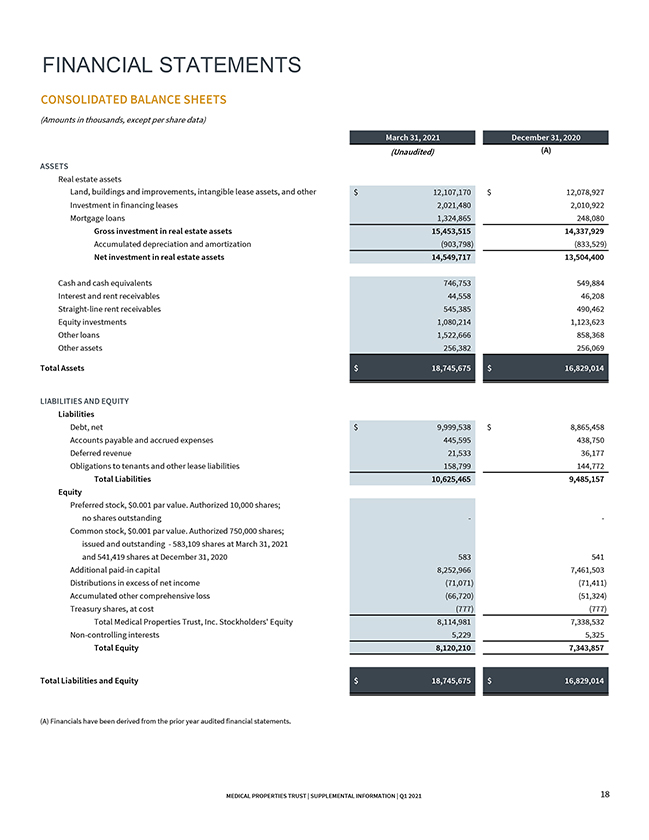
FINANCIAL STATEMENTS CONSOLIDATED BALANCE SHEETS (Amounts in thousands, except per share data) March 31, 2021December 31, 2020 (Unaudited)(A) ASSETS Real estate assets Land, buildings and improvements, intangible lease assets, and other $ 12,107,170 $ 12,078,927 Investment in financing leases2,021,4802,010,922 Mortgage loans1,324,865248,080 Gross investment in real estate assets15,453,51514,337,929 Accumulated depreciation and amortization(903,798)(833,529) Net investment in real estate assets14,549,71713,504,400 Cash and cash equivalents746,753549,884 Interest and rent receivables44,55846,208 Straight-line rent receivables545,385490,462 Equity investments1,080,2141,123,623 Other loans1,522,666858,368 Other assets256,382256,069 Total Assets $ 18,745,675 $ 16,829,014 LIABILITIES AND EQUITY Liabilities Debt, net $ 9,999,538 $ 8,865,458 Accounts payable and accrued expenses445,595438,750 Deferred revenue21,53336,177 Obligations to tenants and other lease liabilities158,799144,772 Total Liabilities10,625,4659,485,157 Equity Preferred stock, $0.001 par value. Authorized 10,000 shares; no shares outstanding— Common stock, $0.001 par value. Authorized 750,000 shares; issued and outstanding—583,109 shares at March 31, 2021 and 541,419 shares at December 31, 2020583541 Additional paid-in capital8,252,9667,461,503 Distributions in excess of net income(71,071)(71,411) Accumulated other comprehensive loss(66,720)(51,324) Treasury shares, at cost(777)(777) Total Medical Properties Trust, Inc. Stockholders’ Equity8,114,9817,338,532 Non-controlling interests5,2295,325 Total Equity8,120,2107,343,857 Total Liabilities and Equity $ 18,745,675 $ 16,829,014 (A) Financials have been derived from the prior year audited financial statements. MEDICAL PROPERTIES TRUST | SUPPLEMENTAL INFORMATION | Q1 2021 18
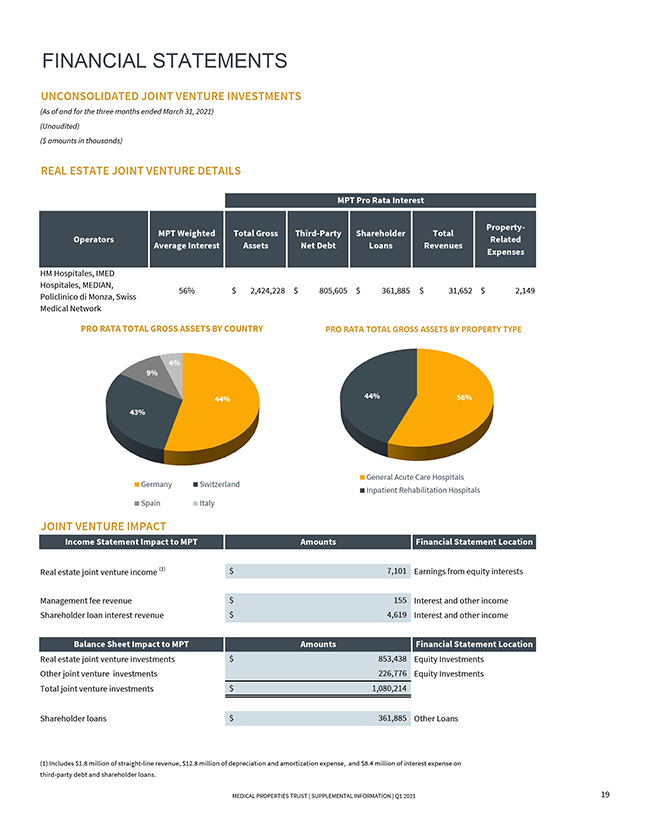
FINANCIAL STATEMENTS UNCONSOLIDATED JOINT VENTURE INVESTMENTS (As of and for the three months ended March 31, 2021) (Unaudited) ($ amounts in thousands) REAL ESTATE JOINT VENTURE DETAILS MPT Pro Rata Interest MPT Weighted Total Gross Third-Party ShareholderTotal Property- OperatorsRelated Average InterestAssets Net DebtLoans Revenues Expenses HM Hospitales, IMED Hospitales, MEDIAN, 56% $ 2,424,228 $ 805,605 $ 361,885 $ 31,652 $ 2,149 Policlinico di Monza, Swiss Medical Network PRO RATA TOTAL GROSS ASSETS BY COUNTRYPRO RATA TOTAL GROSS ASSETS BY PROPERTY TYPE 4% 9% 44% 44%56% 43% General Acute Care Hospitals Germany Switzerland Inpatient Rehabilitation Hospitals Spain Italy JOINT VENTURE IMPACT Income Statement Impact to MPT Amounts Financial Statement Location Real estate joint venture income (1)$ 7,101 Earnings from equity interests Management fee revenue$ 155 Interest and other income Shareholder loan interest revenue$ 4,619 Interest and other income Balance Sheet Impact to MPT Amounts Financial Statement Location Real estate joint venture investments$ 853,438 Equity Investments Other joint venture investments 226,776 Equity Investments Total joint venture investments$ 1,080,214 Shareholder loans$ 361,885 Other Loans (1) Includes $1.8 million of straight-line revenue, $12.8 million of depreciation and amortization expense, and $8.4 million of interest expense on third-party debt and shareholder loans. MEDICAL PROPERTIES TRUST | SUPPLEMENTAL INFORMATION | Q1 2021 19
1000 Urban Center Drive, Suite 501 Birmingham, AL 35242 (205) 969-3755 NYSE: MPW www.medicalpropertiestrust.com Contact: Drew Babin, Senior Managing Director of Corporate Communications (646) 884-9809 or dbabin@medicalpropertiestrust.com or Tim Berryman, Managing Director of Investor Relations (205) 397-8589 or tberryman@medicalpropertiestrust.com