Attached files
| file | filename |
|---|---|
| 8-K - FORM 8-K - MACKINAC FINANCIAL CORP /MI/ | tm2114662d1_8k.htm |
Exhibit 99

PRESS RELEASE
| For Release: | April 29, 2021 |
| Nasdaq: | MFNC |
| Contact: | Jesse A. Deering, EVP& Chief Financial Officer (248) 290-5906 /jdeering@bankmbank.com |
| Website: | www.bankmbank.com |
MACKINAC FINANCIAL CORPORATION
REPORTS 2021 FIRST quarter FINANCIAL Results
Manistique, Michigan –Mackinac Financial Corporation (Nasdaq: MFNC) (“we”, or the “Corporation”) the bank holding company for mBank (“the Bank”) today announced 2021 first quarter net income of $3.88 million, or $.37 per share, compared to 2020 first quarter net income of $3.05 million, or $.28 per share. Weighted average shares outstanding for the first quarter of 2021 were 10,522,899 compared to 10,717,967 for the same period of 2020.
Total assets of the Corporation at March 31, 2021 were $1.51 billion, compared to $1.36 billion at March 31, 2020. Shareholders’ equity at March 31, 2021 totaled $170.18 million, compared to $160.06 million at March 31, 2020. Book value per share outstanding equated to $16.13 at the end of the first quarter 2021, compared to $14.93 per share outstanding a year ago. Tangible book value at quarter-end was $146.40 million, or $13.88 per share outstanding, compared to $135.61 million, or $12.87 per share outstanding at the end of the first quarter 2020.
Additional notes:
| · | mBank, the Corporation’s primary asset, recorded net income of $4.26 million for the first quarter of 2021. |
| · | The Bank funded approximately $53 million of Paycheck Protection Program (PPP) loans in the first quarter of 2021 with origination fees totaling approximately $2.78 million. These loans continue to support small businesses throughout our footprint with the majority of recipients residing in the Upper Peninsula and Northern Michigan. |
| · | Non-interest income was very solid for the quarter including secondary market mortgage fees and gains on sale of $1.30 million and premiums on the sale of Small Business Administration (SBA) guaranteed loans of $433 thousand. |
| · | The residential mortgage pipeline resides at robust levels and we expect strong output from this line of business as we look to upcoming quarters. |
| · | Core operating margin, which is net of accretion from acquired loans and PPP fees that were subject to purchase accounting adjustments, was 4.14%. |
| · | On April 12, 2021 the Board of Directors of MFNC announced the signing of a definitive agreement for Nicolet Bankshares (Green Bay, WI) to acquire the Corporation. The transaction is expected to close in the third quarter of 2021. Specific information regarding the transaction can be found at www.bankmbank.com. |
Revenue & PPP Recognition
Total revenue of the Corporation for first quarter 2021 was $17.29 million, compared to $17.60 million for the first quarter of 2020. Total interest income for the first three months of 2021 was $14.89 million, compared to $15.67 million for the same period in 2020. The 2021 first quarter interest income included accretive yield of $237 thousand from combined credit mark accretion associated with acquisitions, compared to $818 thousand in the same period of 2020.
The first quarter 2021 interest income was also positively impacted by recognition of a portion of the PPP loan origination fees that were earned during the quarter:
| · | The bank originated approximately $53 million of PPP loans in the first quarter. |
| · | The origination efforts resulted in fees earned of $2.78 million, which are subject to FASB accounting guidance for recognition. |
| · | In accordance with applicable accounting guidance, the bank recognized $826 thousand in pre-tax fee revenue that offset ASC 310-20 eligible origination costs. |
| · | This recognition resulted in $1.95 million of fees remaining to be accreted over the expected life of the PPP loan pool, which will initially be 12-months unless acceleration occurs due to the loans being paid off or forgiven before maturity. |
| · | The amount accreted during the second quarter was $296 thousand. |
| · | The total amount of PPP fees that were recognized in the second quarter was $1.12 million, leaving $1.66 million to be accreted or accelerated upon payoff. |
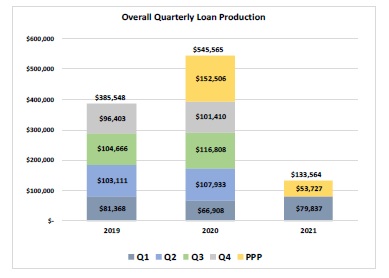
Loan Production and Portfolio Mix
Total balance sheet loans at March 31, 2021 were $1.06 billion, compared to March 31, 2020 balances of $1.04 billion. Total loans under management reside at $1.31 billion, which includes $244.14 million of service retained loans. Overall loan production for the first three months of 2021 was $133.56 million, which included $53.73 million of PPP loans. The remaining $79.8 million was inclusive of $35.1 million of secondary market loans, compared to total production of $66.9 million in the first quarter 2020, which was inclusive of $19.0 million of secondary market production.
Credit Quality
Nonperforming loans totaled $5.02 million, or .47% of total loans (.53% when excluding PPP loans) at March 31, 2021, compared to $6.42 million, or .61% of total loans at March 31, 2020. Total loan delinquencies greater than 30 days resided at .43% (.48% when excluding PPP loans), compared to 1.23% in 2020. The nonperforming assets to total assets ratio resided at .45% (.48 when excluding PPP loans) for the first quarter of 2021, compared to .64% for the first quarter of 2020. The Corporation currently has no commercial loans in full payment deferral and a nominal $5.3 million that remain in the interest- only portion of their COVID-19 loan modification period. These loans are expected to return to normal principal and interest payments over the next quarter. There are $300 thousand of consumer loans that remain in full payment deferral. Total loans in some type of COVID-19 payment modification are a minimal .59% of total loans. There remains no sign of any adverse systemic issues or deterioration in the loan portfolio and we expect good payment performance as we look to our stronger commerce months ahead.
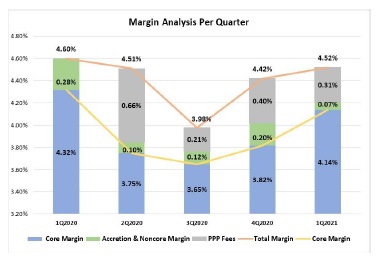
Margin Analysis, Funding and Liquidity
Net interest income for first quarter 2021 was $13.78 million, resulting in a Net Interest Margin (NIM) of 4.52%, compared to $13.40 million in the first quarter 2020 and a NIM of 4.60%. Core operating margin, which is net of accretion from acquired loans that were subject to purchase accounting adjustments (as well as PPP impact for the 2021 period), was 4.14% for the first quarter of 2021, compared to 4.32% for the same period of 2020.
Total bank deposits (excluding brokered deposits) have increased by approximately $261 million year-over-year from $999.09 million at March 31, 2020 to $1.26 billion at first quarter-end 2021. Total brokered deposits have decreased significantly and were $13.35 million at March 31, 2021, compared to $96.29 million at March 31, 2020, a decrease of 86%. FHLB (Federal Home Loan Bank) borrowings have also decreased from $64.12 million at March 31, 2020 to $53.46 million at March 31, 2021. The company plans to retire an additional $25 million of FHLB borrowings in June 2021. Overall access to short-term functional liquidity remains very strong through multiple sources, if needed.
Noninterest Income / Expense
First quarter 2021 Noninterest Income was $2.40 million, compared to $1.94 million for the same period of 2020. The significant year-over-year improvement is mainly due to the increase of secondary market mortgage sales. Noninterest Expense for the first quarter of 2021 was $11.85 million, compared to $11.37 million for the same period of 2020. The expense variance was largely a result of PPP related expenses.
Assets and Capital
Total assets of the Corporation at March 31, 2021 were $1.51 billion, compared to $1.36 billion at March 31, 2020. Shareholders’ equity at March 31, 2021 totaled $170.18 million, compared to $160.06 million at March 31, 2020. Book value per share outstanding equated to $16.13 at the end of the first quarter 2021, compared to $14.93 per share outstanding a year ago. Tangible book value at quarter-end was $146.40 million, or $13.88 per share outstanding, compared to $135.61 million, or $12.87 per share outstanding at the end of the first quarter 2020.
Both the Corporation and the Bank are “well-capitalized” with total risk-based capital to risk-weighted assets of 15.34% and 14.62% and tier 1 capital to total tier 1 average assets at the Corporation of 9.63% and at the bank of 9.16%. The leverage ratio is calculated inclusive of PPP loan balances.
Paul D. Tobias, Chairman and Chief Executive Officer of the Corporation and Chairman of mBank concluded, “As we move toward closing of the Nicolet transaction, the company continues to work on behalf of all constituencies to make the transition as smooth as possible while maintaining best-in-class service to our valued clients. We know that with our experience on the buy-side and Nicolet being an active acquirer, we have two dedicated teams that will complete this process in the best manner possible.”
Mackinac Financial Corporation is a registered bank holding company formed under the Bank Holding Company Act of 1956 with assets in excess of $1.5 billion and whose common stock is traded on the NASDAQ stock market as “MFNC.” The principal subsidiary of the Corporation is mBank. Headquartered in Manistique, Michigan, mBank has 28 branch locations: ten in the Upper Peninsula, ten in the Northern Lower Peninsula, one in Oakland County, Michigan, and seven in Northern Wisconsin. The Corporation’s banking services include commercial lending and treasury management products and services geared toward small to mid-sized businesses, as well as a full array of personal and business deposit products and consumer loans.
Forward-Looking Statements
This release contains certain forward-looking statements. Words such as “anticipates,” “believes,” “estimates,” “expects,” “intends,” “should,” “will,” and variations of such words and similar expressions are intended to identify forward-looking statements: as defined by the Private Securities Litigation Reform Act of 1995. These statements reflect management’s current beliefs as to expected outcomes of future events and are not guarantees of future performance. These statements involve certain risks, uncertainties and assumptions that are difficult to predict with regard to timing, extent, likelihood, and degree of occurrence. Therefore, actual results and outcomes may materially differ from what may be expressed or forecasted in such forward-looking statements. Factors that could cause a difference include among others: risks that the Company’s proposed merger with Nicolet Bankshares, Inc. (“Nicolet”) will not be consummated due to inability to obtain shareholder or regulatory approval or to satisfy certain closing conditions, or if consummated, the possibility that any of the anticipated benefits of the proposed merger will not be realized; changes in the national and local economies or market conditions; changes in interest rates and banking regulations; the impact of competition from traditional or new sources; and the possibility that anticipated cost savings and revenue enhancements from mergers and acquisitions, bank consolidations, and other sources may not be fully realized at all or within specified time frames as well as other risks and uncertainties including but not limited to those detailed from time to time in filings of the Company with the Securities and Exchange Commission. These and other factors may cause decisions and actual results to differ materially from current expectations. Mackinac Financial Corporation undertakes no obligation to revise, update, or clarify forward-looking statements to reflect events or conditions after the date of this release.
Important Information and Where to Find It
Certain communications in this release relate to the proposed merger transaction involving Nicolet and Mackinac. In connection with the proposed merger, Nicolet and Mackinac will file a joint proxy statement/prospectus on Form S-4 and other relevant documents concerning the merger with the Securities and Exchange Commission (the “SEC”). BEFORE MAKING ANY VOTING OR INVESTMENT DECISION, INVESTORS ARE URGED TO READ THE JOINT PROXY STATEMENT/PROSPECTUS AND ANY OTHER DOCUMENTS TO BE FILED WITH THE SEC IN CONNECTION WITH THE PROPOSED MERGER OR INCORPORATED BY REFERENCE IN THE JOINT PROXY STATEMENT/PROSPECTUS BECAUSE THEY WILL CONTAIN IMPORTANT INFORMATION ABOUT NICOLET, MACKINAC AND THE PROPOSED MERGER. When available, the joint proxy statement/prospectus will be delivered to shareholders of Nicolet and Mackinac. Investors may obtain copies of the joint proxy statement/prospectus and other relevant documents (as they become available) free of charge at the SEC’s website (www.sec.gov). Copies of the documents filed with the SEC by Nicolet will be available free of charge on Nicolet’s website at www.nicoletbank.com. Copies of the documents filed with the SEC by Mackinac will be available free of charge on Mackinac’s website at www.bankmbank.com.
Nicolet, Mackinac and certain of their directors, executive officers and other members of management and employees may be deemed to be participants in the solicitation of proxies from the shareholders of Nicolet and the shareholders of Mackinac in connection with the proposed merger. Information about the directors and executive officers of Nicolet and Mackinac will be included in the joint proxy statement/prospectus for the proposed transaction filed with the SEC. Information about the directors and executive officers of Nicolet is also included in the proxy statement for its 2021 annual meeting of shareholders, which was filed with the SEC on March 2, 2021. Information about the directors and executive officers of Mackinac is also included in the proxy statement for its 2021 annual meeting of shareholders, which was filed with the SEC on April 22, 2021. Additional information regarding the interests of such participants and other persons who may be deemed participants in the transaction will be included in the joint proxy statement/prospectus and the other relevant documents filed with the SEC when they become available.
MACKINAC FINANCIAL CORPORATION AND SUBSIDIARIES
SELECTED FINANCIAL HIGHLIGHTS
| As of and For the | As of and For the | As of and For the | ||||||||||
| Period Ending | Year Ending | Period Ending | ||||||||||
| March 31, | December 31, | March 31, | ||||||||||
| (Dollars in thousands, except per share data) | 2021 | 2020 | 2020 | |||||||||
| (Unaudited) | (Unaudited) | |||||||||||
| Selected Financial Condition Data (at end of period): | ||||||||||||
| Assets | $ | 1,508,248 | $ | 1,501,730 | $ | 1,356,381 | ||||||
| Loans | 1,063,756 | 1,077,592 | 1,044,177 | |||||||||
| Investment securities | 109,414 | 111,836 | 114,734 | |||||||||
| Deposits | 1,273,279 | 1,258,776 | 1,095,381 | |||||||||
| Borrowings | 53,459 | 63,479 | 67,120 | |||||||||
| Shareholders' equity | 170,176 | 167,864 | 160,060 | |||||||||
| Selected Statements of Income Data (three months and year ended) | ||||||||||||
| Net interest income | $ | 13,778 | $ | 54,806 | $ | 13,397 | ||||||
| Income before taxes | 4,278 | 17,056 | 3,862 | |||||||||
| Net income | 3,880 | 13,473 | 3,051 | |||||||||
| Income per common share - Basic | .37 | 1.27 | .28 | |||||||||
| Income per common share - Diluted | .37 | 1.27 | .28 | |||||||||
| Weighted average shares outstanding - Basic | 10,522,899 | 10,580,044 | 10,717,967 | |||||||||
| Weighted average shares outstanding- Diluted | 10,522,899 | 10,580,044 | 10,817,470 | |||||||||
| Selected Financial Ratios and Other Data: | ||||||||||||
| Performance Ratios: | ||||||||||||
| Net interest margin | 4.52 | % | 4.37 | % | 4.60 | % | ||||||
| Efficiency ratio | 73.19 | 71.84 | 73.78 | |||||||||
| Return on average assets | 1.04 | .92 | .93 | |||||||||
| Return on average equity | 9.31 | 8.19 | 7.54 | |||||||||
| Average total assets | $ | 1,512,496 | $ | 1,464,674 | $ | 1,321,134 | ||||||
| Average total shareholders' equity | 169,023 | 164,505 | 162,661 | |||||||||
| Average loans to average deposits ratio | 84.26 | % | 93.34 | % | 97.30 | % | ||||||
| Common Share Data at end of period: | ||||||||||||
| Market price per common share | $ | 14.02 | $ | 12.76 | $ | 10.45 | ||||||
| Book value per common share | 16.13 | 15.99 | 15.20 | |||||||||
| Tangible book value per share | 13.88 | 13.71 | 12.87 | |||||||||
| Dividends paid per share, annualized | .56 | .56 | .56 | |||||||||
| Common shares outstanding | 10,550,393 | 10,500,758 | 10,533,589 | |||||||||
| Other Data at end of period: | ||||||||||||
| Allowance for loan losses | $ | 5,842 | $ | 5,816 | $ | 5,292 | ||||||
| Non-performing assets | 6,716 | 7,210 | 8,644 | |||||||||
| Allowance for loan losses to total loans | .55 | % | .54 | % | .51 | % | ||||||
| Non-performing assets to total assets | .45 | % | .48 | % | .64 | % | ||||||
| Texas ratio | 4.41 | % | 4.82 | % | 6.13 | % | ||||||
| Number of: | ||||||||||||
| Branch locations | 28 | 28 | 29 | |||||||||
| FTE Employees | 310 | 315 | 316 | |||||||||
MACKINAC FINANCIAL CORPORATION AND SUBSIDIARIES
CONSOLIDATED BALANCE SHEETS
| March 31, | December 31, | March 31, | ||||||||||
| 2021 | 2020 | 2020 | ||||||||||
| (Unaudited) | (Unaudited) | |||||||||||
| ASSETS | ||||||||||||
| Cash and due from banks | $ | 239,831 | $ | 218,901 | $ | 97,041 | ||||||
| Federal funds sold | 3,661 | 76 | 31 | |||||||||
| Cash and cash equivalents | 243,492 | 218,977 | 97,072 | |||||||||
| Interest-bearing deposits in other financial institutions | 2,427 | 2,917 | 8,825 | |||||||||
| Securities available for sale | 109,414 | 111,836 | 114,734 | |||||||||
| Federal Home Loan Bank stock | 4,924 | 4,924 | 4,924 | |||||||||
| Loans: | ||||||||||||
| Commercial | 818,584 | 819,907 | 760,357 | |||||||||
| Mortgage | 226,780 | 238,705 | 263,445 | |||||||||
| Consumer | 18,392 | 18,980 | 20,375 | |||||||||
| Total Loans | 1,063,756 | 1,077,592 | 1,044,177 | |||||||||
| Allowance for loan losses | (5,842 | ) | (5,816 | ) | (5,292 | ) | ||||||
| Net loans | 1,057,914 | 1,071,776 | 1,038,885 | |||||||||
| Premises and equipment | 25,010 | 25,518 | 24,522 | |||||||||
| Other real estate held for sale | 1,692 | 1,752 | 2,228 | |||||||||
| Deferred tax asset | 2,492 | 3,303 | 3,154 | |||||||||
| Deposit based intangibles | 4,200 | 4,368 | 4,874 | |||||||||
| Goodwill | 19,574 | 19,574 | 19,574 | |||||||||
| Other assets | 37,109 | 36,785 | 37,589 | |||||||||
| TOTAL ASSETS | $ | 1,508,248 | $ | 1,501,730 | $ | 1,356,381 | ||||||
| LIABILITIES AND SHAREHOLDERS’ EQUITY | ||||||||||||
| LIABILITIES: | ||||||||||||
| Deposits: | ||||||||||||
| Noninterest bearing deposits | $ | 443,956 | $ | 414,804 | $ | 278,191 | ||||||
| NOW, money market, interest checking | 478,181 | 450,556 | 369,003 | |||||||||
| Savings | 137,134 | 130,755 | 109,818 | |||||||||
| CDs<$250,000 | 190,320 | 202,266 | 227,924 | |||||||||
| CDs>$250,000 | 10,337 | 15,224 | 14,152 | |||||||||
| Brokered | 13,351 | 45,171 | 96,293 | |||||||||
| Total deposits | 1,273,279 | 1,258,776 | 1,095,381 | |||||||||
| Federal funds purchased | — | — | 22,790 | |||||||||
| Borrowings | 53,459 | 63,479 | 67,120 | |||||||||
| Other liabilities | 11,334 | 11,611 | 11,030 | |||||||||
| Total liabilities | 1,338,072 | 1,333,866 | 1,196,321 | |||||||||
| SHAREHOLDERS’ EQUITY: | ||||||||||||
| Common stock and additional paid in capital - No par value Authorized - 18,000,000 shares Issued and outstanding - 10,550,393; 10,500,758 and 10,533,589 respectively | 127,397 | 127,164 | 127,003 | |||||||||
| Retained earnings | 41,721 | 39,318 | 33,316 | |||||||||
| Accumulated other comprehensive income (loss) | ||||||||||||
| Unrealized (losses) gains on available for sale securities | 1,641 | 1,965 | 151 | |||||||||
| Minimum pension liability | (583 | ) | (583 | ) | (410 | ) | ||||||
| Total shareholders’ equity | 170,176 | 167,864 | 160,060 | |||||||||
| TOTAL LIABILITIES AND SHAREHOLDERS’ EQUITY | $ | 1,508,248 | $ | 1,501,730 | $ | 1,356,381 | ||||||
MACKINAC FINANCIAL CORPORATION AND SUBSIDIARIES
CONSOLIDATED STATEMENTS OF OPERATIONS
| For the Three Months Ended | ||||||||
| March 31, | ||||||||
| 2021 | 2020 | |||||||
| (Unaudited) | ||||||||
| INTEREST INCOME: | ||||||||
| Interest and fees on loans: | ||||||||
| Taxable | $ | 14,122 | $ | 14,613 | ||||
| Tax-exempt | 20 | 74 | ||||||
| Interest on securities: | ||||||||
| Taxable | 524 | 621 | ||||||
| Tax-exempt | 142 | 87 | ||||||
| Other interest income | 84 | 270 | ||||||
| Total interest income | 14,892 | 15,665 | ||||||
| INTEREST EXPENSE: | ||||||||
| Deposits | 889 | 1,927 | ||||||
| Borrowings | 225 | 341 | ||||||
| Total interest expense | 1,114 | 2,268 | ||||||
| Net interest income | 13,778 | 13,397 | ||||||
| Provision for loan losses | 50 | 100 | ||||||
| Net interest income after provision for loan losses | 13,728 | 13,297 | ||||||
| OTHER INCOME: | ||||||||
| Deposit service fees | 257 | 403 | ||||||
| Income from loans sold on the secondary market | 1,302 | 538 | ||||||
| SBA/USDA loan sale gains | 433 | 710 | ||||||
| Mortgage servicing amortization | 241 | 189 | ||||||
| Net security gains | 36 | - | ||||||
| Other | 129 | 97 | ||||||
| Total other income | 2,398 | 1,937 | ||||||
| OTHER EXPENSE: | ||||||||
| Salaries and employee benefits | 6,824 | 6,051 | ||||||
| Occupancy | 1,183 | 1,124 | ||||||
| Furniture and equipment | 842 | 802 | ||||||
| Data processing | 770 | 825 | ||||||
| Advertising | 113 | 212 | ||||||
| Professional service fees | 498 | 498 | ||||||
| Loan origination expenses and deposit and card related fees | 450 | 381 | ||||||
| Writedowns and losses on other real estate held for sale | (52 | ) | 3 | |||||
| FDIC insurance assessment | 140 | 150 | ||||||
| Communications expense | 241 | 213 | ||||||
| Other | 839 | 1,113 | ||||||
| Total other expenses | 11,848 | 11,372 | ||||||
| Income before provision for income taxes | 4,278 | 3,862 | ||||||
| Provision for income taxes | 398 | 811 | ||||||
| NET INCOME AVAILABLE TO COMMON SHAREHOLDERS | $ | 3,880 | $ | 3,051 | ||||
| INCOME PER COMMON SHARE: | ||||||||
| Basic | $ | .37 | $ | .28 | ||||
| Diluted | $ | .37 | $ | .28 | ||||
MACKINAC FINANCIAL CORPORATION AND SUBSIDIARIES
LOAN PORTFOLIO AND CREDIT QUALITY
(Dollars in thousands)
Loan Portfolio Balances (at end of period):
| March 31, | December 31, | March 31, | ||||||||||
| 2021 | 2020 | 2020 | ||||||||||
| (Unaudited) | (Audited) | (Unaudited) | ||||||||||
| Commercial Loans: | ||||||||||||
| Real estate - operators of nonresidential buildings | $ | 137,356 | $ | 138,992 | $ | 136,477 | ||||||
| Hospitality and tourism | 105,077 | 100,237 | 94,734 | |||||||||
| Lessors of residential buildings | 51,288 | 52,035 | 48,529 | |||||||||
| Gasoline stations and convenience stores | 27,562 | 29,046 | 26,495 | |||||||||
| Logging | 16,756 | 18,651 | 21,380 | |||||||||
| Commercial construction | 49,240 | 47,698 | 29,971 | |||||||||
| Other | 431,305 | 433,248 | 402,771 | |||||||||
| Total Commercial Loans | 818,584 | 819,907 | 760,357 | |||||||||
| 1-4 family residential real estate | 214,034 | 227,044 | 244,059 | |||||||||
| Consumer | 18,392 | 18,980 | 20,375 | |||||||||
| Consumer construction | 12,746 | 11,661 | 19,386 | |||||||||
| Total Loans | $ | 1,063,756 | $ | 1,077,592 | $ | 1,044,177 | ||||||
Credit Quality (at end of period):
| March 31, | December 31, | March 31, | ||||||||||
| 2021 | 2020 | 2020 | ||||||||||
| (Unaudited) | (Audited) | (Unaudited) | ||||||||||
| Nonperforming Assets : | ||||||||||||
| Nonaccrual loans | $ | 5,024 | $ | 5,458 | $ | 6,416 | ||||||
| Loans past due 90 days or more | - | - | - | |||||||||
| Restructured loans | - | - | - | |||||||||
| Total nonperforming loans | 5,024 | 5,458 | 6,416 | |||||||||
| Other real estate owned | 1,692 | 1,752 | 2,228 | |||||||||
| Total nonperforming assets | $ | 6,716 | $ | 7,210 | $ | 8,644 | ||||||
| Nonperforming loans as a % of loans | .47 | % | .51 | % | .61 | % | ||||||
| Nonperforming assets as a % of assets | .45 | % | .48 | % | .64 | % | ||||||
| Reserve for Loan Losses: | ||||||||||||
| At period end | $ | 5,842 | $ | 5,816 | $ | 5,292 | ||||||
| As a % of outstanding loans | .55 | % | .54 | % | .51 | % | ||||||
| As a % of nonperforming loans | 116.28 | % | 106.56 | % | 82.48 | % | ||||||
| As a % of nonaccrual loans | 116.28 | % | 106.56 | % | 82.48 | % | ||||||
| Texas Ratio | 4.41 | % | 4.82 | % | 6.13 | % | ||||||
| Charge-off Information (year to date): | ||||||||||||
| Average loans | $ | 1,078,022 | $ | 1,117,132 | $ | 1,047,144 | ||||||
| Net charge-offs (recoveries) | $ | 24 | $ | 492 | $ | 116 | ||||||
| Charge-offs as a % of average | ||||||||||||
| loans, annualized | .01 | % | .04 | % | .04 | % | ||||||
MACKINAC FINANCIAL CORPORATION AND SUBSIDIARIES QUARTERLY FINANCIAL HIGHLIGHTS
| QUARTER ENDED | ||||||||||||||||||||
| (Unaudited) | ||||||||||||||||||||
| March 31, | December 31, | September 30, | June, 30 | March 31, | ||||||||||||||||
| 2021 | 2020 | 2020 | 2020 | 2020 | ||||||||||||||||
| BALANCE SHEET (Dollars in thousands) | ||||||||||||||||||||
| Total loans | $ | 1,063,756 | $ | 1,077,592 | $ | 1,144,325 | $ | 1,153,790 | $ | 1,044,177 | ||||||||||
| Allowance for loan losses | (5,842 | ) | (5,816 | ) | (5,832 | ) | (5,355 | ) | (5,292 | ) | ||||||||||
| Total loans, net | 1,057,914 | 1,071,776 | 1,138,493 | 1,148,435 | 1,038,885 | |||||||||||||||
| Total assets | 1,508,248 | 1,501,730 | 1,522,917 | 1,518,473 | 1,356,381 | |||||||||||||||
| Core deposits | 1,249,591 | 1,198,381 | 1,195,062 | 1,122,582 | 984,936 | |||||||||||||||
| Noncore deposits | 23,688 | 60,395 | 85,825 | 104,970 | 110,445 | |||||||||||||||
| Total deposits | 1,273,279 | 1,258,776 | 1,280,887 | 1,227,552 | 1,095,381 | |||||||||||||||
| Total borrowings | 53,459 | 63,479 | 63,505 | 114,466 | 67,120 | |||||||||||||||
| Total shareholders' equity | 170,176 | 167,864 | 166,168 | 164,157 | 160,060 | |||||||||||||||
| Total tangible equity | 146,402 | 143,922 | 142,057 | 139,877 | 135,612 | |||||||||||||||
| Total shares outstanding | 10,550,393 | 10,500,758 | 10,533,589 | 10,533,589 | 10,533,589 | |||||||||||||||
| Weighted average shares outstanding | 10,522,899 | 10,536,023 | 10,533,589 | 10,533,589 | 10,717,967 | |||||||||||||||
| AVERAGE BALANCES (Dollars in thousands) | ||||||||||||||||||||
| Assets | $ | 1,512,496 | $ | 1,505,869 | $ | 1,536,128 | $ | 1,501,423 | $ | 1,321,134 | ||||||||||
| Earning assets | 1,235,235 | 1,252,038 | 1,303,102 | 1,290,012 | 1,171,551 | |||||||||||||||
| Loans | 1,078,022 | 1,118,665 | 1,154,670 | 1,147,620 | 1,047,144 | |||||||||||||||
| Noninterest bearing deposits | 426,890 | 422,081 | 422,134 | 346,180 | 284,677 | |||||||||||||||
| Deposits | 1,279,362 | 1,255,669 | 1,269,658 | 1,211,694 | 1,076,206 | |||||||||||||||
| Equity | 169,023 | 167,459 | 165,450 | 161,811 | 162,661 | |||||||||||||||
| INCOME STATEMENT (Dollars in thousands) | ||||||||||||||||||||
| Net interest income | $ | 13,778 | $ | 13,898 | $ | 13,052 | $ | 14,458 | $ | 13,397 | ||||||||||
| Provision for loan losses | 50 | 400 | 400 | 100 | 100 | |||||||||||||||
| Net interest income after provision | 13,728 | 13,498 | 12,652 | 14,358 | 13,297 | |||||||||||||||
| Total noninterest income | 2,398 | 2,779 | 3,116 | 2,367 | 1,937 | |||||||||||||||
| Total noninterest expense | 11,848 | 11,663 | 11,561 | 12,352 | 11,372 | |||||||||||||||
| Income before taxes | 4,278 | 4,614 | 4,207 | 4,373 | 3,862 | |||||||||||||||
| Provision for income taxes | 398 | 970 | 883 | 919 | 811 | |||||||||||||||
| Net income available to common shareholders | $ | 3,880 | $ | 3,644 | $ | 3,324 | $ | 3,454 | $ | 3,051 | ||||||||||
| Income pre-tax, pre-provision | $ | 4,328 | $ | 5,014 | $ | 4,607 | $ | 4,473 | $ | 3,962 | ||||||||||
| PER SHARE DATA | ||||||||||||||||||||
| Earnings per common share | $ | .37 | $ | .35 | $ | .32 | $ | .33 | $ | .28 | ||||||||||
| Book value per common share | 16.13 | 15.99 | 15.78 | 15.58 | 15.20 | |||||||||||||||
| Tangible book value per share | 13.88 | 13.71 | 13.49 | 13.28 | 12.87 | |||||||||||||||
| Market value, closing price | 14.02 | 12.76 | 9.65 | 10.37 | 10.45 | |||||||||||||||
| Dividends per share | .14 | .14 | .14 | .14 | .14 | |||||||||||||||
| ASSET QUALITY RATIOS | ||||||||||||||||||||
| Nonperforming loans/total loans | .47 | % | .51 | % | .47 | % | .53 | % | .61 | % | ||||||||||
| Nonperforming assets/total assets | .45 | .48 | .48 | .55 | .64 | |||||||||||||||
| Allowance for loan losses/total loans | .55 | .54 | .51 | .46 | .51 | |||||||||||||||
| Allowance for loan losses/nonperforming loans | 116.28 | 106.56 | 107.72 | 87.44 | 82.48 | |||||||||||||||
| Texas ratio | 4.41 | 4.82 | 4.91 | 4.22 | 6.13 | |||||||||||||||
| PROFITABILITY RATIOS | ||||||||||||||||||||
| Return on average assets | 1.04 | % | .96 | % | .86 | % | .93 | % | .93 | % | ||||||||||
| Return on average equity | 9.31 | 8.66 | 7.99 | 8.58 | 7.54 | |||||||||||||||
| Net interest margin | 4.52 | 4.42 | 3.98 | 4.51 | 4.60 | |||||||||||||||
| Average loans/average deposits | 84.26 | 89.09 | 90.94 | 94.71 | 97.30 | |||||||||||||||
| CAPITAL ADEQUACY RATIOS | ||||||||||||||||||||
| Tier 1 leverage ratio | 9.63 | % | 9.63 | % | 9.20 | % | 9.45 | % | 10.20 | % | ||||||||||
| Tier 1 capital to risk weighted assets | 14.74 | 14.48 | 13.91 | 13.27 | 12.89 | |||||||||||||||
| Total capital to risk weighted assets | 15.34 | 15.07 | 14.49 | 13.79 | 13.41 | |||||||||||||||
| Average equity/average assets (for the quarter) | 11.18 | 11.12 | 10.77 | 10.78 | 12.31 | |||||||||||||||