Attached files
| file | filename |
|---|---|
| 8-K - 8-K - FEDERAL HOME LOAN MORTGAGE CORP | fmcc-20210429.htm |
| EX-99.2 - EX-99.2 - FEDERAL HOME LOAN MORTGAGE CORP | a20211qerexhibit992.htm |
 |  | |||||||
Exhibit 99.1 | ||||||||
Freddie Mac Reports Net Income of $2.8 Billion and
Comprehensive Income of $2.4 Billion for First Quarter 2021
Providing Stability to the Housing Market While Serving Freddie Mac's Affordable Housing Mission
•Continued to provide mortgage-relief options for borrowers affected by the COVID-19 pandemic, including forbearance programs for both single-family and multifamily borrowers.
•Extended moratorium on foreclosures and evictions until at least June 30, 2021.
•Extended temporary measures designed to provide flexibility to homeowners, lenders, and appraisers to expedite loan closings during the pandemic.
First Quarter 2021 Financial Results
Market Liquidity Provided - $377 Billion | Homes and Rental Units Financed - 1.4 Million | Net Worth - $18.8 Billion | Total Mortgage Portfolio - $2.9 Trillion | |||||||||||||||||
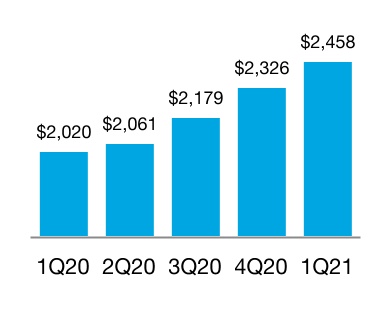
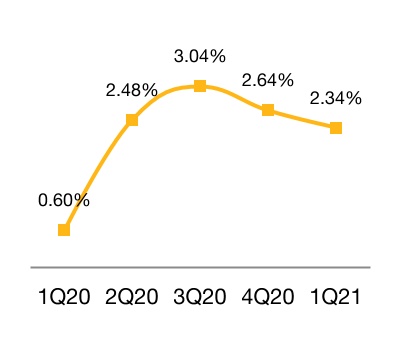
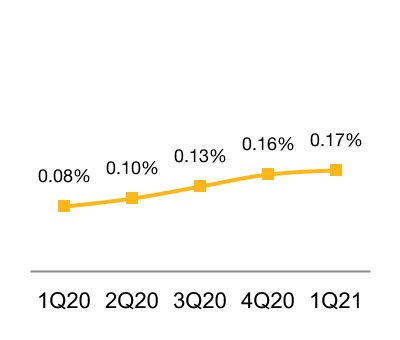
| Consolidated | •Net income up $2.6 billion year-over-year, driven by mortgage portfolio growth, higher deferred fee income recognition, higher revenues from Multifamily loan purchase and securitization activities, and lower credit-related expense •Benefit for credit losses of $0.2 billion, reflecting a credit reserve release driven by improving economic conditions •New business activity of $362 billion, up 162% year-over-year, reflecting strong home purchase and refinance activity •Mortgage portfolio of $2,458 billion, up 22% year-over-year, driven by strong new business activity •Serious delinquency rate of 2.34%, up from 0.60% at March 31, 2020, driven by loans in COVID-19 forbearance, and down from 2.64% at December 31, 2020 •Completed nearly 94,000 loan workouts •51% of mortgage portfolio covered by credit enhancements •New business activity of $14 billion, up 40% year-over-year, driven by the low interest rate environment •Mortgage portfolio of $394 billion, up 15% year-over-year, driven by strong loan purchase and securitization activity •Delinquency rate, which does not include loans in forbearance, increased to 0.17%, up from 0.08% at March 31, 2020 •92% of mortgage portfolio covered by credit enhancements | “Freddie Mac continued to support homebuyers and renters, providing $377 billion of liquidity for home purchases, refinancings, and the multifamily market in the first quarter of 2021. We have also helped hundreds of thousands of families stay in their homes through our foreclosure and eviction prevention programs. We are proud of our role in maintaining a vibrant housing market while providing critical assistance to borrowers and lenders during the pandemic.” Christian M. Lown Chief Financial Officer | ||||||||||||
Net Revenues $5.3 Billion Net Income $2.8 Billion Comprehensive Income $2.4 Billion | ||||||||||||||
Single-Family | ||||||||||||||
Net Revenues $3.8 Billion Net Income $1.7 Billion Comprehensive Income $1.4 Billion | ||||||||||||||
Multifamily | ||||||||||||||
Net Revenues $1.4 Billion Net Income $1.0 Billion Comprehensive Income $1.0 Billion | ||||||||||||||
Totals may not add due to rounding.
Freddie Mac First Quarter 2021 Financial Results
April 29, 2021
Page 2
McLean, VA — Freddie Mac (OTCQB: FMCC) today reported net income of $2.8 billion for the first quarter of 2021, an increase of $2.6 billion year-over-year, primarily driven by higher net revenues and lower credit-related expense. The company also reported comprehensive income of $2.4 billion for the first quarter of 2021, an increase of $1.8 billion year-over-year.
Net revenues increased 118% year-over-year to $5.3 billion, primarily driven by higher net interest income and higher net investment gains. Net interest income increased 31% year-over-year to $3.6 billion, primarily driven by growth in the Single-Family mortgage portfolio and higher deferred fee income recognition due to faster loan prepayments as a result of the low mortgage interest rate environment. Net investment gains were $1.2 billion, compared to net investment losses of $0.8 billion for the first quarter of 2020. This change was primarily driven by higher revenues from Multifamily loan purchase and securitization activities, while the first quarter of 2020 included significant spread-related losses as a result of the market volatility caused by the pandemic.
Credit-related expense declined 63% year-over-year to $0.4 billion, driven by improving economic conditions. Credit-related expense in the first quarter of 2020 was primarily driven by the negative economic effects of the pandemic.
Summary of Condensed Consolidated Statements of Comprehensive Income (Loss)
| (Dollars in millions) | 1Q 2021 | 4Q 2020 | Change | 1Q 2020 | Change | ||||||||||||||||||||||||||||||
| Net interest income | $3,639 | $3,653 | $(14) | $2,785 | $854 | ||||||||||||||||||||||||||||||
| Guarantee fee income | 248 | 281 | (33) | 377 | (129) | ||||||||||||||||||||||||||||||
| Investment gains (losses), net | 1,208 | 856 | 352 | (835) | 2,043 | ||||||||||||||||||||||||||||||
| Other income (loss) | 178 | 232 | (54) | 95 | 83 | ||||||||||||||||||||||||||||||
| Net revenues | 5,273 | 5,022 | 251 | 2,422 | 2,851 | ||||||||||||||||||||||||||||||
| Benefit (provision) for credit losses | 196 | 813 | (617) | (1,233) | 1,429 | ||||||||||||||||||||||||||||||
| Credit enhancement expense | (335) | (327) | (8) | (231) | (104) | ||||||||||||||||||||||||||||||
| Benefit for (decrease in) credit enhancement recoveries | (257) | (385) | 128 | 467 | (724) | ||||||||||||||||||||||||||||||
| Real estate owned (REO) operations expense | (8) | (10) | 2 | (85) | 77 | ||||||||||||||||||||||||||||||
| Credit-related expense | (404) | 91 | (495) | (1,082) | 678 | ||||||||||||||||||||||||||||||
| Administrative expense | (639) | (706) | 67 | (587) | (52) | ||||||||||||||||||||||||||||||
| Temporary Payroll Tax Cut Continuation Act of 2011 expense | (534) | (495) | (39) | (432) | (102) | ||||||||||||||||||||||||||||||
| Other expense | (215) | (243) | 28 | (103) | (112) | ||||||||||||||||||||||||||||||
| Operating expense | (1,388) | (1,444) | 56 | (1,122) | (266) | ||||||||||||||||||||||||||||||
| Income (loss) before income tax (expense) benefit | 3,481 | 3,669 | (188) | 218 | 3,263 | ||||||||||||||||||||||||||||||
| Income tax (expense) benefit | (714) | (756) | 42 | (45) | (669) | ||||||||||||||||||||||||||||||
| Net income (loss) | 2,767 | 2,913 | (146) | 173 | 2,594 | ||||||||||||||||||||||||||||||
| Total other comprehensive income (loss), net of taxes and reclassification adjustments | (389) | (391) | 2 | 449 | (838) | ||||||||||||||||||||||||||||||
| Comprehensive income (loss) | $2,378 | $2,522 | $(144) | $622 | $1,756 | ||||||||||||||||||||||||||||||
| Conservatorship metrics (in billions) | |||||||||||||||||||||||||||||||||||
| Net worth | $18.8 | $16.4 | $2.4 | $9.5 | $9.3 | ||||||||||||||||||||||||||||||
| Senior preferred stock liquidation preference | 89.1 | 86.5 | 2.5 | 81.8 | 7.3 | ||||||||||||||||||||||||||||||
| Remaining Treasury funding commitment | 140.2 | 140.2 | — | 140.2 | — | ||||||||||||||||||||||||||||||
| Cumulative dividend payments to Treasury | 119.7 | 119.7 | — | 119.7 | — | ||||||||||||||||||||||||||||||
| Cumulative draws from Treasury | 71.6 | 71.6 | — | 71.6 | — | ||||||||||||||||||||||||||||||
Totals may not add due to rounding.
Freddie Mac First Quarter 2021 Financial Results
April 29, 2021
Page 3
Segment Financial Results and Business Highlights
During the first quarter of 2021, Freddie Mac's chief operating decision maker began making decisions about allocating resources and assessing segment performance based on two reportable segments – Single-Family and Multifamily. In prior periods, the company managed its business based on three reportable segments – Single-Family Guarantee, Multifamily, and Capital Markets. In connection with this change, the company has also changed the measure of segment profit and loss for each segment to be based on segment net income and comprehensive income calculated using the same accounting policies the company uses to prepare its general purpose financial statements in conformity with generally accepted accounting principles. The financial results of each reportable segment include directly attributable revenue and expenses. The company allocates interest expense and other debt funding and hedging-related costs to each reportable segment using a funds transfer pricing process. The company fully allocates to each reportable segment the administrative expenses and other centrally-incurred costs that are not directly attributable to a particular segment using various methodologies depending on the nature of the expense. As a result, the sum of each income statement line item for the two reportable segments is equal to that same income statement line item for the consolidated entity. The company has discontinued the reclassifications of certain activities between various line items that were included in its previous measure of segment profit and loss. As a result, the company has also discontinued the use of Segment Earnings and therefore no longer presents net interest income, net interest yield, and guarantee fee income on an "adjusted," or non-GAAP, basis.
Prior period information has been revised to conform to the current period presentation. For more information about the company's reportable segments, see Note 15 to the financial statements included in the company’s Quarterly Report on Form 10-Q for the quarter ended March 31, 2021.
Freddie Mac First Quarter 2021 Financial Results
April 29, 2021
Page 4
| Single-Family Segment | ||
| Financial Results | ||
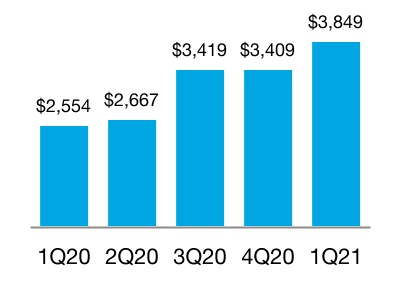
Net Revenues
(In millions)
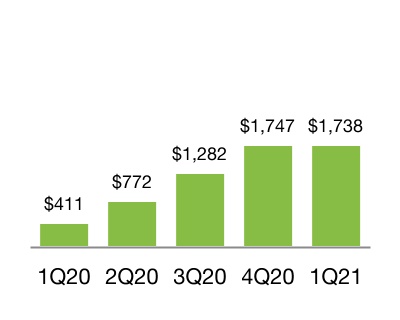
Net Income
(In millions)
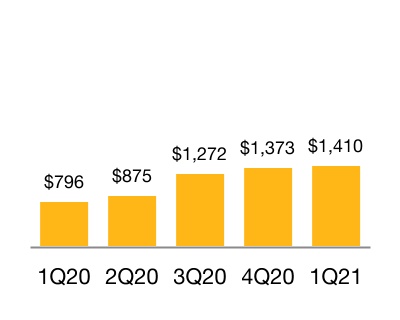
Comprehensive Income
(In millions)
| (Dollars in millions) | 1Q 2021 | 4Q 2020 | Change | 1Q 2020 | Change | |||||||||||||||||||||||||||
| Net interest income | $3,308 | $3,350 | $(42) | $2,485 | $823 | |||||||||||||||||||||||||||
| Guarantee fee income | 89 | 30 | 59 | (13) | 102 | |||||||||||||||||||||||||||
| Investment gains (losses), net | 300 | (158) | 458 | 24 | 276 | |||||||||||||||||||||||||||
| Other income (loss) | 152 | 187 | (35) | 58 | 94 | |||||||||||||||||||||||||||
| Net revenues | 3,849 | 3,409 | 440 | 2,554 | 1,295 | |||||||||||||||||||||||||||
| Benefit (provision) for credit losses | 146 | 790 | (644) | (1,166) | 1,312 | |||||||||||||||||||||||||||
| Credit enhancement expense | (325) | (321) | (4) | (227) | (98) | |||||||||||||||||||||||||||
| Benefit for (decrease in) credit enhancement recoveries | (245) | (379) | 134 | 439 | (684) | |||||||||||||||||||||||||||
| REO operations expense | (8) | (10) | 2 | (85) | 77 | |||||||||||||||||||||||||||
| Credit-related expense | (432) | 80 | (512) | (1,039) | 607 | |||||||||||||||||||||||||||
| Administrative expense | (488) | (564) | 76 | (467) | (21) | |||||||||||||||||||||||||||
| Temporary Payroll Tax Cut Continuation Act of 2011 Expense | (534) | (495) | (39) | (432) | (102) | |||||||||||||||||||||||||||
| Other expense | (209) | (229) | 20 | (98) | (111) | |||||||||||||||||||||||||||
| Operating expense | (1,231) | (1,288) | 57 | (997) | (234) | |||||||||||||||||||||||||||
| Income (loss) before income tax (expense) benefit | 2,186 | 2,201 | (15) | 518 | 1,668 | |||||||||||||||||||||||||||
| Income tax (expense) benefit | (448) | (454) | 6 | (107) | (341) | |||||||||||||||||||||||||||
| Net income (loss) | 1,738 | 1,747 | (9) | 411 | 1,327 | |||||||||||||||||||||||||||
| Total other comprehensive income (loss), net of tax | (328) | (374) | 46 | 385 | (713) | |||||||||||||||||||||||||||
| Comprehensive income (loss) | $1,410 | $1,373 | $37 | $796 | $614 | |||||||||||||||||||||||||||
Key Drivers
Net income and comprehensive income increased year-over-year, primarily driven by:
•Higher net interest income primarily due to mortgage portfolio growth and higher deferred fee income recognition, which was driven by a higher deferred fee balance and faster loan prepayments as a result of the low mortgage interest rate environment; and
•Lower credit-related expense primarily driven by a benefit for credit losses as a result of improving economic conditions in the first quarter of 2021, partially offset by a decrease in credit enhancement recoveries. Credit-related expense in the first quarter of 2020 was primarily driven by the negative economic effects of the pandemic.
Freddie Mac First Quarter 2021 Financial Results
April 29, 2021
Page 5
| Single-Family Segment | ||
| Business Results | ||
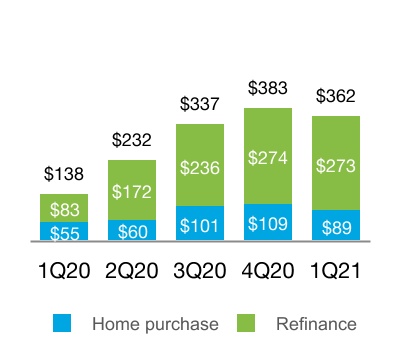
New Business Activity
(UPB in billions)
Mortgage Portfolio
(UPB in billions)
Serious Delinquency Rate
| 1Q 2021 | 4Q 2020 | Change | 1Q 2020 | Change | ||||||||||||||||||||||||||||
| New Business Statistics: | ||||||||||||||||||||||||||||||||
| Average guarantee fee rate charged (bps) | 50 | 47 | 3 | 49 | 1 | |||||||||||||||||||||||||||
| Weighted average original loan-to-value (LTV) (%) | 69 | 70 | (1) | 74 | (5) | |||||||||||||||||||||||||||
| Weighted average original credit score | 759 | 761 | (2) | 752 | 7 | |||||||||||||||||||||||||||
| First-time homebuyers (% of home purchase loans) | 46 | 45 | 1 | 47 | (1) | |||||||||||||||||||||||||||
| Single-Family homes funded (in thousands) | 1,231 | 1,292 | (61) | 526 | 705 | |||||||||||||||||||||||||||
| Purchase borrowers (in thousands) | 291 | 356 | (65) | 217 | 74 | |||||||||||||||||||||||||||
| Refinance borrowers (in thousands) | 940 | 936 | 4 | 309 | 631 | |||||||||||||||||||||||||||
| CRT issuance protected UPB (in billions) | $245 | $167 | $78 | $141 | $104 | |||||||||||||||||||||||||||
| Portfolio Statistics: | ||||||||||||||||||||||||||||||||
| Average guarantee fee rate charged (bps) | 45 | 44 | 1 | 41 | 4 | |||||||||||||||||||||||||||
| Weighted average current LTV (%) | 58 | 58 | — | 58 | — | |||||||||||||||||||||||||||
| Weighted average current credit score | 754 | 754 | — | 748 | 6 | |||||||||||||||||||||||||||
| Loan count (in millions) | 12 | 12 | — | 11 | 1 | |||||||||||||||||||||||||||
| Credit-Related Statistics: | ||||||||||||||||||||||||||||||||
| Loan workout activity (in thousands) | 94 | 133 | (39) | 11 | 83 | |||||||||||||||||||||||||||
| Loans in forbearance, based on loan count (%) | 2.19 | 2.70 | (0.51) | 0.14 | 2.05 | |||||||||||||||||||||||||||
| Current (%) | 0.32 | 0.37 | (0.05) | NM | NM | |||||||||||||||||||||||||||
| Past due (%) | 1.87 | 2.33 | (0.46) | NM | NM | |||||||||||||||||||||||||||
| Credit enhancement coverage (%) | 51 | 51 | — | 58 | (7) | |||||||||||||||||||||||||||
NM - not meaningful.
Business Highlights
•The company provided funding for 1.2 million single-family homes, nearly 940,000 of which were refinance loans. First-time homebuyers represented 46% of new single-family purchase loans.
•Single-Family loan workout activity increased to 94,000, from 11,000 in the first quarter of 2020, driven by completed forbearance agreements and payment deferrals primarily related to the COVID-19 pandemic.
•2.19% of loans in the Single-Family mortgage portfolio, based on loan count, were in forbearance as of March 31, 2021.
•Credit enhancement coverage of the Single-Family mortgage portfolio decreased to 51% from 58% in the first quarter of 2020, primarily due to a higher proportion of recently acquired loans with lower LTV ratios and the high volume of new business activity which has not been included in credit risk transfer (CRT) transactions yet, but may be included in future periods.
Freddie Mac First Quarter 2021 Financial Results
April 29, 2021
Page 6
| Multifamily Segment | ||
| Financial Results | ||
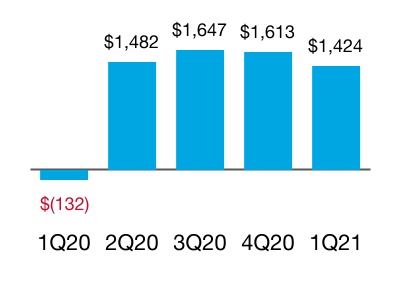
Net Revenues
(In millions)
Net Income
(In millions)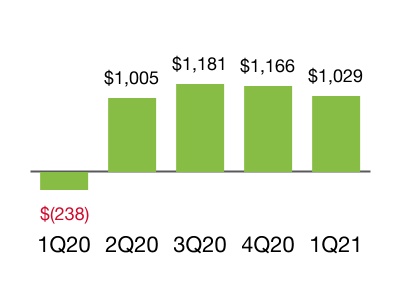
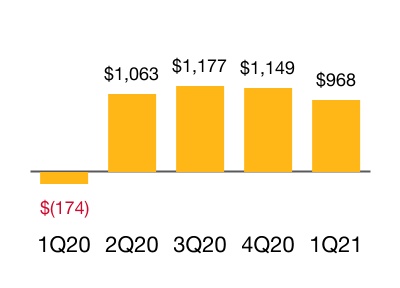
Comprehensive Income
(In millions)
| (Dollars in millions) | 1Q 2021 | 4Q 2020 | Change | 1Q 2020 | Change | |||||||||||||||||||||||||||
| Net interest income | $331 | $303 | $28 | $300 | $31 | |||||||||||||||||||||||||||
| Guarantee fee income | 159 | 251 | (92) | 390 | (231) | |||||||||||||||||||||||||||
| Investment gains (losses), net | 908 | 1,014 | (106) | (859) | 1,767 | |||||||||||||||||||||||||||
| Other income (loss) | 26 | 45 | (19) | 37 | (11) | |||||||||||||||||||||||||||
| Net revenues | 1,424 | 1,613 | (189) | (132) | 1,556 | |||||||||||||||||||||||||||
| Credit-related expense | 28 | 11 | 17 | (43) | 71 | |||||||||||||||||||||||||||
| Administrative expense | (151) | (142) | (9) | (120) | (31) | |||||||||||||||||||||||||||
| Other expense | (6) | (14) | 8 | (5) | (1) | |||||||||||||||||||||||||||
| Operating expense | (157) | (156) | (1) | (125) | (32) | |||||||||||||||||||||||||||
| Income (loss) before income tax (expense) benefit | 1,295 | 1,468 | (173) | (300) | 1,595 | |||||||||||||||||||||||||||
| Income tax (expense) benefit | (266) | (302) | 36 | 62 | (328) | |||||||||||||||||||||||||||
| Net income (loss) | 1,029 | 1,166 | (137) | (238) | 1,267 | |||||||||||||||||||||||||||
| Total other comprehensive income (loss), net of tax | (61) | (17) | (44) | 64 | (125) | |||||||||||||||||||||||||||
| Comprehensive income (loss) | $968 | $1,149 | $(181) | $(174) | $1,142 | |||||||||||||||||||||||||||
Key Drivers
Net income and comprehensive income, compared to a net loss and comprehensive loss in the first quarter of 2020, mainly driven by:
•Net investment gains, compared to net investment losses in the first quarter of 2020, primarily due to tighter spreads and higher margins on Multifamily loan commitments in the first quarter of 2021, while the first quarter of 2020 included significant spread-related losses as a result of the market volatility caused by the pandemic, partially offset by
•Lower guarantee fee income as continued growth in the Multifamily guarantee portfolio was more than offset by higher fair value losses on the guarantee assets as a result of an increase in interest rates in the first quarter of 2021. As most multifamily loans are not prepayable without penalty, increases in interest rates generally result in lower Multifamily guarantee asset fair values.
Freddie Mac First Quarter 2021 Financial Results
April 29, 2021
Page 7
| Multifamily Segment | ||
| Business Results | ||
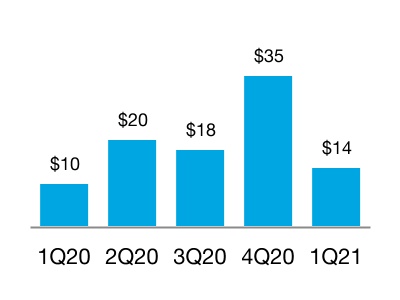
New Business Activity
(UPB in billions)
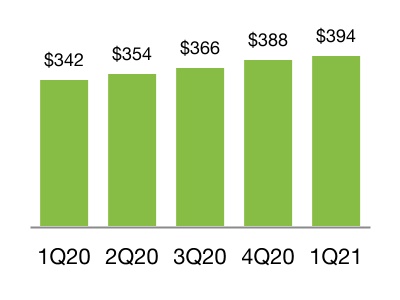
Mortgage Portfolio
(UPB in billions)
Delinquency Rate
| 1Q 2021 | 4Q 2020 | Change | 1Q 2020 | Change | ||||||||||||||||||||||||||||
| New Business Statistics: | ||||||||||||||||||||||||||||||||
| Weighted average original LTV (%) | 69 | 70 | (1) | 69 | — | |||||||||||||||||||||||||||
| Weighted average original debt service coverage ratio | 1.38 | 1.38 | — | 1.42 | (0.04) | |||||||||||||||||||||||||||
| Number of rental units financed (in thousands) | 134 | 306 | (172) | 111 | 23 | |||||||||||||||||||||||||||
| Affordable ≤ 80% of AMI (% of eligible units acquired) | 77 | 71 | 6 | 72 | 5 | |||||||||||||||||||||||||||
| Affordable ≤ 120% of AMI (% of eligible units acquired) | 97 | 96 | 1 | 96 | 1 | |||||||||||||||||||||||||||
| Securitization and Guarantee Activity Statistics: | ||||||||||||||||||||||||||||||||
| Average guarantee fee rate charged (bps) | 49 | 51 | (2) | 46 | 3 | |||||||||||||||||||||||||||
| Total securitization and guarantee activity (in billions) | $23 | $28 | $(5) | $13 | $10 | |||||||||||||||||||||||||||
| Guaranteed securities and other mortgage-related guarantees (in billions) | $21 | $26 | $(5) | $12 | $9 | |||||||||||||||||||||||||||
| Unguaranteed subordinated securities (in billions) | $2 | $2 | $— | $1 | $1 | |||||||||||||||||||||||||||
| Portfolio Statistics: | ||||||||||||||||||||||||||||||||
| Average guarantee fee rate charged (bps) | 41 | 39 | 2 | 37 | 4 | |||||||||||||||||||||||||||
| Loan count (in thousands) | 30 | 29 | 1 | 27 | 3 | |||||||||||||||||||||||||||
| Unit count (in thousands) | 4,613 | 4,598 | 15 | 4,286 | 327 | |||||||||||||||||||||||||||
| Credit-Related Statistics: | ||||||||||||||||||||||||||||||||
| Loans in forbearance, based on UPB (%) | 1.88 | 2.01 | (0.13) | — | 1.88 | |||||||||||||||||||||||||||
| Loans in forbearance period (%) | 0.06 | 0.10 | (0.04) | — | 0.06 | |||||||||||||||||||||||||||
| Loans in repayment period (%) | 1.82 | 1.91 | (0.09) | — | 1.82 | |||||||||||||||||||||||||||
| Credit enhancement coverage (%) | 92 | 89 | 3 | 91 | 1 | |||||||||||||||||||||||||||
Business Highlights
•The company provided financing for more than 134,000 multifamily rental units. 77% of the eligible multifamily rental units financed were affordable to families earning at or below 80% of area median income (AMI).
•As of March 31, 2021, 1.88% of the loans in the Multifamily mortgage portfolio, based on UPB, were in a forbearance program, and approximately 97% of these loans were in the repayment period. Approximately 85% of the total loans in a Multifamily forbearance program are included in securitizations with credit enhancement provided by subordination.
•Credit enhancement coverage of the Multifamily mortgage portfolio increased to 92% from 91% in the first quarter of 2020.
Freddie Mac First Quarter 2021 Financial Results
April 29, 2021
Page 8
About Freddie Mac’s Conservatorship
Since September 2008, Freddie Mac has been operating under conservatorship with FHFA as Conservator. The support provided by Treasury pursuant to the Purchase Agreement enables the company to maintain access to the debt markets and have adequate liquidity to conduct its normal business operations. The amount of funding available to Freddie Mac under the Purchase Agreement was $140.2 billion at March 31, 2021.
Due to changes to the terms of the senior preferred stock pursuant to the January 2021 Letter Agreement, the company will not be required to pay a dividend to Treasury until it has built sufficient capital to meet the capital requirements and buffers set forth in the Enterprise Regulatory Capital Framework (ERCF). As a result, the company was not required to pay a dividend to Treasury on the senior preferred stock in March 2021. As the company builds capital during this period, the quarterly increases in its Net Worth Amount have been, and will continue to be, added to the aggregate liquidation preference of the senior preferred stock. The liquidation preference of the senior preferred stock increased to $89.1 billion on March 31, 2021 based on the $2.5 billion increase in the Net Worth Amount during the fourth quarter of 2020, and will increase to $91.4 billion on June 30, 2021 based on the $2.4 billion increase in the Net Worth Amount during the first quarter of 2021.
For additional information on the Purchase Agreement, January 2021 Letter Agreement, senior preferred stock, and ERCF, see the company's Quarterly Report on Form 10-Q for the quarter ended March 31, 2021.
Additional Information
For more information, including information related to Freddie Mac’s financial results, conservatorship, and related matters, see the company’s Quarterly Report on Form 10-Q for the quarter ended March 31, 2021 and the company’s First Quarter 2021 Financial Results Supplement. These documents are available on the Investor Relations page of the company’s website at www.FreddieMac.com.
Additional information about Freddie Mac and its business is also set forth in the company’s other filings with the SEC, which are available on the Investor Relations page of the company’s website at www.FreddieMac.com and the SEC’s website at www.sec.gov. Freddie Mac encourages all investors and interested members of the public to review these materials for a more complete understanding of the company’s financial results and related disclosures.
Webcast Announcement
Management will host a conference call at 9 a.m. Eastern Time on April 29, 2021 to share the company’s results with the media. The conference call will be concurrently webcast. To access the audio webcast, use the following link: https://edge.media-server.com/mmc/p/i9nxu6fw. The replay will be available on the company’s website at www.FreddieMac.com for approximately 30 days. All materials related to the call will be available on the Investor Relations page of the company’s website at www.FreddieMac.com.
| Media Contact: Frederick Solomon (703) 903-3861 | Investor Contact: Laurie Garthune (571) 382-4732 | ||||
* * * *
This press release contains forward-looking statements, which may include statements pertaining to the conservatorship, the company’s current expectations and objectives for its Single-Family and Multifamily segments, its efforts to assist the housing market, liquidity and capital management, economic and market conditions and trends, the effects of the COVID-19 pandemic and actions taken in response thereto on its business, financial condition, and liquidity, its market share, the effect of legislative and regulatory developments and new accounting guidance, credit quality of loans the company owns or guarantees, the costs and benefits of the company’s CRT transactions, and results of operations and financial condition. Forward-looking statements involve known and unknown risks and uncertainties, some of which are beyond the company’s control. Management’s expectations for the company’s future necessarily involve a number of assumptions, judgments, and estimates, and various factors, including changes in market conditions, liquidity, mortgage spreads, credit outlook, uncertainty about the duration, severity, and effects of the COVID-19 pandemic and actions taken in response thereto, actions by the U.S. government (including FHFA, Treasury, and Congress) and state and local governments, and the impacts of legislation or regulations and new or amended accounting guidance, could cause actual results to differ materially from these expectations. These assumptions, judgments, estimates, and factors are discussed in the company’s Quarterly Report on Form 10-Q for the quarter ended March 31, 2021, which is
Freddie Mac First Quarter 2021 Financial Results
April 29, 2021
Page 9
available on the Investor Relations page of the company’s website at www.FreddieMac.com and the SEC’s website at www.sec.gov. The company undertakes no obligation to update forward-looking statements it makes to reflect events or circumstances occurring after the date of this press release.
Freddie Mac makes home possible for millions of families and individuals by providing mortgage capital to lenders. Since its creation by Congress in 1970, the company has made housing more accessible and affordable for homebuyers and renters in communities nationwide. The company is building a better housing finance system for homebuyers, renters, lenders, and taxpayers. Learn more at FreddieMac.com, Twitter @FreddieMac and Freddie Mac’s blog FreddieMac.com/blog.
Freddie Mac First Quarter 2021 Financial Results
April 29, 2021
Page 10
FREDDIE MAC
Condensed Consolidated Statements of Comprehensive Income (Loss) (Unaudited)
(In millions, except share-related amounts) | 1Q 2021 | 4Q 2020 | 1Q 2020 | |||||||||||||||||
| Net interest income | ||||||||||||||||||||
| Interest income | $13,902 | $14,183 | $17,592 | |||||||||||||||||
| Interest expense | (10,263) | (10,530) | (14,807) | |||||||||||||||||
| Net interest income | 3,639 | 3,653 | 2,785 | |||||||||||||||||
| Non-interest income (loss) | ||||||||||||||||||||
| Guarantee fee income | 248 | 281 | 377 | |||||||||||||||||
| Investment gains (losses), net | 1,208 | 856 | (835) | |||||||||||||||||
| Other income (loss) | 178 | 232 | 95 | |||||||||||||||||
| Non-interest income (loss) | 1,634 | 1,369 | (363) | |||||||||||||||||
| Net revenues | 5,273 | 5,022 | 2,422 | |||||||||||||||||
| Benefit (provision) for credit losses | 196 | 813 | (1,233) | |||||||||||||||||
| Non-interest expense | ||||||||||||||||||||
| Salaries and employee benefits | (344) | (342) | (341) | |||||||||||||||||
| Professional services | (87) | (129) | (76) | |||||||||||||||||
| Other administrative expense | (208) | (235) | (170) | |||||||||||||||||
| Total administrative expense | (639) | (706) | (587) | |||||||||||||||||
| Credit enhancement expense | (335) | (327) | (231) | |||||||||||||||||
| Benefit for (decrease in) credit enhancement recoveries | (257) | (385) | 467 | |||||||||||||||||
| REO operations expense | (8) | (10) | (85) | |||||||||||||||||
| Temporary Payroll Tax Cut Continuation Act of 2011 expense | (534) | (495) | (432) | |||||||||||||||||
| Other expense | (215) | (243) | (103) | |||||||||||||||||
| Non-interest expense | (1,988) | (2,166) | (971) | |||||||||||||||||
| Income (loss) before income tax (expense) benefit | 3,481 | 3,669 | 218 | |||||||||||||||||
| Income tax (expense) benefit | (714) | (756) | (45) | |||||||||||||||||
| Net income (loss) | 2,767 | 2,913 | 173 | |||||||||||||||||
| Other comprehensive income (loss), net of taxes and reclassification adjustments | ||||||||||||||||||||
| Changes in unrealized gains (losses) related to available-for-sale securities | (395) | (384) | 438 | |||||||||||||||||
| Changes in unrealized gains (losses) related to cash flow hedge relationships | 10 | 8 | 13 | |||||||||||||||||
| Changes in defined benefit plans | (4) | (15) | (2) | |||||||||||||||||
| Total other comprehensive income (loss), net of taxes and reclassification adjustments | (389) | (391) | 449 | |||||||||||||||||
| Comprehensive income (loss) | $2,378 | $2,522 | $622 | |||||||||||||||||
| Net income (loss) | $2,767 | $2,913 | $173 | |||||||||||||||||
| Future increase in senior preferred stock liquidation preference | (2,378) | (2,522) | (382) | |||||||||||||||||
| Net income (loss) attributable to common stockholders | $389 | $391 | $(209) | |||||||||||||||||
| Net income (loss) per common share — basic and diluted | $0.12 | $0.12 | $(0.06) | |||||||||||||||||
| Weighted average common shares outstanding (in millions) — basic and diluted | 3,234 | 3,234 | 3,234 | |||||||||||||||||
Freddie Mac First Quarter 2021 Financial Results
April 29, 2021
Page 11
FREDDIE MAC
Condensed Consolidated Balance Sheets (Unaudited)
| March 31, | December 31, | |||||||||||||
(In millions, except share-related amounts) | 2021 | 2020 | ||||||||||||
| Assets | ||||||||||||||
| Cash and cash equivalents (includes $61,962 and $17,379 of restricted cash and cash equivalents) | $100,979 | $23,889 | ||||||||||||
| Securities purchased under agreements to resell | 15,140 | 105,003 | ||||||||||||
| Investment securities, at fair value | 61,880 | 59,825 | ||||||||||||
| Mortgage loans held-for-sale (includes $8,093 and $14,199 at fair value) | 24,915 | 33,652 | ||||||||||||
| Mortgage loans held-for-investment (net of allowance for credit losses of $5,330 and $5,732) | 2,482,972 | 2,350,236 | ||||||||||||
| Accrued interest receivable (net of allowance of $213 and $140) | 7,662 | 7,754 | ||||||||||||
| Derivative assets, net | 2,085 | 1,205 | ||||||||||||
| Deferred tax assets, net | 6,826 | 6,557 | ||||||||||||
| Other assets (includes $5,894 and $5,775 at fair value) | 39,415 | 39,294 | ||||||||||||
| Total assets | $2,741,874 | $2,627,415 | ||||||||||||
| Liabilities and equity | ||||||||||||||
| Liabilities | ||||||||||||||
| Accrued interest payable | $5,954 | $6,210 | ||||||||||||
Debt (includes $2,364 and $2,592 at fair value) | 2,704,270 | 2,592,546 | ||||||||||||
| Derivative liabilities, net | 950 | 954 | ||||||||||||
| Other liabilities | 11,909 | 11,292 | ||||||||||||
| Total liabilities | 2,723,083 | 2,611,002 | ||||||||||||
| Commitments and contingencies | ||||||||||||||
| Equity | ||||||||||||||
Senior preferred stock (liquidation preference of $89,061 and $86,539) | 72,648 | 72,648 | ||||||||||||
| Preferred stock, at redemption value | 14,109 | 14,109 | ||||||||||||
| Common stock, $0.00 par value, 4,000,000,000 shares authorized, 725,863,886 shares issued and 650,059,553 shares and 650,059,292 shares outstanding | — | — | ||||||||||||
| Additional paid-in capital | — | — | ||||||||||||
| Retained earnings (accumulated deficit) | (64,335) | (67,102) | ||||||||||||
| AOCI, net of taxes, related to: | ||||||||||||||
| Available-for-sale securities | 415 | 810 | ||||||||||||
| Cash flow hedge relationships | (196) | (206) | ||||||||||||
| Defined benefit plans | 35 | 39 | ||||||||||||
| Total AOCI, net of taxes | 254 | 643 | ||||||||||||
| Treasury stock, at cost, 75,804,333 shares and 75,804,594 shares | (3,885) | (3,885) | ||||||||||||
| Total equity | 18,791 | 16,413 | ||||||||||||
| Total liabilities and equity | $2,741,874 | $2,627,415 | ||||||||||||
The table below presents the carrying value and classification of the assets and liabilities of consolidated variable interest entities (VIEs) on the company's condensed consolidated balance sheets. | ||||||||||||||
| March 31, | December 31, | |||||||||||||
| (In millions) | 2021 | 2020 | ||||||||||||
| Condensed Consolidated Balance Sheet Line Item | ||||||||||||||
| Assets: | ||||||||||||||
| Mortgage loans held-for-investment | $2,395,707 | $2,273,347 | ||||||||||||
| All other assets | 90,128 | 83,982 | ||||||||||||
| Total assets of consolidated VIEs | $2,485,835 | $2,357,329 | ||||||||||||
| Liabilities: | ||||||||||||||
| Debt | $2,445,829 | $2,308,176 | ||||||||||||
| All other liabilities | 5,592 | 5,610 | ||||||||||||
| Total liabilities of consolidated VIEs | $2,451,421 | $2,313,786 | ||||||||||||