Attached files
| file | filename |
|---|---|
| EX-99.1 - EXHIBIT 99.1 - CMS ENERGY CORP | tm2114543d1_ex99-1.htm |
| 8-K - FORM 8-K - CMS ENERGY CORP | tm2114543d1_8k.htm |
Exhibit 99.2

First Quarter 2021 Results and Outlo ok April 29, 2021 Leading the Clean Energy Transformation

2 Enter “so what” if necessary – Century Gothic, Bold, Size 18 or smaller This presentation is made as of the date hereof and contains “forward - looking statements” as defined in Rule 3b - 6 of the Securit ies Exchange Act of 1934, Rule 175 of the Securities Act of 1933, and relevant legal decisions. The forward - looking statements are subject to risks and uncertainties. All forward - looking statements should be considered in the context of the risk and other factors detailed from time to time in CMS Energy’s and Consumers Energy’s Securities and Exchange Commi ssi on filings. Forward - looking statements should be read in conjunction with “FORWARD - LOOKING STATEMENTS AND INFORMATION” and “RISK FACTORS” sections of CMS Energy’s and Consumers Energy’s most recent Form 10 - K and as updated in reports CMS Energy and Consumers Energy file with the Securities and Exchange Commission. CMS Energy’s and Con sum ers Energy’s “FORWARD - LOOKING STATEMENTS AND INFORMATION” and “RISK FACTORS” sections are incorporated herein by reference and discuss important factors th at could cause CMS Energy’s and Consumers Energy’s results to differ materially from those anticipated in such statements. CMS Energy and Consumers Energy undertake n o o bligation to update any of the information presented herein to reflect facts, events or circumstances after the date hereof. The presentation also includes non - GAAP measures when describing CMS Energy’s results of operations and financial performance. A reconciliation of each of these measures to the most directly comparable GAAP measure is included in the appendix and posted on our website at www.cmsenergy.com . CMS Energy provides historical financial results on both a reported (GAAP) and adjusted (non - GAAP) basis and provides forward - lo oking guidance on an adjusted basis. During an oral presentation, references to “earnings” are on an adjusted basis. All references to net income refer to net income avail abl e to common stockholders and references to earnings per share are on a diluted basis. Adjustments could include items such as discontinued operations, asset sales, imp air ments, restructuring costs, changes in accounting principles, changes in federal tax policy, regulatory items from prior years, unrealized gains or losses, recognized in net i nco me, from mark - to - market adjustments related to CMS Enterprises’ interest expense, or other items. Management views adjusted earnings as a key measure of the company’s present o per ating financial performance and uses adjusted earnings for external communications with analysts and investors. Internally, the company uses adjusted earnings to measure and assess performance. Because the company is not able to estimate the impact of specific line items, which have the potential to significantly impact, favorably or unfavo rab ly, the company's reported earnings in future periods, the company is not providing reported earnings guidance nor is it providing a reconciliation for the comparable future period ea rnings. The adjusted earnings should be considered supplemental information to assist in understanding our business results, rather than as a substitute for the repo rte d earnings. Management also views adjusted operating and maintenance (O&M) expenses as an important measure of operating efficiency. This measure excludes expenses related to ene rgy efficiency because they have no impact on net income, as well as certain historical amounts that reduce comparability to the current period. Other adjustments could in clude restructuring costs and regulatory items from prior years. Because the company is not able to estimate the impact of specific line items that have the potential to signifi can tly impact reported maintenance and other operating expenses, the company is not providing a reconciliation for the comparable future period expenses. Investors and others should note that CMS Energy routinely posts important information on its website and considers the Inves tor Relations section, www.cmsenergy.com/investor - relations , a channel of distribution. Presentation endnotes are included after the appendix. 2

3 A Simple Investment Thesis . . . . . . delivers results for ALL our stakeholders. Infrastructure Renewal Constructive Legislation Strong Cash Flow & Balance Sheet Clean Energy Leader Diversified Service Territory Industry - leading clean energy commitment Net Zero Carbon (2040) & Net Zero Methane (2030) a Excellence through the Top - tier regulatory jurisdiction b Premium total shareholder r eturn 6% to 8% adjusted EPS growth + ~3% dividend yield Nearly two decades of industry - leading financial performance Presentation endnotes are included after the appendix. Affordable Prices

4 Commentary Amount Solid First Quarter . . . . . . a nd o n track to achieve 6% to 8% adjusted EPS growth. Q1 2021 Results Adjusted EPS Dividend Per Share (DPS) Paid $1.21 43.5 ¢ Executing on plan Consistent growth Adjusted EPS Guidance Annual DPS $2.83 – $2.87 $1.74 Up 6 % to 8% In - line with earnings Adjusted EPS and DPS growth +6% to +8% Maintains top - tier growth Long - term Outlook 2021 Outlook
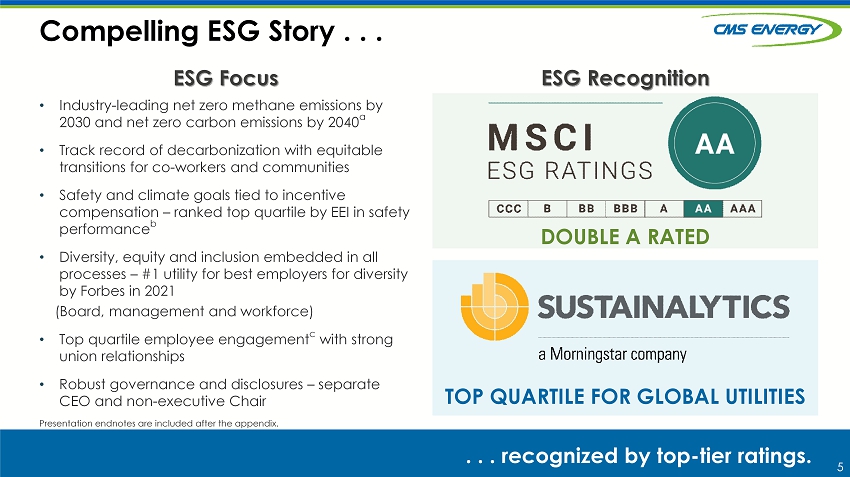
5 • Industry - leading net zero methane emissions by 2030 and net zero carbon emissions by 2040 a • Track record of decarbonization with equitable transitions for co - workers and communities • Safety and climate goals tied to incentive compensation – ranked top quartile by EEI in safety performance b • Diversity, equity and inclusion embedded in all processes – #1 utility for best employers for diversity by Forbes in 2021 (Board, management and workforce) • Top quartile employee engagement c with strong union relationships • Robust governance and disclosures – separate CEO and non - executive Chair ESG Focus ESG Recognition Compelling ESG Story . . . . . . recognized by top - tier ratings. TOP QUARTILE FOR GLOBAL UTILITIES DOUBLE A RATED Presentation endnotes are included after the appendix.

6 • 15% Renewable Portfolio Standard (RPS): • Heartland Wind, 201 MW approved in March (COD 2022), $326 MM, 10.7% ROE • Current Integrated Resource Plan (IRP): • 1,100 MW of solar through 2024 (3 tranches); ~300 MW of solar approved in April (Expected COD 2022) • Owned: 150 MW, $261 MM • PPA with incentive: 140 MW Recent Updates 2021 Pending IRP Objectives • Deliver across the Triple Bottom Line • Accelerate decarbonization • Ensure reliability and resilience while maintaining affordability • Increase use of renewable energy and demand - side resources • Maintain strong balance sheet Growing Utility Renewable Portfolio . . . . . . supports our clean energy transformation. TBU

7 2012 2020 2025 2030 % Fugitve Emissions c Coal Retirements Fugitive Methane Emissions Rate Aggressive Decarbonization Efforts . . . . . . are focused on cleaner generation and gas infrastructure. 0.19% 0.14% 0. 08 % Net Zero (16)% ~(40)% (100)% Net Methane Emissions Reduction b Presentation endnotes are included after the appendix. 2.7 0.9 0.5 1.3 Legacy Coal Classic 7 2016 Karn 1&2 2023 Campbell 1-3 (2031 & Beyond) Capacity in GW Timing per current IRP (38)% (45)% >(90)% CO 2 Emissions Reduction a Additional Decarbonization Efforts • Energy efficiency • RNG • Offsets • Hydrogen (Future) 2018 2024 Future

8 Recession Consistent Growth Through . . . . . . changing circumstances. 2003 2004 2005 2006 2007 2008 2009 2010 2011 2012 2013 2014 2015 2016 2017 2018 2019 2020 2021 Recession Adjusted EPS Dividend +7% +6% to +8% Weather Help Hurt Cold winter Mild summer Warm winter Warm winter Mild summer Cold winter Summer - less Hot summer Hot summer Warm winter Mild summer Polar vortex Cold Feb Warm Dec Warm winter Warm winter Hot summer Storms Pandemic Governor (D) Governor (R) Gov. (D) Commission (D) Commission (D) Commission (R) Commission (I) Comm. (D) Dave Joos John Russell Patti Poppe K. Whipple Garrick Rochow 7% Adjusted EPS CAGR

9 By Business Segment EPS - (GAAP) Adjustments a Adjusted (non - GAAP) Results 2021 First Quarter EPS Results . . . $0 .85 0.01 $ 0.86 $ 1.21 -- $ 1.21 Adjusted EPS 2020 2021 . . . driven by customer investments and sustained cost performance. Presentation endnotes are included after the appendix. Utility $1.16 Enterprises 0.05 EnerBank 0.11 Parent & Other ( 0.11 ) CMS Energy $ 1.21

10 2020 Weather Rates & Investment Customer Initiatives & Cost Savings Usage, Enterprises, Tax & Other Normal Weather Rates & Investment Customer Initiatives & Cost Savings Usage, Enterprises, Tax & Other 2021 2021 Adjusted EPS . . . . . . managing through COVID - 19 risks. . . . s upports another year of 6% to 8% growth. First Quarter $0.86 First Quarter $ 1.21 First Three Months 35¢ Nine Months To - Go (15)¢ – (19) ¢ $2.83 – $2.87 +6% to +8% 8 ¢ $2.67 26¢ 3¢ (12) ¢ 22 ¢ (7 )¢ – (11 )¢ (2)¢ ( 18 )¢

11 Utility Investment Plan Investing in the Clean Energy Transformation . . . . . . while focusing on safety, reliability and affordability. Electric Rate Case Presentation endnotes are included after the appendix. • Filed Mar. 1 for $225 MM • Test year ending Dec. 2022 • Seeking recovery for investments in: • System reliability • IRP solar & clean energy transformation • Enhanced customer experience • Includes 10.5% ROE and 52.0% financial equity ratio • $12.9 Bn rate base c • Final order by Dec. 2021 '21-'25 Plan ~$13¼ Bn $25 Bn 10 - yr Plan with $3 - $4 Bn of Opportunities 40% 42% 18% Clean Energy Generation Electric Gas x x Delivers : 40% investment in cl ean energy t ransformation a >7% annual rate base growth b Incentives above authorized ROE x

12 Cost of Capital Capital Investments Taxes O&M Costs Fuel and Power Costs 0% 100% Estimated Cost Savings Our Entire Cost Structure . . . Cost Components . . . offers cost reduction opportunities to maintain customer affordability. 2022 2023 2025 Palisades retirement Karn 1&2 coal unit retirements (adj. O&M savings b ) MCV contract change Campbell coal unit retirements (adj. O&M savings b ) $90 MM $30 MM >$60 MM $60 MM Year Event Savings PLUS PRODUCTIVITY CE residential utility bill as % of wallet at ~3% a (down 100 bps from 2007 while investing ~$19 Bn) 2031 & Beyond >$200 MM identified future cost savings Presentation endnotes are included after the appendix. ~70% Non - capital related x

13 13 Q&A Thank You

14 14 Appendix

15 2021 Adjusted EPS Sensitivities Utility Sales Continue to Recover . . . . . . a nd are supported by favorable mix. Weather - Normalized Electric Deliveries a Res. Com. Ind. Total 2% (4)% (2)% b (1) % b Presentation endnotes are included after the appendix. Electric Residential Commercial Industrial 4¢ 2½ 2¢ (1% Full Year in Volume) Gas ½ ½ ½ (Q1 2021 vs. Q1 2020)

16 Full - Year Impact Sensitivity Adj. EPS OCF Sales a Electric (~35,200 GWh) Gas (~303 Bcf) + 1% + 1 ( ¢) + 7 + 3 ($MM) + 27 + 13 Gas Prices + 50 ¢ + 0 + 60 Utility Earned ROE Electric Gas + 10 bps + 10 + 2 + 1 + 7 + 4 Interest Rates + 25 bps <1 1 Effective Tax Rate (12%) + 100 bps 3 0 EE b Incentives (20% of spend) + 25 MM + 1 + 5 2021 Sensitivities . . . . . . reflect effective risk mitigation. + + + + Presentation endnotes are included after the appendix.

17 . Ratings Drivers Credit Metrics Maintained . . . Consumers Energy CMS Energy • Strong financial position • Growing operating cash flow • Return on regulated investment • Supportive regulatory environment Senior Secured Commercial Paper Outlook Senior Unsecured Junior Subordinated Outlook Last Review A A - 2 Stable BBB BBB - Stable Jan. 2021 Aa3 P - 1 Negative Baa1 Baa2 Negative Jul. 2020 A+ F - 2 Stable BBB BB+ Stable Dec. 2020 S&P Moody’s Fitch . . . at solid investment - grade levels.

18 Operating Cash Flow Generation . . . (1.1) $2.3 2020 2021 2022 2023 2024 2025 $1. 85 $1. 95 $ 2.05 $2.15 $2.25 Amount (Bn) Cash flow before dividend Investment NOLs b & Credits $0.6 $0.5 $0.6 $0.6 $0.5 $0.4 ~$10¼ Bn in aggregate . . . remains strong and supports our capital plan. $1. 98 a Adj. Presentation endnotes are included after the appendix.

19 19 Endnotes

20 20 Slide 3: a Methane emissions from our natural gas delivery system and carbon emissions company - wide b UBS Research, 2020 state rankings and D.C. Slide 5: a Methane emissions from our natural gas delivery system and carbon emissions company - wide b Ranked top quartile by EEI utility standards in s afety performance in 2019 c By CultureIQ , top quartile for U.S. utilities in 2020 Slide 7: a Consumers Energy emissions reductions from 2005 baseline b Methane emissions from our natural gas delivery system from 2012 baseline c Fugitive methane emissions rate as measured for distribution segment Slide 9: a See GAAP reconciliation on slide 24 Slide 11: a Includes electric clean generation, distribution, grid modernization and gas infrastructure modernization b Assumes ~$21½ Bn rate base in 2021, $28 Bn in 2025, CAGR c Excludes $1.2 Bn of RPS renewables Slide 12: a 2019 Consumers Energy bill as % of Michigan household income, in current dollars. Source: Fred.stlouisfed.org, Bls.gov b Excludes potential fuel savings Slide 15: a Q1 20 21 vs. Q1 2020, year over year change in GWh, excludes ROA and other b Excludes one large, low - margin industrial customer Slide 16: a Reflects 2021 sales forecast; weather - normalized b Energy Efficiency Slide 18: a Excludes $700 MM discretionary pension contributions in 2020 (non - GAAP) b After - tax Presentation Endnotes ( pg 1)

21 21 GAAP Reconciliation

22 CMS ENERGY CORPORATION Reconciliation of GAAP EPS to Non - GAAP Adjusted EPS by Segment (Unaudited) Electric Utility Reported net income per share $ 0.54 $ 0.41 Reconciling items: Other exclusions from adjusted earnings - 0.01 Tax impact - (*) Voluntary separation program - 0.03 Tax impact - (0.01) Adjusted net income per share – non-GAAP $ 0.54 $ 0.44 Gas Utility Reported net income per share $ 0.62 $ 0.41 Reconciling items: Other exclusions from adjusted earnings - * Tax impact - (*) Voluntary separation program - 0.01 Tax impact - (*) Adjusted net income per share – non-GAAP $ 0.62 $ 0.42 Enterprises Reported net income per share $ 0.05 $ 0.07 Reconciling items: Other exclusions from adjusted earnings (*) * Tax impact * (*) Tax reform - (0.01) Voluntary separation program - * Tax impact - (*) Adjusted net income per share – non-GAAP $ 0.05 $ 0.06 EnerBank Reported net income per share $ 0.11 $ 0.05 Reconciling items: Other exclusions from adjusted earnings - - Tax impact - - Adjusted net income per share – non-GAAP $ 0.11 $ 0.05 Corporate Interest and Other Reported net loss per share $ (0.11) $ (0.09) Reconciling items: Other exclusions from adjusted earnings - (*) Tax impact - * Tax reform - (0.02) Adjusted net loss per share – non-GAAP $ (0.11) $ (0.11) Consolidated Reported net income per share $ 1.21 $ 0.85 Reconciling items: Other exclusions from adjusted earnings (*) 0.01 Tax impact * (*) Tax reform - (0.03) Voluntary separation program - 0.04 Tax impact - (0.01) Adjusted net income per share – non-GAAP $ 1.21 $ 0.86 Average Common Shares Outstanding – Diluted 289.1 285.2 * Less than $0.01 per share. In Millions, Except Per Share Amounts Three Months Ended 3/31/21 3/31/20
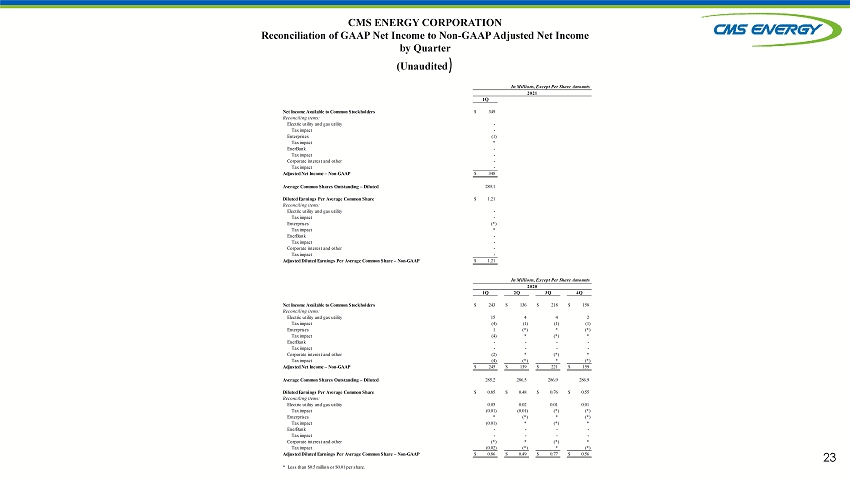
23 CMS ENERGY CORPORATION Reconciliation of GAAP Net Income to Non - GAAP Adjusted Net Income by Quarter (Unaudited ) Net Income Available to Common Stockholders $ 349 Reconciling items: Electric utility and gas utility - Tax impact - Enterprises (1) Tax impact * EnerBank - Tax impact - Corporate interest and other - Tax impact - Adjusted Net Income – Non-GAAP $ 348 Average Common Shares Outstanding – Diluted 289.1 Diluted Earnings Per Average Common Share $ 1.21 Reconciling items: Electric utility and gas utility - Tax impact - Enterprises (*) Tax impact * EnerBank - Tax impact - Corporate interest and other - Tax impact - Adjusted Diluted Earnings Per Average Common Share – Non-GAAP $ 1.21 Net Income Available to Common Stockholders $ 243 $ 136 $ 218 $ 158 Reconciling items: Electric utility and gas utility 15 4 4 2 Tax impact (4) (1) (1) (1) Enterprises 1 (*) * (*) Tax impact (4) * (*) * EnerBank - - - - Tax impact - - - - Corporate interest and other (2) * (*) * Tax impact (4) (*) * (*) Adjusted Net Income – Non-GAAP $ 245 $ 139 $ 221 $ 159 Average Common Shares Outstanding – Diluted 285.2 286.5 286.9 286.9 Diluted Earnings Per Average Common Share $ 0.85 $ 0.48 $ 0.76 $ 0.55 Reconciling items: Electric utility and gas utility 0.05 0.02 0.01 0.01 Tax impact (0.01) (0.01) (*) (*) Enterprises * (*) * (*) Tax impact (0.01) * (*) * EnerBank - - - - Tax impact - - - - Corporate interest and other (*) * (*) * Tax impact (0.02) (*) * (*) Adjusted Diluted Earnings Per Average Common Share – Non-GAAP $ 0.86 $ 0.49 $ 0.77 $ 0.56 * Less than $0.5 million or $0.01 per share. 1Q 2Q 3Q 4Q 2020 In Millions, Except Per Share Amounts 2021 1Q In Millions, Except Per Share Amounts
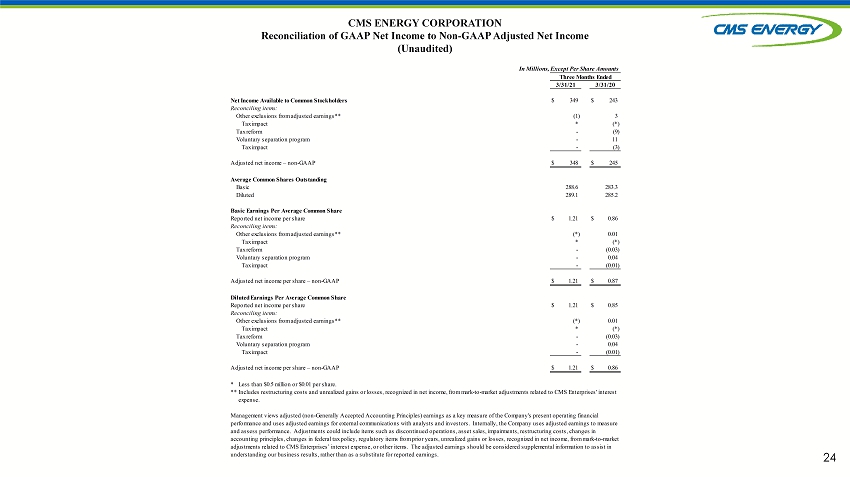
24 CMS ENERGY CORPORATION Reconciliation of GAAP Net Income to Non - GAAP Adjusted Net Income (Unaudited) Net Income Available to Common Stockholders $ 349 $ 243 Reconciling items: Other exclusions from adjusted earnings** (1) 3 Tax impact * (*) Tax reform - (9) Voluntary separation program - 11 Tax impact - (3) Adjusted net income – non-GAAP $ 348 $ 245 Average Common Shares Outstanding Basic 288.6 283.3 Diluted 289.1 285.2 Basic Earnings Per Average Common Share Reported net income per share $ 1.21 $ 0.86 Reconciling items: Other exclusions from adjusted earnings** (*) 0.01 Tax impact * (*) Tax reform - (0.03) Voluntary separation program - 0.04 Tax impact - (0.01) Adjusted net income per share – non-GAAP $ 1.21 $ 0.87 Diluted Earnings Per Average Common Share Reported net income per share $ 1.21 $ 0.85 Reconciling items: Other exclusions from adjusted earnings** (*) 0.01 Tax impact * (*) Tax reform - (0.03) Voluntary separation program - 0.04 Tax impact - (0.01) Adjusted net income per share – non-GAAP $ 1.21 $ 0.86 * Less than $0.5 million or $0.01 per share. ** In Millions, Except Per Share Amounts Management views adjusted (non-Generally Accepted Accounting Principles) earnings as a key measure of the Company's present operating financial performance and uses adjusted earnings for external communications with analysts and investors. Internally, the Company uses adjusted earnings to measure and assess performance. Adjustments could include items such as discontinued operations, asset sales, impairments, restructuring costs, changes in accounting principles, changes in federal tax policy, regulatory items from prior years, unrealized gains or losses, recognized in net income, from mark-to-market adjustments related to CMS Enterprises’ interest expense, or other items. The adjusted earnings should be considered supplemental information to assist in understanding our business results, rather than as a substitute for reported earnings. Three Months Ended 3/31/21 3/31/20 Includes restructuring costs and unrealized gains or losses, recognized in net income, from mark-to-market adjustments related to CMS Enterprises' interest expense.
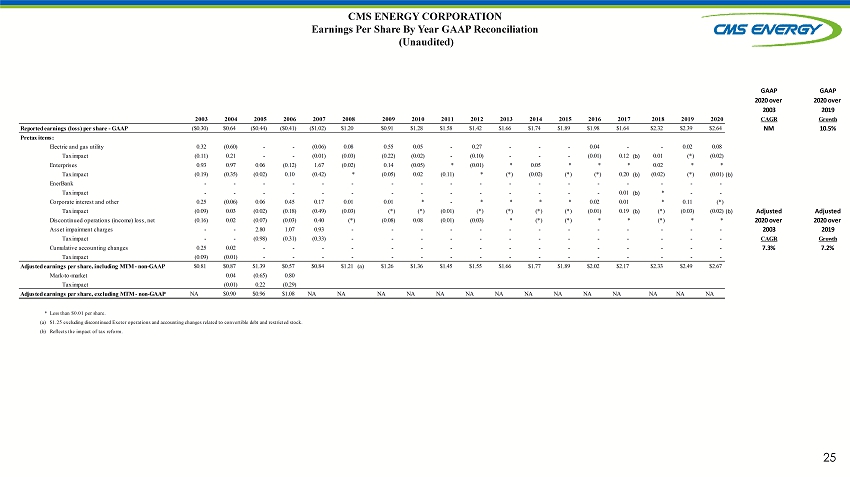
25 CMS ENERGY CORPORATION Earnings Per Share By Year GAAP Reconciliation (Unaudited) GAAP GAAP 2020 over 2020 over 2003 2019 2003 2004 2005 2006 2007 2008 2009 2010 2011 2012 2013 2014 2015 2016 2017 2018 2019 2020 CAGR Growth Reported earnings (loss) per share - GAAP ($0.30) $0.64 ($0.44) ($0.41) ($1.02) $1.20 $0.91 $1.28 $1.58 $1.42 $1.66 $1.74 $1.89 $1.98 $1.64 $2.32 $2.39 $2.64 NM 10.5% Pretax items: Electric and gas utility 0.32 (0.60) - - (0.06) 0.08 0.55 0.05 - 0.27 - - - 0.04 - - 0.02 0.08 Tax impact (0.11) 0.21 - - (0.01) (0.03) (0.22) (0.02) - (0.10) - - - (0.01) 0.12 (b) 0.01 (*) (0.02) Enterprises 0.93 0.97 0.06 (0.12) 1.67 (0.02) 0.14 (0.05) * (0.01) * 0.05 * * * 0.02 * * Tax impact (0.19) (0.35) (0.02) 0.10 (0.42) * (0.05) 0.02 (0.11) * (*) (0.02) (*) (*) 0.20 (b) (0.02) (*) (0.01)(b) EnerBank - - - - - - - - - - - - - - - - - - Tax impact - - - - - - - - - - - - - - 0.01 (b) * - - Corporate interest and other 0.25 (0.06) 0.06 0.45 0.17 0.01 0.01 * - * * * * 0.02 0.01 * 0.11 (*) Tax impact (0.09) 0.03 (0.02) (0.18) (0.49) (0.03) (*) (*) (0.01) (*) (*) (*) (*) (0.01) 0.19 (b) (*) (0.03) (0.02)(b) Adjusted Adjusted Discontinued operations (income) loss, net (0.16) 0.02 (0.07) (0.03) 0.40 (*) (0.08) 0.08 (0.01) (0.03) * (*) (*) * * (*) * * 2020 over 2020 over Asset impairment charges - - 2.80 1.07 0.93 - - - - - - - - - - - - - 2003 2019 Tax impact - - (0.98) (0.31) (0.33) - - - - - - - - - - - - - CAGR Growth Cumulative accounting changes 0.25 0.02 - - - - - - - - - - - - - - - - 7.3% 7.2% Tax impact (0.09) (0.01) - - - - - - - - - - - - - - - - Adjusted earnings per share, including MTM - non-GAAP $0.81 $0.87 $1.39 $0.57 $0.84 $1.21 (a) $1.26 $1.36 $1.45 $1.55 $1.66 $1.77 $1.89 $2.02 $2.17 $2.33 $2.49 $2.67 Mark-to-market 0.04 (0.65) 0.80 Tax impact (0.01) 0.22 (0.29) Adjusted earnings per share, excluding MTM - non-GAAP NA $0.90 $0.96 $1.08 NA NA NA NA NA NA NA NA NA NA NA NA NA NA * Less than $0.01 per share. (a) $1.25 excluding discontinued Exeter operations and accounting changes related to convertible debt and restricted stock. (b) Reflects the impact of tax reform.
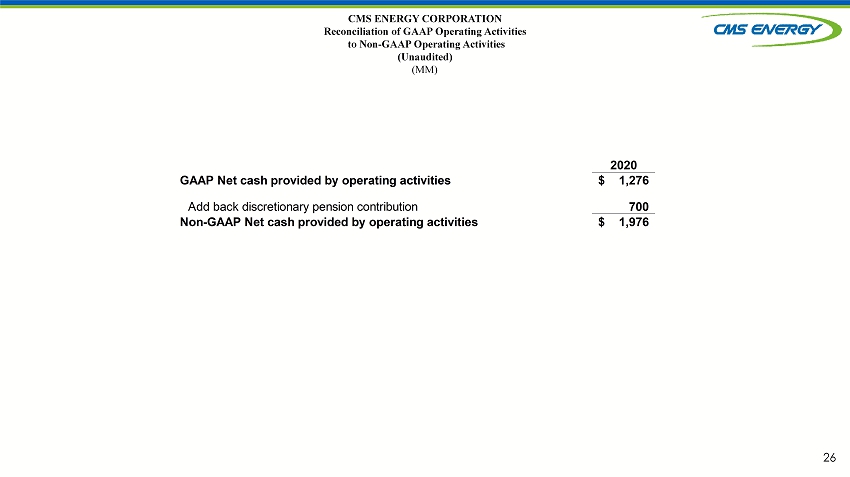
26 CMS ENERGY CORPORATION Reconciliation of GAAP Operating Activities to Non - GAAP Operating Activities (Unaudited) (MM) 2020 GAAP Net cash provided by operating activities 1,276$ 700 Non-GAAP Net cash provided by operating activities 1,976$ Add back discretionary pension contribution