Attached files
| file | filename |
|---|---|
| 8-K - 8-K - Bridgewater Bancshares Inc | bwb-20210429x8k.htm |
| EX-99.1 - EX-99.1 - Bridgewater Bancshares Inc | bwb-20210429xex99d1.htm |
Exhibit 99.2
| Investor Presentation Fourth Quarter 2019 |

| 2 Disclaimer Forward-Looking Statements This presentation contains “forward-looking statements” within the meaning of the safe harbor provisions of the U.S. Private Securities Litigation Reform Act of 1995. Forward-looking statements include, without limitation, statements concerning plans, estimates, calculations, forecasts and projections with respect to the anticipated future performance of Bridgewater Bancshares, Inc. (the “Company”). These statements are often, but not always, identified by words such as “may”, “might”, “should”, “could”, “predict”, “potential”, “believe”, “expect”, “continue”, “will”, “anticipate”, “seek”, “estimate”, “intend”, “plan”, “projection”, “would”, “annualized”, “target” and “outlook”, or the negative version of those words or other comparable words of a future or forward-looking nature. Forward-looking statements are neither historical facts nor assurances of future performance. Instead, they are based only on our current beliefs, expectations and assumptions regarding our business, future plans and strategies, projections, anticipated events and trends, the economy and other future conditions. Because forward-looking statements relate to the future, they are subject to inherent uncertainties, risks and changes in circumstances that are difficult to predict and many of which are outside of our control. Our actual results and financial condition may differ materially from those indicated in the forward-looking statements. Therefore, you should not rely on any of these forward-looking statements. Important factors that could cause our actual results and financial condition to differ materially from those indicated in the forward-looking statements include, among others, the following: the negative effects of the COVID-19 pandemic, including its effects on the economic environment, our clients and our operations, as well as any changes to federal, state or local government laws, regulations or orders in connection with the pandemic; loan concentrations in our portfolio; the overall health of the local and national real estate market; our ability to successfully manage credit risk; business and economic conditions generally and in the financial services industry, nationally and within our market area; our ability to maintain an adequate level of allowance for loan losses; new or revised accounting standards, including as a result of the future implementation of the Current Expected Credit Loss Standard; our high concentration of large loans to certain borrowers; our concentration of large deposits from certain clients; our ability to successfully manage liquidity risk; our dependence on non-core funding sources and our cost of funds; our ability to raise additional capital to implement our business plan; our ability to implement our growth strategy and manage costs effectively; developments and uncertainty related to the future use and availability of some reference rates, such as the London Interbank Offered Rate, as well as other alternative reference rates; the composition of our senior leadership team and our ability to attract and retain key personnel; the occurrence of fraudulent activity, breaches or failures of our information security controls or cybersecurity-related incidents; interruptions involving our information technology and telecommunications systems or third-party servicers; competition in the financial services industry; the effectiveness of our risk management framework; the commencement and outcome of litigation and other legal proceedings and regulatory actions against us; the impact of recent and future legislative and regulatory changes; interest rate risk; fluctuations in the values of the securities held in our securities portfolio; the imposition of tariffs or other governmental policies impacting the value of products produced by our commercial borrowers; severe weather, natural disasters, wide spread disease or pandemics (including the COVID-19 pandemic), acts of war or terrorism or other adverse external events; potential impairment to the goodwill we recorded in connection with our past acquisition; changes to U.S. tax laws, regulations and guidance; and any other risks described in the “Risk Factors” sections of reports and other documents filed by the Company with the Securities and Exchange Commission. Any forward-looking statement made by us in this presentation is based only on information currently available to us and speaks only as of the date on which it is made. We undertake no obligation to publicly update any forward-looking statement, whether written or oral, that may be made from time to time, whether as a result of new information, future developments or otherwise. Certain of the information contained in this presentation is derived from information provided by industry sources. Although we believe that such information is accurate and that the sources from which it has been obtained are reliable, we cannot guarantee the accuracy of, and have not independently verified, such information. Use of Non-GAAP financial measures In addition to the results presented in accordance with U.S. General Accepted Accounting Principles (“GAAP”), the Company routinely supplements its evaluation with an analysis of certain non-GAAP financial measures. The Company believes these non-GAAP financial measures, in addition to the related GAAP measures, provide meaningful information to investors to help them understand the Company’s operating performance and trends, and to facilitate comparisons with the performance of peers. These disclosures should not be viewed as a substitute for operating results determined in accordance with GAAP, nor are they necessarily comparable to non-GAAP performance measures that may be presented by other companies. Reconciliations of non-GAAP disclosures to the comparable GAAP measures are provided in this presentation. |
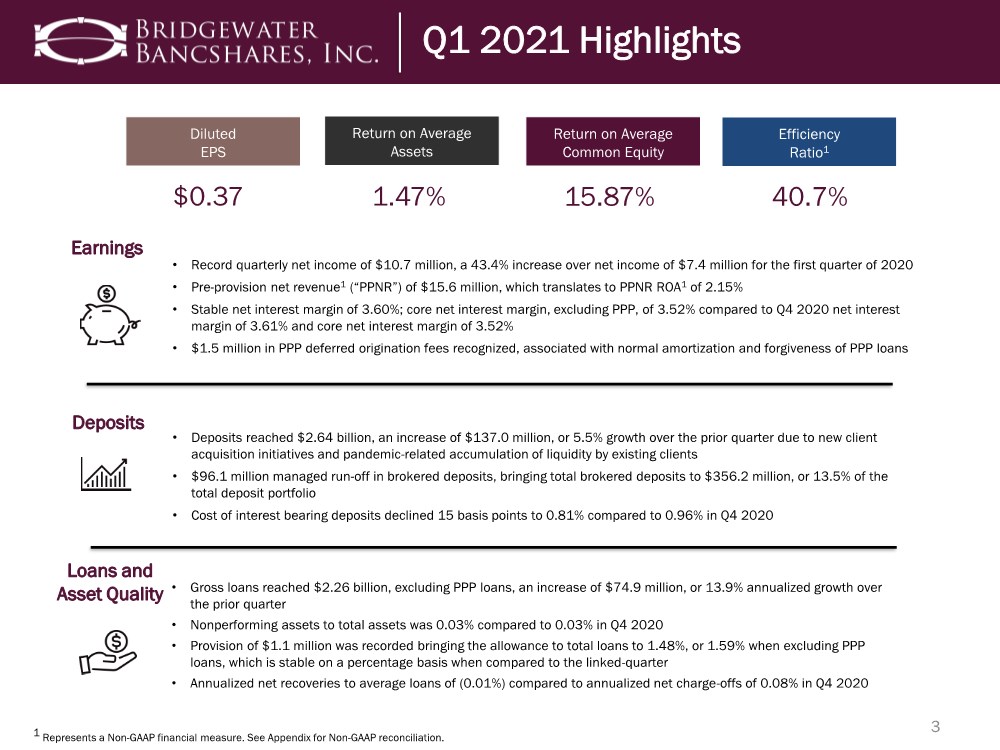
| 1 Represents a Non-GAAP financial measure. See Appendix for Non-GAAP reconciliation. 3 Q1 2021 Highlights $0.37 • Record quarterly net income of $10.7 million, a 43.4% increase over net income of $7.4 million for the first quarter of 2020 • Pre-provision net revenue1 (“PPNR”) of $15.6 million, which translates to PPNR ROA1 of 2.15% • Stable net interest margin of 3.60%; core net interest margin, excluding PPP, of 3.52% compared to Q4 2020 net interest margin of 3.61% and core net interest margin of 3.52% • $1.5 million in PPP deferred origination fees recognized, associated with normal amortization and forgiveness of PPP loans Diluted EPS Efficiency Ratio1 Return on Average Common Equity Return on Average Assets 1.47% 15.87% 40.7% Earnings Deposits • Deposits reached $2.64 billion, an increase of $137.0 million, or 5.5% growth over the prior quarter due to new client acquisition initiatives and pandemic-related accumulation of liquidity by existing clients • $96.1 million managed run-off in brokered deposits, bringing total brokered deposits to $356.2 million, or 13.5% of the total deposit portfolio • Cost of interest bearing deposits declined 15 basis points to 0.81% compared to 0.96% in Q4 2020 Loans and Asset Quality • Gross loans reached $2.26 billion, excluding PPP loans, an increase of $74.9 million, or 13.9% annualized growth over the prior quarter • Nonperforming assets to total assets was 0.03% compared to 0.03% in Q4 2020 • Provision of $1.1 million was recorded bringing the allowance to total loans to 1.48%, or 1.59% when excluding PPP loans, which is stable on a percentage basis when compared to the linked-quarter • Annualized net recoveries to average loans of (0.01%) compared to annualized net charge-offs of 0.08% in Q4 2020 |
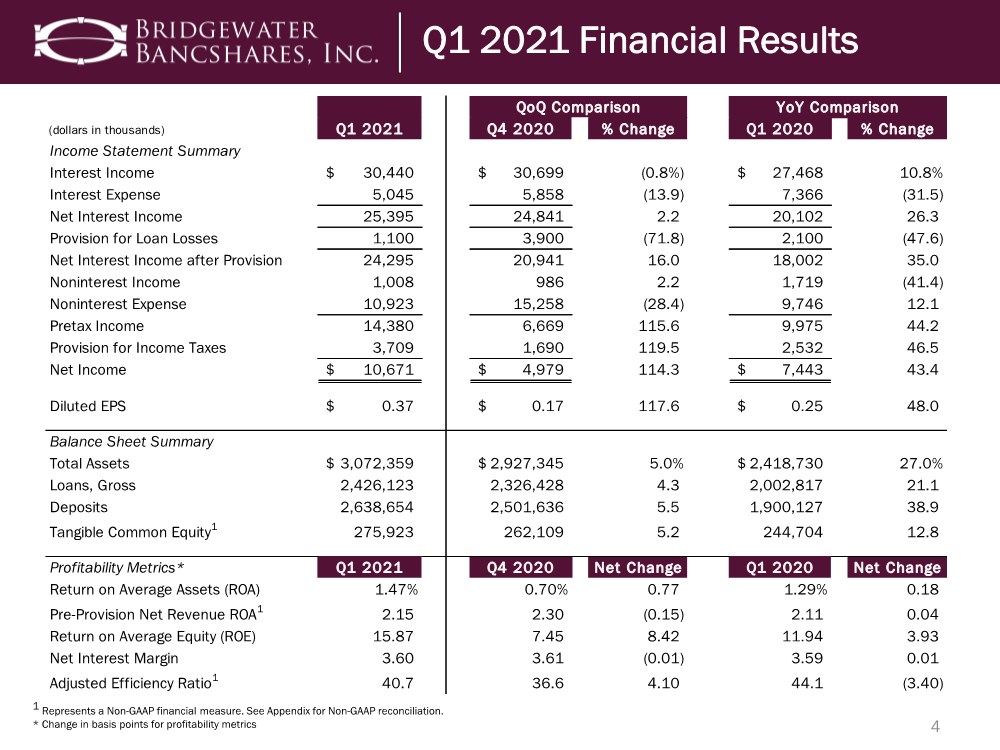
| 1 Represents a Non-GAAP financial measure. See Appendix for Non-GAAP reconciliation. * Change in basis points for profitability metrics 4 Q1 2021 Financial Results (dollars in thousands) Q1 2021 Q4 2020 % Change Q1 2020 % Change Income Statement Summary Interest Income 30,440 $ 30,699 $ (0.8%) 27,468 $ 10.8% Interest Expense 5,045 5,858 (13.9) 7,366 (31.5) Net Interest Income 25,395 24,841 2.2 20,102 26.3 Provision for Loan Losses 1,100 3,900 (71.8) 2,100 (47.6) Net Interest Income after Provision 24,295 20,941 16.0 18,002 35.0 Noninterest Income 1,008 986 2.2 1,719 (41.4) Noninterest Expense 10,923 15,258 (28.4) 9,746 12.1 Pretax Income 14,380 6,669 115.6 9,975 44.2 Provision for Income Taxes 3,709 1,690 119.5 2,532 46.5 Net Income 10,671 $ 4,979 $ 114.3 7,443 $ 43.4 Diluted EPS 0.37 $ 0.17 $ 117.6 0.25 $ 48.0 Balance Sheet Summary Total Assets 3,072,359 $ 2,927,345 $ 5.0% 2,418,730 $ 27.0% Loans, Gross 2,426,123 2,326,428 4.3 2,002,817 21.1 Deposits 2,638,654 2,501,636 5.5 1,900,127 38.9 Tangible Common Equity1 275,923 262,109 5.2 244,704 12.8 Profitability Metrics* Q1 2021 Q4 2020 Net Change Q1 2020 Net Change Return on Average Assets (ROA) 1.47% 0.70% 0.77 1.29% 0.18 Pre-Provision Net Revenue ROA1 2.15 2.30 (0.15) 2.11 0.04 Return on Average Equity (ROE) 15.87 7.45 8.42 11.94 3.93 Net Interest Margin 3.60 3.61 (0.01) 3.59 0.01 Adjusted Efficiency Ratio1 40.7 36.6 4.10 44.1 (3.40) QoQ Comparison YoY Comparison |
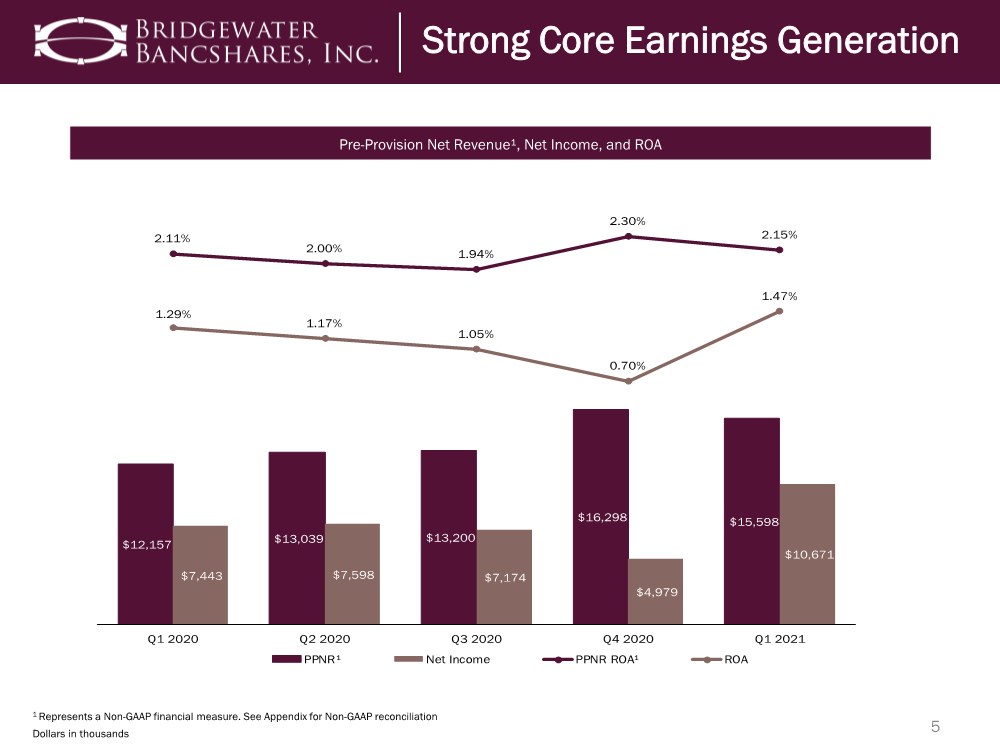
| 5 Dollars in thousands Strong Core Earnings Generation Pre-Provision Net Revenue¹, Net Income, and ROA $12,157 $13,039 $13,200 $16,298 $15,598 $7,443 $7,598 $7,174 $4,979 $10,671 2.11% 2.00% 1.94% 2.30% 2.15% 1.29% 1.17% 1.05% 0.70% 1.47% Q1 2020 Q2 2020 Q3 2020 Q4 2020 Q1 2021 PPNR¹ Net Income PPNR ROA¹ ROA 1 Represents a Non-GAAP financial measure. See Appendix for Non-GAAP reconciliation |
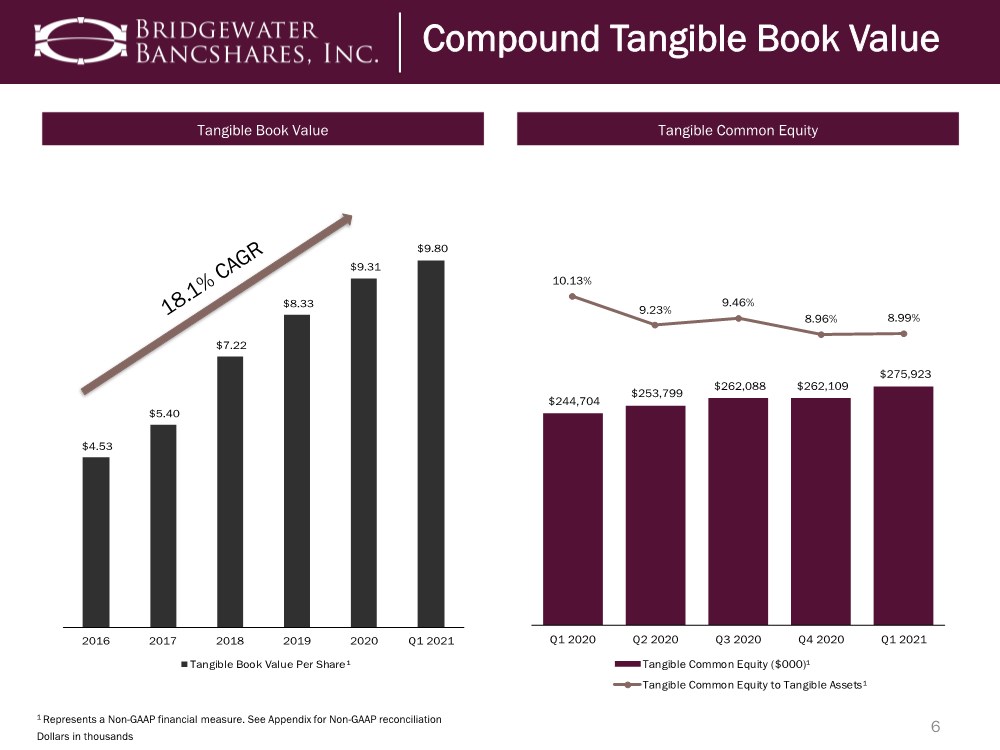
| $4.53 $5.40 $7.22 $8.33 $9.31 $9.80 2016 2017 2018 2019 2020 Q1 2021 Tangible Book Value Per Share¹ $244,704 $253,799 $262,088 $262,109 $275,923 10.13% 9.23% 9.46% 8.96% 8.99% Q1 2020 Q2 2020 Q3 2020 Q4 2020 Q1 2021 Tangible Common Equity ($000)¹ Tangible Common Equity to Tangible Assets¹ 6 Strong Capital and Liquidity Compound Tangible Book Value Tangible Book Value Tangible Common Equity 1 Represents a Non-GAAP financial measure. See Appendix for Non-GAAP reconciliation Dollars in thousands |
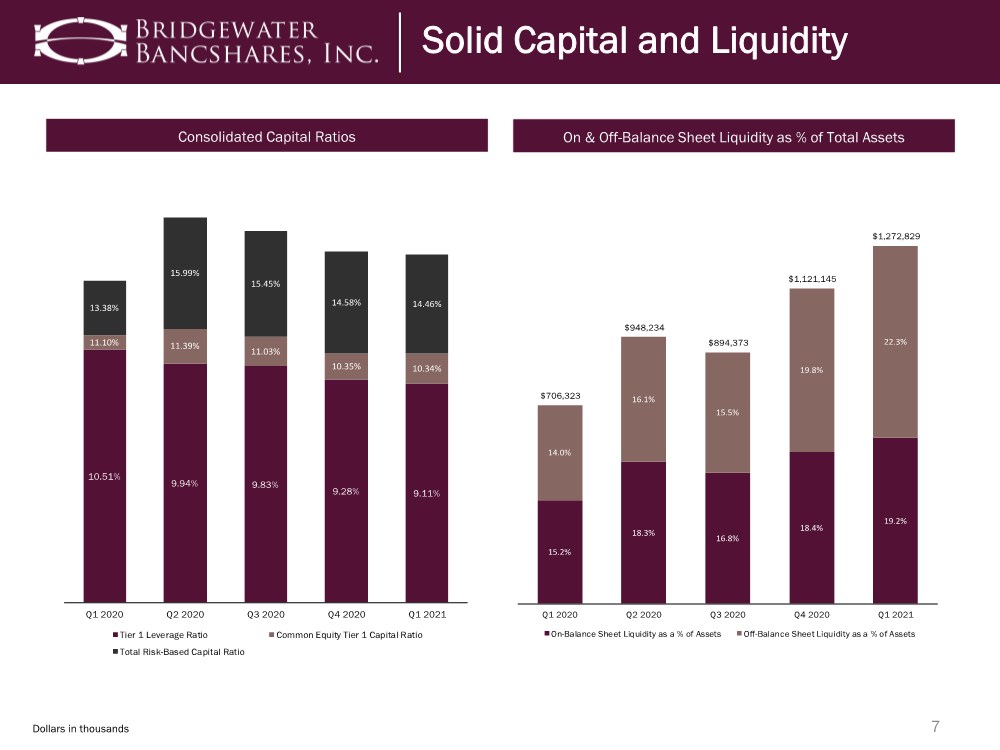
| 7 Dollars in thousands Solid Capital and Liquidity Consolidated Capital Ratios On & Off-Balance Sheet Liquidity as % of Total Assets 15.2% 18.3% 16.8% 18.4% 19.2% 14.0% 16.1% 15.5% 19.8% 22.3% $706,323 $948,234 $894,373 $1,121,145 $1,272,829 Q1 2020 Q2 2020 Q3 2020 Q4 2020 Q1 2021 On-Balance Sheet Liquidity as a % of Assets Off-Balance Sheet Liquidity as a % of Assets 10.51% 9.94% 9.83% 9.28% 9.11% 11.10% 11.39% 11.03% 10.35% 10.34% 13.38% 15.99% 15.45% 14.58% 14.46% Q1 2020 Q2 2020 Q3 2020 Q4 2020 Q1 2021 Tier 1 Leverage Ratio Common Equity Tier 1 Capital Ratio Total Risk-Based Capital Ratio |
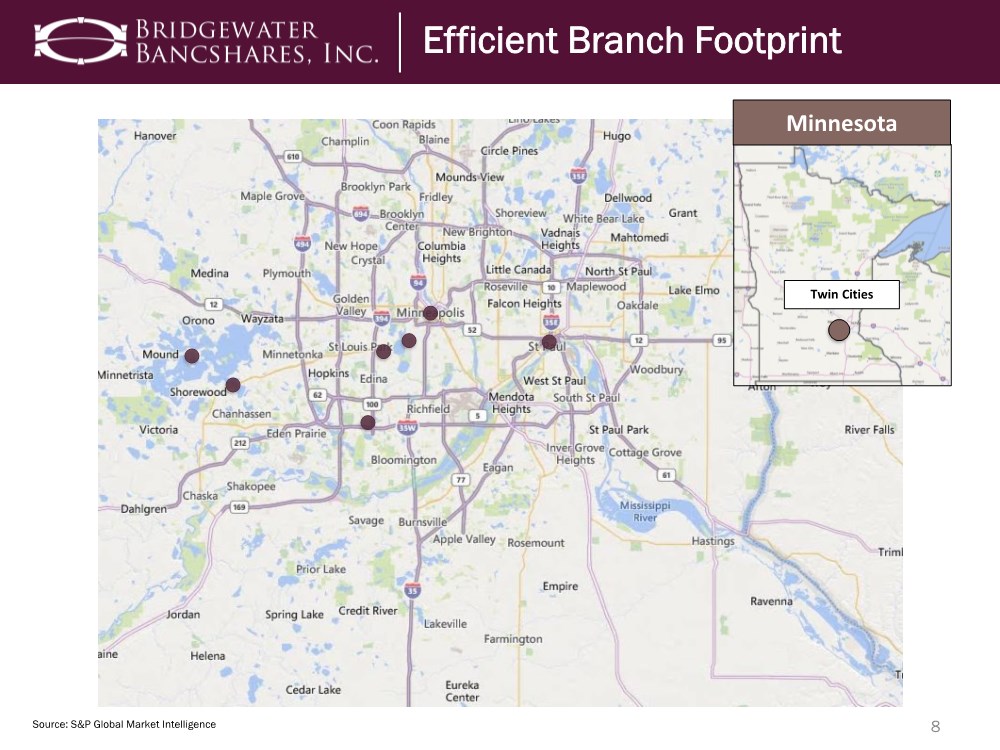
| Twin Cities Minnesota 8 Source: S&P Global Market Intelligence Efficient Branch Footprint |
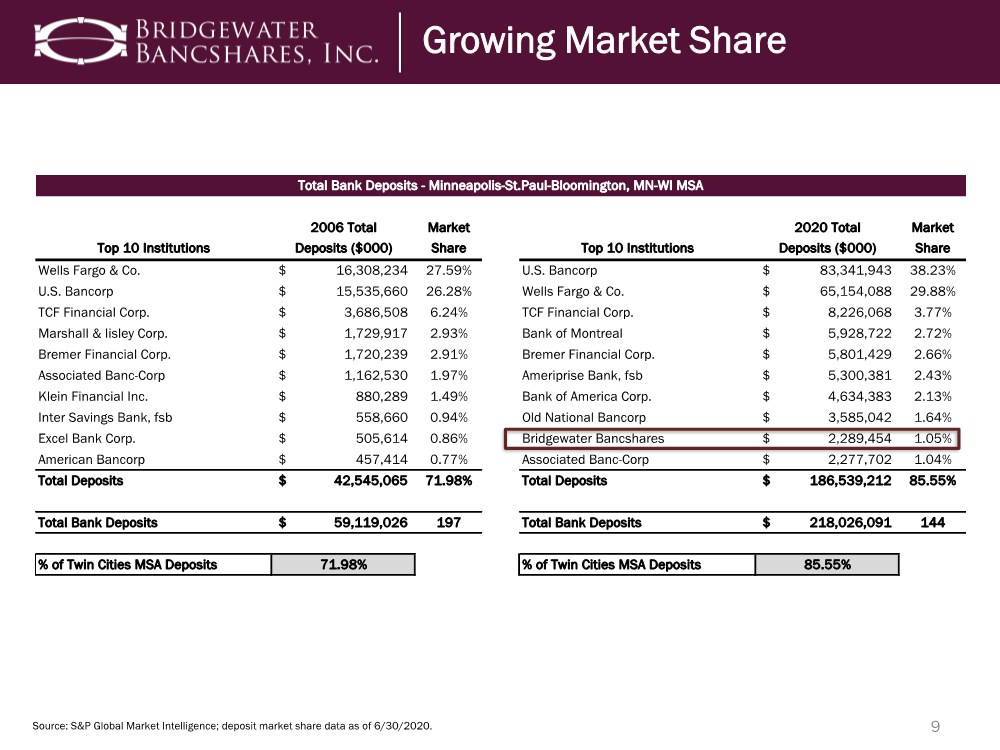
| 9 Source: S&P Global Market Intelligence; deposit market share data as of 6/30/2020. Growing Market Share 2006 Total Market 2020 Total Market Top 10 Institutions Deposits ($000) Share Top 10 Institutions Deposits ($000) Share Wells Fargo & Co. 16,308,234 $ 27.59% U.S. Bancorp 83,341,943 $ 38.23% U.S. Bancorp 15,535,660 $ 26.28% Wells Fargo & Co. 65,154,088 $ 29.88% TCF Financial Corp. 3,686,508 $ 6.24% TCF Financial Corp. 8,226,068 $ 3.77% Marshall & Iisley Corp. 1,729,917 $ 2.93% Bank of Montreal 5,928,722 $ 2.72% Bremer Financial Corp. 1,720,239 $ 2.91% Bremer Financial Corp. 5,801,429 $ 2.66% Associated Banc-Corp 1,162,530 $ 1.97% Ameriprise Bank, fsb 5,300,381 $ 2.43% Klein Financial Inc. 880,289 $ 1.49% Bank of America Corp. 4,634,383 $ 2.13% Inter Savings Bank, fsb 558,660 $ 0.94% Old National Bancorp 3,585,042 $ 1.64% Excel Bank Corp. 505,614 $ 0.86% Bridgewater Bancshares 2,289,454 $ 1.05% American Bancorp 457,414 $ 0.77% Associated Banc-Corp 2,277,702 $ 1.04% Total Deposits 42,545,065 $ 71.98% Total Deposits 186,539,212 $ 85.55% Total Bank Deposits 59,119,026 $ 197 Total Bank Deposits 218,026,091 $ 144 % of Twin Cities MSA Deposits 71.98% % of Twin Cities MSA Deposits 85.55% Total Bank Deposits - Minneapolis-St.Paul-Bloomington, MN-WI MSA |
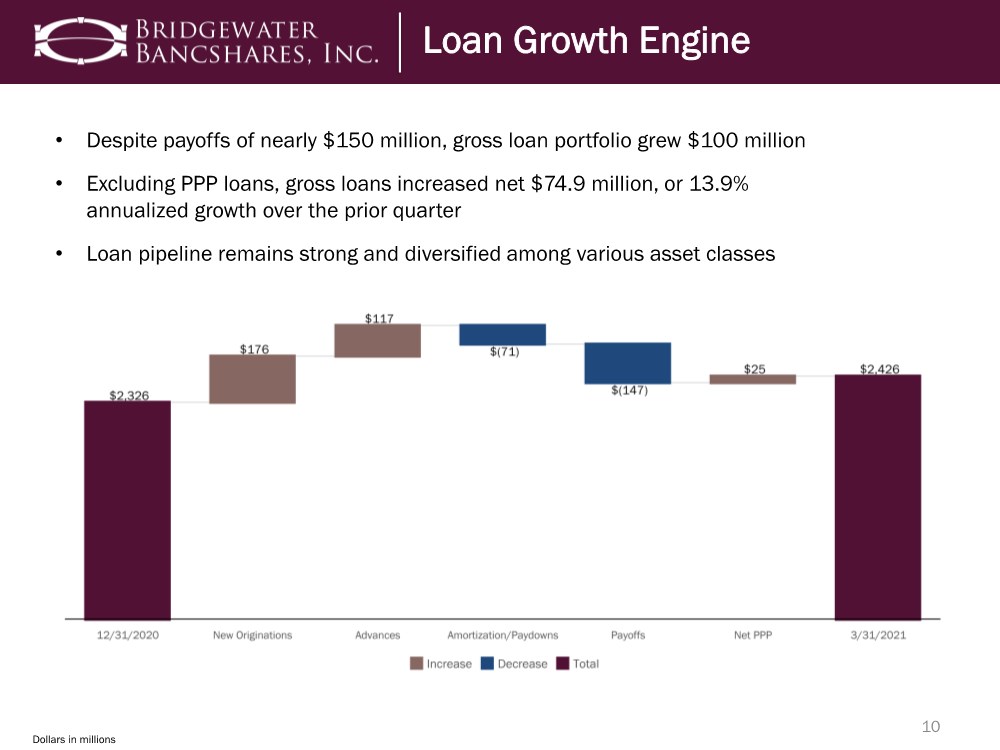
| 10 Loan Growth Engine Dollars in millions • Despite payoffs of nearly $150 million, gross loan portfolio grew $100 million • Excluding PPP loans, gross loans increased net $74.9 million, or 13.9% annualized growth over the prior quarter • Loan pipeline remains strong and diversified among various asset classes |
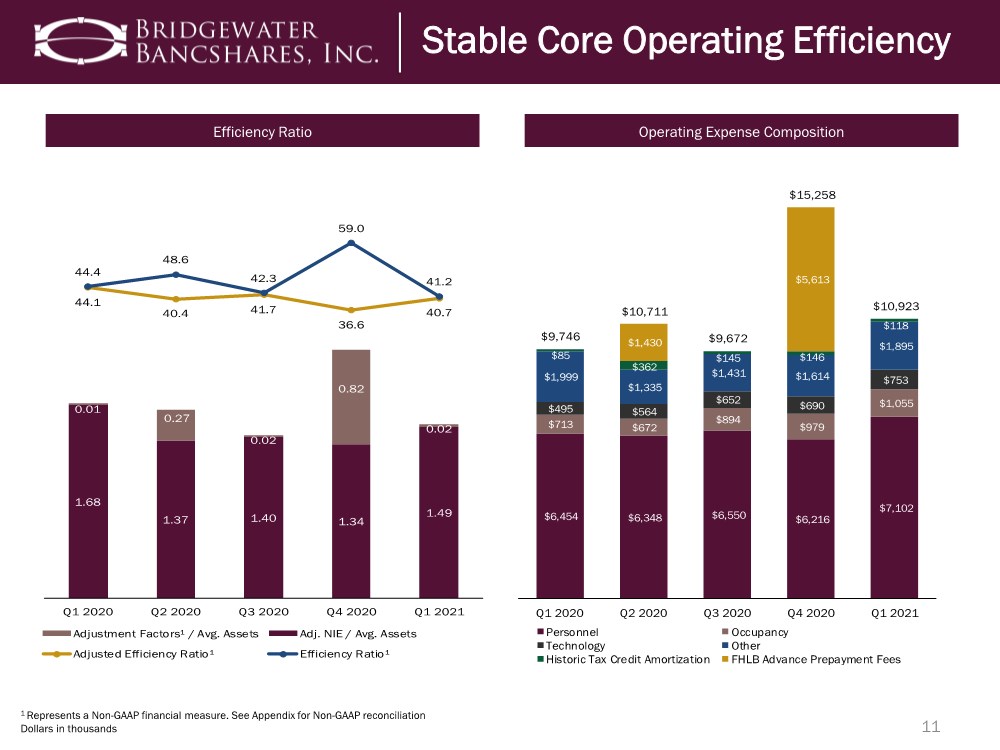
| 11 Stable Core Operating Efficiency Efficiency Ratio Operating Expense Composition 1.68 1.37 1.40 1.34 1.49 0.01 0.27 0.02 0.82 0.02 44.1 40.4 41.7 36.6 40.7 44.4 48.6 42.3 59.0 41.2 Q1 2020 Q2 2020 Q3 2020 Q4 2020 Q1 2021 Adjustment Factors¹ / Avg. Assets Adj. NIE / Avg. Assets Adjusted Efficiency Ratio¹ Efficiency Ratio¹ $6,454 $6,348 $6,550 $6,216 $7,102 $713 $672 $894 $979 $1,055 $495 $564 $652 $690 $753 $1,999 $1,335 $1,431 $1,614 $1,895 $85 $362 $145 $146 $118 $1,430 $5,613 $9,746 $10,711 $9,672 $15,258 $10,923 Q1 2020 Q2 2020 Q3 2020 Q4 2020 Q1 2021 Personnel Occupancy Technology Other Historic Tax Credit Amortization FHLB Advance Prepayment Fees 1 Represents a Non-GAAP financial measure. See Appendix for Non-GAAP reconciliation Dollars in thousands |
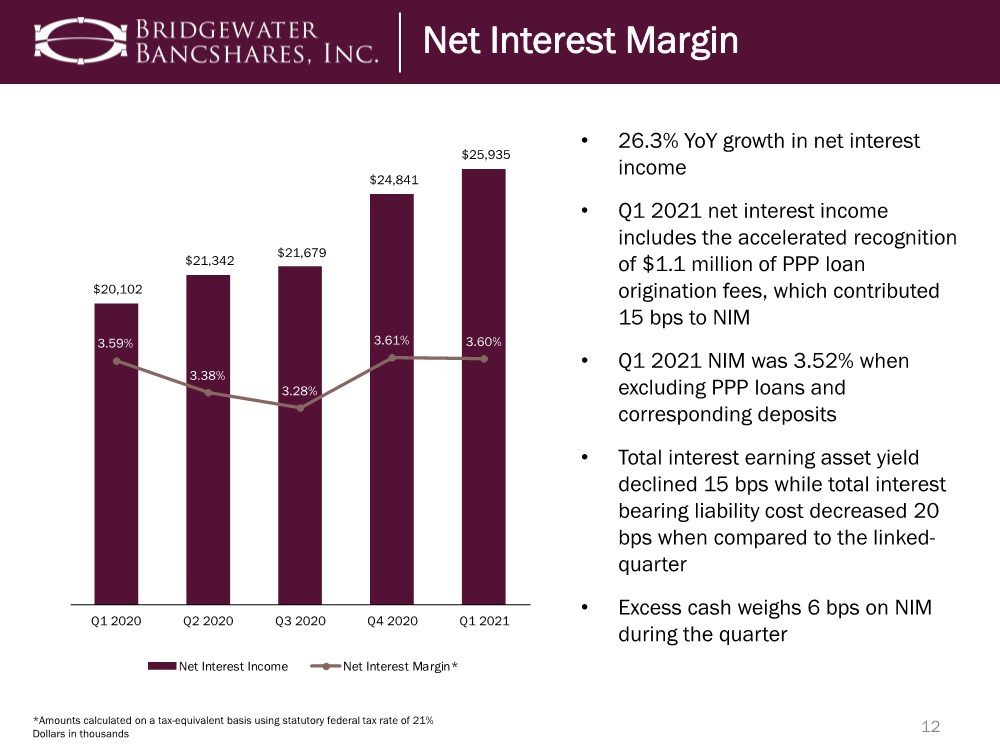
| 12 *Amounts calculated on a tax-equivalent basis using statutory federal tax rate of 21% Dollars in thousands • 26.3% YoY growth in net interest income • Q1 2021 net interest income includes the accelerated recognition of $1.1 million of PPP loan origination fees, which contributed 15 bps to NIM • Q1 2021 NIM was 3.52% when excluding PPP loans and corresponding deposits • Total interest earning asset yield declined 15 bps while total interest bearing liability cost decreased 20 bps when compared to the linked- quarter • Excess cash weighs 6 bps on NIM during the quarter Net Interest Margin $20,102 $21,342 $21,679 $24,841 $25,935 3.59% 3.38% 3.28% 3.61% 3.60% Q1 2020 Q2 2020 Q3 2020 Q4 2020 Q1 2021 Net Interest Income Net Interest Margin* |
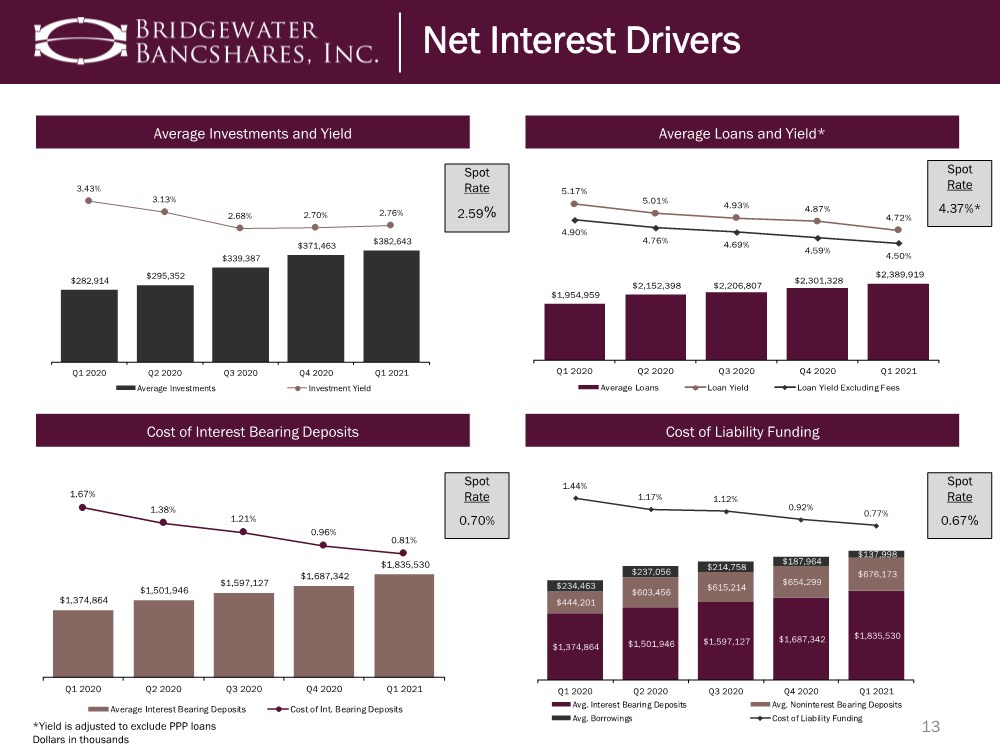
| $1,954,959 $2,152,398 $2,206,807 $2,301,328 $2,389,919 5.17% 5.01% 4.93% 4.87% 4.72% 4.90% 4.76% 4.69% 4.59% 4.50% Q1 2020 Q2 2020 Q3 2020 Q4 2020 Q1 2021 Average Loans Loan Yield Loan Yield Excluding Fees 13 *Yield is adjusted to exclude PPP loans Dollars in thousands Spot Rate 2.59% Spot Rate 4.37%* Spot Rate 0.70% Spot Rate 0.67% Net Interest Drivers $282,914 $295,352 $339,387 $371,463 $382,643 3.43% 3.13% 2.68% 2.70% 2.76% Q1 2020 Q2 2020 Q3 2020 Q4 2020 Q1 2021 Average Investments Investment Yield $1,374,864 $1,501,946 $1,597,127 $1,687,342 $1,835,530 1.67% 1.38% 1.21% 0.96% 0.81% Q1 2020 Q2 2020 Q3 2020 Q4 2020 Q1 2021 Average Interest Bearing Deposits Cost of Int. Bearing Deposits $1,374,864 $1,501,946 $1,597,127 $1,687,342 $1,835,530 $444,201 $603,456 $615,214 $654,299 $676,173 $234,463 $237,056 $214,758 $187,964 $137,998 1.44% 1.17% 1.12% 0.92% 0.77% Q1 2020 Q2 2020 Q3 2020 Q4 2020 Q1 2021 Avg. Interest Bearing Deposits Avg. Noninterest Bearing Deposits Avg. Borrowings Cost of Liability Funding Average Investments and Yield Average Loans and Yield* Cost of Interest Bearing Deposits Cost of Liability Funding |
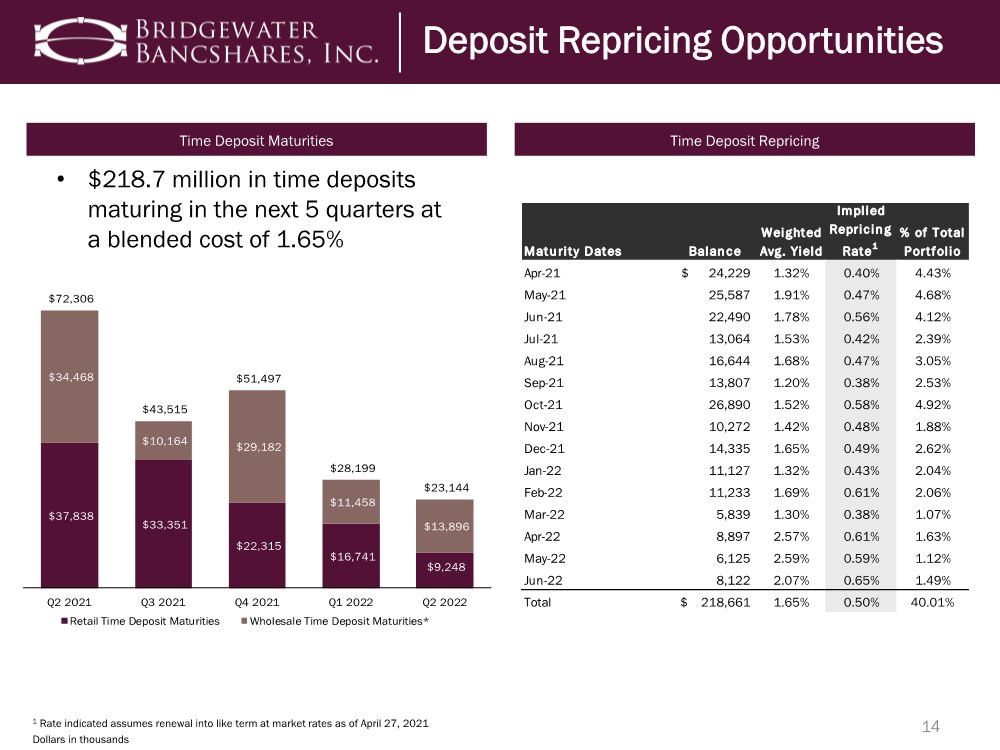
| $37,838 $33,351 $22,315 $16,741 $9,248 $34,468 $10,164 $29,182 $11,458 $13,896 $72,306 $43,515 $51,497 $28,199 $23,144 Q2 2021 Q3 2021 Q4 2021 Q1 2022 Q2 2022 Retail Time Deposit Maturities Wholesale Time Deposit Maturities* 14 1 Rate indicated assumes renewal into like term at market rates as of April 27, 2021 Dollars in thousands • $218.7 million in time deposits maturing in the next 5 quarters at a blended cost of 1.65% Deposit Repricing Opportunities Time Deposit Maturities Time Deposit Repricing Maturity Dates Balance Weighted Avg. Yield Implied Repricing Rate1 % of Total Portfolio Apr-21 24,229 $ 1.32% 0.40% 4.43% May-21 25,587 1.91% 0.47% 4.68% Jun-21 22,490 1.78% 0.56% 4.12% Jul-21 13,064 1.53% 0.42% 2.39% Aug-21 16,644 1.68% 0.47% 3.05% Sep-21 13,807 1.20% 0.38% 2.53% Oct-21 26,890 1.52% 0.58% 4.92% Nov-21 10,272 1.42% 0.48% 1.88% Dec-21 14,335 1.65% 0.49% 2.62% Jan-22 11,127 1.32% 0.43% 2.04% Feb-22 11,233 1.69% 0.61% 2.06% Mar-22 5,839 1.30% 0.38% 1.07% Apr-22 8,897 2.57% 0.61% 1.63% May-22 6,125 2.59% 0.59% 1.12% Jun-22 8,122 2.07% 0.65% 1.49% Total 218,661 $ 1.65% 0.50% 40.01% |
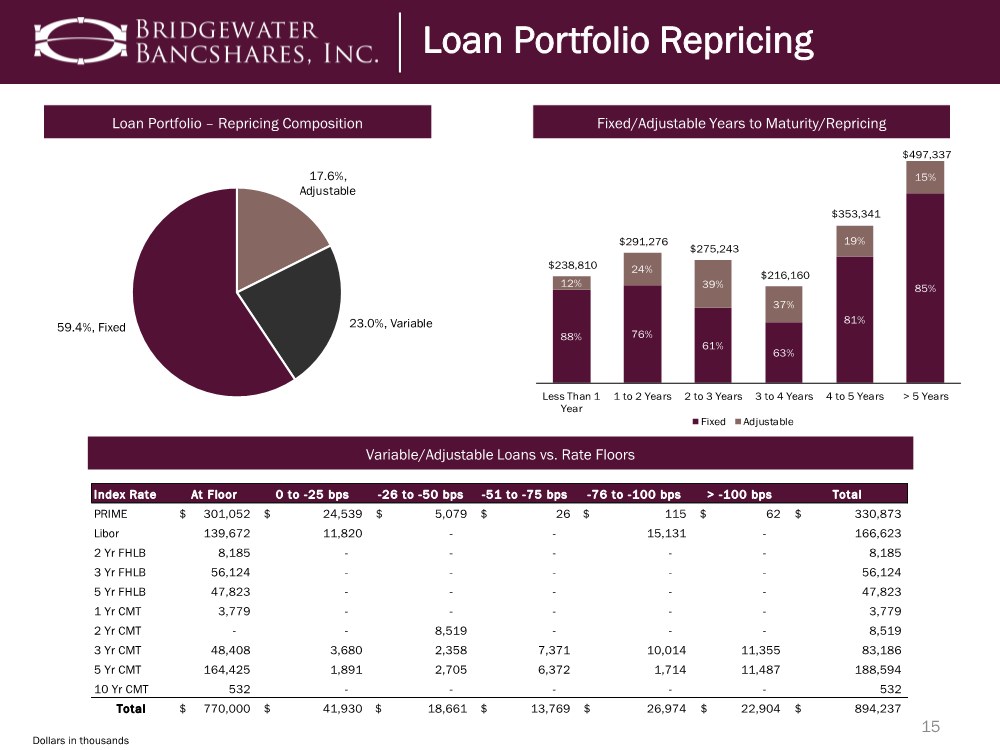
| 15 Dollars in thousands Loan Portfolio Repricing Loan Portfolio – Repricing Composition 17.6%, Adjustable 23.0%, Variable 59.4%, Fixed Variable/Adjustable Loans vs. Rate Floors Fixed/Adjustable Years to Maturity/Repricing 88% 76% 61% 63% 81% 85% 12% 24% 39% 37% 19% 15% $238,810 $291,276 $275,243 $216,160 $353,341 $497,337 Less Than 1 Year 1 to 2 Years 2 to 3 Years 3 to 4 Years 4 to 5 Years > 5 Years Fixed Adjustable Index Rate At Floor 0 to -25 bps -26 to -50 bps -51 to -75 bps -76 to -100 bps > -100 bps Total PRIME 301,052 $ 24,539 $ 5,079 $ 26 $ 115 $ 62 $ 330,873 $ Libor 139,672 11,820 - - 15,131 - 166,623 2 Yr FHLB 8,185 - - - - - 8,185 3 Yr FHLB 56,124 - - - - - 56,124 5 Yr FHLB 47,823 - - - - - 47,823 1 Yr CMT 3,779 - - - - - 3,779 2 Yr CMT - - 8,519 - - - 8,519 3 Yr CMT 48,408 3,680 2,358 7,371 10,014 11,355 83,186 5 Yr CMT 164,425 1,891 2,705 6,372 1,714 11,487 188,594 10 Yr CMT 532 - - - - - 532 Total 770,000 $ 41,930 $ 18,661 $ 13,769 $ 26,974 $ 22,904 $ 894,237 $ |
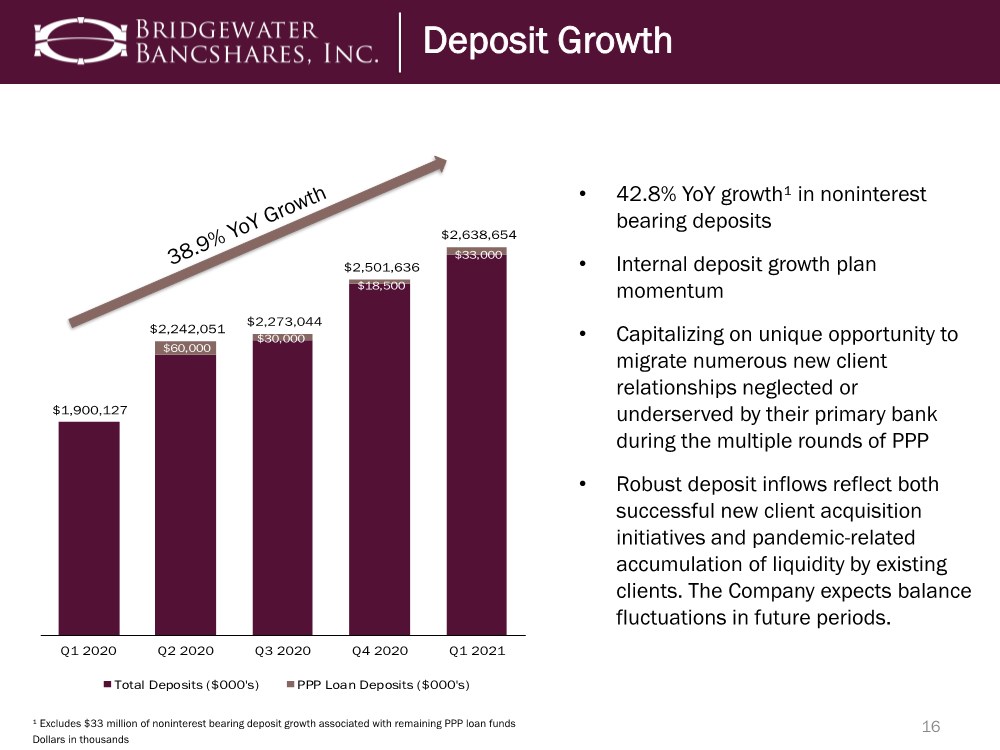
| $60,000 $30,000 $18,500 $33,000 $1,900,127 $2,242,051 $2,273,044 $2,501,636 $2,638,654 Q1 2020 Q2 2020 Q3 2020 Q4 2020 Q1 2021 Total Deposits ($000's) PPP Loan Deposits ($000's) 16 • 42.8% YoY growth¹ in noninterest bearing deposits • Internal deposit growth plan momentum • Capitalizing on unique opportunity to migrate numerous new client relationships neglected or underserved by their primary bank during the multiple rounds of PPP • Robust deposit inflows reflect both successful new client acquisition initiatives and pandemic-related accumulation of liquidity by existing clients. The Company expects balance fluctuations in future periods. Deposit Growth ¹ Excludes $33 million of noninterest bearing deposit growth associated with remaining PPP loan funds Dollars in thousands |
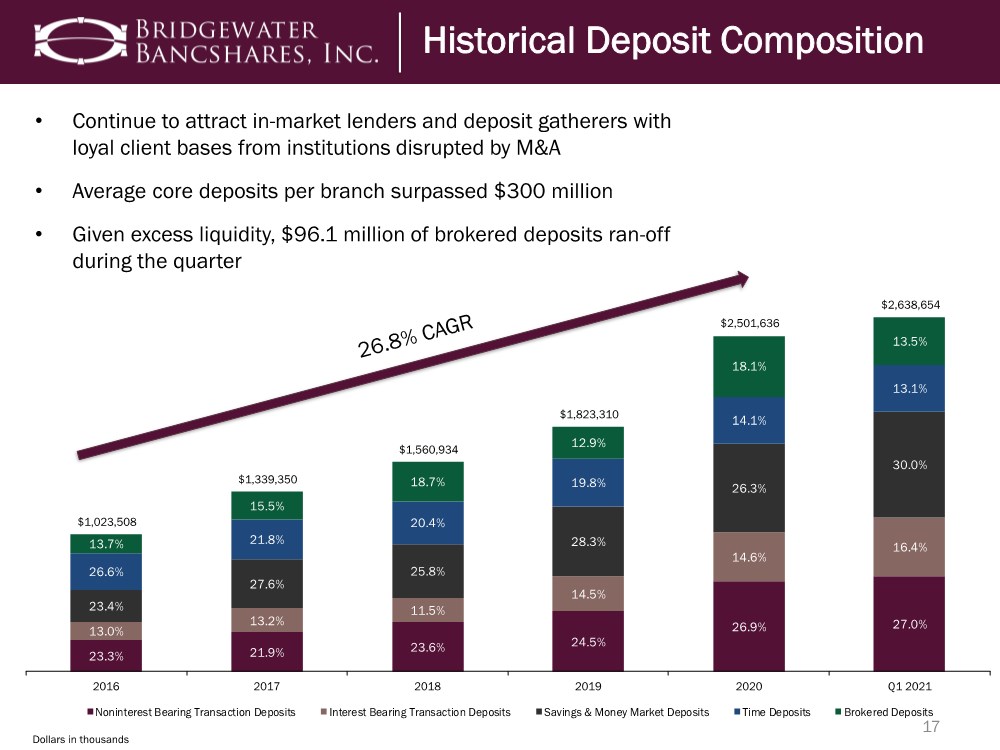
| 23.3% 21.9% 23.6% 24.5% 26.9% 27.0% 13.0% 13.2% 11.5% 14.5% 14.6% 16.4% 23.4% 27.6% 25.8% 28.3% 26.3% 30.0% 26.6% 21.8% 20.4% 19.8% 14.1% 13.1% 13.7% 15.5% 18.7% 12.9% 18.1% 13.5% $1,023,508 $1,339,350 $1,560,934 $1,823,310 $2,501,636 $2,638,654 2016 2017 2018 2019 2020 Q1 2021 Noninterest Bearing Transaction Deposits Interest Bearing Transaction Deposits Savings & Money Market Deposits Time Deposits Brokered Deposits 17 Dollars in thousands Historical Deposit Composition • Continue to attract in-market lenders and deposit gatherers with loyal client bases from institutions disrupted by M&A • Average core deposits per branch surpassed $300 million • Given excess liquidity, $96.1 million of brokered deposits ran-off during the quarter |
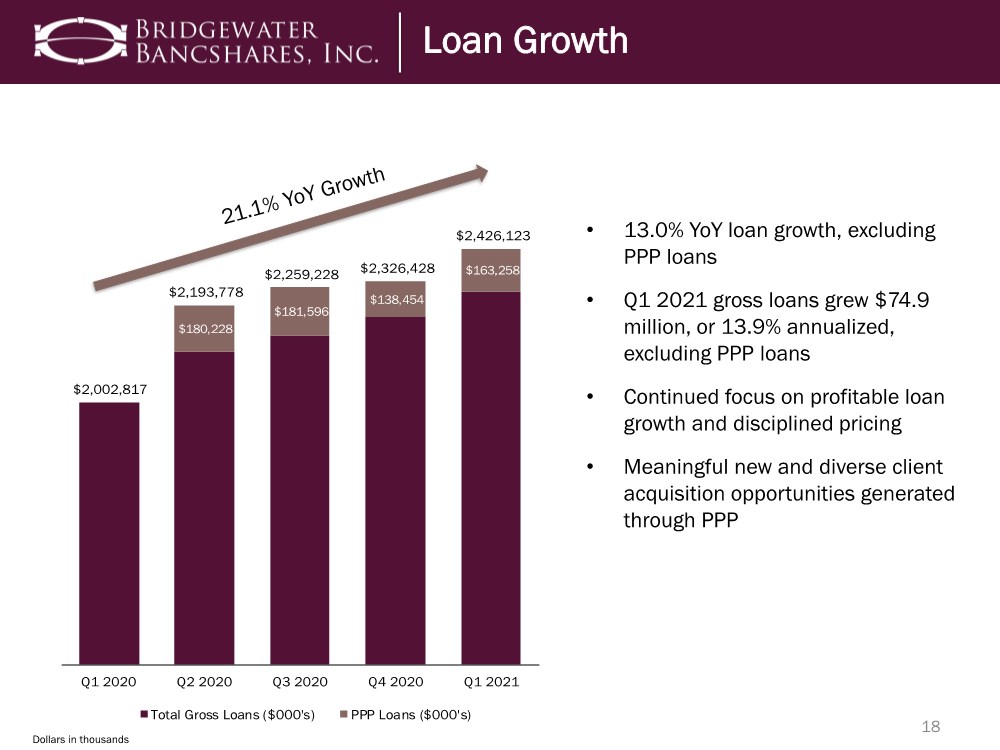
| $180,228 $181,596 $138,454 $163,258 $2,002,817 $2,193,778 $2,259,228 $2,326,428 $2,426,123 Q1 2020 Q2 2020 Q3 2020 Q4 2020 Q1 2021 Total Gross Loans ($000's) PPP Loans ($000's) 18 • 13.0% YoY loan growth, excluding PPP loans • Q1 2021 gross loans grew $74.9 million, or 13.9% annualized, excluding PPP loans • Continued focus on profitable loan growth and disciplined pricing • Meaningful new and diverse client acquisition opportunities generated through PPP Loan Growth Dollars in thousands |
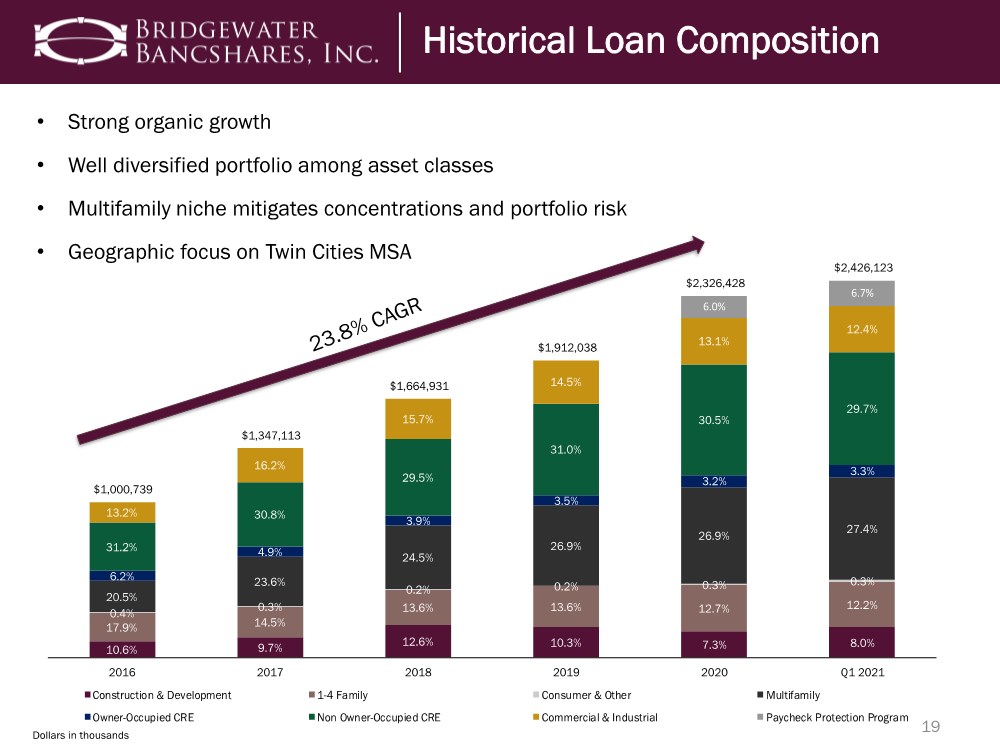
| 10.6% 9.7% 12.6% 10.3% 7.3% 8.0% 17.9% 14.5% 13.6% 13.6% 12.7% 12.2% 0.4% 0.3% 0.2% 0.2% 0.3% 0.3% 20.5% 23.6% 24.5% 26.9% 26.9% 27.4% 6.2% 4.9% 3.9% 3.5% 3.2% 3.3% 31.2% 30.8% 29.5% 31.0% 30.5% 29.7% 13.2% 16.2% 15.7% 14.5% 13.1% 12.4% 6.0% 6.7% $1,000,739 $1,347,113 $1,664,931 $1,912,038 $2,326,428 $2,426,123 2016 2017 2018 2019 2020 Q1 2021 Construction & Development 1-4 Family Consumer & Other Multifamily Owner-Occupied CRE Non Owner-Occupied CRE Commercial & Industrial Paycheck Protection Program 19 Dollars in thousands Historical Loan Composition • Strong organic growth • Well diversified portfolio among asset classes • Multifamily niche mitigates concentrations and portfolio risk • Geographic focus on Twin Cities MSA |
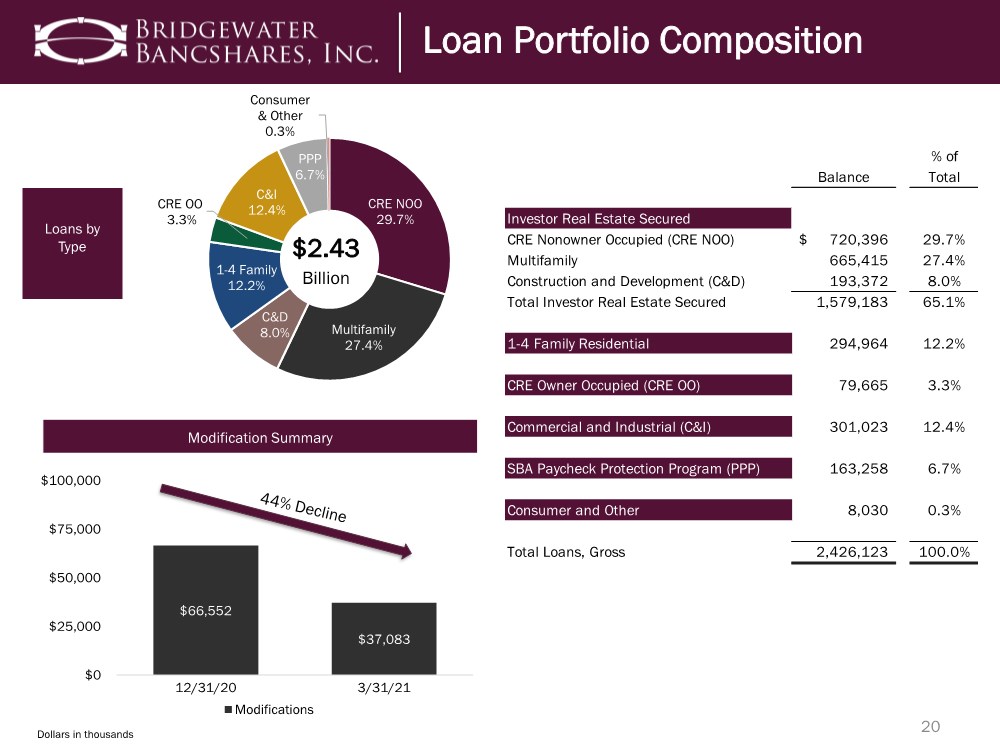
| 20 Dollars in thousands Loan Portfolio Composition Loans by Type Loan Portfolio Composition CRE NOO 29.7% Multifamily 27.4% C&D 8.0% 1-4 Family 12.2% CRE OO 3.3% C&I 12.4% PPP 6.7% Consumer & Other 0.3% $2.43 Billion $66,552 $37,083 $0 $25,000 $50,000 $75,000 $100,000 12/31/20 3/31/21 Modifications Modification Summary % of Balance Total Investor Real Estate Secured CRE Nonowner Occupied (CRE NOO) 720,396 $ 29.7% Multifamily 665,415 27.4% Construction and Development (C&D) 193,372 8.0% Total Investor Real Estate Secured 1,579,183 65.1% 1-4 Family Residential 294,964 12.2% CRE Owner Occupied (CRE OO) 79,665 3.3% Commercial and Industrial (C&I) 301,023 12.4% SBA Paycheck Protection Program (PPP) 163,258 6.7% Consumer and Other 8,030 0.3% Total Loans, Gross 2,426,123 100.0% |
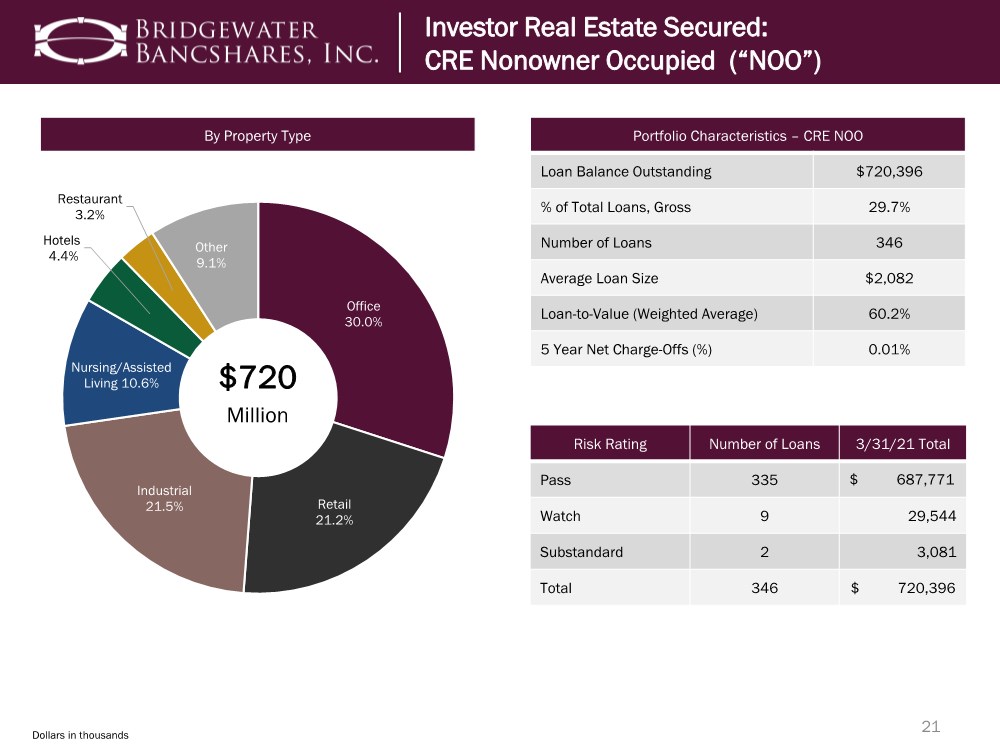
| Dollars in thousands 21 Investor Real Estate Secured: CRE Nonowner Occupied (“NOO”) Portfolio Characteristics – CRE NOO Loan Balance Outstanding $720,396 % of Total Loans, Gross 29.7% Number of Loans 346 Average Loan Size $2,082 Loan-to-Value (Weighted Average) 60.2% 5 Year Net Charge-Offs (%) 0.01% By Property Type Office 30.0% Retail 21.2% Industrial 21.5% Nursing/Assisted Living 10.6% Hotels 4.4% Restaurant 3.2% Other 9.1% Investor Real Estate Secured: CRE Nonowner Occupied (“NOO”) $720 Million 77% 4-6 Month Risk Rating Number of Loans 3/31/21 Total Pass 335 $ 687,771 Watch 9 29,544 Substandard 2 3,081 Total 346 $ 720,396 |
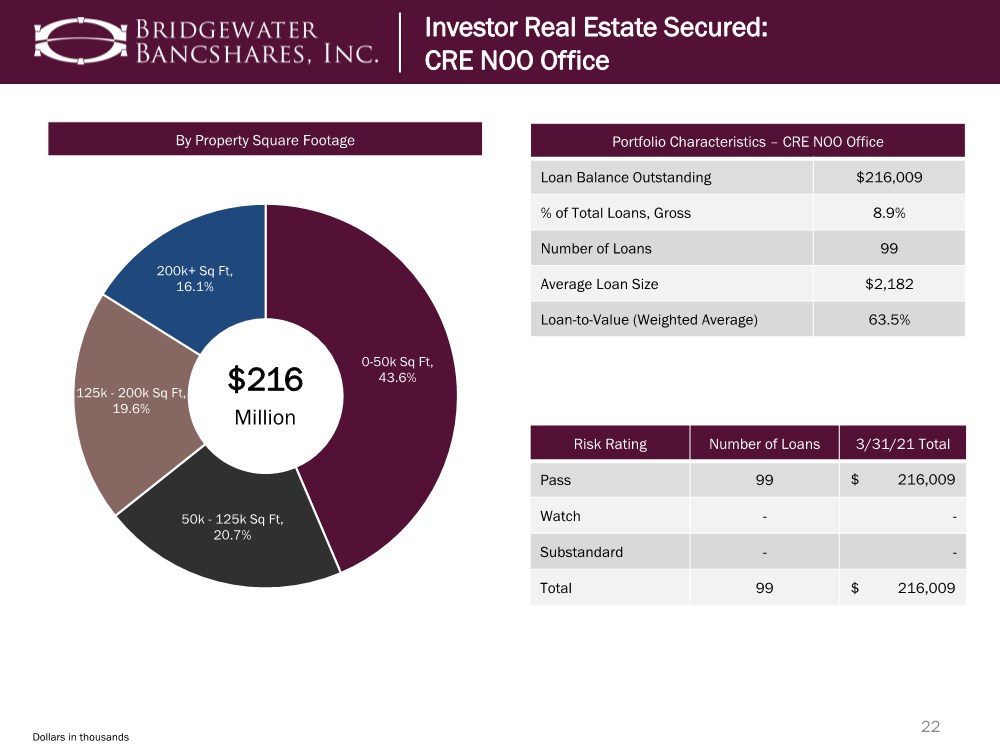
| Dollars in thousands By Property Square Footage 22 Portfolio Characteristics – CRE NOO Office Loan Balance Outstanding $216,009 % of Total Loans, Gross 8.9% Number of Loans 99 Average Loan Size $2,182 Loan-to-Value (Weighted Average) 63.5% Investor Real Estate Secured: CRE NOO Retail Investor Real Estate Secured: CRE NOO Office 0-50k Sq Ft, 43.6% 50k - 125k Sq Ft, 20.7% 125k - 200k Sq Ft, 19.6% 200k+ Sq Ft, 16.1% $216 Million Risk Rating Number of Loans 3/31/21 Total Pass 99 $ 216,009 Watch -- Substandard -- Total 99 $ 216,009 |
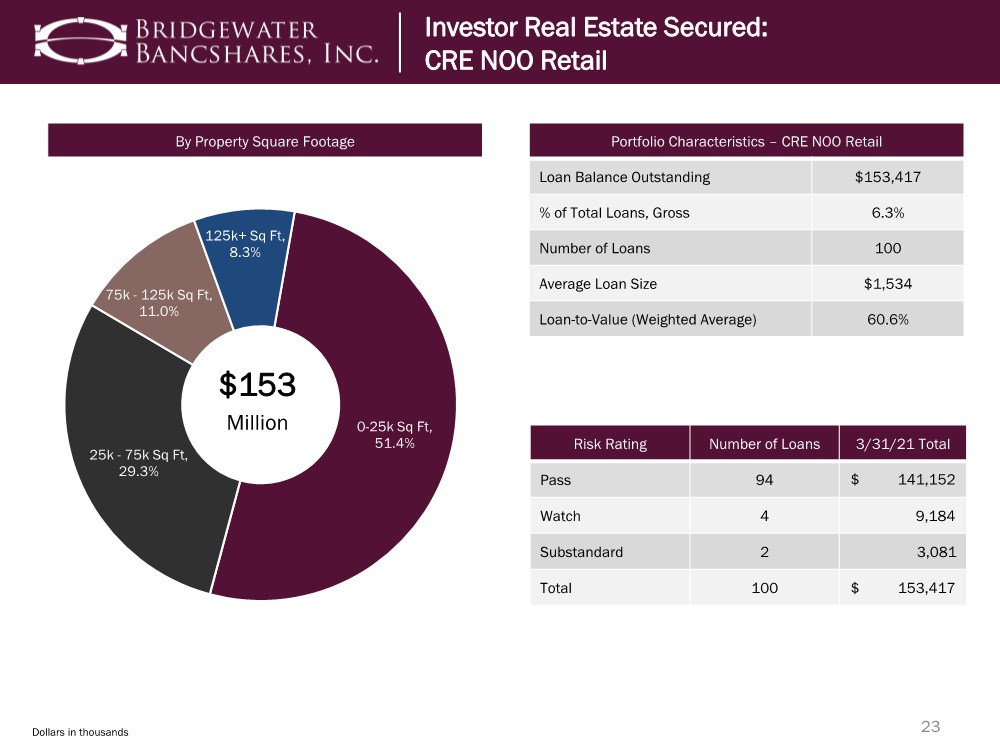
| Dollars in thousands By Property Square Footage 23 Portfolio Characteristics – CRE NOO Retail Loan Balance Outstanding $153,417 % of Total Loans, Gross 6.3% Number of Loans 100 Average Loan Size $1,534 Loan-to-Value (Weighted Average) 60.6% Investor Real Estate Secured: CRE NOO Retail Investor Real Estate Secured: CRE NOO Retail 0-25k Sq Ft, 51.4% 25k - 75k Sq Ft, 29.3% 75k - 125k Sq Ft, 11.0% 125k+ Sq Ft, 8.3% $153 Million Risk Rating Number of Loans 3/31/21 Total Pass 94 $ 141,152 Watch 4 9,184 Substandard 2 3,081 Total 100 $ 153,417 |
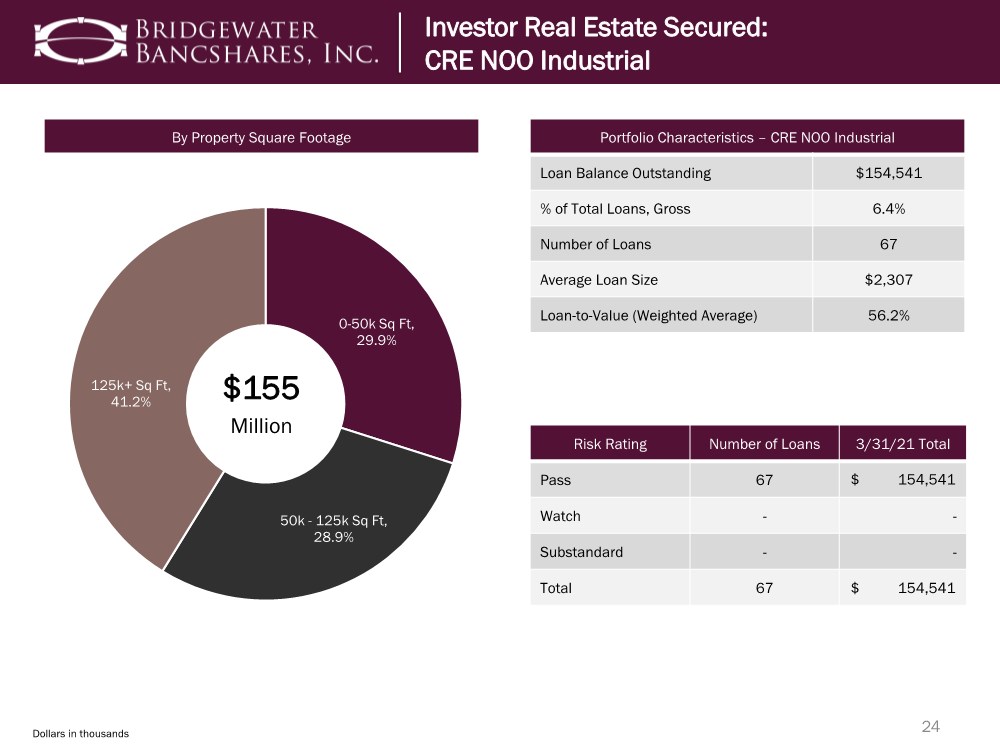
| Dollars in thousands By Property Square Footage 24 Portfolio Characteristics – CRE NOO Industrial Loan Balance Outstanding $154,541 % of Total Loans, Gross 6.4% Number of Loans 67 Average Loan Size $2,307 Loan-to-Value (Weighted Average) 56.2% Investor Real Estate Secured: CRE NOO Retail Investor Real Estate Secured: CRE NOO Industrial 0-50k Sq Ft, 29.9% 50k - 125k Sq Ft, 28.9% 125k+ Sq Ft, 41.2% $155 Million Risk Rating Number of Loans 3/31/21 Total Pass 67 $ 154,541 Watch -- Substandard -- Total 67 $ 154,541 |
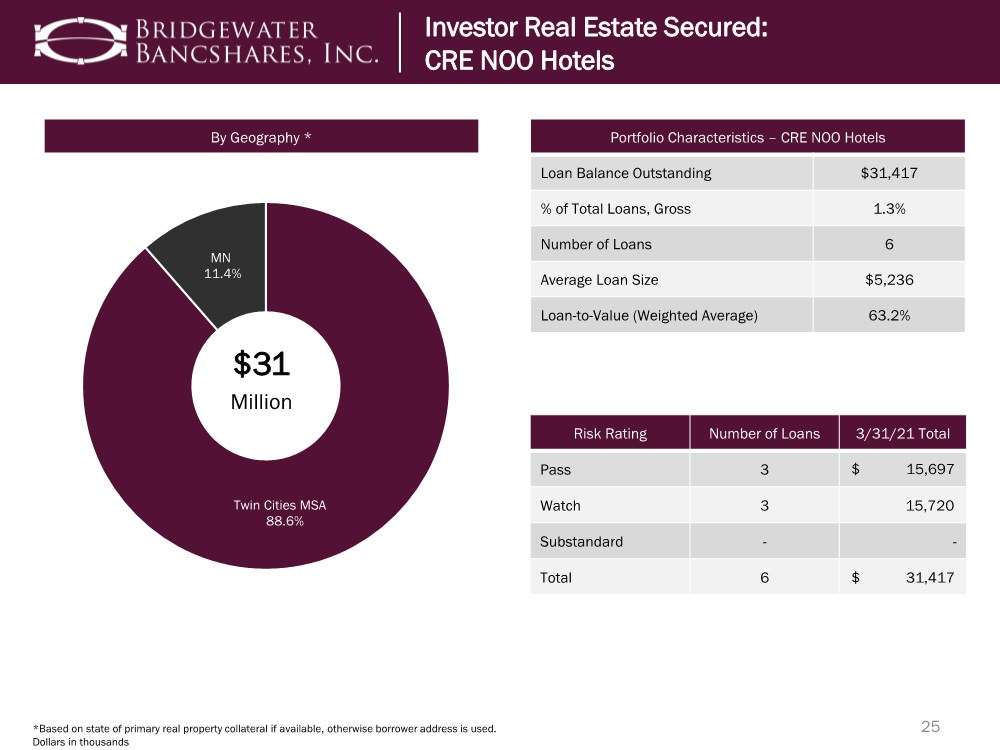
| 25 *Based on state of primary real property collateral if available, otherwise borrower address is used. Investor Real Estate Secured: CRE NOO Hotels Portfolio Characteristics – CRE NOO Hotels Loan Balance Outstanding $31,417 % of Total Loans, Gross 1.3% Number of Loans 6 Average Loan Size $5,236 Loan-to-Value (Weighted Average) 63.2% Twin Cities MSA 88.6% MN 11.4% $31 Million Investor Real Estate Secured: CRE NOO Hotels 4-6 Month Full Payment 100% Risk Rating Number of Loans 3/31/21 Total Pass 3 $ 15,697 Watch 3 15,720 Substandard -- Total 6 $ 31,417 Dollars in thousands By Geography * |
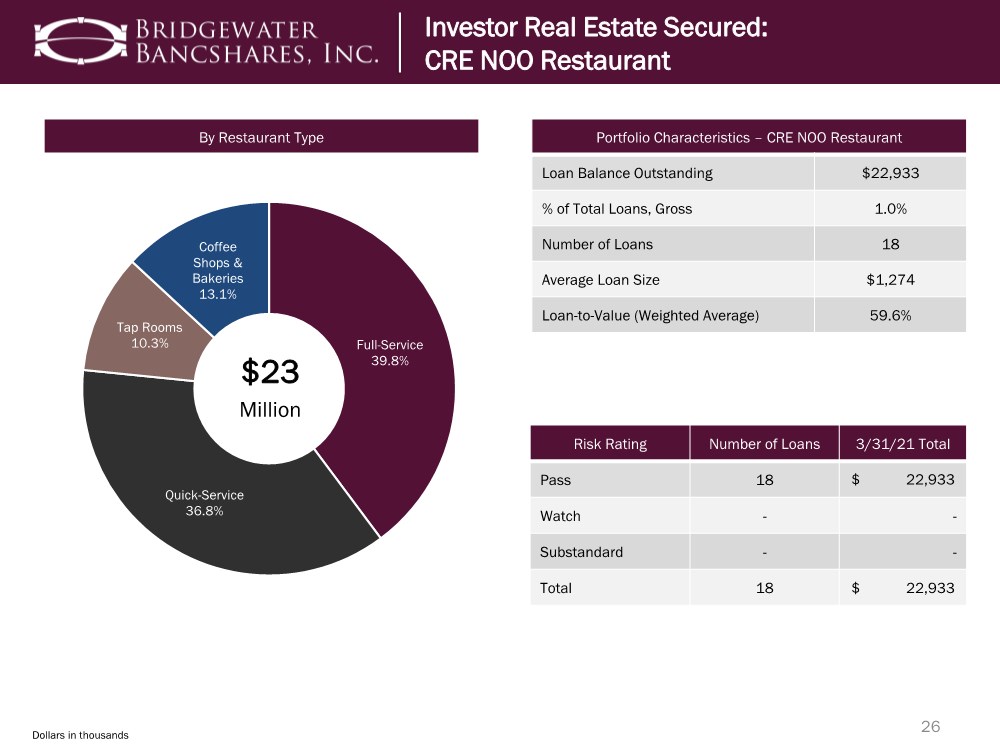
| 26 Portfolio Characteristics – CRE NOO Restaurant Loan Balance Outstanding $22,933 % of Total Loans, Gross 1.0% Number of Loans 18 Average Loan Size $1,274 Loan-to-Value (Weighted Average) 59.6% Investor Real Estate Secured: CRE NOO Restaurant Investor Real Estate Secured: CRE NOO Restaurant Full-Service 39.8% Quick-Service 36.8% Tap Rooms 10.3% Coffee Shops & Bakeries 13.1% $23 Million 96% 4-6 Month Risk Rating Number of Loans 3/31/21 Total Pass 18 $ 22,933 Watch -- Substandard -- Total 18 $ 22,933 Dollars in thousands By Restaurant Type |
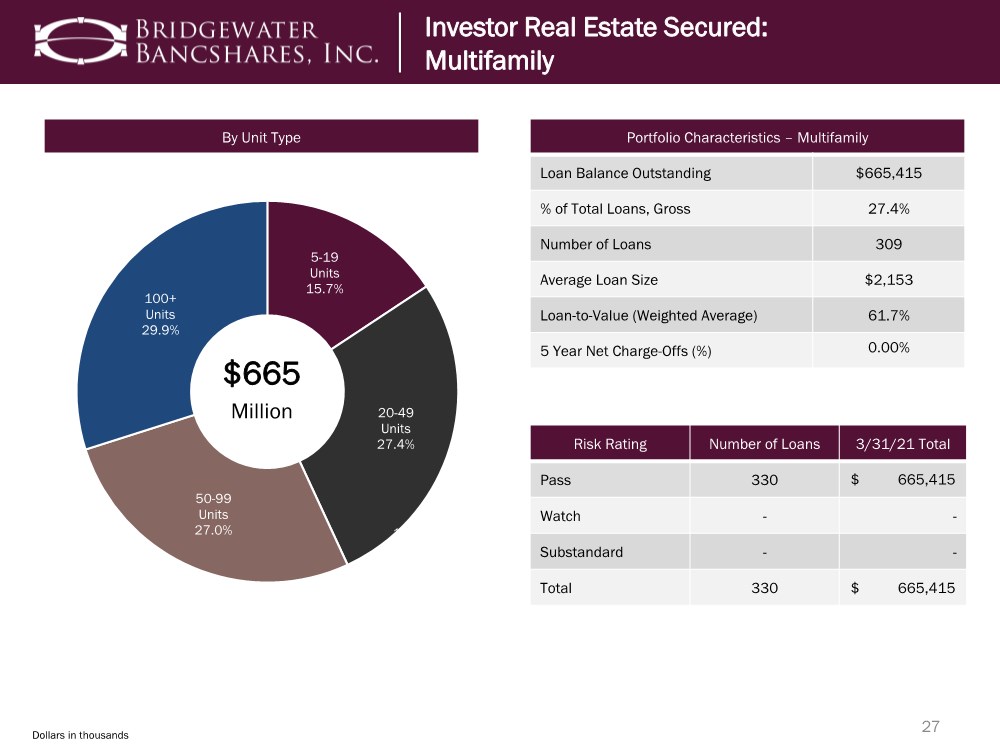
| 5-19 Units 15.7% 20-49 Units 27.4% 50-99 Units 27.0% 100+ Units 29.9% $665 Million 27 Portfolio Characteristics – Multifamily Loan Balance Outstanding $665,415 % of Total Loans, Gross 27.4% Number of Loans 309 Average Loan Size $2,153 Loan-to-Value (Weighted Average) 61.7% 5 Year Net Charge-Offs (%) 0.00% Investor Real Estate Secured: CRE NOO Restaurant Investor Real Estate Secured: Multifamily 44% 56% 7-12 Month 100% Risk Rating Number of Loans 3/31/21 Total Pass 330 $ 665,415 Watch -- Substandard -- Total 330 $ 665,415 Dollars in thousands By Unit Type |
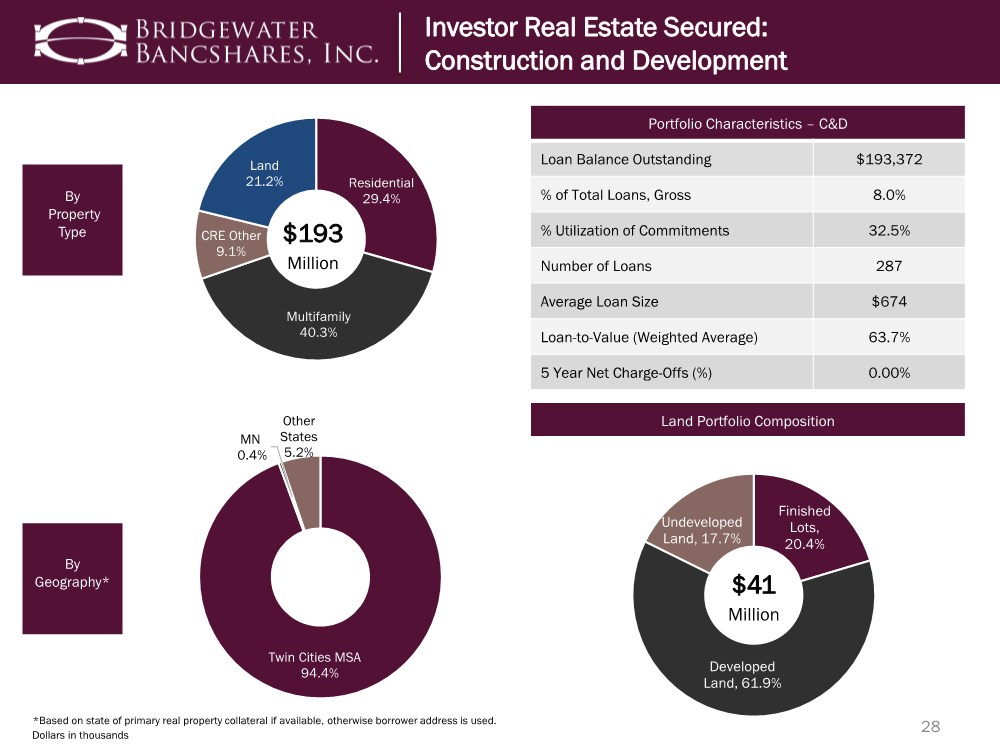
| Residential 29.4% Multifamily 40.3% CRE Other 9.1% Land 21.2% $193 Million 28 By Property Type By Geography* Land Portfolio Composition Investor Real Estate Secured: CRE NOO Restaurant Investor Real Estate Secured: Construction and Development Portfolio Characteristics – C&D Loan Balance Outstanding $193,372 % of Total Loans, Gross 8.0% % Utilization of Commitments 32.5% Number of Loans 287 Average Loan Size $674 Loan-to-Value (Weighted Average) 63.7% 5 Year Net Charge-Offs (%) 0.00% Twin Cities MSA 94.4% MN 0.4% Other States 5.2% Finished Lots, 20.4% Developed Land, 61.9% Undeveloped Land, 17.7% $41 Million Dollars in thousands *Based on state of primary real property collateral if available, otherwise borrower address is used. |
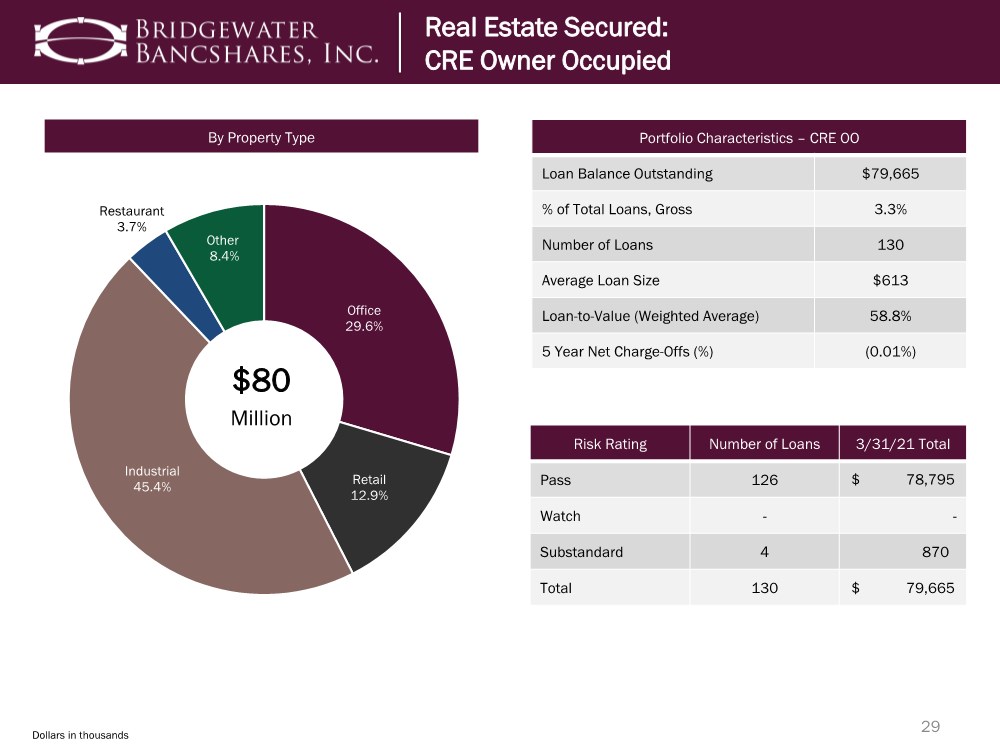
| 29 Investor Real Estate Secured: CRE Nonowner Occupied (“NOO”) Portfolio Characteristics – CRE OO Loan Balance Outstanding $79,665 % of Total Loans, Gross 3.3% Number of Loans 130 Average Loan Size $613 Loan-to-Value (Weighted Average) 58.8% 5 Year Net Charge-Offs (%) (0.01%) Office 29.6% Retail 12.9% Industrial 45.4% Restaurant 3.7% Other 8.4% $80 Million Real Estate Secured: CRE Owner Occupied 4-6 Month Risk Rating Number of Loans 3/31/21 Total Pass 126 $ 78,795 Watch -- Substandard 4 870 Total 130 $ 79,665 Dollars in thousands By Property Type |
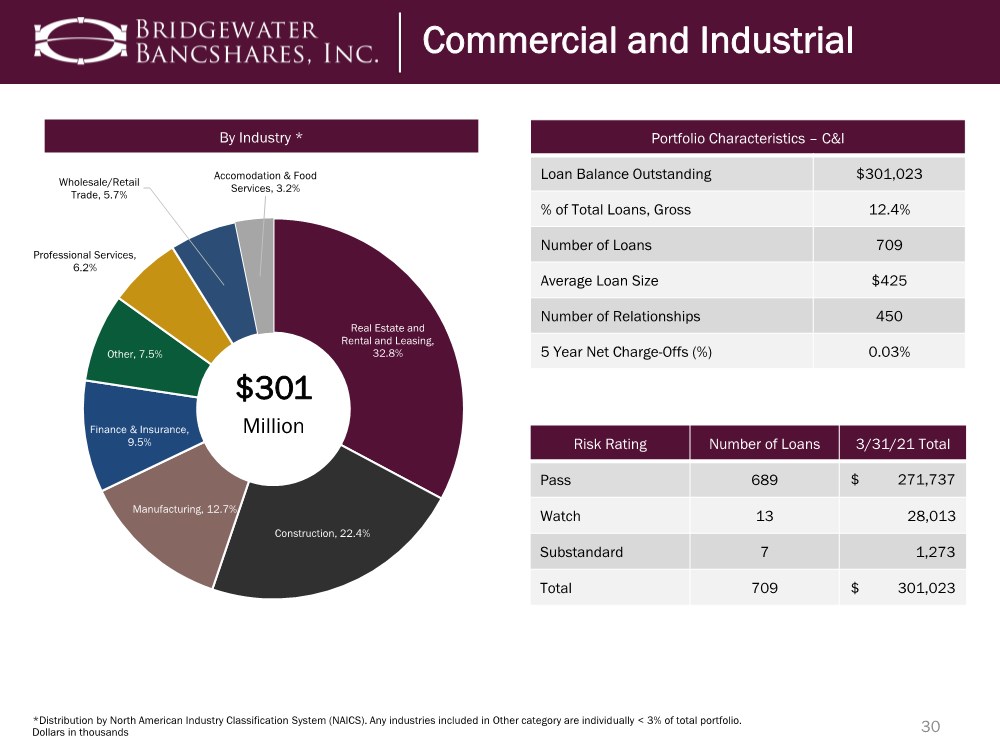
| Dollars in thousands Real Estate and Rental and Leasing, 32.8% Construction, 22.4% Manufacturing, 12.7% Finance & Insurance, 9.5% Other, 7.5% Professional Services, 6.2% Wholesale/Retail Trade, 5.7% Accomodation & Food Services, 3.2% $301 Million 30 *Distribution by North American Industry Classification System (NAICS). Any industries included in Other category are individually < 3% of total portfolio. Portfolio Characteristics – C&I Loan Balance Outstanding $301,023 % of Total Loans, Gross 12.4% Number of Loans 709 Average Loan Size $425 Number of Relationships 450 5 Year Net Charge-Offs (%) 0.03% Commercial and Industrial 4-6 Month Risk Rating Number of Loans 3/31/21 Total Pass 689 $ 271,737 Watch 13 28,013 Substandard 7 1,273 Total 709 $ 301,023 By Industry * |
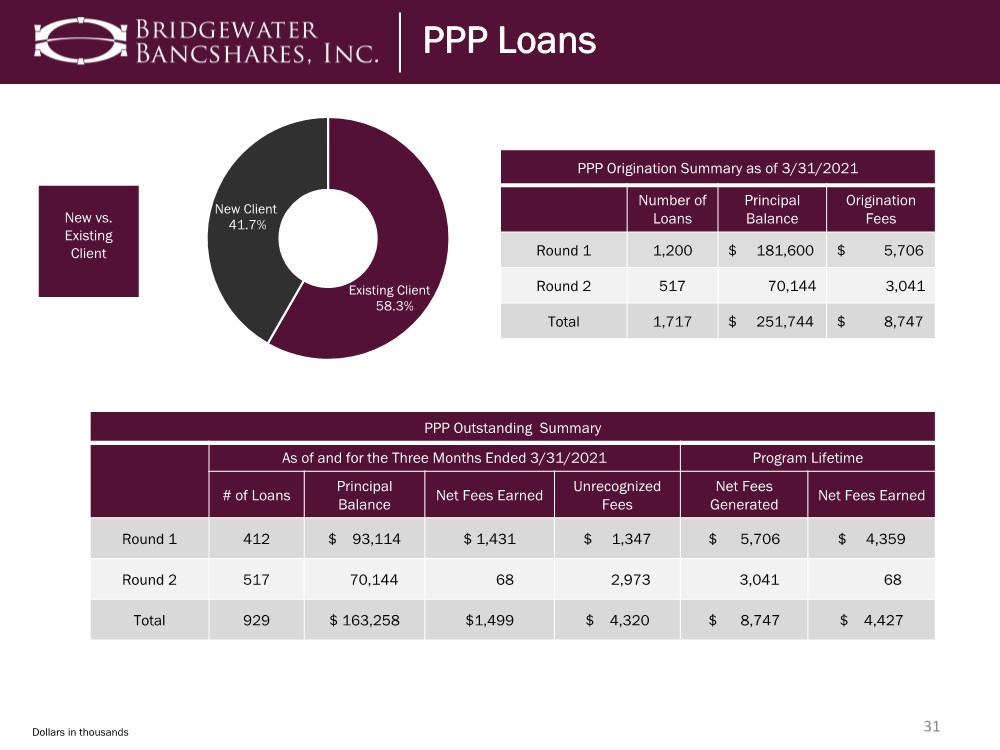
| 31 New vs. Existing Client PPP Origination Summary as of 3/31/2021 Number of Loans Principal Balance Origination Fees Round 1 1,200 $ 181,600 $ 5,706 Round 2 517 70,144 3,041 Total 1,717 $ 251,744 $ 8,747 PPP Loans Existing Client 58.3% New Client 41.7% Dollars in thousands PPP Outstanding Summary As of and for the Three Months Ended 3/31/2021 Program Lifetime # of Loans Principal Balance Net Fees Earned Unrecognized Fees Net Fees Generated Net Fees Earned Round 1 412 $ 93,114 $ 1,431 $ 1,347 $ 5,706 $ 4,359 Round 2 517 70,144 68 2,973 3,041 68 Total 929 $ 163,258 $1,499 $ 4,320 $ 8,747 $ 4,427 |
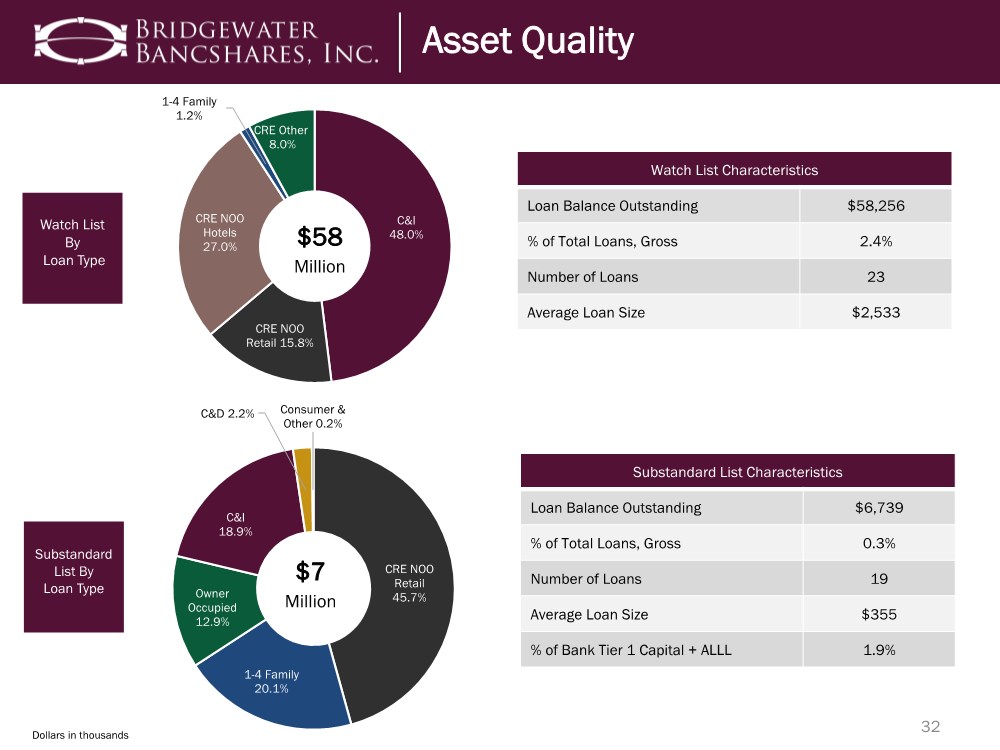
| 32 Investor Real Estate Secured: CRE Nonowner Occupied (“NOO”) Watch List By Loan Type Substandard List By Loan Type C&I 48.0% CRE NOO Retail 15.8% CRE NOO Hotels 27.0% 1-4 Family 1.2% CRE Other 8.0% $58 Million Asset Quality Dollars in thousands Watch List Characteristics Loan Balance Outstanding $58,256 % of Total Loans, Gross 2.4% Number of Loans 23 Average Loan Size $2,533 Substandard List Characteristics Loan Balance Outstanding $6,739 % of Total Loans, Gross 0.3% Number of Loans 19 Average Loan Size $355 % of Bank Tier 1 Capital + ALLL 1.9% CRE NOO Retail 45.7% 1-4 Family 20.1% Owner Occupied 12.9% C&I 18.9% C&D 2.2% Consumer & Other 0.2% $7 Million |
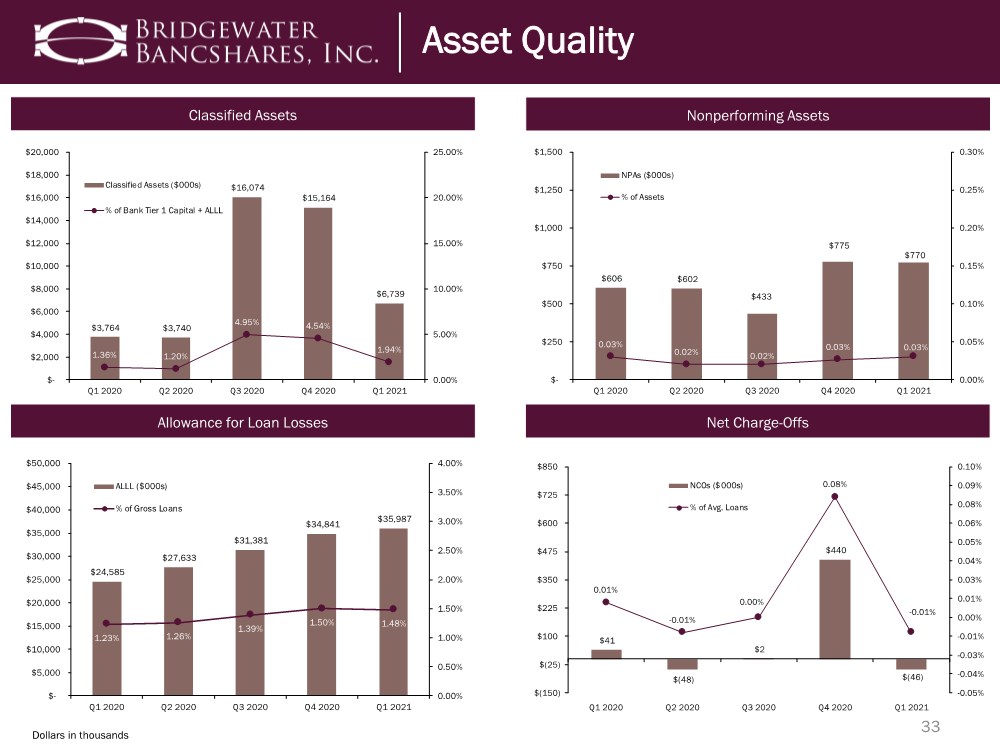
| Dollars in thousands 33 Asset Quality Asset Quality Classified Assets Nonperforming Assets Allowance for Loan Losses Net Charge-Offs $3,764 $3,740 $16,074 $15,164 $6,739 1.36% 1.20% 4.95% 4.54% 1.94% 0.00% 5.00% 10.00% 15.00% 20.00% 25.00% $- $2,000 $4,000 $6,000 $8,000 $10,000 $12,000 $14,000 $16,000 $18,000 $20,000 Q1 2020 Q2 2020 Q3 2020 Q4 2020 Q1 2021 Classified Assets ($000s) % of Bank Tier 1 Capital + ALLL $606 $602 $433 $775 $770 0.03% 0.02% 0.02% 0.03% 0.03% 0.00% 0.05% 0.10% 0.15% 0.20% 0.25% 0.30% $- $250 $500 $750 $1,000 $1,250 $1,500 Q1 2020 Q2 2020 Q3 2020 Q4 2020 Q1 2021 NPAs ($000s) % of Assets $24,585 $27,633 $31,381 $34,841 $35,987 1.23% 1.26% 1.39% 1.50% 1.48% 0.00% 0.50% 1.00% 1.50% 2.00% 2.50% 3.00% 3.50% 4.00% $- $5,000 $10,000 $15,000 $20,000 $25,000 $30,000 $35,000 $40,000 $45,000 $50,000 Q1 2020 Q2 2020 Q3 2020 Q4 2020 Q1 2021 ALLL ($000s) % of Gross Loans $41 $(48) $2 $440 $(46) 0.01% -0.01% 0.00% 0.08% -0.01% -0.05% -0.04% -0.03% -0.01% 0.00% 0.01% 0.03% 0.04% 0.05% 0.06% 0.08% 0.09% 0.10% $(150) $(25) $100 $225 $350 $475 $600 $725 $850 Q1 2020 Q2 2020 Q3 2020 Q4 2020 Q1 2021 NCOs ($000s) % of Avg. Loans |
| 34 Investor Highlights Investor Highlights |

|

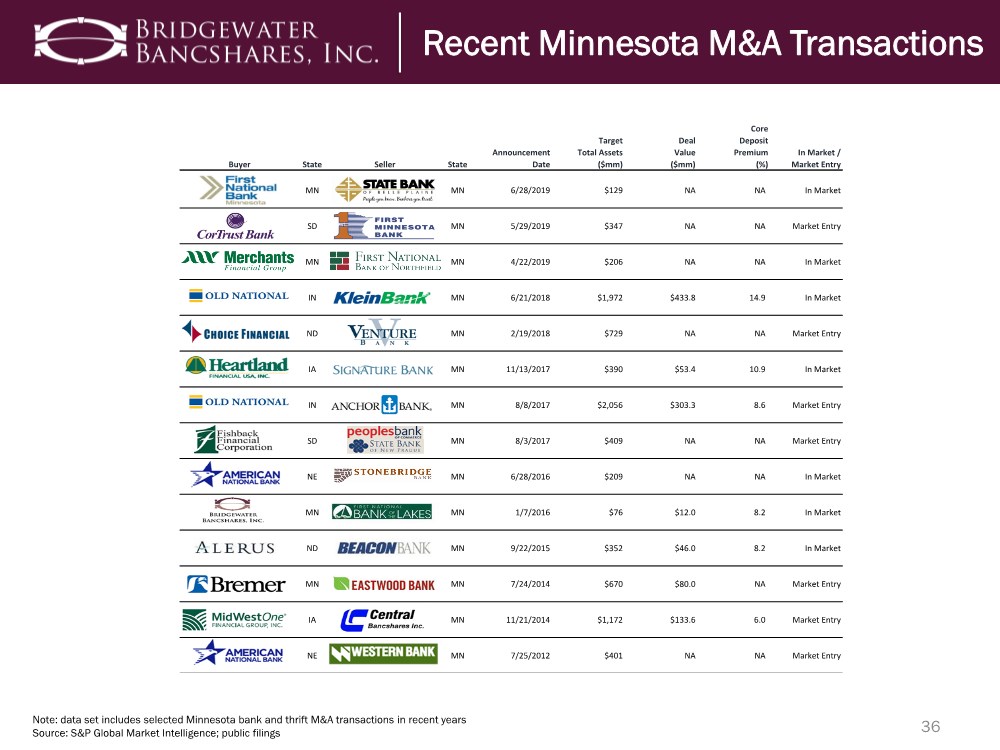
| 36 Note: data set includes selected Minnesota bank and thrift M&A transactions in recent years Source: S&P Global Market Intelligence; public filings Core Target Deal Deposit Announcement Total Assets Value Premium In Market / Buyer State Seller State Date ($mm) ($mm) (%) Market Entry MN MN 6/28/2019 $129 NA NA In Market SD MN 5/29/2019 $347 NA NA Market Entry MN MN 4/22/2019 $206 NA NA In Market IN MN 6/21/2018 $1,972 $433.8 14.9 In Market ND MN 2/19/2018 $729 NA NA Market Entry IA MN 11/13/2017 $390 $53.4 10.9 In Market IN MN 8/8/2017 $2,056 $303.3 8.6 Market Entry SD MN 8/3/2017 $409 NA NA Market Entry NE MN 6/28/2016 $209 NA NA In Market MN MN 1/7/2016 $76 $12.0 8.2 In Market ND MN 9/22/2015 $352 $46.0 8.2 In Market MN MN 7/24/2014 $670 $80.0 NA Market Entry IA MN 11/21/2014 $1,172 $133.6 6.0 Market Entry NE MN 7/25/2012 $401 NA NA Market Entry Recent Minnesota M&A Transactions |
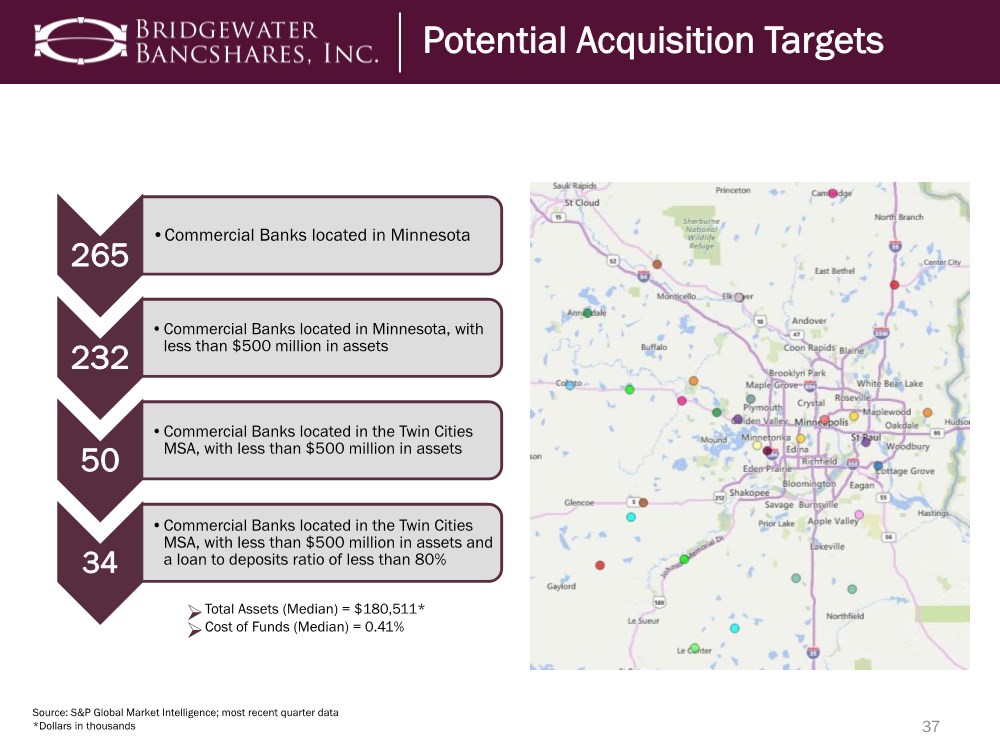
| 37 Source: S&P Global Market Intelligence; most recent quarter data *Dollars in thousands 265 •Commercial Banks located in Minnesota 232 •Commercial Banks located in Minnesota, with less than $500 million in assets 50 •Commercial Banks located in the Twin Cities MSA, with less than $500 million in assets 34 •Commercial Banks located in the Twin Cities MSA, with less than $500 million in assets and a loan to deposits ratio of less than 80% ➢Total Assets (Median) = $180,511* ➢Cost of Funds (Median) = 0.41% Potential Acquisition Targets |
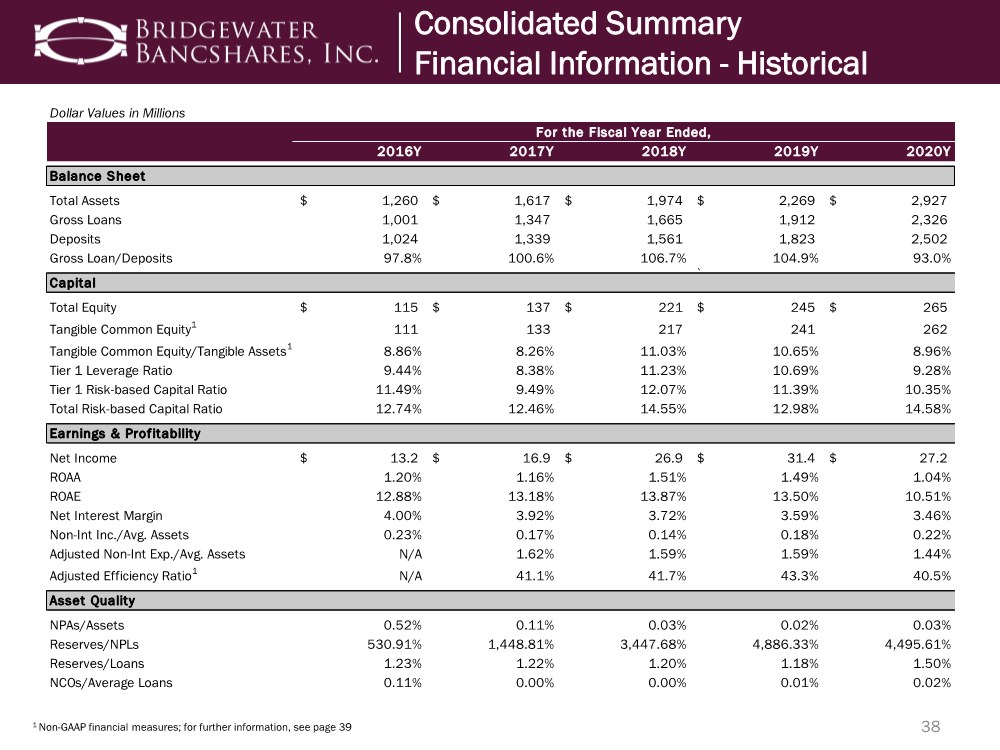
| 38 1 Non-GAAP financial measures; for further information, see page 39 Consolidated Summary Financial Information - Historical Dollar Values in Millions 2016Y 2017Y 2018Y 2019Y 2020Y Balance Sheet Total Assets 1,260 $ 1,617 $ 1,974 $ 2,269 $ 2,927 $ Gross Loans 1,001 1,347 1,665 1,912 2,326 Deposits 1,024 1,339 1,561 1,823 2,502 Gross Loan/Deposits 97.8% 100.6% 106.7% 104.9% 93.0% \ Capital Total Equity 115 $ 137 $ 221 $ 245 $ 265 $ Tangible Common Equity1 111 133 217 241 262 Tangible Common Equity/Tangible Assets1 8.86% 8.26% 11.03% 10.65% 8.96% Tier 1 Leverage Ratio 9.44% 8.38% 11.23% 10.69% 9.28% Tier 1 Risk-based Capital Ratio 11.49% 9.49% 12.07% 11.39% 10.35% Total Risk-based Capital Ratio 12.74% 12.46% 14.55% 12.98% 14.58% Earnings & Profitability Net Income 13.2 $ 16.9 $ 26.9 $ 31.4 $ 27.2 $ ROAA 1.20% 1.16% 1.51% 1.49% 1.04% ROAE 12.88% 13.18% 13.87% 13.50% 10.51% Net Interest Margin 4.00% 3.92% 3.72% 3.59% 3.46% Non-Int Inc./Avg. Assets 0.23% 0.17% 0.14% 0.18% 0.22% Adjusted Non-Int Exp./Avg. Assets N/A 1.62% 1.59% 1.59% 1.44% Adjusted Efficiency Ratio1 N/A 41.1% 41.7% 43.3% 40.5% Asset Quality NPAs/Assets 0.52% 0.11% 0.03% 0.02% 0.03% Reserves/NPLs 530.91% 1,448.81% 3,447.68% 4,886.33% 4,495.61% Reserves/Loans 1.23% 1.22% 1.20% 1.18% 1.50% NCOs/Average Loans 0.11% 0.00% 0.00% 0.01% 0.02% For the Fiscal Year Ended, |
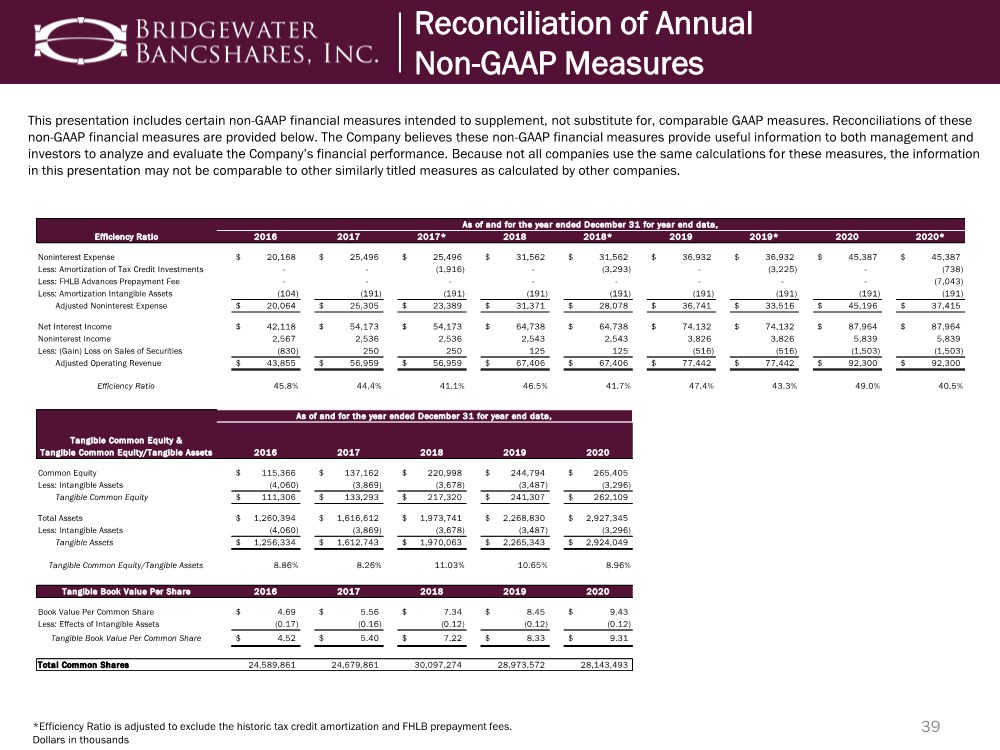
| 39 This presentation includes certain non-GAAP financial measures intended to supplement, not substitute for, comparable GAAP measures. Reconciliations of these non-GAAP financial measures are provided below. The Company believes these non-GAAP financial measures provide useful information to both management and investors to analyze and evaluate the Company’s financial performance. Because not all companies use the same calculations for these measures, the information in this presentation may not be comparable to other similarly titled measures as calculated by other companies. *Efficiency Ratio is adjusted to exclude the historic tax credit amortization and FHLB prepayment fees. Dollars in thousands Reconciliation of Annual Non-GAAP Measures Efficiency Ratio 2016 2017 2017* 2018 2018* 2019 2019* 2020 2020* Noninterest Expense 20,168 $ 25,496 $ 25,496 $ 31,562 $ 31,562 $ 36,932 $ 36,932 $ 45,387 $ 45,387 $ Less: Amortization of Tax Credit Investments - - (1,916) - (3,293) - (3,225) - (738) Less: FHLB Advances Prepayment Fee - - - - - - - - (7,043) Less: Amortization Intangible Assets (104) (191) (191) (191) (191) (191) (191) (191) (191) Adjusted Noninterest Expense 20,064 $ 25,305 $ 23,389 $ 31,371 $ 28,078 $ 36,741 $ 33,516 $ 45,196 $ 37,415 $ Net Interest Income 42,118 $ 54,173 $ 54,173 $ 64,738 $ 64,738 $ 74,132 $ 74,132 $ 87,964 $ 87,964 $ Noninterest Income 2,567 2,536 2,536 2,543 2,543 3,826 3,826 5,839 5,839 Less: (Gain) Loss on Sales of Securities (830) 250 250 125 125 (516) (516) (1,503) (1,503) Adjusted Operating Revenue 43,855 $ 56,959 $ 56,959 $ 67,406 $ 67,406 $ 77,442 $ 77,442 $ 92,300 $ 92,300 $ Efficiency Ratio 45.8% 44.4% 41.1% 46.5% 41.7% 47.4% 43.3% 49.0% 40.5% Tangible Common Equity & Tangible Common Equity/Tangible Assets 2016 2017 2018 2019 2020 Common Equity 115,366 $ 137,162 $ 220,998 $ 244,794 $ 265,405 $ Less: Intangible Assets (4,060) (3,869) (3,678) (3,487) (3,296) Tangible Common Equity 111,306 $ 133,293 $ 217,320 $ 241,307 $ 262,109 $ Total Assets 1,260,394 $ 1,616,612 $ 1,973,741 $ 2,268,830 $ 2,927,345 $ Less: Intangible Assets (4,060) (3,869) (3,678) (3,487) (3,296) Tangible Assets 1,256,334 $ 1,612,743 $ 1,970,063 $ 2,265,343 $ 2,924,049 $ Tangible Common Equity/Tangible Assets 8.86% 8.26% 11.03% 10.65% 8.96% Tangible Book Value Per Share 2016 2017 2018 2019 2020 Book Value Per Common Share 4.69 $ 5.56 $ 7.34 $ 8.45 $ 9.43 $ Less: Effects of Intangible Assets (0.17) (0.16) (0.12) (0.12) (0.12) Tangible Book Value Per Common Share 4.52 $ 5.40 $ 7.22 $ 8.33 $ 9.31 $ Total Common Shares 24,589,861 24,679,861 30,097,274 28,973,572 28,143,493 As of and for the year ended December 31 for year end data, As of and for the year ended December 31 for year end data, |
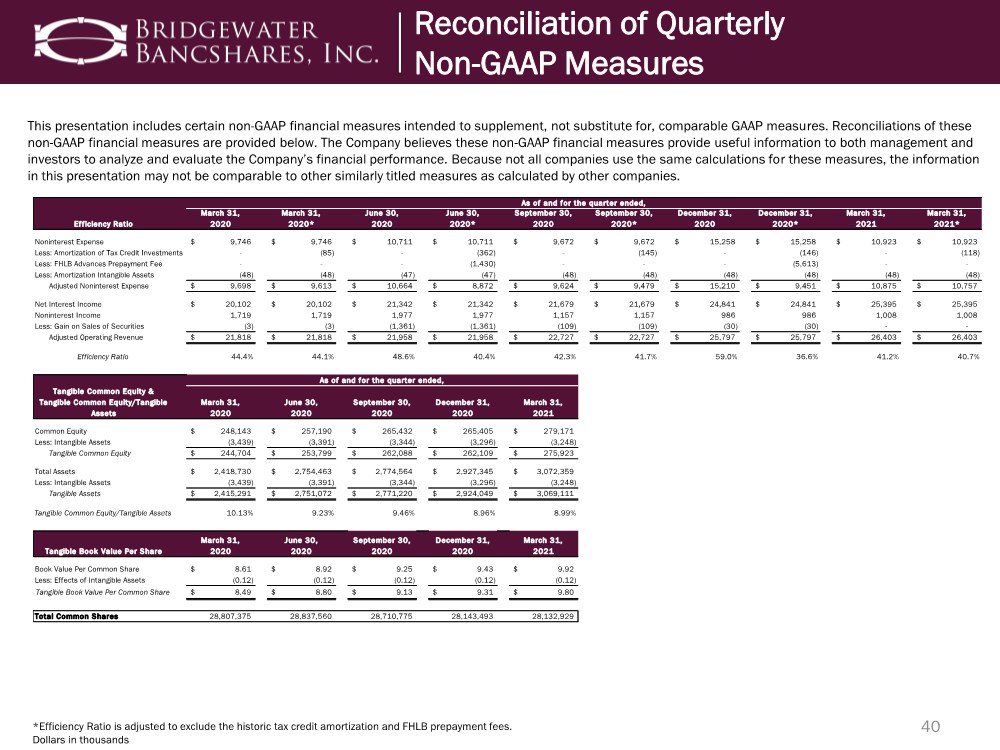
| 40 This presentation includes certain non-GAAP financial measures intended to supplement, not substitute for, comparable GAAP measures. Reconciliations of these non-GAAP financial measures are provided below. The Company believes these non-GAAP financial measures provide useful information to both management and investors to analyze and evaluate the Company’s financial performance. Because not all companies use the same calculations for these measures, the information in this presentation may not be comparable to other similarly titled measures as calculated by other companies. *Efficiency Ratio is adjusted to exclude the historic tax credit amortization and FHLB prepayment fees. Dollars in thousands Reconciliation of Quarterly Non-GAAP Measures Efficiency Ratio March 31, 2020 March 31, 2020* June 30, 2020 June 30, 2020* September 30, 2020 September 30, 2020* December 31, 2020 December 31, 2020* March 31, 2021 March 31, 2021* Noninterest Expense 9,746 $ 9,746 $ 10,711 $ 10,711 $ 9,672 $ 9,672 $ 15,258 $ 15,258 $ 10,923 $ 10,923 $ Less: Amortization of Tax Credit Investments - (85) - (362) - (145) - (146) - (118) Less: FHLB Advances Prepayment Fee - - - (1,430) - - - (5,613) - - Less: Amortization Intangible Assets (48) (48) (47) (47) (48) (48) (48) (48) (48) (48) Adjusted Noninterest Expense 9,698 $ 9,613 $ 10,664 $ 8,872 $ 9,624 $ 9,479 $ 15,210 $ 9,451 $ 10,875 $ 10,757 $ Net Interest Income 20,102 $ 20,102 $ 21,342 $ 21,342 $ 21,679 $ 21,679 $ 24,841 $ 24,841 $ 25,395 $ 25,395 $ Noninterest Income 1,719 1,719 1,977 1,977 1,157 1,157 986 986 1,008 1,008 Less: Gain on Sales of Securities (3) (3) (1,361) (1,361) (109) (109) (30) (30) - - Adjusted Operating Revenue 21,818 $ 21,818 $ 21,958 $ 21,958 $ 22,727 $ 22,727 $ 25,797 $ 25,797 $ 26,403 $ 26,403 $ Efficiency Ratio 44.4% 44.1% 48.6% 40.4% 42.3% 41.7% 59.0% 36.6% 41.2% 40.7% Tangible Common Equity & Tangible Common Equity/Tangible Assets March 31, 2020 June 30, 2020 September 30, 2020 December 31, 2020 March 31, 2021 Common Equity 248,143 $ 257,190 $ 265,432 $ 265,405 $ 279,171 $ Less: Intangible Assets (3,439) (3,391) (3,344) (3,296) (3,248) Tangible Common Equity 244,704 $ 253,799 $ 262,088 $ 262,109 $ 275,923 $ Total Assets 2,418,730 $ 2,754,463 $ 2,774,564 $ 2,927,345 $ 3,072,359 $ Less: Intangible Assets (3,439) (3,391) (3,344) (3,296) (3,248) Tangible Assets 2,415,291 $ 2,751,072 $ 2,771,220 $ 2,924,049 $ 3,069,111 $ Tangible Common Equity/Tangible Assets 10.13% 9.23% 9.46% 8.96% 8.99% Tangible Book Value Per Share March 31, 2020 June 30, 2020 September 30, 2020 December 31, 2020 March 31, 2021 Book Value Per Common Share 8.61 $ 8.92 $ 9.25 $ 9.43 $ 9.92 $ Less: Effects of Intangible Assets (0.12) (0.12) (0.12) (0.12) (0.12) Tangible Book Value Per Common Share 8.49 $ 8.80 $ 9.13 $ 9.31 $ 9.80 $ Total Common Shares 28,807,375 28,837,560 28,710,775 28,143,493 28,132,929 As of and for the quarter ended, As of and for the quarter ended, |
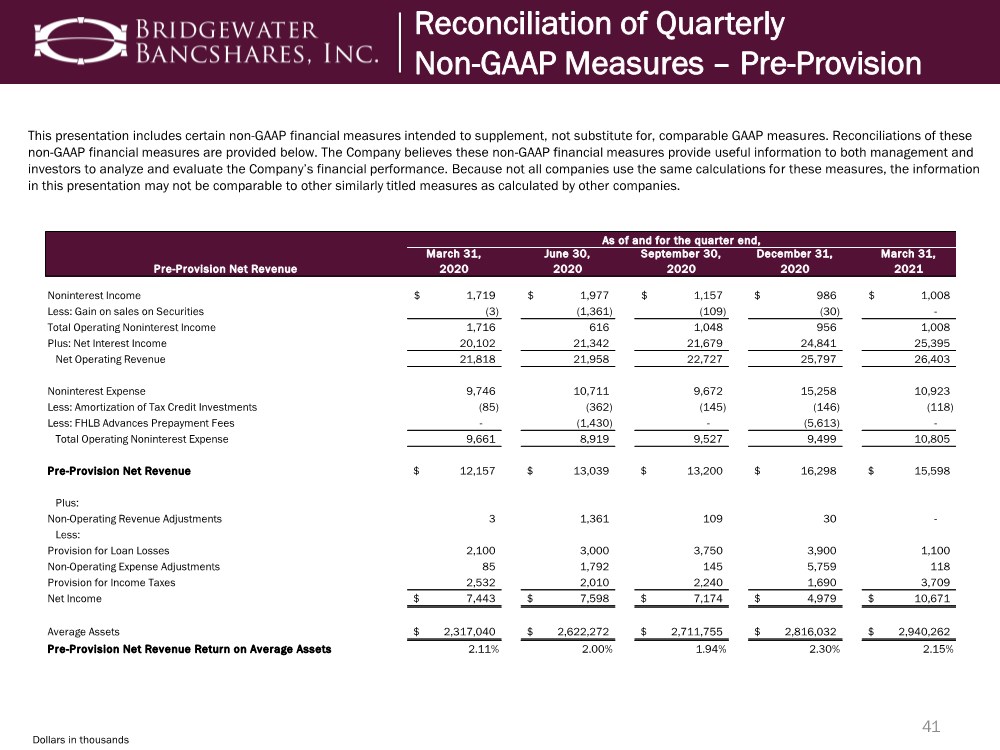
| 41 This presentation includes certain non-GAAP financial measures intended to supplement, not substitute for, comparable GAAP measures. Reconciliations of these non-GAAP financial measures are provided below. The Company believes these non-GAAP financial measures provide useful information to both management and investors to analyze and evaluate the Company’s financial performance. Because not all companies use the same calculations for these measures, the information in this presentation may not be comparable to other similarly titled measures as calculated by other companies. Dollars in thousands Reconciliation of Quarterly Non-GAAP Measures – Pre-Provision Pre-Provision Net Revenue March 31, 2020 June 30, 2020 September 30, 2020 December 31, 2020 March 31, 2021 Noninterest Income 1,719 $ 1,977 $ 1,157 $ 986 $ 1,008 $ Less: Gain on sales on Securities (3) (1,361) (109) (30) - Total Operating Noninterest Income 1,716 616 1,048 956 1,008 Plus: Net Interest Income 20,102 21,342 21,679 24,841 25,395 Net Operating Revenue 21,818 21,958 22,727 25,797 26,403 Noninterest Expense 9,746 10,711 9,672 15,258 10,923 Less: Amortization of Tax Credit Investments (85) (362) (145) (146) (118) Less: FHLB Advances Prepayment Fees - (1,430) - (5,613) - Total Operating Noninterest Expense 9,661 8,919 9,527 9,499 10,805 Pre-Provision Net Revenue 12,157 $ 13,039 $ 13,200 $ 16,298 $ 15,598 $ Plus: Non-Operating Revenue Adjustments 3 1,361 109 30 - Less: Provision for Loan Losses 2,100 3,000 3,750 3,900 1,100 Non-Operating Expense Adjustments 85 1,792 145 5,759 118 Provision for Income Taxes 2,532 2,010 2,240 1,690 3,709 Net Income 7,443 $ 7,598 $ 7,174 $ 4,979 $ 10,671 $ Average Assets 2,317,040 $ 2,622,272 $ 2,711,755 $ 2,816,032 $ 2,940,262 $ Pre-Provision Net Revenue Return on Average Assets 2.11% 2.00% 1.94% 2.30% 2.15% As of and for the quarter end, |
|