Attached files
| file | filename |
|---|---|
| EX-99.1 - EX-99.1 - Atkore Inc. | atkr2q21exhibit991.htm |
| 8-K - 8-K - Atkore Inc. | atkr-20210429.htm |
© Atkore Inc. Second Quarter 2021 Earnings Presentation April 29, 2021
© Atkore Cautionary Statements This presentation contains forward-looking statements that are subject to known and unknown risks and uncertainties, many of which are beyond our control. All statements other than statements of historical fact included in this presentation are forward-looking statements. Forward-looking statements appearing throughout this presentation include, without limitation, statements regarding our intentions, beliefs, assumptions or current expectations concerning, among other things, financial position; results of operations; cash flows; prospects; growth strategies or expectations; customer retention; the outcome (by judgment or settlement) and costs of legal, administrative or regulatory proceedings, investigations or inspections, including, without limitation, collective, representative or any other litigation; and the impact of prevailing economic conditions. You can identify forward-looking statements by the fact that they do not relate strictly to historical or current facts. These statements may inc lude words such as “believes,” “expects,” “may,” “will,” “shall,” “should,” “would,” “could,” “seeks,” “aims,” “projects,” “is optimistic,” “intends,” “plans,” “estimates,” “anticipates” and other comparable terms. We caution you that forward-looking statements are not guarantees of future performance or outcomes and that actual performance and outcomes, including, without limitation, our actual results of operations, financial condition and liquidity, and the development of the market in which we operate, may differ materially from those made in or suggested by the forward-looking statements contained in this presentation. In addition, even if our results of operations, financial condition and cash flows, and the development of the market in which we operate, are consistent with the forward-looking statements contained in this presentation, those results or developments may not be indicative of results or developments in subsequent periods. A number of important factors, including, without limitation, the risks and uncertainties discussed under the captions “Risk Factors” and “Management’s Discussion and Analysis of Financial Condition and Results of Operations” in our Annual Report on Form 10-K and the Quarterly Report on Form 10-Q filed with the U.S. Securities and Exchange Commission, could cause actual results and outcomes to differ materially from those reflected in the forward- looking statements. Because of these risks, we caution that you should not place undue reliance on any of our forward-looking statements. New risks and uncertainties arise from time to time, and it is impossible for us to predict those events or how they may affect us. Further, any forward-looking statement speaks only as of the date on which it is made. We undertake no obligation to revise the forward-looking statements in this presentation after the date of this presentation. Market data and industry information used throughout this presentation are based on management’s knowledge of the industry and the good faith estimates of management. We also relied, to the extent available, upon management’s review of independent industry surveys, forecasts and publications and other publicly available information prepared by a number of third party sources. All of the market data and industry information used in this presentation involves a number of assumptions and limitations which we believe to be reasonable, and you are cautioned not to give undue weight to such estimates. Although we believe that these sources are reliable, we cannot guarantee the accuracy or completeness of this information, and we have not independently verified this information. While we believe the estimated market position, market opportunity and market size information included in this presentation are generally reliable, such information, which is derived in part from management’s estimates and beliefs, is inherently uncertain and imprecise. Projections, assumptions and estimates of our future performance and the future performance of the industry in which we operate are subject to a high degree of uncertainty and risk due to a variety of factors, including those described above. These and other factors could cause results to differ materially from those expressed in our estimates and beliefs and in the estimates prepared by independent parties. We present Adjusted EBITDA, Adjusted EBITDA margin (Adjusted EBITDA over Net Sales), Net debt (total debt less cash and cash equivalents), Adjusted Net Income Per Share, and Leverage ratio (net debt or total debt less cash and cash equivalents, over Adjusted EBITDA on trailing twelve month (“TTM”) basis) to help us describe our operating and financial performance. Adjusted EBITDA, Adjusted EBITDA margin, Net debt (total debt less cash and cash equivalents), Adjusted Net Income Per Share, and Leverage ratio are non-GAAP financial measures commonly used in our industry and have certain limitations and should not be construed as alternatives to net income, net sales and other income data measures (as determined in accordance with generally accepted accounting principles in the United States, or GAAP), or as better indicators of operating performance. Adjusted EBITDA, Adjusted EBITDA margin, Net debt, Adjusted Net Income Per Share, and Leverage ratio, as defined by us may not be comparable to similar non-GAAP measures presented by other issuers. Our presentation of such measures should not be construed as an inference that our future results will be unaffected by unusual or non-recurring items. See the appendix to this presentation for a reconciliation of Adjusted EBITDA to net income, Adjusted EBITDA Margin, Adjusted Net Income Per Share to Net Income Per Share, net debt to total debt, and Leverage Ratio. Fiscal Periods - The Company has a fiscal year that ends on September 30th. It is the Company's practice to establish quarterly closings using a 4-5-4 calendar. The Company's fiscal quarters typically end on the last Friday in December, March and June. 2
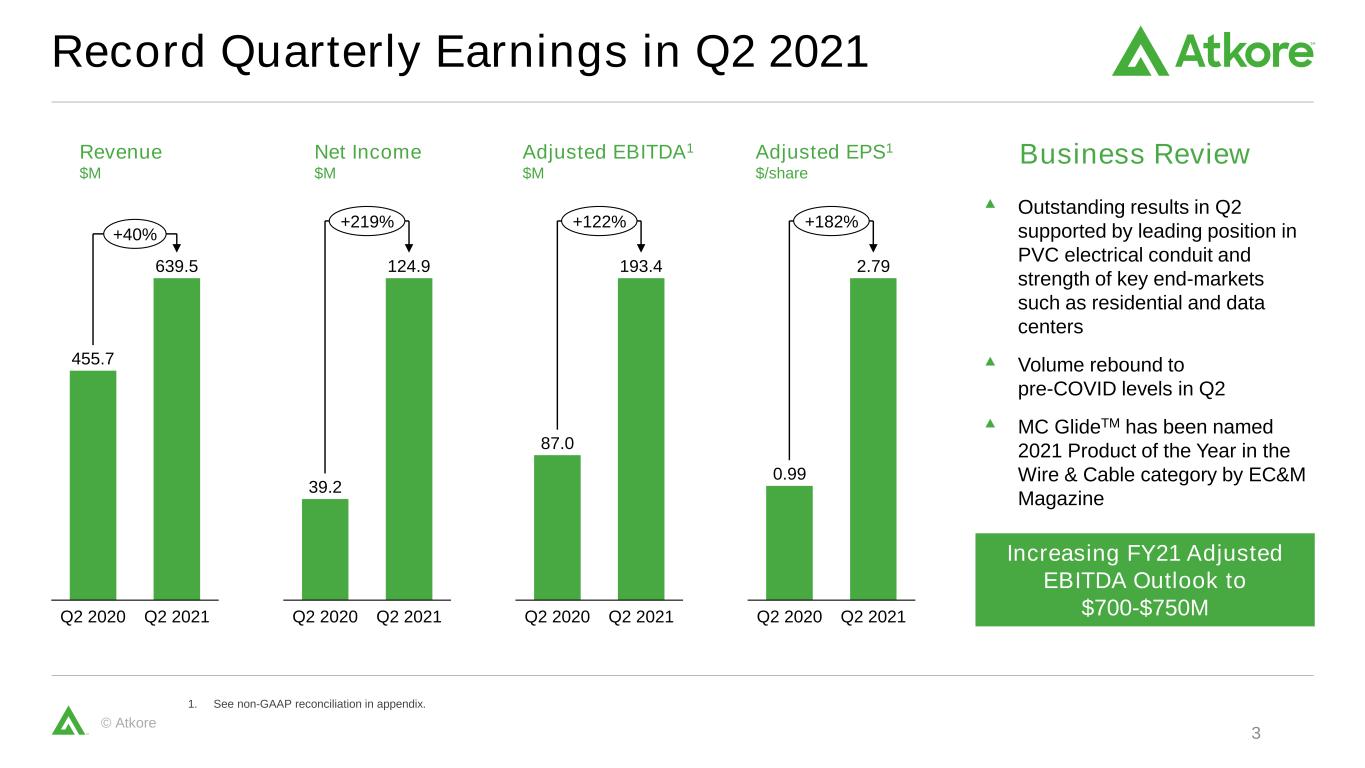
© Atkore Record Quarterly Earnings in Q2 2021 3 1. See non-GAAP reconciliation in appendix. 455.7 639.5 Q2 2020 Q2 2021 +40% 39.2 124.9 Q2 2020 Q2 2021 +219% 87.0 193.4 Q2 2020 Q2 2021 +122% 0.99 2.79 Q2 2020 Q2 2021 +182% Revenue $M Net Income $M Adjusted EBITDA1 $M Adjusted EPS1 $/share Business Review Outstanding results in Q2 supported by leading position in PVC electrical conduit and strength of key end-markets such as residential and data centers Volume rebound to pre-COVID levels in Q2 MC GlideTM has been named 2021 Product of the Year in the Wire & Cable category by EC&M Magazine Increasing FY21 Adjusted EBITDA Outlook to $700-$750M
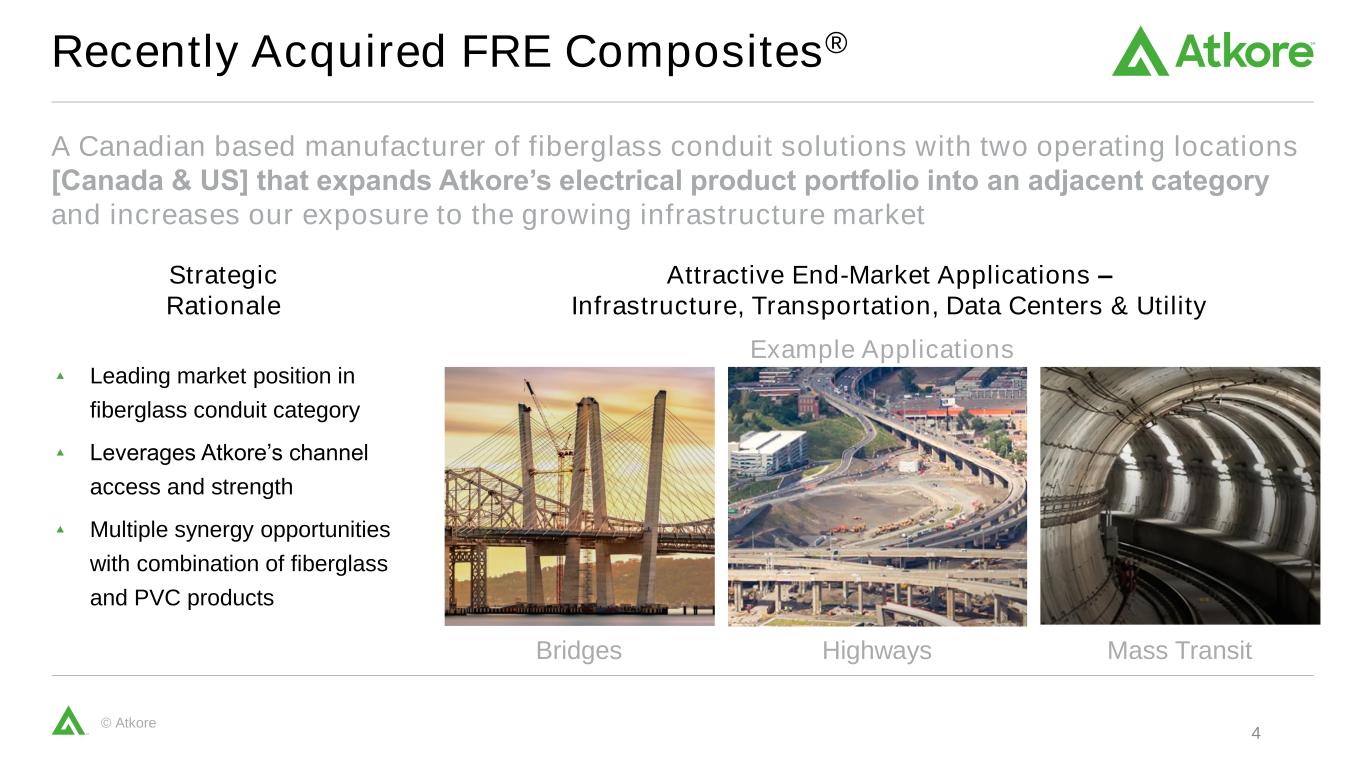
© Atkore A Canadian based manufacturer of fiberglass conduit solutions with two operating locations [Canada & US] that expands Atkore’s electrical product portfolio into an adjacent category and increases our exposure to the growing infrastructure market Recently Acquired FRE Composites® Leading market position in fiberglass conduit category Leverages Atkore’s channel access and strength Multiple synergy opportunities with combination of fiberglass and PVC products Mass TransitHighwaysBridges 4 Attractive End-Market Applications – Infrastructure, Transportation, Data Centers & Utility Strategic Rationale Example Applications
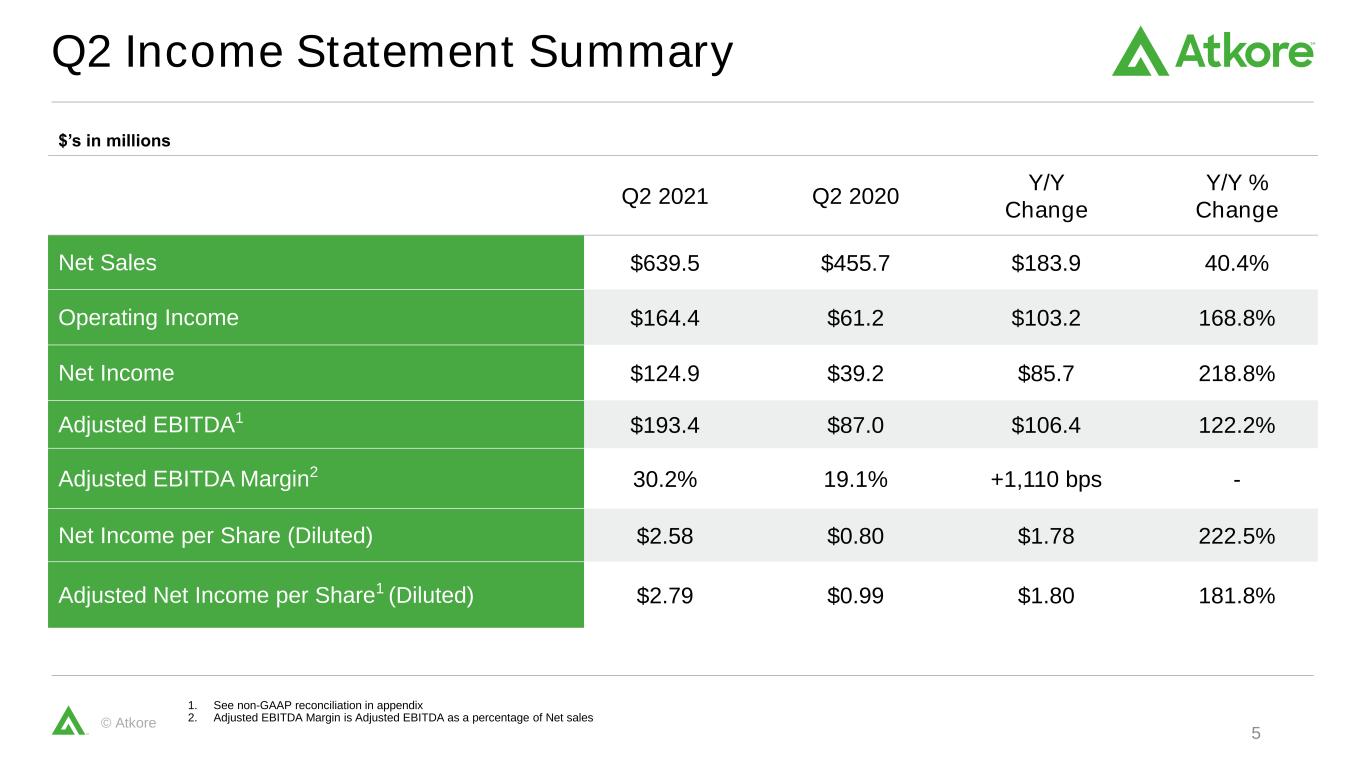
© Atkore Q2 Income Statement Summary 5 1. See non-GAAP reconciliation in appendix 2. Adjusted EBITDA Margin is Adjusted EBITDA as a percentage of Net sales $’s in millions Q2 2021 Q2 2020 Y/Y Change Y/Y % Change Net Sales $639.5 $455.7 $183.9 40.4% Operating Income $164.4 $61.2 $103.2 168.8% Net Income $124.9 $39.2 $85.7 218.8% Adjusted EBITDA1 $193.4 $87.0 $106.4 122.2% Adjusted EBITDA Margin2 30.2% 19.1% +1,110 bps - Net Income per Share (Diluted) $2.58 $0.80 $1.78 222.5% Adjusted Net Income per Share1 (Diluted) $2.79 $0.99 $1.80 181.8%
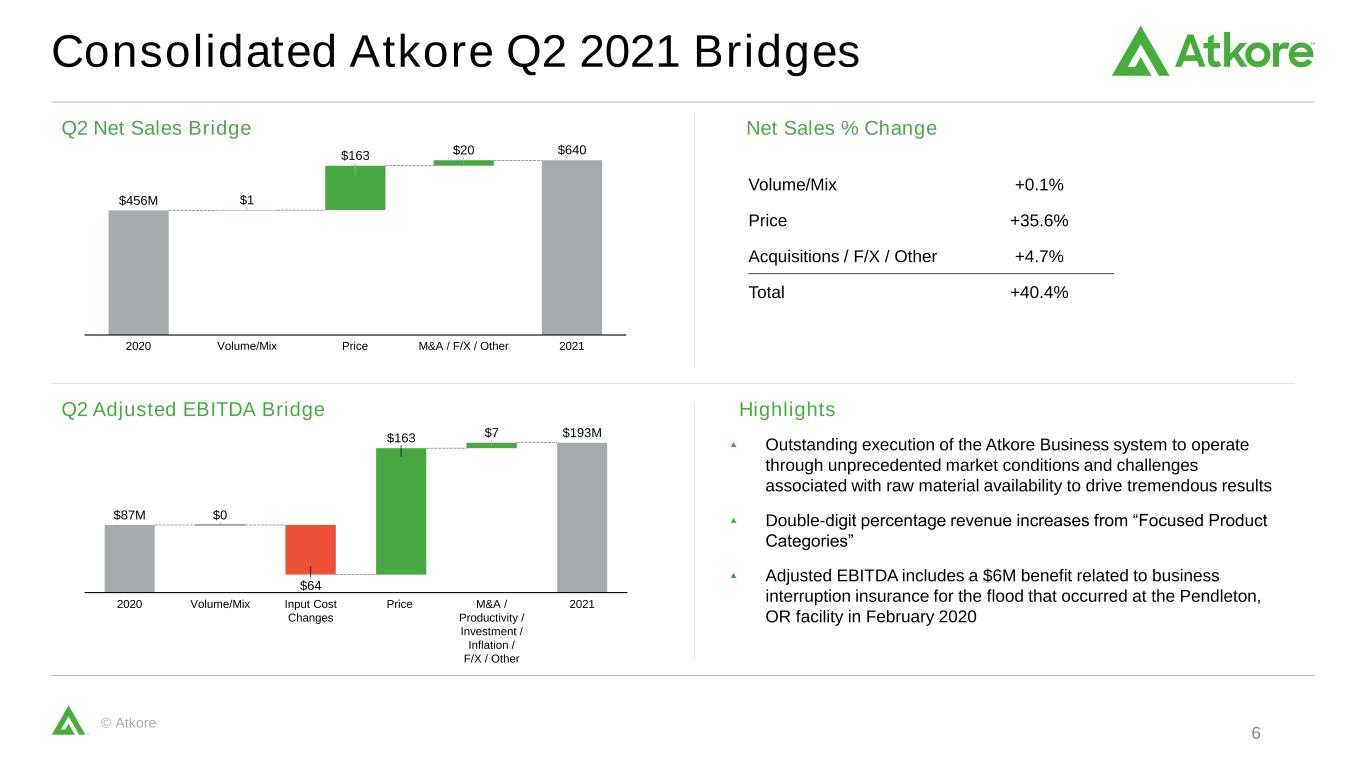
© Atkore Consolidated Atkore Q2 2021 Bridges 6 Volume/Mix +0.1% Price +35.6% Acquisitions / F/X / Other +4.7% Total +40.4% Q2 Net Sales Bridge Net Sales % Change Q2 Adjusted EBITDA Bridge Highlights $640 $1 $163 $20 2020 Price M&A / F/X / Other 2021Volume/Mix $456M Outstanding execution of the Atkore Business system to operate through unprecedented market conditions and challenges associated with raw material availability to drive tremendous results Double-digit percentage revenue increases from “Focused Product Categories” Adjusted EBITDA includes a $6M benefit related to business interruption insurance for the flood that occurred at the Pendleton, OR facility in February 2020 $64 $163 $7 Volume/Mix2020 $0 Input Cost Changes Price M&A / Productivity / Investment / Inflation / F/X / Other 2021 $87M $193M
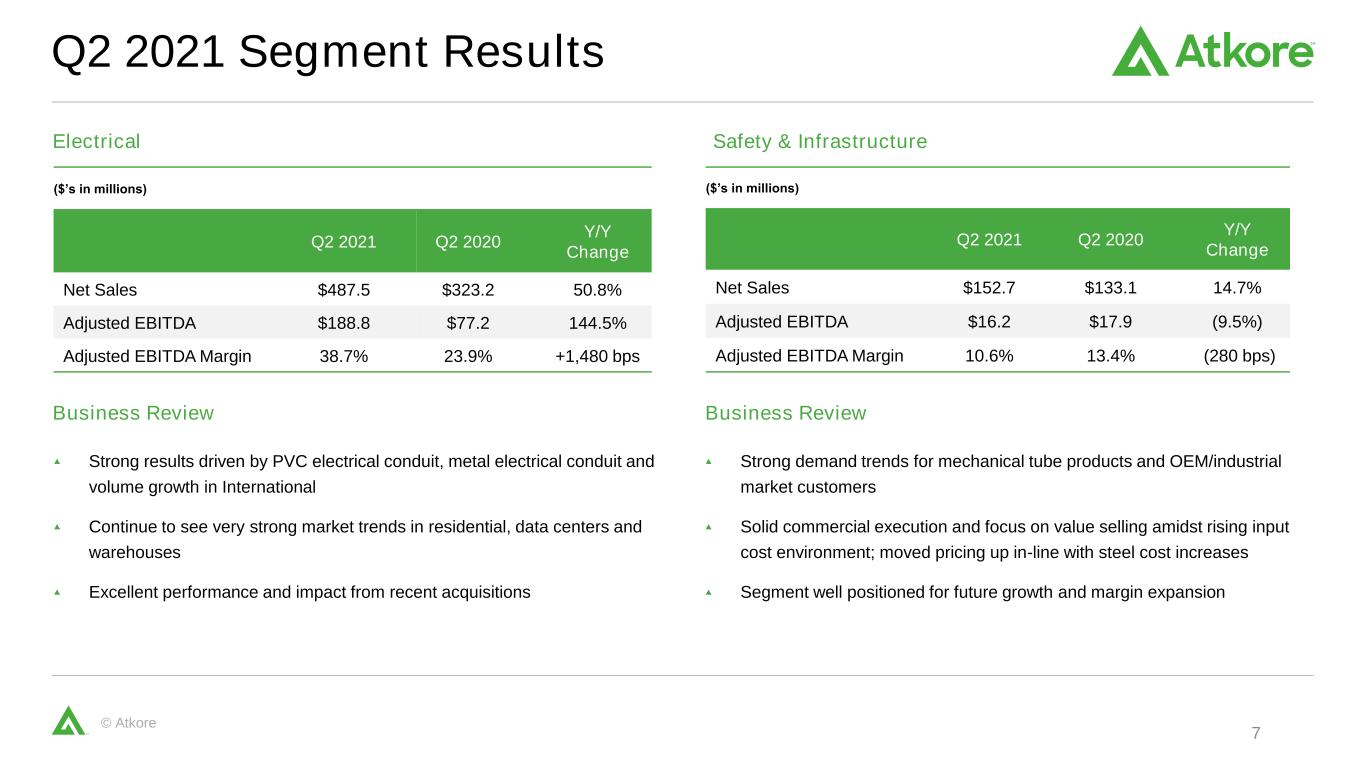
© Atkore Q2 2021 Segment Results 7 Electrical Safety & Infrastructure ($’s in millions) Q2 2021 Q2 2020 Y/Y Change Net Sales $487.5 $323.2 50.8% Adjusted EBITDA $188.8 $77.2 144.5% Adjusted EBITDA Margin 38.7% 23.9% +1,480 bps ($’s in millions) Q2 2021 Q2 2020 Y/Y Change Net Sales $152.7 $133.1 14.7% Adjusted EBITDA $16.2 $17.9 (9.5%) Adjusted EBITDA Margin 10.6% 13.4% (280 bps) Strong results driven by PVC electrical conduit, metal electrical conduit and volume growth in International Continue to see very strong market trends in residential, data centers and warehouses Excellent performance and impact from recent acquisitions Strong demand trends for mechanical tube products and OEM/industrial market customers Solid commercial execution and focus on value selling amidst rising input cost environment; moved pricing up in-line with steel cost increases Segment well positioned for future growth and margin expansion Business Review Business Review
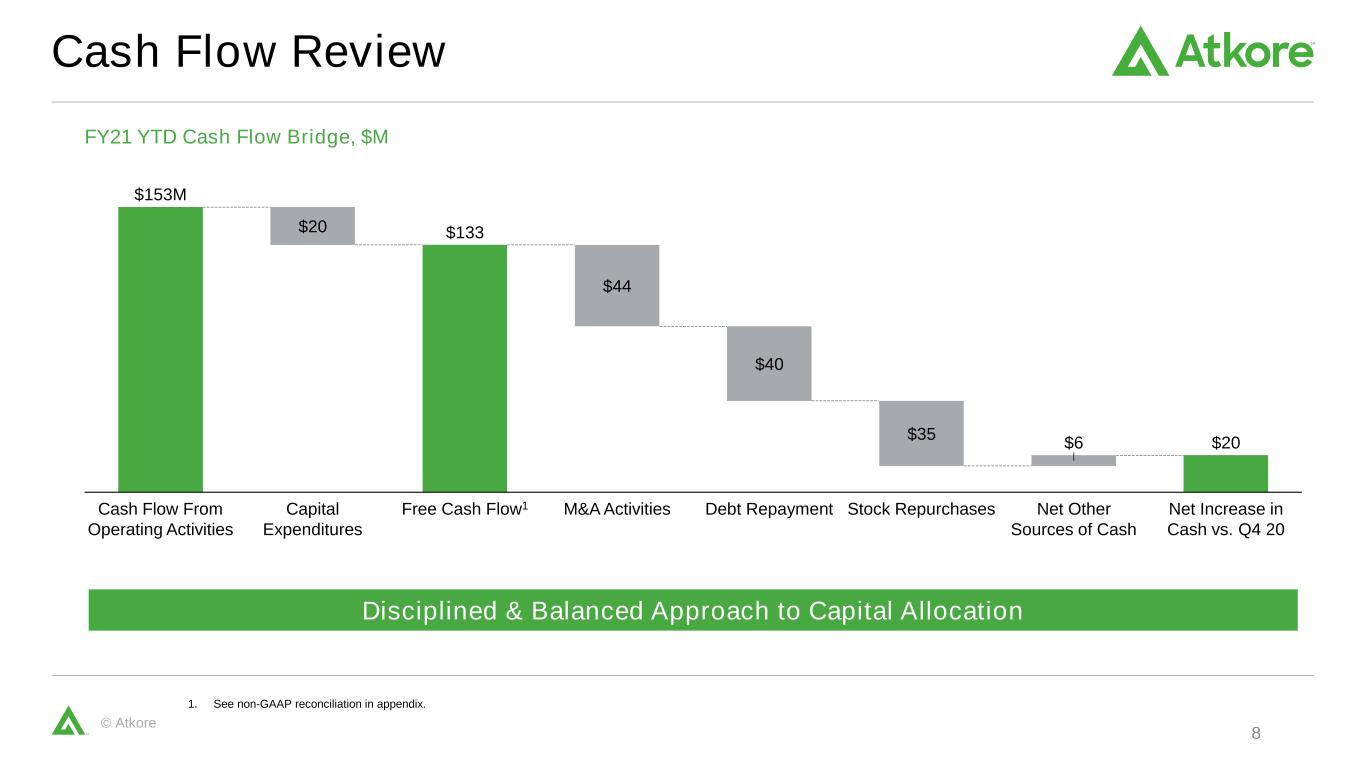
© Atkore Cash Flow Review 8 1. See non-GAAP reconciliation in appendix. $133 $20 $20 $44 $40 $35 $6 Cash Flow From Operating Activities Capital Expenditures Net Other Sources of Cash Free Cash Flow1 Debt RepaymentM&A Activities Stock Repurchases Net Increase in Cash vs. Q4 20 $153M FY21 YTD Cash Flow Bridge, $M Disciplined & Balanced Approach to Capital Allocation
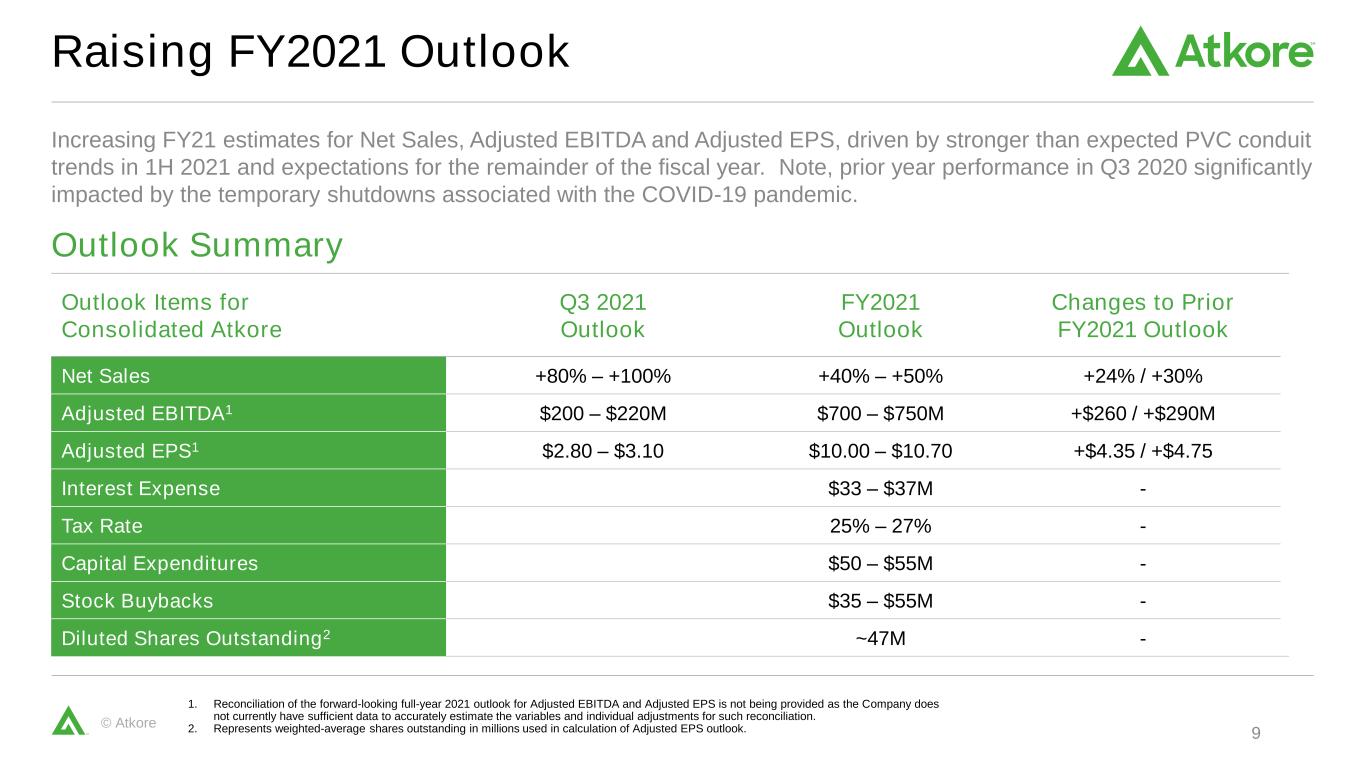
© Atkore Increasing FY21 estimates for Net Sales, Adjusted EBITDA and Adjusted EPS, driven by stronger than expected PVC conduit trends in 1H 2021 and expectations for the remainder of the fiscal year. Note, prior year performance in Q3 2020 significantly impacted by the temporary shutdowns associated with the COVID-19 pandemic. Raising FY2021 Outlook Outlook Summary 9 1. Reconciliation of the forward-looking full-year 2021 outlook for Adjusted EBITDA and Adjusted EPS is not being provided as the Company does not currently have sufficient data to accurately estimate the variables and individual adjustments for such reconciliation. 2. Represents weighted-average shares outstanding in millions used in calculation of Adjusted EPS outlook. Outlook Items for Consolidated Atkore Q3 2021 Outlook FY2021 Outlook Changes to Prior FY2021 Outlook Net Sales +80% – +100% +40% – +50% +24% / +30% Adjusted EBITDA1 $200 – $220M $700 – $750M +$260 / +$290M Adjusted EPS1 $2.80 – $3.10 $10.00 – $10.70 +$4.35 / +$4.75 Interest Expense $33 – $37M - Tax Rate 25% – 27% - Capital Expenditures $50 – $55M - Stock Buybacks $35 – $55M - Diluted Shares Outstanding2 ~47M -
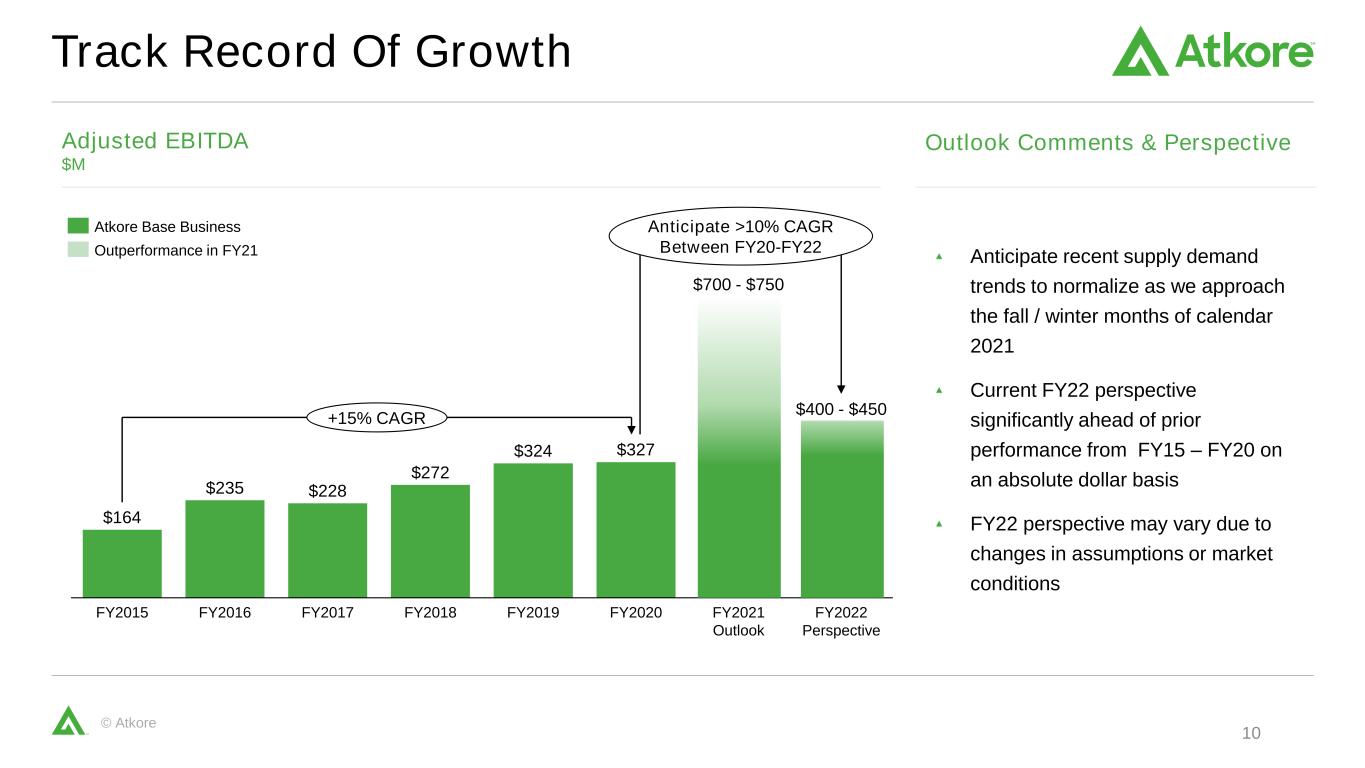
© Atkore Track Record Of Growth Outlook Comments & Perspective Anticipate recent supply demand trends to normalize as we approach the fall / winter months of calendar 2021 Current FY22 perspective significantly ahead of prior performance from FY15 – FY20 on an absolute dollar basis FY22 perspective may vary due to changes in assumptions or market conditions Adjusted EBITDA $M 10 325 400 FY2020FY2015 FY2016 FY2019FY2017 FY2018 FY2021 Outlook FY2022 Perspective $164 $235 $228 $700 - $750 $272 $324 $327 $400 - $450 +15% CAGR Anticipate >10% CAGR Between FY20-FY22 Atkore Base Business Outperformance in FY21
© Atkore. Appendix
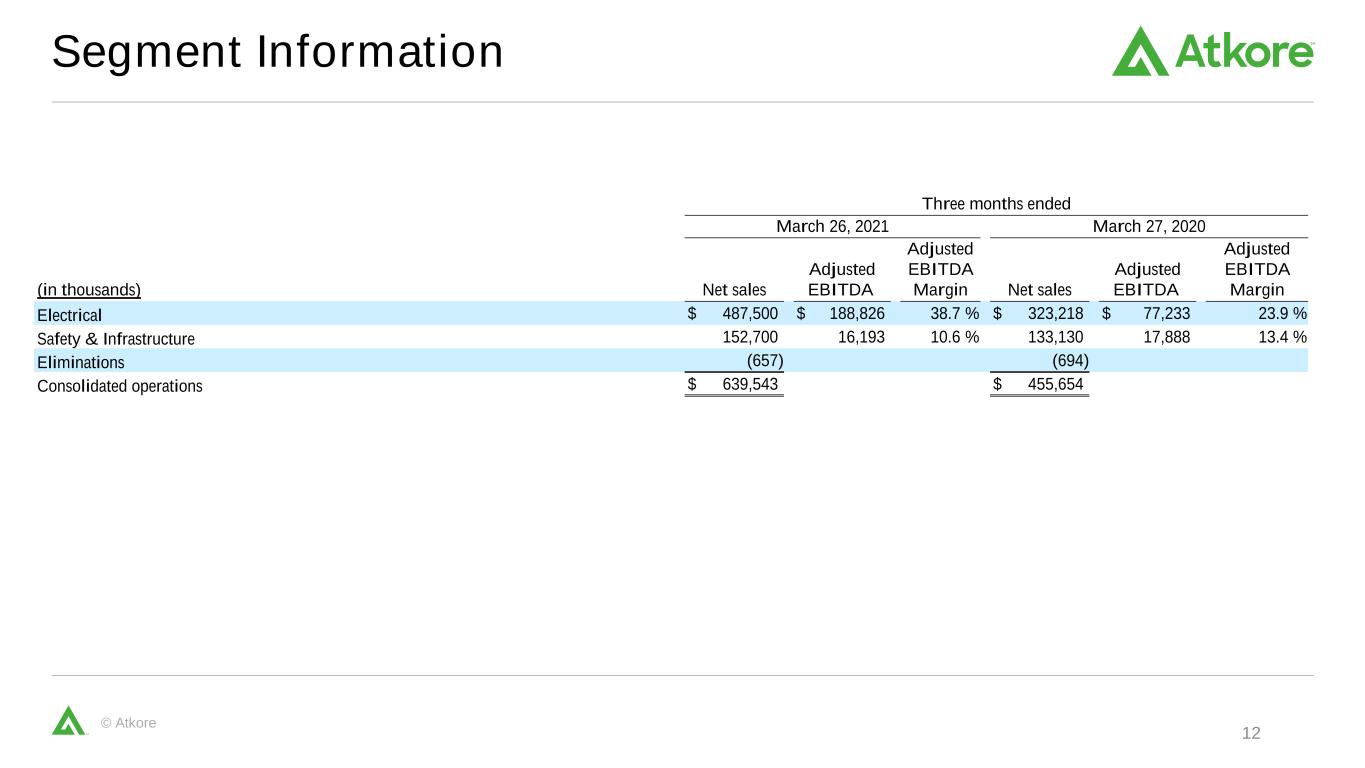
© Atkore Segment Information Three months ended March 26, 2021 March 27, 2020 (in thousands) Net sales Adjusted EBITDA Adjusted EBITDA Margin Net sales Adjusted EBITDA Adjusted EBITDA Margin Electrical $ 487,500 $ 188,826 38.7 % $ 323,218 $ 77,233 23.9 % Safety & Infrastructure 152,700 16,193 10.6 % 133,130 17,888 13.4 % Eliminations (657) (694) Consolidated operations $ 639,543 $ 455,654 12
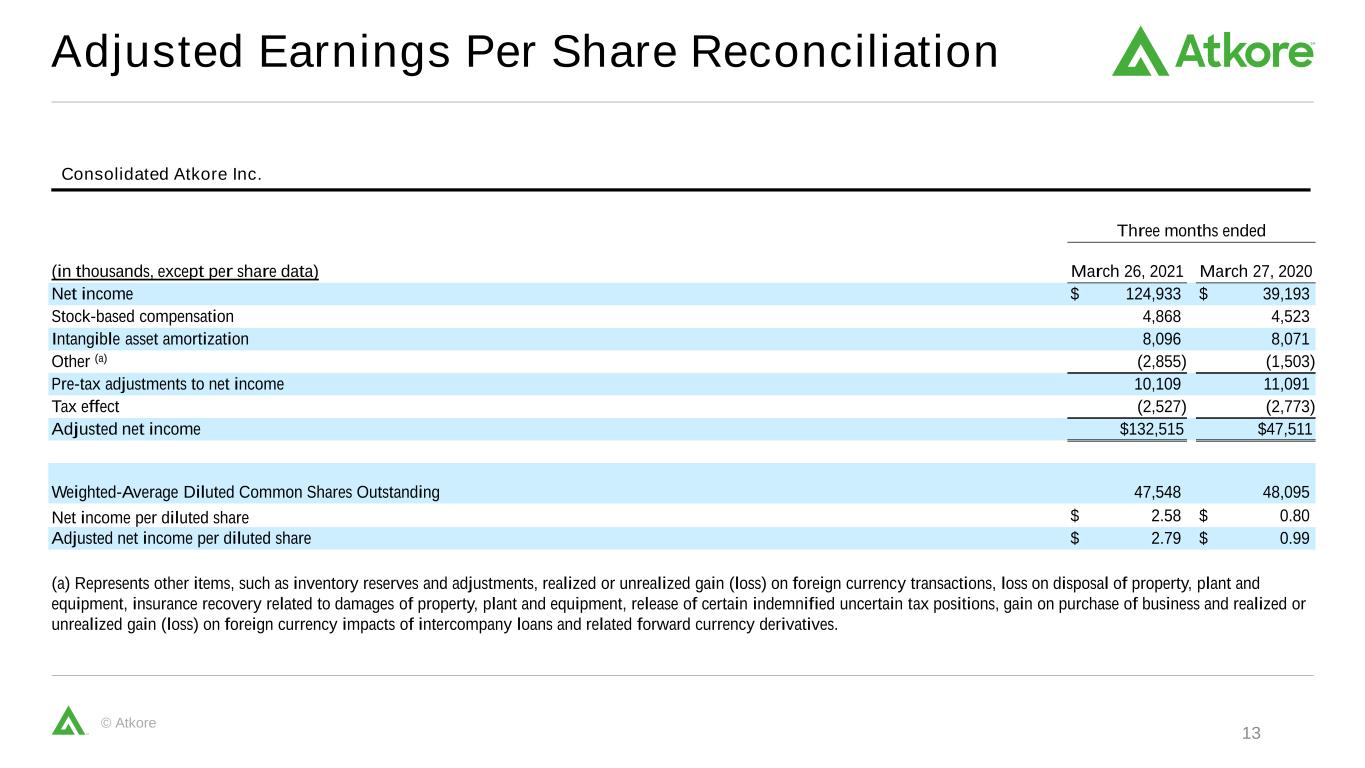
© Atkore Adjusted Earnings Per Share Reconciliation Consolidated Atkore Inc. Three months ended (in thousands, except per share data) March 26, 2021 March 27, 2020 Net income $ 124,933 $ 39,193 Stock-based compensation 4,868 4,523 Intangible asset amortization 8,096 8,071 Other (a) (2,855) (1,503) Pre-tax adjustments to net income 10,109 11,091 Tax effect (2,527) (2,773) Adjusted net income $132,515 $47,511 Weighted-Average Diluted Common Shares Outstanding 47,548 48,095 Net income per diluted share $ 2.58 $ 0.80 Adjusted net income per diluted share $ 2.79 $ 0.99 (a) Represents other items, such as inventory reserves and adjustments, realized or unrealized gain (loss) on foreign currency transactions, loss on disposal of property, plant and equipment, insurance recovery related to damages of property, plant and equipment, release of certain indemnified uncertain tax positions, gain on purchase of business and realized or unrealized gain (loss) on foreign currency impacts of intercompany loans and related forward currency derivatives. 13
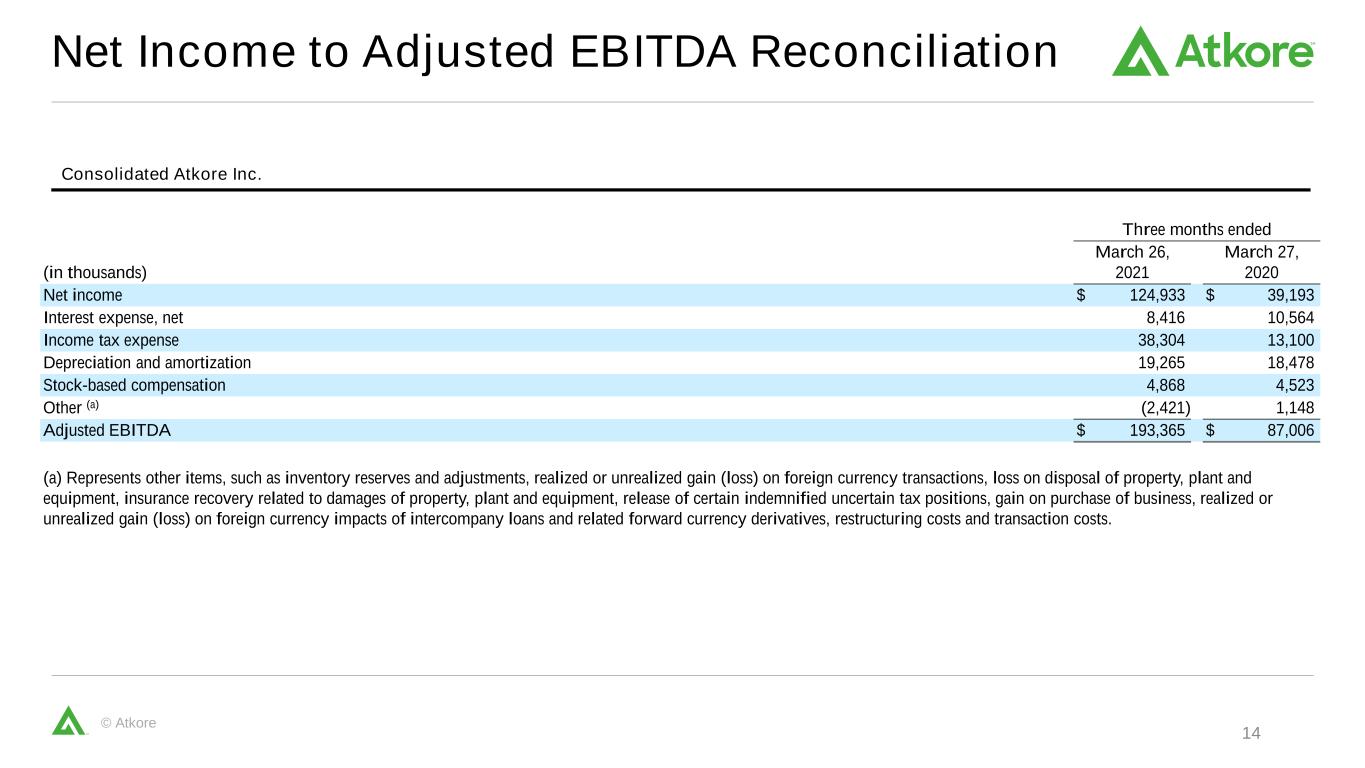
© Atkore Net Income to Adjusted EBITDA Reconciliation Consolidated Atkore Inc. Three months ended (in thousands) March 26, 2021 March 27, 2020 Net income $ 124,933 $ 39,193 Interest expense, net 8,416 10,564 Income tax expense 38,304 13,100 Depreciation and amortization 19,265 18,478 Stock-based compensation 4,868 4,523 Other (a) (2,421) 1,148 Adjusted EBITDA $ 193,365 $ 87,006 (a) Represents other items, such as inventory reserves and adjustments, realized or unrealized gain (loss) on foreign currency transactions, loss on disposal of property, plant and equipment, insurance recovery related to damages of property, plant and equipment, release of certain indemnified uncertain tax positions, gain on purchase of business, realized or unrealized gain (loss) on foreign currency impacts of intercompany loans and related forward currency derivatives, restructuring costs and transaction costs. 14
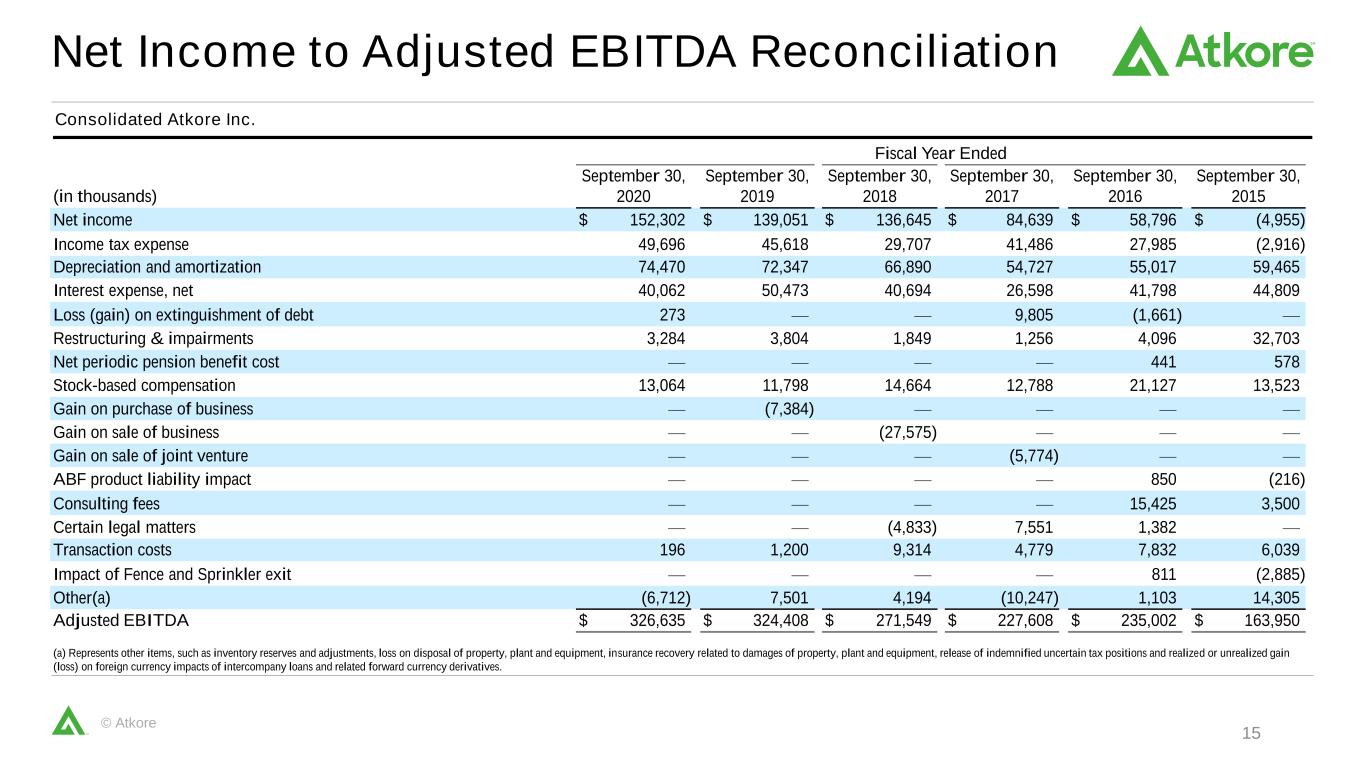
© Atkore Net Income to Adjusted EBITDA Reconciliation Consolidated Atkore Inc. Fiscal Year Ended (in thousands) September 30, 2020 September 30, 2019 September 30, 2018 September 30, 2017 September 30, 2016 September 30, 2015 Net income $ 152,302 $ 139,051 $ 136,645 $ 84,639 $ 58,796 $ (4,955) Income tax expense 49,696 45,618 29,707 41,486 27,985 (2,916) Depreciation and amortization 74,470 72,347 66,890 54,727 55,017 59,465 Interest expense, net 40,062 50,473 40,694 26,598 41,798 44,809 Loss (gain) on extinguishment of debt 273 — — 9,805 (1,661) — Restructuring & impairments 3,284 3,804 1,849 1,256 4,096 32,703 Net periodic pension benefit cost — — — — 441 578 Stock-based compensation 13,064 11,798 14,664 12,788 21,127 13,523 Gain on purchase of business — (7,384) — — — — Gain on sale of business — — (27,575) — — — Gain on sale of joint venture — — — (5,774) — — ABF product liability impact — — — — 850 (216) Consulting fees — — — — 15,425 3,500 Certain legal matters — — (4,833) 7,551 1,382 — Transaction costs 196 1,200 9,314 4,779 7,832 6,039 Impact of Fence and Sprinkler exit — — — — 811 (2,885) Other(a) (6,712) 7,501 4,194 (10,247) 1,103 14,305 Adjusted EBITDA $ 326,635 $ 324,408 $ 271,549 $ 227,608 $ 235,002 $ 163,950 (a) Represents other items, such as inventory reserves and adjustments, loss on disposal of property, plant and equipment, insurance recovery related to damages of property, plant and equipment, release of indemnified uncertain tax positions and realized or unrealized gain (loss) on foreign currency impacts of intercompany loans and related forward currency derivatives. 15
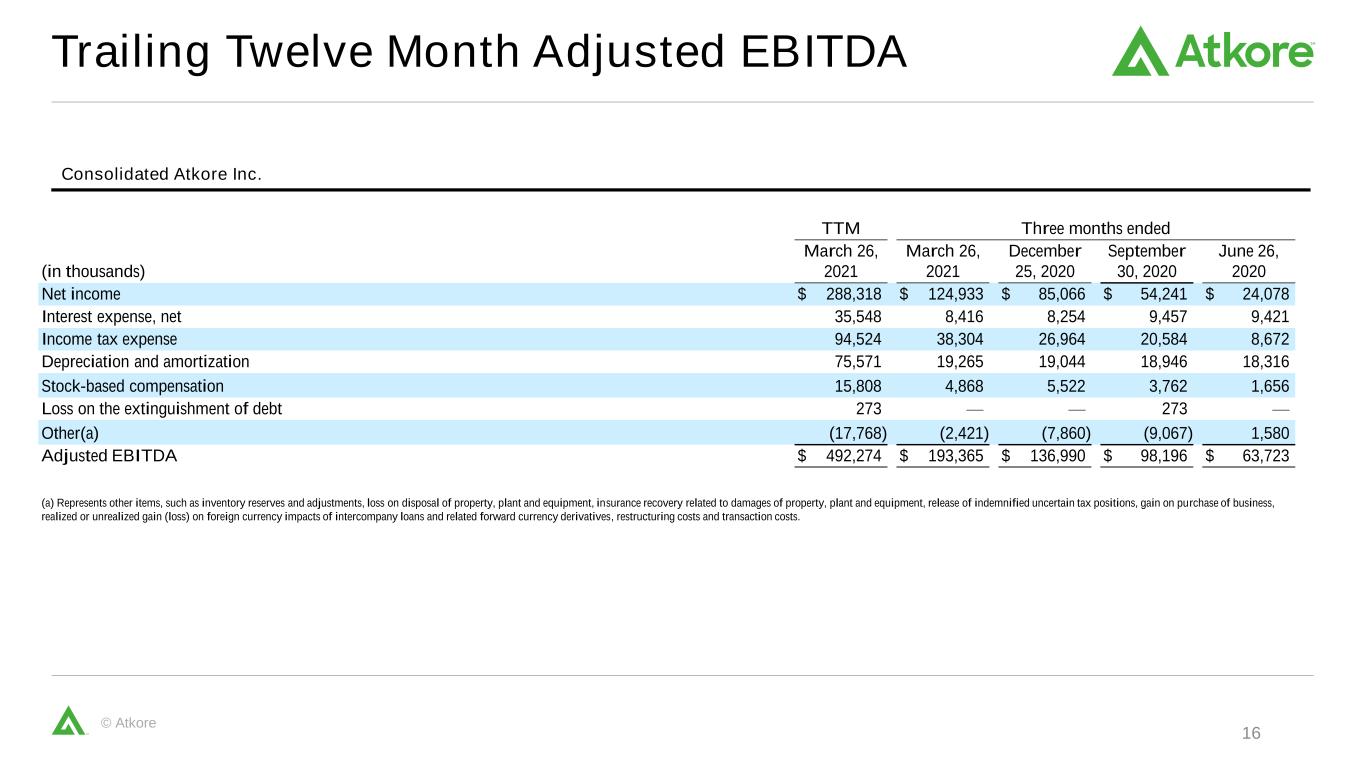
© Atkore Trailing Twelve Month Adjusted EBITDA Consolidated Atkore Inc. TTM Three months ended (in thousands) March 26, 2021 March 26, 2021 December 25, 2020 September 30, 2020 June 26, 2020 Net income $ 288,318 $ 124,933 $ 85,066 $ 54,241 $ 24,078 Interest expense, net 35,548 8,416 8,254 9,457 9,421 Income tax expense 94,524 38,304 26,964 20,584 8,672 Depreciation and amortization 75,571 19,265 19,044 18,946 18,316 Stock-based compensation 15,808 4,868 5,522 3,762 1,656 Loss on the extinguishment of debt 273 — — 273 — Other(a) (17,768) (2,421) (7,860) (9,067) 1,580 Adjusted EBITDA $ 492,274 $ 193,365 $ 136,990 $ 98,196 $ 63,723 (a) Represents other items, such as inventory reserves and adjustments, loss on disposal of property, plant and equipment, insurance recovery related to damages of property, plant and equipment, release of indemnified uncertain tax positions, gain on purchase of business, realized or unrealized gain (loss) on foreign currency impacts of intercompany loans and related forward currency derivatives, restructuring costs and transaction costs. 16
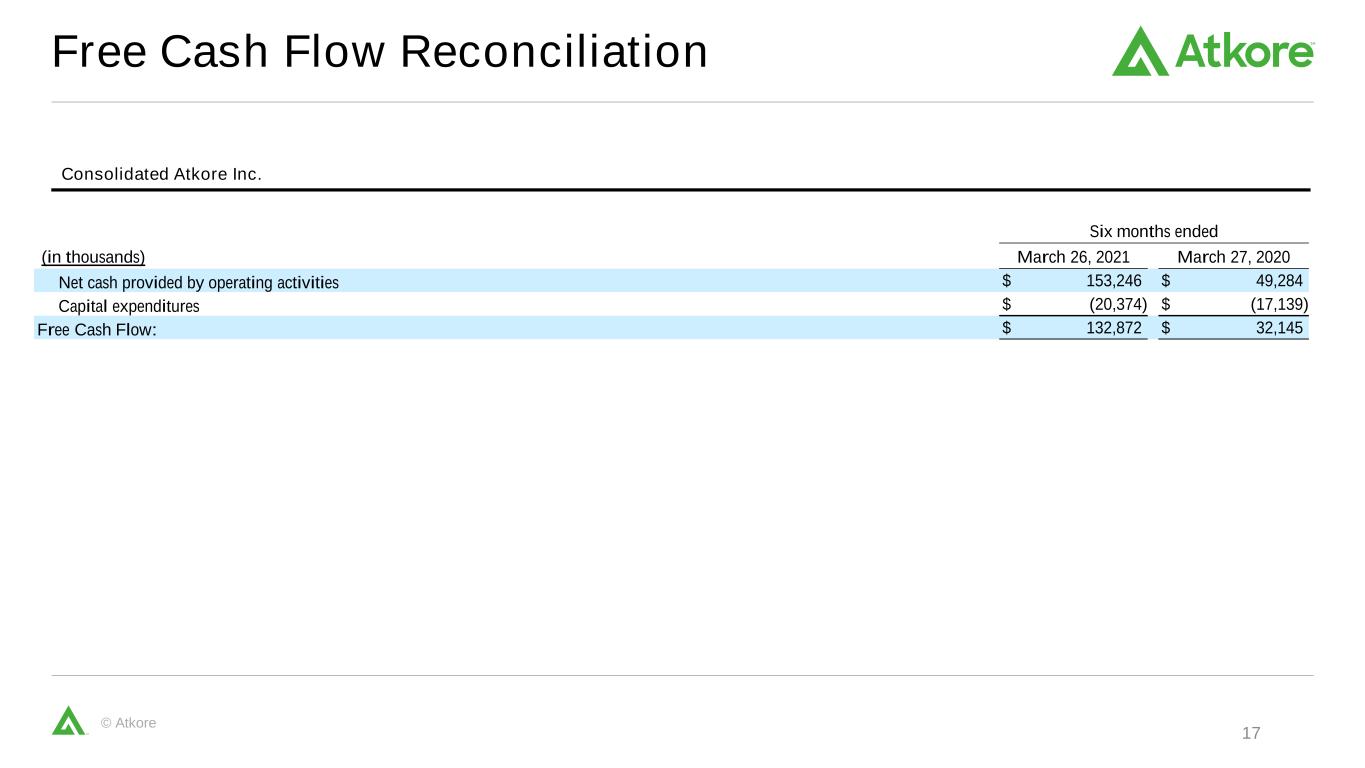
© Atkore Free Cash Flow Reconciliation Consolidated Atkore Inc. Six months ended (in thousands) March 26, 2021 March 27, 2020 Net cash provided by operating activities $ 153,246 $ 49,284 Capital expenditures $ (20,374) $ (17,139) Free Cash Flow: $ 132,872 $ 32,145 17
Thank you! atkore.com 16100 South Lathrop Avenue, Harvey, IL 60426 © Atkore Inc.
