Attached files
| file | filename |
|---|---|
| 8-K - FORM 8-K - STONERIDGE INC | tm2114505d1_8k.htm |
| EX-99.1 - EXHIBIT 99.1 - STONERIDGE INC | tm2114505d1_ex99-1.htm |

Q1 2021 Results April 29, 2021 Exhibit 99.2

2 Forward - Looking Statements Statements in this presentation that are not historical facts are forward - looking statements, which involve risks and uncertaint ies that could cause actual events or results to differ materially from those expressed or implied by the statements. Important factors that ma y cause actual results to differ materially from those in the forward - looking statements include, among other factors, the impact of COVID - 19, or other future pandemics, on the global economy, and on our customers, suppliers, employees, business and cash flows; the reduced purchases, lo ss or bankruptcy of a major customer or supplier; the costs and timing of facility closures, business realignment or similar action s; a significant change in automotive, commercial, off - highway, motorcycle and agricultural vehicle production; competitive market conditions and resulting effects on sales and pricing; our ability to successfully launch/produce products for awarded business; adverse changes in la ws, government regulations or market conditions, including tariffs, affecting our products or customers products; labor disruptions at Stone rid ge’s facilities or at any of Stoneridge’s significant customers or suppliers; the ability of suppliers to supply Stoneridge with parts and compo nen ts at competitive prices on a timely basis; the amount of Stoneridge’s indebtedness and the restrictive covenants contained in the agr eements governing its indebtedness, including its revolving credit facility; customer acceptance of new products; capital availabilit y o r costs, including changes in interest rates or market perceptions; the failure to achieve successful integration of any acquired company or bus ine ss; the occurrence or non - occurrence of circumstances beyond Stoneridge’s control; and the items described in “Risk Factors” and other uncertainties or risks discussed in Stoneridge’s periodic and current reports filed with the Securities and Exchange Commissi on. Important factors that could cause the performance of the commercial vehicle and automotive industry to differ materially fro m t hose in the forward - looking statements include factors such as (1) continued economic instability or poor economic conditions in the United States and global markets, (2) changes in economic conditions, housing prices, foreign currency exchange rates, commodity prices, includ ing shortages of and increases or volatility in the price of oil, (3) changes in laws and regulations, (4) the state of the credit markets, (5 ) political stability, (6) international conflicts and (7) the occurrence of force majeure events. These factors should not be construed as exhaustive and should be considered with the other cautionary statements in Stonerid ge’ s filings with the Securities and Exchange Commission. Forward - looking statements are not guarantees of future performance; Stoneridge’s actual results of operations, financial condit ion and liquidity, and the development of the industry in which Stoneridge operates may differ materially from those described in or sug gested by the forward - looking statements contained in this presentation. In addition, even if Stoneridge’s results of operations, financial co ndition and liquidity, and the development of the industry in which Stoneridge operates are consistent with the forward - looking statements c ontained in this presentation, those results or developments may not be indicative of results or developments in subsequent periods. This presentation contains time - sensitive information that reflects management’s best analysis only as of the date of this prese ntation. Any forward - looking statements in this presentation speak only as of the date of this presentation, and Stoneridge undertakes no obl igation to update such statements. Comparisons of results for current and any prior periods are not intended to express any future tren ds or indications of future performance, unless expressed as such, and should only be viewed as historical data. Stoneridge does not undertake any obligation to publicly update or revise any forward - looking statement as a result of new infor mation, future events or otherwise, except as otherwise required by law. Rounding Disclosure: There may be slight immaterial differences between figures represented in our public filings compared t o w hat is shown in this presentation. The differences are the result of rounding due to the representation of values in millions rathe r t han thousands in public filings.

3 Overview of Achievements x Strong 1 st quarter performance despite impact of global supply chain disruptions x Announced divestiture of soot sensor product lines (previously announced intention to exit the business) x Public announcements from two fleets, Maverick and Montgomery, announcing intention to install MirrorEye on 100% of new trucks x Announcing our partnership with PACCAR with the launch of our digital instrument cluster on their recently introduced heavy - and medium - duty trucks x Updating previously provided full - year 2021 guidance to exclude divested business and adjust for expectations of temporary, but continued and incremental, supply - chain related costs and unfavorable product mix x Maintaining revenue guidance due to Q1 outperformance and expectation that product portfolio will continue to outperform the market, offset by incremental forecasted production headwinds Q 1 2021 Financial Performance 2021 Adjusted Full - Year Guidance 2021 Guidance Previously Provided 2021 Guidance Updated* Adjusted Sales $770.0 – $790.0 million $770.0 – $790.0 million Adjusted Gross Margin 25.75% - 26.75% 25.25% - 26.25% Adjusted Operating Margin 3.5% - 4.25% 3.0% - 3.75% Adjusted Tax Rate 22.5% – 27.5% 22.5% – 27.5% Adjusted EPS $0.60 - $0.75 $0.47 - $0.62 Adjusted EBITDA Margin 8.0% - 8.75% 7.5% - 8.25% Reported Adjusted Sales $193.8 million $192.8 million Gross Profit Margin $46.1 million 23.8% $46.7 million 24.2% Operating Income Margin $2.1 million 1.1% $3.6 million 1.6% Tax Rate 76.2% 23.1% EPS $0.00 $0.06 EBITDA Margin $10.8 million 5.5% $12.2 million 6.4% *Updated guidance excludes the impact of the divested soot sensor business

4 Financial Summary Strong first quarter performance driven by continued focus on execution and overcoming externalities Q1 2020 vs. Q1 2021 Q4 2020 vs. Q1 2021 Adjusted Sales* Adjusted Gross Profit* Adjusted Operating Income* Adjusted EBITDA* Adjusted EPS* $’s in USD Millions *Excluding recently divested business in all periods presented. Refer to exhibits for reconciliations ▸ Q1 2021 sales favorably impacted by strong performance in commercial vehicle and off - highway end - markets and the favorable impact of foreign currency ▸ Adjusted sales in Q1 2021 includes favorable currency impact of approximately $4.0 million vs. Q1 2020 and approximately $1.1 million vs. Q4 2020 ▸ Macroeconomic headwinds and supply chain related constraints reduced operating performance ▸ ($2.7 million) impact Q1 2021 vs. prior expectation of approximately ($1.7 million) ▸ Continued focus on managing engineering and SG&A costs ▸ Costs in the quarter consistent with prior expectations Q 1 Financial Highlights* $180.6 $189.8 Q1 2020 Q1 2021 $187.3 $189.8 Q4 2020 Q1 2021 $49.5 $46.2 26.4% 24.3% 20% 30% 35 45 55 Q4 2020 Q1 2021 $46.8 $46.2 25.9% 24.3% 20% 35 55 Q1 2020 Q1 2021 $6.1 $3.0 3.4% 1.6% Q1 2020 Q1 2021 $6.6 $3.0 3.5% 1.6% Q4 2020 Q1 2021 $16.2 $11.7 9.0% 6.2% -5% 15% 0.0 20.0 Q1 2020 Q1 2021 $15.9 $11.7 8.5% 6.2% -5% 5% 15% 0.0 10.0 20.0 Q4 2020 Q1 2021 $0.20 $0.04 Q1 2020 Q1 2021 $0.13 $0.04 Q4 2020 Q1 2021
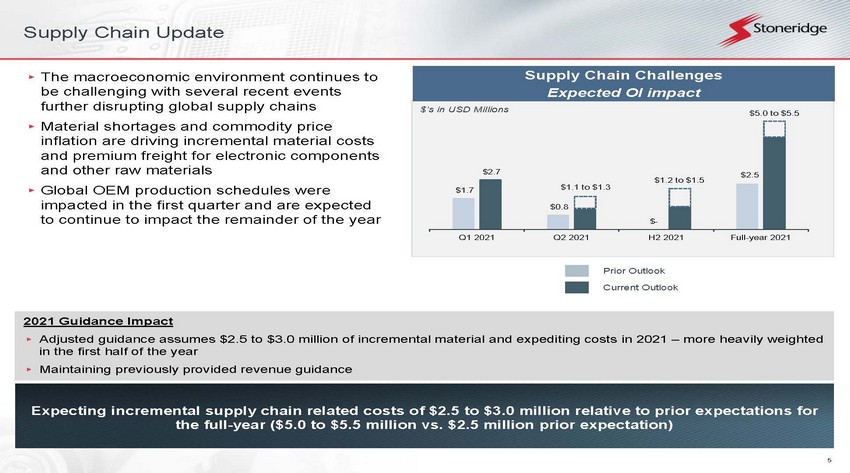
5 $1.7 $0.8 $ - $2.5 $2.7 $1.1 to $1.3 $1.2 to $1.5 $5.0 to $5.5 Q1 2021 Q2 2021 H2 2021 Full-year 2021 Supply Chain Update Expecting incremental supply chain related costs of $2.5 to $3.0 million relative to prior expectations for the full - year ($5.0 to $5.5 million vs. $2.5 million prior expectation) 2021 Guidance Impact ▸ Adjusted guidance assumes $2.5 to $3.0 million of incremental material and expediting costs in 2021 – more heavily weighted in the first half of the year ▸ Maintaining previously provided revenue guidance ▸ The macroeconomic environment continues to be challenging with several recent events further disrupting global supply chains ▸ Material shortages and commodity price inflation are driving incremental material costs and premium freight for electronic components and other raw materials ▸ Global OEM production schedules were impacted in the first quarter and are expected to continue to impact the remainder of the year Supply Chain Challenges Expected OI impact Prior Outlook Current Outlook $’s in USD Millions

6 Weighted average end market forecasts declined 1.0% for the full - year 2021 vs. previously provided production outlook 2021 Updated Volume Outlook Prior Outlook Current Outlook Passenger Car Forecast (Millions of Units) Commercial Vehicle Forecast (Thousands of Units) North America 40.0% of 2020 Sales Europe 4.6% of 2020 Sales China 7.9% of 2020 Sales North America 8.0% of 2020 Sales Europe 19.4% of 2020 Sales China 0.7% of 2020 Sales (5.1%) (10.0%) 1.5% 0.8% (3.2%) 1.2% (3.0%) (4.1%) (1.0%) (1.7%) 4.2% (3.2%) (1.6%) (0.9%) (0.5%) (2.6%) 1.9% 4.2% 8.6% 3.1% (2.6%) (2.6%) 1.5% 5.2% 0.5% 36.1% 11.7% (16.1%) (1.9%) 9.8% Source: Feb 2021 IHS, April 2021 IHS, Q4 2020 LMC, Q1 2021 LMC. 0 5 10 15 20 Q1 2021 Q2 2021 Q3 2021 Q4 2021 2021 0 5 10 15 20 Q1 2021 Q2 2021 Q3 2021 Q4 2021 2021 0 5 10 15 20 25 30 Q1 2021 Q2 2021 Q3 2021 Q4 2021 2021 0 200 400 600 Q1 2021 Q2 2021 Q3 2021 Q4 2021 2021 0 200 400 600 Q1 2021 Q2 2021 Q3 2021 Q4 2021 2021 0 500 1000 1500 2000 Q1 2021 Q2 2021 Q3 2021 Q4 2021 2021

7 Summary Summary x Strong first quarter financial performance despite significant costs related to global supply chain disruptions x Finalized divestiture of exited soot sensor product lines with clear timeline to exit x MirrorEye retrofit programs continue to expand – announced that two of our fleet partners intend to install MirrorEye on every new vehicle x Announced our partnership with PACCAR with the launch of our digital instrument cluster on their recently introduced heavy - and medium - duty trucks 2021 Outlook x We remain focused on executing our operational goals x Expecting temporary supply chain issues to continue – management team is focused on reducing and offsetting impact where possible x Continued expansion of our MirrorEye retrofit programs and pre - wire programs in anticipation of the first OEM launches in 2021 x Updated guidance due to recent changes in external market – maintaining previously communicated medium and long - term targets Driving shareholder value by executing on variables within our control, responding to factors that are out of our control and executing on our long - term strategy

8 Financial Update

9 1 st Quarter 2021 Financial Summary 1 st Quarter 2021 Financial Results Excluding divested product lines, adjusted sales of $189.8 million, an increase of 1.3% over Q4 2020 • Excluding divested product lines, Control Devices adjusted sales of $97.6 million, a decrease of 0.3% over Q4 2020 • Electronics sales of $88.7 million, an increase of 5.6% over Q4 2020 • Stoneridge Brazil sales of $11.4 million, a decrease of 14.0% over Q4 2020 Excluding divested product lines, adjusted operating income of $3.0 million (1.6% adjusted operating margin) a decrease of 53.9% over Q4 2020 • Excluding divested product lines, Control Devices adjusted operating income of $10.8 million (11.1% adjusted operating margin ), a decrease of 11.7% over Q4 2020 • Electronics adjusted operating loss of ($0.6) million ((0.7%) adjusted operating margin), a decrease of $5.0 million over Q4 202 0 • Stoneridge Brazil break - even adjusted operating income (0.2% adjusted operating margin), a decrease of $0.1 million over Q4 2020 2021 Updated Full - Year Guidance 2021 Guidance Previously Provided 2021 Guidance Updated* Adjusted Sales $770.0 – $790.0 million $770.0 – $790.0 million Adjusted Gross Margin 25.75% - 26.75% 25.25% - 26.25% Adjusted Operating Margin 3.5% - 4.25% 3.0% - 3.75% Adjusted Tax Rate 22.5% – 27.5% 22.5% – 27.5% Adjusted EPS $0.60 - $0.75 $0.47 - $0.62 Adjusted EBITDA Margin 8.0% - 8.75% 7.5% - 8.25% *Updated guidance excludes the impact of the divested soot sensor business Updated Guidance Summary Maintaining previously provided revenue guidance Revenue outperformance in Q1 and expectation that product portfolio will continue to outperform the underlying market, offset by updated production forecast headwinds Net impact of soot sensor divestiture / exit expected to be de minimis Adjusted EPS guidance considers 1Q outperformance reduced for incremental supply chain costs, unfavorable product mix and FX headwinds for the remainder of the year

10 Control Devices Financial Performance Focus on future profitable growth and continued operational improvement Navigating external headwinds Control Devices 2021 Expectations ▸ Continued transformation of manufacturing footprint and product portfolio to align with future growth opportunities ▸ Announced sale of soot sensor product lines and assets – exit expected to be completed by the end of 2021 ▸ Expecting global supply chain disruptions to create significant 1st half headwind, with some issues persisting for the remainder of the year – working with customers and suppliers to offset financial impact where possible Q1 2020 vs. Q1 2021 Q4 2020 vs. Q1 2021 Adjusted Sales* Adjusted Operating Income* $’s in USD Millions Control Devices Q1 Summary Adjusted sales inline with Q4 2020 and increased by 1.8% vs. Q1 2020, excluding divested soot sensor business Adjusted operating income, excluding the divested business, declined vs. Q4 2020 primarily due to ($1.1 million) unfavorable impact of global supply chain disruptions (~110 bps impact) *Adjusted results exclude divested business in all periods presented $95.8 $97.6 Q1 2020 Q1 2021 $97.9 $97.6 Q4 2020 Q1 2021 $10.0 $10.8 10.4% 11.1% Q1 2020 Q1 2021 $12.3 $10.8 12.5% 11.1% Q4 2020 Q1 2021

11 Electronics Financial Performance Expecting continued strong revenue growth Engineering investment, unfavorable mix and supply chain costs creating margin headwind in 2021 Electronics 2021 Expectations Continued gross margin headwinds as global supply chain issues continue to impact the business Unfavorable product mix headwind for the remainder of 2021 vs. prior expectations Incremental investment in engineering resources to support future program launches and technology development Expecting continued strong revenue growth as commercial vehicle and off - highway end - markets remain strong Q1 2020 vs. Q1 2021 Q4 2020 vs. Q1 2021 Sales Adjusted Operating Income $’s in USD Millions Electronics Q1 Summary Higher sales vs. Q4 2020 primarily due to higher sales in the off - highway end market The impact of currency exchange rates increased revenue by $6.5 million relative to Q1 2020 and by $1.0 million relative to Q4 2020 Q1 adjusted operating margin declined due to costs related to supply chain issues (~150 bps), unfavorable product mix and higher engineering costs as compared to prior periods $2.9 ($0.7) 3.6% - 0.7% Q1 2020 Q1 2021 $84.1 $88.7 Q4 2020 Q1 2021 $79.8 $88.7 Q1 2020 Q1 2021 $4.3 ($0.7) 5.2% - 0.7% Q4 2020 Q1 2021

12 Stoneridge Brazil Financial Performance Expecting stable revenue and margin performance despite continued macroeconomic challenges Focus remains on supporting global Electronics business Stoneridge Brazil 2021 Expectations Revenue and operating margin expected to remain approximately flat in 2021 based on current market conditions Focus remains on utilizing engineering resources to support global Electronics business and ramping up local OEM business to offset challenging overall macroeconomic conditions Stoneridge Brazil Q1 Summary Macroeconomic market conditions remain challenging The impact of currency exchange rates reduced revenue by ($3.1 million) relative to Q1 2020 and by ($0.2 million) relative to Q4 2020 Adjusted gross margin improved by 200 basis points vs. Q4 2020, despite supply chain headwinds negatively impacting margin by 190 bps Adjusted operating margin decreased vs. Q4 2020 primarily due to leverage on SG&A costs with reduced revenue $’s in USD Millions Q1 2020 vs. Q1 2021 Q4 2020 vs. Q1 2021 Sales Adjusted Operating Income $14.6 $11.4 Q1 2020 Q1 2021 $0.4 $0.0 2.6% 0.2% Q1 2020 Q1 2021 $0.1 $0.0 1.1% 0.2% Q4 2020 Q1 2021 $13.3 $11.4 Q4 2020 Q1 2021 $’s in USD Millions

13 Incremental Supply Chain Related Costs ~($0.07) – ($0.08) 2021 Adjusted EPS Guidance 2021 Guidance Previously Provided Drivers of 2021 Adjusted EPS Guidance $0.60 - $0.75 $0.47 - $0.62 2021 Guidance Updated Guidance adjusted to reflect 1Q outperformance offset by continued external headwinds and unfavorable product mix Net expected impact of soot sensor divestiture / exit on 2021 adjusted EPS guidance expected to be de minimis 1Q adjusted EPS outperformance vs. previously outlined expectation of break - even quarter Product mix headwind for the remainder of the year based on current forecasted production Expecting temporary, but continued and incremental, supply chain pressure for the remainder of the year relative to prior exp ect ations SG&A and engineering expenses remain on - track with prior expectations Forecasted foreign currency exchange rates create slight headwind for remainder of 2021 relative to prior guidance Product Mix ~($0.07) – ($0.08) Operating Expenses FX and Other ~($0.04) 1Q Outperformance $0.06 Net Impact of Soot Sensor Product Line Divestiture / Exit
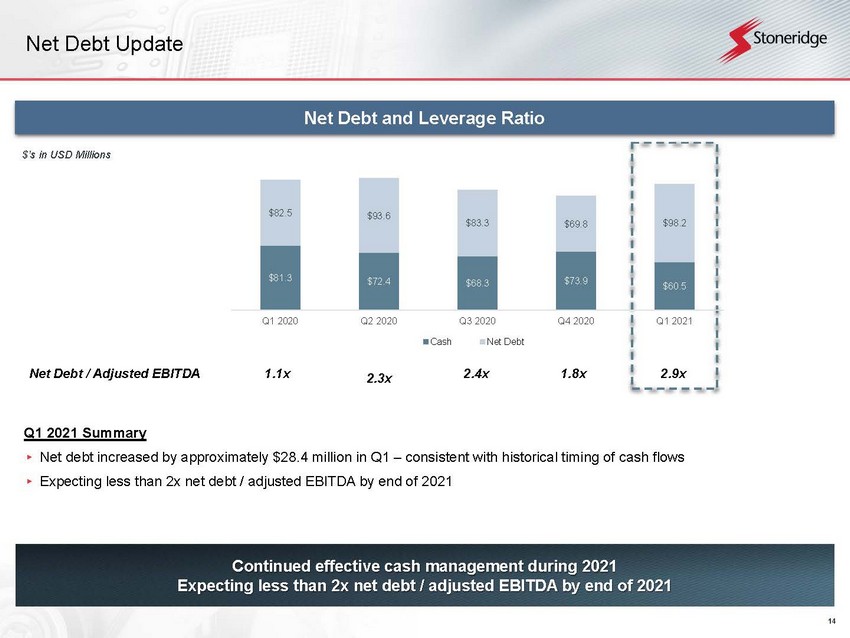
14 Net Debt Update Continued effective cash management during 2021 Expecting less than 2x net debt / adjusted EBITDA by end of 2021 Q1 2021 Summary ▸ Net debt increased by approximately $28.4 million in Q1 – consistent with historical timing of cash flows ▸ Expecting less than 2x net debt / adjusted EBITDA by end of 2021 2.3x 1.1x 2.9x 1.8x Net Debt / Adjusted EBITDA 2.4x Net Debt and Leverage Ratio $’s in USD Millions $81.3 $72.4 $68.3 $73.9 $60.5 $82.5 $93.6 $83.3 $69.8 $98.2 Q1 2020 Q2 2020 Q3 2020 Q4 2020 Q1 2021 Cash Net Debt

15 Summary 2021 Q1 Summary ▸ Control Devices – Strong sales and operating performance in Q1 despite global supply chain related headwinds. Continued transformation by finalizing the divestiture of the soot sensor business. ▸ Electronics – Continued strong sales growth during the quarter. Global supply chain related headwinds, unfavorable product mix and continued investment in engineering resources contributing to lower operating performance. ▸ Stoneridge Brazil – Despite reduced sales, adjusted gross margin improved vs. Q4 2020. Continued focus on cost management improved operating results during the quarter. 2021 Outlook and Guidance ▸ Maintaining previously provided full - year 2021 adjusted revenue guidance of $770.0 to $790.0 million • Maintaining revenue guidance due to Q1 outperformance and expectation that product portfolio will continue to outperform the underlying market, offset by incremental forecasted production headwinds ▸ Reducing adjusted EPS guidance by ($0.13) to a mid - point of $0.55 • Adjusted EPS guidance considers 1Q outperformance reduced for incremental supply chain costs, unfavorable product mix and FX headwinds for the remainder of the year Adapting and responding to challenging macroeconomic conditions to deliver strong results and drive shareholder value

16 Appendix
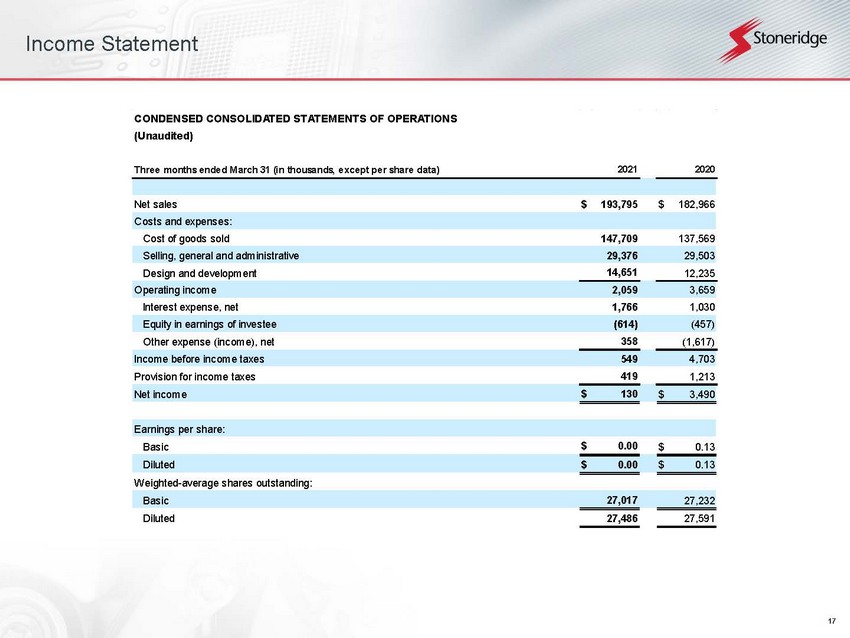
17 Income Statement CONDENSED CONSOLIDATED STATEMENTS OF OPERATIONS (Unaudited) Three months ended March 31 (in thousands, except per share data) Net sales $ 193,795 $ 182,966 Costs and expenses: Cost of goods sold 147,709 137,569 Selling, general and administrative 29,376 29,503 Design and development 14,651 12,235 Operating income 2,059 3,659 Interest expense, net 1,766 1,030 Equity in earnings of investee (614) (457) Other expense (income), net 358 (1,617) Income before income taxes 549 4,703 Provision for income taxes 419 1,213 Net income $ 130 $ 3,490 Earnings per share: Basic $ 0.00 $ 0.13 Diluted $ 0.00 $ 0.13 Weighted-average shares outstanding: Basic 27,017 27,232 Diluted 27,486 27,591 2021 2020
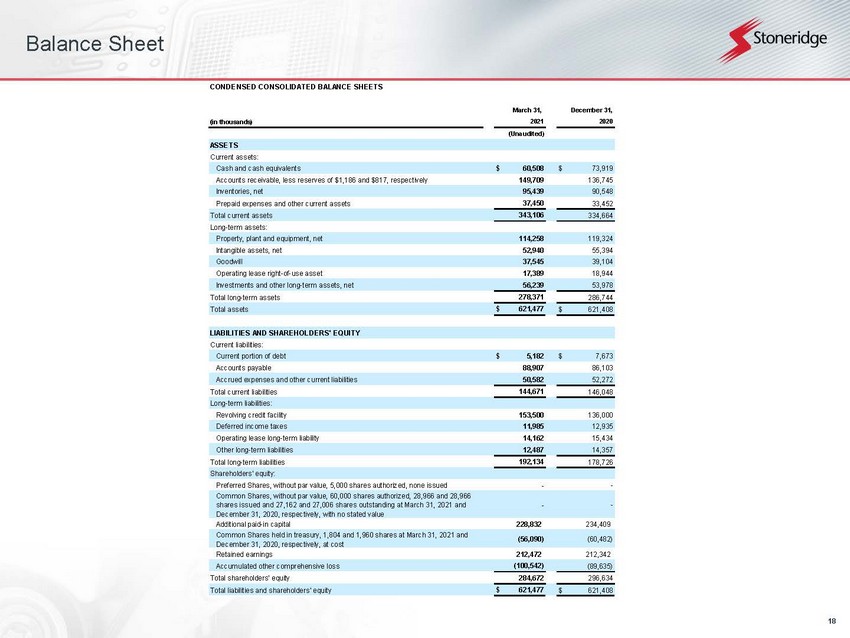
18 Balance Sheet CONDENSED CONSOLIDATED BALANCE SHEETS (in thousands) (Unaudited) ASSETS Current assets: Cash and cash equivalents $ 60,508 $ 73,919 Accounts receivable, less reserves of $1,186 and $817, respectively 149,709 136,745 Inventories, net 95,439 90,548 Prepaid expenses and other current assets 37,450 33,452 Total current assets 343,106 334,664 Long-term assets: Property, plant and equipment, net 114,258 119,324 Intangible assets, net 52,940 55,394 Goodwill 37,545 39,104 Operating lease right-of-use asset 17,389 18,944 Investments and other long-term assets, net 56,239 53,978 Total long-term assets 278,371 286,744 Total assets $ 621,477 $ 621,408 LIABILITIES AND SHAREHOLDERS' EQUITY Current liabilities: Current portion of debt $ 5,182 $ 7,673 Accounts payable 88,907 86,103 Accrued expenses and other current liabilities 50,582 52,272 Total current liabilities 144,671 146,048 Long-term liabilities: Revolving credit facility 153,500 136,000 Deferred income taxes 11,985 12,935 Operating lease long-term liability 14,162 15,434 Other long-term liabilities 12,487 14,357 Total long-term liabilities 192,134 178,726 Shareholders' equity: Preferred Shares, without par value, 5,000 shares authorized, none issued - - Common Shares, without par value, 60,000 shares authorized, 28,966 and 28,966 shares issued and 27,162 and 27,006 shares outstanding at March 31, 2021 and December 31, 2020, respectively, with no stated value - - Additional paid-in capital 228,832 234,409 Common Shares held in treasury, 1,804 and 1,960 shares at March 31, 2021 and December 31, 2020, respectively, at cost (56,090) (60,482) Retained earnings 212,472 212,342 Accumulated other comprehensive loss (100,542) (89,635) Total shareholders' equity 284,672 296,634 Total liabilities and shareholders' equity $ 621,477 $ 621,408 2021 2020 March 31, December 31,

19 Statement of Cash Flows CONDENSED CONSOLIDATED STATEMENTS OF CASH FLOWS (Unaudited) Three months ended March 31 (in thousands) OPERATING ACTIVITIES: Net income $ 130 $ 3,490 Adjustments to reconcile net income to net cash provided by (used for) operating activities: Depreciation 7,068 6,650 Amortization, including accretion and write-off of deferred financing costs 1,513 1,429 Deferred income taxes (1,609) 76 Earnings of equity method investee (614) (418) (Gain) loss on sale of fixed assets (37) 131 Share-based compensation expense 1,162 1,372 Excess tax (benefit) deficiency related to share-based compensation expense (319) 17 Gain on disposal of business, net (739) - Change in fair value of earn-out contingent consideration 72 (633) Changes in operating assets and liabilities: Accounts receivable, net (15,953) (3,730) Inventories, net (7,282) (5,838) Prepaid expenses and other assets (4,744) (3,702) Accounts payable 6,725 2,327 Accrued expenses and other liabilities (2,439) (7,733) Net cash used for operating activities (17,066) (6,562) INVESTING ACTIVITIES: Capital expenditures, including intangibles (7,718) (7,140) Proceeds from sale of fixed assets 155 8 Proceeds from disposal of business, net 1,050 - Investment in venture capital fund, net (399) - Net cash used for investing activities (6,912) (7,132) 2021 2020
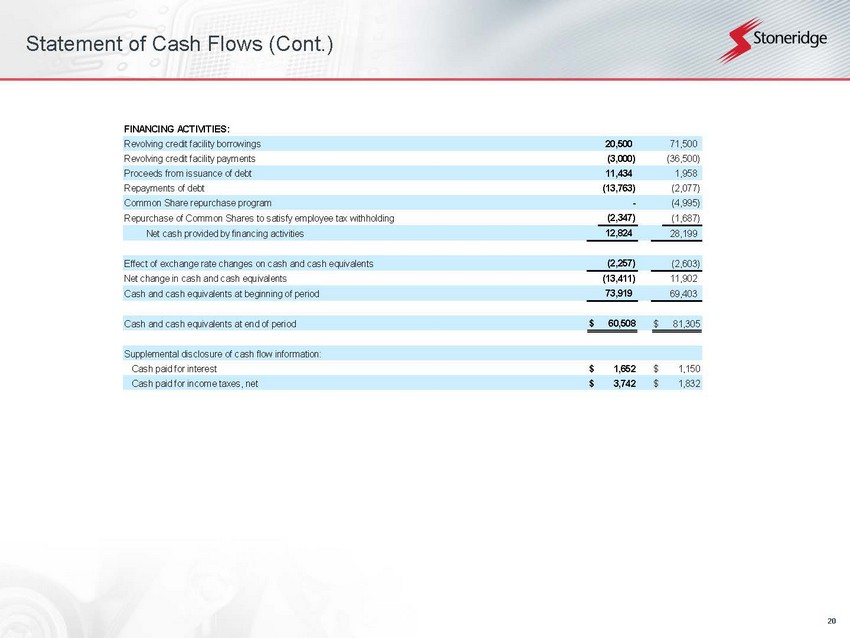
20 Statement of Cash Flows (Cont.) FINANCING ACTIVITIES: Revolving credit facility borrowings 20,500 71,500 Revolving credit facility payments (3,000) (36,500) Proceeds from issuance of debt 11,434 1,958 Repayments of debt (13,763) (2,077) Common Share repurchase program - (4,995) Repurchase of Common Shares to satisfy employee tax withholding (2,347) (1,687) Net cash provided by financing activities 12,824 28,199 Effect of exchange rate changes on cash and cash equivalents (2,257) (2,603) Net change in cash and cash equivalents (13,411) 11,902 Cash and cash equivalents at beginning of period 73,919 69,403 Cash and cash equivalents at end of period $ 60,508 $ 81,305 Supplemental disclosure of cash flow information: Cash paid for interest $ 1,652 $ 1,150 Cash paid for income taxes, net $ 3,742 $ 1,832

21 Segment Financial Information (A) Unallocated Corporate expenses include, among other items, accounting/finance, human resources, information technology an d legal costs as well as share - based compensation. (B) These amounts represent depreciation and amortization on property, plant and equipment and certain intangible assets. (C) Assets located at Corporate consist primarily of cash, intercompany loan receivables, fixed assets for the corporate headq uarter building, leased assets, information technology assets, equity investments and investments in subsidiaries. Three months ended March 31 Net Sales: Control Devices $ 99,618 $ 96,850 Inter-segment sales 1,980 1,347 Control Devices net sales 101,598 98,197 Electronics 82,770 71,546 Inter-segment sales 5,979 8,268 Electronics net sales 88,749 79,814 Stoneridge Brazil 11,407 14,570 Inter-segment sales - - Stoneridge Brazil net sales 11,407 14,570 Eliminations (7,959) (9,615) Total net sales $ 193,795 $ 182,966 Operating Income (Loss): Control Devices $ 10,165 $ 7,322 Electronics (873) 2872 Stoneridge Brazil (48) 859 Unallocated Corporate (A) (7185) (7394) Total operating income $ 2,059 $ 3,659 Depreciation and Amortization: Control Devices $ 4,079 $ 3,530 Electronics 2,809 2,481 Stoneridge Brazil 1,004 1,450 Unallocated Corporate 689 526 Total depreciation and amortization (B) $ 8,581 $ 7,987 Interest Expense (Income), net: Control Devices $ 132 $ 81 Electronics 131 87 Stoneridge Brazil (30) 10 Unallocated Corporate 1,533 852 Total interest expense, net $ 1,766 $ 1,030 Capital Expenditures: Control Devices $ 1,361 $ 2,314 Electronics 3,450 2,650 Stoneridge Brazil 662 1,133 Unallocated Corporate (C) 501 572 Total capital expenditures $ 5,974 $ 6,669 2021 2020

22 Reconciliations to US GAAP
23 Reconciliations to US GAAP This document contains information about Stoneridge's financial results which is not presented in accordance with accounting principles generally accepted in the United States ("GAAP"). Such non - GAAP financial measures are reconciled to their closest GAAP financial measures in the appendix of this document. The provision of these non - GAAP financial measures is not intended to indicate that Stoneridge is explicitly or implicitly providing projections on those non - GAAP financial measures, and actual results for such measures are likely to vary from those presented. The reconciliations include all information reasonably available to the Company at the date of this document and the adjustments that management can reasonably predict.

24 Reconciliations to US GAAP Reconciliation of Q1 2021 Adjusted EPS (USD in millions) Q1 2021 Q1 2021 EPS Net Income 0.1$ 0.0$ Less: After-Tax Change in Fair Value of Earn-Out (Stoneridge Brazil) 0.1 0.00 Add: After-Tax Restructuring Costs 1.5 0.05 Add: After-Tax Business Realignment Costs 0.2 0.01 Less: After-Tax Gain from Disposal of Soot Sensor Business (0.6) (0.02) Less: After-Tax One-Time Sale of Soot Sensor Product Inventory (0.1) (0.00) Add: After-Tax Environmental Remediation Costs 0.3 0.01 Adjusted Net Income 1.6$ 0.06$ Reconciliation of Q1 2020 Adjusted EPS (USD in millions) Q1 2020 Q1 2020 EPS Net Income 3.5$ 0.13$ Less: After-Tax Change in Fair Value of Earn-Out (Stoneridge Brazil) (0.6) (0.02) Add: After-Tax Restructuring Costs 1.7 0.06 Add: After-Tax Share-Based Comp Accelerated Vesting 0.1 0.00 Add: After-Tax Loss in Autotech Fund Investment 0.0 0.00 Add: After-Tax Impact of Valuation Allowance 0.3 0.01 Add: After-Tax Business Realignment Costs 0.5 0.02 Adjusted Net Income 5.5$ 0.20$ Reconciliation of Q4 2020 Adjusted EPS (USD in millions) Q4 2020 Q4 2020 EPS Net Income 3.6$ 0.13$ Less: After-Tax Change in Fair Value of Earn-Out (Stoneridge Brazil) (0.2) (0.01) Add: After-Tax Restructuring Costs 0.7 0.03 Add: After-Tax Loss in Autotech Fund Investment 0.1 0.00 Add: After-Tax Impact of Valuation Allowance (1.0) (0.04) Add: After-Tax Business Realignment Costs 0.4 0.02 Adjusted Net Income 3.7$ 0.14$

25 Reconciliations to US GAAP Reconciliation of Adjusted Operating Income (USD in millions) Q1 2020 Q4 2020 Q1 2021 Operating Income 3.7$ 5.7$ 2.1$ Add(Less): Pre-Tax Change in Fair Value of Earn-Out (Stoneridge Brazil) (0.6) (0.2) 0.1 Add(Less): Pre-Tax Loss (Earnings) in Autotech Fund Investment 0.0 0.2 - Add: Pre-Tax Restructuring Costs 2.2 0.8 1.6 Add: Pre-Tax Share-Based Comp Accelerated Vesting 0.1 - - Add: Pre-Tax Business Realignment Costs 0.6 0.4 0.2 Less: Pre-Tax Gain from Disposal of Soot Sensor Business - - (0.7) Less: Pre-Tax One-Time Sale of Soot Sensor Product Inventory - - (0.1) Add: Pre-Tax Environmental Remediation Costs - - 0.4 Adjusted Operating Income 6.0$ 7.0$ 3.6$ Reconciliation of Adjusted Gross Profit (USD in millions) Q1 2020 Q4 2020 Q1 2021 Gross Profit 45.4$ 49.6$ 46.1$ Add: Pre-Tax Restructuring Costs 1.5 0.3 0.6 Less: Pre-Tax One-Time Sale of Soot Sensor Product Inventory - - (0.1) Add: Pre-Tax Business Realignment Costs 0.1 0.1 - Adjusted Gross Profit 47.0$ 50.0$ 46.7$

26 Reconciliations to US GAAP Reconciliation of Adjusted EBITDA (USD in millions) Q1 2020 Q4 2020 Q1 2021 Income (Loss) Before Tax 4.7$ 4.5$ 0.5$ Interest expense, net 1.0 1.8 1.8 Depreciation and amortization 8.1 8.6 8.4 EBITDA 13.8$ 14.9$ 10.8$ Add(Less): Pre-Tax Change in Fair Value of Earn-Out (Stoneridge Brazil) (0.6) (0.2) 0.1 Add(Less): Pre-Tax Loss (Earnings) in Autotech Fund Investment 0.0 0.2 - Add: Pre-Tax Restructuring Costs 2.2 0.8 1.6 Add: Pre-Tax Business Realignment Costs 0.6 0.4 0.2 Less: Pre-Tax Gain from Disposal of Soot Sensor Products - - (0.7) Add: Pre-Tax Share-Based Comp Accelerated Vesting 0.1 - - Less: Pre-Tax One-Time Sale of Soot Sensor Product Inventory - - (0.1) Add: Pre-Tax Environmental Remediation Costs - - 0.4 Adjusted EBITDA 16.1$ 16.2$ 12.2$

27 Reconciliations to US GAAP Reconciliation of Q1 2021 Adjusted Tax Rate (USD in millions) Q1 2021 Income Before Tax 0.5$ Add: Pre-Tax Change in Fair Value of Earn-Out (Stoneridge Brazil) 0.1 Add: Pre-Tax Restructuring Costs 1.6 Add: Pre-Tax Business Realignment Costs 0.2 Less: Pre-Tax Gain from Disposal of Soot Sensor Business (0.7) Less: Pre-Tax One-Time Sale of Soot Sensor Product Inventory (0.1) Add: Pre-Tax Environmental Remediation Costs 0.4 Adjusted Income Before Tax 2.0$ Income Tax Expense 0.4$ Add: Tax Impact From Pre-Tax Adjustments 0.1 Adjusted Income Tax Expense 0.5$ Adjusted Tax Rate 23.1%

28 Reconciliations to US GAAP Reconciliation of Stoneridge Brazil Adjusted Operating Income (Loss) (USD in millions) Q1 2020 Q4 2020 Q1 2021 Stoneridge Brazil Operating Income (Loss) 0.9$ 0.3$ (0.0)$ Add(Less): Pre-Tax Change in Fair Value of Earn-Out (Stoneridge Brazil) (0.6) (0.2) 0.1 Add: Pre-Tax Business Realignment Costs 0.2 0.1 - Stoneridge Brazil Adjusted Operating Income 0.4$ 0.1$ 0.0$ Reconciliation of Control Devices Adjusted Operating Income (USD in millions) Q1 2020 Q4 2020 Q1 2021 Control Devices Operating Income 7.3$ 12.0$ 10.2$ Add: Pre-Tax Restructuring Costs 2.2 0.6 1.4 Less: Pre-Tax Gain from Disposal of Soot Sensor Business - - (0.7) Add: Pre-Tax Business Realignment Costs 0.4 0.1 0.2 Less: Pre-Tax One-Time Sale of Soot Sensor Product Inventory - - (0.1) Add: Pre-Tax Environmental Remediation Costs - - 0.4 Control Devices Adjusted Operating Income 9.9$ 12.6$ 11.4$ Reconciliation of Electronics Adjusted Operating Income (Loss) (USD in millions) Q1 2020 Q4 2020 Q1 2021 Electronics Operating Income (Loss) 2.9$ 3.9$ (0.9)$ Add: Pre-Tax Restructuring Costs 0.0 0.2 0.2 Add: Pre-Tax Business Realignment Costs - 0.3 0.0 Electronics Adjusted Operating Income (Loss) 2.9$ 4.3$ (0.7)$

29 Reconciliations to US GAAP Reconciliation of Adjusted Sales (USD in millions) Q1 2020 Q4 2020 Q1 2021 Sales 183.0$ 189.7$ 193.8$ Less: Pre-Tax One-Time Sale of Soot Sensor Product Inventory - - (1.0) Adjusted Sales 183.0$ 189.7$ 192.8$ Reconciliation of Adjusted Gross Profit Excluding Disposed Soot Sensor Business (USD in millions) Q1 2020 Q4 2020 Q1 2021 Adjusted Gross Profit 47.0$ 50.0$ 46.7$ Less: Pre-Tax Gain from Disposed Soot Sensor Business (0.2) (0.5) (0.5) Adjusted Gross Profit Excluding Disposed Soot Sensor Business 46.8$ 49.5$ 46.2$ Reconciliation of Adjusted Sales Excluding Disposed Soot Sensor Business (USD in millions) Q1 2020 Q4 2020 Q1 2021 Adjusted Sales 183.0$ 189.7$ 192.8$ Less: Pre-Tax Sales from Disposed Soot Sensor Business (2.4) (2.5) (3.0) Adjusted Sales Excluding Disposed Soot Sensor Business 180.6$ 187.3$ 189.8$ Reconciliation of Adjusted Operating Income Excluding Disposed Soot Sensor Business (USD in millions) Q1 2020 Q4 2020 Q1 2021 Adjusted Operating Income 6.0$ 7.0$ 3.6$ Add(Less): Pre-Tax Loss (Gain) from Disposed Soot Sensor Business 0.1 (0.4) (0.5) Adjusted Operating Income Excluding Disposed Soot Sensor Business 6.1$ 6.6$ 3.0$

30 Reconciliations to US GAAP Reconciliation of Adjusted EPS Excluding Disposed Soot Sensor Business (USD in millions) Q1 2020 Q4 2020 Q1 2021 Adjusted EPS 0.20$ 0.14$ 0.06$ Less: EPS attributable to Disposed Soot Sensor Business (0.00) (0.01) (0.02) Adjusted EPS Excluding Disposed Soot Sensor Business 0.20$ 0.13$ 0.04$ Reconciliation of Adjusted EBITDA Excluding Disposed Soot Sensor Products (USD in millions) Q1 2020 Q4 2020 Q1 2021 Adjusted EBITDA 16.1$ 16.2$ 12.2$ Add(Less): Pre-Tax Loss (Gain) from Disposed Soot Sensor Business 0.1 (0.4) (0.5) Adjusted EBITDA Excluding Disposed Soot Sensor Products 16.2$ 15.9$ 11.7$

31 Reconciliations to US GAAP Reconciliation of Control Devices Adjusted Sales Excluding Disposed Soot Sensor Business (USD in millions) Q1 2020 Q4 2020 Q1 2021 Adjusted Control Devices Sales 98.2$ 100.4$ 100.6$ Less: Sales from Disposed Soot Sensor Business (2.4) (2.5) (3.0) Adjusted Control Devices Sales Excluding Disposed Soot Sensor Business 95.8$ 97.9$ 97.6$ Reconciliation of Control Devices Adjusted Sales (USD in millions) Q1 2020 Q4 2020 Q1 2021 Control Devices Sales 98.2$ 100.4$ 101.6$ Less: Pre-Tax One-Time Sale of Soot Sensor Product Inventory - - (1.0) Adjusted Control Devices Sales 98.2$ 100.4$ 100.6$ Reconciliation of Control Devices Adjusted Operating Income Excluding Disposed Soot Sensor Business (USD in millions) Q1 2020 Q4 2020 Q1 2021 Adjusted Operating Income 9.9$ 12.6$ 11.4$ Add(Less): Pre-Tax Loss (Gain) from Disposed Soot Sensor Business 0.1 (0.4) (0.5) Adjusted Operating Income Excluding Disposed Soot Sensor Business 10.0$ 12.3$ 10.8$