Attached files
| file | filename |
|---|---|
| 8-K - FORM 8-K - Cyxtera Technologies, Inc. | tm2114398d1_8k.htm |
| EX-99.2 - EXHIBIT 99.2 - Cyxtera Technologies, Inc. | tm2114398d1_ex99-2.htm |
| EX-99.1 - EXHIBIT 99.1 - Cyxtera Technologies, Inc. | tm2114398d1_ex99-1.htm |
Exhibit 99.3
| Earnings Conference Call Review of Cyxtera Technologies, Inc. FY 2020 Results |
| Disclaimer 2 Cyxtera Technologies, Inc.(“Cyxtera” or the “Company”) is pleased to present the following financial information (the “Disclosure”) for your review and consideration. This presentation and the information contained herein is being provided by on a voluntary basis to assist you with your ongoing independent evaluation of the Company. We are not required to provide this presentation or any of the information contained herein by the terms of any agreement we have with you. As such, we make no representation or warranty with respect to such information, and by receipt of this presentation (and as a condition to your receipt of this presentation) you acknowledge and agree that no such representation or warranty is being made and release us from any liability with respect thereto. You further acknowledge and agree that you will not rely on any information contained herein, you need to conduct your own thorough ongoing investigation of our business and to exercise your own independent due diligence with respect to our business and the statements set forth herein, we shall be fully exculpated with respect to any liability related to the use and the content of this presentation and you agree (as a condition to its receipt) not to assert any claim with respect thereto. Some of the statements herein constitute "forward-looking statements" that do not directly or exclusively relate to historical facts. These forward-looking statements reflect our intentions, plans, expectations, assumptions and beliefs about future events and are subject to risks (including regulatory risks), uncertainties and other factors, many of which are outside of our control. Important factors that could cause actual results to differ materially from the expectations expressed or implied in the forward-looking statements include known and unknown risks. Because actual results could differ materially from our intentions, plans, expectations, assumptions and beliefs about the future, you are urged to view all forward-looking statements contained herein with caution. We do not undertake any obligation to update or revise any forward-looking statements, whether as a result of new information, future events or otherwise. This presentation and the information contained herein is strictly confidential. By receipt of this presentation, you agree that such information is subject to the confidentiality provisions of the credit agreement and, in addition, not to disclose the information contained herein under any circumstances, not to share any information contained herein with any other person, and to use such information only in connection with your ongoing evaluation of our business. Note: References to Adjusted EBITDA throughout this presentation refer to Credit Agreement Adjusted EBITDA. See Cyxtera Selected Financial Data for a reconciliation of Adj. EBTIDA and Adj. EBITDAR to Net Income /(Loss). Cyxtera Contacts Carlos Sagasta Chief Financial Officer carlos.sagasta@cyxtera.com (305) 537-9500 Nathan Berlinski VP of Corporate Development nathan.berlinski@cyxtera.com (305) 537-9500 |
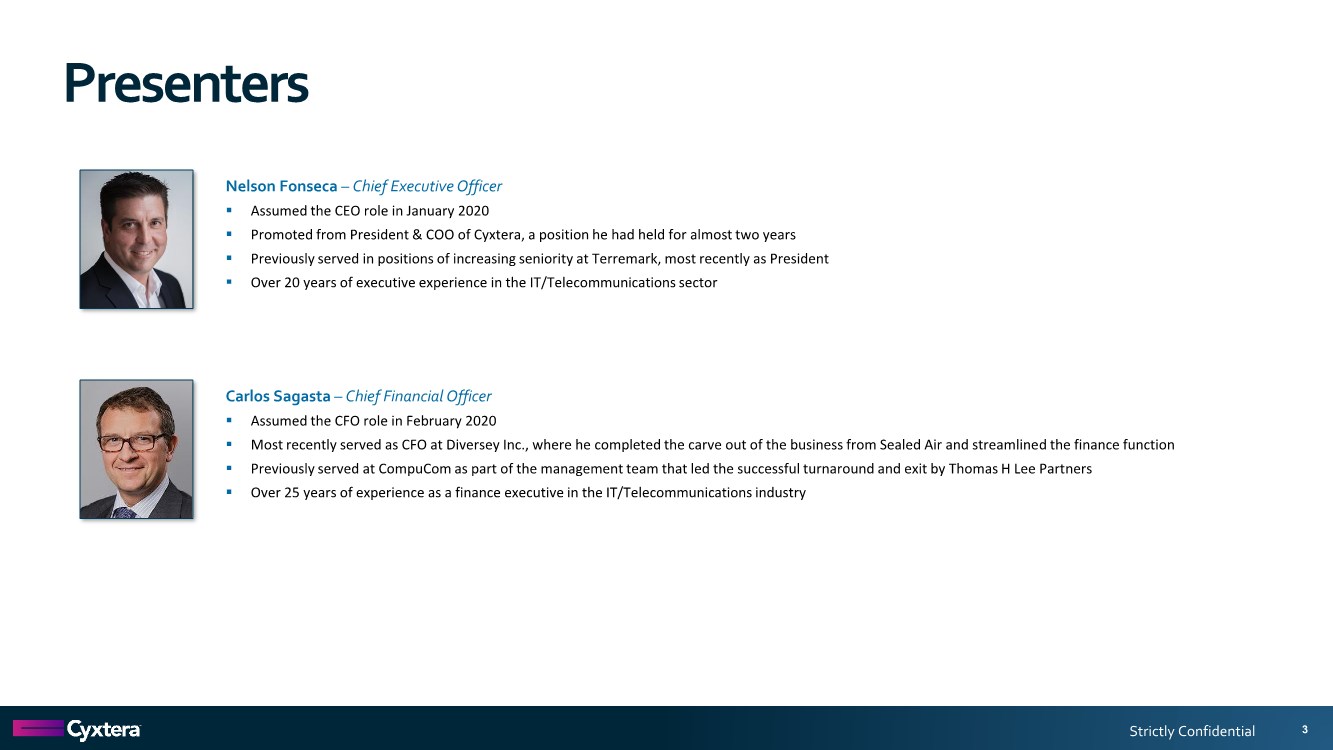
| Strictly Confidential Presenters 3 Nelson Fonseca – Chief Executive Officer ▪ Assumed the CEO role in January 2020 ▪ Promoted from President & COO of Cyxtera, a position he had held for almost two years ▪ Previously served in positions of increasing seniority at Terremark, most recently as President ▪ Over 20 years of executive experience in the IT/Telecommunications sector Carlos Sagasta – Chief Financial Officer ▪ Assumed the CFO role in February 2020 ▪ Most recently served as CFO at Diversey Inc., where he completed the carve out of the business from Sealed Air and streamlined the finance function ▪ Previously served at CompuCom as part of the management team that led the successful turnaround and exit by Thomas H Lee Partners ▪ Over 25 years of experience as a finance executive in the IT/Telecommunications industry |
| Strategic Review & Highlights |
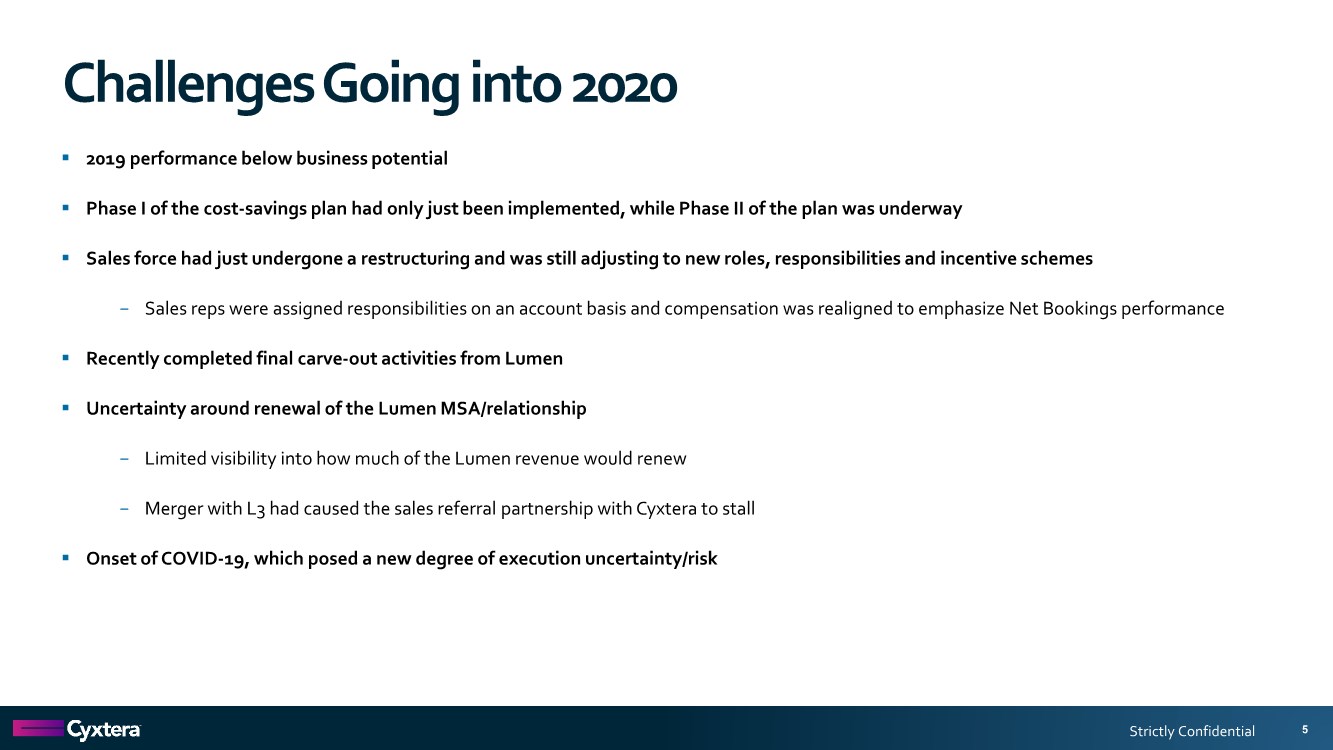
| Strictly Confidential Challenges Going into 2020 5 ▪ 2019 performance below business potential ▪ Phase I of the cost-savings plan had only just been implemented, while Phase II of the plan was underway ▪ Sales force had just undergone a restructuring and was still adjusting to new roles, responsibilities and incentive schemes − Sales reps were assigned responsibilities on an account basis and compensation was realigned to emphasize Net Bookings performance ▪ Recently completed final carve-out activities from Lumen ▪ Uncertainty around renewal of the Lumen MSA/relationship − Limited visibility into how much of the Lumen revenue would renew − Merger with L3 had caused the sales referral partnership with Cyxtera to stall ▪ Onset of COVID-19, which posed a new degree of execution uncertainty/risk |
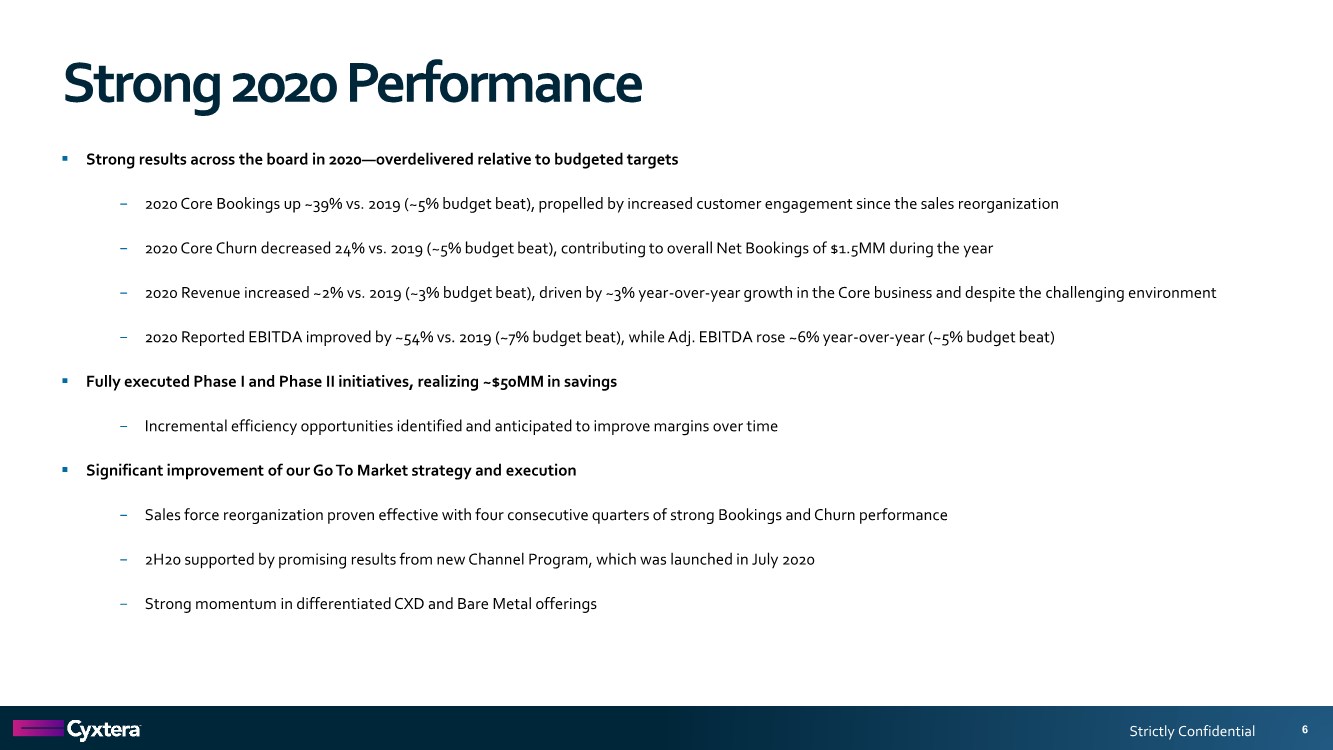
| Strictly Confidential Strong 2020 Performance 6 ▪ Strong results across the board in 2020—overdelivered relative to budgeted targets − 2020 Core Bookings up ~39% vs. 2019 (~5% budget beat), propelled by increased customer engagement since the sales reorganization − 2020 Core Churn decreased 24% vs. 2019 (~5% budget beat), contributing to overall Net Bookings of $1.5MM during the year − 2020 Revenue increased ~2% vs. 2019 (~3% budget beat), driven by ~3% year-over-year growth in the Core business and despite the challenging environment − 2020 Reported EBITDA improved by ~54% vs. 2019 (~7% budget beat), while Adj. EBITDA rose ~6% year-over-year (~5% budget beat) ▪ Fully executed Phase I and Phase II initiatives, realizing ~$50MM in savings − Incremental efficiency opportunities identified and anticipated to improve margins over time ▪ Significant improvement of our Go To Market strategy and execution − Sales force reorganization proven effective with four consecutive quarters of strong Bookings and Churn performance − 2H20 supported by promising results from new Channel Program, which was launched in July 2020 − Strong momentum in differentiated CXD and Bare Metal offerings |
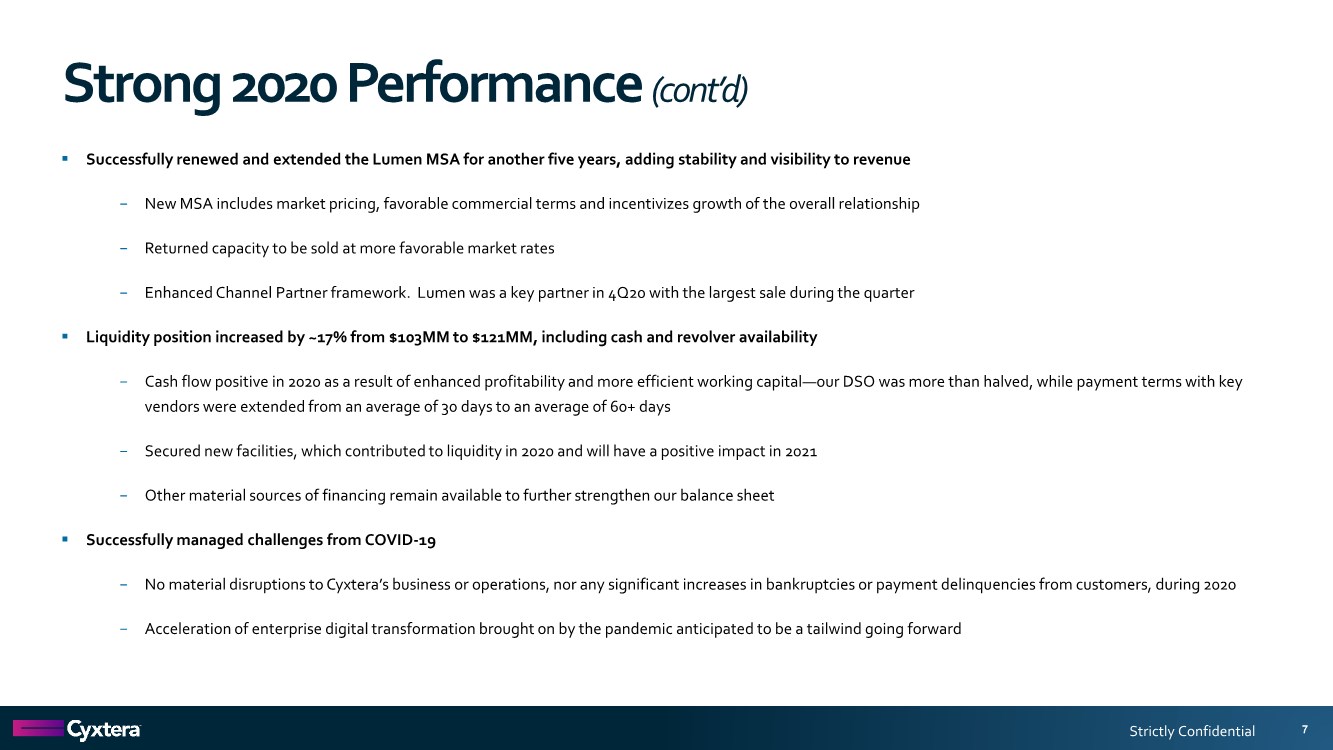
| Strictly Confidential Strong 2020 Performance (cont’d) 7 ▪ Successfully renewed and extended the Lumen MSA for another five years, adding stability and visibility to revenue − New MSA includes market pricing, favorable commercial terms and incentivizes growth of the overall relationship − Returned capacity to be sold at more favorable market rates − Enhanced Channel Partner framework. Lumen was a key partner in 4Q20 with the largest sale during the quarter ▪ Liquidity position increased by ~17% from $103MM to $121MM, including cash and revolver availability − Cash flow positive in 2020 as a result of enhanced profitability and more efficient working capital—our DSO was more than halved, while payment terms with key vendors were extended from an average of 30 days to an average of 60+ days − Secured new facilities, which contributed to liquidity in 2020 and will have a positive impact in 2021 − Other material sources of financing remain available to further strengthen our balance sheet ▪ Successfully managed challenges from COVID-19 − No material disruptions to Cyxtera’s business or operations, nor any significant increases in bankruptcies or payment delinquencies from customers, during 2020 − Acceleration of enterprise digital transformation brought on by the pandemic anticipated to be a tailwind going forward |
| Financial Overview |
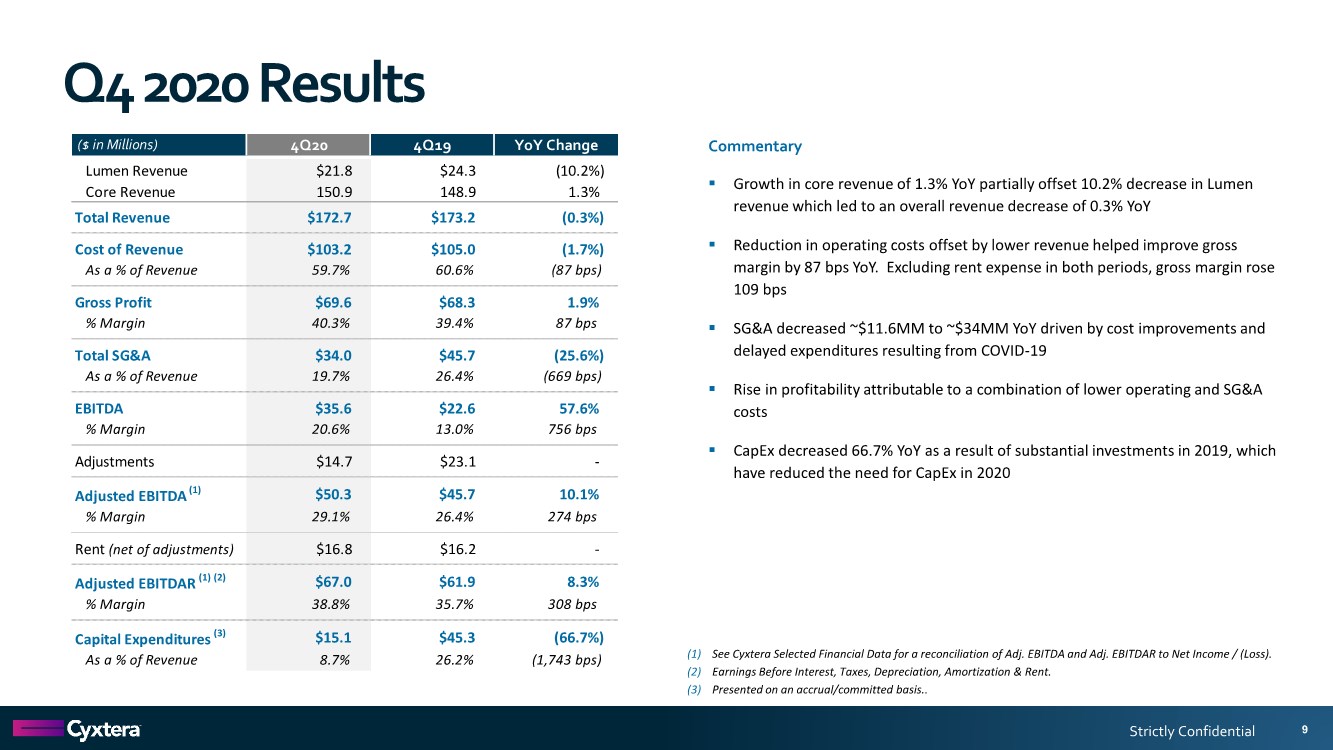
| Strictly Confidential Q4 2020 Results 9 Commentary ▪ Growth in core revenue of 1.3% YoY partially offset 10.2% decrease in Lumen revenue which led to an overall revenue decrease of 0.3% YoY ▪ Reduction in operating costs offset by lower revenue helped improve gross margin by 87 bps YoY. Excluding rent expense in both periods, gross margin rose 109 bps ▪ SG&A decreased ~$11.6MM to ~$34MM YoY driven by cost improvements and delayed expenditures resulting from COVID-19 ▪ Rise in profitability attributable to a combination of lower operating and SG&A costs ▪ CapEx decreased 66.7% YoY as a result of substantial investments in 2019, which have reduced the need for CapEx in 2020 (1) See Cyxtera Selected Financial Data for a reconciliation of Adj. EBITDA and Adj. EBITDAR to Net Income / (Loss). (2) Earnings Before Interest, Taxes, Depreciation, Amortization & Rent. (3) Presented on an accrual/committed basis.. ($ in Millions) 4Q20 4Q19 YoY Change Lumen Revenue $21.8 $24.3 (10.2%) Core Revenue 150.9 148.9 1.3% Total Revenue $172.7 $173.2 (0.3%) Cost of Revenue $103.2 $105.0 (1.7%) As a % of Revenue 59.7% 60.6% (87 bps) Gross Profit $69.6 $68.3 1.9% % Margin 40.3% 39.4% 87 bps Total SG&A $34.0 $45.7 (25.6%) As a % of Revenue 19.7% 26.4% (669 bps) EBITDA $35.6 $22.6 57.6% % Margin 20.6% 13.0% 756 bps Adjustments $14.7 $23.1 - Adjusted EBITDA (1) $50.3 $45.7 10.1% % Margin 29.1% 26.4% 274 bps Rent (net of adjustments) $16.8 $16.2 - Adjusted EBITDAR (1) (2) $67.0 $61.9 8.3% % Margin 38.8% 35.7% 308 bps Capital Expenditures (3) $15.1 $45.3 (66.7%) As a % of Revenue 8.7% 26.2% (1,743 bps) |
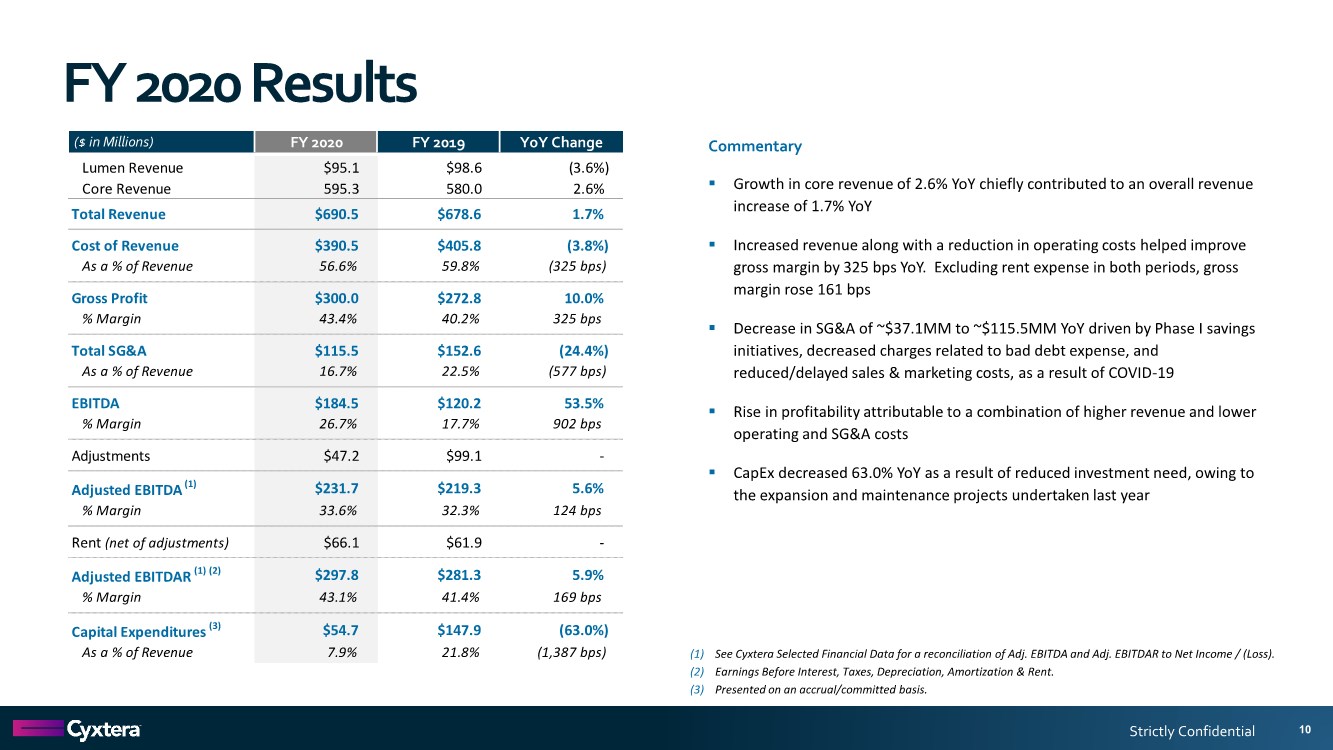
| Strictly Confidential FY 2020 Results 10 Commentary ▪ Growth in core revenue of 2.6% YoY chiefly contributed to an overall revenue increase of 1.7% YoY ▪ Increased revenue along with a reduction in operating costs helped improve gross margin by 325 bps YoY. Excluding rent expense in both periods, gross margin rose 161 bps ▪ Decrease in SG&A of ~$37.1MM to ~$115.5MM YoY driven by Phase I savings initiatives, decreased charges related to bad debt expense, and reduced/delayed sales & marketing costs, as a result of COVID-19 ▪ Rise in profitability attributable to a combination of higher revenue and lower operating and SG&A costs ▪ CapEx decreased 63.0% YoY as a result of reduced investment need, owing to the expansion and maintenance projects undertaken last year (1) See Cyxtera Selected Financial Data for a reconciliation of Adj. EBITDA and Adj. EBITDAR to Net Income / (Loss). (2) Earnings Before Interest, Taxes, Depreciation, Amortization & Rent. (3) Presented on an accrual/committed basis. ($ in Millions) FY 2020 FY 2019 YoY Change Lumen Revenue $95.1 $98.6 (3.6%) Core Revenue 595.3 580.0 2.6% Total Revenue $690.5 $678.6 1.7% Cost of Revenue $390.5 $405.8 (3.8%) As a % of Revenue 56.6% 59.8% (325 bps) Gross Profit $300.0 $272.8 10.0% % Margin 43.4% 40.2% 325 bps Total SG&A $115.5 $152.6 (24.4%) As a % of Revenue 16.7% 22.5% (577 bps) EBITDA $184.5 $120.2 53.5% % Margin 26.7% 17.7% 902 bps Adjustments $47.2 $99.1 - Adjusted EBITDA (1) $231.7 $219.3 5.6% % Margin 33.6% 32.3% 124 bps Rent (net of adjustments) $66.1 $61.9 - Adjusted EBITDAR (1) (2) $297.8 $281.3 5.9% % Margin 43.1% 41.4% 169 bps Capital Expenditures (3) $54.7 $147.9 (63.0%) As a % of Revenue 7.9% 21.8% (1,387 bps) |
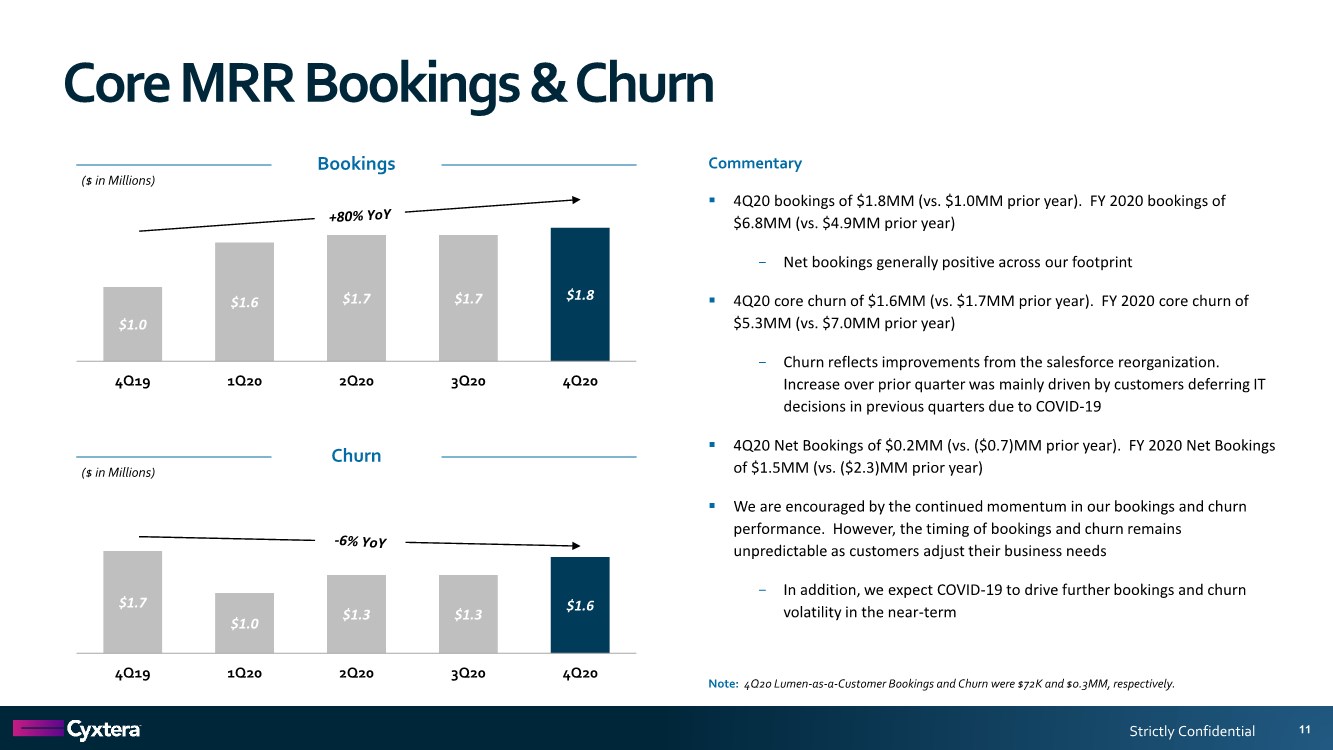
| Strictly Confidential Core MRR Bookings & Churn Commentary ▪ 4Q20 bookings of $1.8MM (vs. $1.0MM prior year). FY 2020 bookings of $6.8MM (vs. $4.9MM prior year) − Net bookings generally positive across our footprint ▪ 4Q20 core churn of $1.6MM (vs. $1.7MM prior year). FY 2020 core churn of $5.3MM (vs. $7.0MM prior year) − Churn reflects improvements from the salesforce reorganization. Increase over prior quarter was mainly driven by customers deferring IT decisions in previous quarters due to COVID-19 ▪ 4Q20 Net Bookings of $0.2MM (vs. ($0.7)MM prior year). FY 2020 Net Bookings of $1.5MM (vs. ($2.3)MM prior year) ▪ We are encouraged by the continued momentum in our bookings and churn performance. However, the timing of bookings and churn remains unpredictable as customers adjust their business needs − In addition, we expect COVID-19 to drive further bookings and churn volatility in the near-term 11 $1.0 $1.6 $1.7 $1.7 $1.8 4Q19 1Q20 2Q20 3Q20 4Q20 2019 Bookings Bookings ($ in Millions) $1.7 $1.0 $1.3 $1.3 $1.6 4Q19 1Q20 2Q20 3Q20 4Q20 2018 Bookings Churn ($ in Millions) Note: 4Q20 Lumen-as-a-Customer Bookings and Churn were $72K and $0.3MM, respectively. |
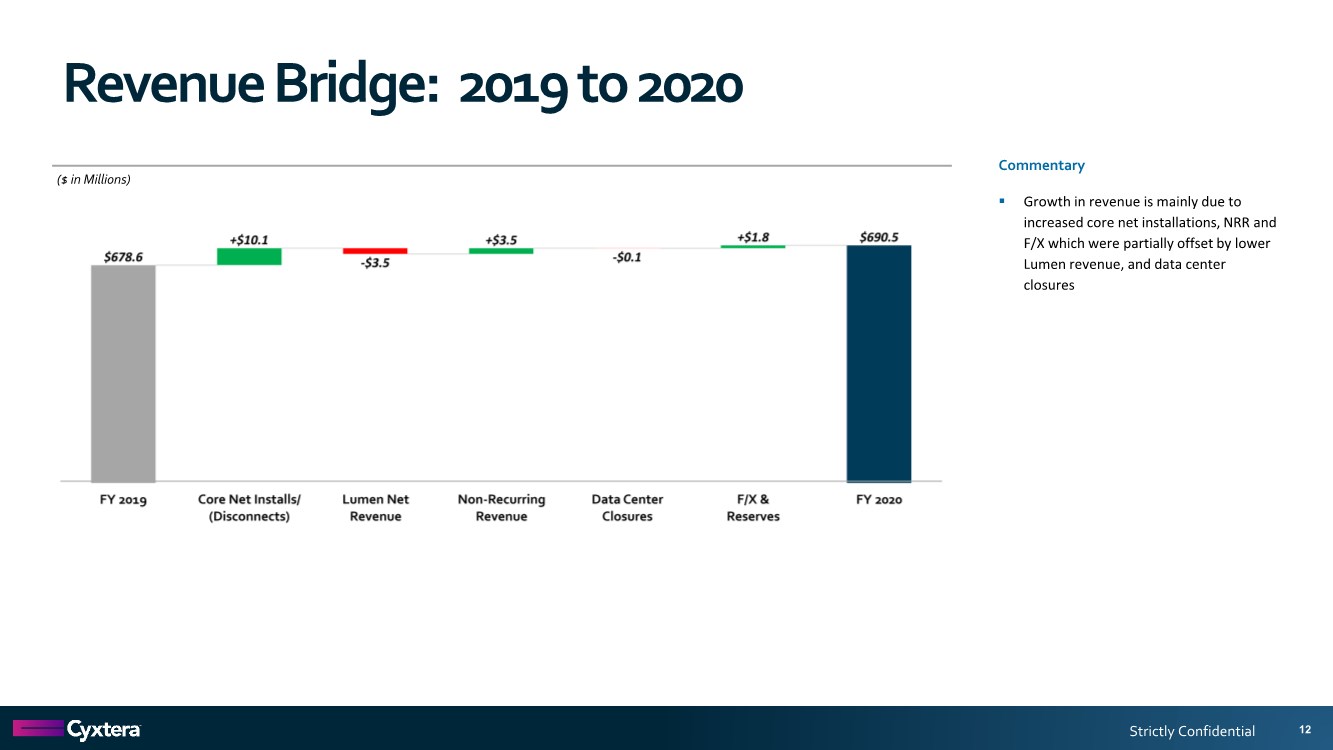
| Strictly Confidential Revenue Bridge: 2019 to 2020 12 ($ in Millions) Commentary ▪ Growth in revenue is mainly due to increased core net installations, NRR and F/X which were partially offset by lower Lumen revenue, and data center closures |
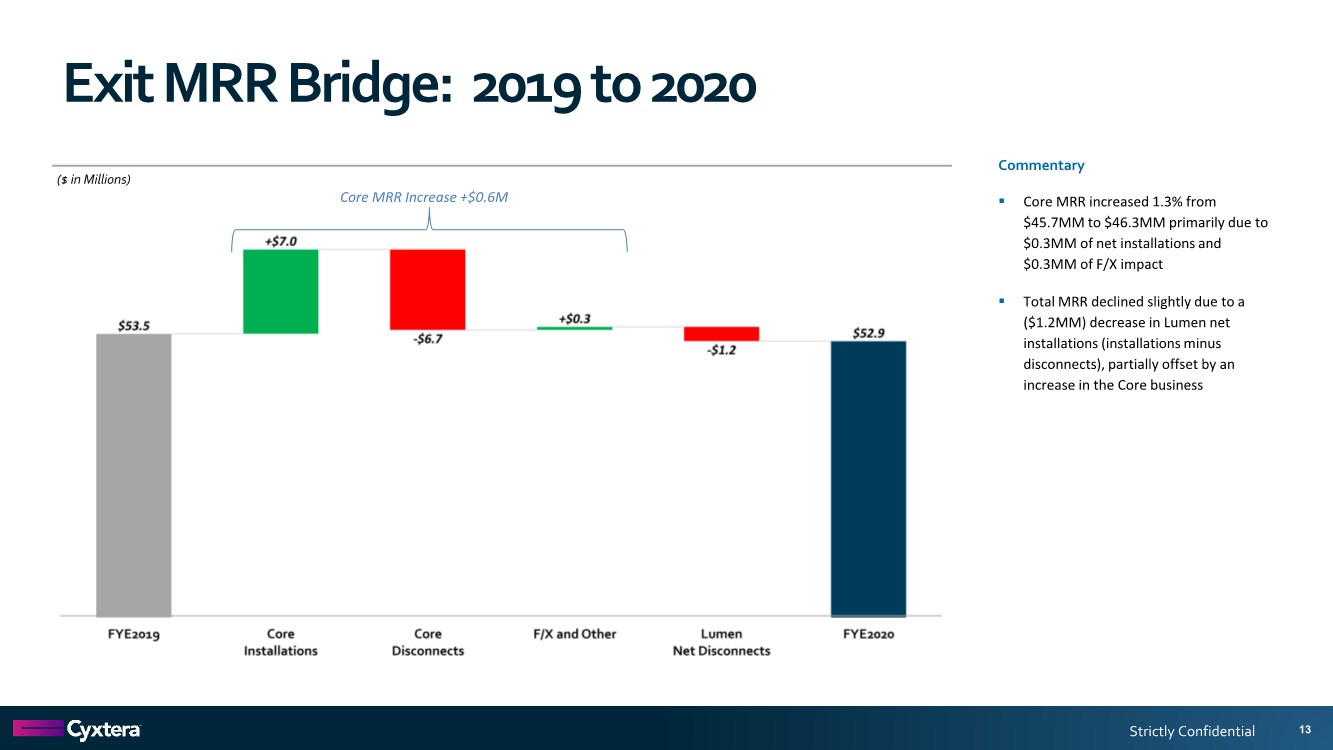
| Strictly Confidential Exit MRR Bridge: 2019 to 2020 13 ($ in Millions) Commentary ▪ Core MRR increased 1.3% from $45.7MM to $46.3MM primarily due to $0.3MM of net installations and $0.3MM of F/X impact ▪ Total MRR declined slightly due to a ($1.2MM) decrease in Lumen net installations (installations minus disconnects), partially offset by an increase in the Core business Core MRR Increase +$0.6M |
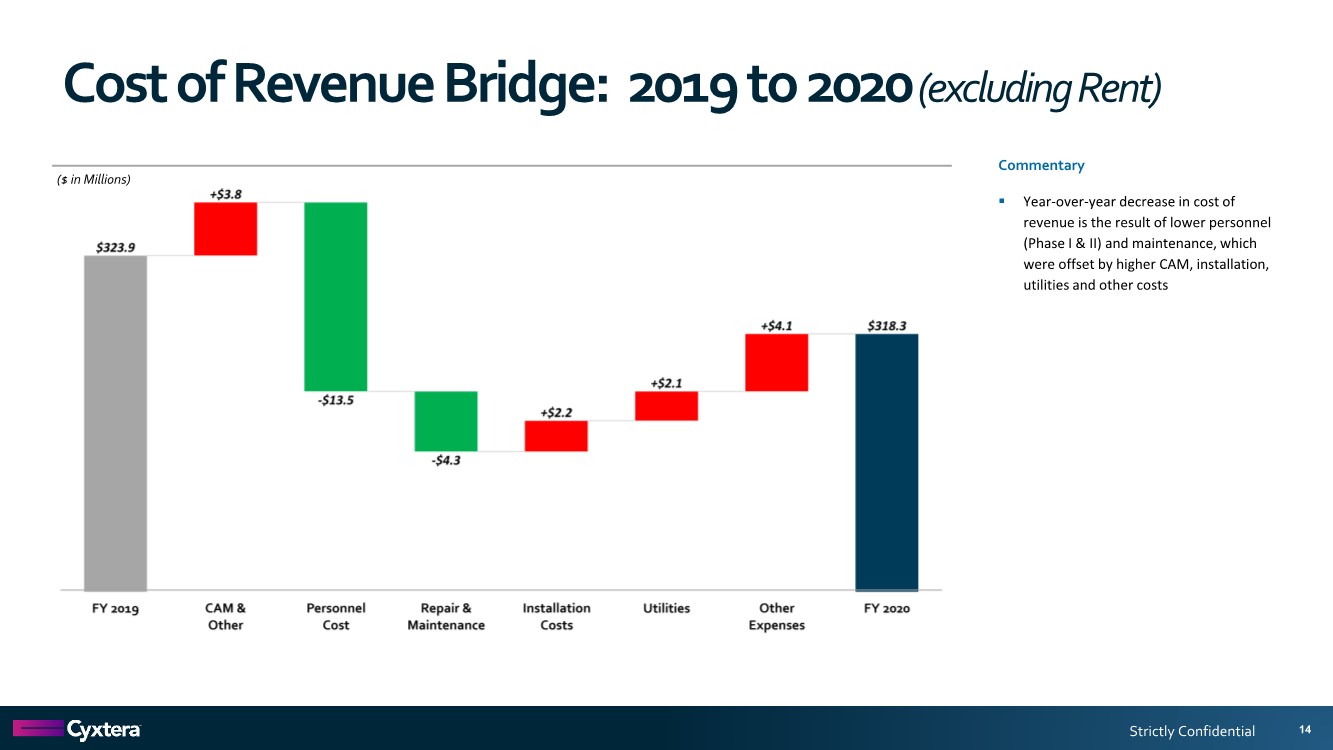
| Strictly Confidential Cost of Revenue Bridge: 2019 to 2020(excluding Rent) 14 ($ in Millions) Commentary ▪ Year-over-year decrease in cost of revenue is the result of lower personnel (Phase I & II) and maintenance, which were offset by higher CAM, installation, utilities and other costs |
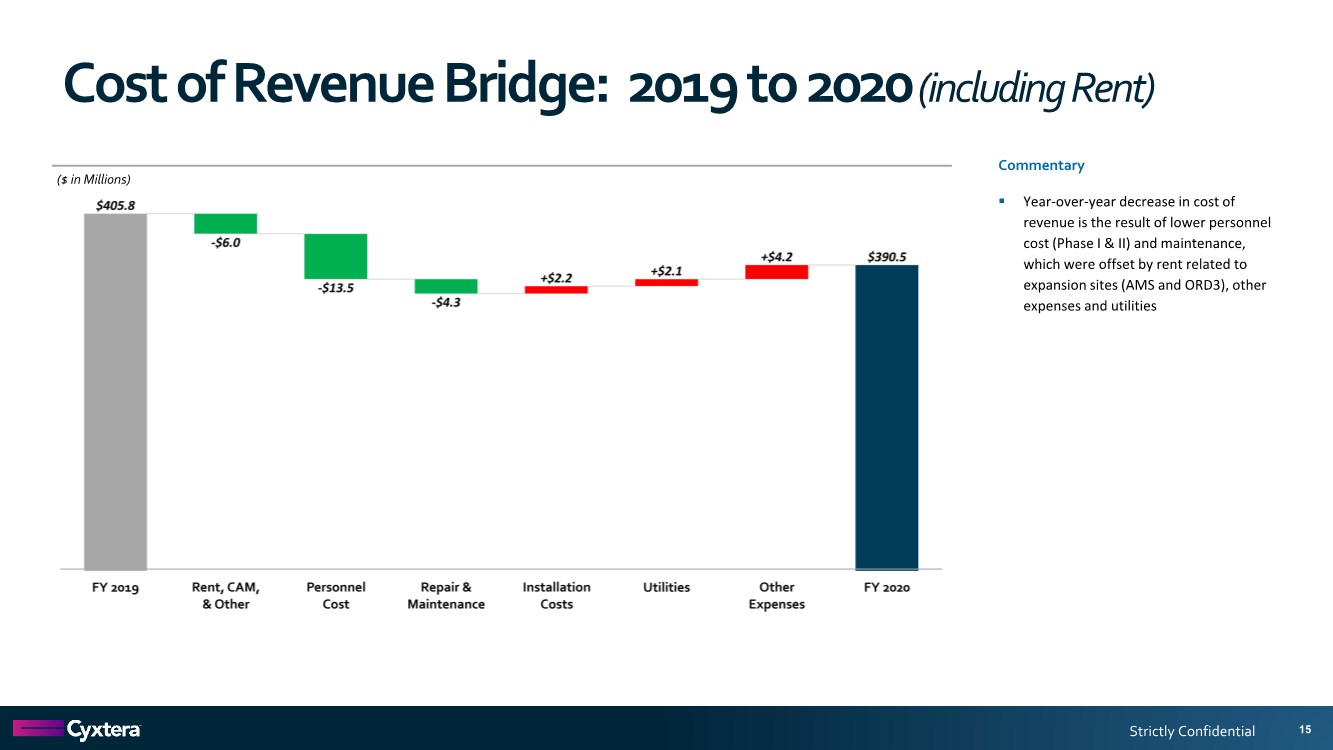
| Strictly Confidential Cost of Revenue Bridge: 2019 to 2020(including Rent) 15 ($ in Millions) Commentary ▪ Year-over-year decrease in cost of revenue is the result of lower personnel cost (Phase I & II) and maintenance, which were offset by rent related to expansion sites (AMS and ORD3), other expenses and utilities |
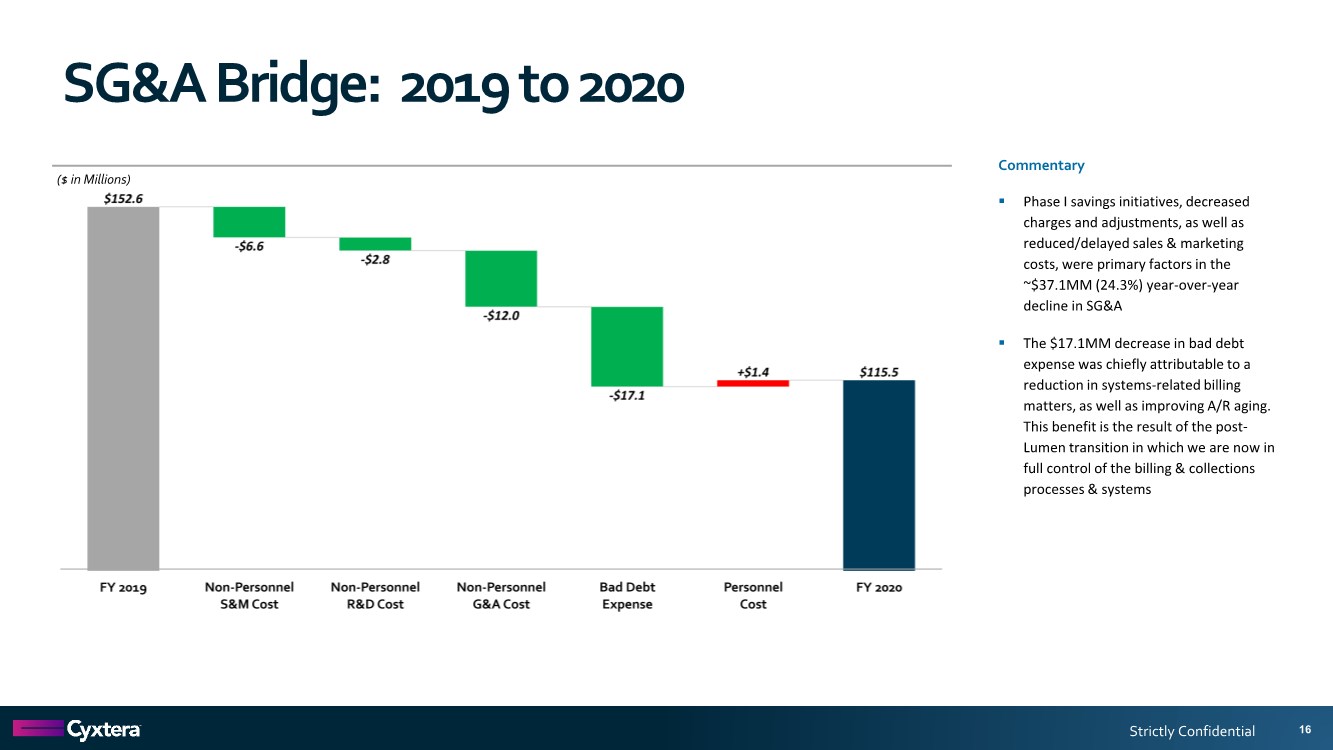
| Strictly Confidential SG&A Bridge: 2019 to 2020 16 ($ in Millions) Commentary ▪ Phase I savings initiatives, decreased charges and adjustments, as well as reduced/delayed sales & marketing costs, were primary factors in the ~$37.1MM (24.3%) year-over-year decline in SG&A ▪ The $17.1MM decrease in bad debt expense was chiefly attributable to a reduction in systems-related billing matters, as well as improving A/R aging. This benefit is the result of the post- Lumen transition in which we are now in full control of the billing & collections processes & systems |
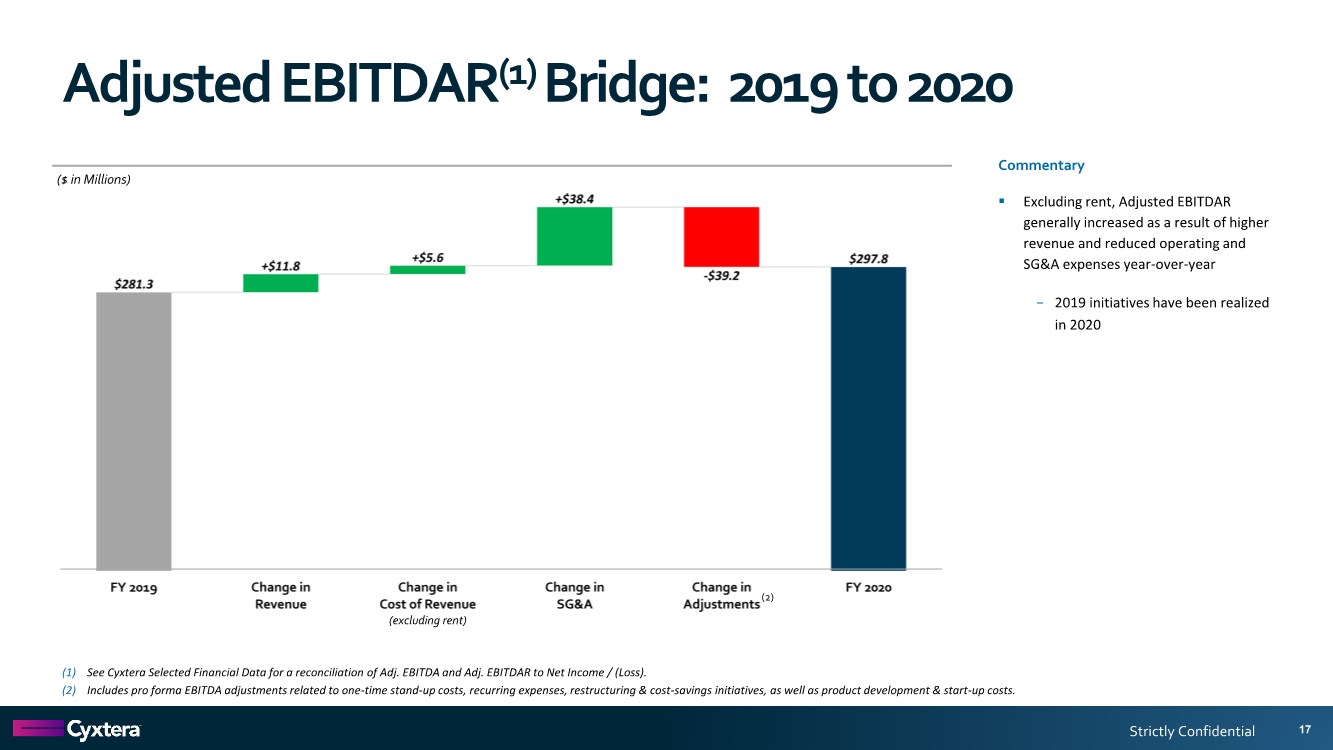
| Strictly Confidential Adjusted EBITDAR(1) Bridge: 2019 to 2020 17 ($ in Millions) Commentary ▪ Excluding rent, Adjusted EBITDAR generally increased as a result of higher revenue and reduced operating and SG&A expenses year-over-year − 2019 initiatives have been realized in 2020 (1) See Cyxtera Selected Financial Data for a reconciliation of Adj. EBITDA and Adj. EBITDAR to Net Income / (Loss). (2) Includes pro forma EBITDA adjustments related to one-time stand-up costs, recurring expenses, restructuring & cost-savings initiatives, as well as product development & start-up costs. (2) (excluding rent) |
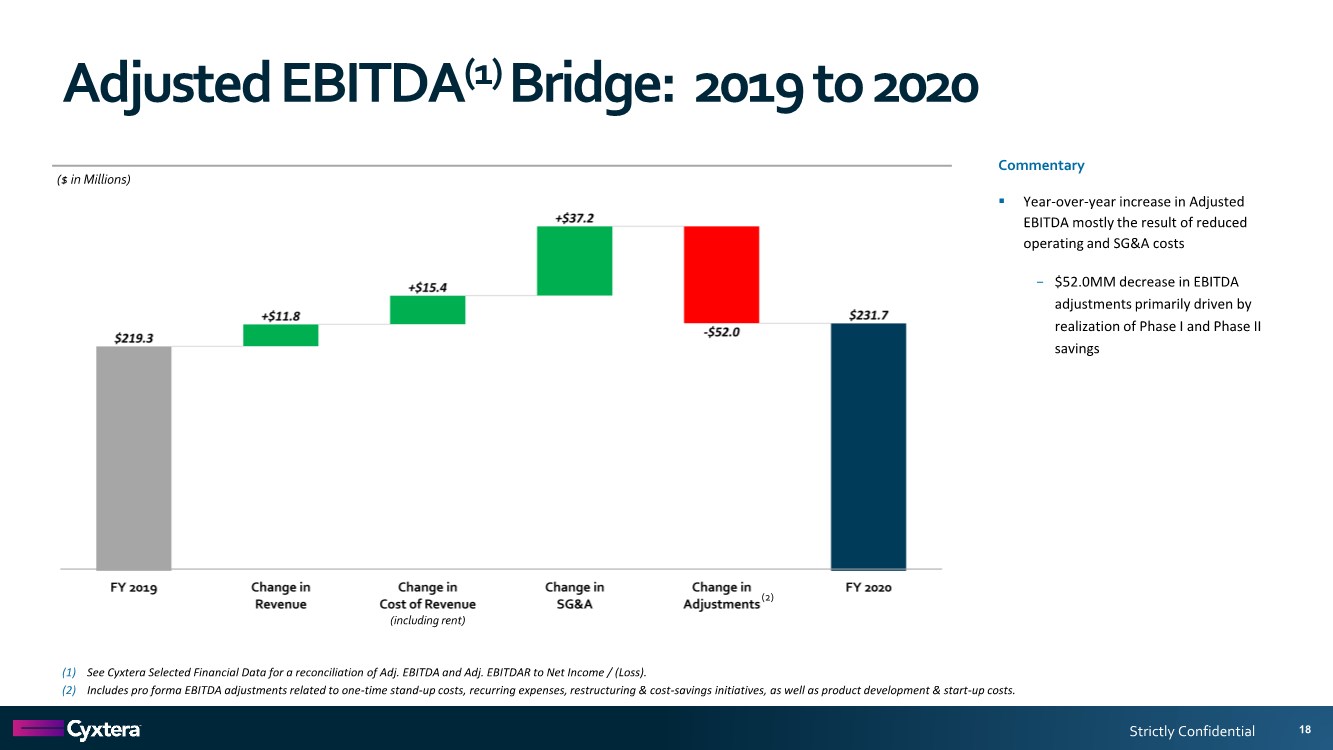
| Strictly Confidential Adjusted EBITDA(1) Bridge: 2019 to 2020 18 ($ in Millions) Commentary ▪ Year-over-year increase in Adjusted EBITDA mostly the result of reduced operating and SG&A costs − $52.0MM decrease in EBITDA adjustments primarily driven by realization of Phase I and Phase II savings (1) See Cyxtera Selected Financial Data for a reconciliation of Adj. EBITDA and Adj. EBITDAR to Net Income / (Loss). (2) Includes pro forma EBITDA adjustments related to one-time stand-up costs, recurring expenses, restructuring & cost-savings initiatives, as well as product development & start-up costs. (2) (including rent) |
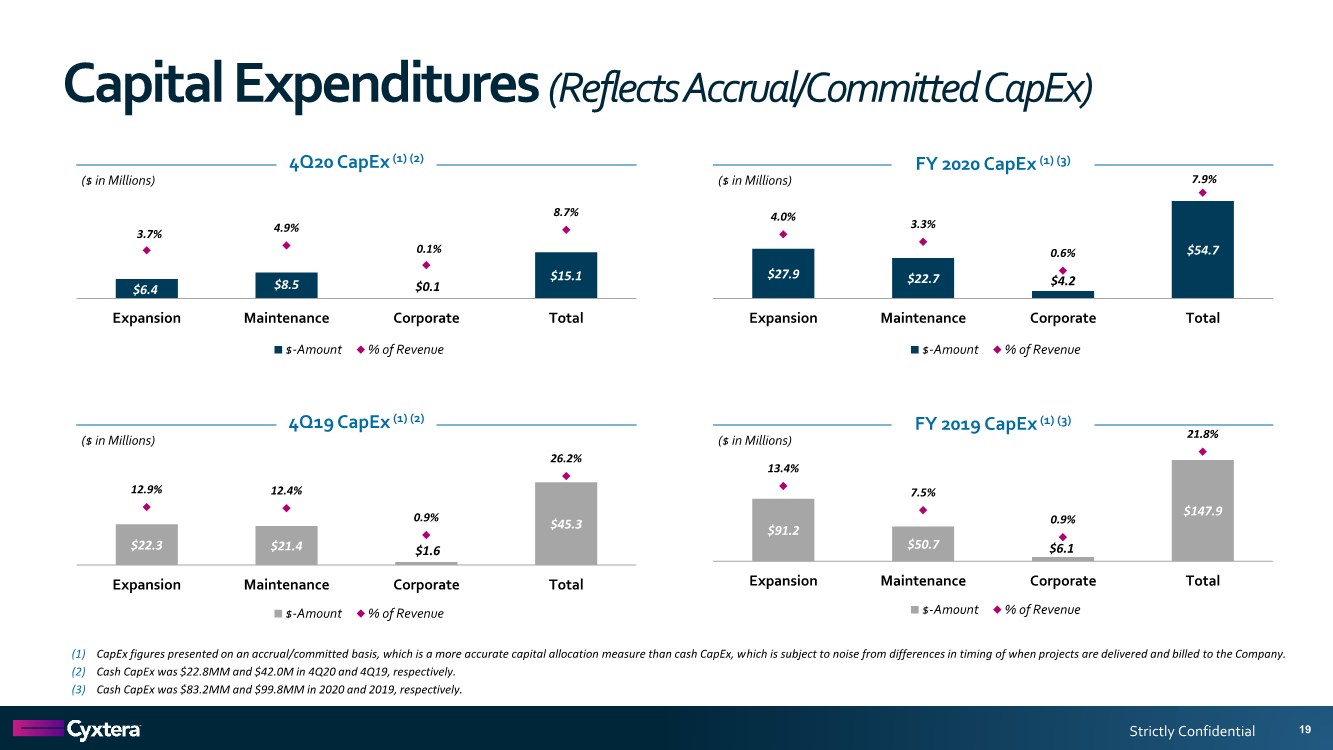
| Strictly Confidential Capital Expenditures (Reflects Accrual/Committed CapEx) 19 $6.4 $8.5 $0.1 $15.1 3.7% 4.9% 0.1% 8.7% Expansion Maintenance Corporate Total 2019 CapEx $-Amount % of Revenue 4Q20 CapEx (1) (2) ($ in Millions) $22.3 $21.4 $1.6 $45.3 12.9% 12.4% 0.9% 26.2% Expansion Maintenance Corporate Total 2018 CapEx $-Amount % of Revenue 4Q19 CapEx (1) (2) ($ in Millions) (1) CapEx figures presented on an accrual/committed basis, which is a more accurate capital allocation measure than cash CapEx, which is subject to noise from differences in timing of when projects are delivered and billed to the Company. (2) Cash CapEx was $22.8MM and $42.0M in 4Q20 and 4Q19, respectively. (3) Cash CapEx was $83.2MM and $99.8MM in 2020 and 2019, respectively. $27.9 $22.7 $4.2 $54.7 4.0% 3.3% 0.6% 7.9% Expansion Maintenance Corporate Total 2019 CapEx $-Amount % of Revenue FY 2020 CapEx (1) (3) ($ in Millions) $91.2 $50.7 $6.1 $147.9 13.4% 7.5% 0.9% 21.8% Expansion Maintenance Corporate Total 2018 CapEx $-Amount % of Revenue FY 2019 CapEx (1) (3) ($ in Millions) |
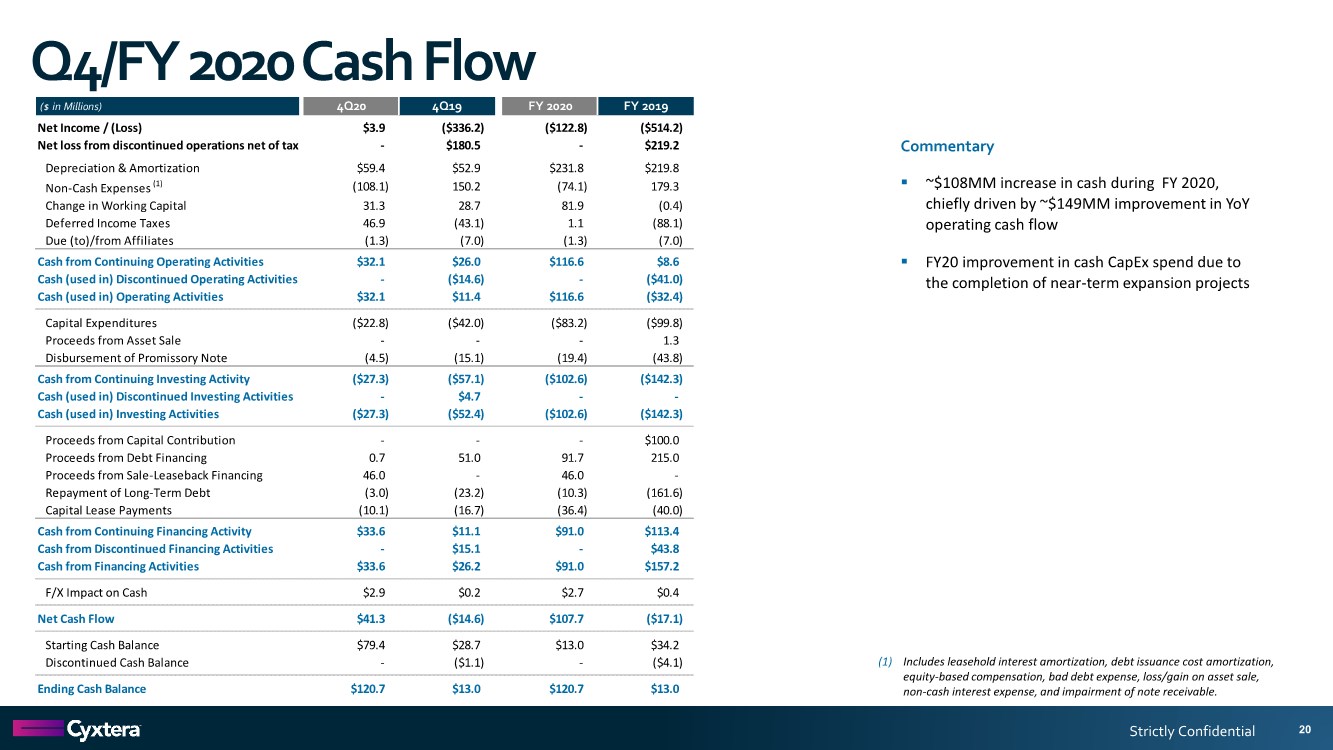
| Strictly Confidential Q4/FY 2020 Cash Flow 20 (1) Includes leasehold interest amortization, debt issuance cost amortization, equity-based compensation, bad debt expense, loss/gain on asset sale, non-cash interest expense, and impairment of note receivable. Commentary ▪ ~$108MM increase in cash during FY 2020, chiefly driven by ~$149MM improvement in YoY operating cash flow ▪ FY20 improvement in cash CapEx spend due to the completion of near-term expansion projects ($ in Millions) 4Q20 4Q19 FY 2020 FY 2019 Net Income / (Loss) $3.9 ($336.2) ($122.8) ($514.2) Net loss from discontinued operations net of tax - $180.5 - $219.2 Depreciation & Amortization $59.4 $52.9 $231.8 $219.8 Non-Cash Expenses (1) (108.1) 150.2 (74.1) 179.3 Change in Working Capital 31.3 28.7 81.9 (0.4) Deferred Income Taxes 46.9 (43.1) 1.1 (88.1) Due (to)/from Affiliates (1.3) (7.0) (1.3) (7.0) Cash from Continuing Operating Activities $32.1 $26.0 $116.6 $8.6 Cash (used in) Discontinued Operating Activities -($14.6) -($41.0) Cash (used in) Operating Activities $32.1 $11.4 $116.6 ($32.4) Capital Expenditures ($22.8) ($42.0) ($83.2) ($99.8) Proceeds from Asset Sale --- 1.3 Disbursement of Promissory Note (4.5) (15.1) (19.4) (43.8) Cash from Continuing Investing Activity ($27.3) ($57.1) ($102.6) ($142.3) Cash (used in) Discontinued Investing Activities - $4.7 -- Cash (used in) Investing Activities ($27.3) ($52.4) ($102.6) ($142.3) Proceeds from Capital Contribution --- $100.0 Proceeds from Debt Financing 0.7 51.0 91.7 215.0 Proceeds from Sale-Leaseback Financing 46.0 - 46.0 - Repayment of Long-Term Debt (3.0) (23.2) (10.3) (161.6) Capital Lease Payments (10.1) (16.7) (36.4) (40.0) Cash from Continuing Financing Activity $33.6 $11.1 $91.0 $113.4 Cash from Discontinued Financing Activities - $15.1 - $43.8 Cash from Financing Activities $33.6 $26.2 $91.0 $157.2 F/X Impact on Cash $2.9 $0.2 $2.7 $0.4 Net Cash Flow $41.3 ($14.6) $107.7 ($17.1) Starting Cash Balance $79.4 $28.7 $13.0 $34.2 Discontinued Cash Balance -($1.1) -($4.1) Ending Cash Balance $120.7 $13.0 $120.7 $13.0 |
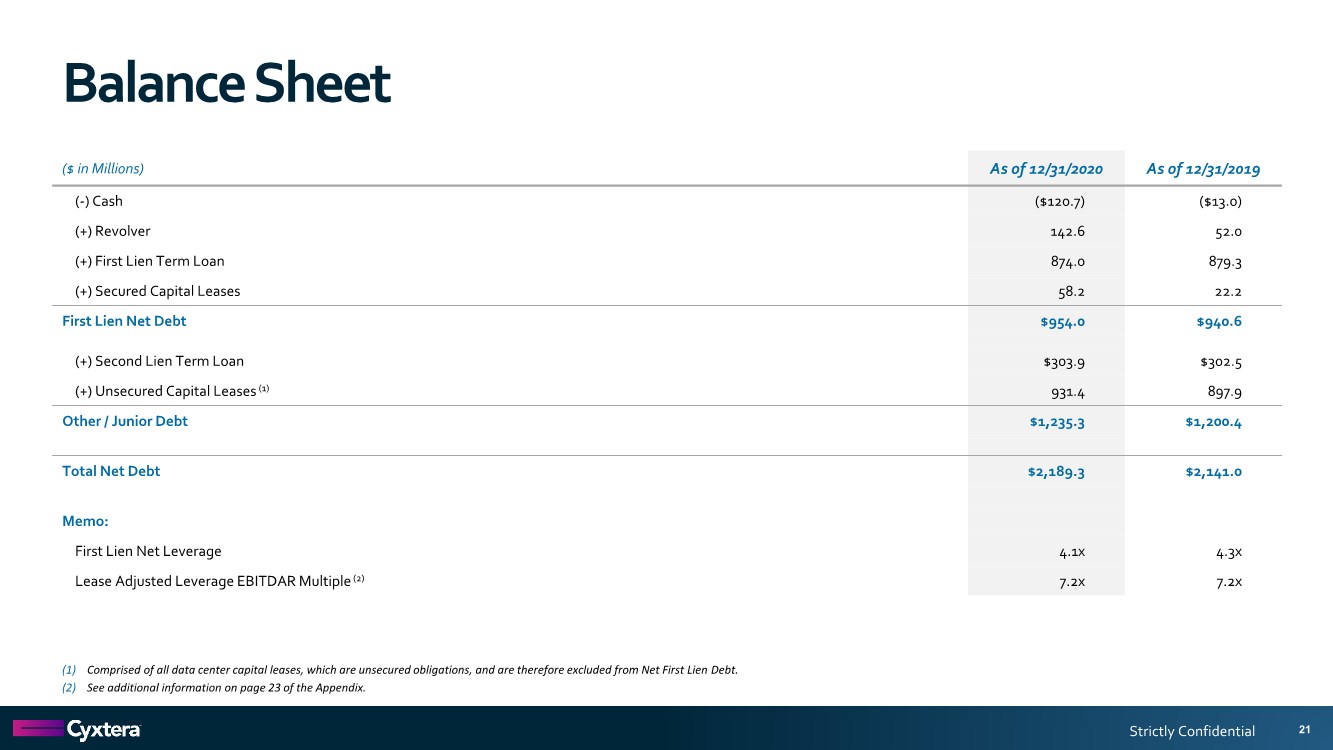
| Strictly Confidential Balance Sheet 21 ($ in Millions) As of 12/31/2020 As of 12/31/2019 (-) Cash ($120.7) ($13.0) (+) Revolver 142.6 52.0 (+) First Lien Term Loan 874.0 879.3 (+) Secured Capital Leases 58.2 22.2 First Lien Net Debt $954.0 $940.6 (+) Second Lien Term Loan $303.9 $302.5 (+) Unsecured Capital Leases (1) 931.4 897.9 Other / Junior Debt $1,235.3 $1,200.4 Total Net Debt $2,189.3 $2,141.0 Memo: First Lien Net Leverage 4.1x 4.3x Lease Adjusted Leverage EBITDAR Multiple (2) 7.2x 7.2x (1) Comprised of all data center capital leases, which are unsecured obligations, and are therefore excluded from Net First Lien Debt. (2) See additional information on page 23 of the Appendix. |
| Appendix |
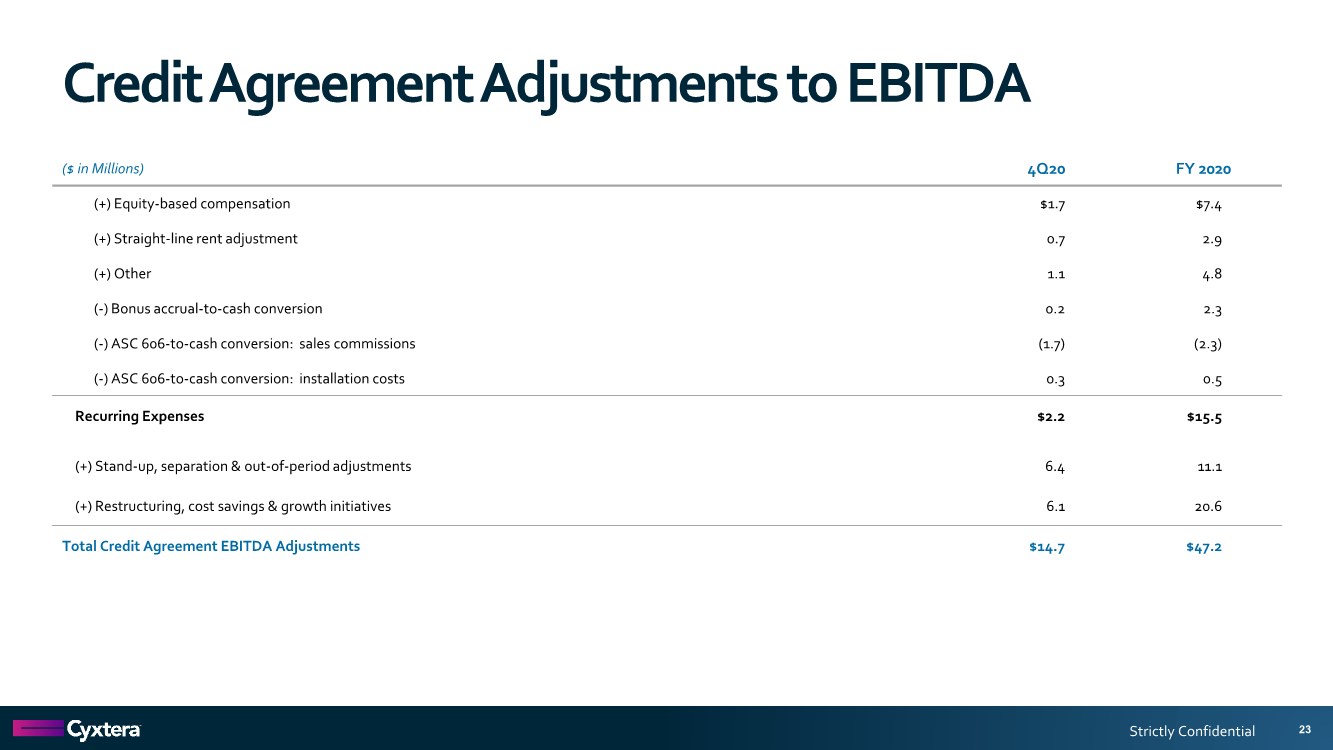
| Strictly Confidential Credit Agreement Adjustments to EBITDA 23 ($ in Millions) 4Q20 FY 2020 (+) Equity-based compensation $1.7 $7.4 (+) Straight-line rent adjustment 0.7 2.9 (+) Other 1.1 4.8 (-) Bonus accrual-to-cash conversion 0.2 2.3 (-) ASC 606-to-cash conversion: sales commissions (1.7) (2.3) (-) ASC 606-to-cash conversion: installation costs 0.3 0.5 Recurring Expenses $2.2 $15.5 (+) Stand-up, separation & out-of-period adjustments 6.4 11.1 (+) Restructuring, cost savings & growth initiatives 6.1 20.6 Total Credit Agreement EBITDA Adjustments $14.7 $47.2 |
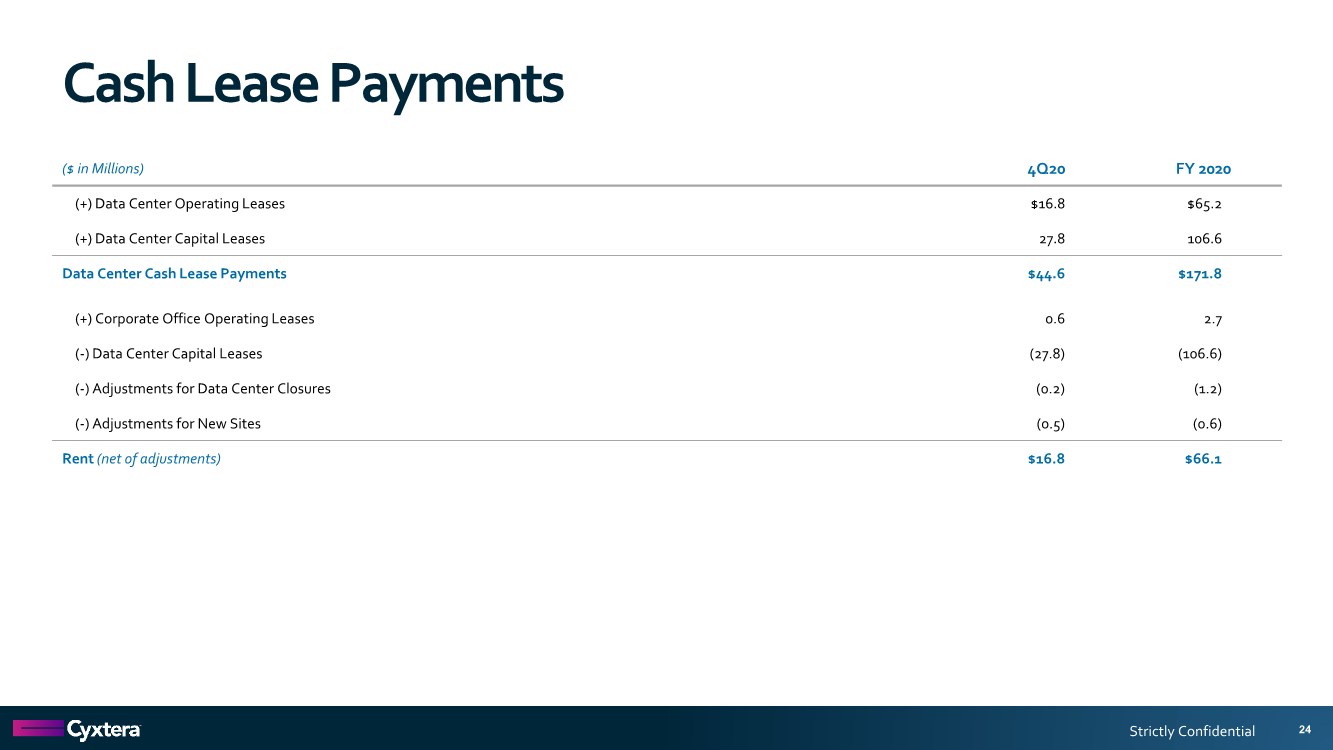
| Strictly Confidential Cash Lease Payments 24 ($ in Millions) 4Q20 FY 2020 (+) Data Center Operating Leases $16.8 $65.2 (+) Data Center Capital Leases 27.8 106.6 Data Center Cash Lease Payments $44.6 $171.8 (+) Corporate Office Operating Leases 0.6 2.7 (-) Data Center Capital Leases (27.8) (106.6) (-) Adjustments for Data Center Closures (0.2) (1.2) (-) Adjustments for New Sites (0.5) (0.6) Rent (net of adjustments) $16.8 $66.1 |
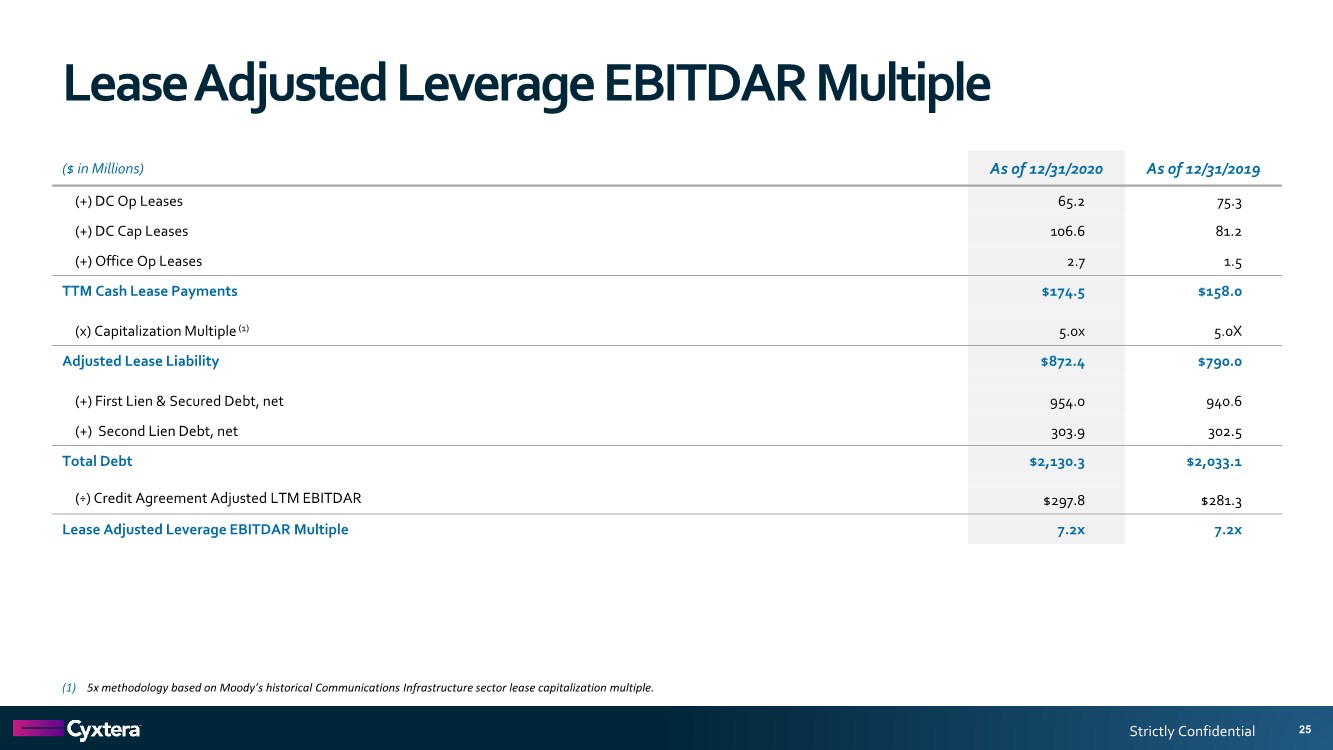
| Strictly Confidential Lease Adjusted Leverage EBITDAR Multiple 25 ($ in Millions) As of 12/31/2020 As of 12/31/2019 (+) DC Op Leases 65.2 75.3 (+) DC Cap Leases 106.6 81.2 (+) Office Op Leases 2.7 1.5 TTM Cash Lease Payments $174.5 $158.0 (x) Capitalization Multiple (1) 5.0x 5.0X Adjusted Lease Liability $872.4 $790.0 (+) First Lien & Secured Debt, net 954.0 940.6 (+) Second Lien Debt, net 303.9 302.5 Total Debt $2,130.3 $2,033.1 (÷) Credit Agreement Adjusted LTM EBITDAR $297.8 $281.3 Lease Adjusted Leverage EBITDAR Multiple 7.2x 7.2x (1) 5x methodology based on Moody’s historical Communications Infrastructure sector lease capitalization multiple. |
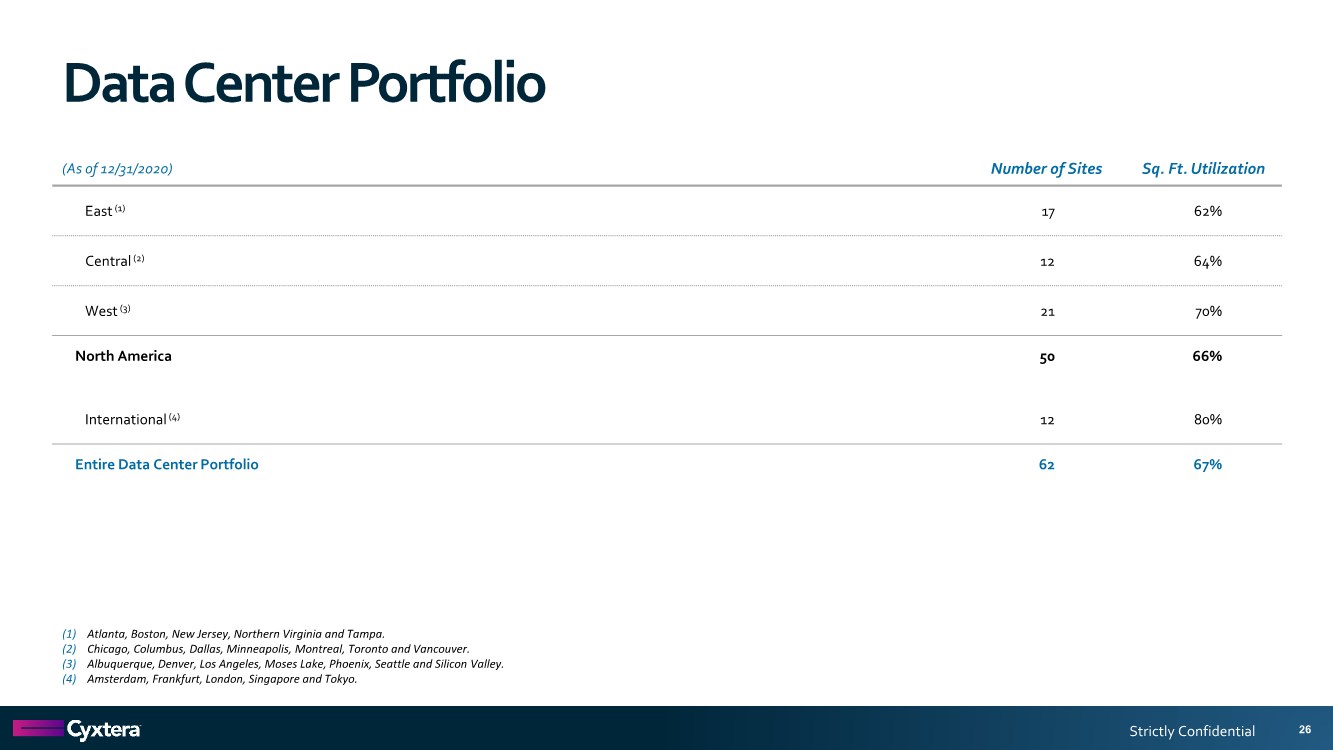
| Strictly Confidential Data Center Portfolio 26 (As of 12/31/2020) Number of Sites Sq. Ft. Utilization East (1) 17 62% Central (2) 12 64% West (3) 21 70% North America 50 66% International (4) 12 80% Entire Data Center Portfolio 62 67% (1) Atlanta, Boston, New Jersey, Northern Virginia and Tampa. (2) Chicago, Columbus, Dallas, Minneapolis, Montreal, Toronto and Vancouver. (3) Albuquerque, Denver, Los Angeles, Moses Lake, Phoenix, Seattle and Silicon Valley. (4) Amsterdam, Frankfurt, London, Singapore and Tokyo. |
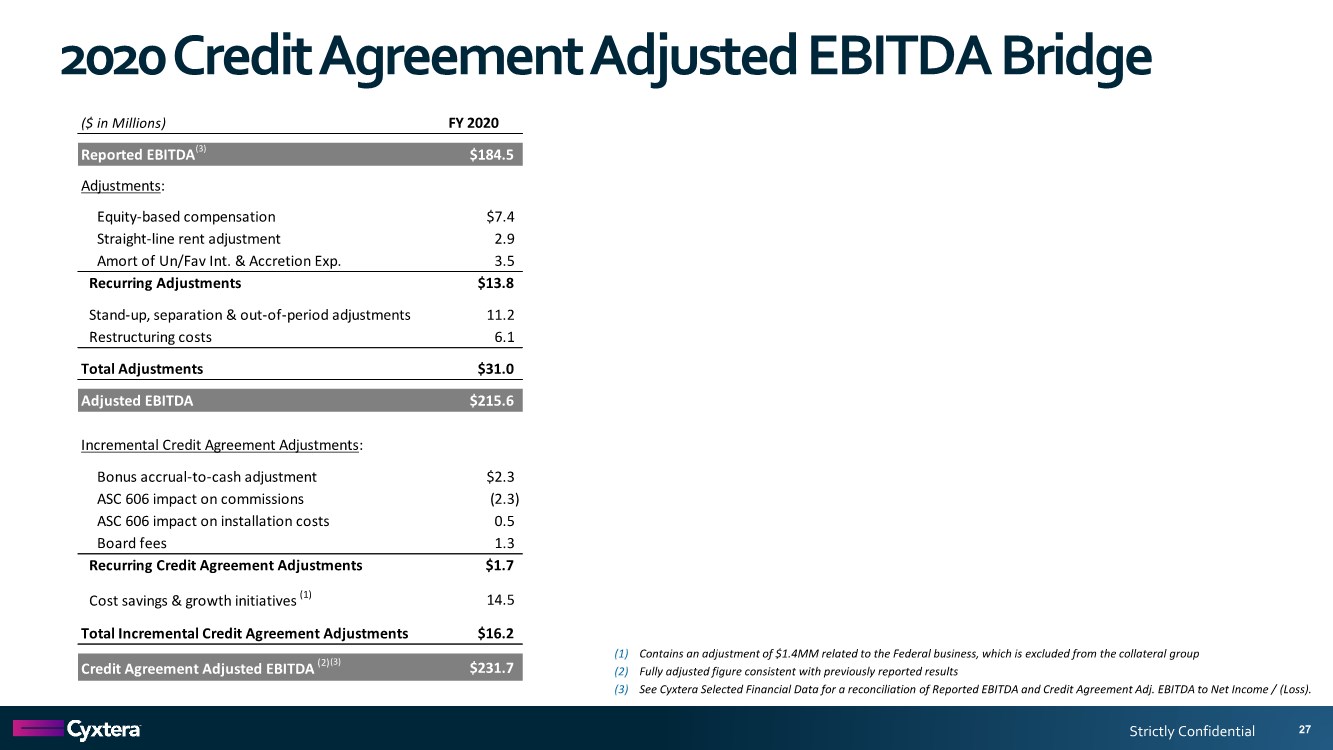
| Strictly Confidential 2020 Credit Agreement Adjusted EBITDA Bridge 27 (1) Contains an adjustment of $1.4MM related to the Federal business, which is excluded from the collateral group (2) Fully adjusted figure consistent with previously reported results (3) See Cyxtera Selected Financial Data for a reconciliation of Reported EBITDA and Credit Agreement Adj. EBITDA to Net Income / (Loss). ($ in Millions) FY 2020 Reported EBITDA $184.5 Adjustments: Equity-based compensation $7.4 Straight-line rent adjustment 2.9 Amort of Un/Fav Int. & Accretion Exp. 3.5 Recurring Adjustments $13.8 Stand-up, separation & out-of-period adjustments 11.2 Restructuring costs 6.1 Total Adjustments $31.0 Adjusted EBITDA $215.6 Incremental Credit Agreement Adjustments: Bonus accrual-to-cash adjustment $2.3 ASC 606 impact on commissions (2.3) ASC 606 impact on installation costs 0.5 Board fees 1.3 Recurring Credit Agreement Adjustments $1.7 Cost savings & growth initiatives (1) 14.5 Total Incremental Credit Agreement Adjustments $16.2 Credit Agreement Adjusted EBITDA (2) $231.7 (3) (3) |
| Strictly Confidential |


