Attached files
| file | filename |
|---|---|
| EX-99.1 - EX-99.1 - Empire State Realty Trust, Inc. | d84644dex991.htm |
| 8-K - 8-K - Empire State Realty Trust, Inc. | d84644d8k.htm |
Exhibit 99.2

|
|
First Quarter 2021
|
| Table of Contents |
Page | |||
| Summary |
||||
| Company Profile |
3 | |||
| Financial Highlights |
4 | |||
| Selected Property Data |
||||
| Property Summary Net Operating Income |
5 | |||
| Net Operating Income, Initial Free Rent Burn-Off and Signed Leases Not Commenced |
6 | |||
| Leasing Activity |
7 | |||
| Property Detail |
9 | |||
| Portfolio Expirations and Vacates Summary |
10 | |||
| Tenant Lease Expirations |
11 | |||
| Largest Tenants and Portfolio Tenant Diversification by Industry |
14 | |||
| Capital Expenditures and Redevelopment Program |
15 | |||
| Observatory Summary |
16 | |||
| Financial information |
||||
| Condensed Consolidated Balance Sheets |
17 | |||
| Condensed Consolidated Statements of Operations |
18 | |||
| FFO, Modified FFO, Core FFO, FAD and EBITDA |
19 | |||
| Consolidated Debt Analysis |
||||
| Debt Summary |
20 | |||
| Debt Detail |
21 | |||
| Debt Maturities |
22 | |||
| Ground Leases |
22 | |||
| Supplemental Definitions |
23 | |||
Forward-looking Statements
This presentation includes “forward looking statements” within the meaning of the federal securities laws. Forward-looking statements may be identified by the use of words such as “believes,” “expects,” “may,” “will,” “should,” “seeks,” “approximately,” “intends,” “plans,” “estimates,” “contemplates,” “aims,” “continues,” “would” or “anticipates” or the negative of these words and phrases or similar words or phrases.
The following factors, among others, could cause actual results and future events to differ materially from those set forth or contemplated in the forward-looking statements: (i) economic, political and social impact of, and uncertainty relating to, the COVID-19 pandemic; (ii) resolution of legal proceedings involving the Company; (iii) reduced demand for office or retail space, including as a result of the COVID-19 pandemic; (iv) changes in our business strategy; (v) changes in technology and market competition that affect utilization of our office, retail, broadcast or other facilities; (vi) changes in domestic or international tourism, including due to health crises such as the COVID-19 pandemic, geopolitical events and/or currency exchange rates, which may cause a decline in Observatory visitors; (vii) defaults on, early terminations of, or non-renewal of, leases by tenants; (viii) increases in the Company’s borrowing costs as a result of changes in interest rates and other factors, including the potential phasing out of LIBOR after 2021; (ix) declining real estate valuations and impairment charges; (x) termination or expiration of our ground leases; (xi) changes in our ability to pay down, refinance, restructure or extend our indebtedness as it becomes due and potential limitations on our ability to borrow additional funds in compliance with drawdown conditions and financial covenants; (xii) decreased rental rates or increased vacancy rates; (xiii) our failure to redevelop and reposition properties, or to execute any newly planned capital project successfully or on the anticipated timeline or at the anticipated costs; (xiv) difficulties in identifying properties to acquire and completing acquisitions; (xv) risks related to our development projects (including our Metro Tower development site) and capital projects, including the cost of construction delays and cost overruns; (xvi) impact of changes in governmental regulations, tax laws and rates and similar matters; (xvii) our failure to qualify as a REIT; (xviii) environmental uncertainties and risks related to adverse weather conditions, rising sea levels and natural disasters and (xix) the accuracy of our methodologies and estimates regarding ESG metrics, goals and targets, tenant willingness and ability to collaborate towards reporting ESG metrics and meeting ESG goals and targets, and the impact of governmental regulation on our ESG efforts.
For a further discussion of these and other factors that could impact the Company’s future results, performance or transactions, see the section entitled “Risk Factors” in the Company’s Annual Report on Form 10-K for the year ended December 31, 2020, and other risks described in documents subsequently filed by the Company from time to time with the Securities and Exchange Commission.
While forward-looking statements reflect the Company’s good faith beliefs, they are not guarantees of future performance. The Company disclaims any obligation to update or revise publicly any forward-looking statement to reflect changes in underlying assumptions or factors, new information, data or methods, future events, or other changes after the date of this press release, except as required by applicable law. Prospective investors should not place undue reliance on any forward-looking statements, which are based only on information currently available to the Company (or to third parties making the forward-looking statements).
Page 2
|
|
First Quarter 2021
|
COMPANY PROFILE
Empire State Realty Trust, Inc., or the Company, is a leading real estate investment trust (REIT) that owns, manages, operates, acquires and repositions office and retail properties in Manhattan and the greater New York metropolitan area, including the Empire State Building, the world’s most famous building.
BOARD OF DIRECTORS
| Anthony E. Malkin |
Chairman, President and Chief Executive Officer | |
| Leslie D. Biddle |
Director, Chair of the Compensation and Human Capital Committee | |
| Thomas J. DeRosa |
Director | |
| Steven J. Gilbert |
Director, Lead Independent Director | |
| S. Michael Giliberto |
Director, Chair of Audit Committee | |
| Patricia S. Han |
Director | |
| Grant H. Hill |
Director | |
| R. Paige Hood |
Director, Chair of the Finance Committee | |
| James D. Robinson IV |
Director, Chair of Nominating and Corporate Governance Committee |
EXECUTIVE MANAGEMENT
| Anthony E. Malkin |
Chairman, President and Chief Executive Officer | |
| Christina Chiu |
Executive Vice President and Chief Financial Officer | |
| Thomas P. Durels |
Executive Vice President, Real Estate | |
| Thomas N. Keltner, Jr. |
Executive Vice President, General Counsel and Secretary |
COMPANY INFORMATION
| Corporate Headquarters | Investor Relations | New York Stock Exchange | ||
| 111 West 33rd Street, 12th Floor | Greg Faje | Trading Symbol: ESRT | ||
| New York, NY 10120 | IR@empirestaterealtytrust.com | |||
| www.empirestaterealtytrust.com | ||||
| (212) 850-2600 |
RESEARCH COVERAGE
| Bank of America Merrill Lynch | James Feldman | (646) 855-5808 | james.feldman@baml.com | |||
| BMO Capital Markets Corp. | John Kim | (212) 885-4115 | jp.kim@bmo.com | |||
| BTIG | Thomas Catherwood | (212) 738-6140 | tcatherwood@btig.com | |||
| Citi | Michael Bilerman | (212) 816-1383 | michael.bilerman@citi.com | |||
| Emmanuel Korchman | (212) 816-1382 | emmanuel.korchman@citi.com | ||||
| Evercore ISI | Steve Sakwa | (212) 446-9462 | steve.sakwa@evercoreisi.com | |||
| Green Street Advisors | Daniel Ismail | (949) 640-8780 | dismail@greenstreetadvisors.com | |||
| Goldman Sachs | Richard Skidmore | (801) 741-5459 | richard.skidmore@gs.com | |||
| KeyBanc Capital Markets | Craig Mailman | (917) 368-2316 | cmailman@key.com | |||
| Wells Fargo Securities, LLC | Blaine Heck | (443) 263-6529 | blaine.heck@wellsfargo.com |
Page 3
|
|
First Quarter 2021 Financial Highlights (unaudited and dollars in thousands, except per share amounts)
|
| Three Months Ended | ||||||||||||||||||||
| Selected Items: |
March 31, 2021 |
December 31, 2020 |
September 30, 2020 |
June 30, 2020 |
March 31, 2020 |
|||||||||||||||
| Revenue |
$ | 145,304 | $ | 151,399 | $ | 146,575 | $ | 141,030 | $ | 170,224 | ||||||||||
| Net income (loss) |
$ | (3,191 | ) | $ | 710 | $ | (12,269 | ) | $ | (19,618 | ) | $ | 8,288 | |||||||
| Cash net operating income (1) |
$ | 71,340 | $ | 82,079 | $ | 73,037 | $ | 78,368 | $ | 81,528 | ||||||||||
| Core funds from operations (“Core FFO”) (1) |
$ | 41,035 | $ | 47,308 | $ | 34,896 | $ | 39,498 | $ | 53,712 | ||||||||||
| Core funds available for distribution (“Core FAD”) (1) |
$ | 29,693 | $ | 41,267 | $ | 24,083 | $ | 37,786 | $ | 37,738 | ||||||||||
| Core FFO per share - diluted |
$ | 0.15 | $ | 0.17 | $ | 0.12 | $ | 0.14 | $ | 0.18 | ||||||||||
| Diluted weighted average shares |
277,881,000 | 278,471,000 | 280,940,000 | 283,384,000 | 292,645,000 | |||||||||||||||
| Dividends declared and paid per share |
$ | — | $ | — | $ | — | $ | 0.105 | $ | 0.105 | ||||||||||
| Portfolio Statistics: |
| |||||||||||||||||||
| Number of properties |
20 | 20 | 20 | 20 | 20 | |||||||||||||||
| Total rentable square footage |
10,134,980 | 10,135,330 | 10,136,793 | 10,132,492 | 10,135,413 | |||||||||||||||
| Percent occupied (2) |
85.0 | % | 85.9 | % | 85.9 | % | 85.6 | % | 88.7 | % | ||||||||||
| Percent leased (3) |
88.7 | % | 88.7 | % | 89.7 | % | 89.6 | % | 91.1 | % | ||||||||||
| Observatory Metrics: |
||||||||||||||||||||
| Number of visitors (4) |
51,000 | 55,000 | 30,000 | — | 422,000 | |||||||||||||||
| Change in visitors year over year |
(87.9 | %) | (93.8 | %) | (97.1 | %) | N/A | (29.8 | %) | |||||||||||
| Observatory revenues (5) |
$ | 2,603 | $ | 5,008 | $ | 4,419 | $ | 86 | $ | 19,544 | ||||||||||
| Change in revenues year over year |
(86.7 | %) | (86.7 | %) | (88.2 | %) | N/A | (5.0 | %) | |||||||||||
| Ratios: |
||||||||||||||||||||
| Debt to Total Market Capitalization (6) |
39.7 | % | 43.9 | % | 51.6 | % | 54.3 | % | 47.8 | % | ||||||||||
| Net Debt to Total Market Capitalization (6) |
32.6 | % | 37.2 | % | 46.3 | % | 43.7 | % | 35.5 | % | ||||||||||
| Debt and Perpetual Preferred Units to Total Market Capitalization (6) |
41.3 | % | 45.7 | % | 53.9 | % | 56.2 | % | 49.5 | % | ||||||||||
| Net Debt and Perpetual Preferred Units to Total Market Capitalization (6) |
34.5 | % | 39.2 | % | 48.9 | % | 46.1 | % | 37.6 | % | ||||||||||
| Debt to Adjusted EBITDA (1) (7) |
8.8x | 8.4x | 6.9x | 7.9x | 7.3x | |||||||||||||||
| Net Debt to Adjusted EBITDA (1) (7) |
6.5x | 6.3x | 5.6x | 5.2x | 4.4x | |||||||||||||||
| Interest Coverage Ratio |
3.5x | 3.7x | 2.9x | 2.6x | 4.3x | |||||||||||||||
| Core FFO Payout Ratio (8) |
0 | % | 0 | % | 0 | % | 83 | % | 61 | % | ||||||||||
| Core FAD Payout Ratio (9) |
0 | % | 0 | % | 0 | % | 86 | % | 87 | % | ||||||||||
| Class A common stock price at quarter end |
$ | 11.13 | $ | 9.32 | $ | 6.12 | $ | 7.00 | $ | 8.96 | ||||||||||
| Average closing price |
$ | 10.42 | $ | 7.89 | $ | 6.49 | $ | 7.72 | $ | 12.24 | ||||||||||
| Dividends per share - annualized |
$ | — | $ | — | $ | — | $ | 0.42 | $ | 0.42 | ||||||||||
| Dividend yield (10) |
0.0 | % | 0.0 | % | 0.0 | % | 6.0 | % | 4.7 | % | ||||||||||
| Series 2013 Private Perpetual Preferred Units outstanding ($16.62 liquidation value) |
1,560,360 | 1,560,360 | 1,560,360 | 1,560,360 | 1,560,360 | |||||||||||||||
| Series 2019 Private Perpetual Preferred Units outstanding ($13.52 liquidation value) |
4,664,038 | 4,664,038 | 4,664,038 | 4,664,038 | 4,664,038 | |||||||||||||||
| Class A common stock |
171,327,270 | 170,555,274 | 171,981,257 | 172,332,358 | 176,112,860 | |||||||||||||||
| Class B common stock |
1,004,601 | 1,010,130 | 1,010,832 | 1,014,221 | 1,015,149 | |||||||||||||||
| Operating partnership units |
113,290,326 | 113,713,319 | 115,383,860 | 117,475,995 | 120,548,216 | |||||||||||||||
|
|
|
|
|
|
|
|
|
|
|
|||||||||||
| Total common stock and operating partnership units outstanding (11) |
285,622,197 | 285,278,723 | 288,375,949 | 290,822,574 | 297,676,225 | |||||||||||||||
|
|
|
|
|
|
|
|
|
|
|
|||||||||||
Notes:
| (1) | Represents non-GAAP financial measures. For a discussion on what these metrics represent and why the Company presents them, see page 23 and for a reconciliation of these metrics to net income, see pages 5 and 19. |
| (2) | Based on leases signed and commenced as of end of period. |
| (3) | Represents occupancy and includes signed leases not commenced. |
| (4) | Reflects the number of visitors who pass through the turnstile, excluding visitors who make a second visit on the same ticket at no additional charge. |
| (5) | Observatory revenues include the fixed license fee received from WDFG North America, the Observatory gift shop operator. See page 16. |
| (6) | Market capitalization represents the sum of (i) Company’s common stock per share price as of March 31, 2021 multiplied by the total outstanding number of shares of common stock and operating partnership units as of March 31, 2021; (ii) the number of Series 2014 perpetual preferred units at March 31, 2021 multiplied by $16.62, (iii) the number of Series 2019 perpetual preferred units at March 31, 2021 multiplied by $13.52, and (iv) our outstanding indebtedness as of March 31, 2021. |
| (7) | Calculated based on trailing 12 months Adjusted EBITDA. |
| (8) | Represents the amount of Core FFO paid out in distributions. |
| (9) | Represents the amount of Core FAD paid out in distributions. |
| (10) | Based on the closing price per share of Class A common stock on March 31, 2021. |
| (11) | As of March 31, 2021, the Company has had conversions from operating partnership units and Class B common shares to Class A common shares totaling 61.7 million shares or approximately $686 million at a closing share price of $11.13. This represents a 75% increase in the number of Class A shares since the IPO. |
Page 4
|
|
First Quarter 2021 Property Summary - Same Store Net Operating Income (“NOI”) by Quarter (unaudited and dollars in thousands)
|
| Three Months Ended | ||||||||||||||||||||
| March 31, 2021 |
December 31, 2020 |
September 30, 2020 |
June 30, 2020 |
March 31, 2020 |
||||||||||||||||
| Same Store Total Portfolio |
||||||||||||||||||||
| Revenues |
$ | 141,136 | $ | 138,255 | $ | 140,698 | $ | 139,610 | $ | 150,123 | ||||||||||
| Operating expenses |
(64,057 | ) | (65,313 | ) | (67,363 | ) | (61,661 | ) | (73,053 | ) | ||||||||||
|
|
|
|
|
|
|
|
|
|
|
|||||||||||
| Same store property NOI |
77,079 | 72,942 | 73,335 | 77,949 | 77,070 | |||||||||||||||
| Straight-line rent |
(6,347 | ) | 640 | (395 | ) | 2,710 | (8,193 | ) | ||||||||||||
| Above/below-market rent revenue amortization |
(654 | ) | (674 | ) | (679 | ) | (1,366 | ) | (908 | ) | ||||||||||
| Below-market ground lease amortization |
1,958 | 1,958 | 1,957 | 1,958 | 1,958 | |||||||||||||||
|
|
|
|
|
|
|
|
|
|
|
|||||||||||
| Total same store property cash NOI - excluding lease termination fees |
$ | 72,036 | $ | 74,866 | $ | 74,218 | $ | 81,251 | $ | 69,927 | ||||||||||
|
|
|
|
|
|
|
|
|
|
|
|||||||||||
| Percent increase over prior year |
3.0 | % | 1.5 | % | 9.3 | % | 18.0 | % | 4.8 | % | ||||||||||
|
|
|
|
|
|
|
|
|
|
|
|||||||||||
| Property cash NOI |
$ | 72,036 | $ | 74,866 | $ | 74,218 | $ | 81,251 | $ | 69,927 | ||||||||||
| Observatory cash NOI |
(1,985 | ) | (628 | ) | (1,512 | ) | (3,916 | ) | 11,390 | |||||||||||
| Lease termination fees |
1,289 | 7,841 | 331 | 1,033 | 211 | |||||||||||||||
|
|
|
|
|
|
|
|
|
|
|
|||||||||||
| Total portfolio same store cash NOI |
$ | 71,340 | $ | 82,079 | $ | 73,037 | $ | 78,368 | $ | 81,528 | ||||||||||
|
|
|
|
|
|
|
|
|
|
|
|||||||||||
| Same Store Manhattan Office Portfolio (1) |
||||||||||||||||||||
| Revenues |
$ | 121,611 | $ | 119,191 | $ | 121,348 | $ | 119,445 | $ | 128,909 | ||||||||||
| Operating expenses |
(54,543 | ) | (55,618 | ) | (57,642 | ) | (52,619 | ) | (62,670 | ) | ||||||||||
|
|
|
|
|
|
|
|
|
|
|
|||||||||||
| Same store property NOI |
67,068 | 63,573 | 63,706 | 66,826 | 66,239 | |||||||||||||||
| Straight-line rent |
(7,117 | ) | 522 | (380 | ) | 1,774 | (8,338 | ) | ||||||||||||
| Above/below-market rent revenue amortization |
(654 | ) | (674 | ) | (679 | ) | (1,366 | ) | (908 | ) | ||||||||||
| Below-market ground lease amortization |
1,958 | 1,958 | 1,957 | 1,958 | 1,958 | |||||||||||||||
|
|
|
|
|
|
|
|
|
|
|
|||||||||||
| Total same store property cash NOI - excluding lease termination fees |
61,255 | 65,379 | 64,604 | 69,192 | 58,951 | |||||||||||||||
| Lease termination fees |
1,167 | 7,834 | 282 | 863 | 159 | |||||||||||||||
|
|
|
|
|
|
|
|
|
|
|
|||||||||||
| Total same store property cash NOI |
$ | 62,422 | $ | 73,213 | $ | 64,886 | $ | 70,055 | $ | 59,110 | ||||||||||
|
|
|
|
|
|
|
|
|
|
|
|||||||||||
| Same Store Greater New York Metropolitan Area Office Portfolio |
||||||||||||||||||||
| Revenues |
$ | 15,721 | $ | 15,623 | $ | 15,930 | $ | 16,529 | $ | 16,915 | ||||||||||
| Operating expenses |
(7,488 | ) | (7,747 | ) | (7,870 | ) | (7,230 | ) | (8,479 | ) | ||||||||||
|
|
|
|
|
|
|
|
|
|
|
|||||||||||
| Same store property NOI |
8,233 | 7,876 | 8,060 | 9,299 | 8,436 | |||||||||||||||
| Straight-line rent |
480 | 198 | 23 | 331 | 12 | |||||||||||||||
| Above/below-market rent revenue amortization |
— | — | — | — | — | |||||||||||||||
| Below-market ground lease amortization |
— | — | — | — | — | |||||||||||||||
|
|
|
|
|
|
|
|
|
|
|
|||||||||||
| Total same store property cash NOI - excluding lease termination fees |
8,713 | 8,074 | 8,083 | 9,630 | 8,448 | |||||||||||||||
| Lease termination fees |
122 | 7 | 49 | 170 | 52 | |||||||||||||||
|
|
|
|
|
|
|
|
|
|
|
|||||||||||
| Total same store property cash NOI |
$ | 8,835 | $ | 8,081 | $ | 8,132 | $ | 9,800 | $ | 8,500 | ||||||||||
|
|
|
|
|
|
|
|
|
|
|
|||||||||||
| Same Store Standalone Retail Portfolio |
||||||||||||||||||||
| Revenues |
$ | 3,804 | $ | 3,441 | $ | 3,420 | $ | 3,636 | $ | 4,299 | ||||||||||
| Operating expenses |
(2,026 | ) | (1,948 | ) | (1,851 | ) | (1,812 | ) | (1,904 | ) | ||||||||||
|
|
|
|
|
|
|
|
|
|
|
|||||||||||
| Same store property NOI |
1,778 | 1,493 | 1,569 | 1,824 | 2,395 | |||||||||||||||
| Straight-line rent |
290 | (80 | ) | (38 | ) | 605 | 133 | |||||||||||||
| Above/below-market rent revenue amortization |
— | — | — | — | — | |||||||||||||||
| Below-market ground lease amortization |
— | — | — | — | — | |||||||||||||||
|
|
|
|
|
|
|
|
|
|
|
|||||||||||
| Total same store property cash NOI - excluding lease termination fees |
2,068 | 1,413 | 1,531 | 2,429 | 2,528 | |||||||||||||||
| Lease termination fees |
— | — | — | — | — | |||||||||||||||
|
|
|
|
|
|
|
|
|
|
|
|||||||||||
| Total same store property cash NOI |
$ | 2,068 | $ | 1,413 | $ | 1,531 | $ | 2,429 | $ | 2,528 | ||||||||||
|
|
|
|
|
|
|
|
|
|
|
|||||||||||
Note:
| (1) | Includes 504,284 rentable square feet of retail space in the Company’s nine Manhattan office properties. |
Page 5
|
|
First Quarter 2021 Net Operating Income (“NOI”), Initial Free Rent Burn-Off and Signed Leases Not Commenced (unaudited and dollars in thousands)
|
| Three Months Ended | ||||||||||||||||||||
| Reconciliation of Net Income to NOI and Cash NOI |
March 31, 2021 |
December 31, 2020 |
September 30, 2020 |
June 30, 2020 |
March 31, 2020 |
|||||||||||||||
| Net income (loss) |
$ | (3,191 | ) | $ | 710 | $ | (12,269 | ) | $ | (19,618 | ) | $ | 8,288 | |||||||
| Add: |
||||||||||||||||||||
| General and administrative expenses |
13,853 | 13,627 | 14,517 | 18,149 | 15,951 | |||||||||||||||
| Depreciation and amortization |
44,457 | 47,397 | 44,733 | 52,783 | 46,093 | |||||||||||||||
| Interest expense |
23,768 | 23,001 | 23,360 | 23,928 | 19,704 | |||||||||||||||
| Income tax expense (benefit) |
(2,106 | ) | (4,177 | ) | 38 | (2,450 | ) | (382 | ) | |||||||||||
| Impairment charges |
— | — | 1,259 | 4,101 | — | |||||||||||||||
| IPO litigation expense |
— | — | 1,165 | — | — | |||||||||||||||
| Less: |
||||||||||||||||||||
| Third-party management and other fees |
(276 | ) | (295 | ) | (283 | ) | (301 | ) | (346 | ) | ||||||||||
| Interest income |
(122 | ) | (108 | ) | (366 | ) | (1,526 | ) | (637 | ) | ||||||||||
|
|
|
|
|
|
|
|
|
|
|
|||||||||||
| Net operating income |
76,383 | 80,155 | 72,154 | 75,066 | 88,671 | |||||||||||||||
| Straight-line rent |
(6,347 | ) | 640 | (395 | ) | 2,710 | (8,193 | ) | ||||||||||||
| Above/below-market rent revenue amortization |
(654 | ) | (674 | ) | (679 | ) | (1,366 | ) | (908 | ) | ||||||||||
| Below-market ground lease amortization |
1,958 | 1,958 | 1,957 | 1,958 | 1,958 | |||||||||||||||
|
|
|
|
|
|
|
|
|
|
|
|||||||||||
| Total cash NOI - including Observatory and lease termination income |
71,340 | 82,079 | 73,037 | 78,368 | 81,528 | |||||||||||||||
| Less: Observatory NOI |
1,985 | 628 | 1,512 | 3,916 | (11,390 | ) | ||||||||||||||
| Less: Lease termination income |
(1,289 | ) | (7,841 | ) | (331 | ) | (1,033 | ) | (211 | ) | ||||||||||
|
|
|
|
|
|
|
|
|
|
|
|||||||||||
| Total property cash NOI - excluding Observatory and lease termination income |
$ | 72,036 | $ | 74,866 | $ | 74,218 | $ | 81,251 | $ | 69,927 | ||||||||||
|
|
|
|
|
|
|
|
|
|
|
|||||||||||
| Burn-off of Free Rent and Signed Leases Not Commenced |
||||||||||||||||||||
| Incremental Annual |
Base Cash Rent Contributing to Cash NOI in the Following Years | |||||||||||||||||||
| Total Portfolio |
Revenue | 2021 | 2022 | 2023 | 2024 | |||||||||||||||
| Commenced leases in free rent period |
$ | 16,725 | $ | 6,264 | $ | 16,118 | $ | 16,725 | $ | 16,725 | ||||||||||
| Signed leases not commenced |
26,260 | 1,664 | 10,558 | 22,626 | 24,807 | |||||||||||||||
|
|
|
|
|
|
|
|
|
|
|
|||||||||||
| Total |
$ | 42,985 | $ | 7,928 | $ | 26,676 | $ | 39,351 | $ | 41,532 | ||||||||||
|
|
|
|
|
|
|
|
|
|
|
|||||||||||
Commenced leases in free rent period
| Incremental | ||||||||||||||||||||||||||
| Square | Cash | Annual | Base Cash Rent Contributing to Cash NOI in the Following Years | |||||||||||||||||||||||
| Feet | Rent Date |
Revenue | 2021 | 2022 | 2023 | 2024 | ||||||||||||||||||||
| Second quarter 2021 - 20 leases |
122,672 | Apr. 2021 - June 2021 |
$ | 6,262 | $ | 3,541 | (1) | $ | 6,262 | $ | 6,262 | $ | 6,262 | |||||||||||||
| Third quarter 2021 - 8 leases |
301,914 | Jul. 2021 - Sept. 2021 |
5,028 | 2,015 | 5,028 | 5,028 | 5,028 | |||||||||||||||||||
| Fourth quarter 2021 - 6 leases |
97,184 | Oct. 2021 - Dec. 2021 |
4,496 | 708 | 4,496 | 4,496 | 4,496 | |||||||||||||||||||
| First quarter 2022 - 1 lease |
6,851 | Jan. 2022 - Mar. 2022 |
158 | — | 119 | 158 | 158 | |||||||||||||||||||
| Second quarter 2022 - 2 leases |
4,980 | Apr. 2022 - June 2022 |
318 | — | 213 | 318 | 318 | |||||||||||||||||||
| Fourth quarter 2022 - 1 lease |
3,695 | Sept. 2022 - Dec. 2022 |
463 | — | — | 463 | 463 | |||||||||||||||||||
|
|
|
|
|
|
|
|
|
|
|
|||||||||||||||||
| $ | 16,725 | $ | 6,264 | $ | 16,118 | $ | 16,725 | $ | 16,725 | |||||||||||||||||
|
|
|
|
|
|
|
|
|
|
|
|||||||||||||||||
Signed leases not commenced (“SLNC”)
| Expected Base Rent | Incremental | |||||||||||||||||||||||||||||
| Square | Commencement | Annual | Base Cash Rent Contributing to Cash NOI in the Following Years | |||||||||||||||||||||||||||
| Tenant |
Feet | GAAP | Cash |
Revenue (2) | 2021 | 2022 | 2023 | 2024 | ||||||||||||||||||||||
| Berkley Insurance Company |
63,173 | July 2021 | Apr. 2023 | $ | 3,300 | $ | — | $ | — | $ | 2,466 | $ | 3,300 | |||||||||||||||||
| Clearview Healthcare Partners, LLC |
39,067 | Jul. 2021 | Oct. 2022 | 2,460 | — | 485 | 2,460 | 2,460 | ||||||||||||||||||||||
| Transit Wireless, LLC |
32,499 | Sept. 2021 | Sept. 2022 | 1,950 | — | 645 | 1,950 | 1,950 | ||||||||||||||||||||||
| Belkin Burden Goldman LLP |
30,598 | Sept. 2021 | Mar. 2022 | 1,840 | — | — | 1,480 | 1,840 | ||||||||||||||||||||||
| Zentalis Pharmaceuticals |
31,362 | Dec. 2021 | Dec. 2022 | 360 | — | 20 | 360 | 360 | ||||||||||||||||||||||
| Burlington Stores |
33,125 | Jan. 2022 | Jan. 2023 | 1,890 | — | — | 1,883 | 1,890 | ||||||||||||||||||||||
| LinkedIn Corporation: |
||||||||||||||||||||||||||||||
| LinkedIn Corporation |
52,666 | Nov. 2021 | Nov. 2021 | 3,840 | 630 | 3,840 | 3,840 | 3,840 | ||||||||||||||||||||||
| LinkedIn Corporation |
52,574 | Jul. 2022 | Jul. 2022 | 3,840 | — | 1,908 | 3,840 | 3,840 | ||||||||||||||||||||||
| LinkedIn Corporation |
30,283 | Dec. 2022 | Oct. 2023 | 670 | — | — | 167 | 670 | ||||||||||||||||||||||
| Target |
32,579 | June 2024 | Oct. 2024 | 1,930 | — | — | — | 477 | ||||||||||||||||||||||
| Other SLNC |
71,127 | |
May 2021- Feb. 2022 |
|
May 2021- June 2022 |
4,180 | 1,034 | 3,660 | 4,180 | 4,180 | ||||||||||||||||||||
|
|
|
|
|
|
|
|
|
|
|
|
|
|||||||||||||||||||
| Total |
469,053 | $ | 26,260 | $ | 1,664 | $ | 10,558 | $ | 22,626 | $ | 24,807 | |||||||||||||||||||
|
|
|
|
|
|
|
|
|
|
|
|
|
|||||||||||||||||||
Notes:
| (1) | As an example, the 2021 amount represents cash revenue contributing from the cash rent commencement date of January 2021 through December 2021. The full annual amount is realized in 2022. |
| (2) | Reflects new annual rent less annual rent from existing tenant in the space. |
Page 6
|
|
First Quarter 2021 Property Summary - Leasing Activity by Quarter (unaudited)
|
| Three Months Ended | ||||||||||||||||||||
| March 31, 2021 |
December 31, 2020 |
September 30, 2020 |
June 30, 2020 |
March 31, 2020 |
||||||||||||||||
| Total Portfolio |
||||||||||||||||||||
| Total leases executed |
26 | 33 | 18 | 19 | 35 | |||||||||||||||
| Weighted average lease term |
10.0 years | 7.7 years | 8.1 years | 4.7 years | 6.8 years | |||||||||||||||
| Average free rent period |
9.5 months | 7.6 months | 5.9 months | 2.7 months | 4.1 months | |||||||||||||||
| Office |
||||||||||||||||||||
| Total square footage executed |
170,757 | 395,035 | 242,323 | 99,229 | 117,481 | |||||||||||||||
| Average cash rent psf - leases executed |
$ | 54.42 | $ | 52.52 | $ | 50.98 | $ | 52.82 | $ | 57.29 | ||||||||||
| Previously escalated cash rents psf |
$ | 50.96 | $ | 55.53 | $ | 53.74 | $ | 51.40 | $ | 52.43 | ||||||||||
| Percentage of new cash rent over previously escalated rents |
6.8 | % | (5.4 | %) | -5.1 | % | 2.8 | % | 9.3 | % | ||||||||||
| Retail |
||||||||||||||||||||
| Total square footage executed |
1,060 | 18,321 | 5,126 | 14,202 | 31,662 | |||||||||||||||
| Average cash rent psf - leases executed |
$ | 90.00 | $ | 132.75 | $ | 53.68 | $ | 145.58 | $ | 101.03 | ||||||||||
| Previously escalated cash rents psf |
$ | 97.32 | $ | 234.27 | $ | 55.15 | $ | 158.58 | $ | 108.81 | ||||||||||
| Percentage of new cash rent over previously escalated rents |
(7.5 | %) | (43.3 | %) | (2.7 | %) | (8.2 | %) | (7.1 | %) | ||||||||||
| Total Portfolio |
||||||||||||||||||||
| Total square footage executed |
171,817 | 413,356 | 247,449 | 113,431 | 149,143 | |||||||||||||||
| Average cash rent psf - leases executed |
$ | 54.64 | $ | 56.08 | $ | 51.04 | $ | 64.43 | $ | 66.58 | ||||||||||
| Previously escalated cash rents psf |
$ | 51.24 | $ | 63.45 | $ | 53.77 | $ | 64.82 | $ | 64.40 | ||||||||||
| Percentage of new cash rent over previously escalated rents |
6.6 | % | (11.6 | %) | (5.1 | %) | -0.6 | % | 3.4 | % | ||||||||||
| Leasing commission costs per square foot |
$ | 20.39 | $ | 14.17 | $ | 7.31 | $ | 13.52 | $ | 20.19 | ||||||||||
| Tenant improvement costs per square foot |
74.39 | 30.58 | 41.78 | 21.68 | 100.79 | |||||||||||||||
|
|
|
|
|
|
|
|
|
|
|
|||||||||||
| Total LC and TI per square foot (1) |
$ | 94.78 | $ | 44.75 | $ | 49.09 | $ | 35.20 | $ | 120.98 | ||||||||||
|
|
|
|
|
|
|
|
|
|
|
|||||||||||
| Occupancy |
85.0 | % | 85.9 | % | 85.9 | % | 85.6 | % | 88.7 | % | ||||||||||
| Manhattan Office Portfolio (2) |
||||||||||||||||||||
| Total leases executed |
18 | 25 | 9 | 13 | 26 | |||||||||||||||
| Office - New Leases |
||||||||||||||||||||
| Total square footage executed |
111,397 | 321,848 | 130,783 | 24,859 | 63,153 | |||||||||||||||
| Average cash rent psf - leases executed |
$ | 57.66 | $ | 54.00 | $ | 51.93 | $ | 66.94 | $ | 62.78 | ||||||||||
| Previously escalated cash rents psf |
$ | 50.25 | $ | 57.87 | $ | 48.56 | $ | 61.55 | $ | 52.56 | ||||||||||
| Percentage of new cash rent over previously escalated rents |
14.7 | % | -6.4 | % | 6.9 | % | 8.7 | % | 19.4 | % | ||||||||||
| Office - Renewal Leases |
||||||||||||||||||||
| Total square footage executed |
31,612 | 36,571 | 6,049 | 27,123 | 30,712 | |||||||||||||||
| Average cash rent psf - leases executed |
$ | 57.58 | $ | 50.80 | $ | 50.48 | $ | 58.35 | $ | 60.20 | ||||||||||
| Previously escalated cash rents psf |
$ | 65.12 | $ | 48.99 | $ | 60.61 | $ | 58.39 | $ | 60.02 | ||||||||||
| Percentage of new cash rent over previously escalated rents |
(11.6 | %) | 3.7 | % | (16.7 | %) | -0.1 | % | 0.3 | % | ||||||||||
| Retail - New and Renewal Leases |
||||||||||||||||||||
| Total square footage executed |
1,060 | 11,394 | 5,126 | 10,702 | 26,432 | |||||||||||||||
| Average cash rent psf - leases executed |
$ | 90.00 | $ | 116.92 | $ | 53.68 | $ | 149.50 | $ | 76.73 | ||||||||||
| Previously escalated cash rents psf |
$ | 97.32 | $ | 201.69 | $ | 55.15 | $ | 150.16 | $ | 103.75 | ||||||||||
| Percentage of new cash rent over previously escalated rents |
(7.5 | %) | (42.0 | %) | (2.7 | %) | (0.4 | %) | (26.0 | %) | ||||||||||
| Total Manhattan Office Portfolio |
||||||||||||||||||||
| Total square footage executed |
144,069 | 369,813 | 141,958 | 62,684 | 120,297 | |||||||||||||||
| Average cash rent psf - leases executed |
$ | 57.88 | $ | 55.62 | $ | 51.93 | $ | 77.32 | $ | 65.19 | ||||||||||
| Previously escalated cash rents psf |
$ | 53.86 | $ | 61.25 | $ | 49.31 | $ | 75.31 | $ | 65.71 | ||||||||||
| Percentage of new cash rent over previously escalated rents |
7.5 | % | -9.2 | % | 5.3 | % | 2.7 | % | -0.8 | % | ||||||||||
| Leasing commission costs per square foot |
$ | 23.57 | $ | 15.20 | $ | 3.80 | $ | 19.84 | $ | 20.57 | ||||||||||
| Tenant improvement costs per square foot |
81.11 | 32.93 | 17.36 | 39.23 | 107.77 | |||||||||||||||
|
|
|
|
|
|
|
|
|
|
|
|||||||||||
| Total LC and TI per square foot (2) |
$ | 104.68 | $ | 48.13 | $ | 21.16 | $ | 59.07 | $ | 128.34 | ||||||||||
|
|
|
|
|
|
|
|
|
|
|
|||||||||||
| Occupancy |
86.2 | % | 87.2 | % | 86.9 | % | 86.8 | % | 89.8 | % | ||||||||||
Page 7
|
|
First Quarter 2021 Property Summary - Leasing Activity by Quarter - (Continued) (unaudited)
|
| Three Months Ended | ||||||||||||||||||||
| March 31, 2021 |
December 31, 2020 |
September 30, 2020 |
June 30, 2020 |
March 31, 2020 |
||||||||||||||||
| Greater New York Metropolitan Area Office Portfolio |
||||||||||||||||||||
| Total leases executed |
8 | 7 | 9 | 5 | 7 | |||||||||||||||
| Total square footage executed |
27,748 | 36,616 | 105,491 | 47,247 | 23,616 | |||||||||||||||
| Average cash rent psf - leases executed |
$ | 37.80 | $ | 41.23 | $ | 49.84 | $ | 42.21 | $ | 38.85 | ||||||||||
| Previously escalated cash rents psf |
$ | 37.64 | $ | 43.25 | $ | 59.77 | $ | 42.04 | $ | 42.23 | ||||||||||
| Percentage of new cash rent over previously escalated rents |
0.4 | % | (4.7 | %) | (16.6 | %) | 0.4 | % | (8.0 | %) | ||||||||||
| Leasing commission costs per square foot |
$ | 3.88 | $ | 6.35 | $ | 12.02 | $ | 5.78 | $ | 7.34 | ||||||||||
| Tenant improvement costs per square foot |
39.53 | 12.61 | 74.65 | — | 51.56 | |||||||||||||||
|
|
|
|
|
|
|
|
|
|
|
|||||||||||
| Total LC and TI per square foot (2) |
$ | 43.41 | $ | 18.96 | $ | 86.67 | $ | 5.78 | $ | 58.90 | ||||||||||
|
|
|
|
|
|
|
|
|
|
|
|||||||||||
| Occupancy |
78.4 | % | 79.0 | % | 80.1 | % | 79.1 | % | 83.0 | % | ||||||||||
| Standalone Retail Portfolio |
||||||||||||||||||||
| Total leases executed |
— | 1 | — | 1 | 2 | |||||||||||||||
| Total square footage executed |
— | 6,927 | — | 3,500 | 5,230 | |||||||||||||||
| Average cash rent psf - leases executed |
$ | — | $ | 158.80 | $ | — | $ | 133.59 | $ | 223.86 | ||||||||||
| Previously escalated cash rents psf |
$ | — | $ | 287.86 | $ | — | $ | 184.31 | $ | 134.41 | ||||||||||
| Percentage of new cash rent over previously escalated rents |
0.0 | % | (44.8 | %) | 0.0 | % | (27.5 | %) | 66.5 | % | ||||||||||
| Leasing commission costs per square foot |
$ | — | $ | — | $ | — | $ | 4.71 | $ | 69.53 | ||||||||||
| Tenant improvement costs per square foot |
— | — | — | — | 162.60 | |||||||||||||||
|
|
|
|
|
|
|
|
|
|
|
|||||||||||
| Total LC and TI per square foot (2) |
$ | — | $ | — | $ | — | $ | 4.71 | $ | 232.13 | ||||||||||
|
|
|
|
|
|
|
|
|
|
|
|||||||||||
| Occupancy |
97.1 | % | 97.1 | % | 95.2 | % | 95.2 | % | 95.2 | % | ||||||||||
Notes:
| (1) | Presents all tenant improvement and leasing commission costs as if they were incurred in the period in which the lease was signed, which may be different than the period in which they were actually paid. |
| (2) | Includes 504,284 rentable square feet of retail space in the Company’s nine Manhattan office properties. |
Page 8
|
|
First Quarter 2021 Property Detail (unaudited)
|
| Property Name |
Location or Sub-Market |
Rentable Square Feet (1) |
Percent Occupied (2) |
Annualized Rent (3) |
Annualized Rent per Occupied Square Foot (4) |
Number of Leases (5) |
||||||||||||||||
| Manhattan Office Properties - Office |
||||||||||||||||||||||
| The Empire State Building (6) |
Penn Station -Times Sq. South | 2,714,482 | 88.6 | % | $ | 147,392,716 | $ | 61.32 | 157 | |||||||||||||
| One Grand Central Place |
Grand Central | 1,246,992 | 84.1 | % | 63,206,426 | 60.26 | 164 | |||||||||||||||
| 1400 Broadway (7) |
Penn Station -Times Sq. South | 917,716 | 86.7 | % | 44,775,017 | 56.28 | 23 | |||||||||||||||
| 111 West 33rd Street (8) |
Penn Station -Times Sq. South | 641,034 | 91.4 | % | 36,403,751 | 62.16 | 22 | |||||||||||||||
| 250 West 57th Street |
Columbus Circle - West Side | 474,120 | 80.1 | % | 23,853,970 | 62.80 | 34 | |||||||||||||||
| 501 Seventh Avenue |
Penn Station -Times Sq. South | 461,380 | 79.5 | % | 18,444,756 | 50.31 | 23 | |||||||||||||||
| 1359 Broadway |
Penn Station -Times Sq. South | 456,386 | 94.2 | % | 24,543,258 | 57.06 | 31 | |||||||||||||||
| 1350 Broadway (9) |
Penn Station -Times Sq. South | 372,251 | 78.1 | % | 18,080,505 | 62.19 | 52 | |||||||||||||||
| 1333 Broadway |
Penn Station -Times Sq. South | 295,635 | 79.9 | % | 13,390,627 | 56.67 | 10 | |||||||||||||||
|
|
|
|
|
|
|
|
|
|
|
|||||||||||||
| Manhattan Office Properties - Office |
7,579,996 | 86.2 | % | 390,091,025 | 59.67 | 516 | ||||||||||||||||
| Manhattan Office Properties - Retail |
||||||||||||||||||||||
| The Empire State Building |
Penn Station -Times Sq. South | 97,322 | 48.3 | % | 5,151,092 | 109.50 | 10 | |||||||||||||||
| One Grand Central Place |
Grand Central | 68,733 | 100.0 | % | 8,762,467 | 127.49 | 14 | |||||||||||||||
| 1400 Broadway (7) |
Penn Station -Times Sq. South | 20,176 | 77.2 | % | 1,719,243 | 110.41 | 7 | |||||||||||||||
| 112 West 34th Street (8) |
Penn Station -Times Sq. South | 91,280 | 100.0 | % | 23,412,972 | 256.50 | 4 | |||||||||||||||
| 250 West 57th Street |
Columbus Circle - West Side | 67,927 | 87.6 | % | 9,178,318 | 154.18 | 7 | |||||||||||||||
| 501 Seventh Avenue |
Penn Station -Times Sq. South | 33,632 | 90.6 | % | 2,152,510 | 70.64 | 9 | |||||||||||||||
| 1359 Broadway |
Penn Station -Times Sq. South | 27,506 | 100.0 | % | 2,070,046 | 75.26 | 6 | |||||||||||||||
| 1350 Broadway (9) |
Penn Station -Times Sq. South | 30,707 | 73.3 | % | 5,752,423 | 255.72 | 4 | |||||||||||||||
| 1333 Broadway |
Penn Station -Times Sq. South | 67,001 | 100.0 | % | 9,650,652 | 144.04 | 4 | |||||||||||||||
|
|
|
|
|
|
|
|
|
|
|
|||||||||||||
| Manhattan Office Properties - Retail |
504,284 | 85.2 | % | 67,849,724 | 157.93 | 65 | ||||||||||||||||
|
|
|
|
|
|
|
|
|
|
|
|||||||||||||
| Sub-Total/Weighted Average Manhattan Office Properties - Office and Retail |
8,084,280 | 86.2 | % | 457,940,749 | 65.73 | 581 | ||||||||||||||||
|
|
|
|
|
|
|
|
|
|
|
|||||||||||||
| Greater New York Metropolitan Area Office Properties |
||||||||||||||||||||||
| First Stamford Place (10) |
Stamford, CT | 776,397 | 83.2 | % | 28,980,857 | 44.85 | 42 | |||||||||||||||
| Metro Center |
Stamford, CT | 286,160 | 67.9 | % | 11,493,834 | 59.13 | 19 | |||||||||||||||
| 383 Main Avenue |
Norwalk, CT | 260,401 | 56.1 | % | 4,367,697 | 29.88 | 22 | |||||||||||||||
| 500 Mamaroneck Avenue |
Harrison, NY | 287,305 | 85.1 | % | 7,417,708 | 30.33 | 29 | |||||||||||||||
| 10 Bank Street |
White Plains, NY | 234,949 | 91.9 | % | 7,944,916 | 36.80 | 32 | |||||||||||||||
|
|
|
|
|
|
|
|
|
|
|
|||||||||||||
| Sub-Total/Weighted Average Greater New York Metropolitan Area Office Properties |
1,845,212 | 78.4 | % | 60,205,012 | 41.60 | 144 | ||||||||||||||||
|
|
|
|
|
|
|
|
|
|
|
|||||||||||||
| Standalone Retail Properties |
||||||||||||||||||||||
| 10 Union Square |
Union Square | 57,984 | 94.7 | % | 6,645,268 | 121.04 | 11 | |||||||||||||||
| 1542 Third Avenue |
Upper East Side | 56,250 | 100.0 | % | 4,191,658 | 74.52 | 4 | |||||||||||||||
| 1010 Third Avenue |
Upper East Side | 44,662 | 100.0 | % | 3,634,510 | 81.38 | 2 | |||||||||||||||
| 77 West 55th Street |
Midtown | 25,388 | 100.0 | % | 2,861,061 | 112.69 | 3 | |||||||||||||||
| 69-97 Main Street |
Westport, CT | 16,874 | 82.9 | % | 1,516,475 | 108.36 | 4 | |||||||||||||||
| 103-107 Main Street |
Westport, CT | 4,330 | 100.0 | % | 606,200 | 140.00 | 1 | |||||||||||||||
|
|
|
|
|
|
|
|
|
|
|
|||||||||||||
| Sub-Total/Weighted Average Standalone Retail Properties |
205,488 | 97.1 | % | 19,455,172 | 97.51 | 25 | ||||||||||||||||
|
|
|
|
|
|
|
|
|
|
|
|||||||||||||
| Portfolio Total |
10,134,980 | 85.0 | % | $ | 537,600,933 | $ | 62.41 | 750 | ||||||||||||||
|
|
|
|
|
|
|
|
|
|
|
|||||||||||||
| Total/Weighted Average Office Properties |
9,425,208 | 84.7 | % | $ | 450,296,037 | $ | 56.39 | 660 | ||||||||||||||
| Total/Weighted Average Retail Properties |
709,772 | 88.6 | % | 87,304,896 | 138.77 | 90 | ||||||||||||||||
|
|
|
|
|
|
|
|
|
|
|
|||||||||||||
| Portfolio Total |
10,134,980 | 85.0 | % | $ | 537,600,933 | $ | 62.41 | 750 | ||||||||||||||
|
|
|
|
|
|
|
|
|
|
|
|||||||||||||
Notes:
| (1) | Excludes (i) 194,929 square feet of space across the Company’s portfolio attributable to building management use and tenant amenities and (ii) 79,613 square feet of space attributable to the Company’s observatory. |
| (2) | Based on leases signed and commenced as of March 31, 2021. |
| (3) | Represents annualized base rent and current reimbursement for operating expenses and real estate taxes. |
| (4) | Represents annualized rent under leases commenced as of March 31, 2021 divided by occupied square feet. |
| (5) | Represents the number of leases at each property or on a portfolio basis. If a tenant has more than one lease, whether or not at the same property, but with different expirations, the number of leases is calculated equal to the number of leases with different expirations. |
| (6) | Includes 38,912 rentable square feet of space leased by the Company’s broadcasting tenants. |
| (7) | Denotes a ground leasehold interest in the property with a remaining term, including unilateral extension rights available to the Company, of approximately 42 years (expiring December 31, 2063). |
| (8) | Denotes a ground leasehold interest in the property with a remaining term, including unilateral extension rights available to the Company, of approximately 56 years (expiring May 31, 2077). |
| (9) | Denotes a ground leasehold interest in the property with a remaining term, including unilateral extension rights available to the Company, of approximately 29 years (expiring July 31, 2050). |
| (10) | First Stamford Place consists of three buildings. |
Page 9
|
|
First Quarter 2021 Total Portfolio Expirations and Vacates Summary (unaudited and in square feet)
|
| Three Months Ended | ||||||||||||||||||||||||
| Actual | Forecast (1) | Forecast (1) | ||||||||||||||||||||||
| Total Portfolio (2) |
March 31, 2021 |
June 30, 2021 |
September 30, 2021 |
December 31, 2021 |
Apr. to Dec. 2021 | Full Year 2022 | ||||||||||||||||||
| Total expirations |
111,546 | 273,379 | 146,848 | 177,119 | 597,346 | 558,069 | ||||||||||||||||||
| Less: broadcasting |
— | (2,708 | ) | — | — | (2,708 | ) | (4,281 | ) | |||||||||||||||
|
|
|
|
|
|
|
|
|
|
|
|
|
|||||||||||||
| Office and retail expirations |
111,546 | 270,671 | 146,848 | 177,119 | 594,638 | 553,788 | ||||||||||||||||||
|
|
|
|
|
|
|
|
|
|
|
|
|
|||||||||||||
| Renewals & relocations (3) |
9,494 | 67,389 | 82,174 | 69,419 | 218,982 | 72,406 | ||||||||||||||||||
| New leases (4) |
43,901 | 14,532 | 3,932 | — | 18,464 | 44,619 | ||||||||||||||||||
| Vacates (5) |
58,151 | 179,167 | 56,812 | 63,616 | 299,595 | 186,541 | ||||||||||||||||||
| Unknown (6) |
— | 9,583 | 3,930 | 44,084 | 57,597 | 250,222 | ||||||||||||||||||
|
|
|
|
|
|
|
|
|
|
|
|
|
|||||||||||||
| Total Portfolio expirations and vacates |
111,546 | 270,671 | 146,848 | 177,119 | 594,638 | 553,788 | ||||||||||||||||||
|
|
|
|
|
|
|
|
|
|
|
|
|
|||||||||||||
| Manhattan Office Portfolio |
||||||||||||||||||||||||
|
|
|
|||||||||||||||||||||||
| Total expirations |
75,574 | 219,886 | 117,036 | 101,263 | 438,185 | 361,117 | ||||||||||||||||||
| Less: broadcasting |
— | (2,708 | ) | — | — | (2,708 | ) | (4,281 | ) | |||||||||||||||
|
|
|
|
|
|
|
|
|
|
|
|
|
|||||||||||||
| Office expirations |
75,574 | 217,178 | 117,036 | 101,263 | 435,477 | 356,836 | ||||||||||||||||||
|
|
|
|
|
|
|
|
|
|
|
|
|
|||||||||||||
| Renewals & relocations (3) |
2,837 | 63,271 | 61,049 | 46,618 | 170,938 | 62,501 | ||||||||||||||||||
| New leases (4) |
43,901 | 14,532 | 3,932 | — | 18,464 | 44,619 | ||||||||||||||||||
| Vacates (5) |
28,836 | 132,688 | 48,125 | 20,028 | 200,841 | 89,615 | ||||||||||||||||||
| Unknown (6) |
— | 6,687 | 3,930 | 34,617 | 45,234 | 160,101 | ||||||||||||||||||
|
|
|
|
|
|
|
|
|
|
|
|
|
|||||||||||||
| Total expirations and vacates |
75,574 | 217,178 | 117,036 | 101,263 | 435,477 | 356,836 | ||||||||||||||||||
|
|
|
|
|
|
|
|
|
|
|
|
|
|||||||||||||
| Greater New York Metropolitan Area Office Portfolio |
| |||||||||||||||||||||||
| Office expirations |
26,348 | 42,209 | 23,243 | 74,742 | 140,194 | 148,586 | ||||||||||||||||||
|
|
|
|
|
|
|
|
|
|
|
|
|
|||||||||||||
| Renewals & relocations (3) |
5,597 | 400 | 17,625 | 22,801 | 40,826 | 3,260 | ||||||||||||||||||
| New leases (4) |
— | — | — | — | — | — | ||||||||||||||||||
| Vacates (5) |
20,751 | 38,913 | 5,618 | 43,588 | 88,119 | 56,109 | ||||||||||||||||||
| Unknown (6) |
— | 2,896 | — | 8,353 | 11,249 | 89,217 | ||||||||||||||||||
|
|
|
|
|
|
|
|
|
|
|
|
|
|||||||||||||
| Total expirations and vacates |
26,348 | 42,209 | 23,243 | 74,742 | 140,194 | 148,586 | ||||||||||||||||||
|
|
|
|
|
|
|
|
|
|
|
|
|
|||||||||||||
| Retail Portfolio |
||||||||||||||||||||||||
| Retail expirations |
9,624 | 11,284 | 6,569 | 1,114 | 18,967 | 48,366 | ||||||||||||||||||
|
|
|
|
|
|
|
|
|
|
|
|
|
|||||||||||||
| Renewals & relocations (3) |
1,060 | 3,718 | 3,500 | — | 7,218 | 6,645 | ||||||||||||||||||
| New leases (4) |
— | — | — | — | — | — | ||||||||||||||||||
| Vacates (5) |
8,564 | 7,566 | 3,069 | — | 10,635 | 40,817 | ||||||||||||||||||
| Unknown (6) |
— | — | — | 1,114 | 1,114 | 904 | ||||||||||||||||||
|
|
|
|
|
|
|
|
|
|
|
|
|
|||||||||||||
| Total expirations and vacates |
9,624 | 11,284 | 6,569 | 1,114 | 18,967 | 48,366 | ||||||||||||||||||
|
|
|
|
|
|
|
|
|
|
|
|
|
|||||||||||||
Notes:
| (1) | These forecasts, which are subject to change, are based on management’s expectations, including, among other things, discussions with and other information provided by tenants as well as management’s analyses of past historical trends. |
| (2) | Any lease on month to month or short-term will re-appear in “Actual” in each period until tenant has vacated or renewed, and thus it would be double counted if periods were cumulated. “Forecast” avoids double counting. |
| (3) | For forecasted periods, “Renewals & relocations” includes the following: tenants renew their existing leases in all or a portion of their current spaces; tenants which signed renewal leases for a term of less than six months and reappear in forecast periods in 2021; and tenants who move within a building or within the Company’s portfolio. |
| (4) | For forecasted periods, “New Leases” represents leases that have been signed with a new tenant, a subtenant who signed a direct lease or a tenant who expanded. The lease commencement dates are provided on page 6. There may be downtime between the lease expiration and the new lease commencement. |
| (5) | For forecasted periods, “Vacates” assumes a tenant elects not to renew at the end of their existing lease or exercises an early termination option; leases that the Company decides not to renew tenant at the end of their existing lease due to anticipated future redevelopment or for other reasons. |
| This also may include early lease terminations. |
| (6) | For forecasted periods, “Unknown” represents tenants’ whose intention is unknown. |
Page 10
|
|
First Quarter 2021 Tenant Lease Expirations (unaudited)
|
| Total Lease Expirations |
Number of Leases Expiring (1) |
Rentable Square Feet Expiring (2) |
Percent of Portfolio Rentable Square Feet Expiring |
Annualized Rent (3) |
Percent of Annualized Rent |
Annualized Rent Per Rentable Square Foot |
||||||||||||||||||
| Available |
— | 1,148,510 | 11.3 | % | $ | — | 0.0 | % | $ | — | ||||||||||||||
| Signed leases not commenced |
11 | 372,578 | 3.7 | % | — | 0.0 | % | — | ||||||||||||||||
| 1Q 2021 (4) |
21 | 94,851 | 0.9 | % | 4,404,983 | 0.8 | % | 46.44 | ||||||||||||||||
| 2Q 2021 |
25 | 181,840 | 1.8 | % | 9,628,414 | 1.8 | % | 52.95 | ||||||||||||||||
| 3Q 2021 |
22 | 146,848 | 1.4 | % | 8,720,132 | 1.6 | % | 59.38 | ||||||||||||||||
| 4Q 2021 |
26 | 177,119 | 1.7 | % | 9,367,483 | 1.7 | % | 52.89 | ||||||||||||||||
|
|
|
|
|
|
|
|
|
|
|
|
|
|||||||||||||
| Total 2021 |
94 | 600,658 | 5.9 | % | 32,121,012 | 6.0 | % | 53.48 | ||||||||||||||||
| 1Q 2022 |
25 | 152,667 | 1.5 | % | 8,301,766 | 1.5 | % | 54.38 | ||||||||||||||||
| 2Q 2022 |
28 | 119,497 | 1.2 | % | 8,303,025 | 1.5 | % | 69.48 | ||||||||||||||||
| 3Q 2022 |
28 | 167,098 | 1.6 | % | 11,021,469 | 2.1 | % | 65.96 | ||||||||||||||||
| 4Q 2022 |
27 | 118,807 | 1.2 | % | 7,089,055 | 1.3 | % | 59.67 | ||||||||||||||||
|
|
|
|
|
|
|
|
|
|
|
|
|
|||||||||||||
| Total 2022 |
108 | 558,069 | 5.5 | % | 34,715,315 | 6.5 | % | 62.21 | ||||||||||||||||
| 2023 |
97 | 722,015 | 7.1 | % | 45,233,941 | 8.4 | % | 62.65 | ||||||||||||||||
| 2024 |
90 | 848,624 | 8.4 | % | 52,308,681 | 9.7 | % | 61.64 | ||||||||||||||||
| 2025 |
79 | 495,319 | 4.9 | % | 29,998,891 | 5.6 | % | 60.56 | ||||||||||||||||
| 2026 |
66 | 754,136 | 7.4 | % | 42,003,661 | 7.8 | % | 55.70 | ||||||||||||||||
| 2027 |
54 | 584,957 | 5.8 | % | 35,483,184 | 6.6 | % | 60.66 | ||||||||||||||||
| 2028 |
37 | 1,074,013 | 10.6 | % | 58,022,380 | 10.8 | % | 54.02 | ||||||||||||||||
| 2029 |
35 | 879,459 | 8.7 | % | 63,401,404 | 11.8 | % | 72.09 | ||||||||||||||||
| 2030 |
34 | 711,497 | 7.0 | % | 46,503,713 | 8.7 | % | 65.36 | ||||||||||||||||
| 2031 |
19 | 163,202 | 1.6 | % | 20,320,821 | 3.8 | % | 124.51 | ||||||||||||||||
| Thereafter |
37 | 1,221,943 | 12.1 | % | 77,487,930 | 14.3 | % | 63.41 | ||||||||||||||||
|
|
|
|
|
|
|
|
|
|
|
|
|
|||||||||||||
| Total |
761 | 10,134,980 | 100.0 | % | $ | 537,600,933 | 100.0 | % | $ | 62.41 | ||||||||||||||
|
|
|
|
|
|
|
|
|
|
|
|
|
|||||||||||||
| Manhattan Office Properties (5) |
||||||||||||||||||||||||
| Available |
— | 761,679 | 10.0 | % | $ | — | 0.0 | % | $ | — | ||||||||||||||
| Signed leases not commenced |
7 | 280,795 | 3.7 | % | — | 0.0 | % | — | ||||||||||||||||
| 1Q 2021 (4) |
12 | 77,508 | 1.0 | % | 3,474,052 | 0.9 | % | 44.82 | ||||||||||||||||
| 2Q 2021 |
20 | 142,378 | 1.9 | % | 7,851,925 | 2.0 | % | 55.15 | ||||||||||||||||
| 3Q 2021 |
14 | 117,036 | 1.5 | % | 6,688,742 | 1.7 | % | 57.15 | ||||||||||||||||
| 4Q 2021 |
17 | 101,263 | 1.3 | % | 6,076,959 | 1.6 | % | 60.01 | ||||||||||||||||
|
|
|
|
|
|
|
|
|
|
|
|
|
|||||||||||||
| Total 2021 |
63 | 438,185 | 5.8 | % | 24,091,678 | 6.2 | % | 54.98 | ||||||||||||||||
| 1Q 2022 |
19 | 118,951 | 1.6 | % | 6,818,985 | 1.7 | % | 57.33 | ||||||||||||||||
| 2Q 2022 |
20 | 82,529 | 1.1 | % | 5,037,650 | 1.3 | % | 61.04 | ||||||||||||||||
| 3Q 2022 |
16 | 67,720 | 0.9 | % | 4,259,618 | 1.1 | % | 62.90 | ||||||||||||||||
| 4Q 2022 |
23 | 91,917 | 1.2 | % | 5,547,958 | 1.4 | % | 60.36 | ||||||||||||||||
|
|
|
|
|
|
|
|
|
|
|
|
|
|||||||||||||
| Total 2022 |
78 | 361,117 | 4.8 | % | 21,664,211 | 5.6 | % | 59.99 | ||||||||||||||||
| 2023 |
75 | 526,342 | 6.9 | % | 32,175,870 | 8.2 | % | 61.13 | ||||||||||||||||
| 2024 |
66 | 606,040 | 8.0 | % | 36,725,248 | 9.4 | % | 60.60 | ||||||||||||||||
| 2025 |
47 | 308,477 | 4.1 | % | 19,636,827 | 5.0 | % | 63.66 | ||||||||||||||||
| 2026 |
44 | 523,497 | 6.9 | % | 30,746,485 | 7.9 | % | 58.73 | ||||||||||||||||
| 2027 |
39 | 443,408 | 5.8 | % | 26,082,998 | 6.7 | % | 58.82 | ||||||||||||||||
| 2028 |
23 | 954,132 | 12.6 | % | 52,322,942 | 13.4 | % | 54.84 | ||||||||||||||||
| 2029 |
23 | 629,621 | 8.3 | % | 37,799,410 | 9.7 | % | 60.04 | ||||||||||||||||
| 2030 |
21 | 607,354 | 8.0 | % | 36,284,699 | 9.3 | % | 59.74 | ||||||||||||||||
| 2031 |
10 | 79,905 | 1.1 | % | 5,567,022 | 1.4 | % | 69.67 | ||||||||||||||||
| Thereafter |
27 | 1,059,444 | 14.0 | % | 66,993,635 | 17.2 | % | 63.23 | ||||||||||||||||
|
|
|
|
|
|
|
|
|
|
|
|
|
|||||||||||||
| Total Manhattan office properties |
523 | 7,579,996 | 100.0 | % | $ | 390,091,025 | 100.0 | % | $ | 59.67 | ||||||||||||||
|
|
|
|
|
|
|
|
|
|
|
|
|
|||||||||||||
Notes:
| (1) | If a lease has two different expiration dates, it is considered to be two leases (for the purpose of lease count and square footage). |
| (2) | Excludes (i) 194,929 rentable square feet of space across the Company portfolio attributable to building management use and tenant amenities and (ii) 79,613 square feet of space attributable to the Company’s observatory. |
| (3) | Represents annualized base rent and current reimbursement for operating expenses and real estate taxes. |
| (4) | Represents leases that are included in occupancy as of March 31, 2021 and expire on March 31, 2021. |
| (5) | Excludes (i) retail space in the Company’s Manhattan office properties and (ii) the Empire State Building broadcasting licenses and observatory operations. |
Page 11
|
|
First Quarter 2021 Tenant Lease Expirations (unaudited)
|
| Greater New York Metropolitan Area Office Properties |
Number of Leases Expiring (1) |
Rentable Square Feet Expiring (2) |
Percent of Portfolio Rentable Square Feet Expiring |
Annualized Rent (3) |
Percent of Annualized Rent |
Annualized Rent Per Rentable Square Foot |
||||||||||||||||||
| Available |
— | 330,391 | 17.9 | % | $ | — | 0.0 | % | $ | — | ||||||||||||||
| Signed leases not commenced |
2 | 67,602 | 3.7 | % | — | 0.0 | % | — | ||||||||||||||||
| 1Q 2021 (4) |
5 | 6,307 | 0.3 | % | 332,976 | 0.6 | % | 52.79 | ||||||||||||||||
| 2Q 2021 |
4 | 39,049 | 2.1 | % | 1,747,745 | 2.9 | % | 44.76 | ||||||||||||||||
| 3Q 2021 |
5 | 23,243 | 1.3 | % | 1,019,972 | 1.7 | % | 43.88 | ||||||||||||||||
| 4Q 2021 |
8 | 74,742 | 4.1 | % | 3,212,544 | 5.3 | % | 42.98 | ||||||||||||||||
|
|
|
|
|
|
|
|
|
|
|
|
|
|||||||||||||
| Total 2021 |
22 | 143,341 | 7.8 | % | 6,313,237 | 10.5 | % | 44.04 | ||||||||||||||||
| 1Q 2022 |
5 | 31,915 | 1.7 | % | 1,243,716 | 2.1 | % | 38.97 | ||||||||||||||||
| 2Q 2022 |
7 | 33,795 | 1.8 | % | 1,342,595 | 2.2 | % | 39.73 | ||||||||||||||||
| 3Q 2022 |
7 | 57,657 | 3.1 | % | 1,901,823 | 3.2 | % | 32.99 | ||||||||||||||||
| 4Q 2022 |
3 | 25,219 | 1.4 | % | 1,318,854 | 2.2 | % | 52.30 | ||||||||||||||||
|
|
|
|
|
|
|
|
|
|
|
|
|
|||||||||||||
| Total 2022 |
22 | 148,586 | 8.1 | % | 5,806,988 | 9.6 | % | 39.08 | ||||||||||||||||
| 2023 |
14 | 150,370 | 8.1 | % | 7,016,220 | 11.7 | % | 46.66 | ||||||||||||||||
| 2024 |
13 | 210,421 | 11.4 | % | 9,347,792 | 15.5 | % | 44.42 | ||||||||||||||||
| 2025 |
27 | 158,477 | 8.6 | % | 5,540,431 | 9.2 | % | 34.96 | ||||||||||||||||
| 2026 |
16 | 163,878 | 8.9 | % | 7,140,869 | 11.9 | % | 43.57 | ||||||||||||||||
| 2027 |
10 | 90,484 | 4.9 | % | 3,420,224 | 5.7 | % | 37.80 | ||||||||||||||||
| 2028 |
9 | 107,564 | 5.8 | % | 3,816,467 | 6.3 | % | 35.48 | ||||||||||||||||
| 2029 |
6 | 148,939 | 8.1 | % | 6,206,153 | 10.3 | % | 41.67 | ||||||||||||||||
| 2030 |
4 | 36,578 | 2.0 | % | 1,813,876 | 3.0 | % | 49.59 | ||||||||||||||||
| 2031 |
— | — | 0.0 | % | — | 0.0 | % | — | ||||||||||||||||
| Thereafter |
1 | 88,581 | 4.7 | % | 3,782,755 | 6.3 | % | 42.70 | ||||||||||||||||
|
|
|
|
|
|
|
|
|
|
|
|
|
|||||||||||||
| Total greater New York metropolitan area office properties |
146 | 1,845,212 | 100.0 | % | $ | 60,205,012 | 100.0 | % | $ | 41.60 | ||||||||||||||
|
|
|
|
|
|
|
|
|
|
|
|
|
|||||||||||||
| Retail Properties |
||||||||||||||||||||||||
| Available |
— | 56,440 | 8.0 | % | $ | — | 0.0 | % | $ | — | ||||||||||||||
| Signed leases not commenced |
2 | 24,181 | 3.4 | % | — | 0.0 | % | — | ||||||||||||||||
| 1Q 2021 (4) |
4 | 11,036 | 1.6 | % | 597,955 | 0.7 | % | 54.18 | ||||||||||||||||
| 2Q 2021 |
1 | 413 | 0.1 | % | 28,744 | 0.0 | % | 69.60 | ||||||||||||||||
| 3Q 2021 |
3 | 6,569 | 0.9 | % | 1,011,418 | 1.2 | % | 153.97 | ||||||||||||||||
| 4Q 2021 |
1 | 1,114 | 0.2 | % | 77,980 | 0.1 | % | 70.00 | ||||||||||||||||
|
|
|
|
|
|
|
|
|
|
|
|
|
|||||||||||||
| Total 2021 |
9 | 19,132 | 2.7 | % | 1,716,097 | 2.0 | % | 89.70 | ||||||||||||||||
| 1Q 2022 |
1 | 1,801 | 0.3 | % | 239,065 | 0.3 | % | 132.74 | ||||||||||||||||
| 2Q 2022 |
1 | 3,173 | 0.4 | % | 1,922,780 | 2.2 | % | 605.98 | ||||||||||||||||
| 3Q 2022 |
5 | 41,721 | 5.9 | % | 4,860,028 | 5.6 | % | 116.49 | ||||||||||||||||
| 4Q 2022 |
1 | 1,671 | 0.2 | % | 222,243 | 0.3 | % | 133.00 | ||||||||||||||||
|
|
|
|
|
|
|
|
|
|
|
|
|
|||||||||||||
| Total 2022 |
8 | 48,366 | 6.8 | % | 7,244,116 | 8.4 | % | 149.78 | ||||||||||||||||
| 2023 |
8 | 45,303 | 6.4 | % | 6,041,851 | 6.9 | % | 133.37 | ||||||||||||||||
| 2024 |
11 | 32,163 | 4.5 | % | 6,235,641 | 7.1 | % | 193.88 | ||||||||||||||||
| 2025 |
5 | 28,365 | 4.0 | % | 4,821,633 | 5.5 | % | 169.99 | ||||||||||||||||
| 2026 |
6 | 66,761 | 9.4 | % | 4,116,307 | 4.7 | % | 61.66 | ||||||||||||||||
| 2027 |
5 | 51,065 | 7.2 | % | 5,979,962 | 6.8 | % | 117.10 | ||||||||||||||||
| 2028 |
5 | 12,317 | 1.7 | % | 1,882,971 | 2.2 | % | 152.88 | ||||||||||||||||
| 2029 |
6 | 100,899 | 14.2 | % | 19,395,841 | 22.2 | % | 192.23 | ||||||||||||||||
| 2030 |
9 | 67,565 | 9.5 | % | 8,405,138 | 9.6 | % | 124.40 | ||||||||||||||||
| 2031 |
9 | 83,297 | 11.7 | % | 14,753,799 | 16.9 | % | 177.12 | ||||||||||||||||
| Thereafter |
9 | 73,918 | 10.5 | % | 6,711,540 | 7.7 | % | 90.80 | ||||||||||||||||
|
|
|
|
|
|
|
|
|
|
|
|
|
|||||||||||||
| Total retail properties |
92 | 709,772 | 100.0 | % | $ | 87,304,896 | 100.0 | % | $ | 138.77 | ||||||||||||||
|
|
|
|
|
|
|
|
|
|
|
|
|
|||||||||||||
Notes:
| (1) | If a lease has two different expiration dates, it is considered to be two leases (for the purpose of lease count and square footage). |
| (2) | Excludes (i) 194,929 rentable square feet of space across the Company portfolio attributable to building management use and tenant amenities and (ii) 79,613 square feet of space attributable to the Company’s observatory. |
| (3) | Represents annualized base rent and current reimbursement for operating expenses and real estate taxes. |
| (4) | Represents leases that are included in occupancy as of March 31, 2021 and expire on March 31, 2021. |
Page 12
|
|
First Quarter 2021 Tenant Lease Expirations (unaudited)
|
| Empire State Building Office (1) |
Number of Leases Expiring (2) |
Rentable Square Feet Expiring (3) |
Percent of Portfolio Rentable Square Feet Expiring |
Annualized Rent (4) (5) |
Percent of Annualized Rent |
Annualized Rent Per Rentable Square Foot |
||||||||||||||||||
| Available |
— | 205,420 | 7.6 | % | $ | — | 0.0 | % | $ | — | ||||||||||||||
| Signed leases not commenced |
1 | 105,240 | 3.9 | % | — | 0.0 | % | — | ||||||||||||||||
| 1Q 2021 |
3 | 2,606 | 0.1 | % | 79,083 | 0.1 | % | 30.35 | ||||||||||||||||
| 2Q 2021 |
13 | 82,947 | 3.1 | % | 4,454,643 | 3.0 | % | 53.70 | ||||||||||||||||
| 3Q 2021 |
1 | 5,121 | 0.2 | % | 406,659 | 0.3 | % | 79.41 | ||||||||||||||||
| 4Q 2021 |
4 | 13,699 | 0.5 | % | 832,116 | 0.6 | % | 60.74 | ||||||||||||||||
|
|
|
|
|
|
|
|
|
|
|
|
|
|||||||||||||
| Total 2021 |
21 | 104,373 | 3.8 | % | 5,772,501 | 3.9 | % | 55.31 | ||||||||||||||||
| 1Q 2022 |
8 | 53,811 | 2.0 | % | 3,093,836 | 2.1 | % | 57.49 | ||||||||||||||||
| 2Q 2022 |
4 | 19,012 | 0.7 | % | 1,216,008 | 0.8 | % | 63.96 | ||||||||||||||||
| 3Q 2022 |
6 | 28,706 | 1.1 | % | 1,980,508 | 1.3 | % | 68.99 | ||||||||||||||||
| 4Q 2022 |
3 | 7,524 | 0.3 | % | 574,158 | 0.4 | % | 76.31 | ||||||||||||||||
|
|
|
|
|
|
|
|
|
|
|
|
|
|||||||||||||
| Total 2022 |
21 | 109,053 | 4.0 | % | 6,864,510 | 4.7 | % | 62.86 | ||||||||||||||||
| 2023 |
25 | 112,852 | 4.2 | % | 7,729,002 | 5.2 | % | 68.49 | ||||||||||||||||
| 2024 |
21 | 269,561 | 9.9 | % | 17,657,346 | 12.0 | % | 65.50 | ||||||||||||||||
| 2025 |
11 | 94,502 | 3.5 | % | 6,227,555 | 4.2 | % | 65.90 | ||||||||||||||||
| 2026 |
10 | 126,946 | 4.7 | % | 8,051,938 | 5.5 | % | 63.43 | ||||||||||||||||
| 2027 |
10 | 38,704 | 1.4 | % | 2,343,670 | 1.6 | % | 60.55 | ||||||||||||||||
| 2028 |
7 | 545,722 | 20.1 | % | 29,611,586 | 20.1 | % | 54.26 | ||||||||||||||||
| 2029 |
7 | 282,020 | 10.4 | % | 17,756,666 | 12.0 | % | 62.96 | ||||||||||||||||
| 2030 |
6 | 210,800 | 7.8 | % | 11,563,319 | 7.8 | % | 54.85 | ||||||||||||||||
| 2031 |
5 | 23,038 | 0.8 | % | 1,892,049 | 1.3 | % | 82.13 | ||||||||||||||||
| Thereafter |
13 | 486,251 | 17.9 | % | 31,922,574 | 21.7 | % | 65.65 | ||||||||||||||||
|
|
|
|
|
|
|
|
|
|
|
|
|
|||||||||||||
| Total Empire State Building office |
158 | 2,714,482 | 100.0 | % | $ | 147,392,716 | 100.0 | % | $ | 61.32 | ||||||||||||||
|
|
|
|
|
|
|
|
|
|
|
|
|
|||||||||||||
| Empire State Building Broadcasting Licenses and Leases |
Annualized Base Rent (7) |
Annualized Expense Reimbursements |
Annualized Rent (4) |
Percent of Annualized Rent |
||||||||||||
| 1Q 2021 (6) |
$ | 131,030 | $ | 43,358 | $ | 174,388 | 1.2 | % | ||||||||
| 2Q 2021 |
— | 34,362 | 34,362 | 0.2 | % | |||||||||||
| 3Q 2021 |
— | — | — | 0.0 | % | |||||||||||
| 4Q 2021 |
— | — | — | 0.0 | % | |||||||||||
|
|
|
|
|
|
|
|
|
|||||||||
| Total 2021 |
131,030 | 77,720 | 208,750 | 1.4 | % | |||||||||||
| 1Q 2022 |
1,236,623 | 337,326 | 1,573,949 | 10.6 | % | |||||||||||
| 2Q 2022 |
— | — | — | 0.0 | % | |||||||||||
| 3Q 2022 |
— | — | — | 0.0 | % | |||||||||||
| 4Q 2022 |
525,143 | 144,976 | 670,119 | 4.5 | % | |||||||||||
|
|
|
|
|
|
|
|
|
|||||||||
| Total 2022 |
1,761,766 | 482,302 | 2,244,068 | 15.2 | % | |||||||||||
| 2023 |
283,668 | 57,131 | 340,799 | 2.3 | % | |||||||||||
| 2024 |
66,950 | 36,088 | 103,038 | 0.7 | % | |||||||||||
| 2025 |
— | 119,580 | 119,580 | 0.8 | % | |||||||||||
| 2026 |
827,860 | 80,568 | 908,428 | 6.1 | % | |||||||||||
| 2027 |
807,668 | 93,827 | 901,495 | 6.1 | % | |||||||||||
| 2028 |
254,829 | 16,086 | 270,915 | 1.8 | % | |||||||||||
| 2029 |
— | — | — | 0.0 | % | |||||||||||
| 2030 |
2,365,500 | 147,410 | 2,512,910 | 17.0 | % | |||||||||||
| 2031 |
1,855,250 | 215,198 | 2,070,448 | 14.0 | % | |||||||||||
| Thereafter |
4,602,847 | 500,814 | 5,103,661 | 34.5 | % | |||||||||||
|
|
|
|
|
|
|
|
|
|||||||||
| Total Empire State Building broadcasting licenses and leases |
$ | 12,957,368 | $ | 1,826,724 | $ | 14,784,092 | 100.0 | % | ||||||||
|
|
|
|
|
|
|
|
|
|||||||||
Notes:
| (1) | Excludes retail space, broadcasting licenses and observatory operations. |
| (2) | If a lease has two different expiration dates, it is considered to be two leases (for the purpose of lease count and square footage). |
| (3) | Excludes 52,508 rentable square feet of space attributable to building management use. |
| (4) | Represents annualized base rent and current reimbursement for operating expenses and real estate taxes. |
| (5) | Includes approximately $4.6 million of annualized rent related to physical space occupied by broadcasting tenants for their broadcasting operations. Does not include license fees charged to broadcasting tenants. |
| (6) | Represents leases that are included in occupancy as of March 31, 2021 and expire on March 31, 2021. |
| (7) | Represents license fees for the use of the Empire State Building mast and base rent for physical space occupied by broadcasting tenants. |
Page 13
|
|
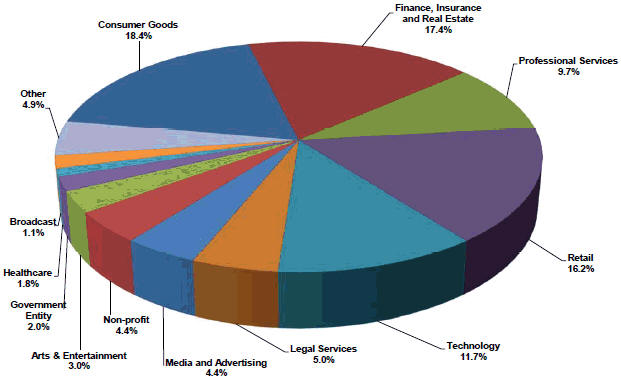
First Quarter 2021 20 Largest Tenants and Portfolio Tenant Diversification by Industry (unaudited)
|
| 20 Largest Tenants |
Property |
Lease Expiration (1) |
Weighted Average Remaining Lease Term(2) |
Total Occupied Square Feet (3) |
Percent of Portfolio Rentable Square Feet (4) |
Annualized Rent (5) |
Percent of Portfolio Annualized Rent (6) |
|||||||||||||||||||
| 1. |
ESB | Aug. 2036 | 15.4 years | 365,886 | 3.6 | % | $ | 22,380,058 | 4.2 | % | ||||||||||||||||
| 2. |
Global Brands Group | ESB, 1333 Broadway | Oct. 2023 - Oct. 2028 | 6.2 years | 353,325 | 3.5 | % | 19,677,393 | 3.7 | % | ||||||||||||||||
| 3. |
Li & Fung | 1359 Broadway, ESB | Jun. 2021 - Oct. 2028 | 4.8 years | 252,899 | 2.5 | % | 13,381,783 | 2.5 | % | ||||||||||||||||
| 4. |
PVH Corp. | 501 Seventh Avenue | Oct. 2028 | 7.6 years | 237,281 | 2.3 | % | 11,890,257 | 2.2 | % | ||||||||||||||||
| 5. |
Centric Brands Inc. | ESB | Oct. 2028 | 7.6 years | 212,154 | 2.1 | % | 10,819,854 | 2.0 | % | ||||||||||||||||
| 6. |
Sephora | 112 West 34th Street | Jan. 2029 | 7.8 years | 11,334 | 0.1 | % | 10,483,711 | 2.0 | % | ||||||||||||||||
| 7. |
Coty | ESB | Jan. 2030 | 8.8 years | 156,187 | 1.5 | % | 8,050,269 | 1.5 | % | ||||||||||||||||
| 8. |
Macy’s | 111 West 33rd Street | May 2030 | 9.2 years | 131,117 | 1.3 | % | 7,902,959 | 1.5 | % | ||||||||||||||||
| 9. |
Urban Outfitters | 1333 Broadway | Sept. 2029 | 8.5 years | 56,730 | 0.6 | % | 7,634,773 | 1.4 | % | ||||||||||||||||
| 10. |
Signature Bank | 1333 & 1400 Broadway | Jul. 2030 - Apr. 2035 | 13.6 years | 124,884 | 1.2 | % | 7,629,754 | 1.4 | % | ||||||||||||||||
| 11. |
Federal Deposit Insurance Corp. | ESB | Dec. 2024 | 3.8 years | 119,226 | 1.2 | % | 7,548,953 | 1.4 | % | ||||||||||||||||
| 12. |
The Interpublic Group of Co’s, Inc. | 111 West 33rd St & 1400 B’Way | Jul. 2024 - Feb. 2025 | 3.5 years | 128,296 | 1.3 | % | 7,335,059 | 1.4 | % | ||||||||||||||||
| 13. |
HNTB Corporation | ESB | Feb. 2029 | 7.9 years | 105,143 | 1.0 | % | 7,078,027 | 1.3 | % | ||||||||||||||||
| 14. |
Footlocker | 112 West 34th Street | Sept. 2031 | 10.5 years | 34,192 | 0.3 | % | 6,927,262 | 1.3 | % | ||||||||||||||||
| 15. |
Franklin Templeton |
First Stamford Place | Sept. 2024 | 3.5 years | 137,583 | 1.4 | % | 6,409,614 | 1.2 | % | ||||||||||||||||
| 16. |
Fragomen | 1400 Broadway | Feb. 2035 | 13.9 years | 107,680 | 1.1 | % | 5,990,238 | 1.1 | % | ||||||||||||||||
| 17. |
Shutterstock | ESB | Apr. 2029 | 8.1 years | 104,386 | 1.0 | % | 5,970,510 | 1.1 | % | ||||||||||||||||
| 18. |
ASCAP | 250 West 57th Street | Aug. 2034 | 13.4 years | 87,943 | 0.9 | % | 5,542,143 | 1.0 | % | ||||||||||||||||
| 19. |
The Michael J. Fox Foundation | 111 West 33rd Street | Nov. 2029 | 8.7 years | 86,492 | 0.9 | % | 5,453,341 | 1.0 | % | ||||||||||||||||
| 20. |
On Deck Capital, Inc. | 1400 Broadway | Dec. 2026 | 5.8 years | 83,266 | 0.8 | % | 4,851,000 | 0.9 | % | ||||||||||||||||
|
|
|
|
|
|
|
|
|
|||||||||||||||||||
| Total | 2,896,004 | 28.6 | % | $ | 182,956,958 | 34.1 | % | |||||||||||||||||||
|
|
|
|
|
|
|
|
|
|||||||||||||||||||
Notes:
| (1) | Expiration dates are per lease and do not assume exercise of renewal or extension options. For tenants with more than two leases, the lease expiration is shown as a range. |
| (2) | Represents the weighted average lease term, based on annualized rent. |
| (3) | Based on leases signed and commenced as of March 31, 2021. |
| (4) | Represents the percentage of rentable square feet of the Company’s office and retail portfolios in the aggregate. |
| (5) | Represents annualized base rent and current reimbursement for operating expenses and real estate taxes. |
| (6) | Represents the percentage of annualized rent of the Company’s office and retail portfolios in the aggregate. |
Portfolio Tenant Diversification by Industry (based on annualized rent)
Page 14
|
|
||
| First Quarter 2021 | ||
| Capital Expenditures and Redevelopment Program and Leasing Opportunity | ||
| (unaudited and dollars in thousands)
|

| Three Months Ended | ||||||||||||||||||||
| Capital expenditures | March 31, 2021 |
December 31, 2020 |
September 30, 2020 |
June 30, 2020 |
March 31, 2020 |
|||||||||||||||
| Tenant improvements - first generation |
$ | 13,244 | $ | 10,098 | $ | 8,599 | $ | 4,562 | $ | 4,913 | ||||||||||
| Tenant improvements - second generation |
6,435 | 6,466 | 12,961 | 5,243 | 8,151 | |||||||||||||||
| Leasing commissions - first generation |
— | — | — | 1,272 | 4,001 | |||||||||||||||
| Leasing commissions - second generation |
3,156 | 6,292 | 730 | 2,048 | 3,347 | |||||||||||||||
| Building improvements - first generation |
78 | 4,436 | 5,672 | 358 | 8,379 | |||||||||||||||
| Building improvements - second generation |
3,462 | 2,531 | 5,494 | 8,075 | 3,846 | |||||||||||||||
| Observatory capital project (1) |
— | — | 498 | 829 | 1,175 | |||||||||||||||
| Development (2) |
98 | 28 | 767 | 525 | 811 | |||||||||||||||
|
|
|
|
|
|
|
|
|
|
|
|||||||||||
| Total |
$ | 26,473 | $ | 29,851 | $ | 34,721 | $ | 22,912 | $ | 34,623 | ||||||||||
|
|
|
|
|
|
|
|
|
|
|
|||||||||||
Note:
| (1) | Total Observatory capital project spent-to-date was $157.9 million as of March 31, 2021. |
| (2) | Primarily represents design and engineering costs. |
Tenant space redevelopment by square feet (3) (4)
| • | Future redevelopment (Empire State Building) - 110,000 square feet |
| • | Future redevelopment (other Manhattan properties) - 280,000 square feet |
| • | Redevelopment completed - 7,570,000 square feet |
Leasing Opportunity - Inventory of Current Vacant Space as of March 31, 2021 (in square feet)
| Total Portfolio vacant space |
1,521,000 | |||
|
|
|
|||
| Signed leases not commenced (“SLNC”): |
||||
| Manhattan Office Properties SLNC |
281,000 | |||
| Greater New York Office Properties SLNC |
68,000 | |||
| Retail Properties SLNC |
24,000 | |||
| Redeveloped Manhattan Office space |
636,000 | |||
| Greater New York Office Properties space |
330,000 | |||
| Retail Properties space |
56,000 | |||
| Undeveloped Manhattan Office space |
47,000 | |||
| Space held off market |
28,000 | |||
| Other |
51,000 | |||
|
|
|
|||
| Total |
1,521,000 | |||
|
|
|
Notes:
| (3) | These estimates are based on the Company’s current budgets and are subject to change. |
| (4) | Redevelopment program is for the Manhattan office assets only. Square footage based on market measurement. Developed space includes space that has been demolished and completed asbestos abatement and available for lease up or ready to be prebuilt. Permanent building use spaces, amenity spaces and broadcasting spaces are excluded. |
Page 15
|
|
||
| First Quarter 2021 | ||
| Observatory Summary | ||
| (unaudited and dollars in thousands)
|
| Three Months Ended | ||||||||||||||||||||||||
| Observatory NOI |
Twelve Months to Date |
March 31, 2021 |
December 31, 2020 |
September 30, 2020 |
June 30, 2020 |
March 31, 2020 (1) |
||||||||||||||||||
| Observatory revenue (2) |
$ | 12,116 | $ | 2,603 | (7) | $ | 5,008 | (8) | $ | 4,419 | (9) | $ | 86 | $ | 19,544 | |||||||||
| Observatory expenses |
20,157 | 4,588 | 5,636 | 5,931 | 4,002 | 8,154 | ||||||||||||||||||
|
|
|
|
|
|
|
|
|
|
|
|
|
|||||||||||||
| NOI |
(8,041 | ) | (1,985 | ) | (628 | ) | (1,512 | ) | (3,916 | ) | 11,390 | |||||||||||||
| Intercompany rent expense (3) |
11,223 | 4,932 | 4,471 | (2,233 | ) | 4,053 | 11,536 | |||||||||||||||||
|
|
|
|
|
|
|
|
|
|
|
|
|
|||||||||||||
| NOI after intercompany rent |
$ | (19,264 | ) | $ | (6,917 | ) | $ | (5,099 | ) | $ | 721 | $ | (7,969 | ) | $ | (146 | ) | |||||||
|
|
|
|
|
|
|
|
|
|
|
|
|
|||||||||||||
| Observatory Metrics |
||||||||||||||||||||||||
| Number of visitors (4) |
51,000 | 55,000 | 30,000 | — | 422,000 | |||||||||||||||||||
| Change in visitors year over year |
(87.9 | %) | (93.8 | %) | (97.1 | %) | N/A | (29.8 | %) | |||||||||||||||
| Number of bad weather days during open days (“BWD”) (5) |
|
17 | 22 | N/A | N/A | 15 | ||||||||||||||||||
| Days closed due to COVID-19 |
— | — | 19 | 91 | 15 | |||||||||||||||||||
| 102nd floor revenue (6) |
$ | 392 | $ | 349 | $ | 129 | $ | — | $ | 1,808 | ||||||||||||||
Notes:
| (1) | Due to the COVID-19 pandemic, the Observatory was closed on March 16, 2020. The 86th floor Observatory reopened on July 20, 2020 and the 102nd floor Observatory reopened on August 24, 2020. |
| (2) | Observatory revenues include the fixed license fee received from WDFG North America, the Observatory gift shop operator. For the three months ended March 31, 2021, December 31, 2020, September 30, 2020, June 30, 2020, and March 31, 2020, the fixed license fee was $4, $1,496, $1,180, $0, and $1,314, respectively. |
| (3) | The Observatory pays a market-based rent payment comprised of fixed and percentage rent to the Empire State Building. Intercompany rent is eliminated upon consolidation. |
| (4) | Reflects the number of visitors who pass through the turnstile, excluding visitors who make a second visit on the same ticket at no additional charge. |
| (5) | The Company defines a bad weather day as one in which the top of the Empire State Building is obscured from view for more than 50% of the day. |
| (6) | Reflects revenues derived from the 102nd floor observatory which are included in total observatory revenues above. |
| (7) | Observatory revenue for the first quarter 2021 includes $0.1 million of deferred revenue recognized this quarter related to unused tickets. |
| (8) | Observatory revenue for the fourth quarter 2020 includes $1.3 million of deferred revenue recognized this quarter related to unused tickets. |
| (9) | Observatory revenue for the third quarter 2020 includes $2.0 million of deferred revenue recognized this quarter related to unused tickets and earned income from our tour and travel partners. |
Annual Observatory Revenues 2016 to 2020
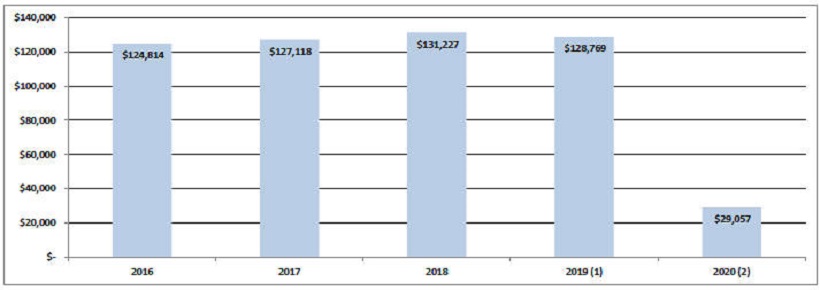
Note:
| (1) | The 102nd floor observatory was closed for approximately nine months in 2019 for renovations. |
| (2) | The observatory experienced a significant decline in visitors from the second week of March and was closed on March 16, 2020 through July 20, 2020. |
Page 16
|
|
||
| First Quarter 2021 | ||
| Condensed Consolidated Balance Sheets | ||
| (unaudited and dollars in thousands)
|
| March 31, 2021 |
December 31, 2020 |
September 30, 2020 |
June 30, 2020 |
March 31, 2020 |
||||||||||||||||
| Assets |
||||||||||||||||||||
| Commercial real estate properties, at cost: |
||||||||||||||||||||
| Land |
$ | 201,196 | $ | 201,196 | $ | 201,196 | $ | 201,196 | $ | 201,196 | ||||||||||
| Development costs |
8,064 | 7,966 | 7,938 | 9,325 | 8,800 | |||||||||||||||
| Building and improvements |
2,943,148 | 2,924,804 | 2,925,532 | 2,914,528 | 2,913,312 | |||||||||||||||
|
|
|
|
|
|
|
|
|
|
|
|||||||||||
| 3,152,408 | 3,133,966 | 3,134,666 | 3,125,049 | 3,123,308 | ||||||||||||||||
| Less: accumulated depreciation |
(973,940 | ) | (941,612 | ) | (927,517 | ) | (911,546 | ) | (886,822 | ) | ||||||||||
|
|
|
|
|
|
|
|
|
|
|
|||||||||||
| Commercial real estate properties, net |
2,178,468 | 2,192,354 | 2,207,149 | 2,213,503 | 2,236,486 | |||||||||||||||
| Cash and cash equivalents |
567,102 | 526,714 | 373,088 | 872,970 | 1,008,983 | |||||||||||||||
| Restricted cash |
40,295 | 41,225 | 54,865 | 58,878 | 36,881 | |||||||||||||||
| Tenant and other receivables |
16,749 | 21,541 | 25,853 | 29,800 | 22,549 | |||||||||||||||
| Deferred rent receivables |
228,117 | 222,508 | 223,886 | 226,444 | 229,154 | |||||||||||||||
| Prepaid expenses and other assets |
50,427 | 77,182 | 50,773 | 68,109 | 40,583 | |||||||||||||||
| Deferred costs, net |
207,058 | 203,853 | 207,774 | 211,356 | 218,578 | |||||||||||||||
| Acquired below-market ground leases, net |
342,777 | 344,735 | 346,693 | 348,651 | 350,609 | |||||||||||||||
| Right of use assets |
29,051 | 29,104 | 29,154 | 29,205 | 29,256 | |||||||||||||||
| Goodwill |
491,479 | 491,479 | 491,479 | 491,479 | 491,479 | |||||||||||||||
|
|
|
|
|
|
|
|
|
|
|
|||||||||||
| Total assets |
$ | 4,151,523 | $ | 4,150,695 | $ | 4,010,714 | $ | 4,550,395 | $ | 4,664,558 | ||||||||||
|
|
|
|
|
|
|
|
|
|
|
|||||||||||
| Liabilities and Equity |
||||||||||||||||||||
| Mortgage notes payable, net |
$ | 775,276 | $ | 775,929 | $ | 603,178 | $ | 603,974 | $ | 604,763 | ||||||||||
| Senior unsecured notes, net |
973,214 | 973,159 | 973,106 | 973,053 | 973,002 | |||||||||||||||
| Unsecured term loan facility, net |
387,811 | 387,561 | 387,309 | 387,059 | 386,568 | |||||||||||||||
| Unsecured revolving credit facility, net |
— | — | — | 546,778 | 546,436 | |||||||||||||||
| Accounts payable and accrued expenses |
102,381 | 103,203 | 111,918 | 104,992 | 142,315 | |||||||||||||||
| Acquired below-market leases, net |
30,112 | 31,705 | 33,405 | 35,170 | 37,623 | |||||||||||||||
| Ground lease liabilities |
29,051 | 29,104 | 29,154 | 29,205 | 29,256 | |||||||||||||||
| Deferred revenue and other liabilities |
94,625 | 88,319 | 77,572 | 62,996 | 64,176 | |||||||||||||||
| Tenants’ security deposits |
27,858 | 30,408 | 51,257 | 51,130 | 30,543 | |||||||||||||||
|
|
|
|
|
|
|
|
|
|
|
|||||||||||
| Total liabilities |
2,420,328 | 2,419,388 | 2,266,899 | 2,794,357 | 2,814,682 | |||||||||||||||
| Total equity |
1,731,195 | 1,731,307 | 1,743,815 | 1,756,038 | 1,849,876 | |||||||||||||||
|
|
|
|
|
|
|
|
|
|
|
|||||||||||
| Total liabilities and equity |
$ | 4,151,523 | $ | 4,150,695 | $ | 4,010,714 | $ | 4,550,395 | $ | 4,664,558 | ||||||||||
|
|
|
|
|
|
|
|
|
|
|
|||||||||||
Page 17
|
|
||
| First Quarter 2021 | ||
| Condensed Consolidated Statements of Operations | ||
| (unaudited and in thousands, except per share amounts)
|
| Three Months Ended | ||||||||||||||||||||
| March 31, 2021 |
December 31, 2020 |
September 30, 2020 |
June 30, 2020 |
March 31, 2020 |
||||||||||||||||
| Revenues |
||||||||||||||||||||
| Rental revenue (1) |
$ | 140,231 | $ | 137,050 | $ | 139,909 | $ | 137,999 | $ | 148,113 | ||||||||||
| Observatory revenue |
2,603 | 5,008 | 4,419 | 86 | 19,544 | |||||||||||||||
| Lease termination fees |
1,289 | 7,841 | 331 | 1,033 | 211 | |||||||||||||||
| Third party management and other fees |
276 | 295 | 283 | 301 | 346 | |||||||||||||||
| Other revenue and fees |
905 | 1,205 | 1,633 | 1,611 | 2,010 | |||||||||||||||
|
|
|
|
|
|
|
|
|
|
|
|||||||||||
| Total revenues |
145,304 | 151,399 | 146,575 | 141,030 | 170,224 | |||||||||||||||
| Operating expenses |
||||||||||||||||||||
| Property operating expenses |
30,279 | 31,087 | 33,836 | 29,750 | 41,468 | |||||||||||||||
| Ground rent expenses |
2,331 | 2,332 | 2,331 | 2,332 | 2,331 | |||||||||||||||
| General and administrative expenses |
13,853 | 13,627 | 14,517 | 18,149 | 15,951 | |||||||||||||||
| Observatory expenses |
4,588 | 5,636 | 5,931 | 4,002 | 8,154 | |||||||||||||||
| Real estate taxes |
31,447 | 31,894 | 31,196 | 29,579 | 29,254 | |||||||||||||||
| Impairment charges |
— | — | 2,103 | (3) | 4,101 | (2) | — | |||||||||||||
| Depreciation and amortization |
44,457 | 47,397 | 44,733 | 52,783 | 46,093 | |||||||||||||||
|
|
|
|
|
|
|
|
|
|
|
|||||||||||
| Total operating expenses |
126,955 | 131,973 | 134,647 | 140,696 | 143,251 | |||||||||||||||
|
|
|
|
|
|
|
|
|
|
|
|||||||||||
| Total operating income |
18,349 | 19,426 | 11,928 | 334 | 26,973 | |||||||||||||||
| Other income (expense) |
||||||||||||||||||||
| Interest income |
122 | 108 | 366 | 1,526 | 637 | |||||||||||||||
| Interest expense |
(23,554 | ) | (23,001 | ) | (23,360 | ) | (23,928 | ) | (19,618 | ) | ||||||||||
| Loss on early extinguishment of debt |
(214 | ) | — | — | — | (86 | ) | |||||||||||||
|
|
|
|
|
|
|
|
|
|
|
|||||||||||
| Initial public offering litigation expense |
— | — | (1,165 | )(4) | — | — | ||||||||||||||
| Income (loss) before income taxes |
(5,297 | ) | (3,467 | ) | (12,231 | ) | (22,068 | ) | 7,906 | |||||||||||
| Income tax (expense) benefit |
2,106 | 4,177 | (38 | ) | 2,450 | 382 | ||||||||||||||
|
|
|
|
|
|
|
|
|
|
|
|||||||||||
| Net income (loss) |
(3,191 | ) | 710 | (12,269 | ) | (19,618 | ) | 8,288 | ||||||||||||
| Perpetual preferred unit distributions |
(1,050 | ) | (1,050 | ) | (1,050 | ) | (1,047 | ) | (1,050 | ) | ||||||||||
| Net (income) loss attributable to non-controlling interests |
1,620 | 130 | 5,115 | 7,872 | (2,743 | ) | ||||||||||||||
|
|
|
|
|
|
|
|
|
|
|
|||||||||||
| Net income (loss) attributable to common stockholders |
$ | (2,621 | ) | $ | (210 | ) | $ | (8,204 | ) | $ | (12,793 | ) | $ | 4,495 | ||||||
|
|
|
|
|
|
|
|
|
|
|
|||||||||||
| Weighted average common shares outstanding |
||||||||||||||||||||
| Basic |
171,735 | 171,970 | 173,048 | 175,433 | 181,741 | |||||||||||||||
|
|
|
|
|
|
|
|
|
|
|
|||||||||||
| Diluted |
277,881 | 278,471 | 280,940 | 283,384 | 292,645 | |||||||||||||||
|
|
|
|
|
|
|
|
|
|
|
|||||||||||
| Net income (loss) per share attributable to common stockholders |
||||||||||||||||||||
| Basic and diluted |
$ | (0.02 | ) | $ | — | $ | (0.05 | ) | $ | (0.07 | ) | $ | 0.02 | |||||||
|
|
|
|
|
|
|
|
|
|
|
|||||||||||
| Dividends per share |
$ | — | $ | — | $ | — | $ | 0.105 | $ | 0.105 | ||||||||||
|
|
|
|
|
|
|
|
|
|
|
|||||||||||
| (1) | The following table reflects the components of rental revenue. |
| Three Months Ended | ||||||||||||||||||||
| Rental Revenue | March 31, 2021 |
December 31, 2020 |
September 30, 2020 |
June 30, 2020 |
March 31, 2020 |
|||||||||||||||
| Base rent |
$ | 126,231 | $ | 121,486 | $ | 123,821 | $ | 122,374 | $ | 130,577 | ||||||||||
| Billed tenant expense reimbursement |
14,000 | 15,564 | 16,088 | 15,625 | 17,536 | |||||||||||||||
|
|
|
|
|
|
|
|
|
|
|
|||||||||||
| Total rental revenue |
$ | 140,231 | $ | 137,050 | $ | 139,909 | $ | 137,999 | $ | 148,113 | ||||||||||
|
|
|
|
|
|
|
|
|
|
|
|||||||||||
The Company believes the preceding table of the components of rental revenue is not, and is not intended to be, a presentation in accordance with GAAP. The Company believes this information is frequently used by management, investors, securities analysts and other interested parties to evaluate the Company’s performance.
| (2) | Reflects a non-cash write-off of prior capitalized expenditures on a combined heat and power generation project for the Empire State Building that has been rendered economically unfeasible due to New York City’s new Local Law 97. |
| (3) | Reflects a non-cash write-off of prior capitalized expenditures on a development project that is unlikely to continue. |
| (4) | Represents an accrued expense which reflects an estimated liability associated with the IPO-related litigation. |
Page 18
|
|
||
| First Quarter 2021 | ||
|
Funds from Operations (“FFO”), Modified Funds From Operations (“Modified FFO”), Core Funds from Operations (“Core FFO”), Core Funds Available for Distribution (“Core FAD”) and EBITDA | ||
| (unaudited and in thousands, except per share amounts)
|
| Three Months Ended | ||||||||||||||||||||
| Reconciliation of Net Income to FFO, Modified FFO and Core FFO |
March 31, 2021 |
December 31, 2020 |
September 30, 2020 |
June 30, 2020 |
March 31, 2020 |
|||||||||||||||
| Net Income (loss) |
$ | (3,191 | ) | $ | 710 | $ | (12,269 | ) | $ | (19,618 | ) | $ | 8,288 | |||||||
| Preferred unit distributions |
(1,050 | ) | (1,050 | ) | (1,050 | ) | (1,047 | ) | (1,050 | ) | ||||||||||
| Real estate depreciation and amortization |
43,104 | 45,690 | 43,029 | 51,096 | 44,430 | |||||||||||||||
| Impairment charges, net of reimbursement |
— | — | 1,259 | 4,101 | — | |||||||||||||||
|
|
|
|
|
|
|
|
|
|
|
|||||||||||
| FFO attributable to common stockholders and non-controlled interests |
38,863 | 45,350 | 30,969 | 34,532 | 51,668 | |||||||||||||||
| Amortization of below-market ground lease |
1,958 | 1,958 | 1,957 | 1,958 | 1,958 | |||||||||||||||
|
|
|
|
|
|
|
|
|
|
|
|||||||||||
| Modified FFO attributable to common stockholders and non-controlled interests |
40,821 | 47,308 | 32,926 | 36,490 | 53,626 | |||||||||||||||
| Loss on early extinguishment of debt |
214 | — | — | — | 86 | |||||||||||||||
| Severance expenses |
— | — | 805 | 3,008 | — | |||||||||||||||
| IPO litigation expense |
— | — | 1,165 | — | — | |||||||||||||||
|
|
|
|
|
|
|
|
|
|
|
|||||||||||
| Core FFO attributable to common stockholders and non-controlled interests |
$ | 41,035 | $ | 47,308 | $ | 34,896 | $ | 39,498 | $ | 53,712 | ||||||||||
|
|
|
|
|
|
|
|
|
|
|
|||||||||||
| Total weighted average shares and Operating Partnership Units |
||||||||||||||||||||
| Basic |
277,881 | 278,427 | 280,940 | 283,384 | 292,645 | |||||||||||||||
|
|
|
|
|
|
|
|
|
|
|
|||||||||||
| Diluted |
277,881 | 278,471 | 280,940 | 283,384 | 292,645 | |||||||||||||||
|
|
|
|
|
|
|
|
|
|
|
|||||||||||
| FFO attributable to common stockholders and non-controlled interests per share |
||||||||||||||||||||
| Basic |
$ | 0.14 | $ | 0.16 | $ | 0.11 | $ | 0.12 | $ | 0.18 | ||||||||||
|
|
|
|
|
|
|
|
|
|
|
|||||||||||
| Diluted |
$ | 0.14 | $ | 0.16 | $ | 0.11 | $ | 0.12 | $ | 0.18 | ||||||||||
|
|
|
|
|
|
|
|
|
|
|
|||||||||||
| Modified FFO attributable to common stockholders and non-controlled interests per share |
||||||||||||||||||||
| Basic |
$ | 0.15 | $ | 0.17 | $ | 0.12 | $ | 0.13 | $ | 0.18 | ||||||||||
|
|
|
|
|
|
|
|
|
|
|
|||||||||||
| Diluted |
$ | 0.15 | $ | 0.17 | $ | 0.12 | $ | 0.13 | $ | 0.18 | ||||||||||
|
|
|
|
|
|
|
|
|
|
|
|||||||||||
| Core FFO attributable to common stockholders and non-controlled interests per share |
||||||||||||||||||||
| Basic |
$ | 0.15 | $ | 0.17 | $ | 0.12 | $ | 0.14 | $ | 0.18 | ||||||||||
|
|
|
|
|
|
|
|
|
|
|
|||||||||||
| Diluted |
$ | 0.15 | $ | 0.17 | $ | 0.12 | $ | 0.14 | $ | 0.18 | ||||||||||
|
|
|
|
|
|
|
|
|
|
|
|||||||||||
| Reconciliation of Core FFO to Core FAD |
||||||||||||||||||||
| Core FFO |
$ | 41,035 | $ | 47,308 | $ | 34,896 | $ | 39,498 | $ | 53,712 | ||||||||||
| Add: |
||||||||||||||||||||
| Amortization of deferred financing costs |
1,204 | 1,150 | 1,041 | 1,049 | 894 | |||||||||||||||
| Non-real estate depreciation and amortization |
1,353 | 1,707 | 1,704 | 1,686 | 1,664 | |||||||||||||||
| Amortization of non-cash compensation expense |
4,735 | 5,321 | 5,504 | 8,778 | 5,892 | |||||||||||||||
| Amortization of loss on interest rate derivative |
1,529 | 1,529 | 1,529 | 938 | 447 | |||||||||||||||
| Deduct: |
||||||||||||||||||||
| Straight-line rental revenues |
(6,347 | ) | 640 | (395 | ) | 2,710 | (8,193 | ) | ||||||||||||
| Above/below-market rent revenue amortization |
(654 | ) | (674 | ) | (679 | ) | (1,366 | ) | (908 | ) | ||||||||||
| Corporate capital expenditures |
(109 | ) | (425 | ) | (332 | ) | (141 | ) | (426 | ) | ||||||||||
| Tenant improvements - second generation |
(6,435 | ) | (6,466 | ) | (12,961 | ) | (5,243 | ) | (8,151 | ) | ||||||||||
| Building improvements - second generation |
(3,462 | ) | (2,531 | ) | (5,494 | ) | (8,075 | ) | (3,846 | ) | ||||||||||
| Leasing commissions - second generation |
(3,156 | ) | (6,292 | ) | (730 | ) | (2,048 | ) | (3,347 | ) | ||||||||||
|
|
|
|
|
|
|
|
|
|
|
|||||||||||
| Core FAD |
$ | 29,693 | $ | 41,267 | $ | 24,083 | $ | 37,786 | $ | 37,738 | ||||||||||
|
|
|
|
|
|
|
|
|
|
|
|||||||||||
| Reconciliation of Net Income to EBITDA and Adjusted EBITDA | ||||||||||||||||||||
| Net income (loss) |
$ | (3,191 | ) | $ | 710 | $ | (12,269 | ) | $ | (19,618 | ) | $ | 8,288 | |||||||
| Interest expense |
23,554 | 23,001 | 23,360 | 23,928 | 19,618 | |||||||||||||||
| Income tax expense (benefit) |
(2,106 | ) | (4,177 | ) | 38 | (2,450 | ) | (382 | ) | |||||||||||
| Depreciation and amortization |
44,457 | 47,397 | 44,733 | 52,783 | 46,093 | |||||||||||||||
|
|
|
|
|
|
|
|
|
|
|
|||||||||||
| EBITDA |
62,714 | 66,931 | 55,862 | 54,643 | 73,617 | |||||||||||||||
| Impairment charges, net of reimbursement |
— | — | 1,259 | 4,101 | — | |||||||||||||||
|
|
|
|
|
|
|
|
|
|
|
|||||||||||
| Adjusted EBITDA |
$ | 62,714 | $ | 66,931 | $ | 57,121 | $ | 58,744 | $ | 73,617 | ||||||||||
|
|
|
|
|
|
|
|
|
|
|
|||||||||||
Page 19
|
|
||
| First Quarter 2021 | ||
| Debt Summary | ||
| (unaudited and dollars in thousands)
|
| March 31, 2021 | December 31, 2020 | |||||||||||||||||||||||
| Weighted Average | Weighted Average | |||||||||||||||||||||||
| Interest | Maturity | Interest | Maturity | |||||||||||||||||||||
| Debt Summary |
Balance | Rate | (Years) | Balance | Rate | (Years) | ||||||||||||||||||
| Fixed rate mortgage debt |
$ | 785,876 | 3.81 | % | 8.2 | $ | 786,884 | 3.81 | % | 8.4 | ||||||||||||||
| Senior unsecured notes |
975,000 | 4.10 | % | 8.9 | 975,000 | 4.10 | % | 9.2 | ||||||||||||||||
| Unsecured term loan facilities (1) |
265,000 | 3.40 | % | 4.3 | 265,000 | 3.40 | % | 4.6 | ||||||||||||||||
|
|
|
|
|
|
|
|
|
|
|
|
|
|||||||||||||
| Total fixed rate debt |
2,025,876 | 3.91 | % | 8.1 | 2,026,884 | 3.91 | % | 8.3 | ||||||||||||||||
| Unsecured term loan facilities |
125,000 | 1.61 | % | 5.8 | 125,000 | 1.64 | % | 6.0 | ||||||||||||||||
| Unsecured revolving credit facilities |
— | — | 4.0 | — | 0.00 | % | 0.7 | |||||||||||||||||
|
|
|
|
|
|
|
|
|
|
|
|
|
|||||||||||||
| Total variable rate debt |
125,000 | 1.61 | % | 5.3 | 125,000 | 1.64 | % | 4.5 | ||||||||||||||||
|
|
|
|
|
|
|
|
|
|
|
|
|
|||||||||||||
| Total debt |
2,150,876 | 3.91 | % | 7.9 | 2,151,884 | 3.91 | % | 8.2 | ||||||||||||||||
|
|
|
|
|
|
|
|
|
|||||||||||||||||
| Deferred financing costs, net |
(14,575 | ) | (15,235 | ) | ||||||||||||||||||||
|
|
|
|
|
|||||||||||||||||||||
| Total |
$ | 2,136,301 | $ | 2,136,649 | ||||||||||||||||||||
|
|
|
|
|
|||||||||||||||||||||
Note:
| (1) | LIBOR is fixed at 2.1485% for $265 million under a variable to fixed interest rate swap agreement. |
| Available Capacity |
Facility | Outstanding at March 31, 2021 |
Letters of Credit |
Available Capacity |
||||||||||||
| Unsecured revolving credit facility (1) |
$ | 850,000 | $ | — | $ | — | $ | 850,000 | ||||||||
|
|
|
|
|
|
|
|
|
|||||||||
| Covenant Summary |
Required | Current Quarter |
In Compliance |
|||||||||||||
| Maximum Total Leverage(2) |
< 60 | % | 40.7 | % | Yes | |||||||||||
| Maximum Secured Debt |
< 40 | % | 14.8 | % | Yes | |||||||||||
| Minimum Fixed Charge Coverage |
> 1.50 | x | 2.2 | x | Yes | |||||||||||
| Minimum Unencumbered Interest Coverage |
> 1.75 | x | 4.5 | x | Yes | |||||||||||
| Maximum Unsecured Leverage |
< 60 | % | 33.6 | % | Yes | |||||||||||
Notes:
| (1) | The unsecured revolving credit and term loan facilities have an accordion feature allowing for an increase in maximum aggregate principal balance to $1.5 billion under certain circumstances. This unsecured revolving credit facility matures in March 2025 with two additional six-month extension options. |
| (2) | Represents the ratio of total indebtedness to total asset value as defined and determined in accordance with the credit facility agreement. |
Page 20
|
|
First Quarter 2021 Debt Detail (unaudited and dollars in thousands)
|
| Stated Interest Rate (%) |
Effective Interest Rate (%) (1) |
Principal Balance |
Maturity Date |
Amortization | ||||||||||||||||
| Fixed rate mortgage debt: |
||||||||||||||||||||
| Metro Center |
3.59 | % | 3.68 | % | $ | 86,803 | 11/5/2024 | 30 years | ||||||||||||
| 10 Union Square |
3.70 | % | 3.97 | % | 50,000 | 4/1/2026 | Interest only | |||||||||||||
| 1542 Third Avenue |
4.29 | % | 4.53 | % | 30,000 | 5/1/2027 | Interest only | |||||||||||||
| First Stamford Place (2) |
4.28 | % | 4.71 | % | 180,000 | 7/1/2027 | |
5 years interest only; 30 years thereafter |
| |||||||||||
| 1010 Third Avenue and 77 West 55th Street |
4.01 | % | 4.23 | % | 37,278 | 1/5/2028 | 30 years | |||||||||||||
| 250 West 57th Street |
2.83 | % | 3.19 | % | 180,000 | 12/1/2030 | Interest only | |||||||||||||
| 10 Bank Street |
4.23 | % | 4.36 | % | 31,795 | 6/1/2032 | 25 years | |||||||||||||
| 383 Main Avenue |
4.44 | % | 4.55 | % | 30,000 | 6/30/2032 | |
5 years interest only; 30 years thereafter |
| |||||||||||
| 1333 Broadway |
4.21 | % | 4.29 | % | 160,000 | 2/5/2033 | Interest only | |||||||||||||
|
|
|
|||||||||||||||||||
| Total mortgage debt |
785,876 | |||||||||||||||||||
| Unsecured term loan facility |
LIBOR plus 1.20 | % | 3.56 | % | 215,000 | 3/19/2025 | Interest only | |||||||||||||
| Unsecured revolving credit facility |
LIBOR plus 1.30 | % | — | — | 3/31/2025 | Interest only | ||||||||||||||
| Unsecured term loan facility |
LIBOR plus 1.50 | % | 3.60 | % | 175,000 | 12/31/2026 | Interest only | |||||||||||||
| Senior unsecured notes: |
||||||||||||||||||||
| Series A |
3.93 | % | 3.96 | % | 100,000 | 3/27/2025 | Interest only | |||||||||||||
| Series B |
4.09 | % | 4.12 | % | 125,000 | 3/27/2027 | Interest only | |||||||||||||
| Series C |
4.18 | % | 4.21 | % | 125,000 | 3/27/2030 | Interest only | |||||||||||||
| Series D |
4.08 | % | 4.11 | % | 115,000 | 1/22/2028 | Interest only | |||||||||||||
| Series E |
4.26 | % | 4.27 | % | 160,000 | 3/22/2030 | Interest only | |||||||||||||
| Series F |
4.44 | % | 4.45 | % | 175,000 | 3/22/2033 | Interest only | |||||||||||||
| Series G |
3.61 | % | 4.89 | % | 100,000 | 3/17/2032 | Interest only | |||||||||||||
| Series H |
3.73 | % | 5.00 | % | 75,000 | 3/17/2035 | Interest only | |||||||||||||
|
|
|
|
|
|
|
|||||||||||||||
| Total / weighted average debt |
3.91 | % | 4.10 | % | 2,150,876 | |||||||||||||||
|
|
|
|
|
|||||||||||||||||
| Deferred financing costs, net |
(14,575 | ) | ||||||||||||||||||
|
|
|
|||||||||||||||||||
| Total |
$ | 2,136,301 | ||||||||||||||||||
|
|
|
|||||||||||||||||||
Notes:
| (1) | The effective interest rate is composed of the stated interest rate, deferred financing cost amortization and interest associated with variable to fixed interest rate swap agreements. |
| (2) | Represents a $164 million mortgage loan bearing interest at 4.09% and a $16 million loan bearing interest at 6.25%. |
Page 21
|
|
First Quarter 2021 Debt Maturities and Ground Lease Commitments (unaudited and dollars in thousands)
|
| Year |
Maturities (1) | Amortization | Total | Percentage of Total Debt |
Weighted Average Interest Rate of Maturing Debt |
|||||||||||||||
| 2021 |
$ | — | $ | 3,082 | $ | 3,082 | 0.1 | % | n/a | |||||||||||
| 2022 |
— | 5,628 | 5,628 | 0.3 | % | n/a | ||||||||||||||
| 2023 |
— | 7,876 | 7,876 | 0.4 | % | n/a | ||||||||||||||
| 2024 |
77,675 | 7,958 | 85,633 | 4.0 | % | 3.59 | % | |||||||||||||
| 2025 |
315,000 | 5,826 | 320,826 | 14.9 | % | 3.57 | % | |||||||||||||
| 2026 |
225,000 | 6,080 | 231,080 | 10.7 | % | 3.83 | % | |||||||||||||
| 2027 |
319,000 | 5,008 | 324,008 | 15.1 | % | 4.21 | % | |||||||||||||
| 2028 |
146,092 | 1,877 | 147,969 | 6.9 | % | 4.06 | % | |||||||||||||
| 2029 |
— | 1,959 | 1,959 | 0.1 | % | n/a | ||||||||||||||
| 2030 |
465,000 | 2,045 | 467,045 | 21.7 | % | 3.68 | % | |||||||||||||
| Thereafter |
552,655 | 3,115 | 555,770 | 25.8 | % | 4.13 | % | |||||||||||||
|
|
|
|
|
|
|
|
|
|
|
|||||||||||
| Total debt |
$ | 2,100,422 | $ | 50,454 | 2,150,876 | 100.0 | % | 3.91 | % | |||||||||||
|
|
|
|
|
|
|
|
|
|||||||||||||
| Deferred financing costs, net |
(14,575 | ) | ||||||||||||||||||
|
|
|
|||||||||||||||||||
| Total |
$ | 2,136,301 | ||||||||||||||||||
|
|
|
|||||||||||||||||||
Note:
| (1) | Assumes no extension options are exercised. |
Debt Maturity and Amortization Profile
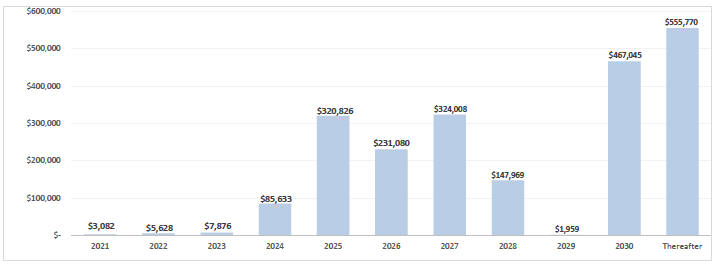
Ground Lease Commitments (1)
| Year |
1350 Broadway (2) |
1400 Broadway (3) |
111 West 33rd Street (4) |
Total | ||||||||||||
| 2021 |
$ | 81 | $ | 506 | $ | 551 | $ | 1,139 | ||||||||
| 2022 |
108 | 675 | 735 | 1,518 | ||||||||||||
| 2023 |
108 | 675 | 735 | 1,518 | ||||||||||||
| 2024 |
108 | 675 | 735 | 1,518 | ||||||||||||
| 2025 |
108 | 675 | 735 | 1,518 | ||||||||||||
| Thereafter |
1,821 | 25,650 | 37,791 | 65,262 | ||||||||||||
|
|
|
|
|
|
|
|
|
|||||||||
| $ | 2,334 | $ | 28,856 | $ | 41,282 | $ | 72,473 | |||||||||
|
|
|
|
|
|
|
|
|
|||||||||
Notes:
| (1) | There are no fair value market resets, no step-ups, and no escalations in the three ground lease commitments. |
| (2) | Expires July 31, 2050 with a remaining term, including unilateral extension rights available to the Company, of approximately 29 years. |
| (3) | Expires December 31, 2063 with a remaining term, including unilateral extension rights available to the Company, of approximately 42 years. |
| (4) | Expires May 31, 2077 with a remaining term, including unilateral extension rights available to the Company, of approximately 56 years. |
Page 22

|
First Quarter 2021 Supplemental Definitions |
Funds From Operations (“FFO”)
We compute FFO in accordance with the “White Paper” on FFO published by the National Association of Real Estate Investment Trusts, or NAREIT, which defines FFO as net income (loss) (determined in accordance with GAAP), excluding impairment writedowns of investments in depreciable real estate and investments in in-substance real estate investments, gains or losses from debt restructurings and sales of depreciable operating properties, plus real estate-related depreciation and amortization (excluding amortization of deferred financing costs), less distributions to non-controlling interests and gains/losses from discontinued operations and after adjustments for unconsolidated partnerships and joint ventures. FFO is a widely recognized non-GAAP financial measure for REITs that we believe, when considered with financial statements determined in accordance with GAAP, is useful to investors in understanding financial performance and providing a relevant basis for comparison among REITs. In addition, FFO is useful to investors as it captures features particular to real estate performance by recognizing that real estate has generally appreciated over time or maintains residual value to a much greater extent than do other depreciable assets. Investors should review FFO, along with GAAP net income, when trying to understand an equity REIT’s operating performance. We present FFO because we consider it an important supplemental measure of our operating performance and believe that it is frequently used by securities analysts, investors and other interested parties in the evaluation of REITs. However, because FFO excludes depreciation and amortization and captures neither the changes in the value of our properties that result from use or market conditions nor the level of capital expenditures and leasing commissions necessary to maintain the operating performance of our properties, all of which have real economic effect and could materially impact our results of operations, the utility of FFO as a measure of its performance is limited. There can be no assurance that FFO presented by us is comparable to similarly titled measures of other REITs. FFO does not represent cash generated from operating activities and should not be considered as an alternative to net income (loss) determined in accordance with GAAP or to cash flow from operating activities determined in accordance with GAAP. FFO is not indicative of cash available to fund ongoing cash needs, including the ability to make cash distributions. Although FFO is a measure used for comparability in assessing the performance of REITs, as the NAREIT White Paper only provides guidelines for computing FFO, the computation of FFO may vary from one company to another.
Modified Funds From Operations (“Modified FFO”)
Modified FFO adds back an adjustment for any above or below-market ground lease amortization to traditionally defined FFO. We consider this a useful supplemental measure in evaluating our operating performance due to the non-cash accounting treatment under GAAP, which stems from the third quarter 2014 acquisition of two option properties following our formation transactions as they carry significantly below market ground leases, the amortization of which is material to our overall results. We present Modified FFO because we consider it an important supplemental measure of our operating performance in that it adds back the non-cash amortization of below-market ground leases. There can be no assurance that Modified FFO presented by us is comparable to similarly titled measures of other REITs. Modified FFO does not represent cash generated from operating activities and should not be considered as an alternative to net income (loss) determined in accordance with GAAP or to cash flow from operating activities determined in accordance with GAAP. Modified FFO is not indicative of cash available to fund ongoing cash needs, including the ability to make cash distributions.
Core Funds From Operations (“Core FFO”)
Core FFO adds back to Modified FFO the following items: loss on early extinguishment of debt, acquisition expenses, severance expenses and IPO litigation expense. The Company presents Core FFO because it considers it an important supplemental measure of its operating performance in that it excludes non-recurring items. There can be no assurance that Core FFO presented by the Company is comparable to similarly titled measures of other REITs. Core FFO does not represent cash generated from operating activities and should not be considered as an alternative to net income (loss) determined in accordance with GAAP or to cash flow from operating activities determined in accordance with GAAP. Core FFO is not indicative of cash available to fund ongoing cash needs, including the ability to make cash distributions. In future periods, we may also exclude other items from Core FFO that we believe may help investors compare our results.
Core Funds Available for Distribution (“Core FAD”)
In addition to Core FFO, we present Core FAD by (i) adding to Core FFO non-real estate depreciation and amortization, the amortization of deferred financing costs, amortization of debt discounts and non-cash compensation expenses and (ii) deducting straight line rent, recurring second generation leasing commissions, tenant improvements, prebuilts, capital expenditures, furniture, fixtures & equipment, amortization of debt premiums and above/below market rent revenue. Core FAD is presented solely as a supplemental disclosure that we believe provides useful information regarding our ability to fund our dividends. Core FAD does not represent cash generated from operating activities and should not be considered as an alternative to net income (loss) determined in accordance with GAAP or to cash flow from operating activities determined in accordance with GAAP. Core FAD is not indicative of cash available to fund ongoing cash needs., including the ability to make cash distributions. There can be no assurance that Core FAD presented by us is comparable to similarly titled measures of other REITs.
Net Operating Income (NOI)
NOI is a non-GAAP financial measure of performance. NOI is used by our management to evaluate and compare the performance of our properties and to determine trends in earnings and to compute the fair value of our properties as it is not affected by; (i) the cost of funds of the property owner, (ii) the impact of depreciation and amortization expenses as well as gains or losses from the sale of operating real estate assets that are included in net income computed in accordance with GAAP, (iii) acquisition expenses, impairment charges, loss on early extinguishment of debt and loss from derivative financial instruments or (iv) general and administrative expenses and other gains and losses that are specific to the property owner. The cost of funds is eliminated from net operating income because it is specific to the particular financing capabilities and constraints of the owner. The cost of funds is also eliminated because it is dependent on historical interest rates and other costs of capital as well as past decisions made by us regarding the appropriate mix of capital which may have changed or may change in the future. Depreciation and amortization expenses as well as gains or losses from the sale of operating real estate assets are eliminated because they may not accurately represent the actual change in value in our office or retail properties that result from use of the properties or changes in market conditions. While certain aspects of real property do decline in value over time in a manner that is reasonably captured by depreciation and amortization, the value of the properties as a whole have historically increased or decreased as a result of changes in overall economic conditions instead of from actual use of the property or the passage of time. Gains and losses from the sale of real property vary from property to property and are affected by market conditions at the time of sale which will usually change from period to period. These gains and losses can create distortions when comparing one period to another or when comparing our operating results to the operating results of other real estate companies that have not made similarly timed, purchases or sales. We believe that eliminating these costs from net income is useful because the resulting measure captures the actual revenue, generated and actual expenses incurred in operating our properties as well as trends in occupancy rates, rental rates and operating costs. However, the usefulness of NOI is limited because it excludes general and administrative costs, interest expense, depreciation and amortization expense and gains or losses from the sale of properties, and other gains and losses as stipulated by GAAP, the level of capital expenditures and leasing costs necessary to maintain the operating performance of our properties, all of which are significant economic costs. NOI may fail to capture significant trends in these components of net income which further limits its usefulness. NOI is a measure of the operating performance of our properties but does not measure our performance as a whole. NOI is therefore not a substitute for net income as computed in accordance with GAAP. This measure should be analyzed in conjunction with net income computed in accordance with GAAP. Other companies may use different methods for calculating NOI or similarly titled measures and, accordingly, our NOI may not-be comparable to similarly titled measures reported by other companies that do not define the measure exactly as we do.
EBITDA and Adjusted EBITDA
We compute EBITDA as net income plus interest expense, income taxes and depreciation. We present EBITDA because we believe that EBITDA, along with cash flow from operating activities, investing activities and financing activities, provides investors with an additional indicator of its ability to incur and service debt. EBITDA should not be considered as an alternative to net income (determined in accordance with GAAP), as an indication of our financial performance, as an alternative to net cash flows from operating activities (determined in accordance with GAAP), or as a measure of its liquidity. For adjusted EBITDA, we add back impairment charges.
Page 23