Attached files
| file | filename |
|---|---|
| 8-K - 8-K - ANNALY CAPITAL MANAGEMENT INC | nly-20210428.htm |
First Quarter 2021 Investor Presentation April 28, 2021
Important Notices 2 This presentation is issued by Annaly Capita l Management, Inc. ("Annaly"), an internally-managed, publicly traded company that has elected to be taxed as a real estate investment trust for federal income tax purposes and is be ing furnished in connection with Annaly’s First Quarter 2021 earnings release. This presentation is provided for investors in Annaly for inf ormational purposes only and is not an offer to sell, or a solicitation of an offer to buy, any security or instrument. Forward-Looking Statements This presentation, other wr itten or oral communications, and our public documents to which we refer contain or incorporate by reference certain forward-looking statements which are based on var ious assumptions (some of which are beyond our control) and may be identified by reference to a future period or periods or by the use of forward-looking terminology, such as “may,” “will,” “believe,” “expect,” “anticipate,” “cont inue,” or similar terms or variations on those terms or the negative of those terms. Such statements include those relating to the Company’s future performance, macro outlook, the interest rate and credit environments, tax reform and future opportunities. Actual results could differ materially from those set forth in forward-looking statements due to a var iety of factors, including, but not limited to, risks and uncertainties related to the COVID-19 pandemic, inc luding as related to adverse economic conditions on real estate-related assets and financing conditions; changes in interest rates; changes in the yield curve; changes in prepayment rates; the availability of mortgage-backed securities (“MBS”) and other securities for purchase; the availability of financing and, if available, the terms of any financing; changes in the market value of the Company’s assets; changes in business conditions and the general economy; the Company’s ability to grow its residential credit business; the Company’s ability to grow its middle market lending business; credit risks related to the Company’s investments in credit risk transfer securities, residential mortgage-backed securities and related residential mortgage credit assets, commercial real estate assets and corporate debt; risks related to investments in mortgage servicing r ights; the Company’s ability to consummate any contemplated investment opportunities; changes in government regulations or policy affecting the Company’s business; the Company’s ability to maintain its qualif ication as a REIT for U.S. federal income tax purposes; the Company’s ability to maintain its exemption from registration under the Investment Company Act of 1940; and the timing and ultimate completion of the sale of our commercial real estate business. For a discussion of the risks and uncertainties which could cause actual results to differ from those contained in the forward-looking statements, see “Risk Factors” in our most recent Annual Report on Form 10-K and any subsequent Quarterly Reports on Form 10-Q. The Company does not undertake, and specifically disclaims any obligation, to publicly release the result of any revisions which may be made to any forward-looking statements to reflect the occurrence of anticipated or unanticipated events or circumstances after the date of such statements, except as required by law. We routinely post important information for investors on our website, www.annaly.com. We intend to use this webpage as a means of disclos ing materia l information, for complying with our disclosure obligations under Regulation FD and to post and update investor presentations and similar materials on a regular basis. Annaly encourages investors, analysts, the media and others interested in Annaly to monitor the Investors section of our website, in addition to following our press releases, SEC filings, public conference calls, presentations, webcasts and other information we post from time to time on our website. To sign-up for email-notifications, please visit the “Email Alerts” section of our website, www.annaly.com, under the “Investors” section and enter the required information to enable notifications. The information contained on, or that may be accessed through, our webpage is not incorporated by reference into, and is not a part of, this document. Past performance is no guarantee of future results. There is no guarantee that any investment strategy referenced herein will work under all market conditions. Prior to making any investment decision, you should evaluate your ability to invest for the long-term, especially during periods of downturns in the market. You alone assume the responsibility of evaluating the merits and risks associated with any potential investment or investment strategy referenced herein. To the extent that this material contains reference to any past specific investment recommendations or strategies which were or would have been profitable to any person, it should not be assumed that recommendations made in the future will be profitable or will equal the performance of such past investment recommendations or strategies. The information contained herein is not intended to provide, and should not be relied upon for accounting, legal or tax advice or investment recommendations for Annaly or any of its affiliates. Regardless of source, information is believed to be re liable for purposes used herein, but Annaly makes no representation or warranty as to the accuracy or completeness thereof and does not take any responsibility for information obtained from sources outside of Annaly. Certain inf ormation contained in the presentation discusses general market activity, industry or sector trends, or other broad-based economic, market or political conditions and should not be construed as research or investment advice. Non-GAAP Financial Measures This presentation includes certain non-GAAP financial measures, including core earnings excluding the premium amortization adjustment (“PAA”). We believe the non-GAAP financial measures are useful for management, investors, analysts, and other interested parties in evaluating our performance but should not be viewed in isolation and are not a substitute for financial measures computed in accordance wit h U.S. generally accepted accounting principles (“GAAP”). In addition, we may calculate our non-GAAP metrics, such as core earnings (excluding PAA), or the PAA, differently than our peers making comparative analysis difficult. Please see the section entitled “Non-GAAP Reconciliations” in the attached Appendix for a reconciliation to the most directly comparable GAAP financial measures. Divestiture of Commercial Real Estate Business On March 25, 2021, the Company announced the sale of substantially all of the assets that comprise its commercial real estate business to Slate Asset Management for $2.33 billion, which is expected to be completed by the third quarter of 2021. The Company also intends to sell nearly all of the remaining assets that are not included in the sale to Slate. As of March 31, 2021, the Company met the conditions for held-for sale account ing which requires that assets be carried at the lower of amortized cost or fair value less costs to sell. Assets and liabilities associated with the commercial real estate business are reported separately in the Company’s Consolidated Statement of Financial Condition as Assets and Liabilit ies of Disposal Group Held for Sale, respectively. The Company’s Consolidated Statement of Comprehensive Income (Loss) reflects a reversal of previously recognized loan loss provisions as well as business divestiture-related gains (losses), which include valuation allowances on commercial real estate assets, impairment of goodwill and estimated transaction costs. Revenues and expenses associated with the commercial real estate business will be reflected in the Company’s results of operations and key financial metrics through closing.
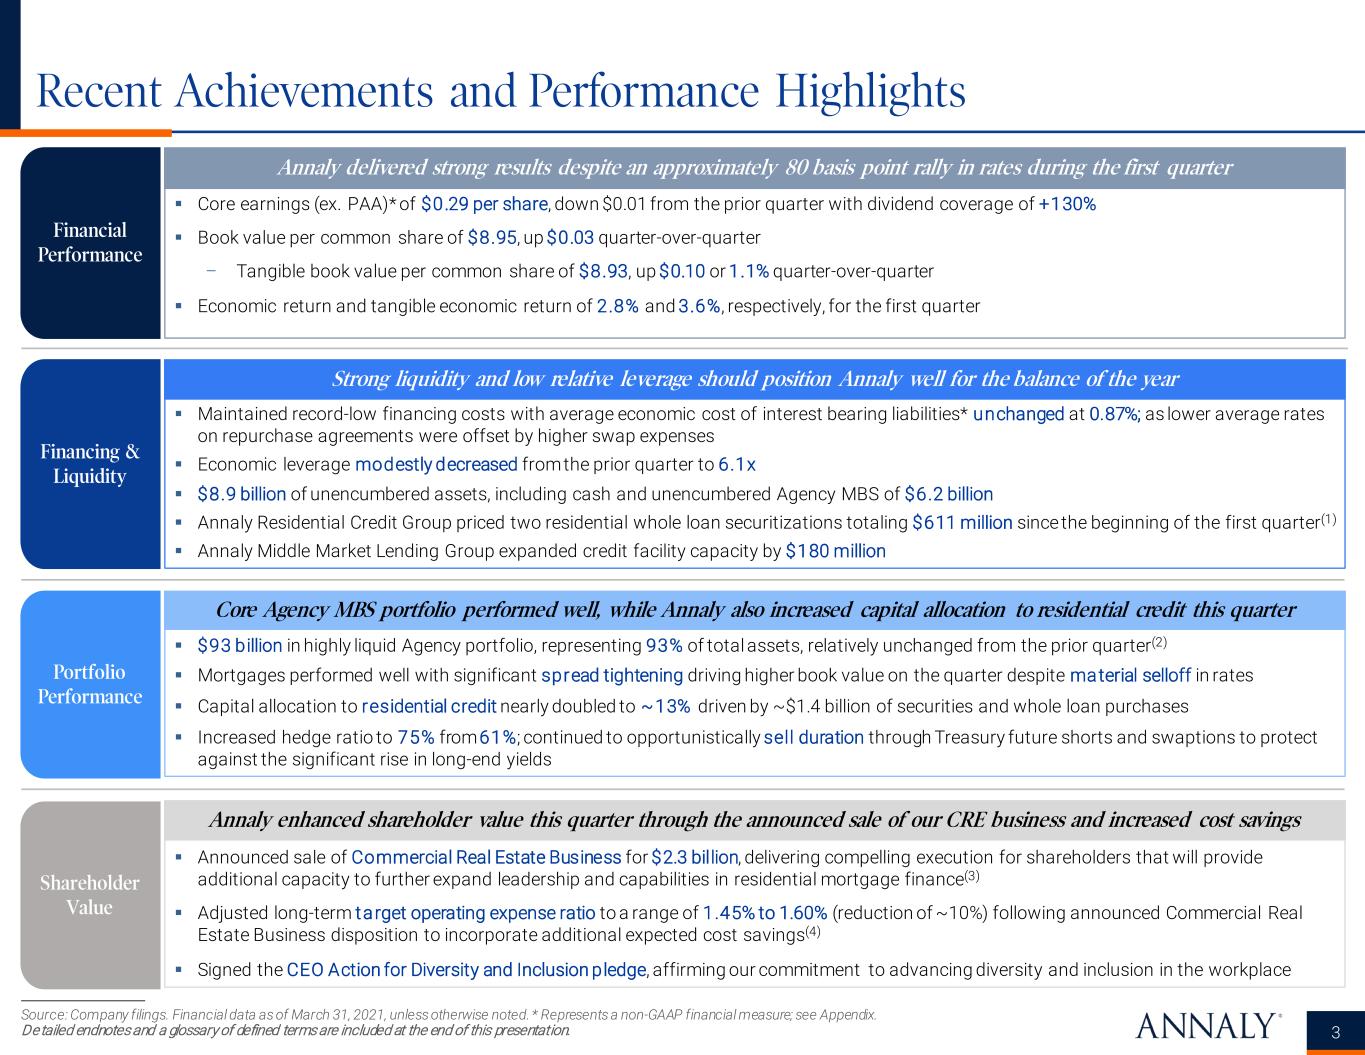
Recent Achievements and Performance Highlights Source: Company filings. Financial data as of March 31, 2021, unless otherwise noted. * Represents a non-GAAP financial measure; see Appendix. Detailed endnotes and a glossary of defined terms are included at the end of this presentation. 3 Annaly delivered strong results despite an approximately 80 basis point rally in rates during the first quarter Strong liquidity and low relative leverage should position Annaly well for the balance of the year Core Agency MBS portfolio performed well, while Annaly also increased capital allocation to residential credit this quarter Annaly enhanced shareholder value this quarter through the announced sale of our CRE business and increased cost savings Core earnings (ex. PAA)* of $0.29 per share, down $0.01 from the prior quarter with dividend coverage of +130% Book value per common share of $8.95, up $0.03 quarter-over-quarter – Tangible book value per common share of $8.93, up $0.10 or 1.1% quarter-over-quarter Economic return and tangible economic return of 2.8% and 3.6%, respectively, for the first quarter Announced sale of Commercial Real Estate Business for $2.3 billion, delivering compelling execution for shareholders that will provide additional capacity to further expand leadership and capabilities in residential mortgage finance(3) Adjusted long-term target operating expense ratio to a range of 1.45% to 1.60% (reduction of ~10%) following announced Commercial Real Estate Business disposition to incorporate additional expected cost savings(4) Signed the CEO Action for Diversity and Inclusion pledge, affirming our commitment to advancing diversity and inclusion in the workplace $93 billion in highly liquid Agency portfolio, representing 93% of total assets, relatively unchanged from the prior quarter(2) Mortgages performed well with significant spread tightening driving higher book value on the quarter despite material selloff in rates Capital allocation to residential credit nearly doubled to ~13% driven by ~$1.4 billion of securities and whole loan purchases Increased hedge ratio to 75% from 61%; continued to opportunistically sell duration through Treasury future shorts and swaptions to protect against the significant rise in long-end yields Maintained record-low financing costs with average economic cost of interest bearing liabilities* unchanged at 0.87%; as lower average rates on repurchase agreements were offset by higher swap expenses Economic leverage modestly decreased from the prior quarter to 6.1x $8.9 billion of unencumbered assets, including cash and unencumbered Agency MBS of $6.2 billion Annaly Residential Credit Group priced two residential whole loan securitizations totaling $611 million since the beginning of the first quarter(1) Annaly Middle Market Lending Group expanded credit facility capacity by $180 million Financial Performance Financing & Liquidity Portfolio Performance Shareholder Value
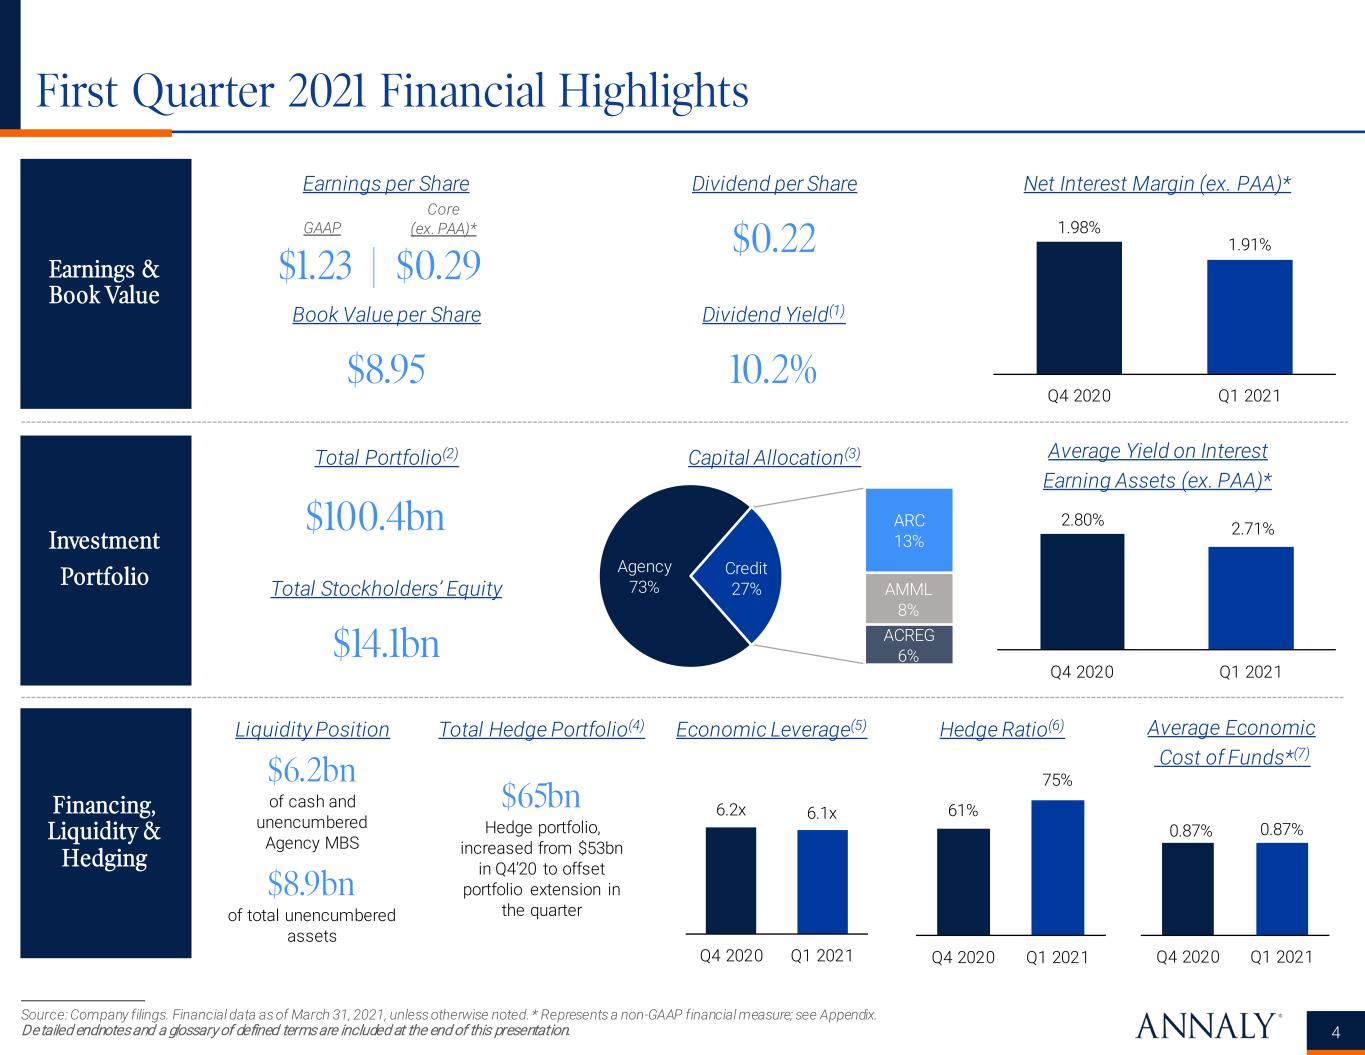
Source: Company filings. Financial data as of March 31, 2021, unless otherwise noted. * Represents a non-GAAP financial measure; see Appendix. Detailed endnotes and a glossary of defined terms are included at the end of this presentation. 4 First Quarter 2021 Financial Highlights Earnings & Book Value $1.23 | $0.29 $8.95 Earnings per Share Core (ex. PAA)*GAAP Book Value per Share 10.2% Dividend per Share Dividend Yield(1) $0.22 Net Interest Margin (ex. PAA)* Investment Portfolio $100.4bn $14.1bn Total Portfolio(2) Total Stockholders’ Equity Capital Allocation(3) Average Yield on Interest Earning Assets (ex. PAA)* Financing, Liquidity & Hedging Liquidity Position $6.2bn of cash and unencumbered Agency MBS $8.9bn of total unencumbered assets Total Hedge Portfolio(4) $65bn Hedge portfolio, increased from $53bn in Q4’20 to offset portfolio extension in the quarter Economic Leverage(5) Hedge Ratio(6) Average Economic Cost of Funds*(7) 1.98% 1.91% Q4 2020 Q1 2021 2.80% 2.71% Q4 2020 Q1 2021 6.2x 6.1x Q4 2020 Q1 2021 0.87% 0.87% Q4 2020 Q1 2021 61% 75% Q4 2020 Q1 2021 Agency 73% ARC 13% AMML 8% ACREG 6% Credit 27%
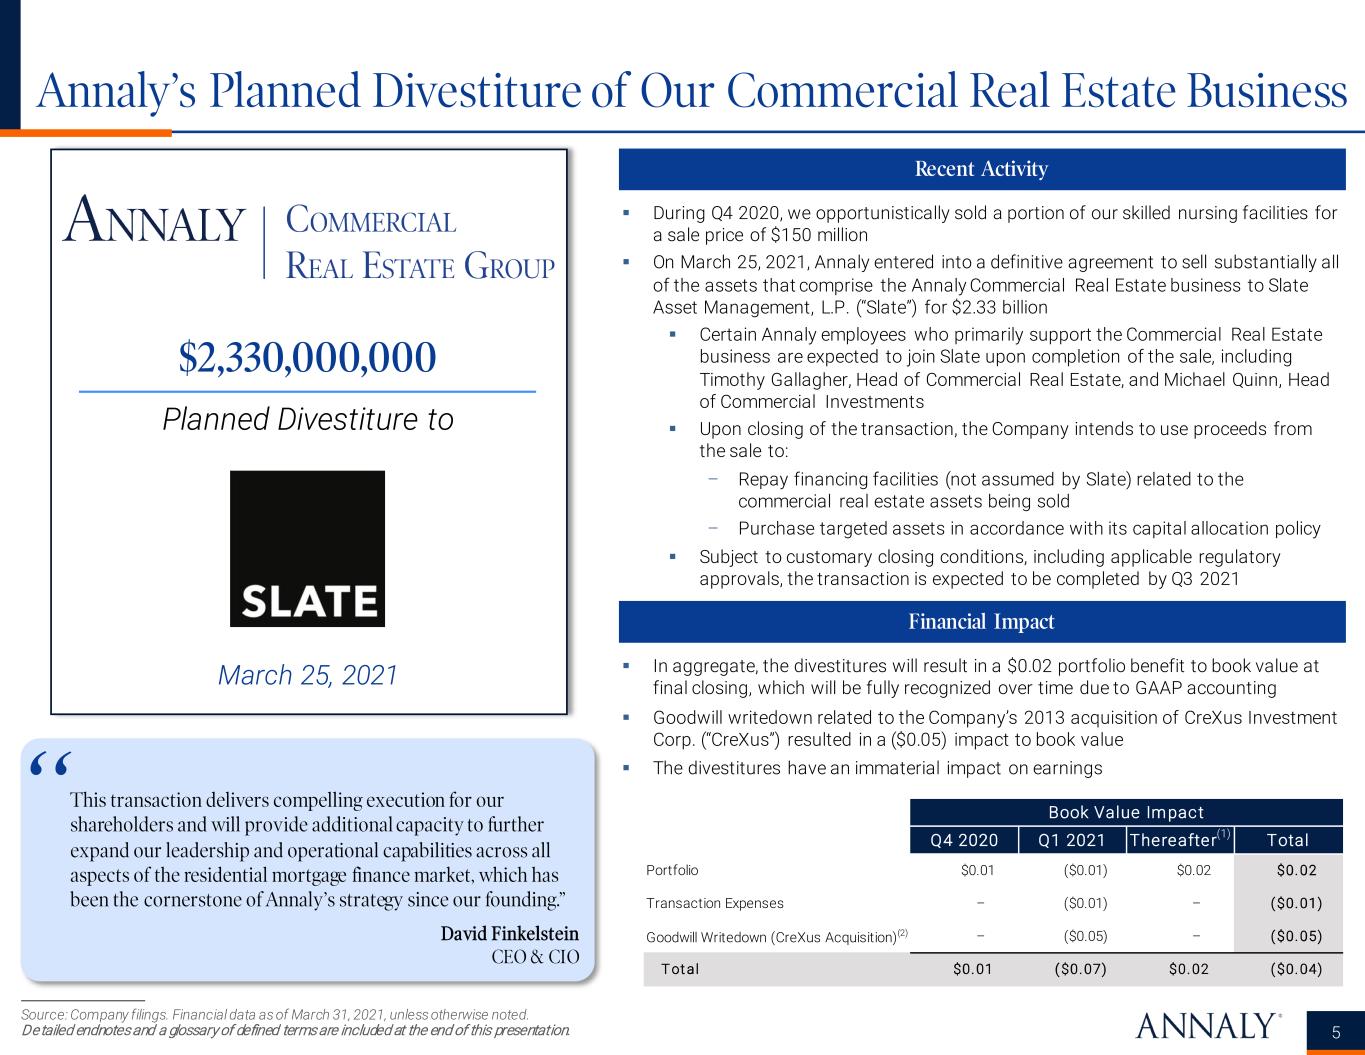
Annaly’s Planned Divestiture of Our Commercial Real Estate Business 5 Recent Activity This transaction delivers compelling execution for our shareholders and will provide additional capacity to further expand our leadership and operational capabilities across all aspects of the residential mortgage finance market, which has been the cornerstone of Annaly’s strategy since our founding.” David Finkelstein CEO & CIO Source: Company filings. Financial data as of March 31, 2021, unless otherwise noted. Detailed endnotes and a glossary of defined terms are included at the end of this presentation. $2,330,000,000 Planned Divestiture to March 25, 2021 “ During Q4 2020, we opportunistically sold a portion of our skilled nursing facilities for a sale price of $150 million On March 25, 2021, Annaly entered into a definitive agreement to sell substantially all of the assets that comprise the Annaly Commercial Real Estate business to Slate Asset Management, L.P. (“Slate”) for $2.33 billion Certain Annaly employees who primarily support the Commercial Real Estate business are expected to join Slate upon completion of the sale, including Timothy Gallagher, Head of Commercial Real Estate, and Michael Quinn, Head of Commercial Investments Upon closing of the transaction, the Company intends to use proceeds from the sale to: – Repay financing facilities (not assumed by Slate) related to the commercial real estate assets being sold – Purchase targeted assets in accordance with its capital allocation policy Subject to customary closing conditions, including applicable regulatory approvals, the transaction is expected to be completed by Q3 2021 Financial Impact In aggregate, the divestitures will result in a $0.02 portfolio benefit to book value at final closing, which will be fully recognized over time due to GAAP accounting Goodwill writedown related to the Company’s 2013 acquisition of CreXus Investment Corp. (“CreXus”) resulted in a ($0.05) impact to book value The divestitures have an immaterial impact on earnings Book Value Impact Q4 2020 Q1 2021 Thereafter Total Portfolio $0.01 ($0.01) $0.02 $0. 02 Transaction Expenses – ($0.01) – ( $0. 01) Goodwill Writedown (CreXus Acquisition)(2) – ($0.05) – ( $0. 05) T ot al $0. 01 ( $0. 07) $0. 02 ( $0. 04) (1)
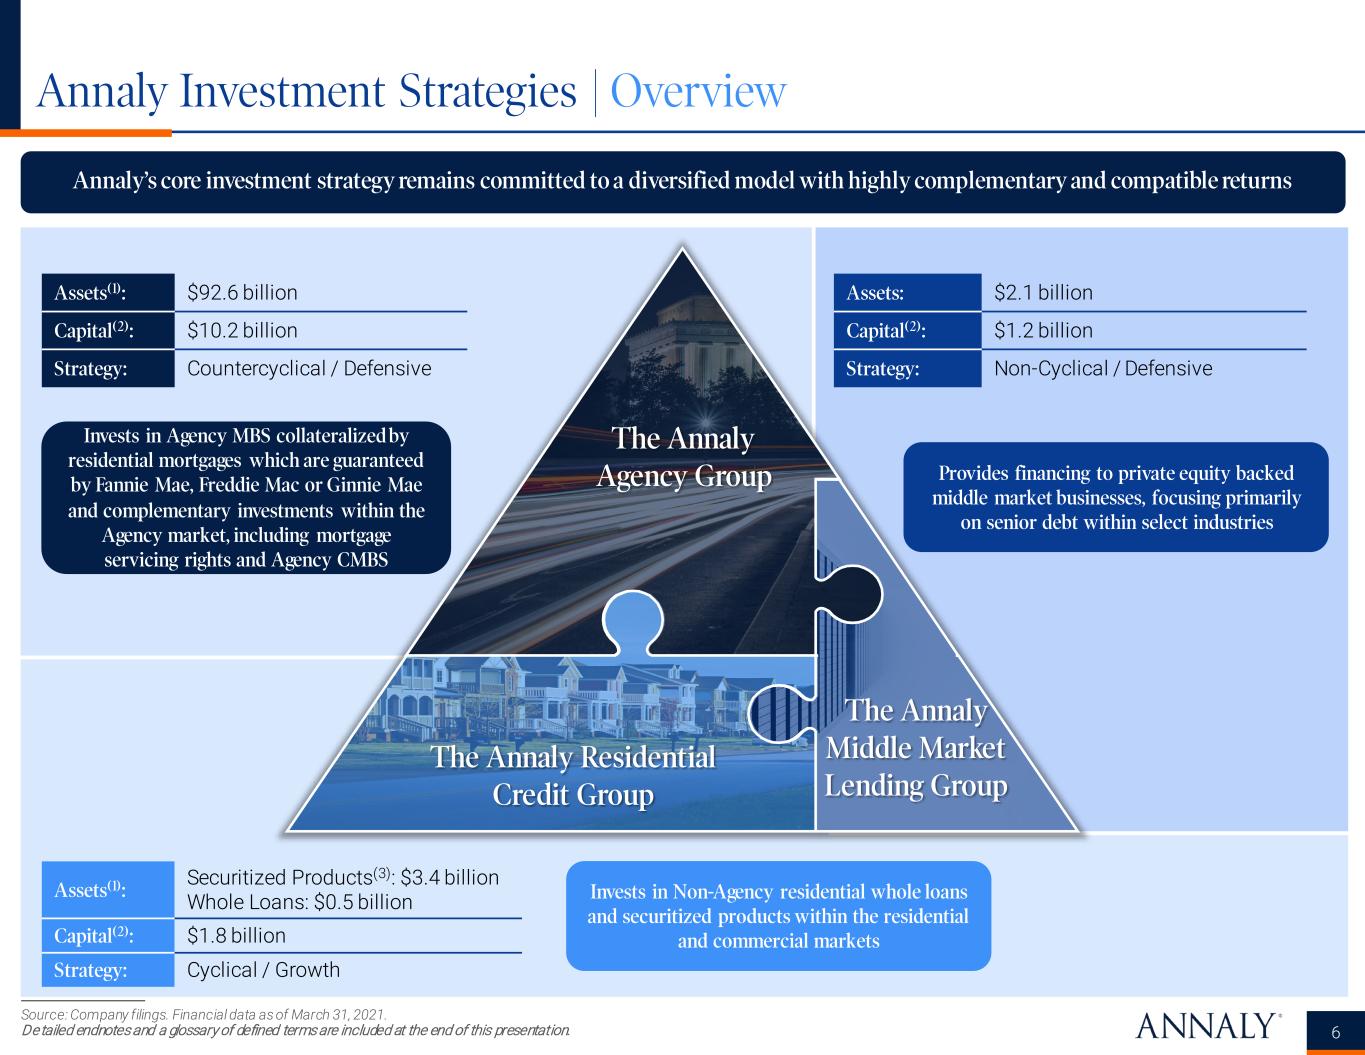
Annaly Investment Strategies | Overview 6 Annaly’s core investment strategy remains committed to a diversified model with highly complementary and compatible returns Source: Company filings. Financial data as of March 31, 2021. Detailed endnotes and a glossary of defined terms are included at the end of this presentation. Assets(1): $92.6 billion Capital(2): $10.2 billion Strategy: Countercyclical / Defensive Assets: $2.1 billion Capital(2): $1.2 billion Strategy: Non-Cyclical / Defensive Assets(1): Securitized Products(3): $3.4 billion Whole Loans: $0.5 billion Capital(2): $1.8 billion Strategy: Cyclical / Growth Invests in Agency MBS collateralized by residential mortgages which are guaranteed by Fannie Mae, Freddie Mac or Ginnie Mae and complementary investments within the Agency market, including mortgage servicing rights and Agency CMBS Invests in Non-Agency residential whole loans and securitized products within the residential and commercial markets Provides financing to private equity backed middle market businesses, focusing primarily on senior debt within select industries The Annaly Middle Market Lending Group The Annaly Residential Credit Group The Annaly Agency Group
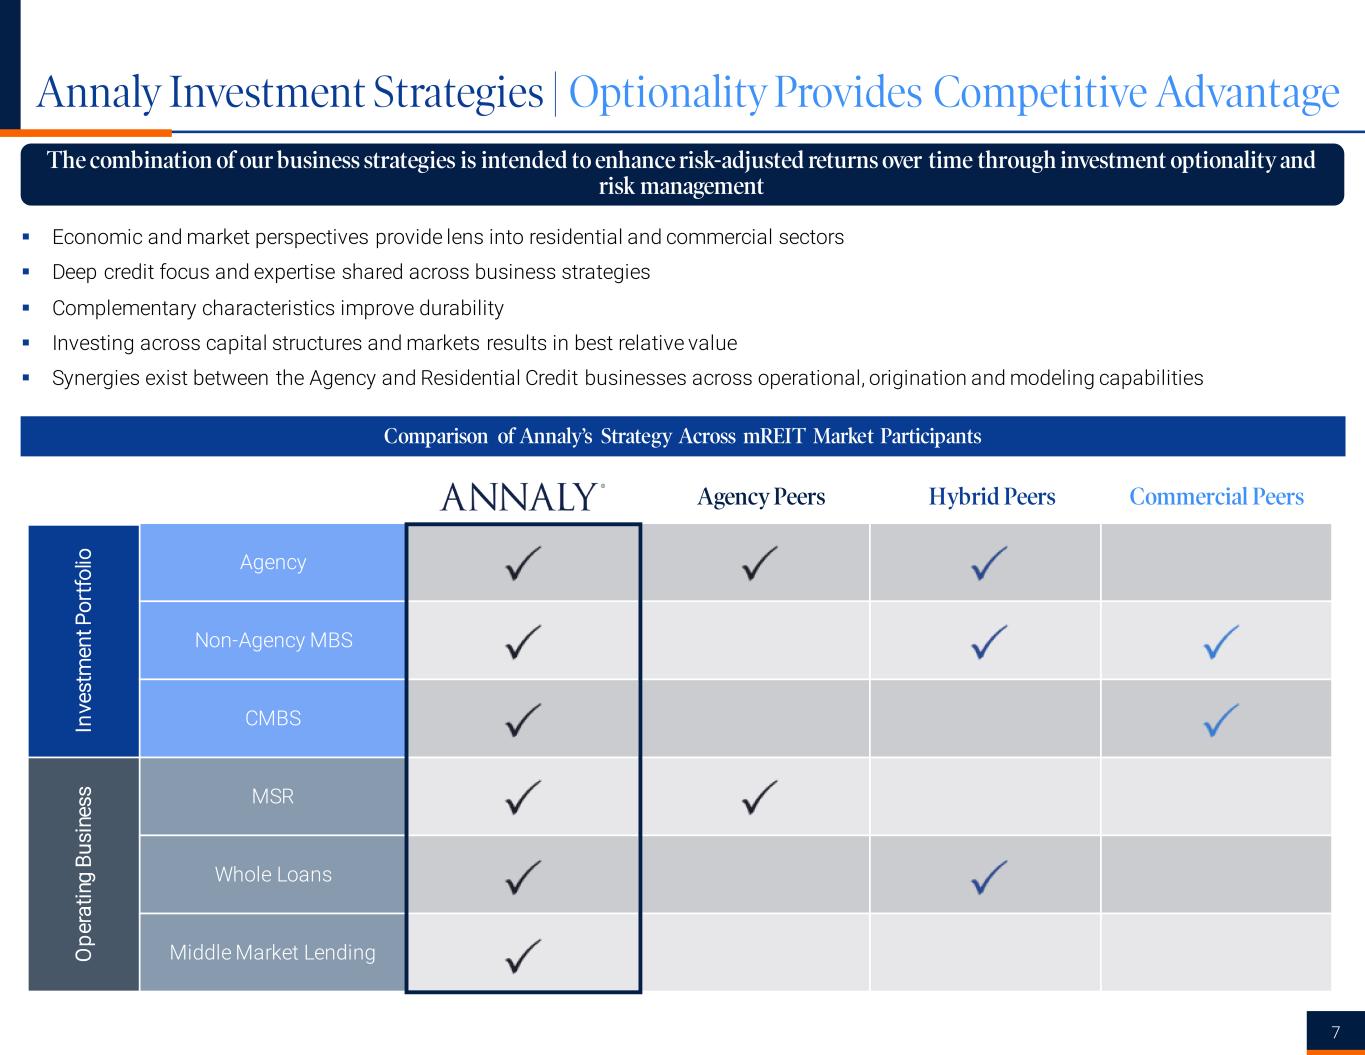
In ve st m en t P or tf ol io Agency Non-Agency MBS CMBS O p er at in g B us in es s MSR Whole Loans Middle Market Lending Annaly Investment Strategies | Optionality Provides Competitive Advantage Economic and market perspectives provide lens into residential and commercial sectors Deep credit focus and expertise shared across business strategies Complementary characteristics improve durability Investing across capital structures and markets results in best relative value Synergies exist between the Agency and Residential Credit businesses across operational, origination and modeling capabilities The combination of our business strategies is intended to enhance risk-adjusted returns over time through investment optionality and risk management 7 Comparison of Annaly’s Strategy Across mREIT Market Participants Agency Peers Hybrid Peers Commercial Peers
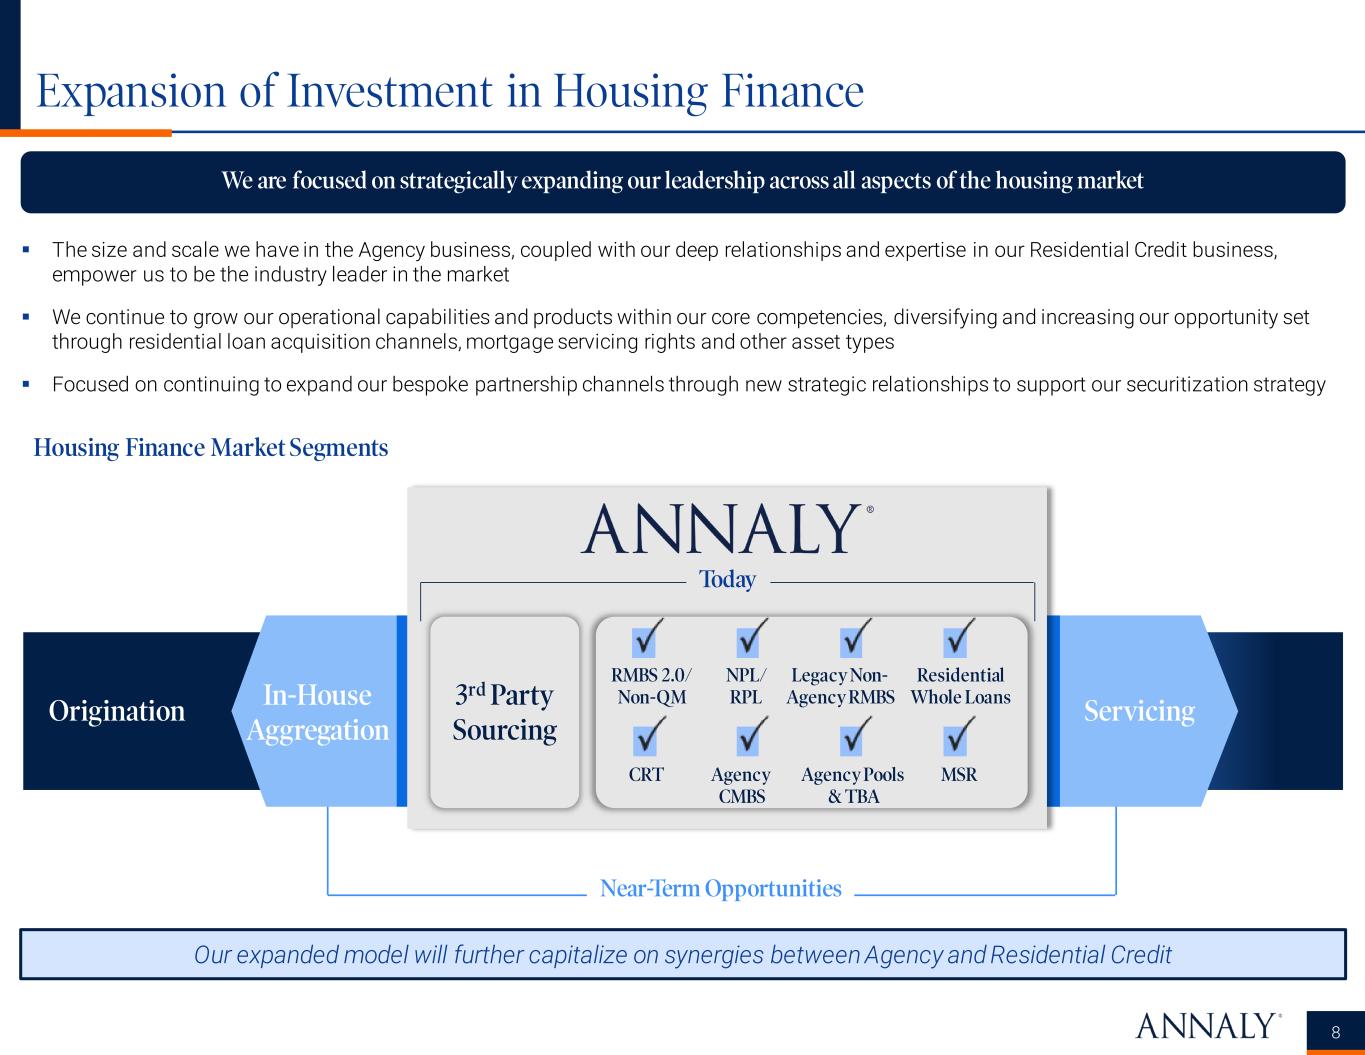
Expansion of Investment in Housing Finance We are focused on strategically expanding our leadership across all aspects of the housing market 8 The size and scale we have in the Agency business, coupled with our deep relationships and expertise in our Residential Credit business, empower us to be the industry leader in the market We continue to grow our operational capabilities and products within our core competencies, diversifying and increasing our opportunity set through residential loan acquisition channels, mortgage servicing rights and other asset types Focused on continuing to expand our bespoke partnership channels through new strategic relationships to support our securitization strategy Our expanded model will further capitalize on synergies between Agency and Residential Credit Near-Term Opportunities Origination In-House Aggregation Servicing Today 3rd Party Sourcing Legacy Non- Agency RMBS Residential Whole Loans RMBS 2.0/ Non-QM NPL/ RPL Agency Pools & TBA MSRAgency CMBS CRT Housing Finance Market Segments
Market Environment
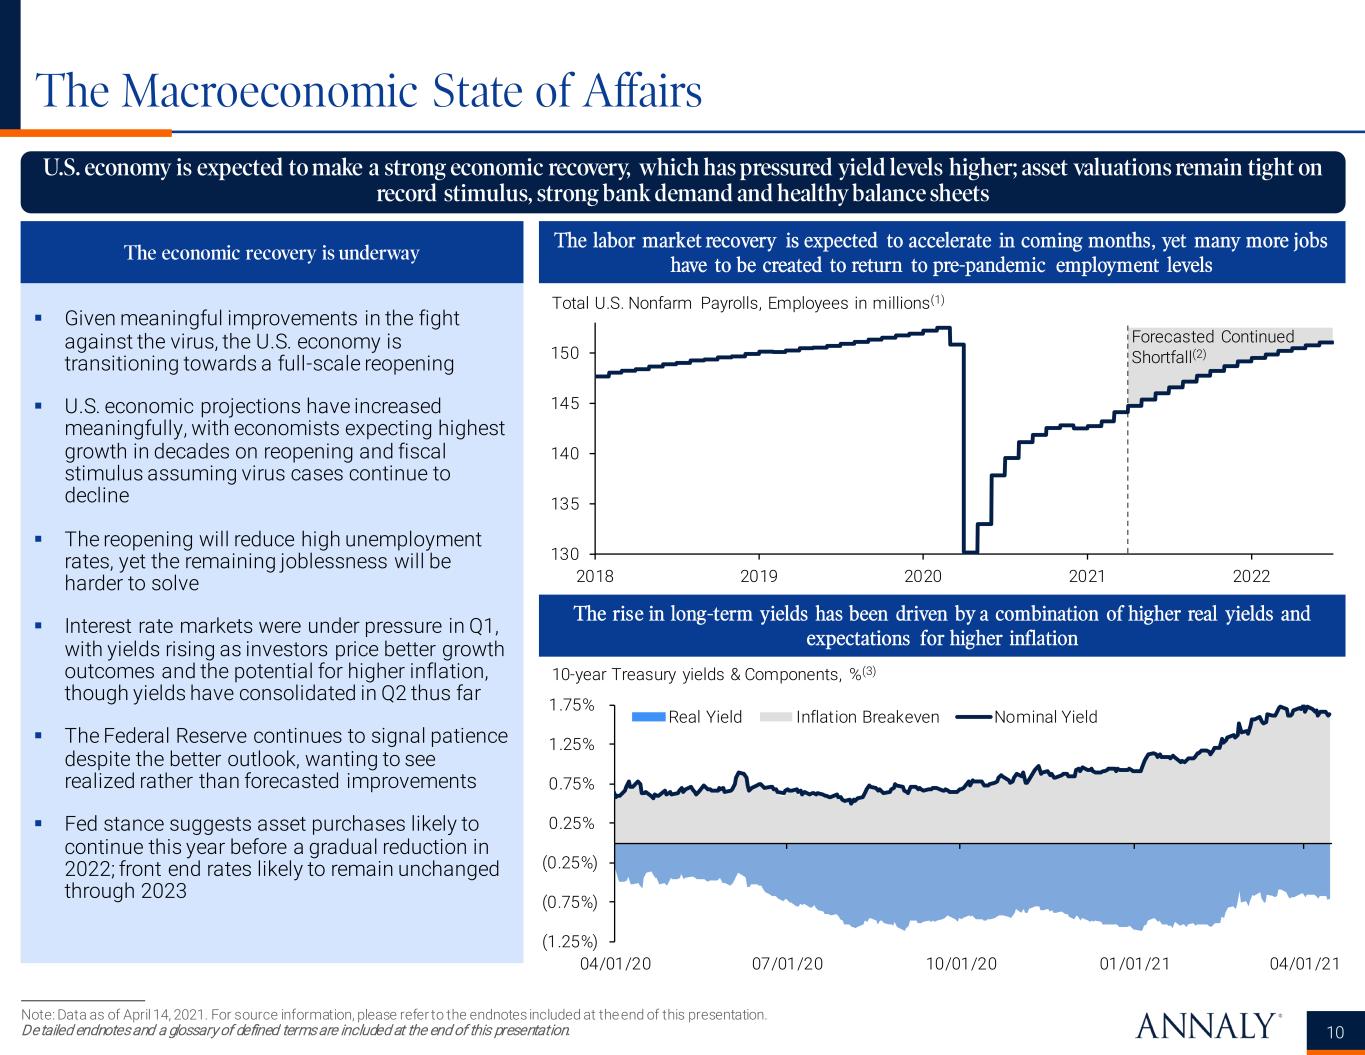
The Macroeconomic State of Affairs Note: Data as of April 14, 2021. For source information, please refer to the endnotes included at the end of this presentation. Detailed endnotes and a glossary of defined terms are included at the end of this presentation. U.S. economy is expected to make a strong economic recovery, which has pressured yield levels higher; asset valuations remain tight on record stimulus, strong bank demand and healthy balance sheets 10 Given meaningful improvements in the fight against the virus, the U.S. economy is transitioning towards a full-scale reopening U.S. economic projections have increased meaningfully, with economists expecting highest growth in decades on reopening and fiscal stimulus assuming virus cases continue to decline The reopening will reduce high unemployment rates, yet the remaining joblessness will be harder to solve Interest rate markets were under pressure in Q1, with yields rising as investors price better growth outcomes and the potential for higher inflation, though yields have consolidated in Q2 thus far The Federal Reserve continues to signal patience despite the better outlook, wanting to see realized rather than forecasted improvements Fed stance suggests asset purchases likely to continue this year before a gradual reduction in 2022; front end rates likely to remain unchanged through 2023 The economic recovery is underway The labor market recovery is expected to accelerate in coming months, yet many more jobs have to be created to return to pre-pandemic employment levels The rise in long-term yields has been driven by a combination of higher real yields and expectations for higher inflation (1.25%) (0.75%) (0.25%) 0.25% 0.75% 1.25% 1.75% 04/01/20 07/01/20 10/01/20 01/01/21 04/01/21 Real Yield Inflation Breakeven Nominal Yield 10-year Treasury yields & Components, %(3) 130 135 140 145 150 2018 2019 2020 2021 2022 Total U.S. Nonfarm Payrolls, Employees in millions(1) Forecasted Continued Shortfall(2)

Business Update
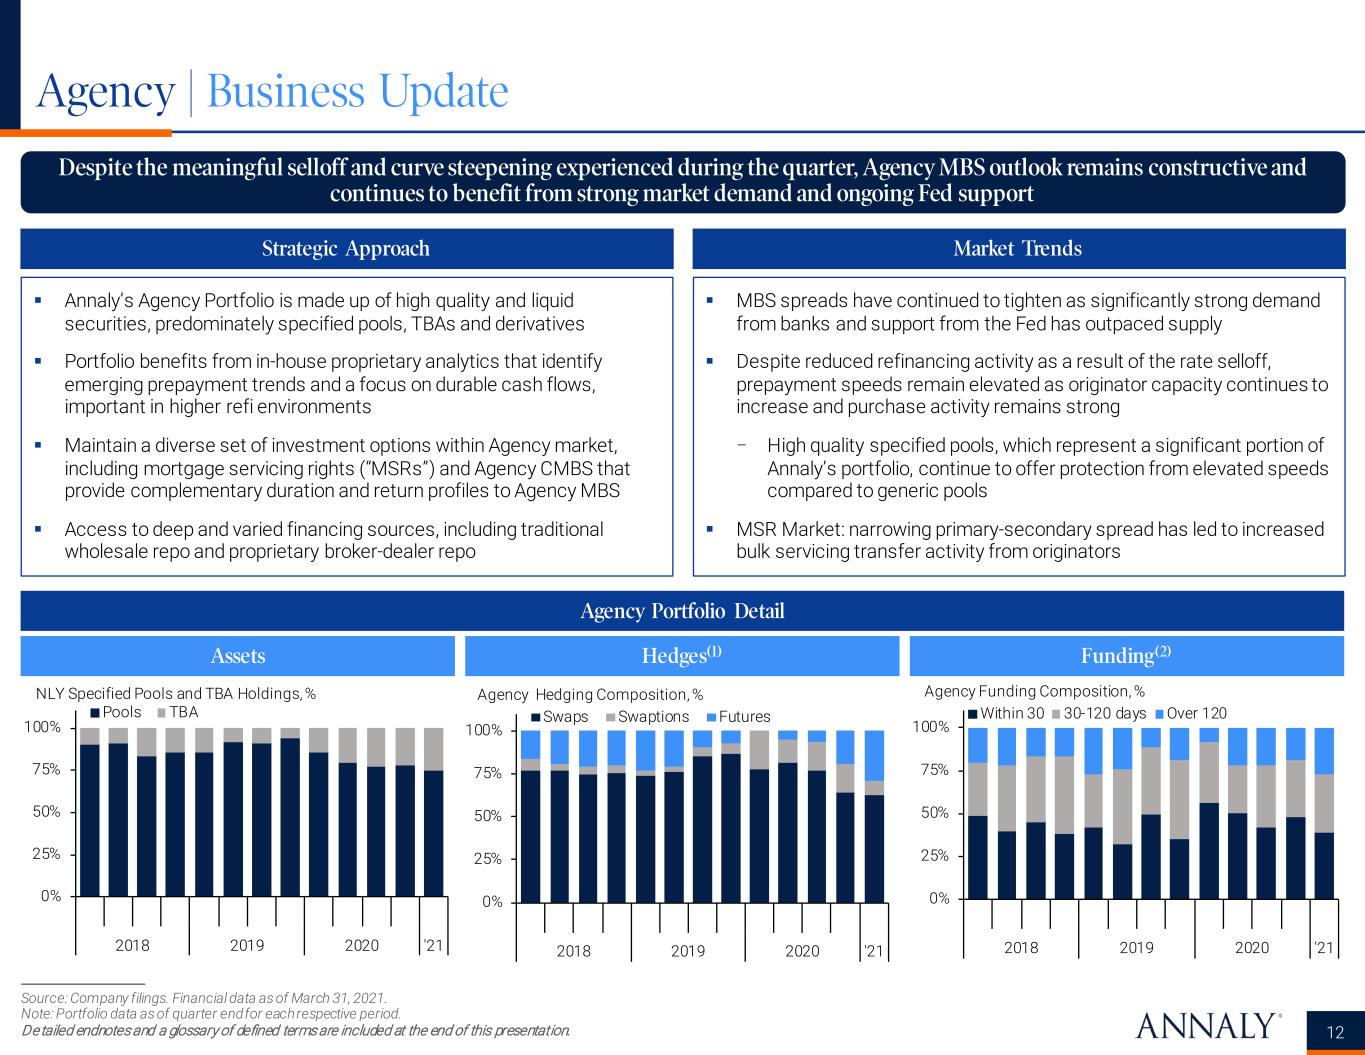
Agency | Business Update Source: Company filings. Financial data as of March 31, 2021. Note: Portfolio data as of quarter end for each respective period. Detailed endnotes and a glossary of defined terms are included at the end of this presentation. 12 Despite the meaningful selloff and curve steepening experienced during the quarter, Agency MBS outlook remains constructive and continues to benefit from strong market demand and ongoing Fed support Strategic Approach Market Trends Agency Portfolio Detail Assets Hedges(1) Funding(2) Annaly’s Agency Portfolio is made up of high quality and liquid securities, predominately specified pools, TBAs and derivatives Portfolio benefits from in-house proprietary analytics that identify emerging prepayment trends and a focus on durable cash flows, important in higher refi environments Maintain a diverse set of investment options within Agency market, including mortgage servicing rights (“MSRs”) and Agency CMBS that provide complementary duration and return profiles to Agency MBS Access to deep and varied financing sources, including traditional wholesale repo and proprietary broker-dealer repo MBS spreads have continued to tighten as significantly strong demand from banks and support from the Fed has outpaced supply Despite reduced refinancing activity as a result of the rate selloff, prepayment speeds remain elevated as originator capacity continues to increase and purchase activity remains strong − High quality specified pools, which represent a significant portion of Annaly’s portfolio, continue to offer protection from elevated speeds compared to generic pools MSR Market: narrowing primary-secondary spread has led to increased bulk servicing transfer activity from originators 0% 25% 50% 75% 100% 2018 2019 2020 '21 Swaps Swaptions Futures Agency Hedging Composition, % 0% 25% 50% 75% 100% 2018 2019 2020 '21 Within 30 30-120 days Over 120 Agency Funding Composition, % 0% 25% 50% 75% 100% 2018 2019 2020 '21 Pools TBA NLY Specified Pools and TBA Holdings, %
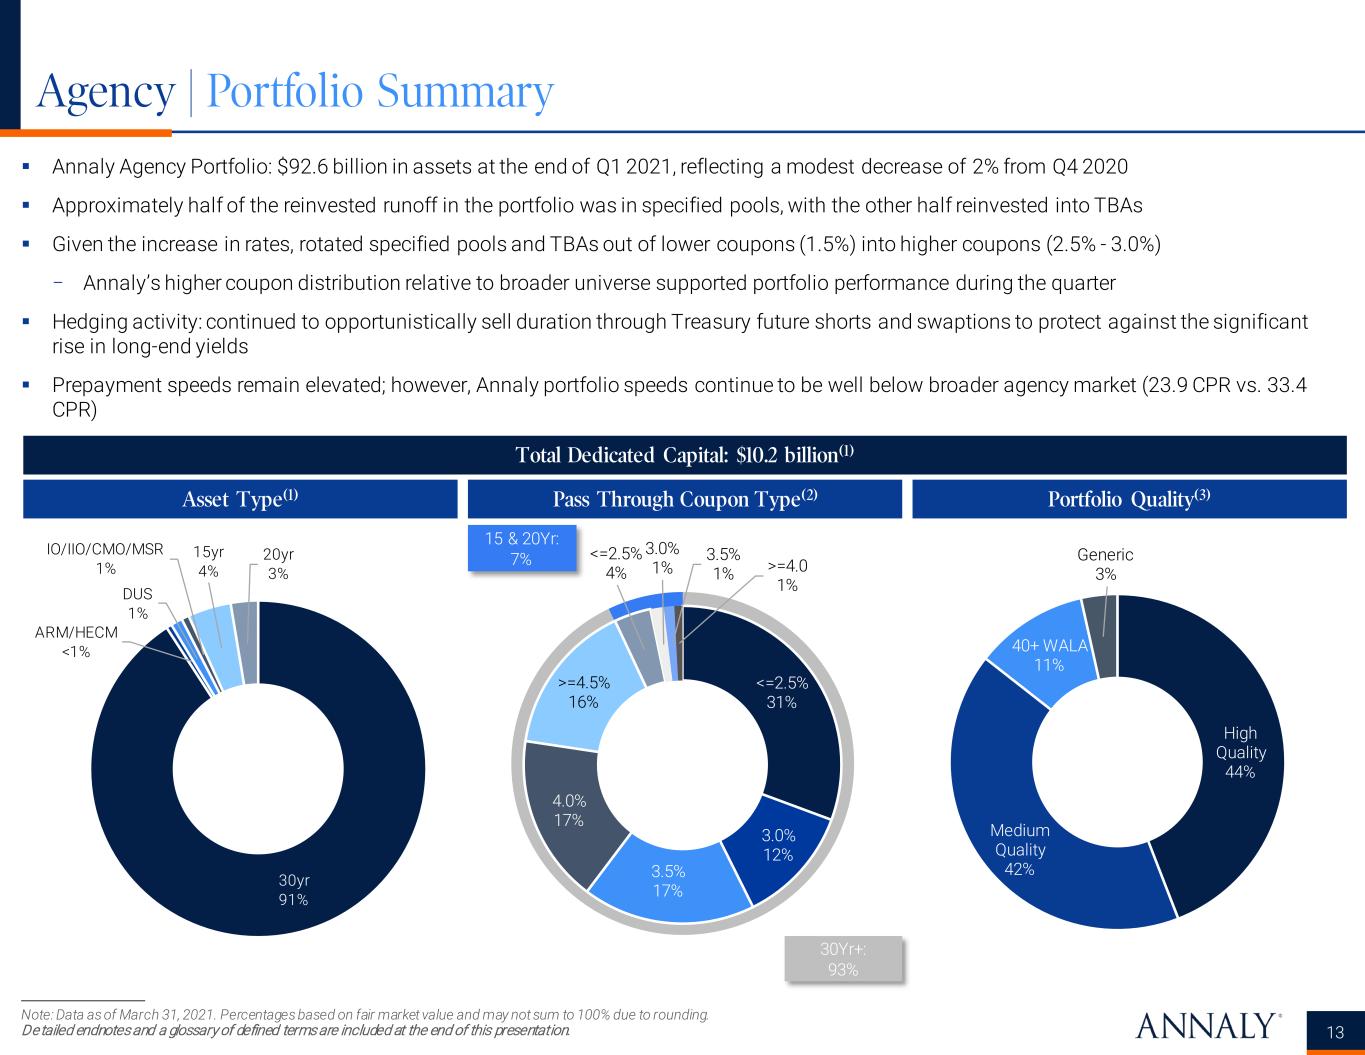
Annaly Agency Portfolio: $92.6 billion in assets at the end of Q1 2021, reflecting a modest decrease of 2% from Q4 2020 Approximately half of the reinvested runoff in the portfolio was in specified pools, with the other half reinvested into TBAs Given the increase in rates, rotated specified pools and TBAs out of lower coupons (1.5%) into higher coupons (2.5% - 3.0%) − Annaly’s higher coupon distribution relative to broader universe supported portfolio performance during the quarter Hedging activity: continued to opportunistically sell duration through Treasury future shorts and swaptions to protect against the significant rise in long-end yields Prepayment speeds remain elevated; however, Annaly portfolio speeds continue to be well below broader agency market (23.9 CPR vs. 33.4 CPR) Note: Data as of March 31, 2021. Percentages based on fair market value and may not sum to 100% due to rounding. Detailed endnotes and a glossary of defined terms are included at the end of this presentation. 13 Total Dedicated Capital: $10.2 billion(1) Asset Type(1) Pass Through Coupon Type(2) Portfolio Quality(3) Agency | Portfolio Summary 15 & 20Yr: 7% 30Yr+: 93% <=2.5% 31% 3.0% 12% 3.5% 17% 4.0% 17% >=4.5% 16% <=2.5% 4% 3.0% 1% 3.5% 1% >=4.0 1% High Quality 44% Medium Quality 42% 40+ WALA 11% Generic 3% 30yr 91% ARM/HECM <1% DUS 1% IO/IIO/CMO/MSR 1% 15yr 4% 20yr 3%
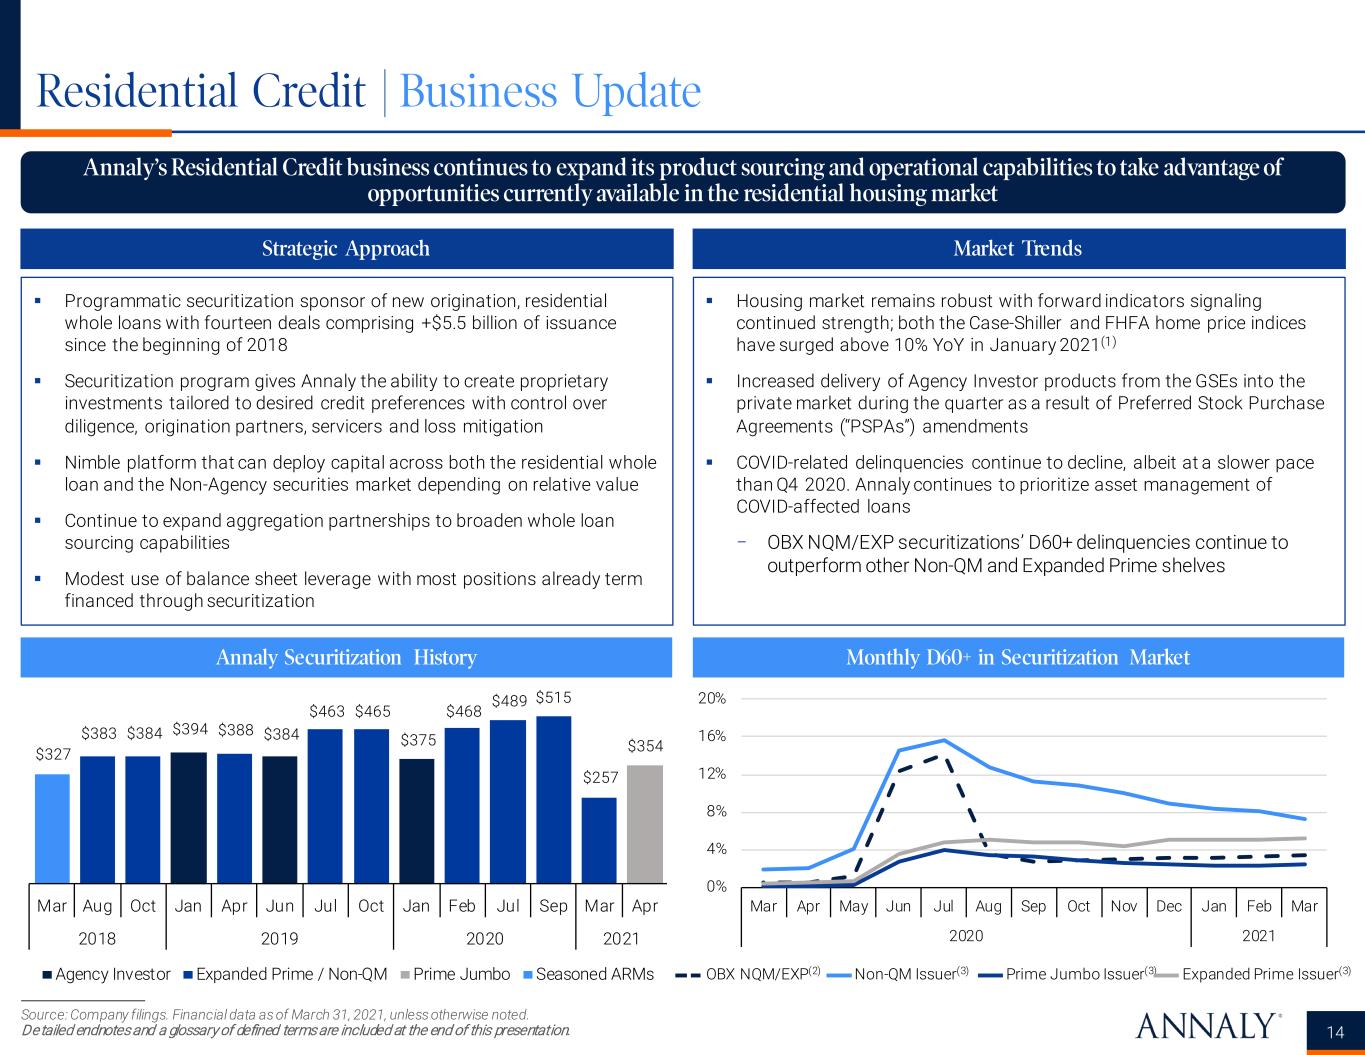
Source: Company filings. Financial data as of March 31, 2021, unless otherwise noted. Detailed endnotes and a glossary of defined terms are included at the end of this presentation. Annaly’s Residential Credit business continues to expand its product sourcing and operational capabilities to take advantage of opportunities currently available in the residential housing market 14 Strategic Approach Market Trends Annaly Securitization History Monthly D60+ in Securitization Market Programmatic securitization sponsor of new origination, residential whole loans with fourteen deals comprising +$5.5 billion of issuance since the beginning of 2018 Securitization program gives Annaly the ability to create proprietary investments tailored to desired credit preferences with control over diligence, origination partners, servicers and loss mitigation Nimble platform that can deploy capital across both the residential whole loan and the Non-Agency securities market depending on relative value Continue to expand aggregation partnerships to broaden whole loan sourcing capabilities Modest use of balance sheet leverage with most positions already term financed through securitization Housing market remains robust with forward indicators signaling continued strength; both the Case-Shiller and FHFA home price indices have surged above 10% YoY in January 2021(1) Increased delivery of Agency Investor products from the GSEs into the private market during the quarter as a result of Preferred Stock Purchase Agreements (“PSPAs”) amendments COVID-related delinquencies continue to decline, albeit at a slower pace than Q4 2020. Annaly continues to prioritize asset management of COVID-affected loans − OBX NQM/EXP securitizations’ D60+ delinquencies continue to outperform other Non-QM and Expanded Prime shelves Residential Credit | Business Update OBX NQM/EXP(2) Non-QM Issuer(3) Prime Jumbo Issuer(3) Expanded Prime Issuer(3) 0% 4% 8% 12% 16% 20% MarFebJanDecNovOctSepAugJulJunMayAprMar 20212020 $394 $384 $375 $383 $384 $388 $463 $465 $468 $489 $515 $257 $354 $327 Mar Aug Oct Jan Apr Jun Jul Oct Jan Feb Jul Sep Mar Apr 2018 2019 2020 2021 Agency Investor Expanded Prime / Non-QM Prime Jumbo Seasoned ARMs
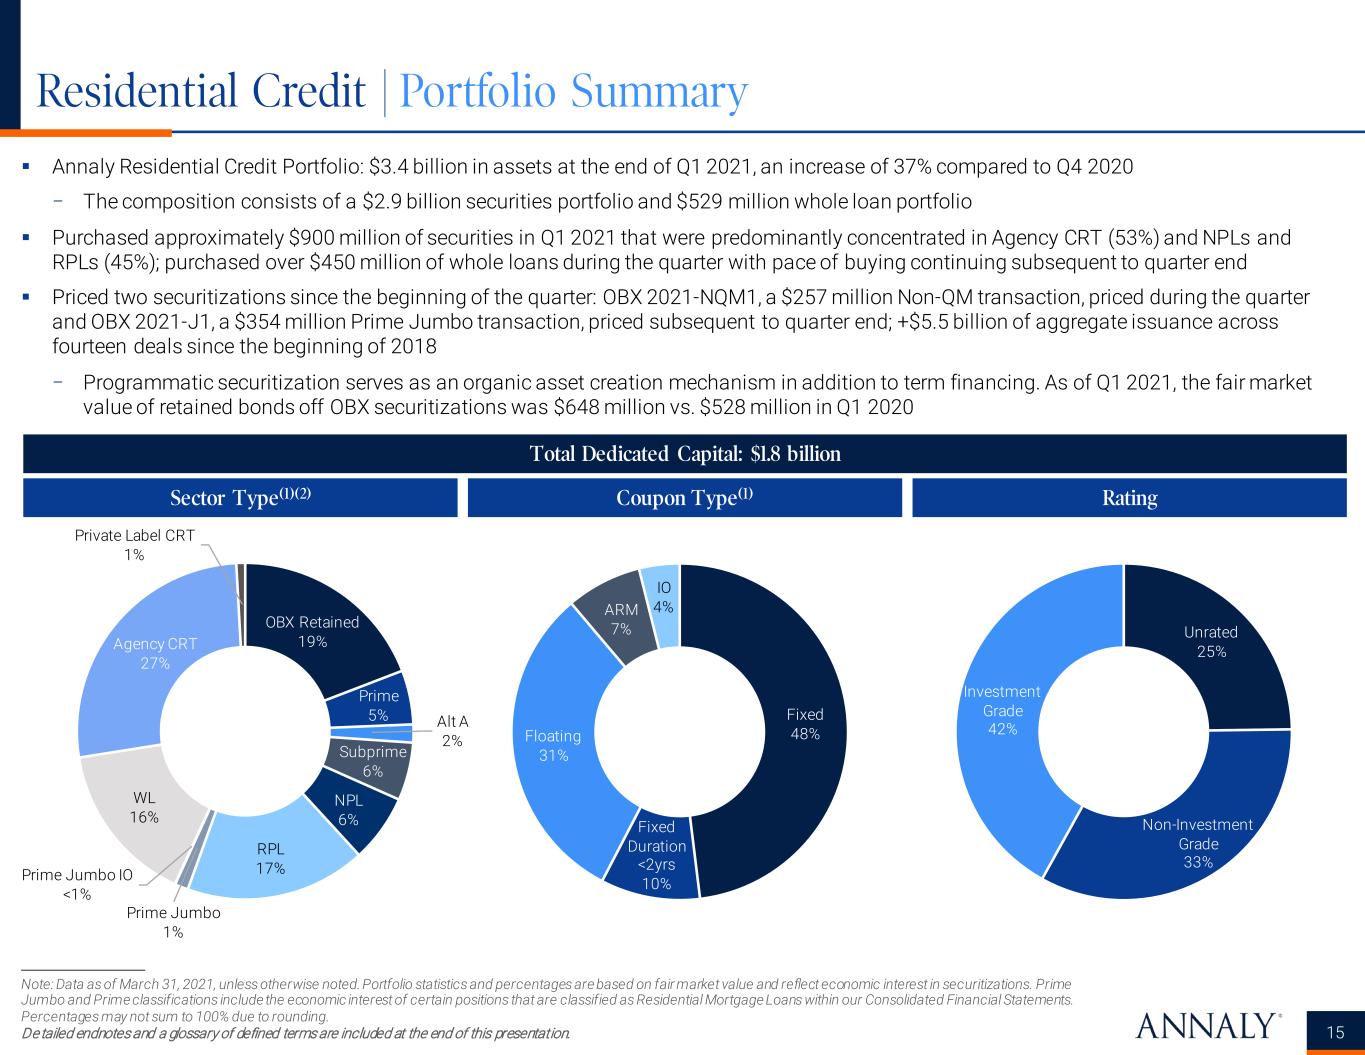
Fixed 48% Fixed Duration <2yrs 10% Floating 31% ARM 7% IO 4% Note: Data as of March 31, 2021, unless otherwise noted. Portfolio statistics and percentages are based on fair market value and reflect economic interest in securitizations. Prime Jumbo and Prime classifications include the economic interest of certain positions that are classified as Residential Mortgage Loans within our Consolidated Financial Statements. Percentages may not sum to 100% due to rounding. Detailed endnotes and a glossary of defined terms are included at the end of this presentation. 15 Total Dedicated Capital: $1.8 billion Coupon Type(1) Rating Residential Credit | Portfolio Summary Annaly Residential Credit Portfolio: $3.4 billion in assets at the end of Q1 2021, an increase of 37% compared to Q4 2020 − The composition consists of a $2.9 billion securities portfolio and $529 million whole loan portfolio Purchased approximately $900 million of securities in Q1 2021 that were predominantly concentrated in Agency CRT (53%) and NPLs and RPLs (45%); purchased over $450 million of whole loans during the quarter with pace of buying continuing subsequent to quarter end Priced two securitizations since the beginning of the quarter: OBX 2021-NQM1, a $257 million Non-QM transaction, priced during the quarter and OBX 2021-J1, a $354 million Prime Jumbo transaction, priced subsequent to quarter end; +$5.5 billion of aggregate issuance across fourteen deals since the beginning of 2018 − Programmatic securitization serves as an organic asset creation mechanism in addition to term financing. As of Q1 2021, the fair market value of retained bonds off OBX securitizations was $648 million vs. $528 million in Q1 2020 Sector Type(1)(2) OBX Retained 19% Prime 5% Alt A 2% Subprime 6% NPL 6% RPL 17% Prime Jumbo 1% Prime Jumbo IO <1% WL 16% Agency CRT 27% Private Label CRT 1% Unrated 25% Non-Investment Grade 33% Investment Grade 42%
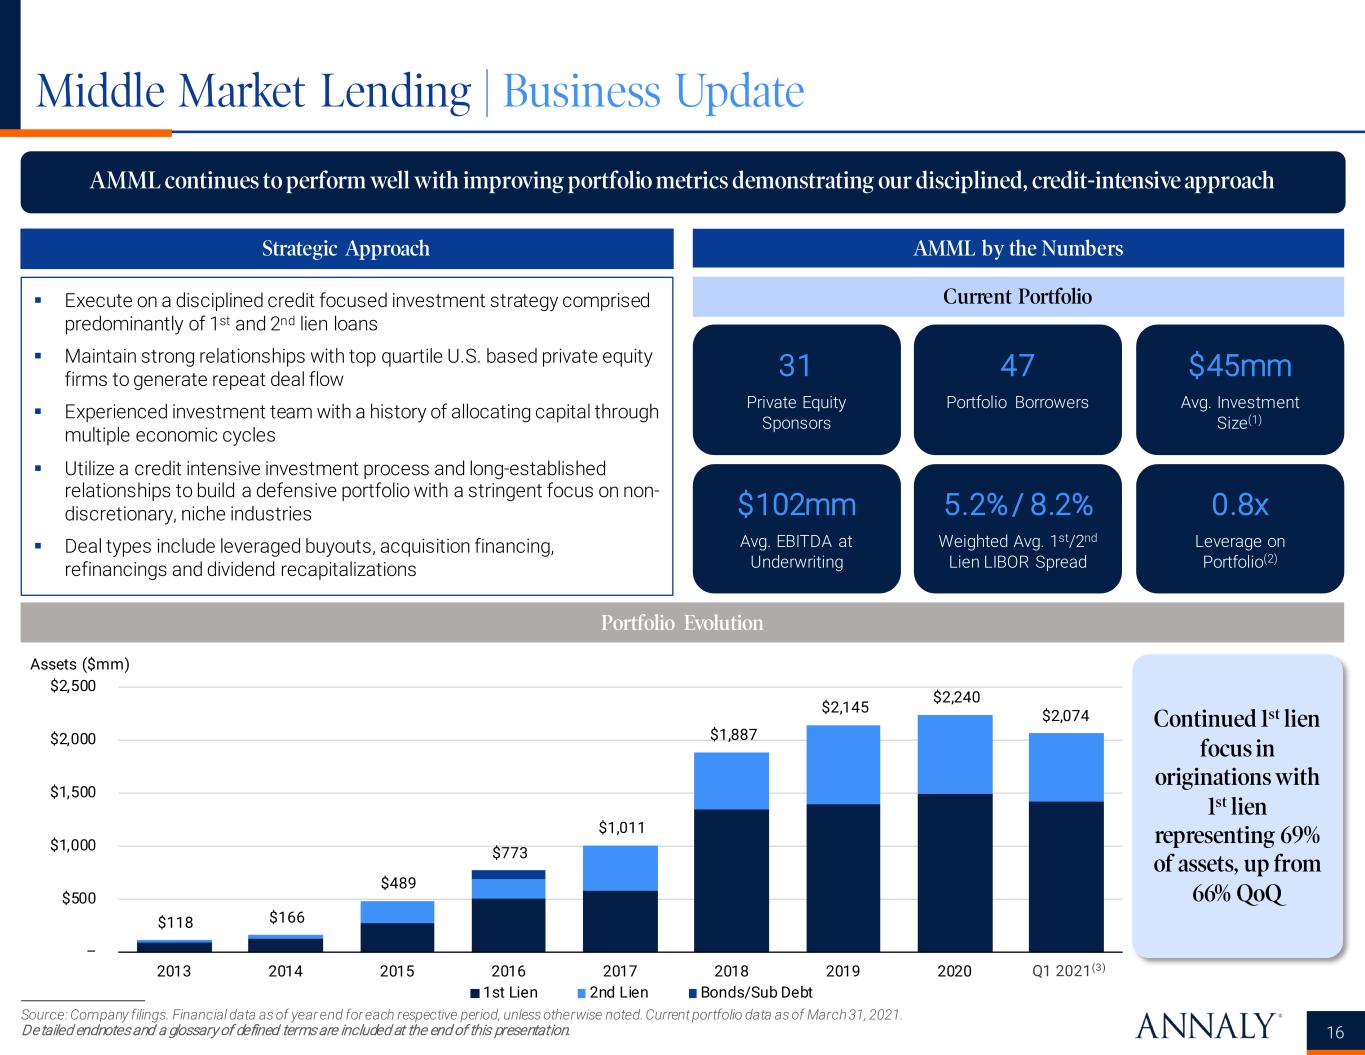
Middle Market Lending | Business Update Source: Company filings. Financial data as of year end for each respective period, unless otherwise noted. Current portfolio data as of March 31, 2021. Detailed endnotes and a glossary of defined terms are included at the end of this presentation. AMML continues to perform well with improving portfolio metrics demonstrating our disciplined, credit-intensive approach 16 Execute on a disciplined credit focused investment strategy comprised predominantly of 1st and 2nd lien loans Maintain strong relationships with top quartile U.S. based private equity firms to generate repeat deal flow Experienced investment team with a history of allocating capital through multiple economic cycles Utilize a credit intensive investment process and long-established relationships to build a defensive portfolio with a stringent focus on non- discretionary, niche industries Deal types include leveraged buyouts, acquisition financing, refinancings and dividend recapitalizations Strategic Approach AMML by the Numbers Portfolio Evolution Current Portfolio 31 Private Equity Sponsors $45mm Avg. Investment Size(1) 47 Portfolio Borrowers $102mm Avg. EBITDA at Underwriting 0.8x Leverage on Portfolio(2) 5.2% / 8.2% Weighted Avg. 1st/2nd Lien LIBOR Spread $118 $166 $489 $773 $1,011 $1,887 $2,145 $2,240 $2,074 – $500 $1,000 $1,500 $2,000 $2,500 2013 2014 2015 2016 2017 2018 2019 2020 2021 YTD Assets ($mm) 1st Lien 2nd Lien Bonds/Sub Debt Continued 1st lien focus in originations with 1st lien representing 69% of assets, up from 66% QoQ Q1 2021(3)
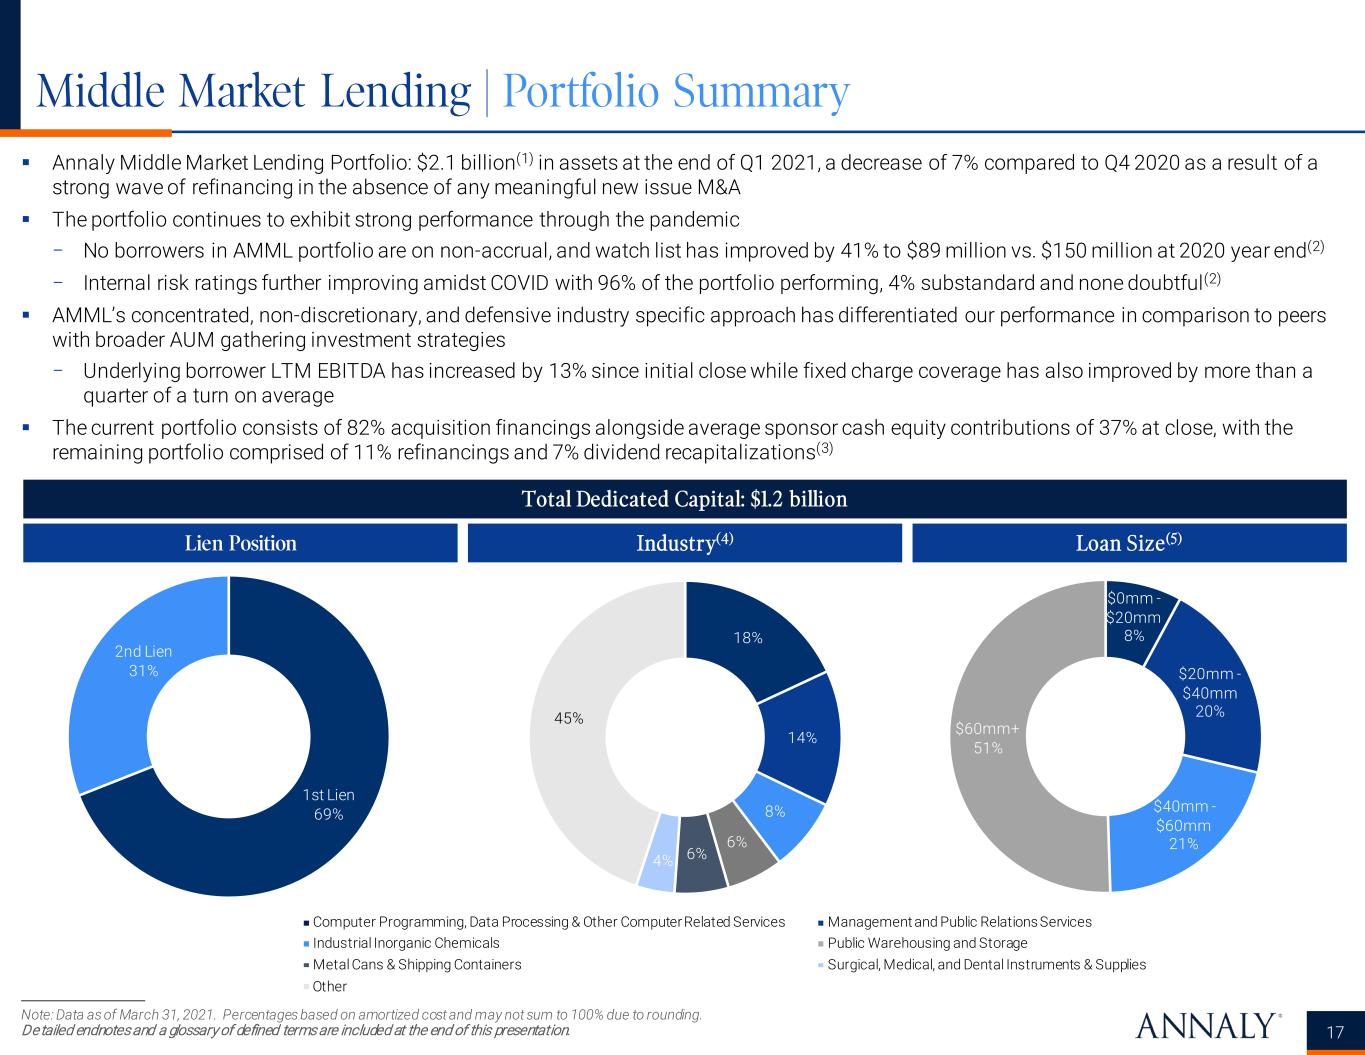
Note: Data as of March 31, 2021. Percentages based on amortized cost and may not sum to 100% due to rounding. Detailed endnotes and a glossary of defined terms are included at the end of this presentation. Middle Market Lending | Portfolio Summary 17 Annaly Middle Market Lending Portfolio: $2.1 billion(1) in assets at the end of Q1 2021, a decrease of 7% compared to Q4 2020 as a result of a strong wave of refinancing in the absence of any meaningful new issue M&A The portfolio continues to exhibit strong performance through the pandemic − No borrowers in AMML portfolio are on non-accrual, and watch list has improved by 41% to $89 million vs. $150 million at 2020 year end(2) − Internal risk ratings further improving amidst COVID with 96% of the portfolio performing, 4% substandard and none doubtful(2) AMML’s concentrated, non-discretionary, and defensive industry specific approach has differentiated our performance in comparison to peers with broader AUM gathering investment strategies − Underlying borrower LTM EBITDA has increased by 13% since initial close while fixed charge coverage has also improved by more than a quarter of a turn on average The current portfolio consists of 82% acquisition financings alongside average sponsor cash equity contributions of 37% at close, with the remaining portfolio comprised of 11% refinancings and 7% dividend recapitalizations(3) Total Dedicated Capital: $1.2 billion Lien Position Industry(4) Loan Size(5) Computer Programming, Data Processing & Other Computer Related Services Industrial Inorganic Chemicals Metal Cans & Shipping Containers Management and Public Relations Services Public Warehousing and Storage Surgical, Medical, and Dental Instruments & Supplies Other 1st Lien 69% 2nd Lien 31% 18% 14% 8% 6% 6%4% 45% $0mm - $20mm 8% $20mm - $40mm 20% $40mm - $60mm 21% $60mm+ 51%
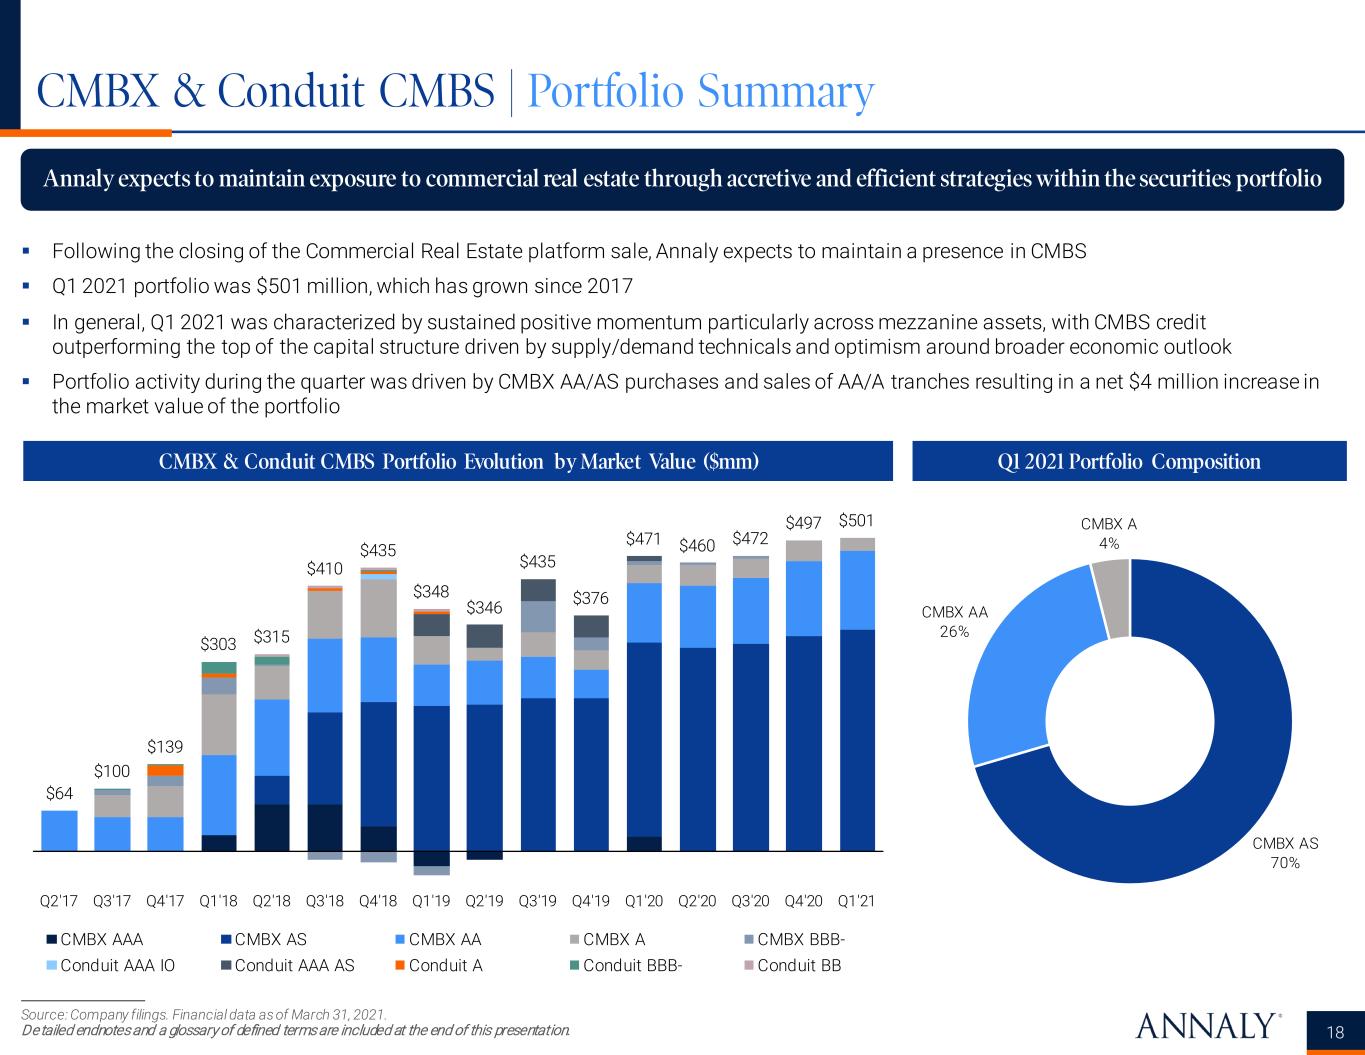
CMBX & Conduit CMBS | Portfolio Summary 18 CMBX & Conduit CMBS Portfolio Evolution by Market Value ($mm) Annaly expects to maintain exposure to commercial real estate through accretive and efficient strategies within the securities portfolio Source: Company filings. Financial data as of March 31, 2021. Detailed endnotes and a glossary of defined terms are included at the end of this presentation. Q1 2021 Portfolio Composition Following the closing of the Commercial Real Estate platform sale, Annaly expects to maintain a presence in CMBS Q1 2021 portfolio was $501 million, which has grown since 2017 In general, Q1 2021 was characterized by sustained positive momentum particularly across mezzanine assets, with CMBS credit outperforming the top of the capital structure driven by supply/demand technicals and optimism around broader economic outlook Portfolio activity during the quarter was driven by CMBX AA/AS purchases and sales of AA/A tranches resulting in a net $4 million increase in the market value of the portfolio CMBX AS 70% CMBX AA 26% CMBX A 4% $64 $100 $139 $303 $315 $410 $435 $348 $346 $435 $376 $471 $460 $472 $497 $501 Q2'17 Q3'17 Q4'17 Q1'18 Q2'18 Q3'18 Q4'18 Q1'19 Q2'19 Q3'19 Q4'19 Q1'20 Q2'20 Q3'20 Q4'20 Q1'21 CMBX AAA CMBX AS CMBX AA CMBX A CMBX BBB- Conduit AAA IO Conduit AAA AS Conduit A Conduit BBB- Conduit BB

Financial Highlights and Trends
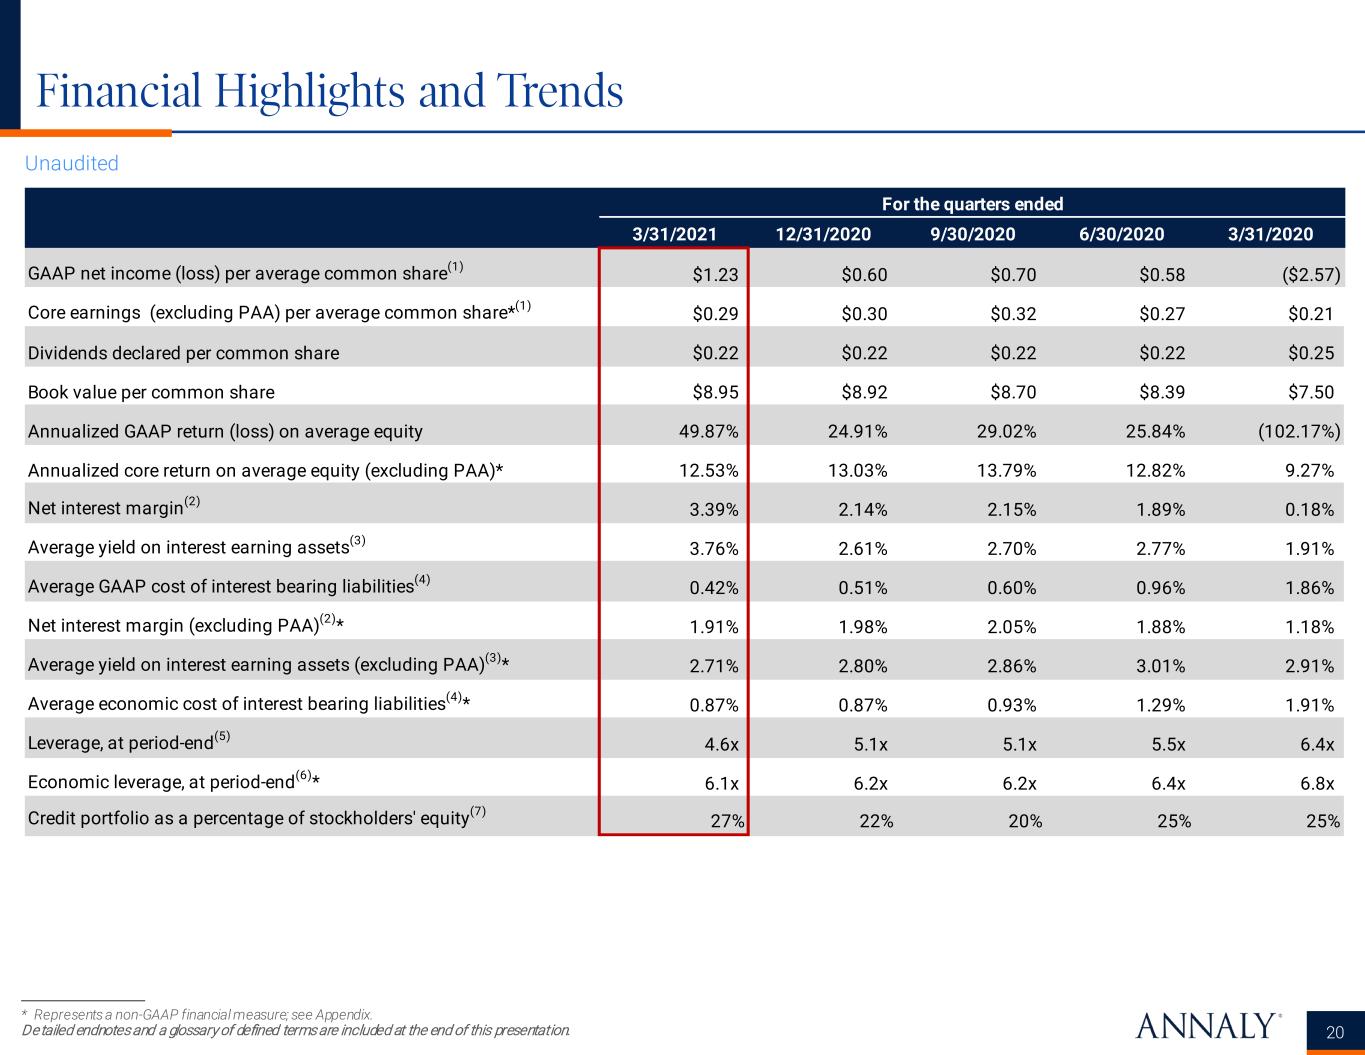
Financial Highlights and Trends * Represents a non-GAAP financial measure; see Appendix. Detailed endnotes and a glossary of defined terms are included at the end of this presentation. 20 Unaudited For the quarters ended 3/31/2021 12/31/2020 9/30/2020 6/30/2020 3/31/2020 GAAP net income (loss) per average common share(1) $1.23 $0.60 $0.70 $0.58 ($2.57) Core earnings (excluding PAA) per average common share*(1) $0.29 $0.30 $0.32 $0.27 $0.21 Dividends declared per common share $0.22 $0.22 $0.22 $0.22 $0.25 Book value per common share $8.95 $8.92 $8.70 $8.39 $7.50 Annualized GAAP return (loss) on average equity 49.87% 24.91% 29.02% 25.84% (102.17%) Annualized core return on average equity (excluding PAA)* 12.53% 13.03% 13.79% 12.82% 9.27% Net interest margin(2) 3.39% 2.14% 2.15% 1.89% 0.18% Average yield on interest earning assets(3) 3.76% 2.61% 2.70% 2.77% 1.91% Average GAAP cost of interest bearing liabilities(4) 0.42% 0.51% 0.60% 0.96% 1.86% Net interest margin (excluding PAA)(2)* 1.91% 1.98% 2.05% 1.88% 1.18% Average yield on interest earning assets (excluding PAA)(3)* 2.71% 2.80% 2.86% 3.01% 2.91% Average economic cost of interest bearing liabilities(4)* 0.87% 0.87% 0.93% 1.29% 1.91% Leverage, at period-end(5) 4.6x 5.1x 5.1x 5.5x 6.4x Economic leverage, at period-end(6)* 6.1x 6.2x 6.2x 6.4x 6.8x Credit portfolio as a percentage of stockholders' equity(7) 27% 22% 20% 25% 25%
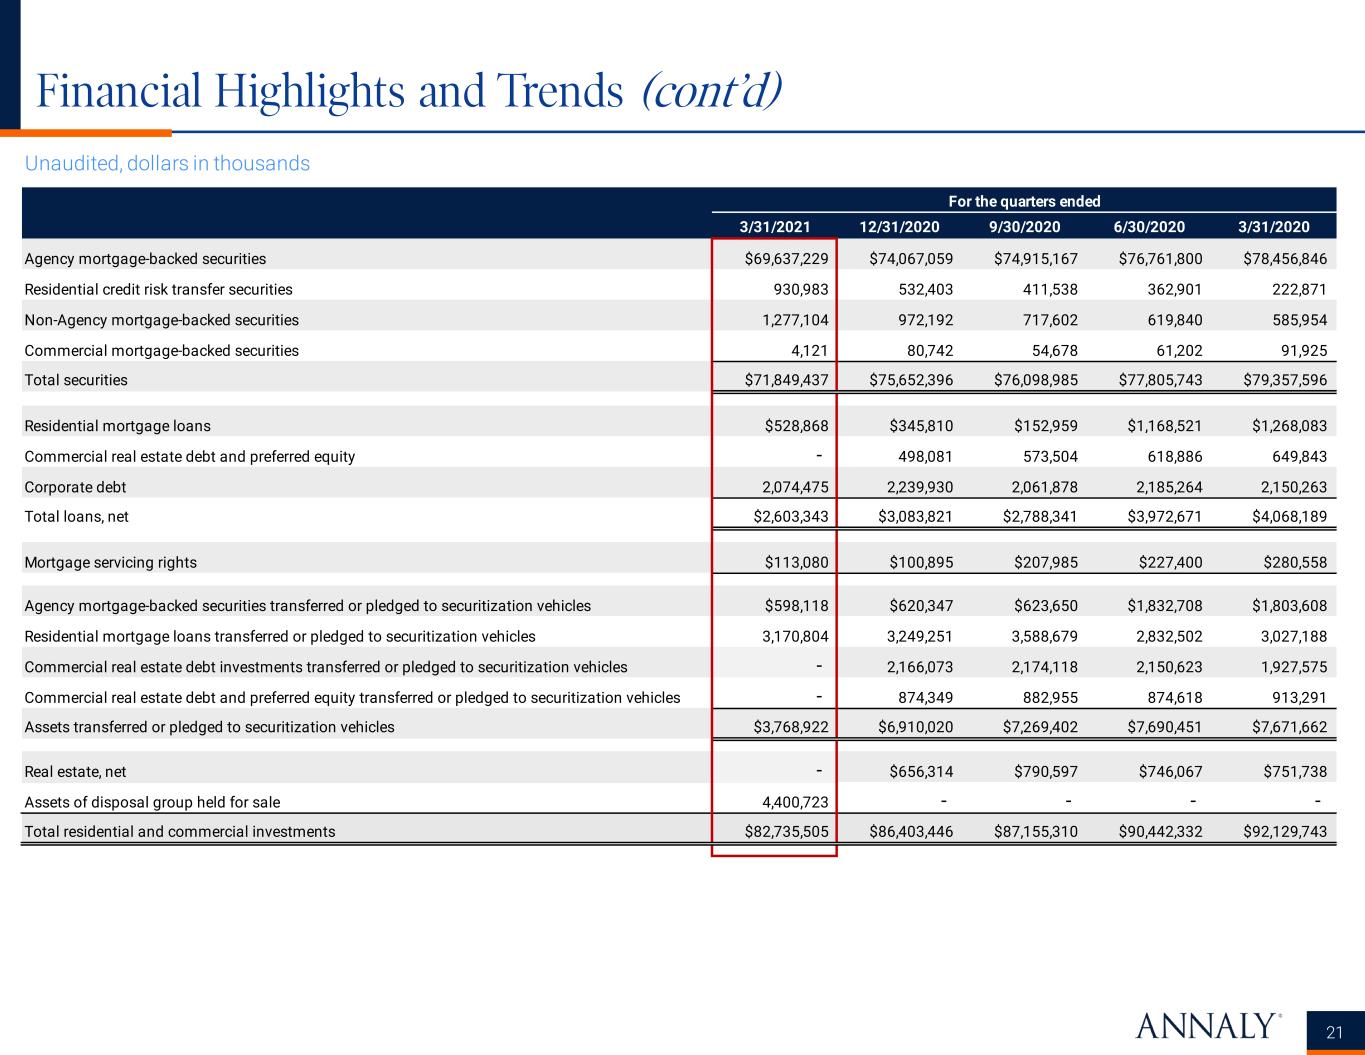
Financial Highlights and Trends (cont’d) 21 Unaudited, dollars in thousands For the quarters ended 3/31/2021 12/31/2020 9/30/2020 6/30/2020 3/31/2020 Agency mortgage-backed securities $69,637,229 $74,067,059 $74,915,167 $76,761,800 $78,456,846 Residential credit risk transfer securities 930,983 532,403 411,538 362,901 222,871 Non-Agency mortgage-backed securities 1,277,104 972,192 717,602 619,840 585,954 Commercial mortgage-backed securities 4,121 80,742 54,678 61,202 91,925 Total securities $71,849,437 $75,652,396 $76,098,985 $77,805,743 $79,357,596 Residential mortgage loans $528,868 $345,810 $152,959 $1,168,521 $1,268,083 Commercial real estate debt and preferred equity - 498,081 573,504 618,886 649,843 Corporate debt 2,074,475 2,239,930 2,061,878 2,185,264 2,150,263 Total loans, net $2,603,343 $3,083,821 $2,788,341 $3,972,671 $4,068,189 Mortgage servicing rights $113,080 $100,895 $207,985 $227,400 $280,558 Agency mortgage-backed securities transferred or pledged to securitization vehicles $598,118 $620,347 $623,650 $1,832,708 $1,803,608 Residential mortgage loans transferred or pledged to securitization vehicles 3,170,804 3,249,251 3,588,679 2,832,502 3,027,188 Commercial real estate debt investments transferred or pledged to securitization vehicles - 2,166,073 2,174,118 2,150,623 1,927,575 Commercial real estate debt and preferred equity transferred or pledged to securitization vehicles - 874,349 882,955 874,618 913,291 Assets transferred or pledged to securitization vehicles $3,768,922 $6,910,020 $7,269,402 $7,690,451 $7,671,662 Real estate, net - $656,314 $790,597 $746,067 $751,738 Assets of disposal group held for sale 4,400,723 - - - - Total residential and commercial investments $82,735,505 $86,403,446 $87,155,310 $90,442,332 $92,129,743
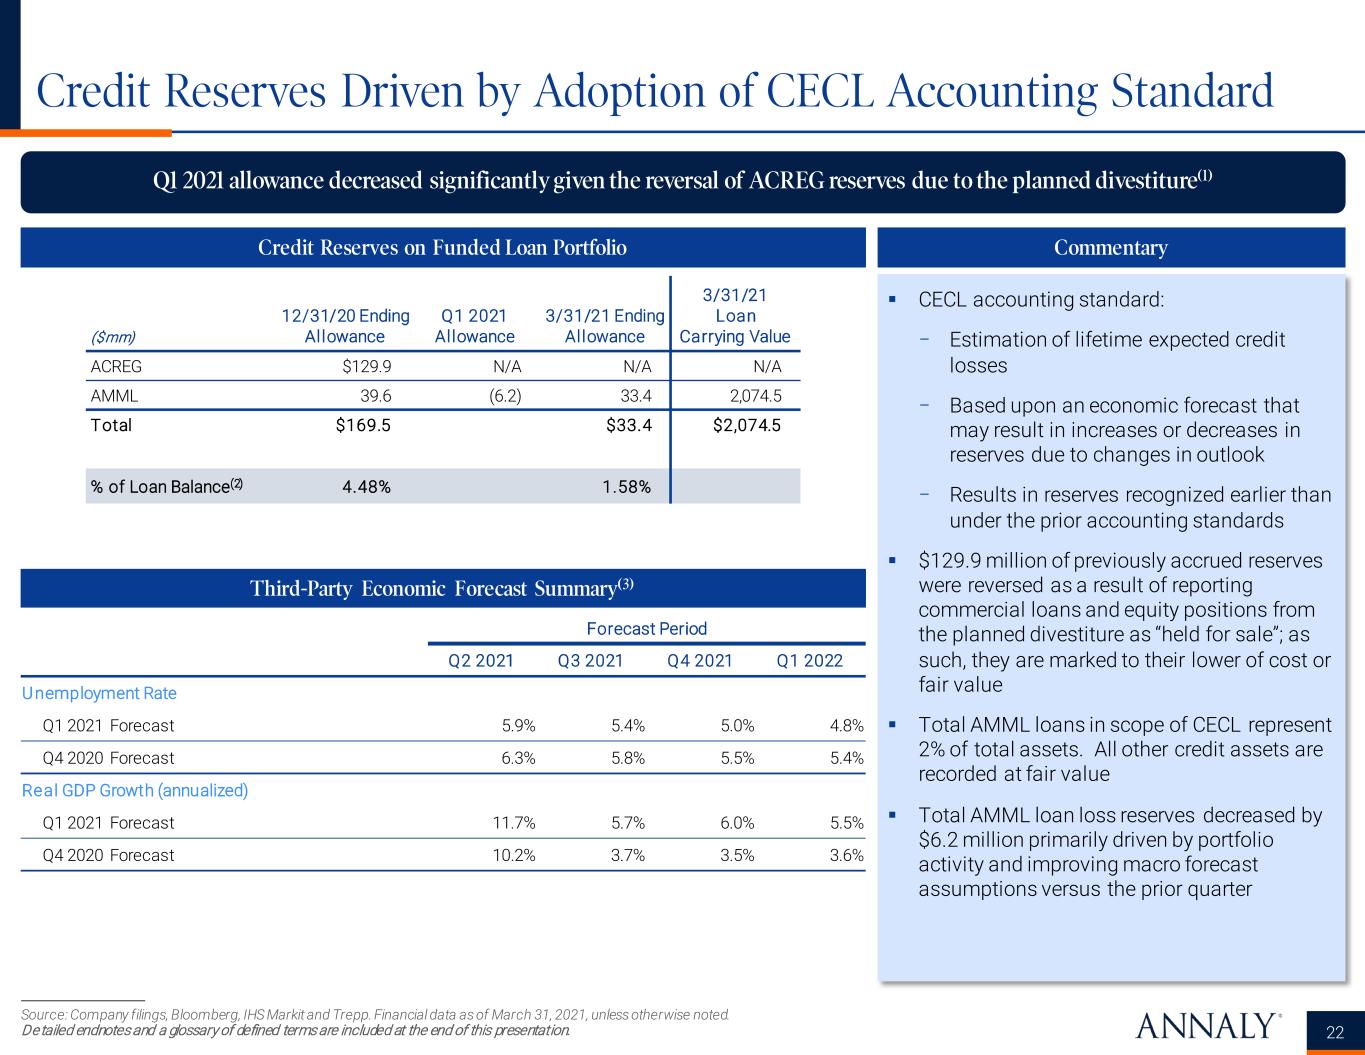
Credit Reserves Driven by Adoption of CECL Accounting Standard Source: Company filings, Bloomberg, IHS Markit and Trepp. Financial data as of March 31, 2021, unless otherwise noted. Detailed endnotes and a glossary of defined terms are included at the end of this presentation. Q1 2021 allowance decreased significantly given the reversal of ACREG reserves due to the planned divestiture(1) 22 Credit Reserves on Funded Loan Portfolio Commentary ($mm) 12/31/20 Ending Allowance Q1 2021 Allowance 3/31/21 Ending Allowance 3/31/21 Loan Carrying Value ACREG $129.9 N/A N/A N/A AMML 39.6 (6.2) 33.4 2,074.5 Total $169.5 $33.4 $2,074.5 % of Loan Balance(2) 4.48% 1.58% Third-Party Economic Forecast Summary(3) Forecast Period Q2 2021 Q3 2021 Q4 2021 Q1 2022 Unemployment Rate Q1 2021 Forecast 5.9% 5.4% 5.0% 4.8% Q4 2020 Forecast 6.3% 5.8% 5.5% 5.4% Real GDP Growth (annualized) Q1 2021 Forecast 11.7% 5.7% 6.0% 5.5% Q4 2020 Forecast 10.2% 3.7% 3.5% 3.6% CECL accounting standard: − Estimation of lifetime expected credit losses − Based upon an economic forecast that may result in increases or decreases in reserves due to changes in outlook − Results in reserves recognized earlier than under the prior accounting standards $129.9 million of previously accrued reserves were reversed as a result of reporting commercial loans and equity positions from the planned divestiture as “held for sale”; as such, they are marked to their lower of cost or fair value Total AMML loans in scope of CECL represent 2% of total assets. All other credit assets are recorded at fair value Total AMML loan loss reserves decreased by $6.2 million primarily driven by portfolio activity and improving macro forecast assumptions versus the prior quarter
Appendix: Non-GAAP Reconciliations
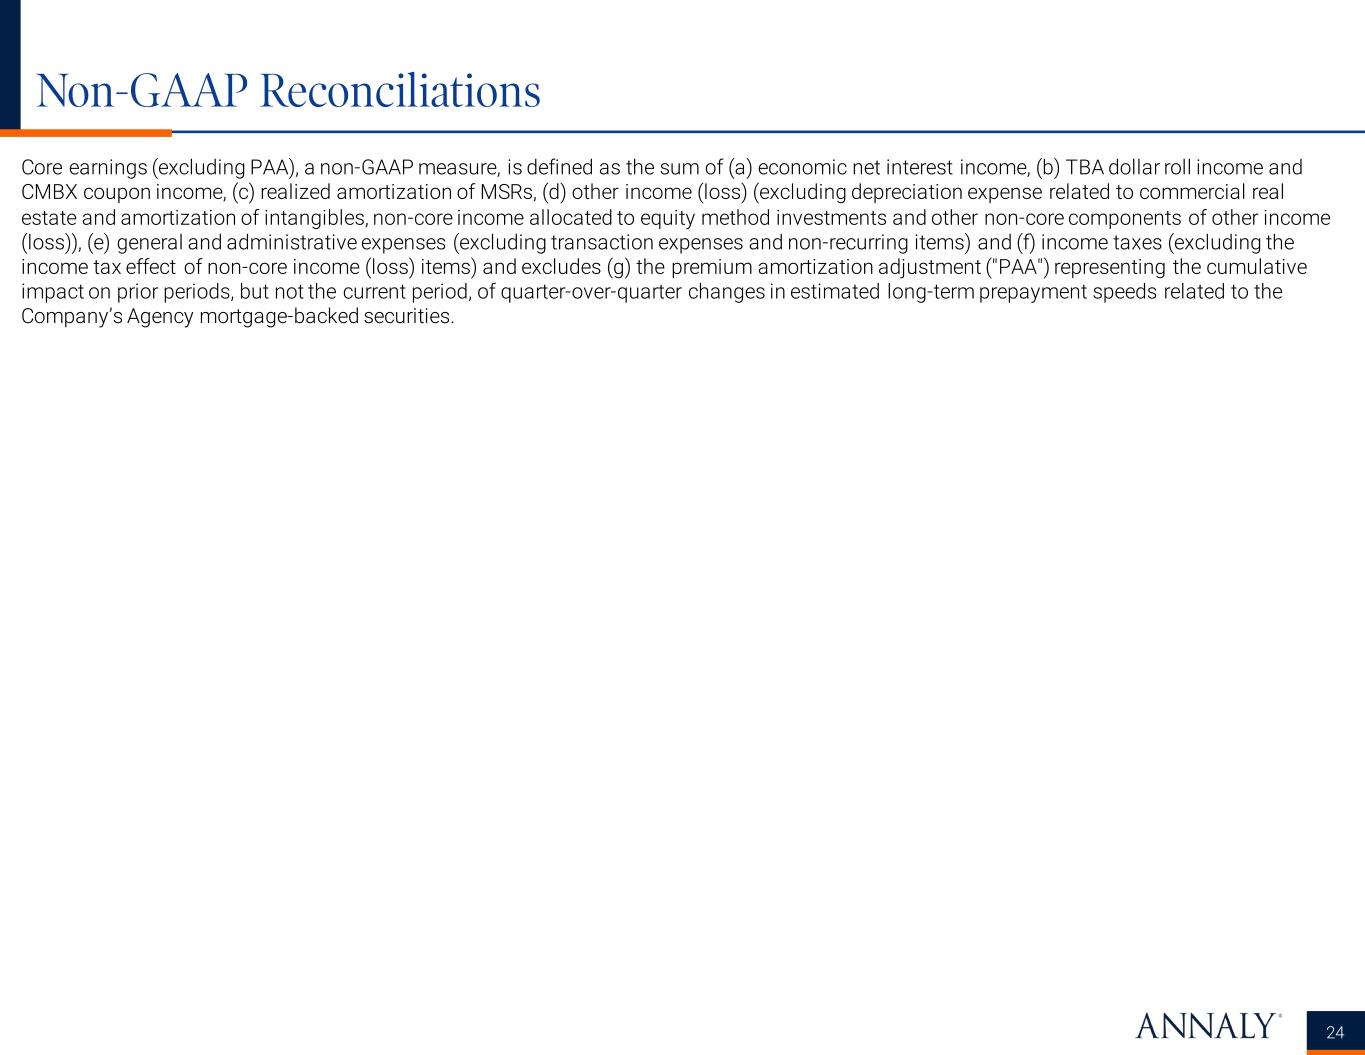
Non-GAAP Reconciliations Core earnings (excluding PAA), a non-GAAP measure, is defined as the sum of (a) economic net interest income, (b) TBA dollar roll income and CMBX coupon income, (c) realized amortization of MSRs, (d) other income (loss) (excluding depreciation expense related to commercial real estate and amortization of intangibles, non-core income allocated to equity method investments and other non-core components of other income (loss)), (e) general and administrative expenses (excluding transaction expenses and non-recurring items) and (f) income taxes (excluding the income tax effect of non-core income (loss) items) and excludes (g) the premium amortization adjustment ("PAA") representing the cumulative impact on prior periods, but not the current period, of quarter-over-quarter changes in estimated long-term prepayment speeds related to the Company’s Agency mortgage-backed securities. 24
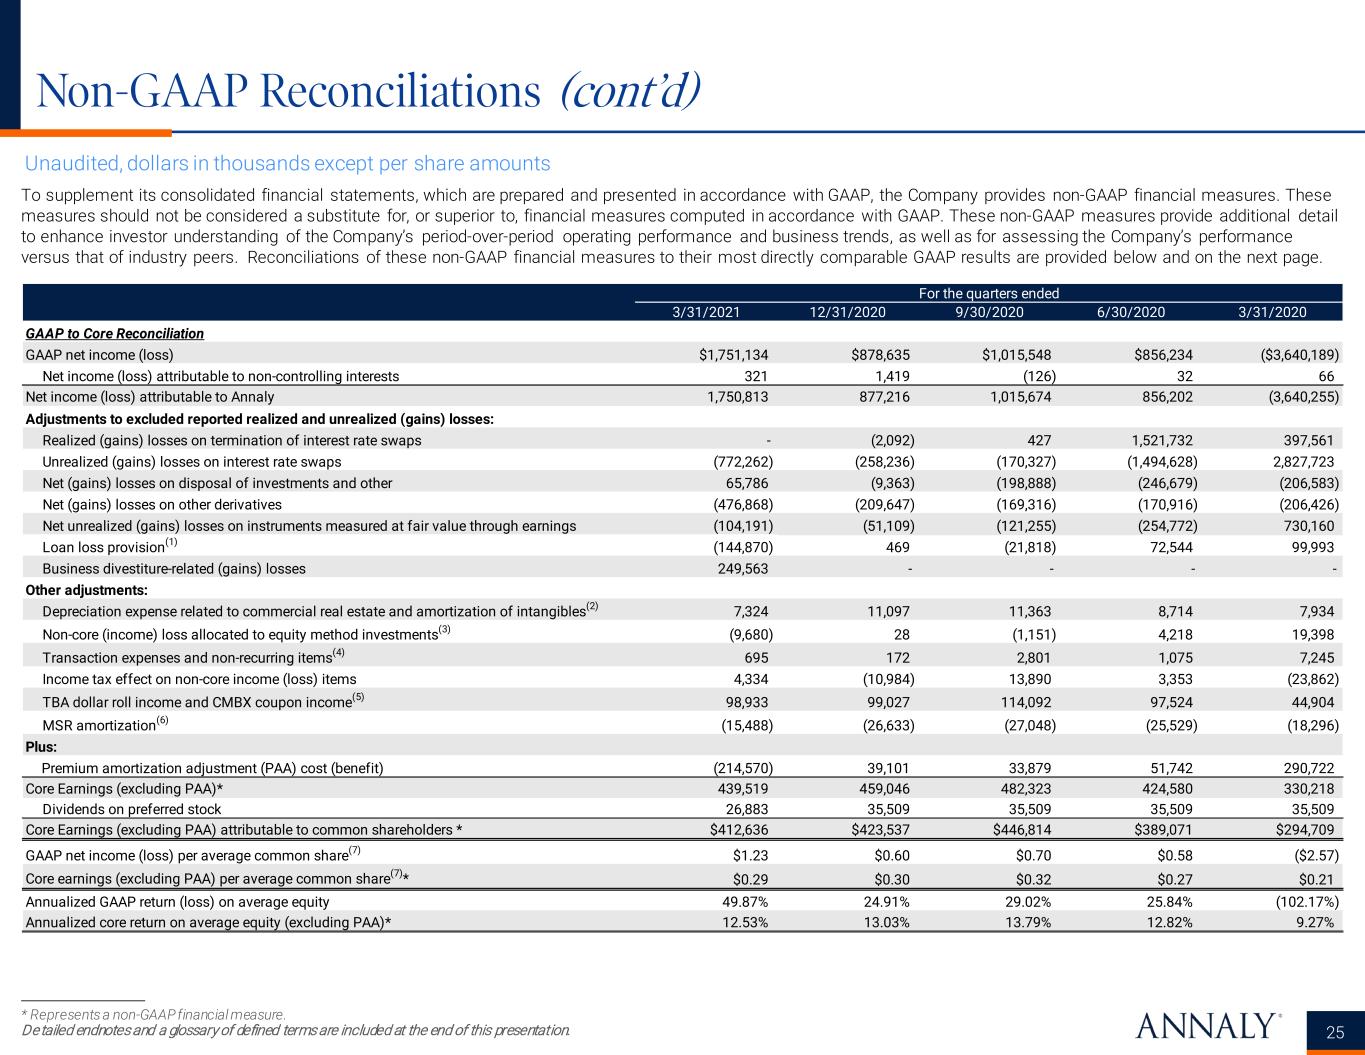
Non-GAAP Reconciliations (cont’d) To supplement its consolidated financial statements, which are prepared and presented in accordance with GAAP, the Company provides non-GAAP financial measures. These measures should not be considered a substitute for, or superior to, financial measures computed in accordance with GAAP. These non-GAAP measures provide additional detail to enhance investor understanding of the Company’s period-over-period operating performance and business trends, as well as for assessing the Company’s performance versus that of industry peers. Reconciliations of these non-GAAP financial measures to their most directly comparable GAAP results are provided below and on the next page. * Represents a non-GAAP financial measure. Detailed endnotes and a glossary of defined terms are included at the end of this presentation. 25 Unaudited, dollars in thousands except per share amounts For the quarters ended 3/31/2021 12/31/2020 9/30/2020 6/30/2020 3/31/2020 GAAP to Core Reconciliation GAAP net income (loss) $1,751,134 $878,635 $1,015,548 $856,234 ($3,640,189) Net income (loss) attributable to non-controlling interests 321 1,419 (126) 32 66 Net income (loss) attributable to Annaly 1,750,813 877,216 1,015,674 856,202 (3,640,255) Adjustments to excluded reported realized and unrealized (gains) losses: Realized (gains) losses on termination of interest rate swaps - (2,092) 427 1,521,732 397,561 Unrealized (gains) losses on interest rate swaps (772,262) (258,236) (170,327) (1,494,628) 2,827,723 Net (gains) losses on disposal of investments and other 65,786 (9,363) (198,888) (246,679) (206,583) Net (gains) losses on other derivatives (476,868) (209,647) (169,316) (170,916) (206,426) Net unrealized (gains) losses on instruments measured at fair value through earnings (104,191) (51,109) (121,255) (254,772) 730,160 Loan loss provision(1) (144,870) 469 (21,818) 72,544 99,993 Business divestiture-related (gains) losses 249,563 - - - - Other adjustments: Depreciation expense related to commercial real estate and amortization of intangibles(2) 7,324 11,097 11,363 8,714 7,934 Non-core (income) loss allocated to equity method investments(3) (9,680) 28 (1,151) 4,218 19,398 Transaction expenses and non-recurring items(4) 695 172 2,801 1,075 7,245 Income tax effect on non-core income (loss) items 4,334 (10,984) 13,890 3,353 (23,862) TBA dollar roll income and CMBX coupon income(5) 98,933 99,027 114,092 97,524 44,904 MSR amortization(6) (15,488) (26,633) (27,048) (25,529) (18,296) Plus: Premium amortization adjustment (PAA) cost (benefit) (214,570) 39,101 33,879 51,742 290,722 Core Earnings (excluding PAA)* 439,519 459,046 482,323 424,580 330,218 Dividends on preferred stock 26,883 35,509 35,509 35,509 35,509 Core Earnings (excluding PAA) attributable to common shareholders * $412,636 $423,537 $446,814 $389,071 $294,709 GAAP net income (loss) per average common share(7) $1.23 $0.60 $0.70 $0.58 ($2.57) Core earnings (excluding PAA) per average common share(7)* $0.29 $0.30 $0.32 $0.27 $0.21 Annualized GAAP return (loss) on average equity 49.87% 24.91% 29.02% 25.84% (102.17%) Annualized core return on average equity (excluding PAA)* 12.53% 13.03% 13.79% 12.82% 9.27%
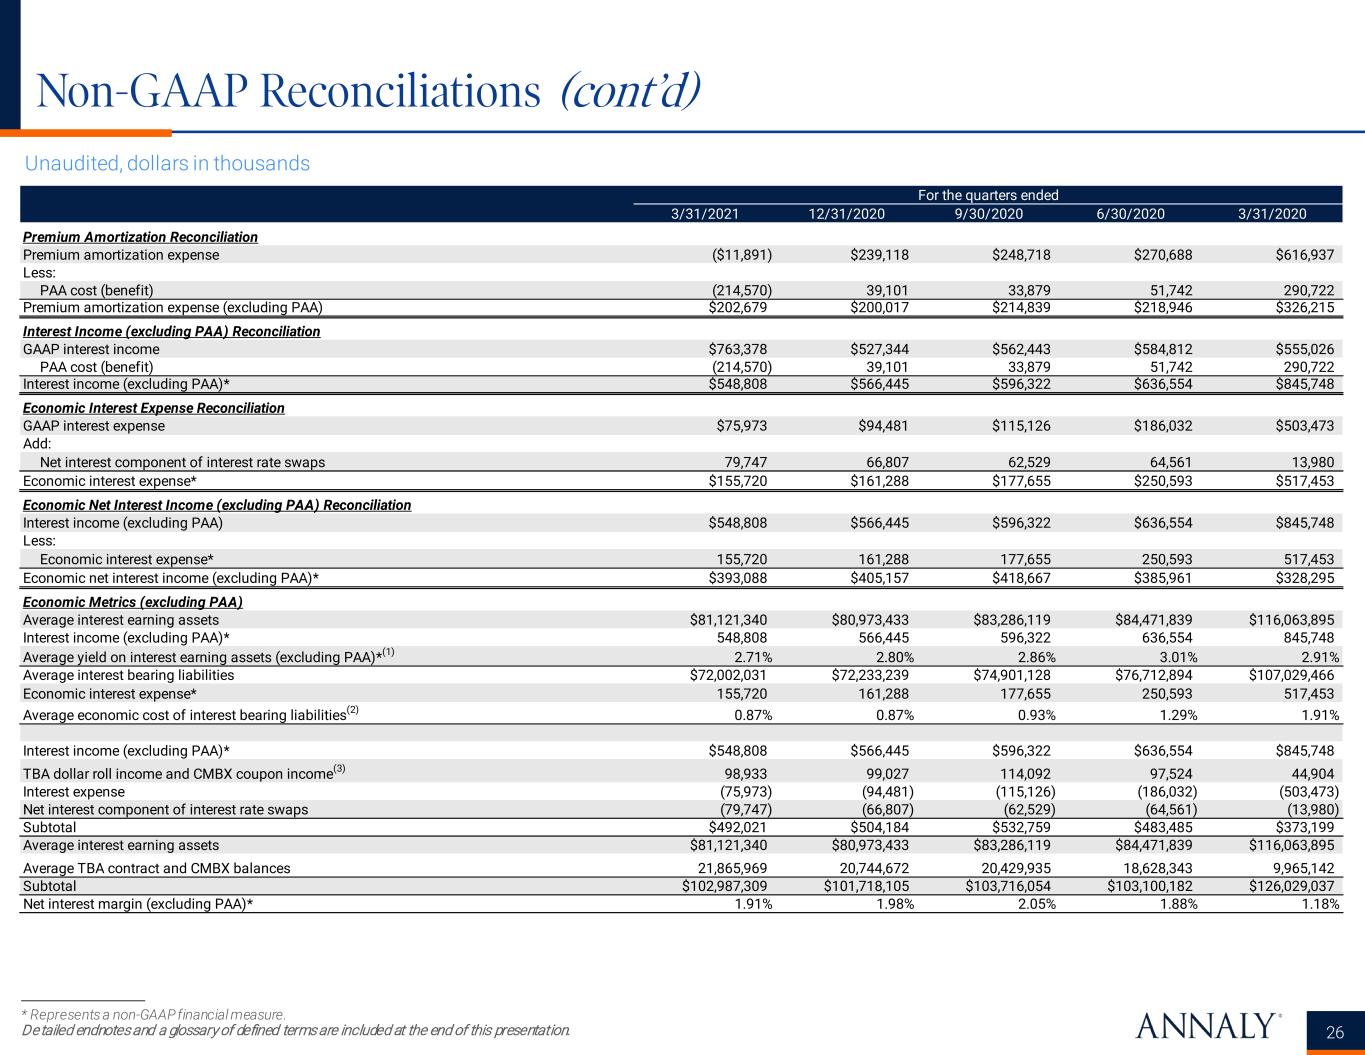
Non-GAAP Reconciliations (cont’d) * Represents a non-GAAP financial measure. Detailed endnotes and a glossary of defined terms are included at the end of this presentation. 26 Unaudited, dollars in thousands For the quarters ended 3/31/2021 12/31/2020 9/30/2020 6/30/2020 3/31/2020 Premium Amortization Reconciliation Premium amortization expense ($11,891) $239,118 $248,718 $270,688 $616,937 Less: PAA cost (benefit) (214,570) 39,101 33,879 51,742 290,722 Premium amortization expense (excluding PAA) $202,679 $200,017 $214,839 $218,946 $326,215 Interest Income (excluding PAA) Reconciliation GAAP interest income $763,378 $527,344 $562,443 $584,812 $555,026 PAA cost (benefit) (214,570) 39,101 33,879 51,742 290,722 Interest income (excluding PAA)* $548,808 $566,445 $596,322 $636,554 $845,748 Economic Interest Expense Reconciliation GAAP interest expense $75,973 $94,481 $115,126 $186,032 $503,473 Add: Net interest component of interest rate swaps 79,747 66,807 62,529 64,561 13,980 Economic interest expense* $155,720 $161,288 $177,655 $250,593 $517,453 Economic Net Interest Income (excluding PAA) Reconciliation Interest income (excluding PAA) $548,808 $566,445 $596,322 $636,554 $845,748 Less: Economic interest expense* 155,720 161,288 177,655 250,593 517,453 Economic net interest income (excluding PAA)* $393,088 $405,157 $418,667 $385,961 $328,295 Economic Metrics (excluding PAA) Average interest earning assets $81,121,340 $80,973,433 $83,286,119 $84,471,839 $116,063,895 Interest income (excluding PAA)* 548,808 566,445 596,322 636,554 845,748 Average yield on interest earning assets (excluding PAA)*(1) 2.71% 2.80% 2.86% 3.01% 2.91% Average interest bearing liabilities $72,002,031 $72,233,239 $74,901,128 $76,712,894 $107,029,466 Economic interest expense* 155,720 161,288 177,655 250,593 517,453 Average economic cost of interest bearing liabilities(2) 0.87% 0.87% 0.93% 1.29% 1.91% Interest income (excluding PAA)* $548,808 $566,445 $596,322 $636,554 $845,748 TBA dollar roll income and CMBX coupon income(3) 98,933 99,027 114,092 97,524 44,904 Interest expense (75,973) (94,481) (115,126) (186,032) (503,473) Net interest component of interest rate swaps (79,747) (66,807) (62,529) (64,561) (13,980) Subtotal $492,021 $504,184 $532,759 $483,485 $373,199 Average interest earning assets $81,121,340 $80,973,433 $83,286,119 $84,471,839 $116,063,895 Average TBA contract and CMBX balances 21,865,969 20,744,672 20,429,935 18,628,343 9,965,142 Subtotal $102,987,309 $101,718,105 $103,716,054 $103,100,182 $126,029,037 Net interest margin (excluding PAA)* 1.91% 1.98% 2.05% 1.88% 1.18%

Glossary and Endnotes
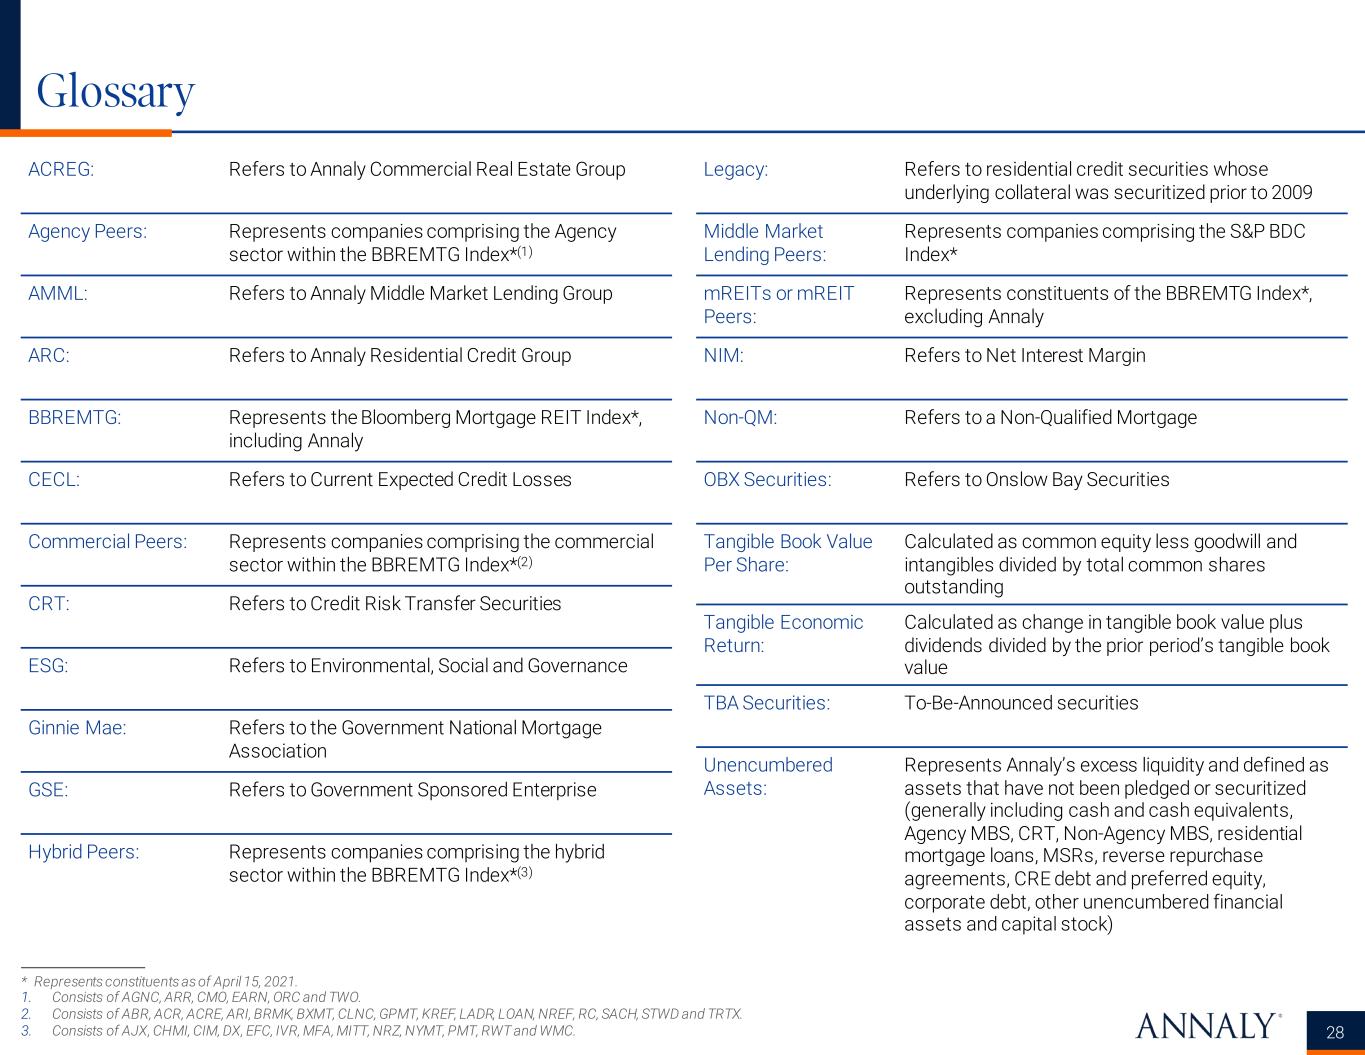
Glossary * Represents constituents as of April 15, 2021. 1. Consists of AGNC, ARR, CMO, EARN, ORC and TWO. 2. Consists of ABR, ACR, ACRE, ARI, BRMK, BXMT, CLNC, GPMT, KREF, LADR, LOAN, NREF, RC, SACH, STWD and TRTX. 3. Consists of AJX, CHMI, CIM, DX, EFC, IVR, MFA, MITT, NRZ, NYMT, PMT, RWT and WMC. 28 ACREG: Refers to Annaly Commercial Real Estate Group Agency Peers: Represents companies comprising the Agency sector within the BBREMTG Index*(1) AMML: Refers to Annaly Middle Market Lending Group ARC: Refers to Annaly Residential Credit Group BBREMTG: Represents the Bloomberg Mortgage REIT Index*, including Annaly CECL: Refers to Current Expected Credit Losses Commercial Peers: Represents companies comprising the commercial sector within the BBREMTG Index*(2) CRT: Refers to Credit Risk Transfer Securities ESG: Refers to Environmental, Social and Governance Ginnie Mae: Refers to the Government National Mortgage Association GSE: Refers to Government Sponsored Enterprise Hybrid Peers: Represents companies comprising the hybrid sector within the BBREMTG Index*(3) Legacy: Refers to residential credit securities whose underlying collateral was securitized prior to 2009 Middle Market Lending Peers: Represents companies comprising the S&P BDC Index* mREITs or mREIT Peers: Represents constituents of the BBREMTG Index*, excluding Annaly NIM: Refers to Net Interest Margin Non-QM: Refers to a Non-Qualified Mortgage OBX Securities: Refers to Onslow Bay Securities Tangible Book Value Per Share: Calculated as common equity less goodwill and intangibles divided by total common shares outstanding Tangible Economic Return: Calculated as change in tangible book value plus dividends divided by the prior period’s tangible book value TBA Securities: To-Be-Announced securities Unencumbered Assets: Represents Annaly’s excess liquidity and defined as assets that have not been pledged or securitized (generally including cash and cash equivalents, Agency MBS, CRT, Non-Agency MBS, residential mortgage loans, MSRs, reverse repurchase agreements, CRE debt and preferred equity, corporate debt, other unencumbered financial assets and capital stock)
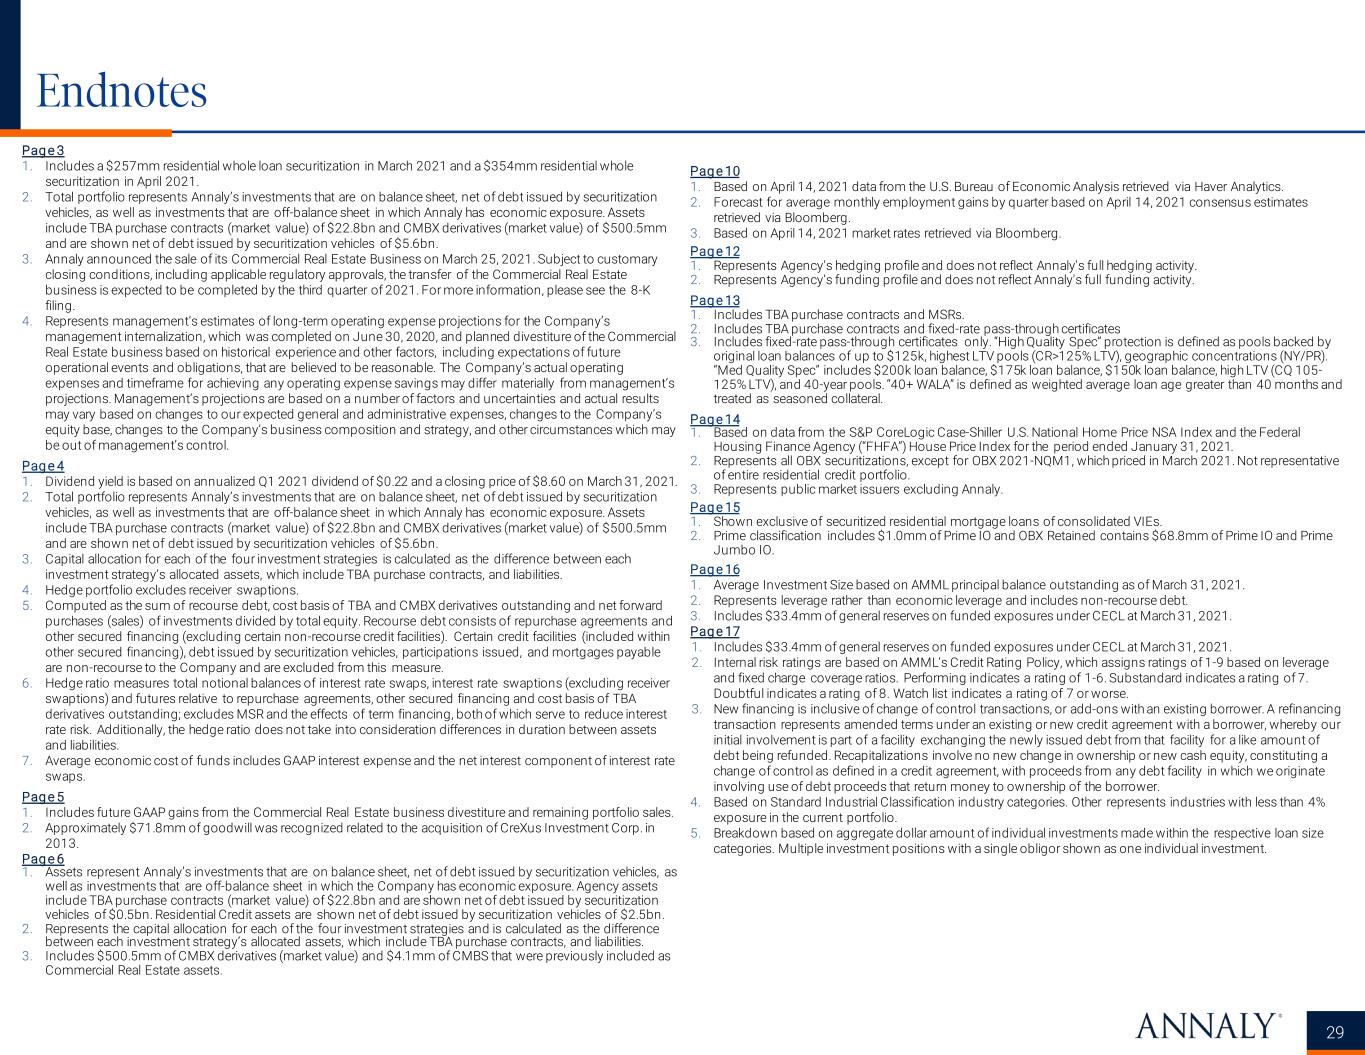
Endnotes 29 Pag e 3 1. Includes a $257mm residential whole loan securitization in March 2021 and a $354mm residential whole securitization in April 2021. 2. Total portfolio represents Annaly’s investments that are on balance sheet, net of debt issued by securitization vehicles, as well as investments that are off-balance sheet in which Annaly has economic exposure. Assets include TBA purchase contracts (market value) of $22.8bn and CMBX derivatives (market value) of $500.5mm and are shown net of debt issued by securitization vehicles of $5.6bn. 3. Annaly announced the sale of its Commercial Real Estate Business on March 25, 2021. Subject to customary closing conditions, including applicable regulatory approvals, the transfer of the Commercial Real Estate business is expected to be completed by the third quarter of 2021. For more information, please see the 8-K filing. 4. Represents management’s estimates of long-term operating expense projections for the Company’s management internalization, which was completed on June 30, 2020, and planned divestiture of the Commercial Real Estate business based on historical experience and other factors, including expectations of future operational events and obligations, that are believed to be reasonable. The Company’s actual operating expenses and timeframe for achieving any operating expense savings may differ materially from management’s projections. Management’s projections are based on a number of factors and uncertainties and actual results may vary based on changes to our expected general and administrative expenses, changes to the Company’s equity base, changes to the Company’s business composition and strategy, and other circumstances which may be out of management’s control. Pag e 4 1. Dividend yield is based on annualized Q1 2021 dividend of $0.22 and a closing price of $8.60 on March 31, 2021. 2. Total portfolio represents Annaly’s investments that are on balance sheet, net of debt issued by securitization vehicles, as well as investments that are off-balance sheet in which Annaly has economic exposure. Assets include TBA purchase contracts (market value) of $22.8bn and CMBX derivatives (market value) of $500.5mm and are shown net of debt issued by securitization vehicles of $5.6bn. 3. Capital allocation for each of the four investment strategies is calculated as the difference between each investment strategy’s allocated assets, which include TBA purchase contracts, and liabilities. 4. Hedge portfolio excludes receiver swaptions. 5. Computed as the sum of recourse debt, cost basis of TBA and CMBX derivatives outstanding and net forward purchases (sales) of investments divided by total equity. Recourse debt consists of repurchase agreements and other secured financing (excluding certain non-recourse credit facilities). Certain credit facilities (included within other secured financing), debt issued by securitization vehicles, participations issued, and mortgages payable are non-recourse to the Company and are excluded from this measure. 6. Hedge ratio measures total notional balances of interest rate swaps, interest rate swaptions (excluding receiver swaptions) and futures relative to repurchase agreements, other secured financing and cost basis of TBA derivatives outstanding; excludes MSR and the effects of term financing, both of which serve to reduce interest rate risk. Additionally, the hedge ratio does not take into consideration differences in duration between assets and liabilities. 7. Average economic cost of funds includes GAAP interest expense and the net interest component of interest rate swaps. Pag e 5 1. Includes future GAAP gains from the Commercial Real Estate business divestiture and remaining portfolio sales. 2. Approximately $71.8mm of goodwill was recognized related to the acquisition of CreXus Investment Corp. in 2013. Pag e 6 1. Assets represent Annaly’s investments that are on balance sheet, net of debt issued by securitization vehicles, as well as investments that are off-balance sheet in which the Company has economic exposure. Agency assets include TBA purchase contracts (market value) of $22.8bn and are shown net of debt issued by securitization vehicles of $0.5bn. Residential Credit assets are shown net of debt issued by securitization vehicles of $2.5bn. 2. Represents the capital allocation for each of the four investment strategies and is calculated as the difference between each investment strategy’s allocated assets, which include TBA purchase contracts, and liabilities. 3. Includes $500.5mm of CMBX derivatives (market value) and $4.1mm of CMBS that were previously included as Commercial Real Estate assets. Pag e 10 1. Based on April 14, 2021 data from the U.S. Bureau of Economic Analysis retrieved via Haver Analytics. 2. Forecast for average monthly employment gains by quarter based on April 14, 2021 consensus estimates retrieved via Bloomberg. 3. Based on April 14, 2021 market rates retrieved via Bloomberg. Pag e 12 1. Represents Agency's hedging profile and does not reflect Annaly's full hedging activity. 2. Represents Agency’s funding profile and does not reflect Annaly's full funding activity. Pag e 13 1. Includes TBA purchase contracts and MSRs. 2. Includes TBA purchase contracts and fixed-rate pass-through certificates 3. Includes fixed-rate pass-through certificates only. “High Quality Spec” protection is defined as pools backed by original loan balances of up to $125k, highest LTV pools (CR>125% LTV), geographic concentrations (NY/PR). “Med Quality Spec” includes $200k loan balance, $175k loan balance, $150k loan balance, high LTV (CQ 105- 125% LTV), and 40-year pools. “40+ WALA” is defined as weighted average loan age greater than 40 months and treated as seasoned collateral. Pag e 14 1. Based on data from the S&P CoreLogic Case-Shiller U.S. National Home Price NSA Index and the Federal Housing Finance Agency (“FHFA”) House Price Index for the period ended January 31, 2021. 2. Represents all OBX securitizations, except for OBX 2021-NQM1, which priced in March 2021. Not representative of entire residential credit portfolio. 3. Represents public market issuers excluding Annaly. Pag e 15 1. Shown exclusive of securitized residential mortgage loans of consolidated VIEs. 2. Prime classification includes $1.0mm of Prime IO and OBX Retained contains $68.8mm of Prime IO and Prime Jumbo IO. Pag e 16 1. Average Investment Size based on AMML principal balance outstanding as of March 31, 2021. 2. Represents leverage rather than economic leverage and includes non-recourse debt. 3. Includes $33.4mm of general reserves on funded exposures under CECL at March 31, 2021. Pag e 17 1. Includes $33.4mm of general reserves on funded exposures under CECL at March 31, 2021. 2. Internal risk ratings are based on AMML’s Credit Rating Policy, which assigns ratings of 1-9 based on leverage and fixed charge coverage ratios. Performing indicates a rating of 1-6. Substandard indicates a rating of 7. Doubtful indicates a rating of 8. Watch list indicates a rating of 7 or worse. 3. New financing is inclusive of change of control transactions, or add-ons with an existing borrower. A refinancing transaction represents amended terms under an existing or new credit agreement with a borrower, whereby our initial involvement is part of a facility exchanging the newly issued debt from that facility for a like amount of debt being refunded. Recapitalizations involve no new change in ownership or new cash equity, constituting a change of control as defined in a credit agreement, with proceeds from any debt facility in which we originate involving use of debt proceeds that return money to ownership of the borrower. 4. Based on Standard Industrial Classification industry categories. Other represents industries with less than 4% exposure in the current portfolio. 5. Breakdown based on aggregate dollar amount of individual investments made within the respective loan size categories. Multiple investment positions with a single obligor shown as one individual investment.
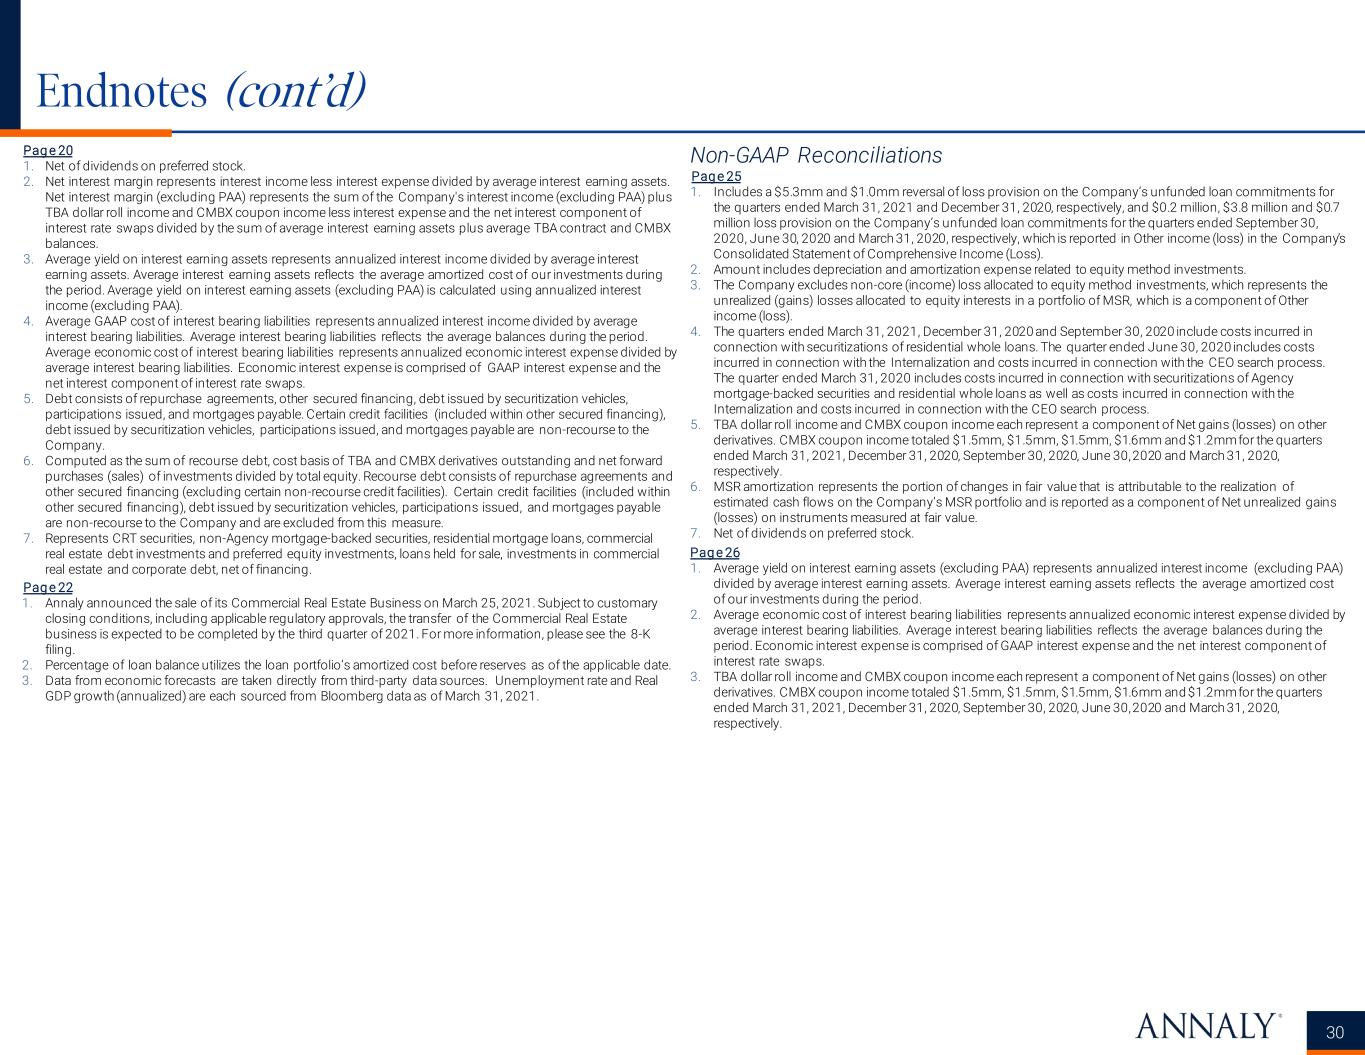
Endnotes (cont’d) 30 Pag e 20 1. Net of dividends on preferred stock. 2. Net interest margin represents interest income less interest expense divided by average interest earning assets. Net interest margin (excluding PAA) represents the sum of the Company's interest income (excluding PAA) plus TBA dollar roll income and CMBX coupon income less interest expense and the net interest component of interest rate swaps divided by the sum of average interest earning assets plus average TBA contract and CMBX balances. 3. Average yield on interest earning assets represents annualized interest income divided by average interest earning assets. Average interest earning assets reflects the average amortized cost of our investments during the period. Average yield on interest earning assets (excluding PAA) is calculated using annualized interest income (excluding PAA). 4. Average GAAP cost of interest bearing liabilities represents annualized interest income divided by average interest bearing liabilities. Average interest bearing liabilities reflects the average balances during the period. Average economic cost of interest bearing liabilities represents annualized economic interest expense divided by average interest bearing liabilities. Economic interest expense is comprised of GAAP interest expense and the net interest component of interest rate swaps. 5. Debt consists of repurchase agreements, other secured financing, debt issued by securitization vehicles, participations issued, and mortgages payable. Certain credit facilities (included within other secured financing), debt issued by securitization vehicles, participations issued, and mortgages payable are non-recourse to the Company. 6. Computed as the sum of recourse debt, cost basis of TBA and CMBX derivatives outstanding and net forward purchases (sales) of investments divided by total equity. Recourse debt consists of repurchase agreements and other secured financing (excluding certain non-recourse credit facilities). Certain credit facilities (included within other secured financing), debt issued by securitization vehicles, participations issued, and mortgages payable are non-recourse to the Company and are excluded from this measure. 7. Represents CRT securities, non-Agency mortgage-backed securities, residential mortgage loans, commercial real estate debt investments and preferred equity investments, loans held for sale, investments in commercial real estate and corporate debt, net of financing. Pag e 22 1. Annaly announced the sale of its Commercial Real Estate Business on March 25, 2021. Subject to customary closing conditions, including applicable regulatory approvals, the transfer of the Commercial Real Estate business is expected to be completed by the third quarter of 2021. For more information, please see the 8-K filing. 2. Percentage of loan balance utilizes the loan portfolio’s amortized cost before reserves as of the applicable date. 3. Data from economic forecasts are taken directly from third-party data sources. Unemployment rate and Real GDP growth (annualized) are each sourced from Bloomberg data as of March 31, 2021. Non-GAAP Reconciliations Pag e 25 1. Includes a $5.3mm and $1.0mm reversal of loss provision on the Company’s unfunded loan commitments for the quarters ended March 31, 2021 and December 31, 2020, respectively, and $0.2 million, $3.8 million and $0.7 million loss provision on the Company’s unfunded loan commitments for the quarters ended September 30, 2020, June 30, 2020 and March 31, 2020, respectively, which is reported in Other income (loss) in the Company’s Consolidated Statement of Comprehensive Income (Loss). 2. Amount includes depreciation and amortization expense related to equity method investments. 3. The Company excludes non-core (income) loss allocated to equity method investments, which represents the unrealized (gains) losses allocated to equity interests in a portfolio of MSR, which is a component of Other income (loss). 4. The quarters ended March 31, 2021, December 31, 2020 and September 30, 2020 include costs incurred in connection with securitizations of residential whole loans. The quarter ended June 30, 2020 includes costs incurred in connection with the Internalization and costs incurred in connection with the CEO search process. The quarter ended March 31, 2020 includes costs incurred in connection with securitizations of Agency mortgage-backed securities and residential whole loans as well as costs incurred in connection with the Internalization and costs incurred in connection with the CEO search process. 5. TBA dollar roll income and CMBX coupon income each represent a component of Net gains (losses) on other derivatives. CMBX coupon income totaled $1.5mm, $1.5mm, $1.5mm, $1.6mm and $1.2mm for the quarters ended March 31, 2021, December 31, 2020, September 30, 2020, June 30, 2020 and March 31, 2020, respectively. 6. MSR amortization represents the portion of changes in fair value that is attributable to the realization of estimated cash flows on the Company’s MSR portfolio and is reported as a component of Net unrealized gains (losses) on instruments measured at fair value. 7. Net of dividends on preferred stock. Pag e 26 1. Average yield on interest earning assets (excluding PAA) represents annualized interest income (excluding PAA) divided by average interest earning assets. Average interest earning assets reflects the average amortized cost of our investments during the period. 2. Average economic cost of interest bearing liabilities represents annualized economic interest expense divided by average interest bearing liabilities. Average interest bearing liabilities reflects the average balances during the period. Economic interest expense is comprised of GAAP interest expense and the net interest component of interest rate swaps. 3. TBA dollar roll income and CMBX coupon income each represent a component of Net gains (losses) on other derivatives. CMBX coupon income totaled $1.5mm, $1.5mm, $1.5mm, $1.6mm and $1.2mm for the quarters ended March 31, 2021, December 31, 2020, September 30, 2020, June 30, 2020 and March 31, 2020, respectively.
